Embed Size (px)
Citation preview
ICES ASC 2009, Theme session I
1/28
Monitoring fish communities at drifting FADs: an autonomous system for data collection in 1 an ecosystems approach 2
3 Patrice Brehmer1*, Gorka Sancho2, Erwan Josse3, Marc Taquet4, Stratis Georgakarakos5, David 4 Itano6, Gala Moreno7, Pierre Palud8, Vasilis Trygonis5, Riaz Aumeeruddy9, Charlotte Girard10, 5
Christophe Peignon11, John Dalen12, Laurent Dagorn10 6 7
1 University of the Aegean/Co IRD-UR109, Centre de Recherche Halieutique méditerranéenne et 8 tropicale, Avenue Jean Monnet, BP 171, 34 203, Sète, France 9 2 College of Charleston, Grice Marine laboratory, 205 Fort Johnson Road, Charleston, SC 29412, 10 USA 11 3 IRD, US004 ACAPPELLA, Centre de Bretagne, BP 70, 29 280, Plouzané, France 12 4 Ifremer, Ressources Halieutiques, Centre de Recherche Halieutique Méditerranéenne et 13 Tropicale, Avenue Jean Monnet, BP 171, 34 203, Sète, France 14 5 University of the Aegean, Fisheries and Sonar Laboratory, University Hill, 81100 Mytilini, 15 Greece 16 6 University of Hawaii at Manoa, 1000 Pope Road, MSB 312, 96822 Honolulu, Hawaii, USA 17 IRD-UR109, Centre de Recherche Halieutique Méditerranéenne et Tropicale, 1 Avenue Jean 18 Monnet, BP 171, 34 203, Sète, France 19 7 AZTI - Tecnalia, Txatxarramendi ugartea z/g, 48395 Sukarrieta, Spain 20 8 Simrad Europe France, Parc Technologique de la Soye, Espace Créa, 15 rue Gallilée, 56270 21 Ploemeur, France 22 9 Seychelles Fishing Authority, PO Box 570, Victoria, Seychelles 23 10 CLS, 8-10 Rue Hermès, 31520 Ramonville Ste Agne, France 24 11 IRD, 101 Promenade Roger Laroque - Anse Vata BP A5 - 98848 NOUMEA Cedex, Nouvelle 25 Calédonie 26 12 Institute of Marine Research, P.O. Box 1870, Nordnes 5817, Bergen, Norway 27 28 * Corresponding author: [email protected] ; tel (33) 672730048; Fax (33) 29 499573295 30 31 32 33
“Could not be cited prior to reference to the authors” 34 35 36
ICES ASC 2009, Theme session I
2/28
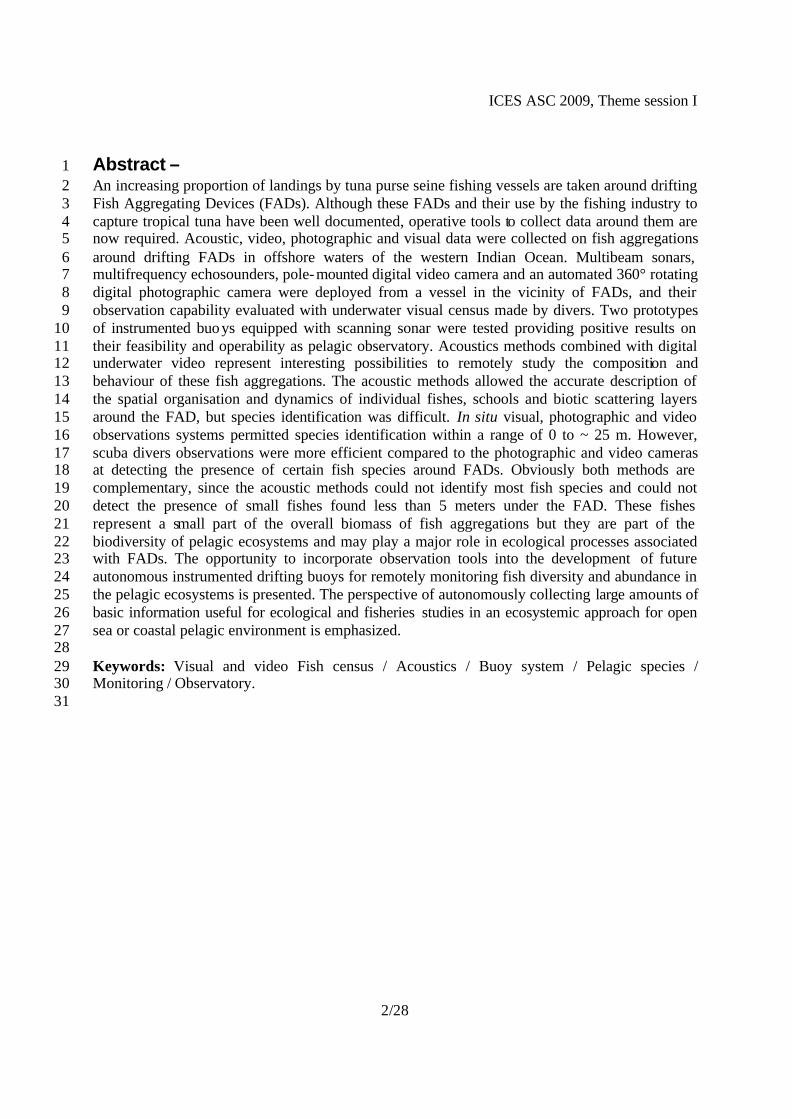
Abstract – 1 An increasing proportion of landings by tuna purse seine fishing vessels are taken around drifting 2 Fish Aggregating Devices (FADs). Although these FADs and their use by the fishing industry to 3 capture tropical tuna have been well documented, operative tools to collect data around them are 4 now required. Acoustic, video, photographic and visual data were collected on fish aggregations 5 around drifting FADs in offshore waters of the western Indian Ocean. Multibeam sonars, 6 multifrequency echosounders, pole-mounted digital video camera and an automated 360° rotating 7 digital photographic camera were deployed from a vessel in the vicinity of FADs, and their 8 observation capability evaluated with underwater visual census made by divers. Two prototypes 9 of instrumented buoys equipped with scanning sonar were tested providing positive results on 10 their feasibility and operability as pelagic observatory. Acoustics methods combined with digital 11 underwater video represent interesting possibilities to remotely study the composition and 12 behaviour of these fish aggregations. The acoustic methods allowed the accurate description of 13 the spatial organisation and dynamics of individual fishes, schools and biotic scattering layers 14 around the FAD, but species identification was difficult. In situ visual, photographic and video 15 observations systems permitted species identification within a range of 0 to ~ 25 m. However, 16 scuba divers observations were more efficient compared to the photographic and video cameras 17 at detecting the presence of certain fish species around FADs. Obviously both methods are 18 complementary, since the acoustic methods could not identify most fish species and could not 19 detect the presence of small fishes found less than 5 meters under the FAD. These fishes 20 represent a small part of the overall biomass of fish aggregations but they are part of the 21 biodiversity of pelagic ecosystems and may play a major role in ecological processes associated 22 with FADs. The opportunity to incorporate observation tools into the development of future 23 autonomous instrumented drifting buoys for remotely monitoring fish diversity and abundance in 24 the pelagic ecosystems is presented. The perspective of autonomously collecting large amounts of 25 basic information useful for ecological and fisheries studies in an ecosystemic approach for open 26 sea or coastal pelagic environment is emphasized. 27 28 Keywords: Visual and video Fish census / Acoustics / Buoy system / Pelagic species / 29 Monitoring / Observatory. 30 31
ICES ASC 2009, Theme session I
3/28
1 Résumé : Une part importante des captures de poissons par les thoniers senneurs sont réalisées 2 autour des Dispositifs de Concentration de Poissons (DCP). Ces DCP et leur utilisation par 3 l’industrie thonière sont bien documentés mais des outils opérationnels sont désormais requis 4 pour l’acquisition de données écologiques autour de ces objets. Des données d’origines 5 acoustiques, vidéographiques, photographiques et visuelles ont été collectées sur les agrégations 6 de poissons autour de DCP dérivant au large dans l’océan Indien occidental. Nous avons 7 déployés à partir d’un navire à proximité de DCP des sonars multifaisceaux, des échosondeurs 8 multifréquence, une camera montée sur une perche, et un système photographique numérique à 9 360°, et comparé les observations faites avec celles obtenues en plongée sous-marine. Deux 10 prototypes de bouées instrumentées avec un sonar à balayages ont été testés et ont fourni des 11 résultats positifs quand à leurs faisabilité et opérabilité. Les méthodes acoustiques combinées à 12 des observations vidéo numériques offrent des possibilités intéressantes d’étude à distance de la 13 composition spécifique et du comportement de ces agrégations de poissons. Les méthodes 14 acoustiques permettent une description précise de l’organisation spatiale et de la dynamique des 15 poissons individuels, des bancs et des couches planctoniques autour des DCP mais 16 l’identification spécifique reste difficile. Les observations visuelles, photographiques et 17 vidéographiques permettent quant à elles une identification spécifique à une portée de 0 à ~ 25 m. 18 Les observations visuelles sous-marines sont toutefois plus efficaces pour détecter la présence 19 d’espèces de poissons a proximité des DCP que les observations photographiques et 20 vidéographiques. Les deux méthodes visuels et acoustiques apparaissent complémentaires car les 21 dernières ne permettent ni la discrimination spécifique de nombreuses espèces présentes ni la 22 détection des petits poissons directement inféodés au DCP (distance de 0-5 m). Ces derniers 23 représentent une très faible part de la biomasse en poissons mais peuvent jouer un rôle essentiel 24 dans les processus écologiques associés au DCP. En outre ils constituent une part de la 25 biodiversité des écosystèmes pélagiques. L’opportunité d’incorporer les méthodes d’observations 26 dans le développement de futures bouées dérivantes instrumentées et autonomes, pour la 27 surveillance à distance dans les écosystèmes pélagiques de la diversité en poissons et leur 28 abondance, est présentée autour de notre cas d’étude. La perspective de collecter de manière 29 autonome un grand nombre d’informations élémentaires à l’usage d’études écologiques et 30 halieutiques sur les agrégations de poissons au large comme sur le littoral est soulignée. 31 32 33
ICES ASC 2009, Theme session I
4/28
Introduction 1 The aggregation effect of floating objects has been recognized and exploited by fishermen for a 2 long time, as a first scientific description of such natural aggregations was made by Hunter and 3 Mitchell (1967). Fréon and Dagorn (2000) and Castro et al. (2002) formulated different 4 hypotheses to explain the behavioural motivations of fishes to associate with floating objects, 5 commonly named Fish Aggregating Devices (FADs). However, none of them have been 6 validated so far, except for small species hiding in the structure of the FADs (Taquet et al. 2007). 7 The deployment and exploitation of drifting FADs has become a common fishing strategy for 8 industrial fisheries targeting tuna in tropical pelagic waters since 1980 (Fonteneau et al. 2000, 9 Ménard et al. 2000). However, tuna are not the only species associating to floating objects, and 10 fish aggregations (Pitcher 1983) around FADs commonly comprise 10 to 40 species (Romanov 11 2002; Taquet et al. 2007). Most of those species have no commercial value for industrial fishing 12 fleets and are discarded as by-catch (Hall et al. 2000). But some associated species could be of 13 great interest to small-scale fisheries exploiting coastal anchored FADs, while other species could 14 play an important role in the initial aggregation process around floating objects (Taquet et al. 15 2007). Moreover, collection of scientific data of fish communities around drifting FADs is 16 needed in order to characterize and understand their role in pelagic ecosystems, including 17 potential adverse ecological impacts (Hallier and Gaertner 2008). However, collecting data on 18 FAD aggregations is difficult for several reasons. First, drifting FADs deployed by tuna purse 19 seiners are usually found far from coastlines and dispersed over wide areas (Hyrenbach et al. 20 2000). Second, while studying FAD populations though commercial catches is possible 21 (Romanov 2002), using fishery- independent methods is preferable as (i) they do not cause the 22 mortality of animals associated to the studied FADs, (ii) they provide complementary data to 23 commercial catches, which are influenced by the selectivity of the fishing gear employed 24 (Gaertner et al. 1999). 25 Observing fish aggregations around FADs with non intrusive methods can be done from research 26 vessels using in situ visual (Taquet et al. 2007) and acoustic surveys (Josse et al. 1999, 2000; 27 Doray et al. 2006; Moreno et al. 2007a; Brehmer et al. 2006a). However, these protocols require 28 large human and financial efforts, extended research cruises, and do not allow for simultaneous 29 monitoring of multiple FADs. In order to collect large and simultaneous data sets of FAD 30 associated communities, there is a need for the use autonomous monitoring systems. Such 31 autonomous systems are pre-requisites to develop large-scale research projects to (i) improve our 32 understanding of the effects of FADs on tuna and other fish species, (ii) develop methods to 33 reduce by-catch around FADs, and (iii) build the foundation for future scientific observatories of 34 pelagic ecosystems using autonomous platforms. 35 In this study we evaluated the operability and efficiency of various observation tools based on 36 visual observations and active underwater acoustics that could be autonomously deployed on 37 FADs, by comparing them to proven monitoring methods based from research vessels. Visual 38 underwater fish censuses are extensively used to identify species, but are commonly limited in 39 space and time (Jones and Thompson 1978; Kimmel 1985; Michalopoulos et al. 1992). 40 Standardized acoustic survey methods which can be conducted repeatedly and more extensively 41 provide reliable biomass data, but lack accurate spe cies recognition (Fréon and Misund 1999; 42 Simmonds and MacLennan 2005). Combining both methodologies during daytime observations 43 in clear waters is a very effective way to characterize fish communities associated with FADs. 44 45
ICES ASC 2009, Theme session I
5/28
Materials and methods 1 We distinguished two categories of instruments/methods: those that in their current configuration 2 need to be operated from a research vessel (category 1), and those that can be deployed and work 3 autonomously (category 2). 4 5
FAD surveys 6 In October 2004, two drifting FADs were surveyed during a research cruise operated in the frame 7 of the EU project FADIO (EU Project ‘Fishing Aggregating Devices as Instrumented 8 Observatories of the pelagic ecosystems; ; web: http://www.fadio.ird.fr). They were deployed by 9 the French tuna purse seine fleet in the western Indian Ocean, around the Seychelles Islands (Fig. 10 1a). The first FAD (ID 484: 52°22’ E - 5°10’ S; 13/10/2004) was a bamboo raft with hanging 11 netting panels, and the second FAD (ID 958: 56°16’ E - 4°01’ S; 16/10/2004) consisted of a 12 floating coil of thick rope (Fig. 1b, 1c). We reached the FADs using a 34 m vessel (M/V Indian 13 Ocean Explorer) and used onboard (category 1) and autonomous (category 2) survey systems to 14 monitor the fish communities around the FADs (see below). A sonar buoy prototype (category 2) 15 which could not be safely deployed from the vessel on these drifting FADs due to bad weather 16 conditions was tested at the end of the survey on an anchored FAD near Mahé Island. Lastly, a 17 second test of a sonar buoy prototype was performed in August 2006 in a Spanish bluefin tuna 18 cage. 19 20 Acoustic monitoring 21 22 Ship-based equipment 23 The ship-based acoustic equipment (category 1) consisted of a multibeam high resolution lateral 24 sonar, a multifrequency echosounder and an omnid irectional sonar (Fig. 2abc). 25 The lateral sonar, a RESON Seabat™ 6012 was on pole-mounted at amidships at two meters 26 depth. It emitted at a frequency of 455 kHz in a vertical plane from the surface to 90° with 60 27 beams of 1.5°*17° at a range of 50 m (Gerlotto et al. 1999; Guillard et al. 2006). The sonar TVG 28 (Time Varied Gain) function was set in 20 Log R (where R is the distance to the target), the gain 29 put between 4 and 6 dB and the pulse length was 0.67 ms. The video sonar detection was 30 recorded on a digital videotape recorder and the raw digital one on a hard disk via a dedicated 31 data acquisition software (Gerlotto et al. 1999). The data analysed were the voxel delivered by 32 the sonar central unit, with a beam size of 1024 elements and a data precision of 7 bits. The 33 lateral sonar software analyzed this digita l sonar data and produced detailed 3D images of the 34 schools. The sampling methodology consisted in performing with the vessel several passes close 35 to the FAD, keeping a vessel FAD distance of 50 metres. 36 The multifrequency split beam scientific echosounder employed in this study was a SIMRAD 37 EK60 (38, 70, 120 kHz) and was deployed on a pole in a similar way as the lateral sonar (see 38 above; Fig. 2abc). We used it over a diameter of 0.8 nautical mile in the horizontal plane and on 39 250 meter depth (see Moreno et al. 2007a for details). 40 Finally, an omnidirectional Simrad SP90 sonar mounted in the hull of the vessel at four meters 41 depth (Fig. 2ad) was a used at a frequency of 24 kHz. The sampling methodology consisted first 42 in using the omnidirectional sonar to detect precisely the FAD aggregation position. Then the 43 vessel started a drifting operation at a distance of 50 to 300 meters to the FAD to monitor large 44 fish school (for more details, see Brehmer et al. 2006a, 2007). 45

ICES ASC 2009, Theme session I
6/28
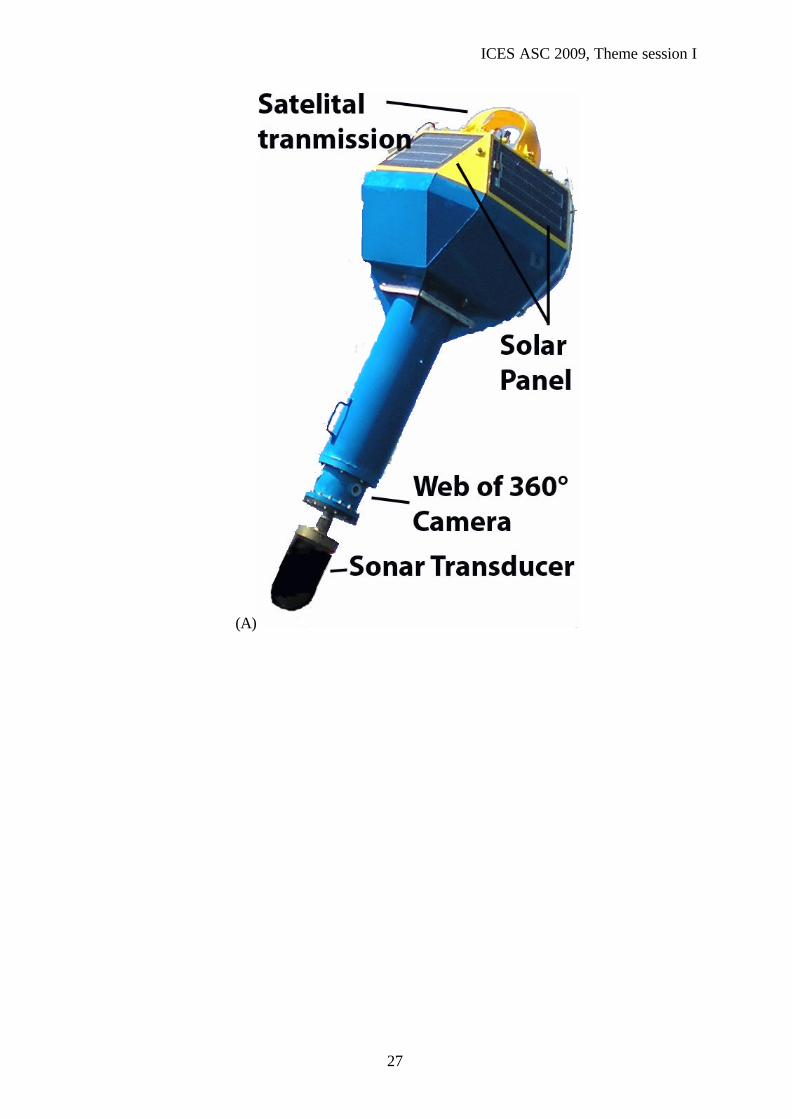
1 Autonomous equipment 2 The autonomous acoustic equipment (category 2) consisted of a prototype of a sonar buoy system 3 manufactured by Martec-Serpe designed for observing pelagic fish schools. This instrumented 4 buoy system was equipped with a scanning sonar system (model: Simrad SL 35; frequency 90 5 kHz) and a radio beacon system (WIFI: frequency 2.6 GHz; data rate transfer 6 Mo.s-1), which 6 directly transmitted the sonar data to the vessel. The buoy settings could be remotely adjusted 7 from the vessel though the WIFI. A detailed plan of this first prototype is presented in Appendix 8 1. The second prototype build by the same company following the preliminary analysis of the 9 data presented in this paper, maintaining the Simrad SL35 scanning sonar, and changing the radio 10 beacon system by a satellite one (Iridium). This last prototype was also equipped of solar panels 11 and a web of 4 underwater cameras (see Fig. Annex 2A). 12 13 Visual monitoring 14
Two visual survey methods were used from the vessel (category 1). The first one consisted in 15 visual surveys performed by SCUBA divers equipped with an underwater digital video camera 16 system. The survey consisted in a diver census starting with the fishes present directly under the 17 FAD structure within a 25 meter radius and down to 15 meters depth, followed by a dive down to 18 30 meters depth to count deeper fishes, all performed in 30 minutes (see Taquet et al. 2007 for 19 details). The second visual method tested was an underwater video system (Sea-Viewer™). It 20 was a Sea-Drop Camera model 650 Series (dimensions: diameter of 7.6 cm and length of 18.4 21 cm. Focal distance 5 1/2” to infinity), mounted on a pole along the side of the vessel (Fig. 2d), 22 the camera being at 2 m under the surface. The system was specifically optimized for the marine 23 applications such as underwater wildlife videos and habitat monitoring. The video camera 24 allowed permanent monitoring in PAL-B Video standard, stored on an S-VHS videotape 25 recorder. The analogical video data were post-digitalized with a video card (Brehmer et al. 2005). 26 The sampling methodology was to perform several passages close to the FAD keeping a distance 27 of 50 metres (same procedure than for the pole-mounted lateral sonar monitoring). 28 The autonomous visual system (category 2) tested was an Aquapix SeaSnap photographic 29 system, consisting of a Nikon CoolPix 5400 digital camera (focus 28 mm) electronically 30 controlled by a Harbotronics Snap360 turntable, all enclosed in a boro-silicate transparent 31 underwater housing (www.aquapix.net/seasnap360.php ). Panoramic views of 360° consisted of 32 ten overlapping digital images of 5 megapixels each, shooting 1 picture every 4 seconds. This 33 autonomous underwater imaging system was originally developed to monitor benthic 34 communities and obtain panoramic photographs of benthic habitats while deployed on the 35 bottom. For monitoring fishes around FADs, the Aquapix system was suspended from a buoy 36 hooked to the FAD (with an elast ic rope for absorption of the swell movement) at 3 meters depth. 37 A vane was attached below the casing to avoid erratic drift and spinning of the suspended 38 camera. 39 40 Results 41 Results obtained during this cruise with ship-based multifrequency echosounders and 42 omnidirectional sonar are detailed in Moreno et al. (2007a) and Brehmer et al. (2007), 43 respectively. Corresponding underwater visual surveys are also described in (Taquet et al. 2007). 44 Therefore, in the present paper they are shortly described in order to further discuss the interest of 45
ICES ASC 2009, Theme session I
7/28
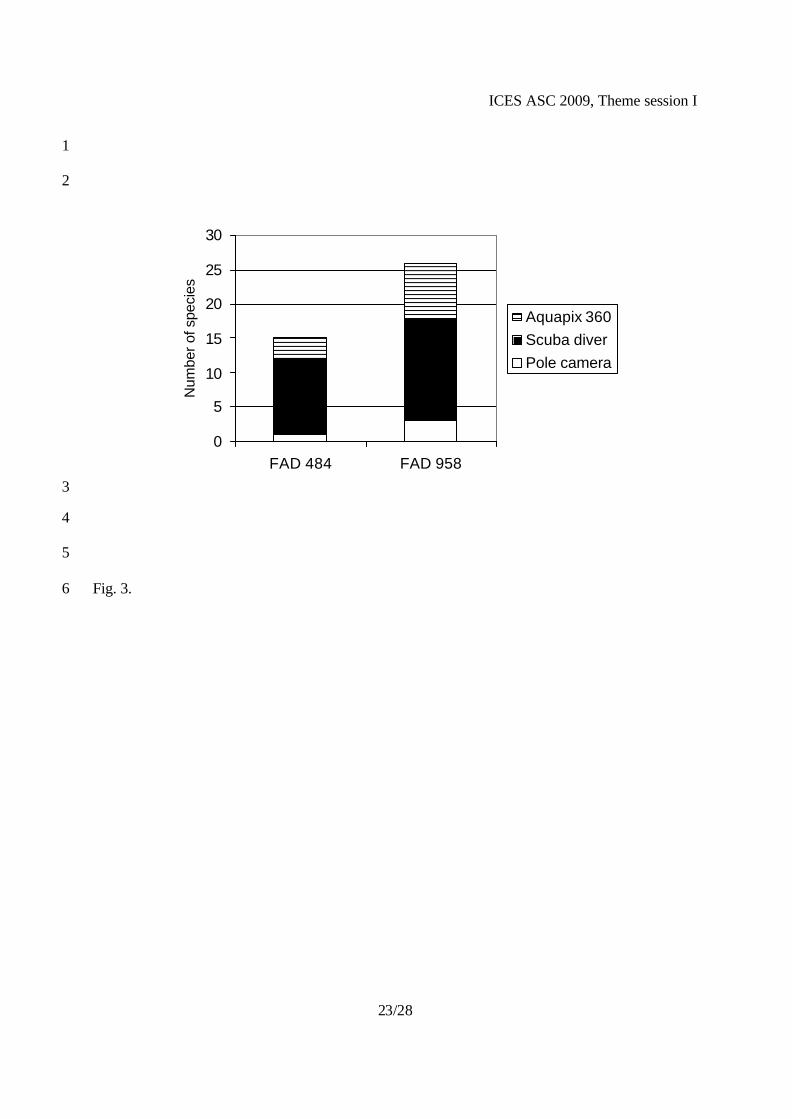
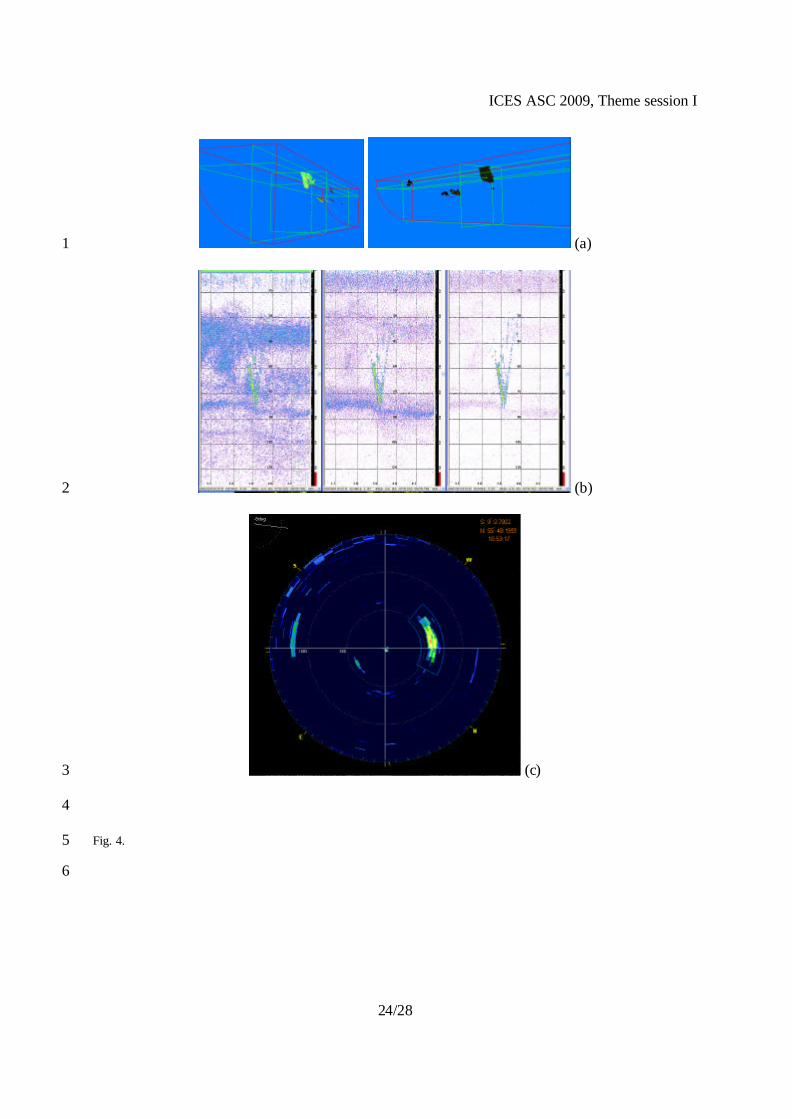
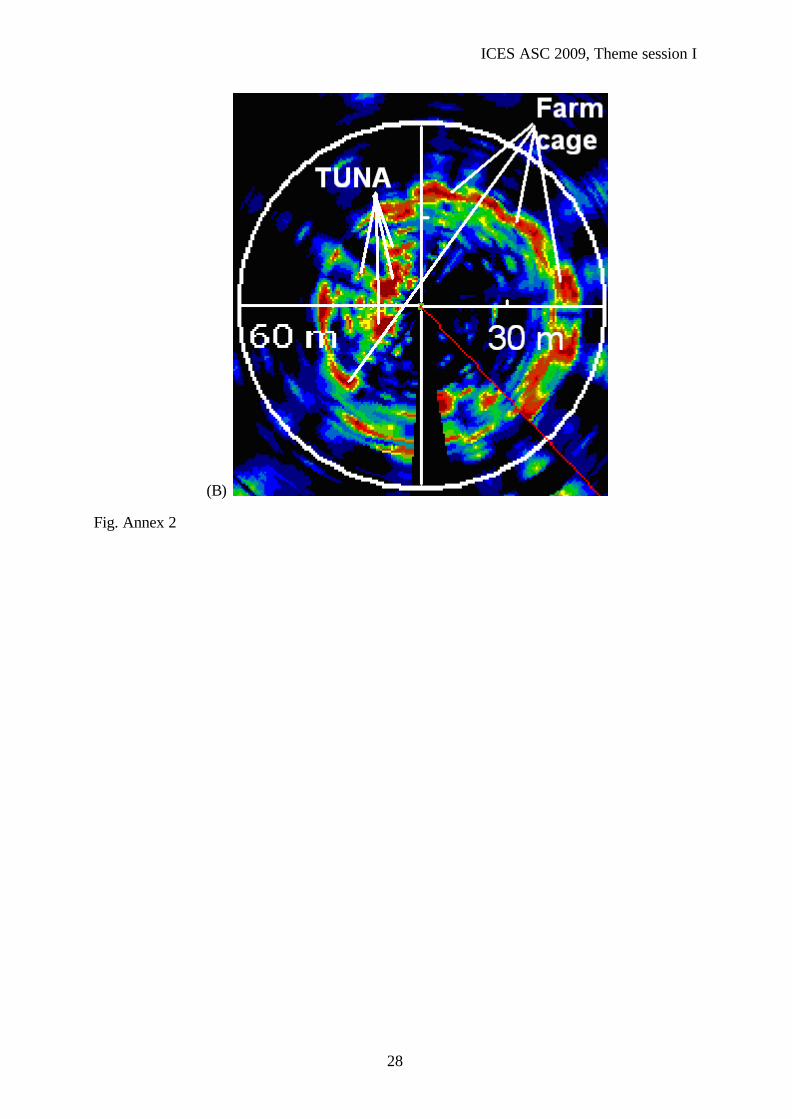
the novel data obtained through the use of (i) the Martec-Serpe autonomous buoy system, (ii) the 1 RESON lateral multibeam sonar, (iii) the Aquapix 360o rotating digital photographic camera and 2 (iv) the pole-mounted video camera (Sea Viewer). 3 Using the RESON sonar data, a tri-dimensional representation of an underwater scene around a 4 drifting FAD was produced, discriminating the FAD from the fish schools surrounding it (Fig. 5 3a). However, while the 3D positions and structures of the schools could be determined, neither 6 the species or the size of the individual fishes of these schools could be assessed from the data, 7 nor the school biomass. 8 The vertical multifrequency echosounders recordings provided accurate acoustics characteristics 9 and position of the fish schools, the individual fishes and the different planktonic scattering 10 layers present in the water column. An important observation is that acoustic responses from the 11 planktonic scattering layers varied with the frequencies used. For example, shallow layers were 12 well observed at 70 and 120 kHz, while deeper layers were best observed at 38 kHz (Fig. 3b). 13 The 120 kHz appeared as the best for tuna detection but was the worst for observation of 14 planktonic layers. On the other hand, the multifrequency methodology permitted to obtain a 15 better extraction of fish school characteristics from the echogram and estimate their relative 16 biomass (Moreno et al. 2007a). 17 The recordings by the hull-mounted omnidirectional sonar allowed for mo nitoring the behaviours 18 (kinematics and spatial structure) of large fish schools and marine mammals around the FADs, in 19 a horizontal plane, at a much higher range (max. 300 to more than 1200 m) that all the other 20 methods (Brehmer et al. 2007) (Fig. 3c). 21 The experimental trials with the first sonar buoy around the anchored FAD produced positive 22 results as it successfully recorded acoustic data on fish schools around the FAD. Horizontal 23 locations of fish school all around the FAD were observed dynamically and transmitted directly 24 to the vessel positioned at several hundred meters from the FAD. The possibility to transmit 25 directly data on the vessel platform by the radio system was validated. The ability to set the sonar 26 buoy parameters from the vessel (wireless control) was also confirmed. The second buoy 27 prototype, deployed on a bluefin tuna school in a Mediterranean farming cage, effectively 28 detected the tuna school and the net around it (see Fig. Annex 2B). 29 30 Three pole-mounted video fish observations were made at the first drifting FAD (ID 484), 31 recording one trigger fish school (Canthidermis maculatus) with about 100 individual fish, and 32 two other fish species, which could not be identified from the recordings (Table 1). On the 33 second FAD (ID 958), the pole-mounted video recorded eight fishes: one shark Carcharinus 34 falciformis (80 to 100 cm), one Carangid (species unidentified), four Kyphosus sp. and five 35 unidentified fishes (adding up to around 40 individual fish). Comparatively, a total of more than 36 600 individuals of 11 species and more than 13000 individuals of 15 species were observed 37 respectively for FADs 484 and 958 by SCUBA divers (Taquet et al. 2007). All the species 38 observed with the pole-mounted video camera were also recorded during the SCUBA surveys 39 (Table 2). There is a poor correlation between fish composition (number of identified species) 40 and abundance (number of individual fish) data collected with the pole camera and the SCUBA 41 divers surveys (Fig. 4; Table 1). Intermediate results were provided by the autonomous Aquapix 42 system, which recorded 207 individual fishes from 8 identifiable species and multiple 43 unidentified fishes at FAD 958 (Fig. 4). Three species were identified from Aquapix images at 44 FAD 484 (98 individual fish recorded), along with numerous fishes that could not be identified 45 (Fig. 4). Observations from the Aquapix system are still less efficient than observations 46 performed by SCUBA diver team, particularly on the number of individual fish. 47
ICES ASC 2009, Theme session I
8/28
Lastly we can notify that no fish species inventoried on the IUCN red list of threatened species 1 (IUCN 2008) are commonly found around both drifting FADs. 2 3 Discussion 4 The results are discussed in three parts, (i) on the acoustics observations, then (ii) the visual 5 systems to monitor fish community, (iii) the interest to combine visual and acoustics methods, 6 and lastly (iv) the perspective of autonomous system to monitor pelagic environments, combining 7 both previous methodologies. 8
The acoustics observations 9 Echosounder detections have permitted to obtain information not only on individual fishes and 10 fish schools around FADs (Josse et al. 1999, 2000), but also on the planktonic scattering layer 11 (Bertrand et al. 1999; Brierley et al. 2006; Doray et al. 2006). In order to avoid misleading 12 descriptive interpretations when plankton scattering layers occur, echosounder data must be 13 studied using multifrequency analyses (Moreno et al. 2007a), which needs at least two 14 complementaries frequencies e.g. in our case study 38 kHz and 70 kHz. 15 The echosounders had a narrow sampling volume (vs. multibeam sonar) below the vessel (Fig. 16 5), but it could efficiently correct the pitch and roll effect from the vessel experienced in rough 17 seas during the survey of the both FADs. Nevertheless, sea surface reverberation produced 18 misleading echoes at the surface and numerous acoustic parasites generated by subsurface air 19 bubbles on the lateral sonar detection. The high nearest neighbour distance (NND) (Belckman 20 1993) between individual fish inside fish aggregation and inside tuna schools did not allow 21 producing a single target: in this case the software solution did not permit the generation of useful 22 3D images. In order to avoid these signal limitations, an alternative method would be to analyse 23 raw sonar video data (Brehmer et al. 2006b). 24 The medium range omnidirectional sonar allows to detect fish school up to 800 m (Brehmer et al. 25 2006a; Brehmer et al. 2007), but has high power consumption. In the FADIO project, we limited 26 the buoy system instrumentation to small scanning sonar coupled with fixed simple video 27 cameras, which was considered a reasonable compromise between gaining scientific information 28 on FAD fish communities, power consumption and low cost objectives. 29 30
The visual observations 31
The goal of our experiment was to check their operability at sea and potential of each visual 32 devices with respect to further development of autonomous observatories. We can remark that the 33 number of species observed from the pole-mounted video and from the autonomous camera 34 (Aquapix system) are significantly lower than those estimated in situ by SCUBA divers. Many 35 factors can explain those results. The duration of observations were different: while SCUBA 36 divers were staying 30 minutes in the water to conduct their visual surveys, the pole-mounted 37 camera was used during 15 minutes more per survey, and the autonomous camera did multiple 1 38 minute scans (10 pictures) in both surveyed FAD. Also, while the divers surveyed the FAD 39 community dynamically from the surface to 30 m depth, the pole-mounted camera was located 2 40 meters below the surface turning around the FAD, and the autonomous camera three meters deep, 41 fixed under the FAD. Other factors that could explain the poor results produced by the pole-42 mounted camera was fish avoidance reactio ns to the moving vessel (Olsen et al. 1983; Fernandes 43
ICES ASC 2009, Theme session I
9/28
et al. 2000; Brehmer 2004) and a small visual range due to a narrow focal optic. However, we 1 consider that the pole -mounted camera provided some interests since it can provide visual 2 information simultaneous to acoustic data and help in identifying species from specific acoustic 3 targets. 4 The autonomous photographic camera (Aquapix) tested in our study appears to constitute the best 5 compromise between a pole -mounted video and diver surveys. The number of fishes and species 6 observed were less than those observed by SCUBA divers, but much higher than from the pole-7 mounted video. We hypothesize that with a more appropriate sampling protocol (i.e. longer 8 duration of observations, greater number of images taken), such system could approach the 9 performances of SCUBA divers at short and medium distances from the FAD. This system would 10 (i) reduce human risks (conducting SCUBA diver surveys in offshore environments is a difficult 11 and risky task), (ii) not depend on human performance, (iii) be autonomous (vs. both other visual 12 methods which involves experienced divers or the use of vessel), (iv) and can be made regularly 13 and simultaneously at multiple FADs. Consequently we decided to add a video system with 4 14 cameras at 90o from each other, which would obtain similar information to that of the Aquapix 15 rotating photographic camera in the second autonomous buoy prototype developed. 16 17
Combining visual and acoustic observations 18 At the present time the combination of video with simultaneous sonar data records is not yet 19 operational for species identification, as the range of detection by the high resolution sonar (50 20 m) was too wide i.e. the range was 50 m in a 90 ° plane and the visual detection range of the 21 pole-mounted video was around 5 to 20 m, using a narrow focal. Nevertheless experimental 22 studies could lead to fish identification using acoustics (Guillard et al. 2006). Synchronized 23 acoustics detection with fish video identification sampling the same volume of the water column 24 could be a way for such purpose and efficient new methods appear as it will be reported in the 25 future ICES CRR coordinate by Erik XXXX. A few video species identification associated with 26 acoustic records were observed during the survey using the lateral sonar and multifrequency 27 echosounder. We determined that fish recognition when the video camera was mounted in the 28 vertical plane (i.e. as the echosounder) is more difficult than when the video system samples in 29 the horizontal plane (i.e. as for the lateral sonar (Fig. 2d)). Combining visual and acoustics is a 30 way to facilitate the acoustic discrimination of fish species, which is a key to the reduction of by-31 catch (Bailey et al. 1996, Holland et al. 2003) and the take of undersize tuna species (Brehmer et 32 al. 2005; Miquel et al. 2006) by the fishing industry. 33 34 The sampling area covered by each sampling method encompassed different scales (Fig.5). 35 Moreover the information on the fish aggregations delivered by the different active acoustic 36 methodologies were highly complementary (Brehmer et al. 2002): from a few small individual 37 fishes located just below the FAD (Taquet 2004) visually observed by divers [Range 38 (omnidirectional): 0 to 30 m, maximum 50 m], to the large schools of tuna [Range 39 (omnidirectional): 5-800 m, maximum 1200 m] all around the FAD (Fig. 4c) detected by 40 omnidirectional sonar, and the individual fishes as the planktonic layers observed by the 41 multifrequency echosounders [Range (vertical): 3-200 m, maximum 600 m]. Fish of some 42 centimetres directly present under the FAD could not be detected by our acoustics devices 43 because they were present in the near field of the sonars and the multifrequency echosounders, or 44 because they were below the range resolution of the transducers. 45
ICES ASC 2009, Theme session I
10/28
1
Perspectives in autonomous pelagic observatories 2
A drifting monitoring buoy system appears to be a valid observational platform since it may 3 naturally act as a FAD and therefore allow for long term monitoring of pelagic fish communities 4 without human disturbances. These buoys could also potentially cover large areas while being 5 displaced by surface currents and winds. Purse seine fishermen are already working with 6 autonomous non-scientific acoustic buoys that remotely provide information on relative biomass 7 estimates using commercial echosounders and satellite transmitters (Moreno et al 2007b), which 8 shows the value and the operability of such systems. Future refinements to both buoy prototypes 9 are needed before a final autonomous buoy reaches the production stage. Hardware power 10 consumption is still the main challenge for building autonomous instrumented drifting platforms 11 with acoustic and video surveying capabilities in offshore environments. The rate of data transfer 12 through satellite transmissions does not constitute a technical limitation as the buoy manufacture 13 (Stolte 1994). Video systems have shown their operability in remote harsh conditions, plus they 14 have low power consumption which allows them to be mounted additionally to sonar systems. 15 Our second autonomous buoy prototype (figure Appendix 2) with four web quality cameras 16 provides 360° underwater view (4*90°) around the buoy. Data can be transmitted though radio or 17 satellite communication modules (e.g. Iridium or Immarsat) which provide short to long distance 18 real time data transmission. An alternative is to store data on a hard disk in the buoy (Wilson 19 1998; Godø and Totland 1999), which increases power economy, but requires the recovery of the 20 device to access the recorded data. However, the recovery of dr ifting buoys after long 21 deployments in the open ocean where purse seiner fishing fleets operate is very unlikely (Moreno 22 et al. 2007a). To further increase power economy, video cameras could be only activated during 23 daytime hours and triggered according to particular acoustics detection characteristics (e.g. 24 changes in acoustic intensity and reflectivity indexes of the targets) or when certain movement 25 patterns are acoustically detected (i.e. fish passage in the camera detection field) (Spruijt et al. 26 1992). Fish tracking by video can also be envisaged to increase the fish species recognition 27 (Kirkpatrick et al. 1991; Noldus et al. 2002). The power limitation will be inversely proportional 28 to the buoy size (battery compartment size). A certain critical buoy size is needed to implement 29 renewable energy generators such as solar panel, wind turbine or fuel cells, which would allow 30 adding all kind of valuable instruments and sensors to the buoy such as acoustic doppler current 31 profilers ADCP (Brierley et al. 2006). In our case of drifting FAD ecological studies, 32 atmospheric and oceanographic sensors (rain, wind, air and water temperature, water 33 conductivity and turbidity, etc.), hydrophones (sea state, bioacoustic noises) and acoustic 34 listening stations (Ohta and Kakuma 2005; Dagorn et al. 2007), do not need heavy technical 35 adaptation even expense and can provide the valuable information. 36 Apart from the devices used in our project, an interesting possibility would be to use remotely 37 operated vehicles (ROV) and autonomous underwater vehicles (AUV) with the buoy as a power 38 and data transmission platform. Fernandes et al. (2003) have shown that such equipment could be 39 equipped with acoustics devices and produce high quality results. The main interest is that the 40 AUV equipped with physical, acoustic and video sensors could make surveys around the FAD at 41 several depths, could track particular individuals, or lead inter-FAD transect. A limitation could 42
ICES ASC 2009, Theme session I
11/28
be the avoidance by fishes of underwater vehicles, shown to occur in some deep sea fish species 1 (Trenkel et al. 2004). 2 This work paves way to provide interesting perspective for fisheries and ecological studies in the 3 pelagic environment. Dagorn et al (2007) underline the interest to study top predators using buoy 4 observatory, because they have natural aggregative behaviour around the buoy. The interest to 5 use web of instrumented buoy at large scale was a perspective of the Fadio project (Dagorn 2005; 6 Dagorn et al. 2007). Future project are already planed using several buoys clustering in a web, 7 which could be led at the level of an ecosystem, e.g. firstly by installing echosounders on weather 8 buoys which already are scattered across all the oceans (Olivier Maury and Patrick Leodey, pers. 9 com.), in the interest to set and validate planktonic production models. Future studies which 10 necessitate an ecosystem approach (e.g. Godø and Tenningen 2009), need adapted experimental 11 sampling scheme, using ad hoc methodologies and devices. An important goal using such 12 autonomous tools, in particular in such open sea pelagic environments seldom surveyed but 13 which need to be regularly monitored, will be to look for consistent indicators (Josse 2008) of the 14 ecosystem ecological status. 15 16 Conclusions 17
These results refined our methodology for characterizing fish aggregations and will help with the 18 study of dynamic fish aggregations in association with drifting FADs as well as to monitor 19 pelagic fishes in an ecosystems approach, including seabirds, marine mammals and plankton 20 communities. Visual fish censuses by divers were limited in space and time, while acoustic 21 methods were not. Acoustics methods are well standardized and are not dependant on underwater 22 visibility. On the other hand SCUBA diver fish surveys allow accurate fish species identifica tion 23 and collection of detailed information on the FADs characteristics. Catching fishes from FAD 24 aggregations with commercial purse seiners remains a valid way to obtain detailed fish 25 inventories and abundance estimates around drifting FADs, though this method does not produce 26 data on fish behavioural dynamics nor the presence of small fishes that swim through the net 27 mesh or more simply not catchable by the fishing practice. 28 The underwater acoustics and video autonomous buoy system, drifting or fixed, linked with 29 satellite communication, radio link (near a reception centre) or high memory storage recoverable 30 systems will be in a near future an operative tool for monitoring fish behaviour, abundance and 31 biodiversity. Indeed a combination of video and acous tic observations recorded simultaneously 32 from the same instrumented buoy structure will provide large quantities of basic information 33 useful for ecological and fisheries studies on fish aggregations in the open sea, as in our case 34 study, or coastal pelagic environment. In the context of global warming, biodiversity 35 conservation and overexploitation of natural resources, such tools could provide in situ data and 36 consistent indicators crucial to making ecological studies in the pelagic ecosystems. 37 38 Acknowledgements 39
This work has been realised through the European project FADIO, 5th Framework Programme 40 Research Directorate General contract QLRI-CT-2002-02773 with the Seychelles Fishing 41 Authority facilities. Previous work on sonar data visualization was done under the Avitis project 42 (EU DG XIV contract Fair CT 96-1717). Final edition works has been supported by the 43 Oceanraise contribution 09-001. Thanks to the crew of the Indian Ocean Explorer and the Olivier 44
ICES ASC 2009, Theme session I
12/28
Dugornay and Bertrand Wendeling for conducting underwater visual and video surveys. The 1 M/V Indian Ocean Explorer has been seized by Somali pirates between Assumption and Aldabra 2 in April 2009; we hope a safe issue and dedicated this work to all the crew. 3 4 References 5
Bailey K., Williams P.G., Itano D., 1996, By-catch and discards in the Western Pacific Tuna 6 fisheries: A review of SPC data holdings and literature. South Pacific Commission, Noumea, 7 New Caledonia, Oceanic Fisheries Programme, Tech. Rep. 34, Various pagings. 8
Benfield M.C., Wiebe P.H., Stanton T.K., Davis C.S., Gallager S.M., Greene C.H.. 1998, 9 Estimating the spatial distribution of zooplankton biomass by combining Video Plankton 10 Recorder and single- frequency acoustic data. Deep Sea Research Part II: Topical Studies in 11 oceanography, 45(7), 1175-1199. 12
Bertrand A., Le Borgne R., Josse E., 1999. Acoustic characterisation of micronekton distribution 13 in French Polynesia. Marine Ecology Progress Series, 191: 127-140. 14
Bleckmann H., 1993, Role of lateral line in fish behaviour. In: Pitcher T.J. (Ed.), Behaviour of 15 Teleost Fishes, Chapman and Hall, London, pp. 201-246. 16
Brehmer P., Aumeeruddy R., Itano D., Taquet M., Gerlotto F., Sanchez G., 2005, Simultaneous 17 under water digital video recording and multibeam sonar monitoring of FADs and artificial reef 18 in eastern Indian Ocean. In: Papadakis J.S. and Bjorno L. (Eds.) Proceedings of the 1st 19 International Conference Underwater acoustic measurements: technologies and results, 20 Heraklion, Crete, 28th June – 1st July, 2005, 6 pp. 21
Brehmer P., Georgakarakos S., Josse E., Trygonis V., Dalen J., 2007, Adaptation of fisheries 22 sonar for monitoring schools of large pelagic fish: dependence of schooling behaviour on fish 23 finding efficiency. Aquat. Living Resour. 20, 377-384. 24
Brehmer P., Gerlotto F., Rouault A., 2002. In situ inter-standardization of acoustics data: an 25 integrated database for fish school studies. Acta Acoust., 88, 730-733. 26
Brehmer P., Lafont T., Georgakarakos S., Josse E., Gerlotto F., Collet C., 2006a, Omnidirectional 27 multibeam sonar monitoring: Applications in Fisheries Science. Fish Fish. 7, 165-179. 28
Brehmer P., Vercelli C., Gerlotto F., Sanguinède F., Pichot Y., Buestel D., Guénnegan Y., 2006b, 29 Multibeam sonar detection of suspended mussel culture grounds in open sea: Direct observation 30 methods for management purpose. Aquaculture 252, 234-241 31
Brierley A.S., Saunders R.A., Bone D.G., Murphy E.J., Enderlein P., Conti S.G., Demer D.A., 32 2006, Use of moored acoustic instruments to measure short-term variability in abundance of 33 Antarctic krill. Limnol. Oceanogr. 4, 18-29. 34
Castro J.J., Santiago J.A., Santana-Ortega, A.T., 2001, A general theory on fish aggregation to 35 floating objects: An alternative to the meeting point hypothesis. Rev. Fish Biol. Fish. 11, 255-36 277. 37
Cevher V., Sankaranarayanan A.C., McClellan J.H., Chellappa R., 2007, Target Tracking using a 38 Joint Acoustic Video System. IEEE Transactions on Multimedia. 12pp. 39
ICES ASC 2009, Theme session I
13/28
Dagorn L., Holland K., Dalen J., Brault P., Vrignaud C., Josse E., Moreno G., Brehmer P., 1 Nottestad L., Georgakarakos S., Trigonis V., Taquet M., Aumeeruddy R., Girard C., Itano D., 2 Sancho G., 2007, New instruments to observe pelagic fish around FADs: satellite- linked acoustic 3 receivers and buoys with sonar and cameras. In Lyle J.M., Furlani D.M., Buxton C.D. (Eds), 4 Cutting-edge technologies in fish and fisheries science. Australian Society for Fish Biology 5 Workshop Proceedings, Hobart, Tasmania, August 2006, Australian Society for Fish Biology, pp. 6 37-40. 7
Dagorn L., 2005, Le comportement des poissons pélagiques tropicaux autour des objets flottants : 8 le mystère à l'épreuve des observations et théories. Habilitation à Diriger des Recherches, 9 Université de Perpignan: 85 p. 10
Dagorn L., Pincock D., Girard C., Holland K., Taquet M., Sancho G., Itano D., Aumeeruddy R., 11 2007b, Satellite-linked acoustic receivers to observe behavior of fish in remote areas. Aquat. 12 Living Resour. 20, 307-312. 13
Dickey T., 2003, Emerging ocean observations for interdisciplinary data assimilation systems. 14 Journal of Marine Systems, 40-41, 5-48. 15 Doray M., Josse E., Gervain P., Reynal L., Chantrel J., 2006, Acoustic characterisation of pelagic 16 fish aggregations around moored fish aggregating devices in Martinique (Lesser Antilles). Fish. 17 Res. 82, 162-175. 18
Fernandes P.G., Brierley A.S., Simmonds E.J., Millard N.W., McPhail S.D., Armstrong F., 19 Stevenson P., Squires M., 2000, Fish do not avoid survey vessels. Nature 404, 35-36. 20
Fernandes P.G., Stevenson P., Brierley A.S., Armstrong F., Simmonds E.J., 2003, Autonomous 21 underwater vehicles: future platforms for fisheries acoustics. ICES J. Mar. Sci. 60, 684-691. 22
Fonteneau A., Pallarés P., Pianet R., 2000, A worldwide review of purse seine fisheries on FADs. 23 In: Le Gall J.-Y., Cayré P., Taquet M. (Eds.), Pêche thonière et dispositifs de concentration de 24 poissons. IFREMER, Actes Colloq. 28, pp. 15-34. 25
Fréon P., Dagorn L., 2000, Review of fish associative behaviour: toward a generalisation of the 26 meeting point hypothesis. Rev. Fish Biol. Fish.10, 183-207. 27
Fréon P., Misund O.A., 1999, Dynamics of pelagic fish distribution and behaviour: effects on 28 fisheries and stock assessment. Fishing News Books, Blackwell Scientific, Oxford. 29
Gaertner D., Pagavino M., Marcano J., 1999, Influence of fishers' behaviour on the catchability 30 of surface tuna schools in the Venezuelan purse-seiner fishery in the Caribbean Sea. Can. J. Fish. 31 Aquat. Sci. 56 394-406. 32
Gerlotto F., Soria M., Fréon P., 1999, From two dimensions to three: the use of multibeam sonar 33 for a new approach in fisheries acoustics. Can. J. Fish. Aquat. Sci. 56, 6-12. 34
Godø O.R., Tenningen E. 2009, Remote Sensing. In: Megrey B.A., Moksness E. (Eds.) 35 Computers in Fisheries Research, 2nd Edition., Kluwer Academic Publishers, pp. 121-144. 36
Godø O.R., Totland A., 1999, Bergen acoustic buoy (BAB): A tool for remote monitoring of 37 marine resources. J. Acoust. Soc. Am. 105, 1051-1051. 38
Guillard J., Brehmer P., Colon M., Guennégan Y., 2006, Three dimensional characteristics of 39 young–of–year pelagic fish schools in lake. Aquat. Living Resour. 19, 115-122. 40
ICES ASC 2009, Theme session I
14/28
Hall M., Alverson D.L., Metuzals K.I., 2000, By-Catch: Problems and Solutions. Mar. Poll. Bull. 1 41, 204-219. 2
Hallier J.-P., Gaertner D. 2008. Drifting fish aggregation devices could act as an ecological trap 3 for tropical tuna species. Mar. Ecol. Prog. Ser. 353, 255-264. 4
Holland K., Grubbs D., Graham B., Itano D., Dagorn L., 2003, The biology of FAD-associated 5 tuna: temporal dynamics of association and feeding ecology. Secretariat of the Pacific 6 Community, Noumea, New Caledonia, Standing Committee on Tuna and Billfish, Mooloolaba, 7 Queensland, Australia, 9-16 July 2003, SCTB16 Working Paper YFT-7, 6p. 8
Hunter J.R., Mitchell C.T., 1967, Association of fishes with flotsam in the offshore waters of 9 Central America. Fish. Bull. 66, 13-29. 10
Hyrenbach K.D., Forney K.A., Dayton P.K., 2000, Marine protected areas and ocean basin 11 management. Aquat. Conserv.: Mar. Freshw. Ecosyst. 10, 437-458. 12
IUCN, 2008, IUCN Red List of Threatened Species. http://www.iucnredlist.org/ 13
Jones R.S., Thompson M.J., 1978, Comparison of Florida reef fish assemblages using a rapid 14 visual survey technique. Bull. Mar. Sci. 28, 159-172. 15
Josse E., 2008. L'observation acoustique des écosystèmes aquatiques. De l'écologie halieutique à 16 la définition d'indicateurs bioacoustiques. Habilitation à Diriger des Recherches, Université de 17 Bretagne Occidentale, Ecole Doctorale des Sciences de la Mer, Brest, 76p. 18
Josse E., Bertrand A., Dagorn L., 1999, An acoustic approach to study tuna aggregated around 19 fish aggregating devices in French Polynesia: methods and validation. Aquat. Living Resour. 12, 20 303-313. 21
Josse E., Dagorn L., Bertrand A., 2000, Typology and behaviour of tuna aggregations around fish 22 aggregating devices from acoustic surveys in French Polynesia. Aquat. Living Resour. 13, 183-23 192. 24
Kimmel J.J., 1985, A new species-time method for visual assessment of fishes and its comparison 25 with established methods. Environ. Biol. Fish. 12, 23-32. 26
Kirkpatrick T., Schneider C.W., Pavloski R., 1991, A computerized infrared monitor for 27 following movement in aquatic animals. Behav. Res. Meth. Instr. Comp. 23, 16-22. 28
Koslow J. A., 2009, The role of acoustics in ecosystem-based fishery management. ICES Journal 29 of Marine Science, 66, 000–000. 30
Ménard F., Fonteneau A., Gaertner D., Nordstom V., Stéquert B., Marchal E. 2000, Exploitation 31 of small tunas by a purse seine fishery with fish aggregating devices and their feeding ecology in 32 an eastern tropical Atlantic ecosystem. ICES J. Mar. Sci. 57, 525-530. 33
Michalopoulos C., Auster P.J., Malatesta R.J., 1992, A comparison of transect and species-time 34 counts for assessing faunal abundance from video surveys. Mar. Tech. Soc. J. 26, 27– 31. 35
Miquel J., Delgado de Molina A., Ariz J., Delgado de Molina R., Déniz S., Díaz N., Iglesias M., 36 Santana J.C., Brehmer P., 2006, Acoustic Selectivity in Tropical Tuna (Experimental Purse-seine 37 Campaign in the Indian Ocean). Western and Central Pacific Fisheries Commission, Scientific 38 Committee, Second regular session, 7-18 August 2006, Manila, Philippines, WCPFC-SC2/FT 39 WP-8: 31p. 40
ICES ASC 2009, Theme session I
15/28
Moreno G., Dagorn L., Sancho G., García D., Itano D., 2007b, Using local ecological knowledge 1 (LEK) to provide insight on the tuna purse seine fleets of the Indian Ocean useful for 2 management. Aquat. Living Resour. 20: 367-376. 3
Moreno G., Josse E., Brehmer P., Nøttestad L., 2007a, Echotrace classification and spatial 4 distribution of pelagic fish aggregations around drifting fish aggregating devices (DFAD). Aquat. 5 Living Resour. 20: 343-356. 6
Noldus L.P.J.J., Spink, A.J., Tegelenbosch, R.A.J., 2002, Computerised video tracking, 7 movement analysis and behaviour recognition in insects. Comput. Electr. Agric. 35, 201-227. 8
Ohta I., Kakuma S., 2005, Periodic behavior and residence time of yellowfin and bigeye tuna 9 associated with fish aggregating devices around Okinawa Islands, as identified with automated 10 listening stations. Mar. Biol. 146, 581-594. 11
Olsen K., Angell J., Pettersen F. Løvik A., 1983, Observed fish reactions to a surveying vessel 12 with special reference to herring, cod, capelin and polar cod. FAO Fish. Rep. 300, 131-139. 13
Palud P., 2005, Schéma de principe bouée autonome Fadio version SL35. Technical Doc. Simrad 14 Europe France, Parc Technologique de soye, Ploemeur, France. 15
Pitcher T.J., 1983, Heuristic definitions of shoaling behaviour. Anim. Behav. 31, 611-613. 16
Romanov E.V., 2002, By-catch in the tuna purse-seine fisheries of the western Indian Ocean. 17 Fish. Bull. 100, 90-105. 18
Simmonds E.J., MacLennan D.N., 2005, Fisheries acoustics. Theory and practice. Blackwell 19 Publishing, Oxford. 20
Spruijt B.M., Hol T., Rousseau J.B.I., 1992, Approach, avoidance, and contact behavior of 21 individually recognized animals automatically quantified with an imaging technique. Physiol. 22 Behav. 51, 747-752. 23
Stolte S., 1994, Short-wave measurements by a fixed tower-based and a drifting buoy system. 24 IEEE J. Ocean. Eng. 19, 10-22. 25
Taquet M., 2004, Le comportement agrégatif de la dorade coryphène (Coryphaena hippurus) 26 autour des objets flottants. Thèse de Doctorat de l'Université de Paris 6, Océanologie biologique, 27 Ifremer, 168 p. 28
Taquet M., Sancho G., Dagorn L., Gaertner J.-C., Itano D., Aumeeruddy R., Wendling B. 29 Peignon C., 2007, Characterizing fish communities associated with drifting fish aggregating 30 devices (FADs) in the Western Indian Ocean using underwater visual surveys. Aquat. Living 31 Resour. 20, 331-341. 32
Trenkel V.M., Lorance P., Mahévas S., 2004, Do visual transects provide true population density 33 estimates for deep-water fish? ICES J. Mar. Sci. 61, 1050-1056. 34
Trygonis V., Georgakarakos S., Simmonds E. J., 2009, An operational system for automatic 35 school identification on multibeam sonar echoes. ICES J. mar. Sci. 2009 66: 935-949. 36
Wilson C.D., 1998, Field trials using an acoustic buoy to measure fish response to vessel and 37 trawl noise. J. Acoust. Soc. Am. 103, 3036-3036. 38
39 40
ICES ASC 2009, Theme session I
16/28
1 Number of visual observation
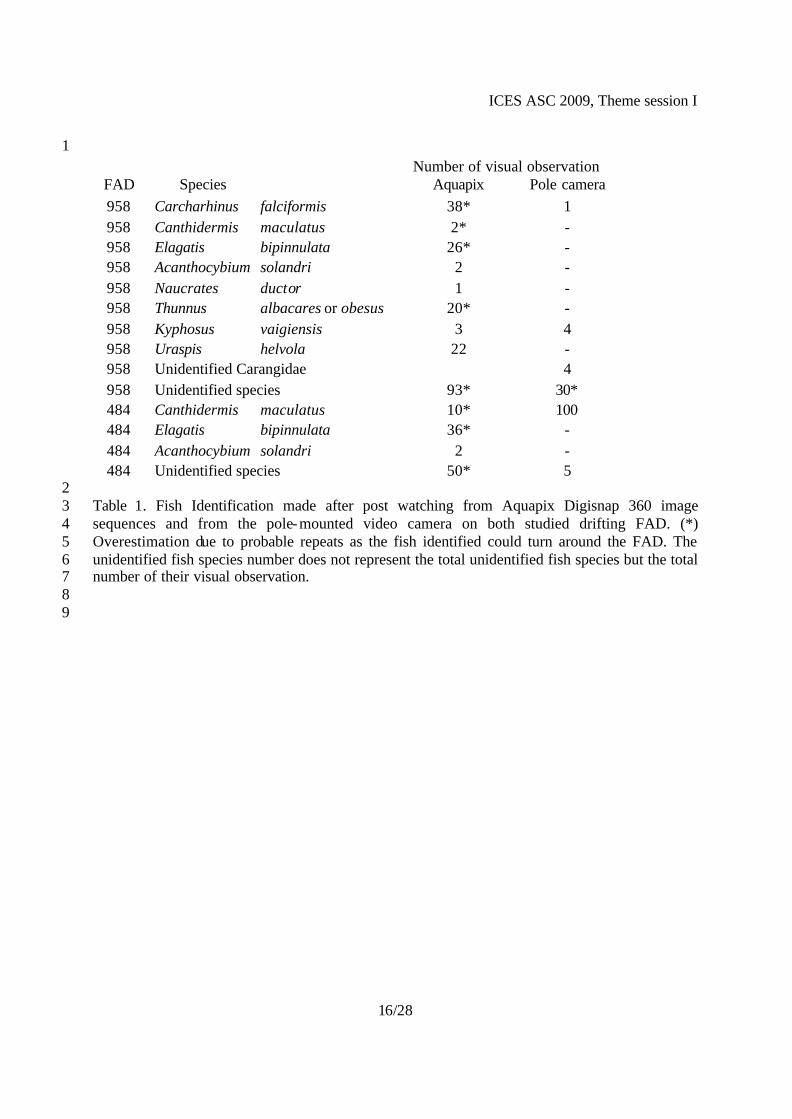
FAD Species Aquapix Pole camera 958 Carcharhinus falciformis 38* 1 958 Canthidermis maculatus 2* - 958 Elagatis bipinnulata 26* - 958 Acanthocybium solandri 2 - 958 Naucrates ductor 1 - 958 Thunnus albacares or obesus 20* - 958 Kyphosus vaigiensis 3 4 958 Uraspis helvola 22 - 958 Unidentified Carangidae 4 958 Unidentified species 93* 30* 484 Canthidermis maculatus 10* 100 484 Elagatis bipinnulata 36* - 484 Acanthocybium solandri 2 - 484 Unidentified species 50* 5
2 Table 1. Fish Identification made after post watching from Aquapix Digisnap 360 image 3 sequences and from the pole-mounted video camera on both studied drifting FAD. (*) 4 Overestimation due to probable repeats as the fish identified could turn around the FAD. The 5 unidentified fish species number does not represent the total unidentified fish species but the total 6 number of their visual observation. 7 8 9
ICES ASC 2009, Theme session I
17/28
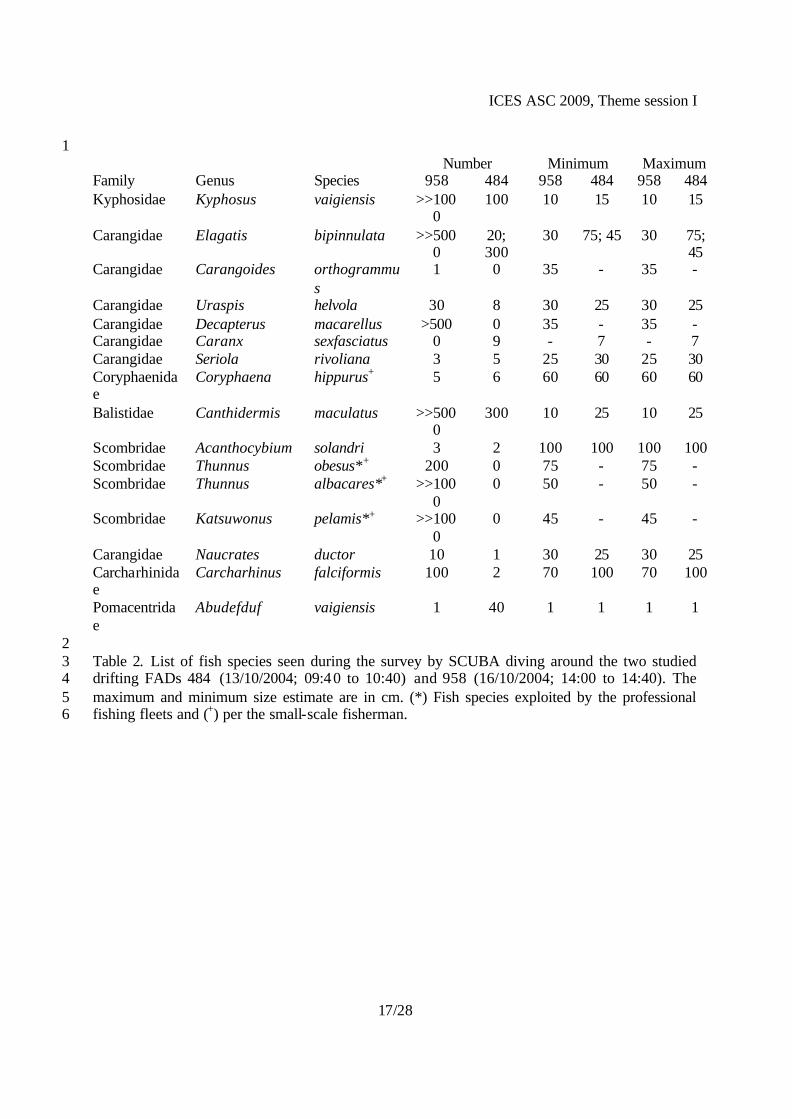
1 Number Minimum Maximum Family Genus Species 958 484 958 484 958 484 Kyphosidae Kyphosus vaigiensis >>100
0 100 10 15 10 15
Carangidae Elagatis bipinnulata >>5000
20; 300
30 75; 45 30 75; 45
Carangidae Carangoides orthogrammus
1 0 35 - 35 -
Carangidae Uraspis helvola 30 8 30 25 30 25 Carangidae Decapterus macarellus >500 0 35 - 35 - Carangidae Caranx sexfasciatus 0 9 - 7 - 7 Carangidae Seriola rivoliana 3 5 25 30 25 30 Coryphaenidae
Coryphaena hippurus+ 5 6 60 60 60 60
Balistidae Canthidermis maculatus >>5000
300 10 25 10 25
Scombridae Acanthocybium solandri 3 2 100 100 100 100 Scombridae Thunnus obesus*+ 200 0 75 - 75 - Scombridae Thunnus albacares*+ >>100
0 0 50 - 50 -
Scombridae Katsuwonus pelamis*+ >>1000
0 45 - 45 -
Carangidae Naucrates ductor 10 1 30 25 30 25 Carcharhinidae
Carcharhinus falciformis 100 2 70 100 70 100
Pomacentridae
Abudefduf vaigiensis 1 40 1 1 1 1
2 Table 2. List of fish species seen during the survey by SCUBA diving around the two studied 3 drifting FADs 484 (13/10/2004; 09:40 to 10:40) and 958 (16/10/2004; 14:00 to 14:40). The 4 maximum and minimum size estimate are in cm. (*) Fish species exploited by the professional 5 fishing fleets and (+) per the small-scale fisherman. 6
ICES ASC 2009, Theme session I
18/28
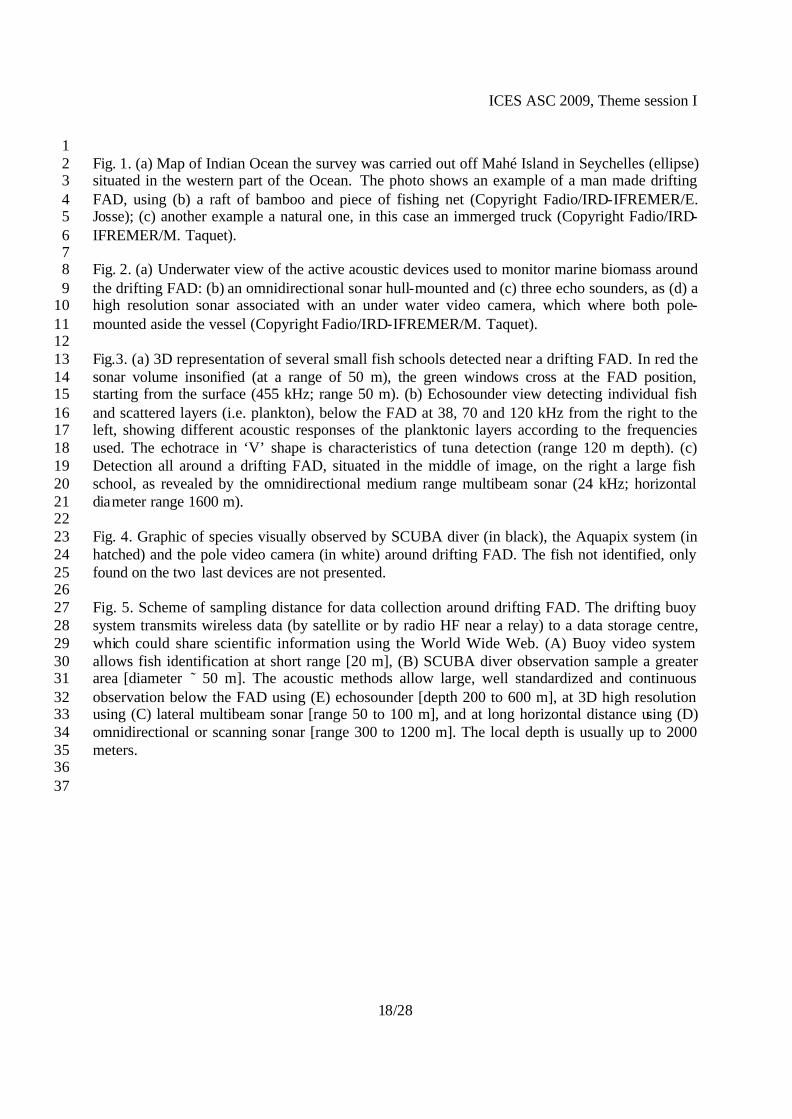
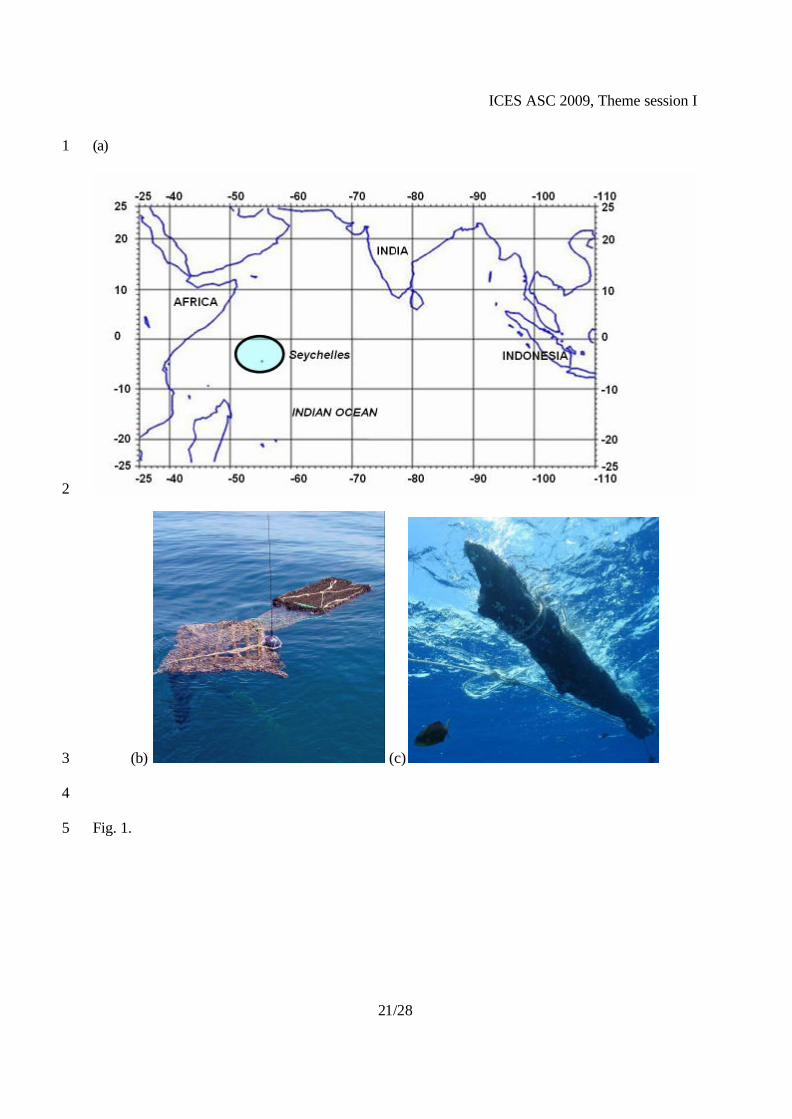
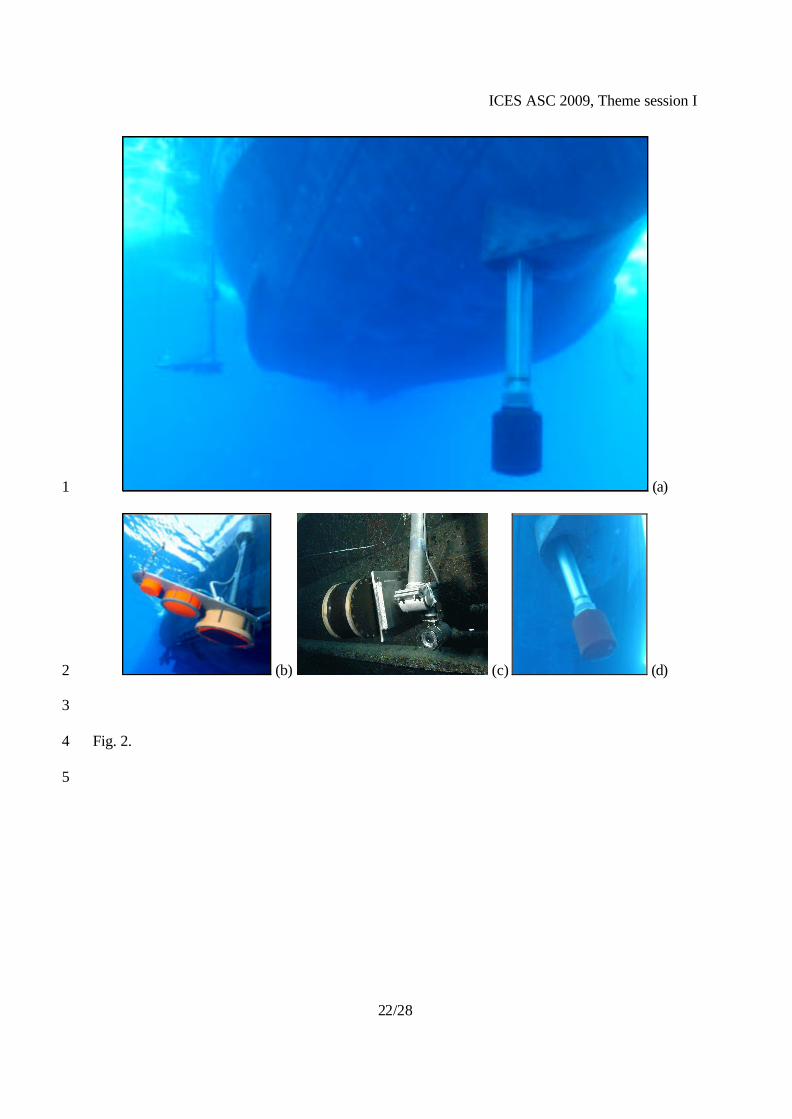
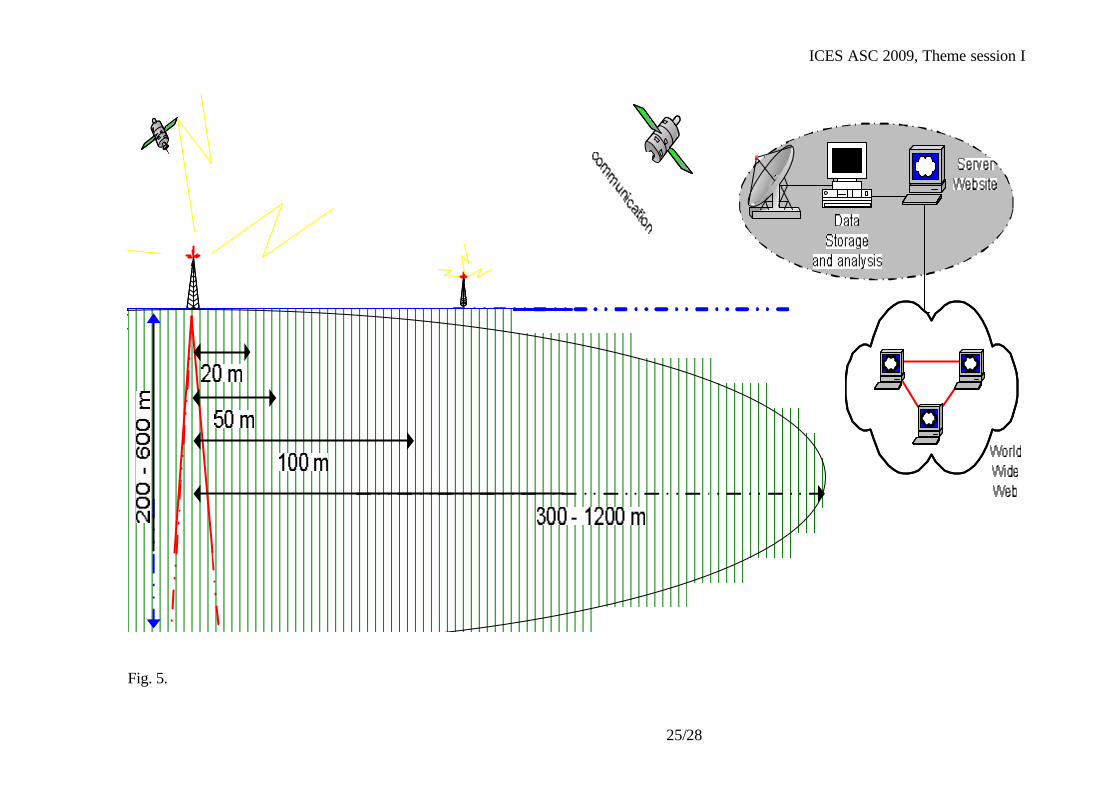
1 Fig. 1. (a) Map of Indian Ocean the survey was carried out off Mahé Island in Seychelles (ellipse) 2 situated in the western part of the Ocean. The photo shows an example of a man made drifting 3 FAD, using (b) a raft of bamboo and piece of fishing net (Copyright Fadio/IRD-IFREMER/E. 4 Josse); (c) another example a natural one, in this case an immerged truck (Copyright Fadio/IRD-5 IFREMER/M. Taquet). 6 7 Fig. 2. (a) Underwater view of the active acoustic devices used to monitor marine biomass around 8 the drifting FAD: (b) an omnidirectional sonar hull-mounted and (c) three echo sounders, as (d) a 9 high resolution sonar associated with an under water video camera, which where both pole-10 mounted aside the vessel (Copyright Fadio/IRD-IFREMER/M. Taquet). 11 12 Fig.3. (a) 3D representation of several small fish schools detected near a drifting FAD. In red the 13 sonar volume insonified (at a range of 50 m), the green windows cross at the FAD position, 14 starting from the surface (455 kHz; range 50 m). (b) Echosounder view detecting individual fish 15 and scattered layers (i.e. plankton), below the FAD at 38, 70 and 120 kHz from the right to the 16 left, showing different acoustic responses of the planktonic layers according to the frequencies 17 used. The echotrace in ‘V’ shape is characteristics of tuna detection (range 120 m depth). (c) 18 Detection all around a drifting FAD, situated in the middle of image, on the right a large fish 19 school, as revealed by the omnidirectional medium range multibeam sonar (24 kHz; horizontal 20 diameter range 1600 m). 21 22 Fig. 4. Graphic of species visually observed by SCUBA diver (in black), the Aquapix system (in 23 hatched) and the pole video camera (in white) around drifting FAD. The fish not identified, only 24 found on the two last devices are not presented. 25 26 Fig. 5. Scheme of sampling distance for data collection around drifting FAD. The drifting buoy 27 system transmits wireless data (by satellite or by radio HF near a relay) to a data storage centre, 28 which could share scientific information using the World Wide Web. (A) Buoy video system 29 allows fish identification at short range [20 m], (B) SCUBA diver observation sample a greater 30 area [diameter ˜ 50 m]. The acoustic methods allow large, well standardized and continuous 31 observation below the FAD using (E) echosounder [depth 200 to 600 m], at 3D high resolution 32 using (C) lateral multibeam sonar [range 50 to 100 m], and at long horizontal distance using (D) 33 omnidirectional or scanning sonar [range 300 to 1200 m]. The local depth is usually up to 2000 34 meters. 35 36 37
ICES ASC 2009, Theme session I
19/28
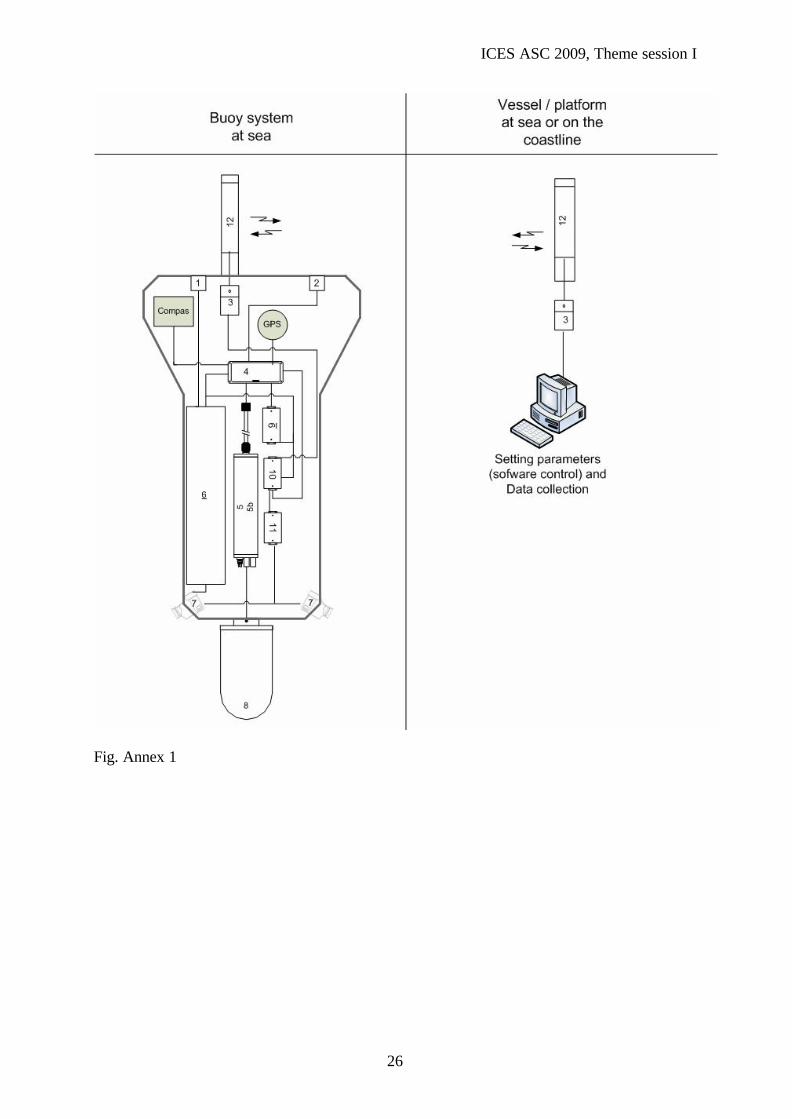
Appendix 1 2 Conceptual scheme of the autonomous buoy system equipped of scanning sonar Simrad SL 35, a 3 web of underwater camera and a module of data transmission (according Palud 2005). The sonar 4 parameters could be set and the data transmitted at short distance (WIFI transmission module) or 5 at long distance (satellite transmission module) from a platform close to the buoy using a WIFI 6 connection (first buoy prototype : Appendix 1) or from the land using satellite communication 7 (second buoy prototype: Appendix 2). 8 9
Figure Appendix 1 HERE 10 11
Figure Appendix 2 HERE 12 13 Figure Appendix 1. Block diagram. Technical legend of the main Fadio buoy component, linked 14 (wireless transmission/reception) to a PC control. 1: Alimentation 24 volt. 2: Connect ion RJ 45 15 (Ethernet). 3: Antenna connector. 4: Fan less motherboard (PCB PC). 5: Module power manager 16 (12V, 8V, 5V). 5b: Module data converter analog/digital, transmission signal. 6: Battery (floating 17 mode); plumb, 2V by element. 7: Web of underwater camera D- link system. 8: Transducer, 18 scanning sonar model Simrad SL35 (200 kHz); motion sensor. 9: Multiplexer USB data. 10: N-19 port serial interface (1510-IP). 11: N-port optical module (1510-IPO). 12: Antenna; modularly 20 WIFI (e.g. 2.6 GHz) or satellite (e.g. iridium). 21 22

ICES ASC 2009, Theme session I
20/28
1 2
Figure Appendix 2. (A) Photography of the last buoy prototype using wireless satellite system 3 (iridium transmission), solar panel and a web of under water camera. (B) Example of detection 4 led in a tuna farming cage, we can distinguished the tuna schools and the circular net of 60 m 5 diameter. 6
ICES ASC 2009, Theme session I
21/28
(a) 1
2
(b) (c) 3
4
Fig. 1. 5
ICES ASC 2009, Theme session I
22/28
(a) 1
(b) (c) (d) 2
3
Fig. 2. 4
5
ICES ASC 2009, Theme session I
23/28
1
2
0
5
10
15
20
25
30
FAD 484 FAD 958
Num
ber o
f spe
cies
Aquapix 360Scuba diverPole camera
3
4
5
Fig. 3. 6
ICES ASC 2009, Theme session I
24/28
(a) 1
(b) 2
(c) 3
4
Fig. 4. 5
6
ICES ASC 2009, Theme session I
25/28
Fig. 5.
ICES ASC 2009, Theme session I
26
Fig. Annex 1
ICES ASC 2009, Theme session I
27
(A)
ICES ASC 2009, Theme session I
28
(B)
Fig. Annex 2