Embed Size (px)
Citation preview
ICES WGRS – AUGUST REPORT 2011 SCICOM STEERING GROUP ON ECOSYSTEM SURVEYS SCIENCE AND TECHNOLOGY
ICES CM 2011/SSGESST:21
REF. SCICOM, ACOM, NWWG
Report of the Working Group on Redfish Surveys (WGRS)
2–4 August 2011
Murmansk, Russia
International Council for the Exploration of the Sea Conseil International pour l’Exploration de la Mer
H. C. Andersens Boulevard 44–46 DK-1553 Copenhagen V Denmark Telephone (+45) 33 38 67 00 Telefax (+45) 33 93 42 15 www.ices.dk [email protected]
Recommended format for purposes of citation:
ICES. 2011. Report of the Working Group on Redfish Surveys (WGRS), 2–4 August 2011, Murmansk, Russia. ICES CM 2011/SSGESST:21. 62 pp.
For permission to reproduce material from this publication, please apply to the Gen-eral Secretary.
The document is a report of an Expert Group under the auspices of the International Council for the Exploration of the Sea and does not necessarily represent the views of the Council.
© 2011 International Council for the Exploration of the Sea
ICES WGRS - AUGUST REPORT 2011 | i
Contents
Executive Summary ............................................................................................................... 1
1 Introduction .................................................................................................................... 2
1.1 Terms of Reference ............................................................................................... 2
1.2 Participants ............................................................................................................ 2
2 Report on the international trawl-acoustic survey on pelagic redfish in the Irminger Sea and adjacent waters in June/July 2011 ........................................ 3
2.1 Historical development of the survey ................................................................ 3
2.2 Material and methods .......................................................................................... 6
2.2.1 Vessels, timing and survey area............................................................. 6 2.2.2 Acoustic assessment ................................................................................ 6 2.2.3 Abundance estimation by the trawl method........................................ 8 2.2.4 Biological sampling ............................................................................... 10 2.2.5 Hydrographic measurements .............................................................. 10
2.3 Results .................................................................................................................. 11
2.3.1 Abundance estimation by the trawl method...................................... 11 2.3.2 Biological data ........................................................................................ 12 2.3.3 Hydrography .......................................................................................... 13
2.4 Discussion ............................................................................................................ 14
2.4.1 Acoustic assessment .............................................................................. 14 2.4.2 Abundance estimation by the trawl method...................................... 14 2.4.3 Biology ..................................................................................................... 15 2.4.4 Hydrography .......................................................................................... 16
3 Future of the survey and participation .................................................................... 18
4 Acknowledgements ..................................................................................................... 19
5 References ..................................................................................................................... 20
6 Tables ............................................................................................................................. 23
7 Figures ........................................................................................................................... 38
Annex 1: List of participants............................................................................................... 51
Annex 2: Agenda of the meeting ....................................................................................... 53
Annex 3: Regression models used in biomass calculations.......................................... 56
Annex 4: WGRS Terms of Reference for the 2013 meeting (not finished) ................ 57
Annex 5: Recommendations ............................................................................................... 59
Annex 6: Working Document: Long term climate dynamics in the Irminger ........... 60

ICES WGRS - AUGUST REPORT 2011 | 1
Executive Summary
A trawl-acoustic survey on pelagic redfish (Sebastes mentella) in the Irminger Sea and adjacent waters was carried out by Iceland, Russia and Germany in June/July 2011. About 343 000 NM2 were covered. As relative survey indices, a total biomass of 123 000 t was estimated at depths shallower than the “deep scattering layer” (DSL) by hydroacoustic measurements, about 309 000 t within the DSL shallower than 500 m by a trawl method, and 475 000 t deeper than 500 m by the trawl method. In the shal-lower layer (both acoustic and trawl method), the highest concentrations of redfish were found southeast and south of Cape Farewell. In the layer deeper than 500 m, highest concentrations were found in the northeastern survey area. The estimated biomass and abundance of redfish within the DSL shallower than 500 m and deeper than 500 m derived from the trawl data, however, is considered highly uncertain because of the large error involved in the estimation.
Although the estimates divided by depth layers are not strictly comparable between years as a result of changes in the depth range covered in the deeper layer over the time-series, the total estimates of the whole water column combined can be compared between years. The total relative biomass value of 907 000 t derived in 2011, encom-passing the shallower and the deeper layer is about 70 000 t higher than recorded in 2009. The distribution of redfish was mostly covered except in small parts of the southwest and southeast survey area which may result in an underestimation of the redfish abundance.
The Working Group on Redfish Surveys (WGRS) recommends that the survey should be continued, that it should be carried out every second year, that as many vessels as possible should participate to improve the quality of the derived estimates, and that the timing of the survey should be kept in June/July. The Group recommends that further nations should participate in the next surveys and that chartering of addi-tional vessels and cost share should be considered as alternative to direct participa-tion.
2 | ICES WGRS - AUGUST REPORT 2011
1 Introduction
1.1 Terms of Reference
According to 2010/2/SSGESST03 “The Planning Group on Redfish Stocks (PGRS) has been renamed the Working Group on Redfish Surveys (WGRS), Co-Chaired by Kristjan Kristinsson, Iceland and Benjamin Planque, Norway, and met at ICES Head-quarters, Copenhagen, from 1–3 February 2011 and in Murmansk, Russia, from 2–4 August 2011 to:
a ) At the February meeting, plan:
i ) a joint international trawl/acoustic survey on the redfish stock in the Norwegian Sea and adjacent waters in August 2011.
ii ) a joint international trawl/acoustic survey on the redfish stocks in the Irminger Sea and adjacent waters in June/July 2011.
b ) At the August meeting, report on the outcome of the 2011 Irminger Sea survey;
c ) Prepare methods for delivery of the following information to assessment working groups in 2012: i ) Proportion of fish larger than the mean size of first sexual maturation ii ) Mean maximum length of fish found in research vessel surveys iii ) 95th % percentile of the fish length distribution observed
The information should be provided for all major fish stocks covered by the survey.
WGRS will report by 15 March 2011 (January meeting) and 15 August 2011 (August meeting) for the attention of the SCICOM and ACOM.”
Regarding ToR c) there are still uncertainties about this request. These uncertainties are stated in the WGRS February report (ICES 2011a). Therefore, the Group decided not to address this issue during this meeting.
1.2 Participants
Alexey Astakhov Russia Yuri Bakay Russia Matthias Bernreuther Germany Eckhard Bethke Germany Valery Ignashkin Russia Alexey Karsakov Russia Kristján Kristinsson (Chair) Iceland Viktor Popov Russia Alexey Rolskiy Russia
Detailed contact information of the participants is given in Annex 1.
The attendance and expertise in the Group was adequate for addressing the Terms of Reference, as all cruise leaders and specialists on biology and hydroacoustics were present.
ICES WGRS - AUGUST REPORT 2011 | 3
2 Report on the international trawl-acoustic survey on pelagic redfish in the Irminger Sea and adjacent waters in June/July 2011
2.1 Historical development of the survey
Several acoustic surveys have been conducted on pelagic redfish in the Irminger Sea and adjacent waters. During the period of commercial fishery in the area, which commenced in 1982, the former Soviet Union, and later Russia, carried out acoustic surveys annually until 1993. These surveys provided valuable information on the distribution and relative abundance of oceanic redfish and on the biology of the spe-cies as well as on the oceanographic conditions of the area surveyed (e.g. Shibanov et al., 1996b). The acoustic measurements were, however, not considered sufficient for stock assessment purposes (ICES, 1991).
In 1991, Iceland (6–26 June in the field) conducted a national survey on pelagic red-fish with a very limited area coverage of 60 000 NM2 (Magnússon et al., 1992a).
In 1992, Iceland and Russia conducted a joint acoustic survey on oceanic redfish in the Irminger Sea from 26 May–11 July in the field. The results of the survey were presented in Magnússon et al. (1992b). It became obvious from the surveys in 1992 that for an acoustic assessment, two vessels were hardly sufficient to cover the whole area of distribution within a reasonable period (ICES, 1993).
In 1993, Russia conducted a survey in the Irminger Sea in field from 7 June-8 July (Shibanov et al., 1994). Iceland carried out a short survey in September in the same year (ICES, 1994a) with no reliable stock size estimate, because the area coverage was limited.
In 1994, Iceland and Norway carried out a survey with two vessels, covering the main distribution area down to 500 m depth (Magnússon et al., 1994). The vessels were in the field from 24 June-17 July. Approximately 190 000 NM2 were covered, resulting in a stock size estimate of about 2.2 million t or 3.5 billion individuals. Most of the fish was measured in the area east of Cape Farewell. In the report from the survey, the view of the ICES Study Group on Redfish Stocks (ICES, 1994b) that the entire area of distribution could not be covered sufficiently by only two vessels (ICES, 1993), was supported.
In 1995 (25 June-30 July in the field), Russia carried out a single vessel survey for red-fish, covering the main distribution area down to 500 m depth. The stock was esti-mated to be 2.5 million t and 4.1 billion individuals (Shibanov et al., 1996a). As the survey was only covered by one vessel, the NWWG meeting in 1996 (ICES, 1996), considered the results to be unreliable.
In 1996 (19 June – 22 July in the field), Iceland, Germany and Russia carried out the survey in June/July. Approximately 250 000 NM2 were covered. The acoustic assess-ment yielded a stock size of about 1.6 million t or 2.6 billion individuals at depths down to 500 m (Magnússon et al., 1996). This estimate was considered to be an un-derestimation of the stock, due to mixture of the redfish towards depths below 500 m. The oceanic redfish concentrations were densest between 200 and 300 m depth, mainly within a temperature range of 3.5°C to 5°C. Temperatures recorded during the survey were somewhat higher than observed during previous acoustic surveys.
In 1997 (21 June–21 July in the field), Russia carried out a single vessel survey in June/July, resulting in a stock estimate of 1.2 million t down to 500 m depth (Mel-nikov et al., 1998).
4 | ICES WGRS - AUGUST REPORT 2011
In 1999 (18 June-10 July in the field), an international acoustic survey on pelagic red-fish was carried out in the Irminger Sea and adjacent waters, with participation of Iceland, Germany and Russia. The acoustically estimated biomass of the oceanic S. mentella in the upper 500 m of the water column was 0.6 million t (Sigurðsson et al., 1999). The observed decrease in survey abundance compared with the years 1994–1996 was very drastic and exceeded the removed biomass by the fishing fleets. The area covered was the most extensive in the time-series until then, but covered only a portion of the horizontal distribution of the oceanic stock. Therefore, the biomass estimate was considered as an underestimate. The stock above 500 m was observed more southwesterly and deeper than it had been during former acoustic surveys, and a gradual increase in temperature in the observation area was observed. This was considered to have influenced the distribution pattern of the redfish, as the highest concentrations were found in the colder waters, i.e. southwestern part of the survey area.
During all the surveys until 1999, oceanic redfish was only measured by acoustics down to approximately 500 m depth. Attempts have been made to measure below that depth (see Section 2.2.3), but basically without success in obtaining any reliable stock size estimate. The reason is mainly due to the “deep scattering layer” (DSL), which is a mixture of many vertebrate and invertebrate species (Magnússon, 1996) mixed with redfish. Although several attempts have been made by Russia and Ice-land to map the distribution of pelagic redfish at depths below 500 m (Shibanov et al., 1996a; ICES, 1998; Sigurðsson and Reynisson, 1998), the 1999 survey provided for the first time an estimate on the abundance of the pelagic S. mentella >500 m depth in the order of 0.5 million t. Hydrographic observations indicated that the highest concen-trations of redfish below 500 were associated with eddies and fronts.
In 2001 (19 June-14 July in the field), a trawl-acoustic survey was carried out by Ger-many, Iceland, Russia and Norway. Approximately 420 000 NM2 were covered. The stock size measured with acoustic instruments was assessed to be about 715 000 t at depths down to the DSL (or about 350 m), with redfish having a mean length of 34.6 cm. Highest concentrations of redfish were found in the SW part of the covered sur-vey area. In addition to the acoustic measurements, an attempt was made to estimate the redfish within and below the deep scattering layer with so-called “trawl method” (see Section 2.2.3). This was done by correlating catches and acoustic values at depths between 100 and 450 m. The obtained correlation was used to transfer the trawl data at greater depths to acoustic values then to abundance. A total biomass of approxi-mately 1.1 million t was estimated to be at depths between 0 and 500 m and 1.1 mil-lion t shallower than 500 m depth by the use of the “trawl method”. Deeper than 500 m, the densest concentrations were found in the NE part of the area. The average length of the fish caught deeper than 500 m was 38.3 cm. It was further suggested that the estimated abundance derived from the trawl data should be treated with great caution (ICES, 2002).
The basic area coverage during the recent surveys was determined to be extended from what has previously been used and was defined in ICES (1995). As the results from the surveys in 1999 and 2001 indicated that the covered area did not reach the boundary of the distribution area of pelagic redfish in the acoustic layer, the PGRS in 2003 (ICES, 2003a) felt it was necessary to expand the area both to the south and west. As the fishery had also changed towards greater depths in later years, it was also considered important to continue expansion of the vertical coverage to assess the stock that is below the acoustic layer (below 500 m depth). The results of that survey were presented in ICES (2003b). Germany, Iceland and Russia participated in the
ICES WGRS - AUGUST REPORT 2011 | 5
international survey in May/June 2003 (28 May-30 June in the field). Approximately 405 000 NM2 were covered. A total biomass of less than 100 000 t was estimated at depths between 0 and 500 m and about 700 000 t deeper than 500 m by the use of a standardized “trawl method”. The redfish biomass of 100 000 t estimated acoustically down to the deep-scattering layer or about 350 m, with redfish having a mean length of 35.3 cm, was the lowest ever obtained since the beginning of the joint measure-ments. The highest concentrations of redfish were found around 60°N, east of Cape Farewell. Deeper than 500 m, the densest concentrations were found in the NE part of the area. The estimated abundance derived from the trawl data were considered highly uncertain. The results of the 2003 survey were regarded as inconsistent and thus did hardly indicate the actual stock status of pelagic redfish. To which extent seasonal effects contributed to this inconsistency, is unknown (see ICES, 2003b).
The international trawl-acoustic survey on pelagic redfish in June/July 2005 (18 June-18 July in the field) was carried out by Germany, Iceland and Russia (ICES, 2005b). Nearly 400 000 NM2 were covered. A total biomass of 551 000 t was estimated at depths shallower than the “deep scattering layer” (DSL) by hydroacoustic measure-ments, and about 674 000 t within and deeper than the DSL by the “trawl method”. In both depth layers, the highest concentrations of redfish were found in the western and southwestern part of the survey area. Although the estimates divided by depth layers were not comparable between years due to changes in the depth range covered in the deeper layer in the 2005 survey, the total estimates of the shallower and deeper layer combined can be compared between years. The total biomass estimate of 1.2 million t, encompassing the shallower and the deeper layer, represented a value within the range of the 1999 and 2001 estimates. Along with the trawl and acoustic measurements since 1992, hydrographic data had been obtained. The results indi-cated a relationship between the hydrography and distribution of redfish in the sur-vey area.
The international trawl-acoustic survey in June/July 2007 (23 June – 24 July in the field) was carried out by Iceland and Russia (ICES, 2007b). The usual participation of Germany had to be cancelled due to short-term technical problems of their vessel. The German participant, however, compensated the Russian participant by funding additional days in the field, in order to ensure the complete survey area coverage. Nearly 350 000 NM2 were covered, with only slightly increased distances between hydroacoustic tracks and trawl hauls, compared to previous surveys. As relative survey indices, a total biomass of 372 000 t was estimated at depths shallower than the “deep scattering layer” (DSL) by hydroacoustic measurements, and about 854 000 t within and deeper than the DSL by an experimental “trawl method”. In the shal-lower layer, the highest concentrations of redfish were found southeast of Cape Farewell and in the southwestern survey area. In the deeper layer, high concentra-tions were also found southeast of Greenland, but as well in the northeastern survey area. Although the estimates divided by depth layers are not strictly comparable be-tween years due to changes in the depth range covered in the deeper layer in the 2005 and 2007 surveys, the total estimates of the shallower and deeper layer combined can be compared between years. The total relative biomass value of 1.2 million t derived in 2005 and 2007, encompassing the shallower and the deeper layer, represents a value within the range of the 1999 and 2001 estimates.
The international trawl-acoustic survey in June/July 2009 (11 June – 19 July in the field) was carried out by Iceland and Germany (ICES, 2009c). The usual participation of Russia was cancelled because of a number of reasons not specified. About 360 000 NM2 were covered, with increased distances between hydroacoustic tracks and trawl
6 | ICES WGRS - AUGUST REPORT 2011
hauls, compared to previous surveys. As relative survey indices, a total biomass of 108 000 t was estimated at depths shallower than the “deep scattering layer” (DSL) by hydroacoustic measurements, the lowest in the time-series (excluding the 2003 esti-mate). About 278 000 t were estimated within the DSL shallower than 500 m by a trawl method and 458 000 t deeper than 500 m by the trawl method. In the shallower layer (both acoustic and trawl method), the highest concentrations of redfish were found southeast of Cape Farewell. In the layer deeper than 500 m, highest concentra-tions were found in the northeastern survey area and southeast of Cape Farewell. The estimated biomass and abundance of redfish within the DSL shallower than 500 m and deeper than 500 m derived from the trawl data, however, is considered highly uncertain because of the large error involved in the estimation. The total relative biomass value of 845 000 t derived in 2009 (to make the 2005 and 2007 estimates com-parable with other years), encompassing the shallower and the deeper layer, was the lowest value recorded excluding the 2003 estimate.
2.2 Material and methods
The methodology and planning of the survey was discussed and agreed during the WGRS planning meeting in Copenhagen, Denmark, from 1–3 February 2011 (ICES, 2011).
2.2.1 Vessels, timing and survey area
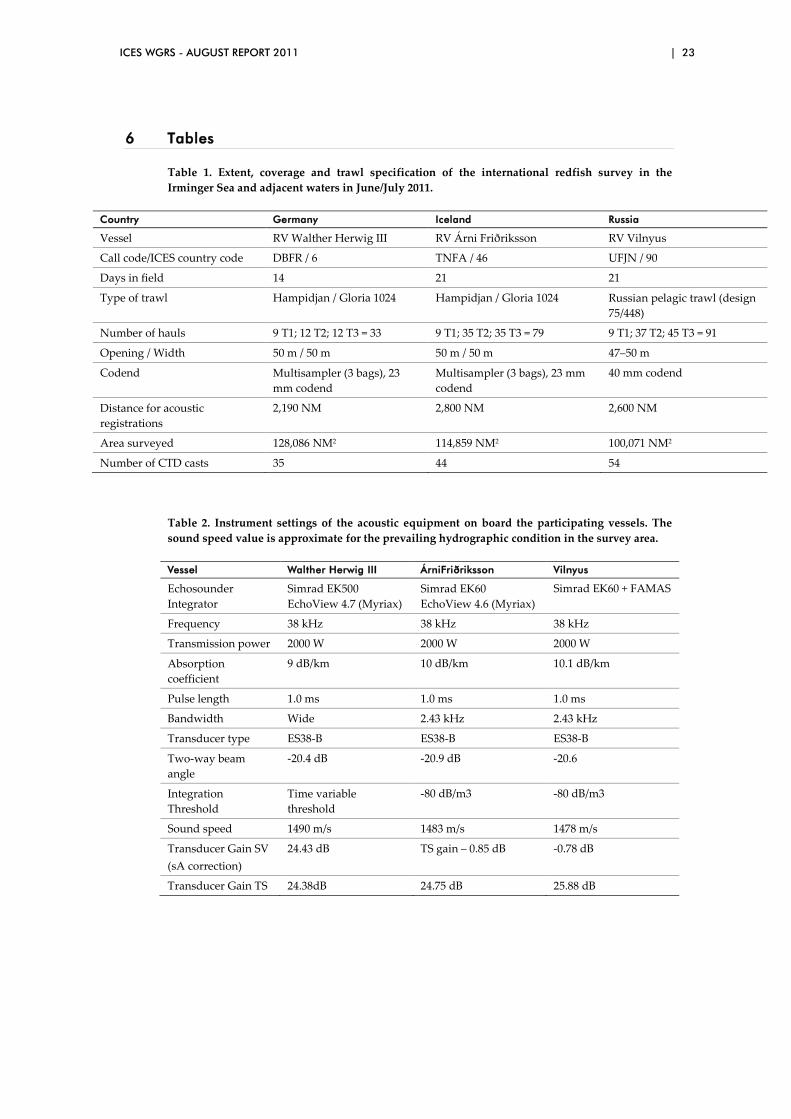
Table 1 describes the extent, coverage and the trawl specification of the survey. The Icelandic part of the survey was carried out by the Marine Research Institute (MRI), Reykjavík, with the RV “Árni Friðriksson” from 23 June to 16 July with 21 days in field. The German part was carried out by the Johann Heinrich von Thünen Institute (vTI), Institute of Sea Fisheries, Hamburg, with the RV “Walther Herwig III” during the period 22 June to 18 July, with 13 days in the field. The Russian part was carried out by PINRO, the Knipovich Polar Research Institute of Marine Fisheries and Oceanography in Murmansk, with the RV “Vilnyus“ from 6 June to 16 July, with 21 days in the field.
The vessels covered an area of approximately 343 000 NM2 within the boundaries of about 52°N to 65°N and 26°W to 52°W, on transects 30–60 NM apart (Figure 1). Some of the planned transects (ICES 2011a) were altered and rescheduled prior to and dur-ing the survey, mainly due to bad weather and reduced survey time of Iceland and Germany which was related to later departure than planned because the vessels were delayed in the dockyard.
2.2.2 Acoustic assessment
A 38 kHz Simrad EK60 split-beam echosounder was used for the acoustic data collec-tion on RV “Árni Friðriksson” and RV “Vilnyus” whereas on RV “Walther Herwig III“ an EK500 was used, also equipped with a 38 kHz split-beam transducer. Prior to the survey, the acoustic equipment on all vessels was calibrated with the standard sphere method (Foote et al., 1987). The settings of the acoustic equipment used during the survey are given in Table 2. During the survey on board of the Icelandic and German vessels the post-processing system (EchoView V4.9, Myriax) was used for scrutinising the echograms, whereas FAMAS (a post-processing program developed by TINRO) was used in the Russian vessel. Mean integration values of redfish per 5 NM were used for the calculations.
Earlier investigations (Magnússon et al., 1994; Magnússon et al., 1996; Reynisson and Sigurðsson, 1996) have shown that the acoustic values obtained from oceanic redfish
ICES WGRS - AUGUST REPORT 2011 | 7
exhibit a clear diurnal variation, due to a different degree of mixing with smaller scatter as well as changes in target strength. In order to compensate for these effects to some degree, it was decided to discard the acoustic data obtained during periods of the most pronounced mixing, i.e. during the darkest hours of the night, and to estimate the values within the missing sections by interpolation.
In further data processing, the number of fish was calculated for statistical rectangles, the size of which was 1 degree in latitude and 2 degrees in longitude. As the observed length range of redfish in the past acoustic surveys had increased from previous years, a length-based target strength formula of TS = 20 × lg(L) -71.3 dB was used again instead of a constant TS of –40 dB (Reynisson, 1992), as used prior to the 2001 survey for all length groups. This TS-equation gives the same results as –40 dB does for 37 cm redfish and is also equal to –38.3 dB /kg as has previously been used by Russia. The total number of fish within subareas A-F (Figure 2) was then obtained by summation of the individual rectangles. The acoustic results were further divided into the number of individuals and biomass based on the biological samples repre-sentative for each subarea.
For the entire survey area, single-fish echoes from redfish were expected to be detect-able down to 350 m. In order to include all echoes of interest, a low integration threshold was chosen. As shown in Table 2, the integration threshold was set at -80 dB//m3 for echo integration. Based on the depth distribution of redfish observed dur-ing the survey and the expected target strength distribution, the method outlined by Reynisson (1996) was used to estimate the expected bias due to thresholding. The results of the biomass calculations were adjusted accordingly.
2.2.2.1 Noise measurements
The measurements of echosounders can be disturbed by noise and reverberation. Reverberation consists of echoes reflected from unwanted targets and cannot be avoided. For noise, we distinguish between ambient noise (rain, wind-induced noise, thermal noise) and vessel noise (propeller noise, turbulent flow noise). Ambient noise can also not be avoided, whereas vessel noise can be minimized by constructive measures. The German RV “Walther Herwig III” can only supply noise-free values down to approximately 450 m. In the latter case, the reason is the relatively unfa-vourable location of the transducers. The results of the measurements show that the Icelandic RV “Árni Friðriksson”, optimized for acoustic measurements, can accom-plish practically noise-free measurements down to 950 m and the Russian RV “Vil-nyus” down to 1,100 m under good weather condition.
Whereas noise is always present and influences the echo integration results, echoes of redfish are much more seldom. Therefore already very small noise can prevent the measurements. For the improvement of the signal to noise ratio, a threshold is usu-ally applied. The amplitude of the signal decreases with depth whereas the ampli-tude of noise increases due to time varied gain. Accurate results can only be obtained by applying a threshold adapted to the analysed depth range. Even if redfish are still visible on the echogram, an accurate measurement may be not possible. The applied threshold preventing the influence of noise is optimized for a depth of 250 m (Bethke, 2004).
2.2.2.2 Echo counting
During the survey, situations can be found in which the redfish appears mixed with other deep-sea species like myctophids etc. Even if scrutinizing is performed accu-rately by setting the limits for echo integration, the integration of reverberation can-
8 | ICES WGRS - AUGUST REPORT 2011
not always be avoided. This leads to an overestimation of the redfish density. In those situations, echo counting is clearly the more exact measuring procedure. The proce-dure is described in Bethke (2004). Almost identical values are measured if redfish appears in an undisturbed environment as a single fish. The counting procedure is based on the fact that fish are recognized as single targets according to the parameter settings of the echosounder. If this, as within redfish shoals, is not the case, these data are rejected from counting. This, however, leads to an underestimation of the redfish stock. In situations in which the redfish have to be measured in denser concentra-tions, the echo integration has to be preferred. A switch between both methods may be necessary according to the situation found in the field.
Within bad weather conditions cavitation due to strong movements of the vessel can disturb the measurements (Figure 8). If disturbances appear the disturbed single pings have to be removed manually from the echogram to avoid the integration of large noise signals in bad weather. This, however, is a time consuming work and not always possible with a reasonable effort. In this case echo counting is also the prefer-able method because this kind of noise doesn’t influence the results of counting sig-nificantly. Therefore, the application of echo counting helps to save time especially within bad weather conditions. This method can be performed by the usage of the EchoView post-processing software developed by Myriax (www.echoview.com). Since the German area redfish was not observed in schools the echo counting was applied on the German vessel without any disadvantages. The counting results were converted into sA values for further processing (Bethke, 2004).
The echosounder EK500 used for scientific work since the middle of the 1980s was replaced by the new Simrad sounder EK60 on the Icelandic vessel. The new sounder can be handled in a more convenient way and is equipped with an improved calibra-tion program, allowing the calibration also under rough weather conditions. The EK500 and EK60 can detect individual targets based on the amplitude and width of the echo. It is no surprise that technological progress leads to advantages in functio-nality of equipment. However, this is not the case for the echosounder EK60 with regard to the single target detection capability needed for echo counting. In one expe-riment involving 1000 ensonifications of the same target near or on the transducer axis by each echosounder, the number of single-target detections was 932 with the EK500 and 220 with the EK60 (Mark I; Jech et al., 2005). This is not sufficient for echo counting and it is probably not possible to obtain sufficient reliable results for as-sessment work with the EK60/BI60 system. Due to the replacement of the older EK500 on the Icelandic and Russian vessel the counting method was no longer appli-cable on those vessels.
2.2.3 Abundance estimation by the trawl method
The classic method of continuous echo integration deeper than 350 m (within and deeper than DSL) is applicable only under very specific conditions. Because of the increased influence of the vessel’s noise, as well as the mixing of redfish with various components of the DSL (Magnússon, 1996), this is almost impossible. An additional difficulty is due to the decrease of the effective angle of the transducer beam, espe-cially for single fish registration at great depths. This in particular demands for a lower SV-threshold, down to (-85) – (-90) dB for correct echo integration. For hull-mounted transducers, this may cause problems with noise. Therefore, acoustic esti-mation of redfish with a hull mounted transducer in depths exceeding 350 m is very difficult (Dalen et al., 2003).
ICES WGRS - AUGUST REPORT 2011 | 9
As in the surveys in 1999–2009, a "trawl method" was used to calculate abundance of redfish. The method is based on a combination of standardized survey catches and the acoustic data, where the correlation between catch and acoustic values during trawling in the shallower layer is used to obtain acoustic values for the deeper layer, based on catches in the deeper layer. To be able to make the calculations, it was de-cided to carry out hauls at different depth intervals, evenly distributed over the sur-vey area.
Based on the conclusion of WKREDS (ICES, 2009a) and the recommendation of ICES on stock structure of redfish in the Irminger Sea and adjacent waters (the conclusion and the recommendation is not agreed by Russia), the Group decided in the planning meeting (ICES, 2009b) to sample redfish separately above and below 500 m, i.e. to sample redfish as was done in the 1999, 2001 and 2003 surveys. In the 2005 and the 2007 surveys (ICES, 2007a) the trawling was from 350 down to 950 m, i.e. within and deeper than the DSL. The group decided to continue sampling redfish separately above and below 500 m in 2011 (ICES, 2011) as well.
The sampling was carried out as follows (ICES, 2011):
1 ) The depth zones shallower than the DSL, in which redfish could be acous-tically identified. Trawling distance was 4 NM.
2 ) The depth zone shallower than 500 m, in which acoustic redfish registra-tion is hampered by the deep scattering layer. The identification hauls cov-ered the following layer (headrope of the net): from the top of the DSL down to 450m. Trawling distance at each depth layer was 2 nautical miles calculated with GPS.
3 ) The depth zones deeper than 500 m depth. The deep identification hauls covered the following 3 depth layers (headline): 550 m, 700 m, and 850 m. Trawling distance at each depth layer was 2 nautical miles calculated with GPS.
The net used on RV “Árni Friðriksson” and RV “Walther Herwig III” was a Gloria type #1024, with a vertical opening of 45–50 m (Table 1). The net used on RV “Vil-nyus” was a Russian pelagic trawl (design 75/448) with a circumference of 448 m and a vertical opening of 47–50 m. Russia was using a mesh opening of 40 mm in the codend, whereas Iceland and Germany were using a mesh opening of 23 mm in the codends. The trawls used on RV “Árni Friðriksson” and RV “Walther Herwig III” were fitted with multiple codend sampling device: the ‘multisampler’ (Engås et al., 1997). This allowed for successive sampling at three distinct depth zones within one trawl haul and without ‘contamination’ from one depth to the next and no sampling during shooting or heaving of the trawl. During the survey, the vessels employed a total of 27 type 1 trawl hauls on redfish above the DSL which were acoustically iden-tified, 84 type 2 trawl hauls in the depth range from the top of the DSL down to 450 m and 92 type 3 trawls hauls in the depth range from 550–900 m, which were rela-tively evenly distributed over the survey area (Figure 1). The catches were standard-ized by 1 NM and converted into acoustic values using a linear regression model between catches and acoustic values at depths shallower than the DSL.
A linear regression model between the acoustic values and catches (in kg/NM) of type 1 trawls (shallower than the DSL) was applied to predict the acoustic values for each type 2 and 3 trawl. Because few type 1 trawls were taken in 2011 (9 for RV “Walther Herwig III”, 9 for RV “Árni Friðriksson, and 9 for RV “Vilnyus”), the type 1 trawls from the surveys in 2001, 2003, 2005, 2007, and 2009 were also used in the re-gression analysis. This made the total type 1 trawls for Iceland 38 (from the 2005,
10 | ICES WGRS - AUGUST REPORT 2011
2007, 2009 and 2011 surveys), 34 trawls for Germany (from the 2001, 2005, 2009 and 2011 surveys), and 21 for Russia (from the 2007 and 2009 surveys). The results of the geometric mean linear regressions between the acoustic values and the catches re-corded shallower than the DSL for each vessel are given in Figure 7 and the models output in Annex 2.
Estimation of redfish distribution by the trawl method for type 2 and 3 trawls was done by conversion of catches (catch in kg per NM) to equivalent acoustic estimates by predicting the sA values using the obtained correlation for each vessel. Further, the obtained sA values were then adjusted for the vertical coverage of the trawls and the depth range of each haul (ΔD/Htr; where ΔD is the difference between maximum and minimum depth of each haul, and Htr is the vertical opening during each tow). The sA value for each trawl (sA tr) is:
sA tr = C * K * KH
where C is the catch in kg per NM of each type 2 and 3 trawl, K is the coefficient of the trawl obtained from the linear regression of type 1 trawls for each vessel (see above and the results in Annex 2), and KH is the width of the depth range towed de-fined as:
KH = (HMAX – HMIN + dHTR) / dHTR
where HMAX and HMIN of the headline of the trawl during the tow and dHTR is mean vertical opening of the trawl. For both vessels dHTR was 50 m. For type 3 trawls HMIN was 550 m and HMAX was 850 m. For type 2 trawls HMAX was 400 or 450 m but HMIN varied and was dependent on the minimum depth of the DSL layer.
Based on the regressions, confidence limits for the estimates were also calculated.
After having calculated the sA values from the catches of each haul, the estimation of the abundance and biomass was calculated using the same target strength equation for redfish (20Lg (L) – 71.3) and the same algorithm as used for the acoustic estima-tion. The area coverage was considered to be the same as for the acoustic results and applied to all subareas.
2.2.4 Biological sampling
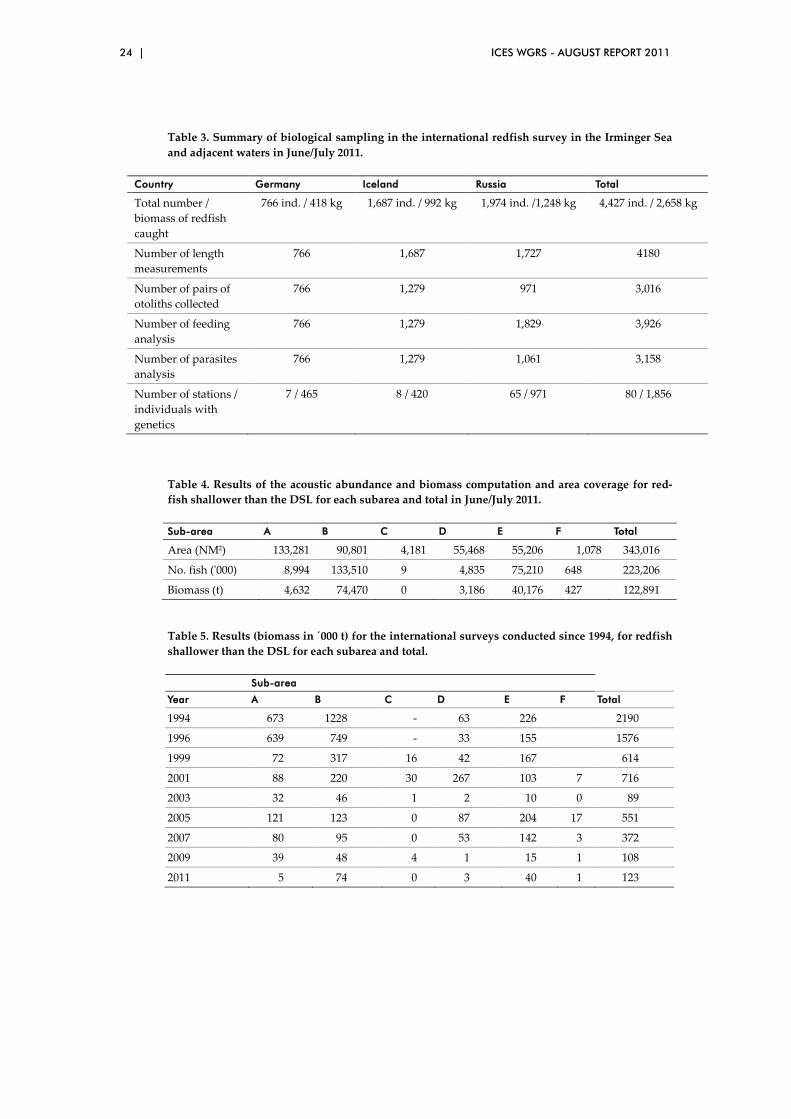
Standard biological observations needed for the acoustic assessment were carried out, as decided at the planning meeting (ICES, 2011). In addition, otoliths were col-lected, and stomach fullness as well as parasite infestation, pigment patches and muscular melanosis were recorded according to an approved method (Bakay and Karasev, 2001). A summary of biological sampling in 2011 is given in Table 3. On a number of stations (80) genetic sampling was carried out. For this purpose, fin clips or tissue samples of gill filaments were collected from as many fish as possible (ran-domly sampled) and preserved in alcohol (n = 1,856). Otoliths were collected from all the individuals and individual length, weight, sex, maturity, parasites and pigmenta-tion recorded.
2.2.5 Hydrographic measurements
Temperature and salinity measurements were made with CTD probes, usually evenly distributed along the acoustic transects and at the turning points of transects down to approximately 1000 m depth (Figure 1). The hydrographic data at depths of 0, 10, 20, 30, 50, 100, 200, 300, 400, 500, 600, 700, 800, 900 and 1000 m from each CTD station were used in the data analysis. A total of 133 CTD stations were conducted during the survey, with 44 carried out by RV “Árni Friðriksson”, 35 by RV “Walther Herwig
ICES WGRS - AUGUST REPORT 2011 | 11
III“ and 54 by RV “Vilnyus. Due to the early stage of processing of CTD data, only temperature is included in this report. The Russian long-term hydrographic so-called 3K section (10 standard stations) across Reykjanes Ridge was included in the joint survey and taken on RV “Vilnyus” down to 1000 m or the bottom. For the analysis of interannual variations of temperature, the long-term Russian database and data from the last international survey in 2009 were used.
2.3 Results
Figure 3 shows the average sA values by 5 NM sailed distance along the survey tracks, and the average values within the statistical rectangles are given in Figure 4. As shown in Figures 3 and 4, the boundary of the redfish was reached in all direc-tions except in a small area in the SE and SW parts which may lead to underestima-tion of total-stock biomass. The stock abundance estimate of pelagic redfish within the covered area of 343 000 NM2 shallower than the DSL amounts to about 0.22 bil-lion individuals or 123 000 t (Table 4). The abundance disaggregated by length groups is given in Table 14a. Compared to 2009, the biomass in the acoustic layer was estimated to be about 15 000 t higher in 2011 (Table 5). There was an increase in the biomass in subareas B and E, but a decrease in subarea A which was the lowest bio-mass estimate since the beginning of the time-series. In earlier years (Table 5), the biomass estimates in the shallower layer had decreased sharply from 1994–1999. Val-ues prior to 2005, however, covered depths down to 500 m.
The average depth of the DSL and the corresponding confidence limits are shown in Figure 9, combined for all three vessels. The depth of the layer in which redfish can be detected is, on average, around 50–150 m during the night-time but increases to its maximum between 275 and 300 m around noon. As a consequence, the redfish is hard to detect and measure below those depths.
The diurnal variation in the integrated acoustic values is shown in Figure 10, with minimum sA values during night and maximum values around afternoon.
2.3.1 Abundance estimation by the trawl method
Figure 5 shows the redfish distribution within the DSL above 500 m, based on the regression between the catches and the measured sA values in the layer shallower than the DSL (Figure 7). The circles indicate converted units of sA. The highest values (sA up to 11 m2/NM2) were observed in the southeastern area (subarea B) between latitudes 59° and 60°.
Figure 6 shows the redfish distribution at depths from 550 m to 900 m based on trawl data. The highest values (sA up to 170 m2/NM2) were observed at latitude of about 62°N in the northeastern area. The values in remaining areas reach a maximum of 12 m2/NM2.
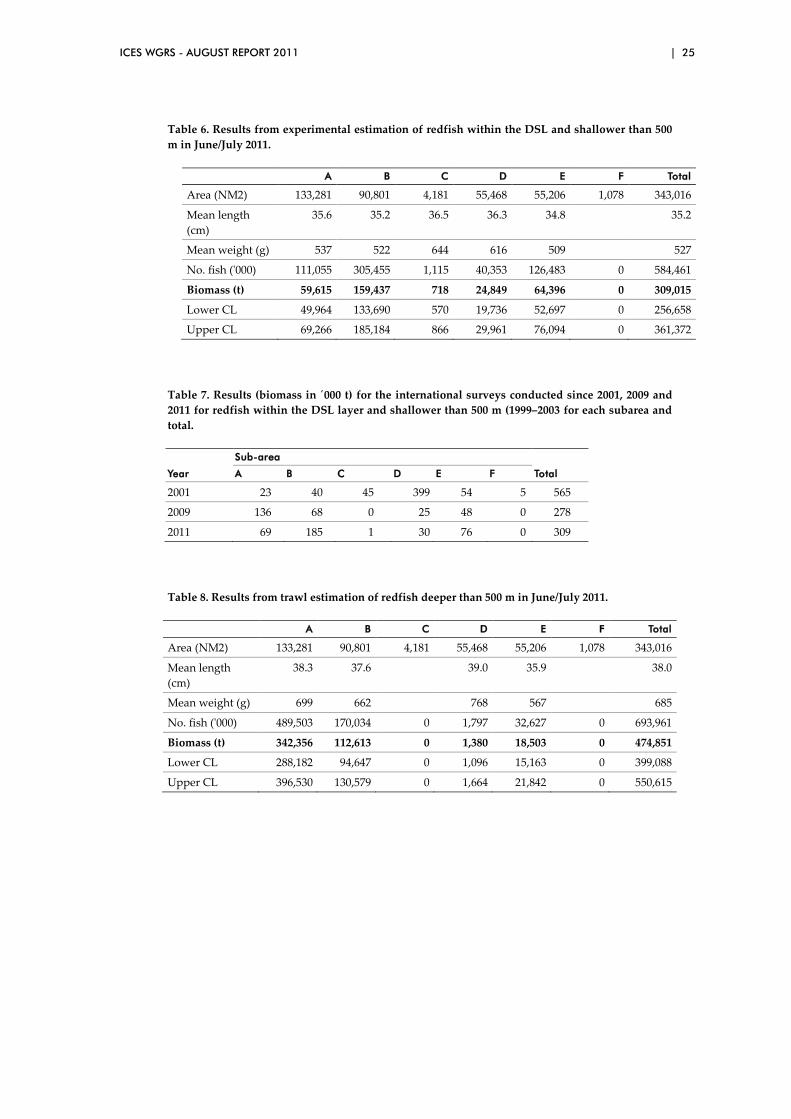
The abundance estimation by subareas is given in Tables 6 and 8 for within the DSL (shallower than 500 m) and deeper than 500 m, respectively, and disaggregated by length groups in Tables 14b and 14c.
The assessment of the redfish stock distributed shallower than 500 m and within the DSL obtained by the trawl method constituted 309 000 t (0.58 billion individuals; Table 6). Applying the 95% confidence level to the data, the biomass estimate ranges from 257 000 to 361 000 t. For comparison, the results of the surveys 2001 and 2009 are given in Table 7. The estimate is about 30 000 t higher than in 2009, but compared to the 2005 estimate there has been almost twofold decrease in biomass. In 2001, the
12 | ICES WGRS - AUGUST REPORT 2011
majority of fish was caught in subarea D whereas in 2009 and 2011 the majority was found either in subareas A and B respectively.
The assessment of the redfish stock distributed below 500 m obtained by the trawl method constituted 475 000 t (0.69 billion individuals; Table 8). Applying the 95% confidence level to the data, the biomass estimate ranges from 399 000 to 551 000 t.
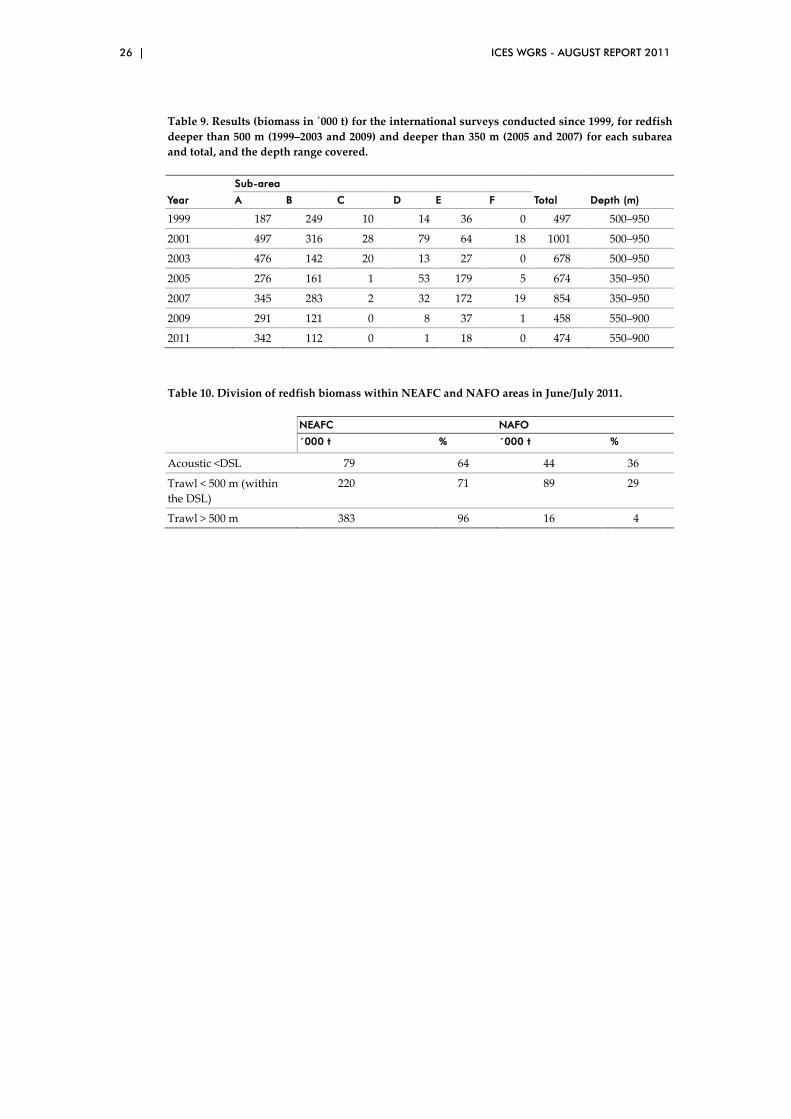
For comparison, the results of the surveys 1999–2009 are given in Table 9. As the depth coverage of the deep trawls was changed to 350–950 m in 2005 (ICES, 2005a) and again in 2009 to 500–950, the survey estimates are not strictly comparable be-tween years. The 2005 and 2007 data provide estimates within and deeper than the DSL (350–950 m), whereas the other surveys cover the depth range 500–950 m. The results show that in subareas A, the abundance estimate in 2011 increased compared to 2009, but decreased a little in subarea B. In subarea E, the estimated abundance also decreased and is now the lowest in the time-series. In other subareas, no or little redfish was found deeper then 500 m.
There has been a substantial decrease in the biomass in 2009–2011 compared to 1999–2003, when the trawling was done in similar way, especially in subareas A and B, the main fishing areas. There has however been a some increase in biomass in 2011 com-pared to 2009.
2.3.2 Biological data
2.3.2.1 Sex composition, length and weight
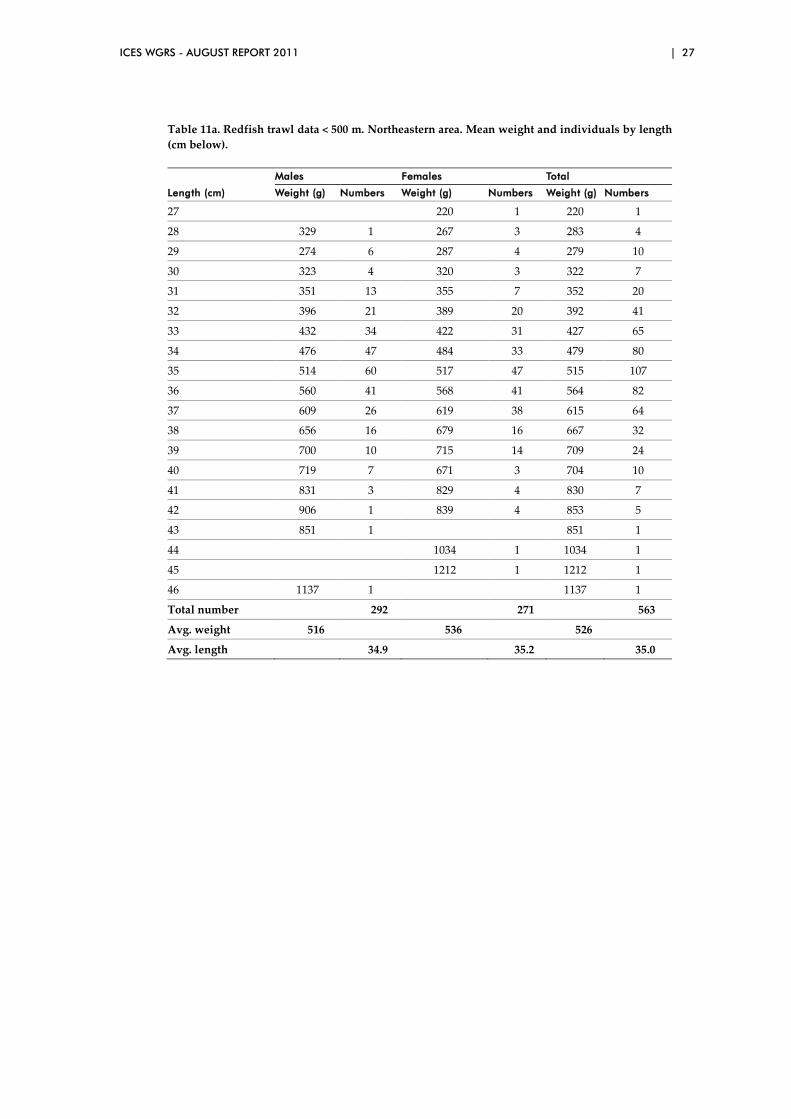
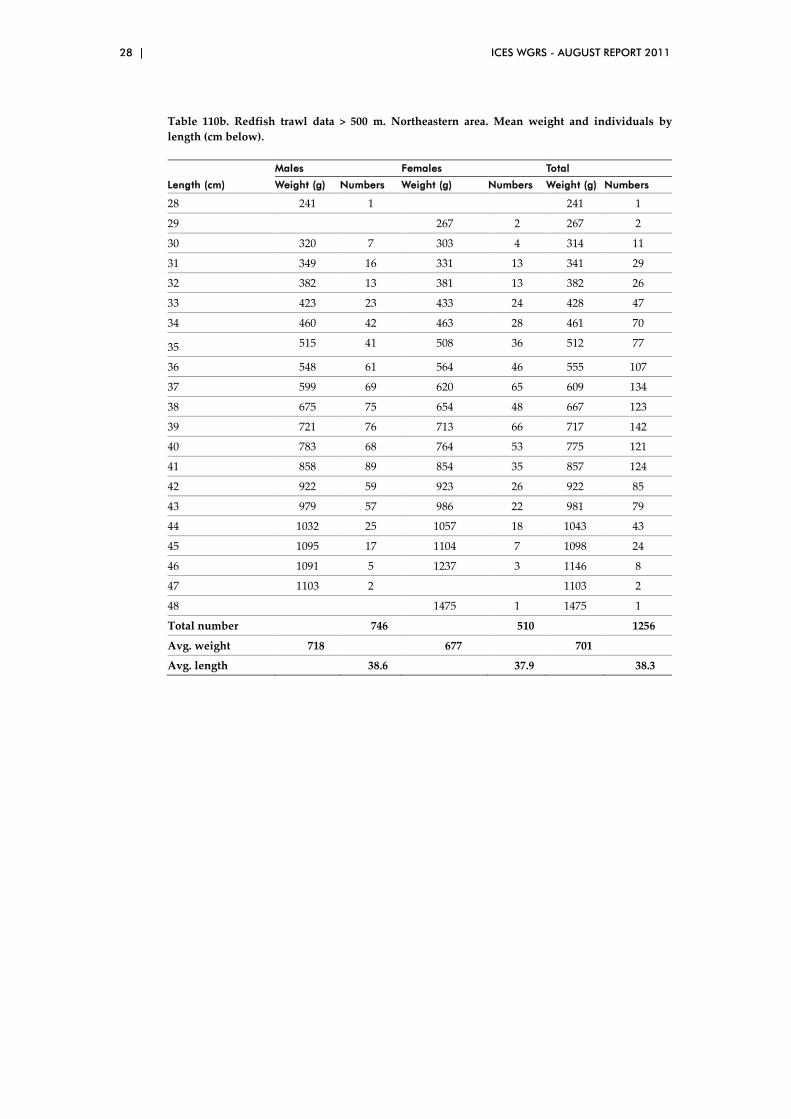
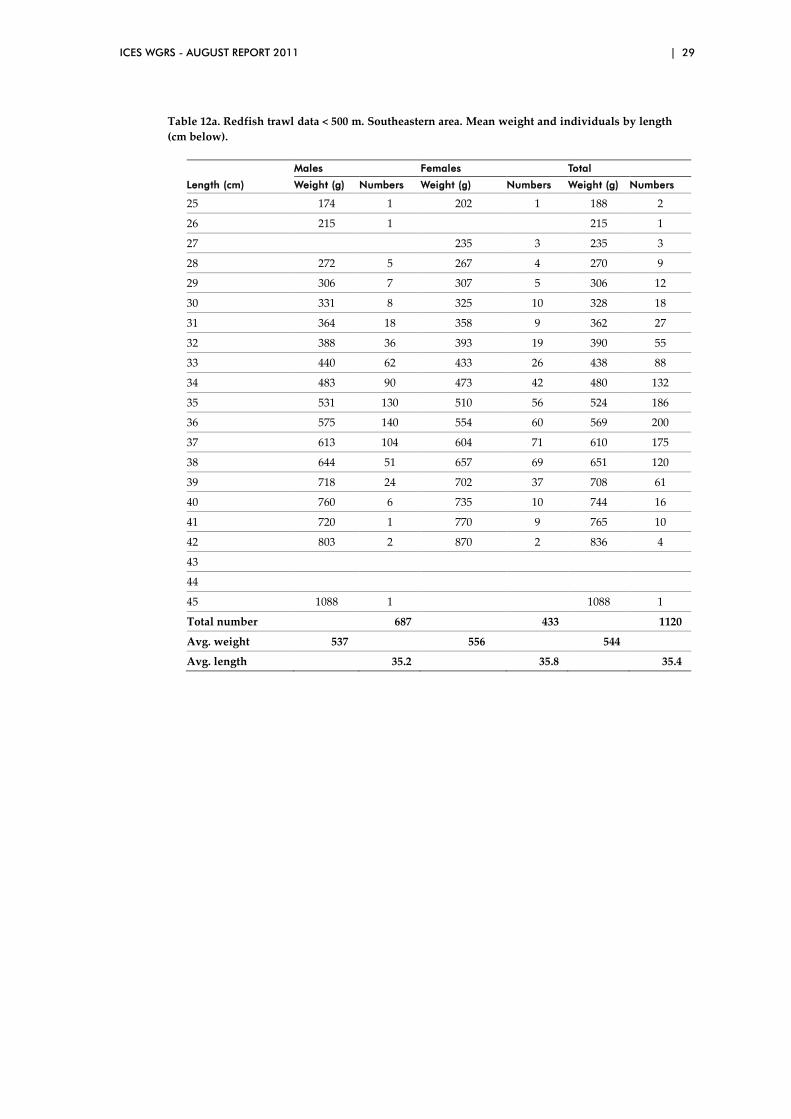
At depths shallower than 500 m, the percentage of males (61.0%) exceeded that of the females (39.0%). The proportion of females has increased by about 4.6% from 2009. In the layer deeper than 500 m, the sex ratio was very similar to that of the shallow layer (59.1% males, 40.9% females), and the proportion of females increased by about 6.7%. Fish length in the catches ranged from 25 to 48 cm. The mean length of redfish in the shallower layer was 35.1 cm, and the mean individual weight was 536 g. In the deeper layer, the mean length was 38.1 cm, and the mean weight was 690 g, which is 31 g less than 2009. In the northeastern (NE) area (Tables 11a and 11b), redfish caught in the shallower layer were on average about 3.3 cm shorter than in the deeper layer. In the southeastern (SE) area (Tables 12a and 12b), redfish from the shallower layer were 2.2 cm shorter than from the deeper layer, whereas in the southwestern (SW) area (Tables 13a and 13b), redfish from the shallower layer were 1.3 cm smaller than redfish from the deeper layer. The length frequencies from the trawl stations are illus-trated in Figure 11, and length-disaggregated abundance data are given Tables 14a-c. In depths shallower than 500 m (Figure 11, upper panel), the peak of the length fre-quency distribution is around 35 cm, about 1 cm less than in the 2009 survey but similar to the 2007 survey. In the southeastern area, fish were slightly larger (peak at 36) than in the NE and SW areas. In the layer deeper than 500 m, the length distribu-tion shows a broad maximum around 37–41 cm (Figure 11, lower panel), with a lower fraction of fish between 38 and 41 cm in the SW area. In the SW area a large propor-tion of fish of 35 and 37 cm length was observed. As observed during the recent sur-veys, there are indications of recruitment of fish smaller than 35 cm in both depth layers.
2.3.2.2 Food and feeding
An overview on the stomach fullness is given in Table 15. In both the shallower and deeper layer, the majority of the redfish stomachs (76% shallow, 68% deep layer) were everted. In total 12% of the investigated redfish from the shallower layer and
ICES WGRS - AUGUST REPORT 2011 | 13
7% in the deeper layer had food items in their stomachs. Of these fish in the shallow layer little, medium and high contents were evenly distributed, whereas in the deep layer the majority of the fish had little and medium contents. Stomach contents have partly been analysed and the remaining fixed stomachs are being analysed.
2.3.2.3 Maturity
The great majority of the males were identified as maturing, whereas most of the females were in the post-spawning stage, as expected from earlier investigations. Figure 12 displays the maturity ogive by sex and depth layers. In general, around 90% of the females and 100% of the males were identified as being mature at a length of 35 cm, and 50% maturity was reached for males at 25 cm (shallow layer) and around 28 cm for males (deeper layer), while in females 50% maturity was reached around 28–29 cm (shallow layer) and around 31–32 cm in the deeper layer. Both males and females mature at a smaller size (about 3 cm less) in the shallow layer compared to 2009.
2.3.2.4 Parasite infestation
Tables 16a and 16b contain the results of the analysis of the infestation of the beaked redfish S. mentella by parasitic copepod Sphyrion lumpi and the occurrence of individuals with pigmented patches (black and red spots) on skin in the survey area. As in previ-ous years, the infestation by copepod S. lumpi and occurrence of pigmented patches on redfish skin was higher in females than in males of S. mentella throughout the whole survey area and at all depths. Above 500 m 61.9% of the females were infested with S. lumpi or were carrying remnants, while the percentage in males was 43.4. Below 500 m the values of infestation between females and males were similar to 44.4% and 41.9%, respectively. Above 500 m in total 18.0% of the redfish were carrying black or red pig-ment patches (females: 23.8%, males: 14.3%), in total only 6.3% (females: 8.6%, males: 4.9%) of the redfish below 500 m were carrying pigment patches.
2.3.3 Hydrography
A total of 134 deep-water hydrographical stations, including survey in the long-term hydrographical Russian 3K section, were carried out. The results are shown in Fig-ures 13–20.
Surface temperature varied from 2.5°С in the northwest survey area to 11.2°С in the southeast of the survey area (Figure 13). Positive difference of surface temperature compared to the 2009 survey was observed in the southern part of the survey area with maximum positive value of 2.0 – 2.5°С. Negative difference in water tempera-ture up to -5.0 – -4.0°С was, however, observed in the northern part (Figure 18).
Temperature distribution and its anomalies in the hydrographical 3K section are pre-sented in Figures 19 and 20. Assessment of temperature anomalies shows that heat content deficiency dominated in the upper mixed layer along the whole section and over the whole survey area except for the easternmost stations. Positive temperature anomalies up to 1.5°С are characteristic of intermediate and deep waters in the cen-tral part of the Irminger Sea.
14 | ICES WGRS - AUGUST REPORT 2011
2.4 Discussion
2.4.1 Acoustic assessment
The survey covered 343 000 NM2, which represents most of the distribution area of redfish in the Irminger Sea and adjacent waters. The boundaries of the horizontal distribution were more or less reached in all directions except for a small area in the southeastern and soutwestern parts. This may indicate that biomass in the upper layer may be underestimated. Compared with earlier investigations at this time of the year (Magnusson et al., 1994, 1996; Sigurðsson et al., 1999; ICES, 2002; ICES, 2003b; ICES, 2005b, ICES, 2007b), the relative distribution of the redfish is similar to the dis-tribution observed in 2001, 2005, 2007 and 2009. Since the survey in 2003 was carried out about one month earlier as the previous surveys, and a marked seasonal effect was observed, the biomass estimates for 2003 were considered as inconsistent (ICES, 2003b). The surveys since 2001 (excluding the survey in 2003) indicate that the redfish were more westerly (and southwesterly) distributed than prior to 2001 when the highest concentration was found SE of Cape Farewell. Since 1994, the results of the acoustic estimate indicate a drastically decreasing biomass trend with the lowest value recorded in 2009, excluding the 2003 survey (Table 5). The estimate was in 2011 slightly higher than estimated in 2009.
The present results show that in subareas A and B, where the highest concentration of redfish was observed in the surveys 1994–2001, the biomass in 2011 was about 5% of the 1994 estimates. In subarea D, where highest biomass was found in 2001, but al-most no redfish was recorded in 2009 and 2011. In subarea E, south and southwest of Cape Farewell, the biomass has decreased compared to the 2005 and 2007 surveys. The estimated biomass in this area was less than 20% of the estimate in 2005 and twice more that in 2009. The increased fraction of fish in the southwestern survey area in 2001, 2005 and 2007 is consistent with an increasing proportion of fishery ac-tivities in this area since 2000 (ICES, 2007b).
Although discarding the acoustic data obtained during the times of the most pro-nounced mixing with the scattering layer, the diurnal variation of the integration values was evident. During night-time (i.e. from about 22:00–08:00 GMT), the integra-tion values usually decrease. Compared with the surveys in 1994 and 1996 (Magnús-son et al., 1994; Magnússon et al., 1996) this is, however, not as pronounced now as it has been.
2.4.2 Abundance estimation by the trawl method
During Russian trawl-acoustic surveys in 1995 and 1997, attempts were made to as-sess the redfish deeper than 500 m by acoustic methods. According to an expert esti-mation in 1995, the stock constituted nearly 900 000 t (Shibanov et al., 1996a), and in 1997, it was estimated to be 500 000 t (Melnikov et al., 1998). In the joint survey in 1999, an attempt was made to estimate the abundance deeper than 500 m based on a similar method as presented here. About 500 000 t were estimated deeper than 500 m with a high degree of uncertainty (Sigurðsson et al., 1999). From the data obtained during the joint survey in 2001 (ICES, 2002), the biomass of redfish between 0 and 500 m was estimated about 1 075 000 t, and deeper than 500 m about 1 057 000 t. The 2003 estimate was 92 000 t shallower than 500 m and 678 000 t deeper than 500 m (ICES, 2003b). In 2005 and 2007, the total biomass over both layers was about 1.2 million t, with different shares between the depth layers (2005: 551 000 t shallow, 674 000 t deep; 2007: 372 000 t shallow, 854 000 t deep). The total biomass in 2011 was esti-mated about 907 000 t (123 000 t in acoustic layer, 309 000 t in the DSL above 500 m
ICES WGRS - AUGUST REPORT 2011 | 15
and 475 000 t below 500 m). This is an increase of about 60 000 tonnes compared to 2009, but the second lowest estimate since 1999 excluding the 2003 estimate. As stated earlier, the boundaries of redfish distribution was not reached in some areas which may cause underestimation of total biomass in 2011.
The estimates given for the shallower and deeper layer in 2005 and 2007 are not strictly comparable with earlier results and the 2009 and 2011 results, as the depth coverage is different. The estimates within the DSL were combined with the acoustic results in the surveys 1999–2003 to obtain indices for the layer down to 500 m, whereas in 2005 and 2007, the estimates within and deeper than the DSL were com-bined, allowing an estimation of abundance for the water column from 350–950 m. In 2009 and 2011, the estimates were calculated separately for the acoustic data, for the layer within the DSL shallower than 500 m (trawl method) and deeper than 500 m (trawl method). These changes do not allow a direct comparison between the surveys without recalculation of the estimates, but the acoustic and the trawl data can be summed up to obtain the total estimate of abundance and biomass by each area, which is comparable between years.
The quality of the trawl method cannot be verified as the dataseries is relatively short. Such evaluation on the consistency of the method can therefore not be done until more data points are available. Therefore, as has been stated in earlier reports of the PGRS/SGRS, the abundance estimation by the trawl method must only be consid-ered as a rough attempt to measure the abundance within the DSL and deeper than 500 m. In addition, the codend of the trawl was replaced by the multisampler system (ref) for the Icelandic trawl in 2009 and for the German trawl in 2011. This may affect the slope of the regression line (Figure 7). It is not possible to obtain reliable results without comparing the two trawl system with large number of trawls stations. This can only be done step by step.
Based on the converted sA values derived from the trawl data deeper than 500 m, one can see that although the catch rates are usually low, the distribution area of the red-fish at those depths is very large and exceeds the distribution area of the redfish shal-lower than the DSL. About 72% and 24% of the redfish deeper than 500 m were found in subareas A and B, respectively, with the highest concentrations found in the north-eastern part of subarea A and southeast of Cape Farewell. As in previous years, su-bareas A and B together contained 80–95% of the biomass in the deeper layers.
Within the DSL layer shallower than 500 m the main distribution was in subarea B then in E. The distribution is similar to what was observed with acoustic measure-ments.
2.4.3 Biology
Due to the difference in depth layers observed, compared to 2005 and 2007 when the layers were ‘shallower than’ and ‘within and deeper than the DSL’, the length distri-bution data are not comparable to three of the last two surveys. The differences in mean length between the layers <500 m and >500 m in the NE area, however, display the pattern observed in the commercial fisheries and in surveys prior to 2005. The relatively high amount of redfish of 33–37 cm length (peak at 35 cm) in the shallow layer of the NE and SE areas have been observed in the survey 2009 and coincide with recently observed large numbers of demersal S. mentella on the East Greenland shelf (ICES, 2011b) that are probably partly migrating eastwards into the pelagic wa-ters at that size.
16 | ICES WGRS - AUGUST REPORT 2011
As in previous years, the majority of the fish caught had everted stomachs, and only few stomach content data could be collected, thus the feeding condition and food composition could not be fully evaluated. However, stomach samples were taken and will be analysed accurately. From the observations made so far, redfish are opportun-istic feeders that graze within the DSL (Magnússon, 1996) and feed on invertebrate species and small fish in the layers shallower and deeper than the DSL.
In both depth layers (shallower and deeper than 500 m) maturity of males was reached earlier than that of the females, as seen in earlier surveys. Redfish of both sexes in the shallow layer were mature at smaller sizes than in 2007 and 2009. The classification into the various stages by macroscopic analysis, however, is not straightforward and therefore subject to high variation. Further research and training, coupled with histological analyses, is necessary to distinguish between the different stages.
The obtained results show year-to-year value stability for parameters of S. mentella infes-tation by copepod S. lumpi and occurrence of pigmented patches on the redfish skin.
Some differences in redfish infestation between areas and depths were observed. These differences in occurrence of the above characteristics in S. mentella between specific areas may be associated with the peculiarities of size structure and sex composition of the catch and the ecology of the mesopelagic parasite S. lumpi (Bogovski and Bakay, 1989; Bakay and Melnikov, 2002, 2008). Registered differences (lower at depth over 500 m) in occurrence of pigmented patches on skin of individuals by depth may also be associated with the distribution of larger S. mentella individuals (over 40 cm) that demonstrate sharp reduction of pigmented patches occurrence mainly at depth dee-per than 500 m (Bogovski and Bakay, 1989; Bakay and Melnikov, 2002, 2008).
2.4.4 Hydrography
Analysis of oceanographic situation during the survey and long-term data including 2003, allows following conclusions:
Strong positive anomalies of temperature observed in the upper layer of the Irminger Sea with a maximum in 1998 are related to an overall warming of water Irminger Sea and adjacent areas in 1994–2003. These changes were also observed in the Irminger Current above the Reykjanes Ridge (Pedchenko, 2000), off Iceland (Malmberg et al., 2001) and in the Labrador Seawater (Mortensen and Valdimarsson, 1999). Thus an increase in temperature and salinity has been found in the Irminger Current since 1997 to higher values than for decades, as well as a withdrawal of the Labrador Sea-water due to a slow-down of its formation by winter convection since the extreme year 1988 (ICES, 2001).
The results of the survey in 2003 were confirmed by the presented high water tem-perature anomalies of the 0–200 m layer in the Irminger Sea and adjacent waters. In 200–500 m depth and deeper, positive anomalies in most parts of the observation area were observed, but increasing temperature as compared to the survey in June-July 2001 was obtained only north of 60° N in the flow of the Irminger Current above the Reykjanes Ridge and the northwestern part of the Irminger Sea.
In June/July 2005, the temperature of the water in the shallower layer (0–500 m) of the Irminger Sea was higher than normal (ICES, 2005b). As in the surveys 1999–2003, the redfish were aggregating in the southwestern part of the survey area, partly influ-enced by these hydrographic conditions. In connection with the continuation of posi-tive anomalies of temperature in the survey area, the redfish concentrations were

ICES WGRS - AUGUST REPORT 2011 | 17
distributed mainly in depths of 450–800 m, within and deeper than the DSL. Favour-able conditions for aggregation of redfish in an acoustic layer have been marked only in the southwestern part of the survey area with temperatures between 3.6–4.5°C.
In June/July 2007, again a higher temperature in the shallower layer was observed, as seen since 1996.
Hydrography surveys of June/July 2011 show that the increased temperature back-ground is still in place in the survey area on the level specific for warm and mod-erately warm years. However as compared to the 2007 and 2009 surveys the heat capacity reduction trend is observed.
The increasing of water temperature in the Irminger Sea may have an effect on spatial and vertical distributions of S. mentella in the feeding area (Pedchenko, 2005). The abundance and distribution of S. mentella in relation to oceanographic conditions will be analysed in a special multistage workshop (WKREDOCE). The first meeting of the workshop will be held on 17 September 2011 in Gdańsk, Poland.
18 | ICES WGRS - AUGUST REPORT 2011
3 Future of the survey and participation
The Group confirms its 2005 recommendations (ICES 2005a, 2005b) that the survey should be continued, that it should be carried out every second year, that as many vessels as possible should participate to improve the quality of the derived estimates, and that the timing of the survey should be kept in June/July.
After several unsuccessful attempts by the Group to involve more nations/vessels in the survey (see ICES, 2007a), the possibility of chartering e.g. an Icelandic or Russian vessel, equipped with the necessary gear and instrumentation, was discussed. Similar as in other international surveys (e.g. on Atlanto-Scandian herring and blue whiting), a cost and staff contribution by those nations fishing on the stock could be considered to ensure that at least four vessels could participate in the survey, as recommended by the Group in 2005 (ICES, 2005b). The Group recommends that the ICES Secretariat supports the Group’s efforts to involve further nations in the next surveys. To date, this situation has not improved, but even become more serious:
On two of the last three surveys (2007 and 2009), the redfish distribution area was only covered with a relatively low density of hydroacoustic tracks and trawl hauls by two vessels, due to the cancellation of the German part in 2007 and the Russian part in 2009. The Group would like to express its severe worries about the insufficient survey participation of ICES countries involved in the pelagic redfish fisheries in the Irminger Sea and adjacent waters. The Group is particularly concerned with the de-creased data quality and higher uncertainty (on top of the methodological draw-backs) in the derived dataseries and corresponding low credibility in the Group’s work and consequently the advice on the stock status.
ICES WGRS - AUGUST REPORT 2011 | 19
4 Acknowledgements
The Group wishes to thank everyone who has been involved in this work, especially to those people conducting the surveys and being responsible for the flexibility and successful logistics during the recent survey. The German part of the survey and meeting travel costs were partly funded by the European Commission within the Data Collection Framework (Reg. 199/2008).
The meeting was hosted by PINRO in Murmansk. Many thanks for their great hospi-tality and technical organisation of the meeting.
20 | ICES WGRS - AUGUST REPORT 2011
5 References
Bakay, Y. I., and Karasev, A. B. 2001. Registration of ectolesions of redfish Sebastes genus in the North Atlantic (Methodical guidelines). NAFO Scientific Council Research Document 01/27, Serial No. 4401, 10 pp.
Bakay, Y. I., and Melnikov, S. P. 2002. Vertical structure of Sebastes mentella concentrations in the pelagic open part of the Irminger Sea. NAFO Scientific Council Research Document 02/10, Serial No. 4611, 21 pp.
Bakay, Y. I., and Melnikov, S. P. 2008. Biological and ecological characteristics of deepwater redfish Sebastes mentella (Scorpaeniformes: Scorpaenidae) at different depths in the pela-gial of the Irminger Sea. Journal of Ichthyology, Vol. 48, No 1. P.68–80.
Bethke, E. 2004. The evaluation of noise- and threshold-induced bias in the integration of sin-gle-fish echoes. ICES Journal of Marine Science 61: 405–415.
Bogovski, S. P., and Bakay, Y. I. 1989. Chromatoblastomas and related pigmented lesions in deepwater redfish, Sebastes mentella (Travin), from North Atlantic areas, especially the Irminger Sea. Journal of Fish Diseases, 12: 1–13.
Dalen, J., Nedreaas, K., and Pedersen, R. 2003. A comparative acoustic-abundance estimation of pelagic redfish (Sebastes mentella) from hull-mounted and deep-towed acoustic systems. ICES Journal of Marine Science 60: 472–479.
Engås, A., Skeide, R., and West, C.W. 1997. The ‘MultiSampler’: a system for remotely opening and closing multiple codends on a sampling trawl. Fisheries Research 29: 295–298.
Foote, K. G., Knudsen, H. P., Vestnes, G., MacLennan, D. N., and Simmonds, E. J. 1987. Calibra-tion of acoustic instruments for fish density estimation: a practical guide. Cooperative Re-search Report Conseil International pour l’Exploration de la Mer 144.
ICES. 1991. Report of the North-Western Working Group. ICES CM 1991/Assess:21.
ICES. 1993. Report of the Study Group on Redfish Stocks. ICES CM 1993/G:6, 12 pp.
ICES. 1994a. Report of the North-Western Working Group. ICES CM 1994/Assess:19.
ICES. 1994b. Report of the Study Group on Redfish Stocks. ICES CM 1994/G:4, 8 pp.
ICES. 1995. Report of the Study Group on Redfish Stocks. ICES CM 1995/G:1, 6 pp.
ICES. 1996. Report of the North-Western Working Group. ICES CM 1996/Assess:15.
ICES. 1998. Report of the North-Western Working Group. ICES CM 1998/ACFM:19, 350 pp.
ICES. 2002. Report of the Planning Group on Redfish stocks. ICES CM 2002/D:08, 48 pp.
ICES. 2003a. Report of the Planning Group on Redfish stocks (planning meeting). ICES CM 2003/D:02, 21 pp.
ICES. 2003b. Report of the Planning Group on Redfish stocks (results meeting). ICES CM 2003/D:08, 43 pp.
ICES. 2005a. Report of the Study Group on Redfish stocks (planning meeting). ICES CM 2005/D:02, 27 pp.
ICES. 2005b. Report of the Study Group on Redfish stocks (results meeting). ICES CM 2005/D:03, 48 pp.
ICES. 2007a. Report of the Study Group on Redfish stocks (planning meeting). ICES CM 2007/RMC:01, 25 pp.
ICES. 2007b. Report of the Study Group on Redfish stocks (results meeting). ICES CM 2007/RMC:12, 50 pp.
ICES WGRS - AUGUST REPORT 2011 | 21
ICES. 2009a. Report of the Workshop on Redfish Stock Structure (WKREDS). ICES CM 2009/ACOM:37.
ICES. 2009b. Report of the Planning Group on Redfish Surveys (PGRS). ICES CM 2009/RMC:01.
ICES. 2009c. Report of the Planning Group on Redfish Surveys (PGRS). ICES CM 2009/RMC:05.
ICES. 2011a. Report of the Working Group on Redfish Surveys (WGRS). ICES CM 2011/SSGESST:03.
ICES. 2011b. Report of the North Western Working Group (NWWG). ICES CM 2011/ACOM:7.
Jech, J. M., Foote, K. G., Chu, D., and Hufnagle, L. C. 2005. Comparing two 38-kHz scientific echosounders. ICES Journal of Marine Science, 62: 1168–1179.
Magnússon, J. 1996. The deep scattering layers in the Irminger Sea. Journal of Fish Biology 49 (Suppl. A): 182–191.
Magnússon, J., Magnússon, J. V., and Reynisson, P. 1992a. Report on the Icelandic survey on oceanic redfish in the Irminger Sea, in June 1991. ICES CM 1992/G:64, 11 pp.
Magnússon, J., Magnússon, J. V., Reynisson, P., Hallgrímsson, I., Dorchenkov, A., Pedchenko, A., and Bakay, Y. 1992b. Report on the Icelandic and Russian acoustic surveys on oceanic redfish in the Irminger Sea and adjacent waters, in May/July 1992. ICES CM 1992/G:51, 27 pp.
Magnússon, J., Nedreaas, K. H., Magnússon, J. V., Reynisson, P., and Sigurðsson, T. 1994. Re-port on the joint Icelandic/Norwegian survey on oceanic redfish in the Irminger Sea and adjacent waters, in June/July 1994. ICES CM 1994/G:44, 29 pp.
Magnússon, J., Magnússon, J. V., Sigurðsson, Þ., Reynisson, P., Hammer, C., Bethke, E., Ped-chenko, A., Gavrilov, E., Melnikov, S., Antsilerov, M., and Kiseleva, V. 1996. Report on the Joint Icelandic / German / Russian Survey on Oceanic Redfish in the Irminger Sea and Ad-jacent Waters in June/July 1996. ICES CM 1996/G:8, Ref. H, 27 pp.
Malmberg, S. A., Mortensen, J., and Jónsson, S. 2001. Oceanic fluxes in Icelandic waters. ICES CM 2001/W:08, 14pp.
Melnikov, S. P., Mamylov, V. S., Shibanov, V. N., and Pedchenko, A. P. 1998. Results from the Russian Trawl-acoustic survey on Sebastes mentella stock of the Irminger Sea in 1997. ICES CM 1998/O:12, 15 pp.
Mortensen, J. and Valdimarsson, H. 1999. Thermohaline changes in the Irminger Sea. ICES CM 1999/L:16, 11 pp.
Pedchenko, A. P. 2000. Specification of oceanographic conditions of the Irminger Sea and their influence on the distribution of feeding redfish in 1999. ICES North-Western Working Group 2000, Working Document 22, 13 pp.
Pedchenko, A. P. 2005. The role of interannual environmental variations in the geographic range of spawning and feeding concentrations of redfish Sebastes mentella in the Irminger Sea. ICES Journal of Marine Science, 62: 1501–1510.
Reynisson, P. 1992. Target strength measurements of oceanic redfish in the Irminger Sea. ICES CM 1992/B:8, 13 pp.
Reynisson, P. 1996. Evaluation of threshold-induced bias in the integration of single-fish ech-oes. ICES Journal of Marine Science, 53: 345–350.
Reynisson, P. and Sigurðsson, T. 1996. Diurnal variation in acoustic intensity and target strength measurements of oceanic redfish (Sebastes mentella) in the Irminger Sea. ICES CM 1996/G:25, 15 pp.
Shibanov, V. N., Bakay, Y. I., Ermolchev, V. A., Ermolchev, M. V., Melnikov, S. P., and Ped-chenko, A. P. 1994. Results of the Russian trawl acoustic survey for Sebastes mentella of the Irminger Sea in 1993. ICES CM 1994/G:34, 20 pp.
22 | ICES WGRS - AUGUST REPORT 2011
Shibanov, V. N., Pedchenko, A. P., Melnikov, S. P., Mamylov, S. V., and Polishchuk, M. I. 1996a. Assessment and distribution of the oceanic-type redfish, Sebastes mentella, in the Irminger Sea in 1995. ICES CM 1996/G:44, 21 pp.
Shibanov, V. N., Melnikov, S. P., and Pedchenko, A. P. 1996b. Dynamics of commercial stock of oceanic-type redfish Sebastes mentella in the Irminger Sea in 1989–1995 from results of Rus-sian summer trawl-acoustic surveys. ICES CM 1996/G:46, 19 pp.
Sigurðsson, T., and Reynisson, P. 1998. Distribution of pelagic redfish in (S. mentella, Travin), at depth below 500 m, in the Irminger Sea and adjacent waters in May 1998. ICES CM 1998/O:75, 17 pp.
Sigurðsson, T., Rätz, H.-J., Pedchenko, A., Mamylov, V., Mortensen, J., Stransky, C., Melnikov, S., Drevetnyak, K., and Bakay, Y. 1999. Report on the joint Icelandic/German/Russian trawl-acoustic survey on pelagic redfish in the Irminger Sea and adjacent waters in June/July 1999. Annex to ICES CM 1999/ACFM:17, 38 pp.
ICES WGRS - AUGUST REPORT 2011 | 23
6 Tables
Table 1. Extent, coverage and trawl specification of the international redfish survey in the Irminger Sea and adjacent waters in June/July 2011.
Country Germany Iceland Russia
Vessel RV Walther Herwig III RV Árni Friðriksson RV Vilnyus
Call code/ICES country code DBFR / 6 TNFA / 46 UFJN / 90
Days in field 14 21 21
Type of trawl Hampidjan / Gloria 1024 Hampidjan / Gloria 1024 Russian pelagic trawl (design 75/448)
Number of hauls 9 T1; 12 T2; 12 T3 = 33 9 T1; 35 T2; 35 T3 = 79 9 T1; 37 T2; 45 T3 = 91
Opening / Width 50 m / 50 m 50 m / 50 m 47–50 m
Codend Multisampler (3 bags), 23 mm codend
Multisampler (3 bags), 23 mm codend
40 mm codend
Distance for acoustic registrations
2,190 NM 2,800 NM 2,600 NM
Area surveyed 128,086 NM2 114,859 NM2 100,071 NM2
Number of CTD casts 35 44 54
Table 2. Instrument settings of the acoustic equipment on board the participating vessels. The sound speed value is approximate for the prevailing hydrographic condition in the survey area.
Vessel Walther Herwig III ÁrniFriðriksson Vilnyus
Echosounder Integrator
Simrad EK500 EchoView 4.7 (Myriax)
Simrad EK60 EchoView 4.6 (Myriax)
Simrad EK60 + FAMAS
Frequency 38 kHz 38 kHz 38 kHz
Transmission power 2000 W 2000 W 2000 W
Absorption coefficient
9 dB/km 10 dB/km 10.1 dB/km
Pulse length 1.0 ms 1.0 ms 1.0 ms
Bandwidth Wide 2.43 kHz 2.43 kHz
Transducer type ES38-B ES38-B ES38-B
Two-way beam angle
-20.4 dB -20.9 dB -20.6
Integration Threshold
Time variable threshold
-80 dB/m3 -80 dB/m3
Sound speed 1490 m/s 1483 m/s 1478 m/s
Transducer Gain SV (sA correction)
24.43 dB TS gain – 0.85 dB -0.78 dB
Transducer Gain TS 24.38dB 24.75 dB 25.88 dB
24 | ICES WGRS - AUGUST REPORT 2011
Table 3. Summary of biological sampling in the international redfish survey in the Irminger Sea and adjacent waters in June/July 2011.
Country Germany Iceland Russia Total
Total number / biomass of redfish caught
766 ind. / 418 kg 1,687 ind. / 992 kg 1,974 ind. /1,248 kg 4,427 ind. / 2,658 kg
Number of length measurements
766 1,687 1,727 4180
Number of pairs of otoliths collected
766 1,279 971 3,016
Number of feeding analysis
766 1,279 1,829 3,926
Number of parasites analysis
766 1,279 1,061 3,158
Number of stations / individuals with genetics
7 / 465 8 / 420 65 / 971 80 / 1,856
Table 4. Results of the acoustic abundance and biomass computation and area coverage for red-fish shallower than the DSL for each subarea and total in June/July 2011.
Sub-area A B C D E F Total
Area (NM2) 133,281 90,801 4,181 55,468 55,206 1,078 343,016
No. fish ('000) 8,994 133,510 9 4,835 75,210 648 223,206
Biomass (t) 4,632 74,470 0 3,186 40,176 427 122,891
Table 5. Results (biomass in ´000 t) for the international surveys conducted since 1994, for redfish shallower than the DSL for each subarea and total.
Sub-area
Year A B C D E F Total
1994 673 1228 - 63 226 2190
1996 639 749 - 33 155 1576
1999 72 317 16 42 167 614
2001 88 220 30 267 103 7 716
2003 32 46 1 2 10 0 89
2005 121 123 0 87 204 17 551
2007 80 95 0 53 142 3 372
2009 39 48 4 1 15 1 108
2011 5 74 0 3 40 1 123
ICES WGRS - AUGUST REPORT 2011 | 25
Table 6. Results from experimental estimation of redfish within the DSL and shallower than 500 m in June/July 2011.
A B C D E F Total
Area (NM2) 133,281 90,801 4,181 55,468 55,206 1,078 343,016
Mean length (cm)
35.6 35.2 36.5 36.3 34.8 35.2
Mean weight (g) 537 522 644 616 509 527
No. fish ('000) 111,055 305,455 1,115 40,353 126,483 0 584,461
Biomass (t) 59,615 159,437 718 24,849 64,396 0 309,015
Lower CL 49,964 133,690 570 19,736 52,697 0 256,658
Upper CL 69,266 185,184 866 29,961 76,094 0 361,372
Table 7. Results (biomass in ´000 t) for the international surveys conducted since 2001, 2009 and 2011 for redfish within the DSL layer and shallower than 500 m (1999–2003 for each subarea and total.
Sub-area
Year A B C D E F Total
2001 23 40 45 399 54 5 565
2009 136 68 0 25 48 0 278
2011 69 185 1 30 76 0 309
Table 8. Results from trawl estimation of redfish deeper than 500 m in June/July 2011.
A B C D E F Total
Area (NM2) 133,281 90,801 4,181 55,468 55,206 1,078 343,016
Mean length (cm)
38.3 37.6 39.0 35.9 38.0
Mean weight (g) 699 662 768 567 685
No. fish ('000) 489,503 170,034 0 1,797 32,627 0 693,961
Biomass (t) 342,356 112,613 0 1,380 18,503 0 474,851
Lower CL 288,182 94,647 0 1,096 15,163 0 399,088
Upper CL 396,530 130,579 0 1,664 21,842 0 550,615
26 | ICES WGRS - AUGUST REPORT 2011
Table 9. Results (biomass in ´000 t) for the international surveys conducted since 1999, for redfish deeper than 500 m (1999–2003 and 2009) and deeper than 350 m (2005 and 2007) for each subarea and total, and the depth range covered.
Sub-area
Year A B C D E F Total Depth (m)
1999 187 249 10 14 36 0 497 500–950
2001 497 316 28 79 64 18 1001 500–950
2003 476 142 20 13 27 0 678 500–950
2005 276 161 1 53 179 5 674 350–950
2007 345 283 2 32 172 19 854 350–950
2009 291 121 0 8 37 1 458 550–900
2011 342 112 0 1 18 0 474 550–900
Table 10. Division of redfish biomass within NEAFC and NAFO areas in June/July 2011.
NEAFC NAFO
´000 t % ´000 t %
Acoustic <DSL 79 64 44 36
Trawl < 500 m (within the DSL)
220 71 89 29
Trawl > 500 m 383 96 16 4
ICES WGRS - AUGUST REPORT 2011 | 27
Table 11a. Redfish trawl data < 500 m. Northeastern area. Mean weight and individuals by length (cm below).
Length (cm)
Males Females Total
Weight (g) Numbers Weight (g) Numbers Weight (g) Numbers
27 220 1 220 1
28 329 1 267 3 283 4
29 274 6 287 4 279 10
30 323 4 320 3 322 7
31 351 13 355 7 352 20
32 396 21 389 20 392 41
33 432 34 422 31 427 65
34 476 47 484 33 479 80
35 514 60 517 47 515 107
36 560 41 568 41 564 82
37 609 26 619 38 615 64
38 656 16 679 16 667 32
39 700 10 715 14 709 24
40 719 7 671 3 704 10
41 831 3 829 4 830 7
42 906 1 839 4 853 5
43 851 1 851 1
44 1034 1 1034 1
45 1212 1 1212 1
46 1137 1 1137 1
Total number 292 271 563
Avg. weight 516 536 526
Avg. length 34.9 35.2 35.0
28 | ICES WGRS - AUGUST REPORT 2011
Table 110b. Redfish trawl data > 500 m. Northeastern area. Mean weight and individuals by length (cm below).
Length (cm)
Males Females Total
Weight (g) Numbers Weight (g) Numbers Weight (g) Numbers
28 241 1 241 1
29 267 2 267 2
30 320 7 303 4 314 11
31 349 16 331 13 341 29
32 382 13 381 13 382 26
33 423 23 433 24 428 47
34 460 42 463 28 461 70
35 515 41 508 36 512 77
36 548 61 564 46 555 107
37 599 69 620 65 609 134
38 675 75 654 48 667 123
39 721 76 713 66 717 142
40 783 68 764 53 775 121
41 858 89 854 35 857 124
42 922 59 923 26 922 85
43 979 57 986 22 981 79
44 1032 25 1057 18 1043 43
45 1095 17 1104 7 1098 24
46 1091 5 1237 3 1146 8
47 1103 2 1103 2
48 1475 1 1475 1
Total number 746 510 1256
Avg. weight 718 677 701
Avg. length 38.6 37.9 38.3
ICES WGRS - AUGUST REPORT 2011 | 29
Table 12a. Redfish trawl data < 500 m. Southeastern area. Mean weight and individuals by length (cm below).
Length (cm)
Males Females Total
Weight (g) Numbers Weight (g) Numbers Weight (g) Numbers
25 174 1 202 1 188 2
26 215 1 215 1
27 235 3 235 3
28 272 5 267 4 270 9
29 306 7 307 5 306 12
30 331 8 325 10 328 18
31 364 18 358 9 362 27
32 388 36 393 19 390 55
33 440 62 433 26 438 88
34 483 90 473 42 480 132
35 531 130 510 56 524 186
36 575 140 554 60 569 200
37 613 104 604 71 610 175
38 644 51 657 69 651 120
39 718 24 702 37 708 61
40 760 6 735 10 744 16
41 720 1 770 9 765 10
42 803 2 870 2 836 4
43
44
45 1088 1 1088 1
Total number 687 433 1120
Avg. weight 537 556 544
Avg. length 35.2 35.8 35.4
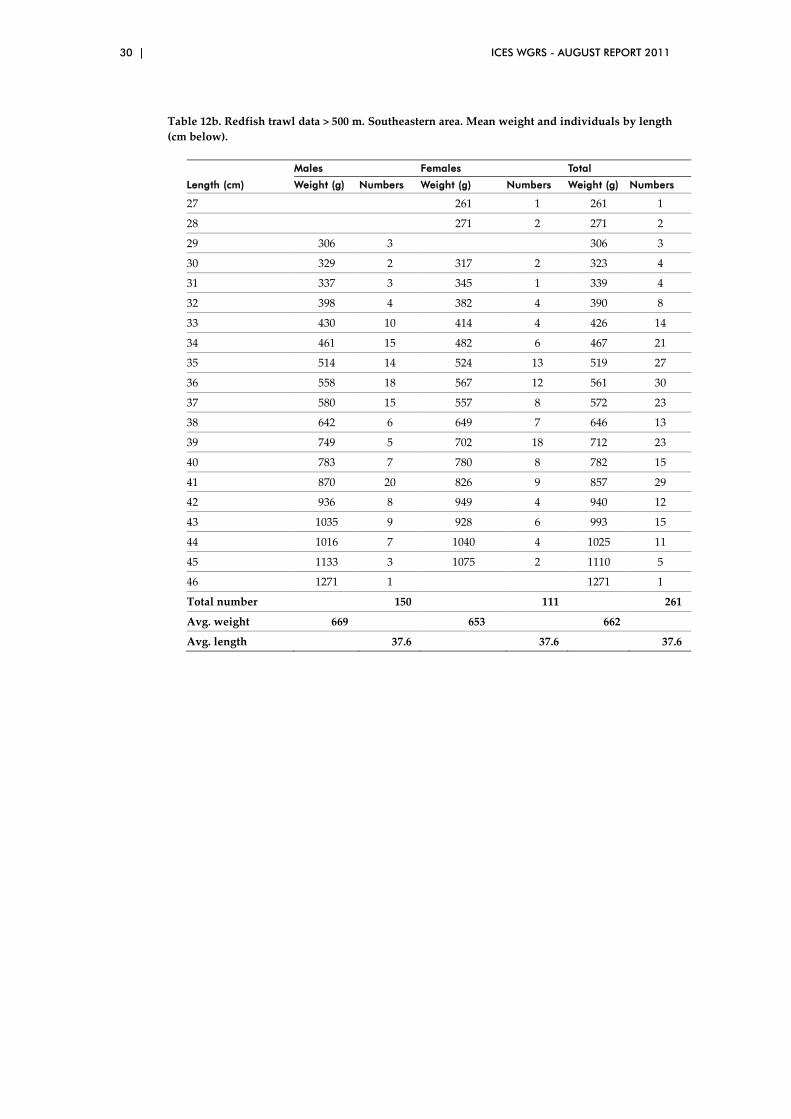
30 | ICES WGRS - AUGUST REPORT 2011
Table 12b. Redfish trawl data > 500 m. Southeastern area. Mean weight and individuals by length (cm below).
Length (cm)
Males Females Total
Weight (g) Numbers Weight (g) Numbers Weight (g) Numbers
27 261 1 261 1
28 271 2 271 2
29 306 3 306 3
30 329 2 317 2 323 4
31 337 3 345 1 339 4
32 398 4 382 4 390 8
33 430 10 414 4 426 14
34 461 15 482 6 467 21
35 514 14 524 13 519 27
36 558 18 567 12 561 30
37 580 15 557 8 572 23
38 642 6 649 7 646 13
39 749 5 702 18 712 23
40 783 7 780 8 782 15
41 870 20 826 9 857 29
42 936 8 949 4 940 12
43 1035 9 928 6 993 15
44 1016 7 1040 4 1025 11
45 1133 3 1075 2 1110 5
46 1271 1 1271 1
Total number 150 111 261
Avg. weight 669 653 662
Avg. length 37.6 37.6 37.6
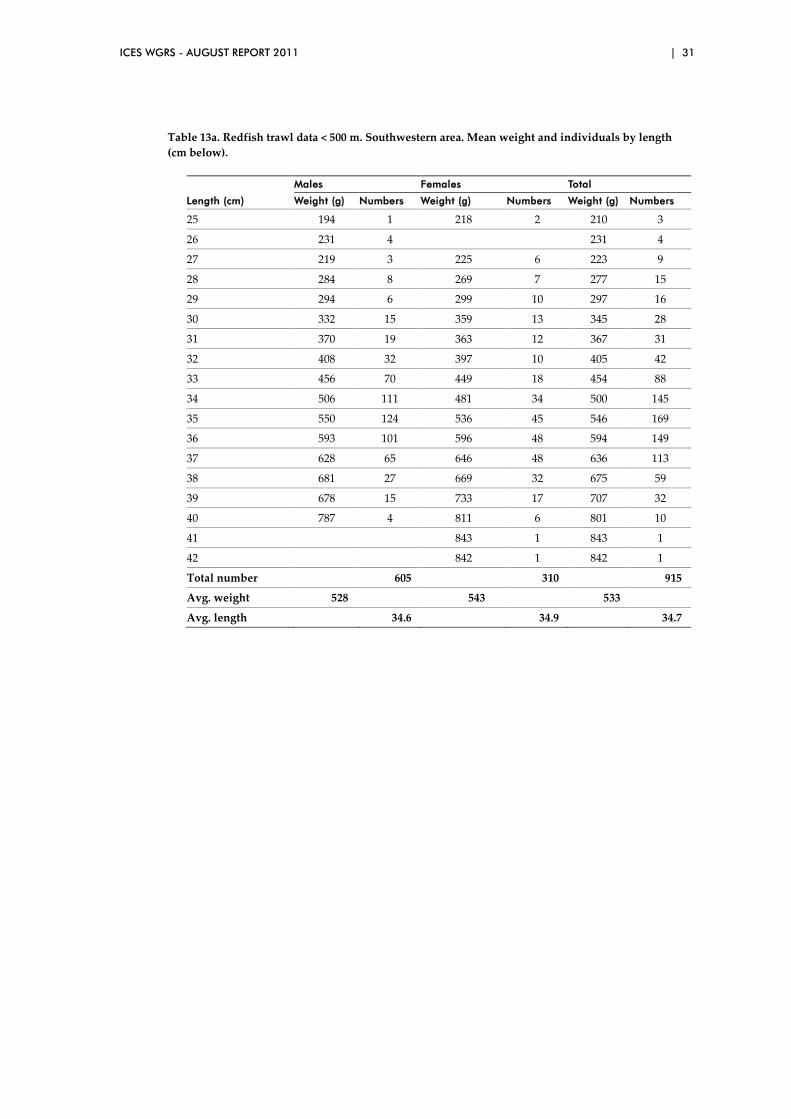
ICES WGRS - AUGUST REPORT 2011 | 31
Table 13a. Redfish trawl data < 500 m. Southwestern area. Mean weight and individuals by length (cm below).
Length (cm)
Males Females Total
Weight (g) Numbers Weight (g) Numbers Weight (g) Numbers
25 194 1 218 2 210 3
26 231 4 231 4
27 219 3 225 6 223 9
28 284 8 269 7 277 15
29 294 6 299 10 297 16
30 332 15 359 13 345 28
31 370 19 363 12 367 31
32 408 32 397 10 405 42
33 456 70 449 18 454 88
34 506 111 481 34 500 145
35 550 124 536 45 546 169
36 593 101 596 48 594 149
37 628 65 646 48 636 113
38 681 27 669 32 675 59
39 678 15 733 17 707 32
40 787 4 811 6 801 10
41 843 1 843 1
42 842 1 842 1
Total number 605 310 915
Avg. weight 528 543 533
Avg. length 34.6 34.9 34.7
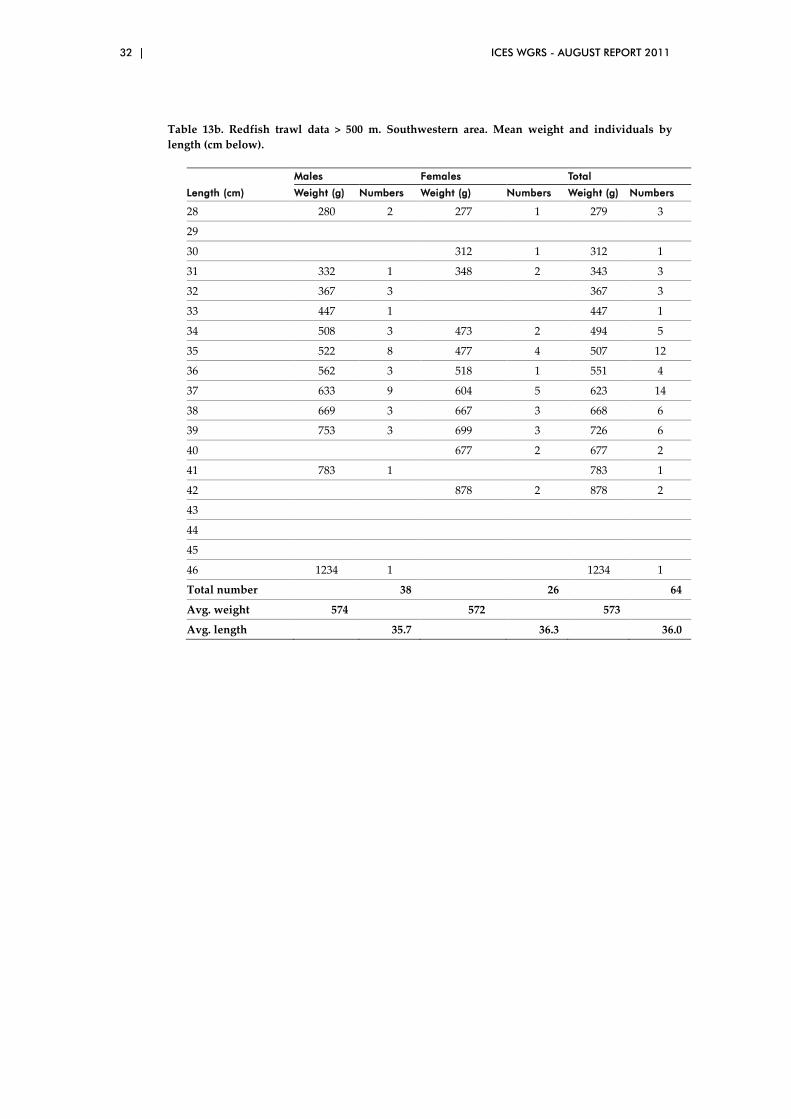
32 | ICES WGRS - AUGUST REPORT 2011
Table 13b. Redfish trawl data > 500 m. Southwestern area. Mean weight and individuals by length (cm below).
Length (cm)
Males Females Total
Weight (g) Numbers Weight (g) Numbers Weight (g) Numbers
28 280 2 277 1 279 3
29
30 312 1 312 1
31 332 1 348 2 343 3
32 367 3 367 3
33 447 1 447 1
34 508 3 473 2 494 5
35 522 8 477 4 507 12
36 562 3 518 1 551 4
37 633 9 604 5 623 14
38 669 3 667 3 668 6
39 753 3 699 3 726 6
40 677 2 677 2
41 783 1 783 1
42 878 2 878 2
43
44
45
46 1234 1 1234 1
Total number 38 26 64
Avg. weight 574 572 573
Avg. length 35.7 36.3 36.0
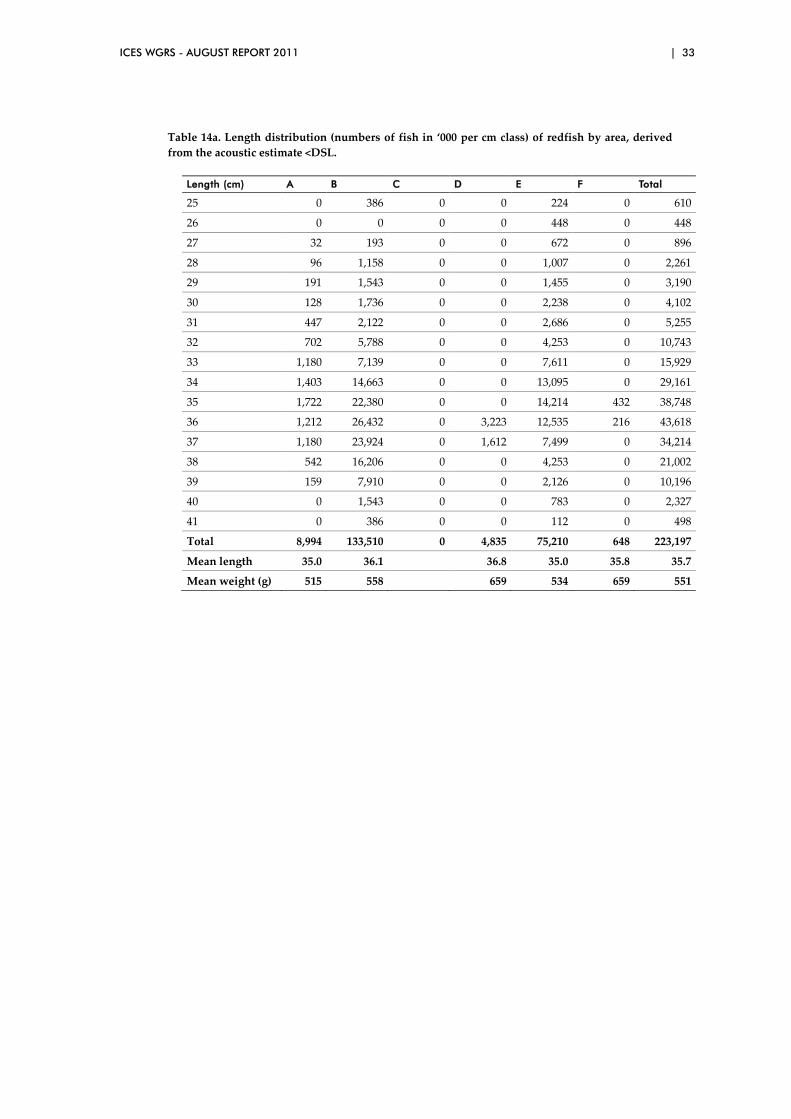
ICES WGRS - AUGUST REPORT 2011 | 33
Table 14a. Length distribution (numbers of fish in ‘000 per cm class) of redfish by area, derived from the acoustic estimate <DSL.
Length (cm) A B C D E F Total
25 0 386 0 0 224 0 610
26 0 0 0 0 448 0 448
27 32 193 0 0 672 0 896
28 96 1,158 0 0 1,007 0 2,261
29 191 1,543 0 0 1,455 0 3,190
30 128 1,736 0 0 2,238 0 4,102
31 447 2,122 0 0 2,686 0 5,255
32 702 5,788 0 0 4,253 0 10,743
33 1,180 7,139 0 0 7,611 0 15,929
34 1,403 14,663 0 0 13,095 0 29,161
35 1,722 22,380 0 0 14,214 432 38,748
36 1,212 26,432 0 3,223 12,535 216 43,618
37 1,180 23,924 0 1,612 7,499 0 34,214
38 542 16,206 0 0 4,253 0 21,002
39 159 7,910 0 0 2,126 0 10,196
40 0 1,543 0 0 783 0 2,327
41 0 386 0 0 112 0 498
Total 8,994 133,510 0 4,835 75,210 648 223,197
Mean length 35.0 36.1 36.8 35.0 35.8 35.7
Mean weight (g) 515 558 659 534 659 551
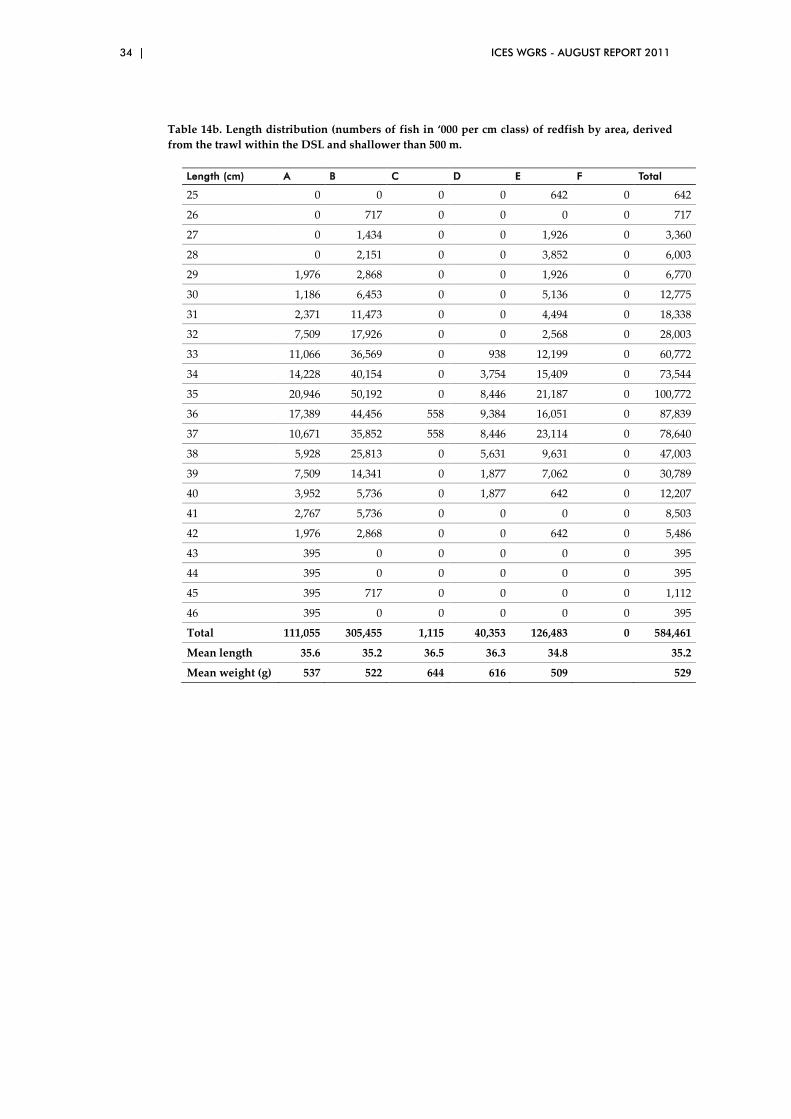
34 | ICES WGRS - AUGUST REPORT 2011
Table 14b. Length distribution (numbers of fish in ‘000 per cm class) of redfish by area, derived from the trawl within the DSL and shallower than 500 m.
Length (cm) A B C D E F Total
25 0 0 0 0 642 0 642
26 0 717 0 0 0 0 717
27 0 1,434 0 0 1,926 0 3,360
28 0 2,151 0 0 3,852 0 6,003
29 1,976 2,868 0 0 1,926 0 6,770
30 1,186 6,453 0 0 5,136 0 12,775
31 2,371 11,473 0 0 4,494 0 18,338
32 7,509 17,926 0 0 2,568 0 28,003
33 11,066 36,569 0 938 12,199 0 60,772
34 14,228 40,154 0 3,754 15,409 0 73,544
35 20,946 50,192 0 8,446 21,187 0 100,772
36 17,389 44,456 558 9,384 16,051 0 87,839
37 10,671 35,852 558 8,446 23,114 0 78,640
38 5,928 25,813 0 5,631 9,631 0 47,003
39 7,509 14,341 0 1,877 7,062 0 30,789
40 3,952 5,736 0 1,877 642 0 12,207
41 2,767 5,736 0 0 0 0 8,503
42 1,976 2,868 0 0 642 0 5,486
43 395 0 0 0 0 0 395
44 395 0 0 0 0 0 395
45 395 717 0 0 0 0 1,112
46 395 0 0 0 0 0 395
Total 111,055 305,455 1,115 40,353 126,483 0 584,461
Mean length 35.6 35.2 36.5 36.3 34.8 35.2
Mean weight (g) 537 522 644 616 509 529
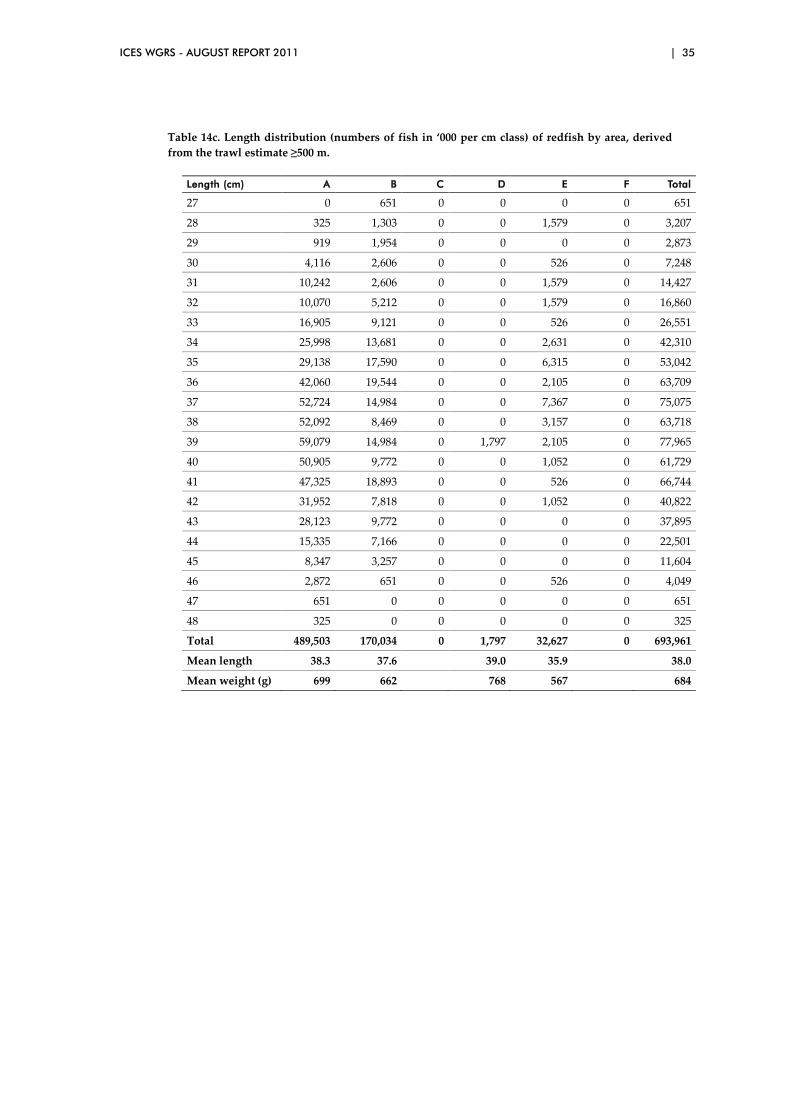
ICES WGRS - AUGUST REPORT 2011 | 35
Table 14c. Length distribution (numbers of fish in ‘000 per cm class) of redfish by area, derived from the trawl estimate ≥500 m.
Length (cm) A B C D E F Total
27 0 651 0 0 0 0 651
28 325 1,303 0 0 1,579 0 3,207
29 919 1,954 0 0 0 0 2,873
30 4,116 2,606 0 0 526 0 7,248
31 10,242 2,606 0 0 1,579 0 14,427
32 10,070 5,212 0 0 1,579 0 16,860
33 16,905 9,121 0 0 526 0 26,551
34 25,998 13,681 0 0 2,631 0 42,310
35 29,138 17,590 0 0 6,315 0 53,042
36 42,060 19,544 0 0 2,105 0 63,709
37 52,724 14,984 0 0 7,367 0 75,075
38 52,092 8,469 0 0 3,157 0 63,718
39 59,079 14,984 0 1,797 2,105 0 77,965
40 50,905 9,772 0 0 1,052 0 61,729
41 47,325 18,893 0 0 526 0 66,744
42 31,952 7,818 0 0 1,052 0 40,822
43 28,123 9,772 0 0 0 0 37,895
44 15,335 7,166 0 0 0 0 22,501
45 8,347 3,257 0 0 0 0 11,604
46 2,872 651 0 0 526 0 4,049
47 651 0 0 0 0 0 651
48 325 0 0 0 0 0 325
Total 489,503 170,034 0 1,797 32,627 0 693,961
Mean length 38.3 37.6 39.0 35.9 38.0
Mean weight (g) 699 662 768 567 684
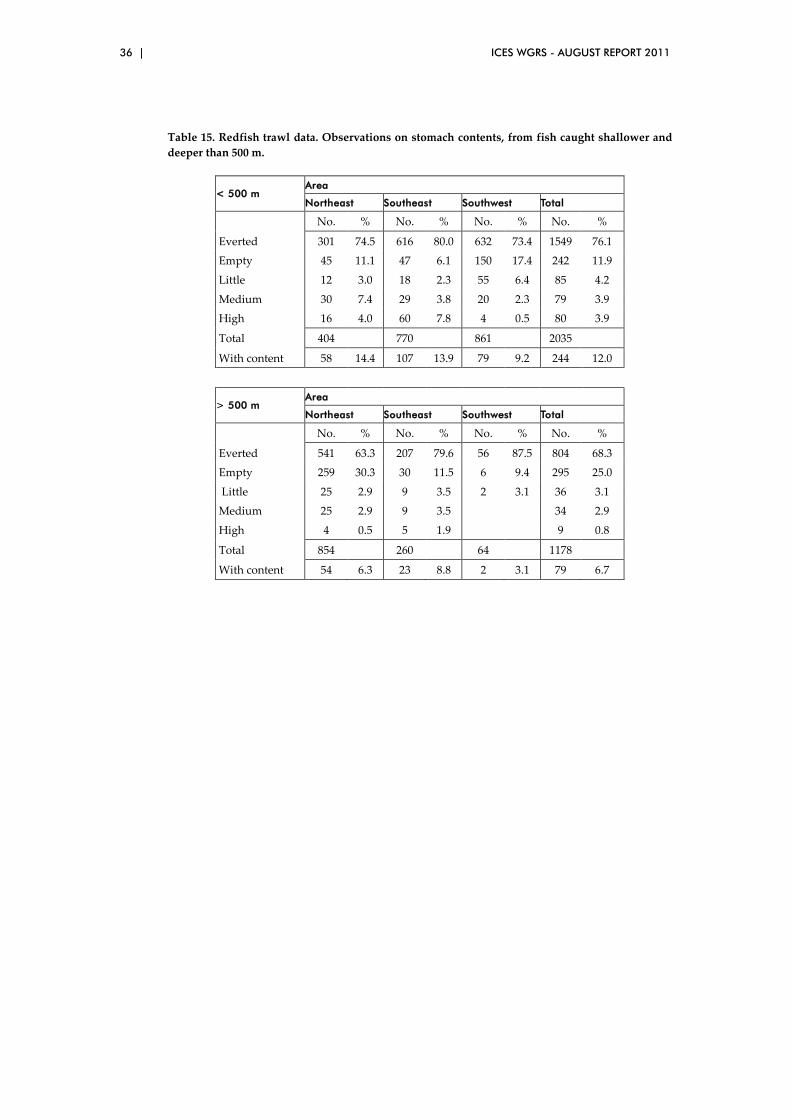
36 | ICES WGRS - AUGUST REPORT 2011
Table 15. Redfish trawl data. Observations on stomach contents, from fish caught shallower and deeper than 500 m.
< 500 m Area
Northeast Southeast Southwest Total
No. % No. % No. % No. %
Everted 301 74.5 616 80.0 632 73.4 1549 76.1
Empty 45 11.1 47 6.1 150 17.4 242 11.9
Little 12 3.0 18 2.3 55 6.4 85 4.2
Medium 30 7.4 29 3.8 20 2.3 79 3.9
High 16 4.0 60 7.8 4 0.5 80 3.9
Total 404 770 861 2035
With content 58 14.4 107 13.9 79 9.2 244 12.0
> 500 m Area
Northeast Southeast Southwest Total
No. % No. % No. % No. %
Everted 541 63.3 207 79.6 56 87.5 804 68.3
Empty 259 30.3 30 11.5 6 9.4 295 25.0
Little 25 2.9 9 3.5 2 3.1 36 3.1
Medium 25 2.9 9 3.5 34 2.9
High 4 0.5 5 1.9 9 0.8
Total 854 260 64 1178
With content 54 6.3 23 8.8 2 3.1 79 6.7
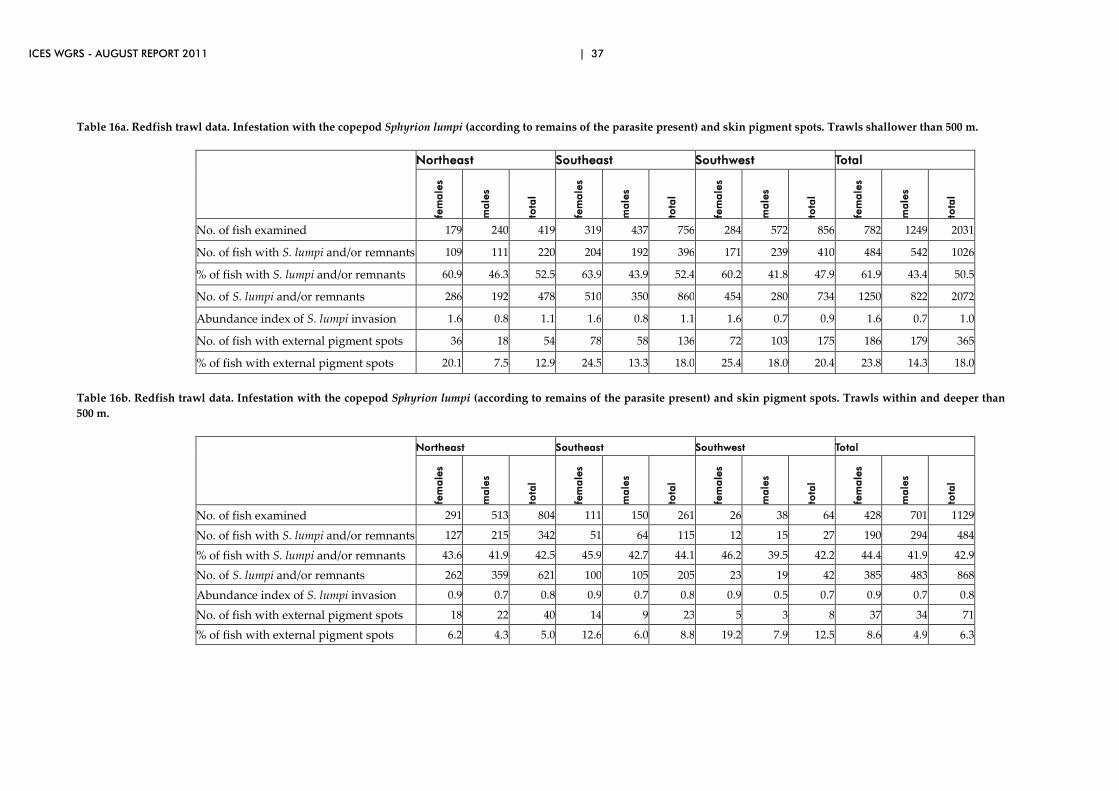
ICES WGRS - AUGUST REPORT 2011 | 37
Table 16a. Redfish trawl data. Infestation with the copepod Sphyrion lumpi (according to remains of the parasite present) and skin pigment spots. Trawls shallower than 500 m.
Northeast Southeast Southwest Total
fem
ale
s
ma
les
tota
l
fem
ale
s
ma
les
tota
l
fem
ale
s
ma
les
tota
l
fem
ale
s
ma
les
tota
l
No. of fish examined 179 240 419 319 437 756 284 572 856 782 1249 2031
No. of fish with S. lumpi and/or remnants 109 111 220 204 192 396 171 239 410 484 542 1026
% of fish with S. lumpi and/or remnants 60.9 46.3 52.5 63.9 43.9 52.4 60.2 41.8 47.9 61.9 43.4 50.5
No. of S. lumpi and/or remnants 286 192 478 510 350 860 454 280 734 1250 822 2072
Abundance index of S. lumpi invasion 1.6 0.8 1.1 1.6 0.8 1.1 1.6 0.7 0.9 1.6 0.7 1.0
No. of fish with external pigment spots 36 18 54 78 58 136 72 103 175 186 179 365
% of fish with external pigment spots 20.1 7.5 12.9 24.5 13.3 18.0 25.4 18.0 20.4 23.8 14.3 18.0
Table 16b. Redfish trawl data. Infestation with the copepod Sphyrion lumpi (according to remains of the parasite present) and skin pigment spots. Trawls within and deeper than 500 m.
Northeast Southeast Southwest Total fe
ma
les
ma
les
tota
l
fem
ale
s
ma
les
tota
l
fem
ale
s
ma
les
tota
l
fem
ale
s
ma
les
tota
l
No. of fish examined 291 513 804 111 150 261 26 38 64 428 701 1129 No. of fish with S. lumpi and/or remnants 127 215 342 51 64 115 12 15 27 190 294 484 % of fish with S. lumpi and/or remnants 43.6 41.9 42.5 45.9 42.7 44.1 46.2 39.5 42.2 44.4 41.9 42.9 No. of S. lumpi and/or remnants 262 359 621 100 105 205 23 19 42 385 483 868 Abundance index of S. lumpi invasion 0.9 0.7 0.8 0.9 0.7 0.8 0.9 0.5 0.7 0.9 0.7 0.8 No. of fish with external pigment spots 18 22 40 14 9 23 5 3 8 37 34 71 % of fish with external pigment spots 6.2 4.3 5.0 12.6 6.0 8.8 19.2 7.9 12.5 8.6 4.9 6.3
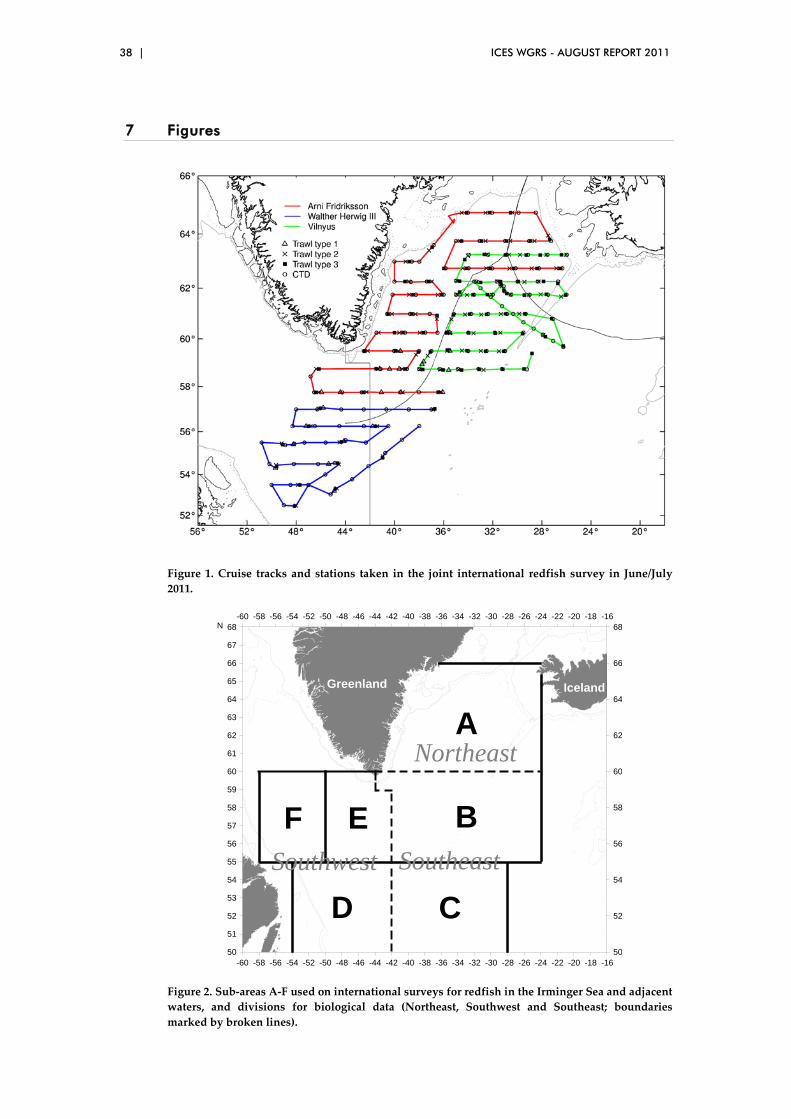
38 | ICES WGRS - AUGUST REPORT 2011
7 Figures
Figure 1. Cruise tracks and stations taken in the joint international redfish survey in June/July 2011.
-60 -58 -56 -54 -52 -50 -48 -46 -44 -42 -40 -38 -36 -34 -32 -30 -28 -26 -24 -22 -20 -18 -16
-60 -58 -56 -54 -52 -50 -48 -46 -44 -42 -40 -38 -36 -34 -32 -30 -28 -26 -24 -22 -20 -18 -16
50
51
52
53
54
55
56
57
58
59
60
61
62
63
64
65
66
67
68
N
50
52
54
56
58
60
62
64
66
68
Greenland Iceland
A
B
CD
EF
Northeast
SoutheastSouthwest
Figure 2. Sub-areas A-F used on international surveys for redfish in the Irminger Sea and adjacent waters, and divisions for biological data (Northeast, Southwest and Southeast; boundaries marked by broken lines).
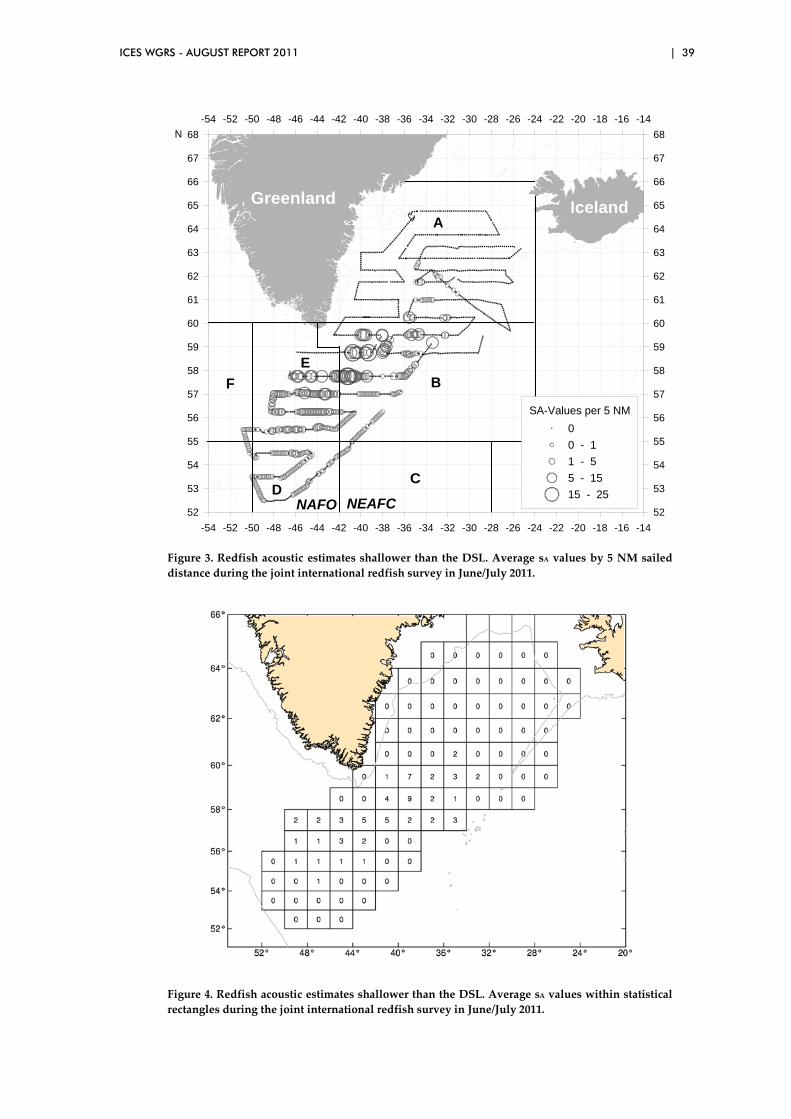
ICES WGRS - AUGUST REPORT 2011 | 39
-54 -52 -50 -48 -46 -44 -42 -40 -38 -36 -34 -32 -30 -28 -26 -24 -22 -20 -18 -16 -14
-54 -52 -50 -48 -46 -44 -42 -40 -38 -36 -34 -32 -30 -28 -26 -24 -22 -20 -18 -16 -14
52
53
54
55
56
57
58
59
60
61
62
63
64
65
66
67
68
N
52
53
54
55
56
57
58
59
60
61
62
63
64
65
66
67
68
Greenland Iceland
SA-Values per 5 NM 0 0 - 1 1 - 5 5 - 15 15 - 25
A
B
CD
EF
NAFO NEAFC
Figure 3. Redfish acoustic estimates shallower than the DSL. Average sA values by 5 NM sailed distance during the joint international redfish survey in June/July 2011.
Figure 4. Redfish acoustic estimates shallower than the DSL. Average sA values within statistical rectangles during the joint international redfish survey in June/July 2011.
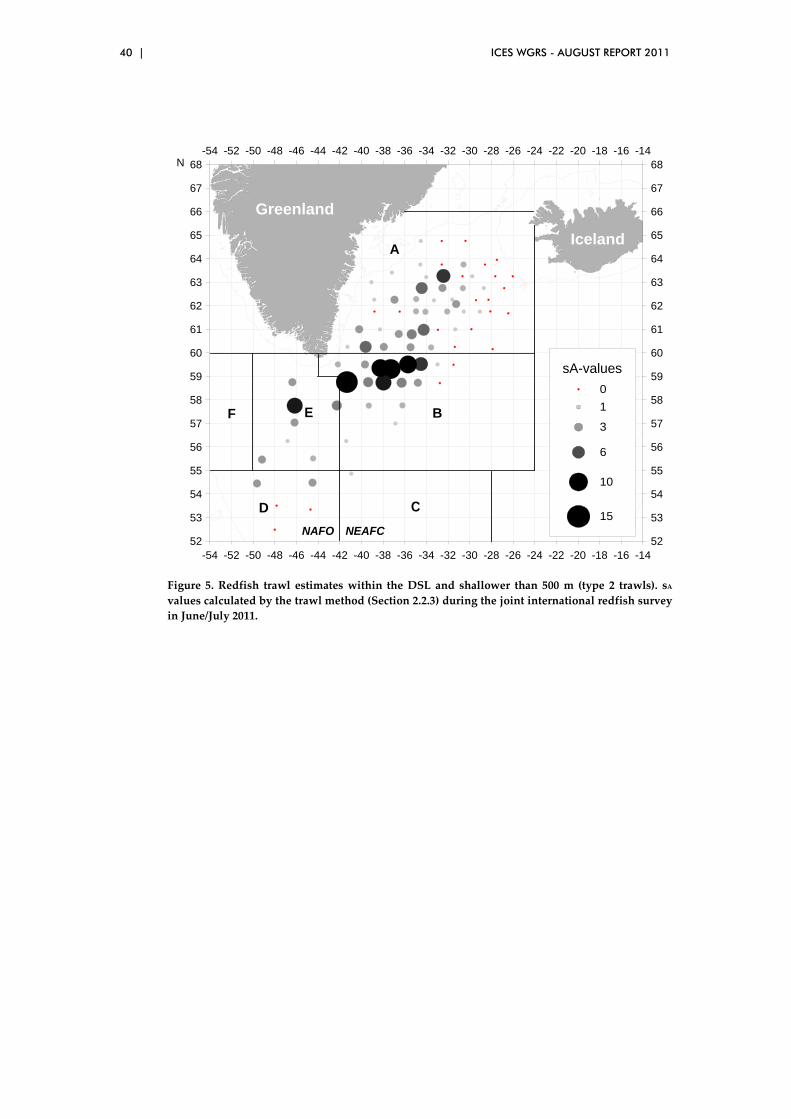
40 | ICES WGRS - AUGUST REPORT 2011
-54 -52 -50 -48 -46 -44 -42 -40 -38 -36 -34 -32 -30 -28 -26 -24 -22 -20 -18 -16 -14
-54 -52 -50 -48 -46 -44 -42 -40 -38 -36 -34 -32 -30 -28 -26 -24 -22 -20 -18 -16 -14
52
53
54
55
56
57
58
59
60
61
62
63
64
65
66
67
68
N
52
53
54
55
56
57
58
59
60
61
62
63
64
65
66
67
68
Greenland
IcelandA
B
CD
EF
NAFO NEAFC
sA-values 0 1
3
6
10
15
Figure 5. Redfish trawl estimates within the DSL and shallower than 500 m (type 2 trawls). sA values calculated by the trawl method (Section 2.2.3) during the joint international redfish survey in June/July 2011.
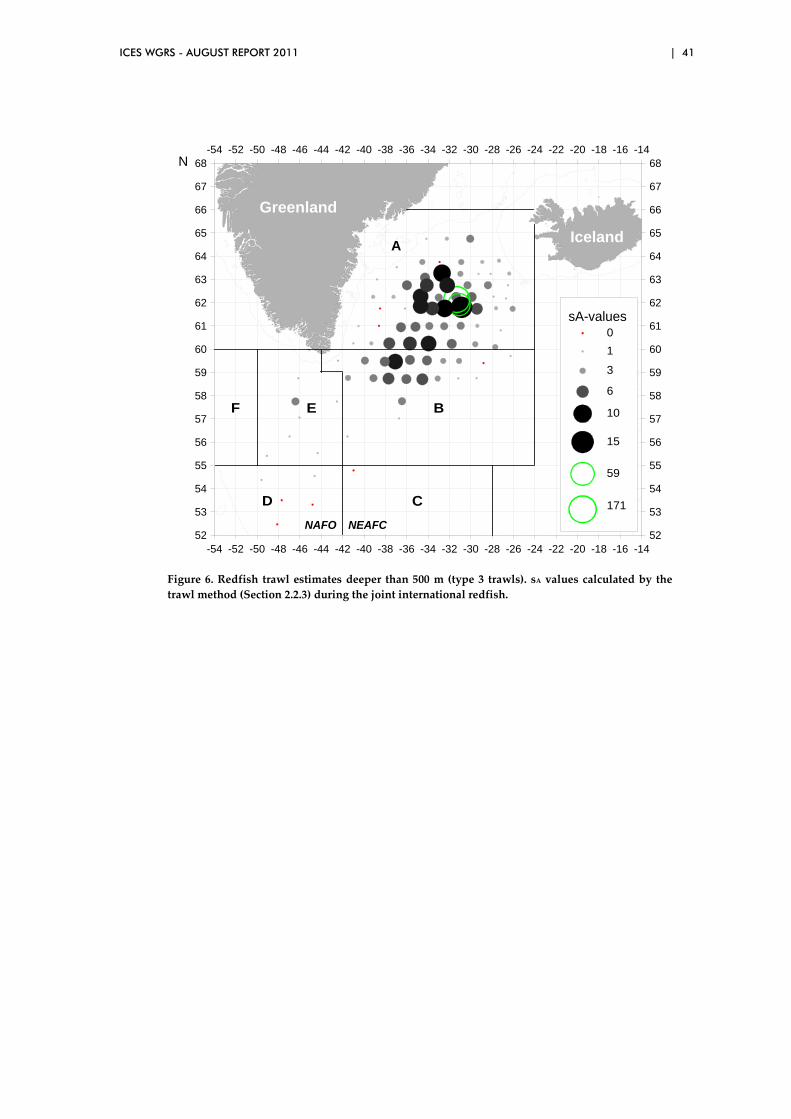
ICES WGRS - AUGUST REPORT 2011 | 41
-54 -52 -50 -48 -46 -44 -42 -40 -38 -36 -34 -32 -30 -28 -26 -24 -22 -20 -18 -16 -14
-54 -52 -50 -48 -46 -44 -42 -40 -38 -36 -34 -32 -30 -28 -26 -24 -22 -20 -18 -16 -14
52
53
54
55
56
57
58
59
60
61
62
63
64
65
66
67
68
N
52
53
54
55
56
57
58
59
60
61
62
63
64
65
66
67
68
Greenland
IcelandA
B
CD
EF
NAFO NEAFC
sA-values 0 1
3
6
10
15
59
171
Figure 6. Redfish trawl estimates deeper than 500 m (type 3 trawls). sA values calculated by the trawl method (Section 2.2.3) during the joint international redfish.
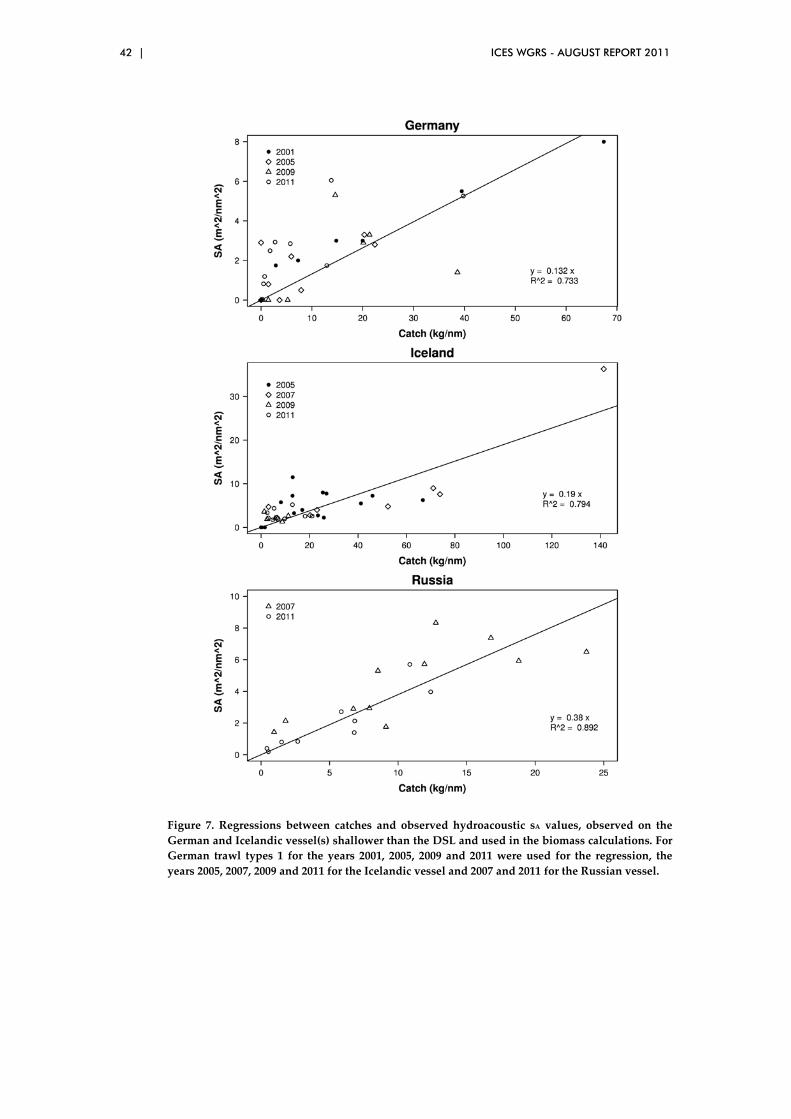
42 | ICES WGRS - AUGUST REPORT 2011
Figure 7. Regressions between catches and observed hydroacoustic sA values, observed on the German and Icelandic vessel(s) shallower than the DSL and used in the biomass calculations. For German trawl types 1 for the years 2001, 2005, 2009 and 2011 were used for the regression, the years 2005, 2007, 2009 and 2011 for the Icelandic vessel and 2007 and 2011 for the Russian vessel.
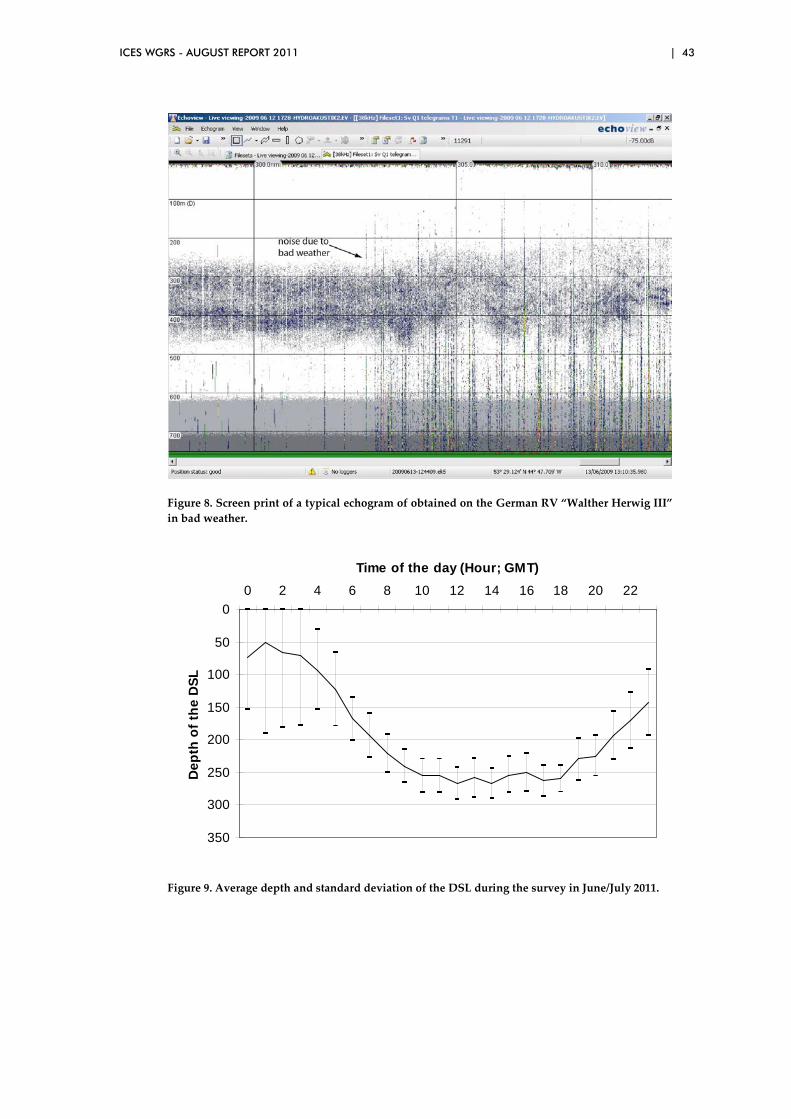
ICES WGRS - AUGUST REPORT 2011 | 43
Figure 8. Screen print of a typical echogram of obtained on the German RV “Walther Herwig III” in bad weather.
0
50
100
150
200
250
300
350
0 2 4 6 8 10 12 14 16 18 20 22
Time of the day (Hour; GMT)
Dep
th o
f the
DSL
Figure 9. Average depth and standard deviation of the DSL during the survey in June/July 2011.
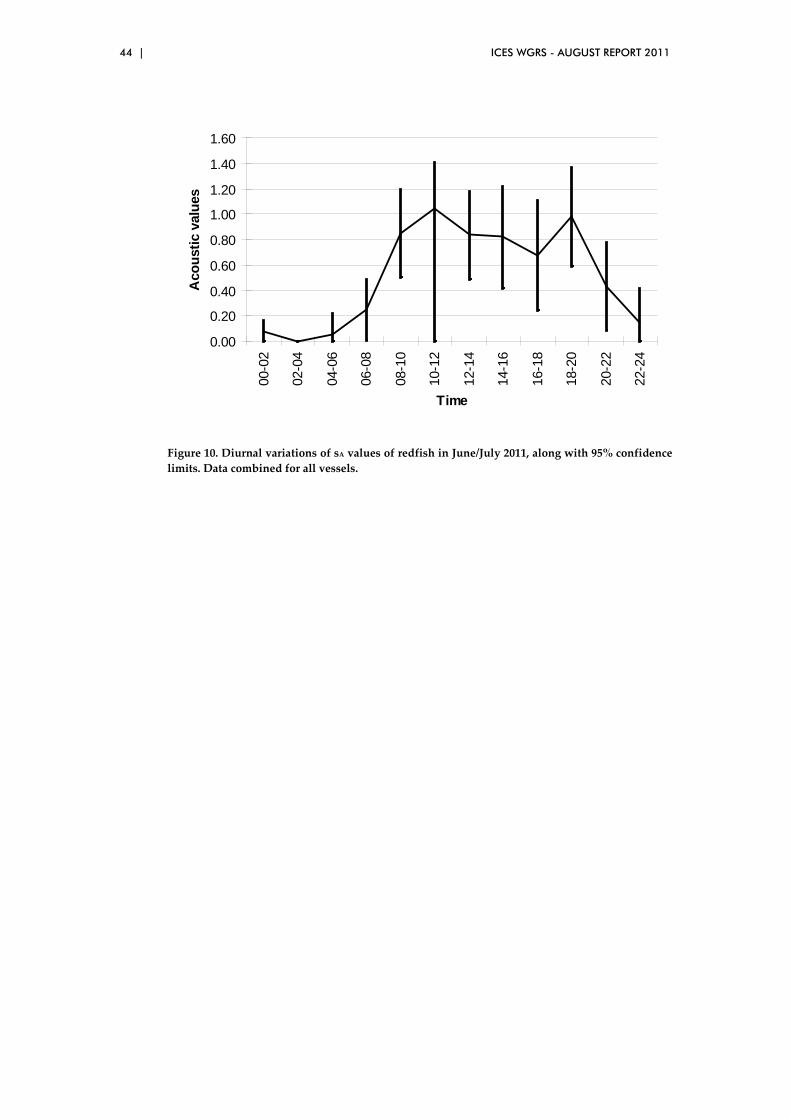
44 | ICES WGRS - AUGUST REPORT 2011
0.00
0.20
0.40
0.60
0.80
1.00
1.20
1.40
1.60
00-0
2
02-0
4
04-0
6
06-0
8
08-1
0
10-1
2
12-1
4
14-1
6
16-1
8
18-2
0
20-2
2
22-2
4
Time
Aco
ustic
val
ues
Figure 10. Diurnal variations of sA values of redfish in June/July 2011, along with 95% confidence limits. Data combined for all vessels.
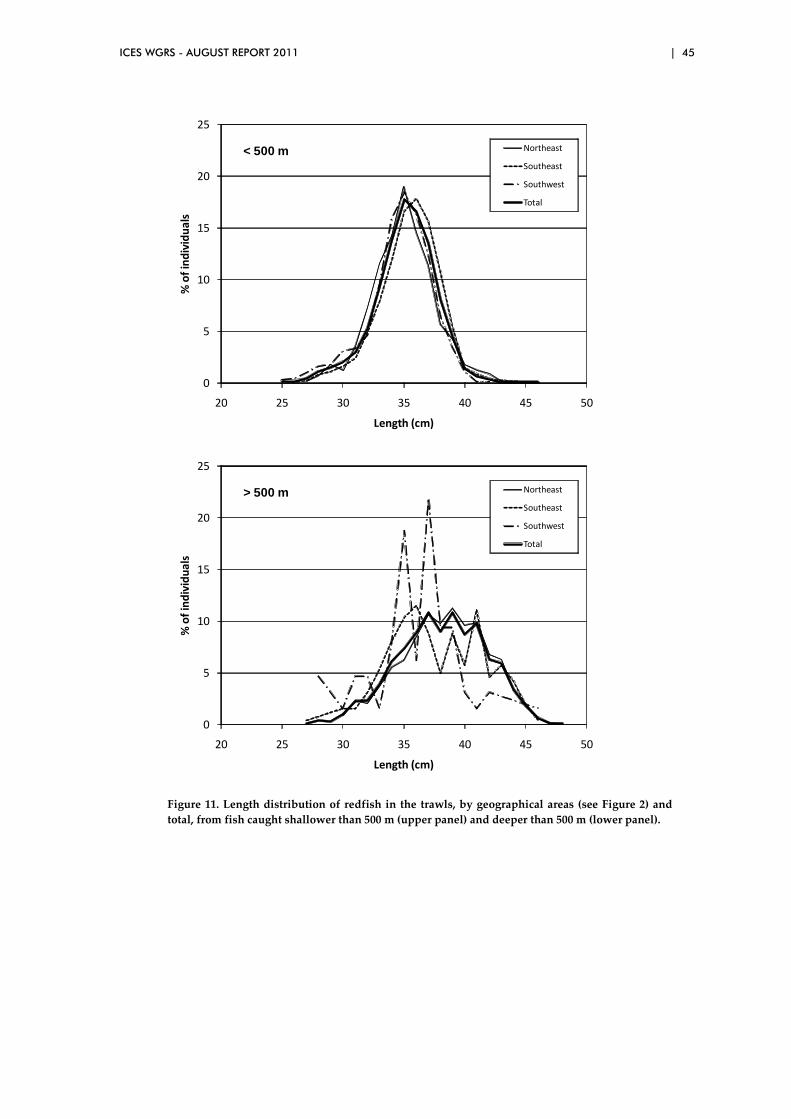
ICES WGRS - AUGUST REPORT 2011 | 45
0
5
10
15
20
25
20 25 30 35 40 45 50
% o
f ind
ivid
uals
Length (cm)
Northeast
Southeast
Southwest
Total
< 500 m
0
5
10
15
20
25
20 25 30 35 40 45 50
% o
f ind
ivid
uals
Length (cm)
Northeast
Southeast
Southwest
Total
> 500 m
Figure 11. Length distribution of redfish in the trawls, by geographical areas (see Figure 2) and total, from fish caught shallower than 500 m (upper panel) and deeper than 500 m (lower panel).
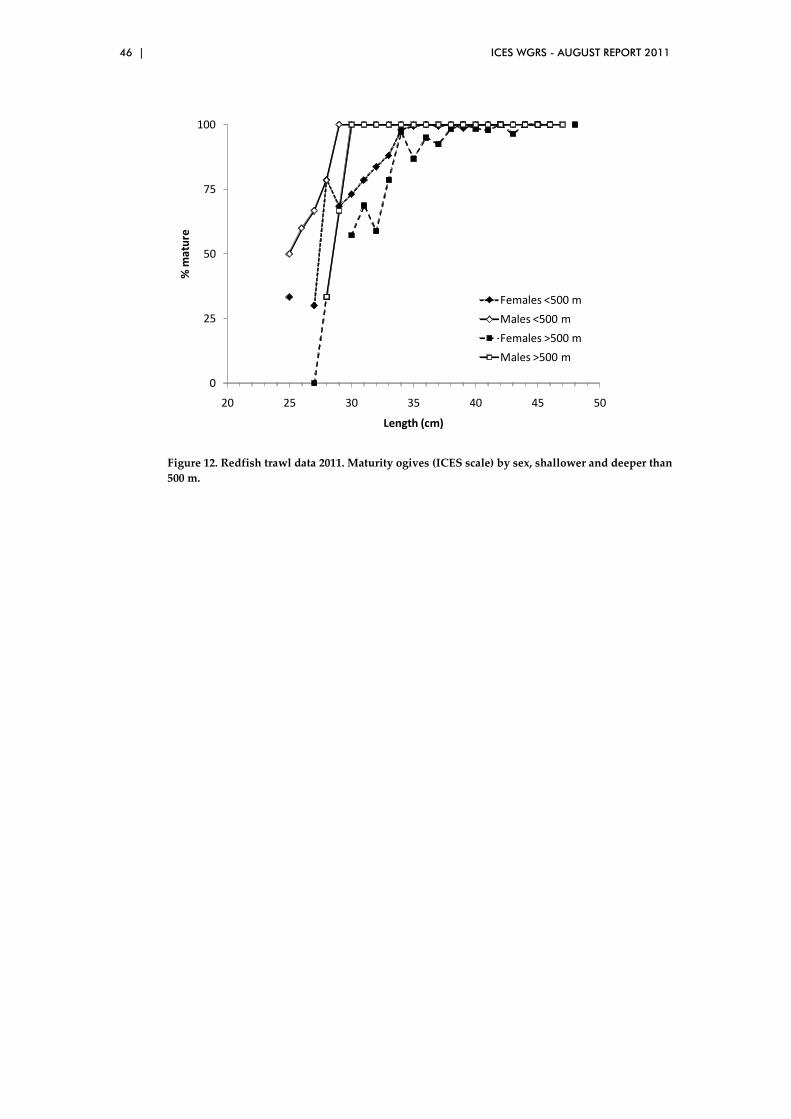
46 | ICES WGRS - AUGUST REPORT 2011
0
25
50
75
100
20 25 30 35 40 45 50
% m
atur
e
Length (cm)
Females <500 m
Males <500 m
Females >500 m
Males >500 m
Figure 12. Redfish trawl data 2011. Maturity ogives (ICES scale) by sex, shallower and deeper than 500 m.
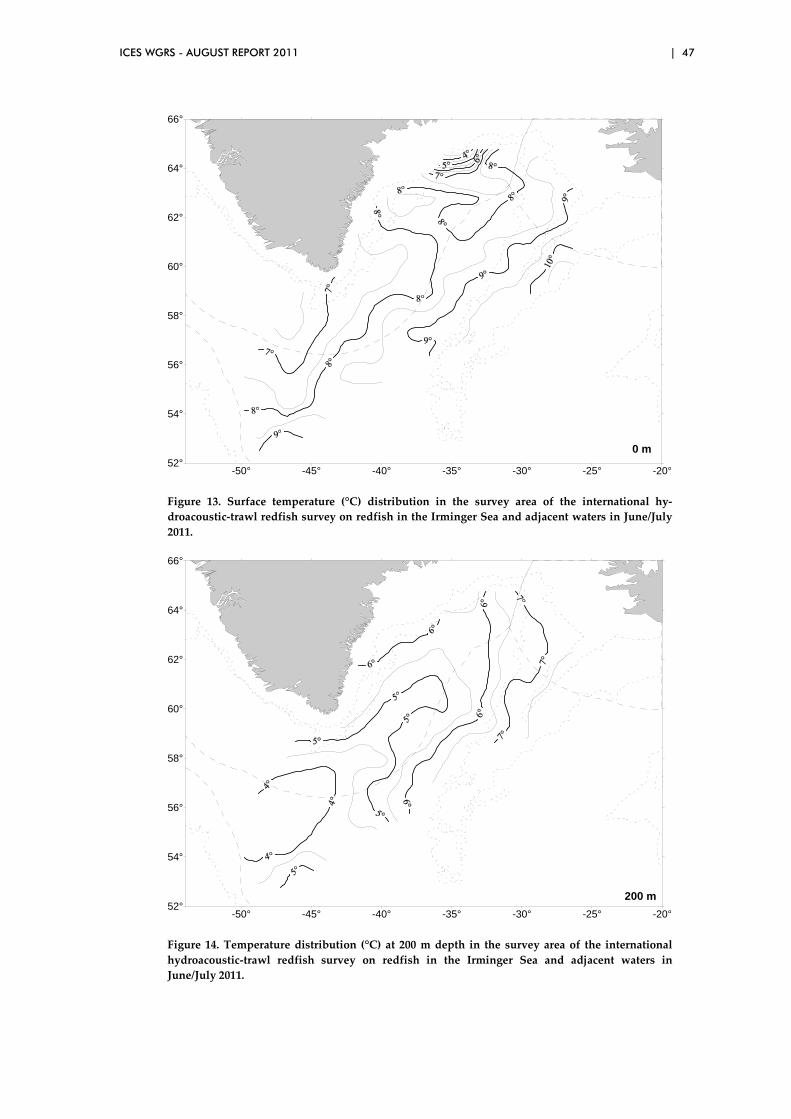
ICES WGRS - AUGUST REPORT 2011 | 47
0 m
-50° -45° -40° -35° -30° -25° -20°52°
54°
56°
58°
60°
62°
64°
66°
Figure 13. Surface temperature (°C) distribution in the survey area of the international hy-droacoustic-trawl redfish survey on redfish in the Irminger Sea and adjacent waters in June/July 2011.
-50° -45° -40° -35° -30° -25° -20°52°
54°
56°
58°
60°
62°
64°
66°
200 m
Figure 14. Temperature distribution (°C) at 200 m depth in the survey area of the international hydroacoustic-trawl redfish survey on redfish in the Irminger Sea and adjacent waters in June/July 2011.
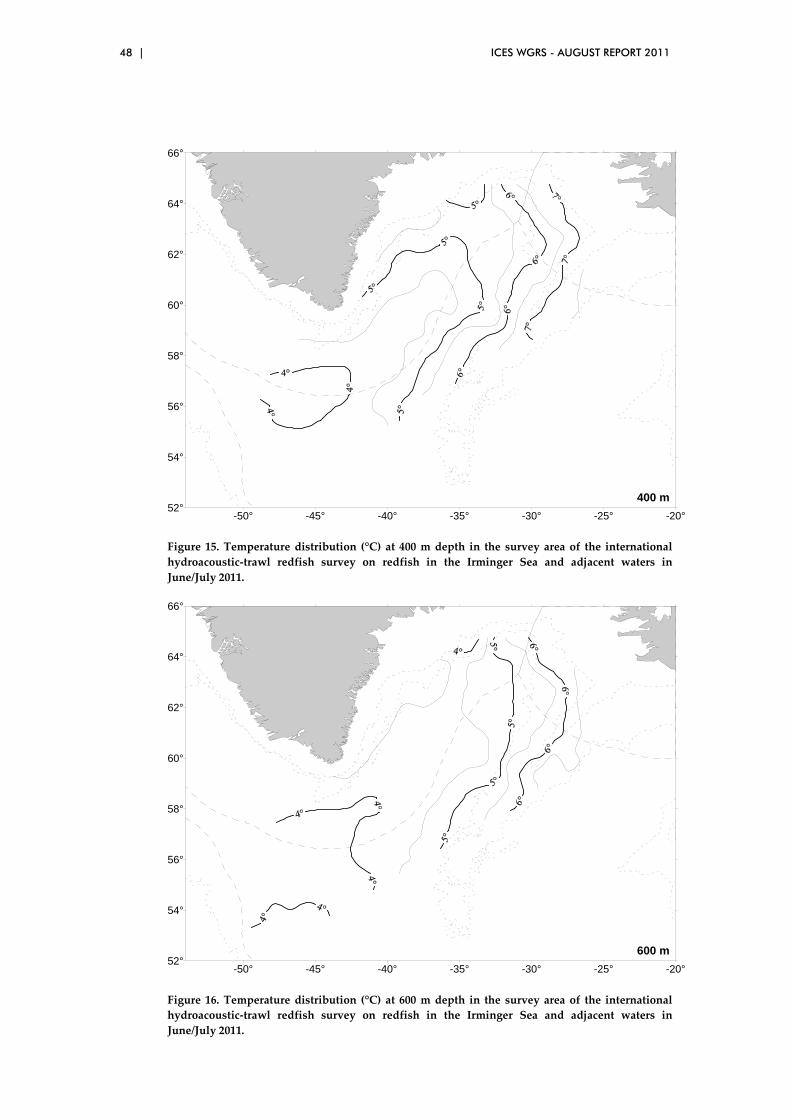
48 | ICES WGRS - AUGUST REPORT 2011
-50° -45° -40° -35° -30° -25° -20°52°
54°
56°
58°
60°
62°
64°
66°
400 m
Figure 15. Temperature distribution (°C) at 400 m depth in the survey area of the international hydroacoustic-trawl redfish survey on redfish in the Irminger Sea and adjacent waters in June/July 2011.
-50° -45° -40° -35° -30° -25° -20°52°
54°
56°
58°
60°
62°
64°
66°
600 m
Figure 16. Temperature distribution (°C) at 600 m depth in the survey area of the international hydroacoustic-trawl redfish survey on redfish in the Irminger Sea and adjacent waters in June/July 2011.
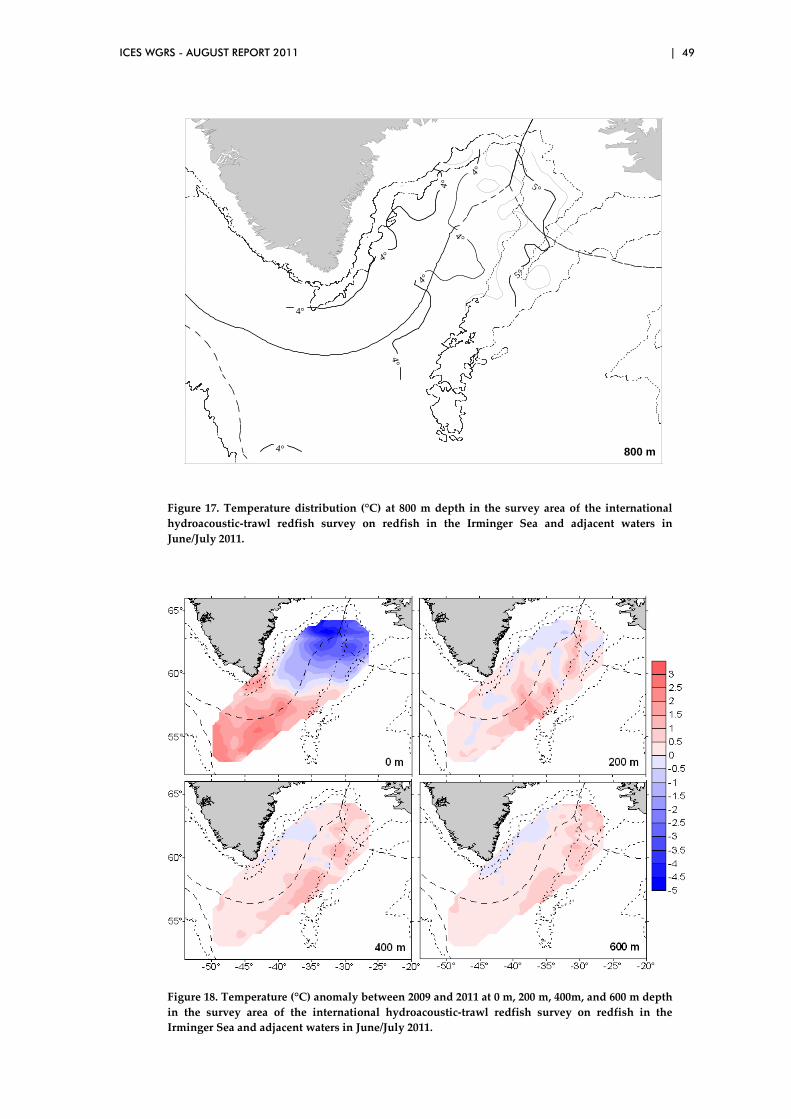
ICES WGRS - AUGUST REPORT 2011 | 49
4°
4°
4°
4°
4°
4°
4°
4°
5°
5°
-50° -45° -40° -35° -30° -25° -20°52°
54°
56°
58°
60°
62°
64°
66°
Figure 16. Horizontal temperature (°C) distribution at 800 m depth in June/July 2011.
800 m
Figure 17. Temperature distribution (°C) at 800 m depth in the survey area of the international hydroacoustic-trawl redfish survey on redfish in the Irminger Sea and adjacent waters in June/July 2011.
Figure 18. Temperature (°C) anomaly between 2009 and 2011 at 0 m, 200 m, 400m, and 600 m depth in the survey area of the international hydroacoustic-trawl redfish survey on redfish in the Irminger Sea and adjacent waters in June/July 2011.
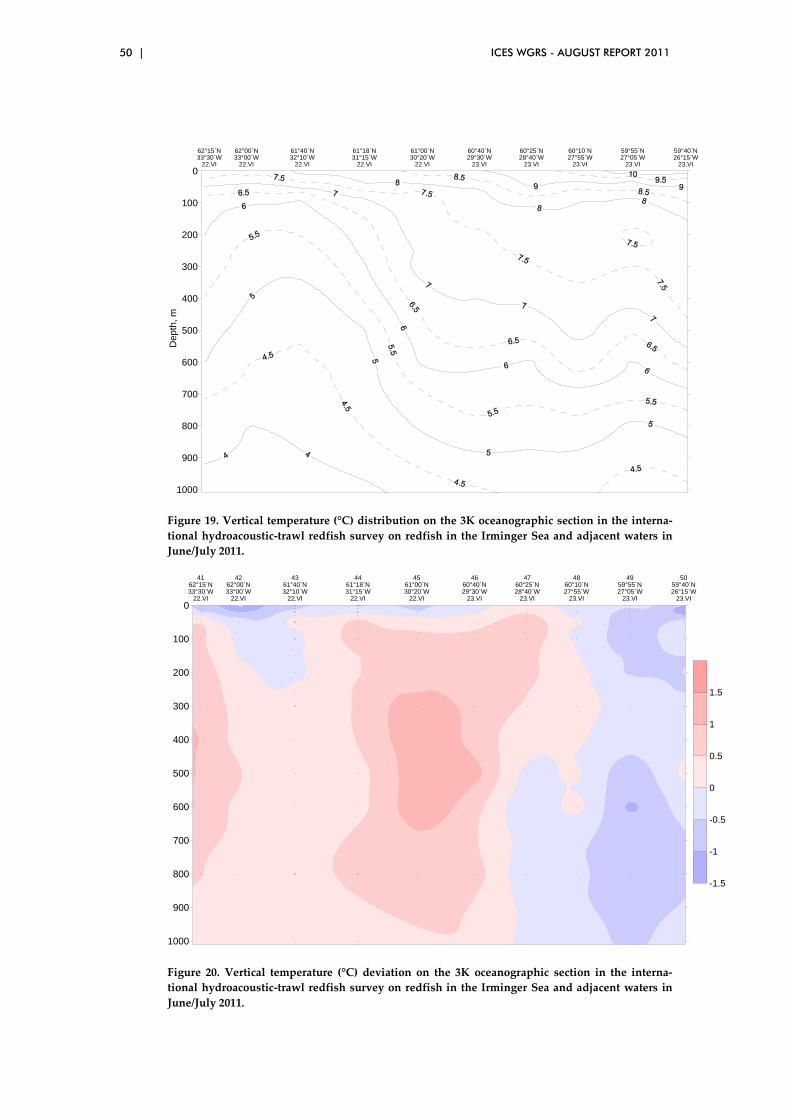
50 | ICES WGRS - AUGUST REPORT 2011
1000
900
800
700
600
500
400
300
200
100
0
62°15`N 62°00`N 61°40`N 61°18`N 61°00`N 60°40`N 60°25`N 60°10`N 59°55`N 59°40`N33°30`W 33°00`W 32°10`W 31°15`W 30°20`W 29°30`W 28°40`W 27°55`W 27°05`W 26°15`W
22.VI 22.VI 22.VI 22.VI 22.VI 23.VI 23.VI 23.VI 23.VI 23.VID
epth
, m
Figure 19. Vertical temperature (°C) distribution on the 3K oceanographic section in the interna-tional hydroacoustic-trawl redfish survey on redfish in the Irminger Sea and adjacent waters in June/July 2011.
62°15`N 62°00`N 61°40`N 61°18`N 61°00`N 60°40`N 60°25`N 60°10`N 59°55`N 59°40`N33°30`W 33°00`W 32°10`W 31°15`W 30°20`W 29°30`W 28°40`W 27°55`W 27°05`W 26°15`W
22.VI 22.VI 22.VI 22.VI 22.VI 23.VI 23.VI 23.VI 23.VI 23.VI
41 42 43 44 45 46 47 48 49 50
1000
900
800
700
600
500
400
300
200
100
0
-1.5
-1
-0.5
0
0.5
1
1.5
Figure 20. Vertical temperature (°C) deviation on the 3K oceanographic section in the interna-tional hydroacoustic-trawl redfish survey on redfish in the Irminger Sea and adjacent waters in June/July 2011.

ICES WGRS - AUGUST REPORT 2011 | 51
Annex 1: List of participants
Name Address Telephone/Fax E-mail
Alexey Astakhov
Knipovich Polar Research Institute of Marine Fisheries and Oceanography (PINRO) 6 Knipovitch Street 183763Murmansk Russian Federation
TEL: +7 8152 47 25 32 FAX: +7 8152 47 33 31
Yuri Bakay Knipovich Polar Research Institute of Marine Fisheries and Oceanography (PINRO) 6 Knipovich Street 183038 Murmansk Russian Federation
TEL: +7 8152 47 25 32 FAX: +7 8152 47 33 31
Matthias Bernreuther
vTI-Institute of Sea Fisheries, Palmaille 9 D-22767 Hamburg Germany
TEL: +49 40 38905–238 FAX: +49 40 38905–263
Eckhard Bethke vTI-Institute of Sea Fisheries, Palmaille 9 D-22767 Hamburg Germany
TEL: +49 40 38905–203 FAX: +49 40 38905–264
Valery Ignashkin
Knipovich Polar Research Institute of Marine Fisheries and Oceanography (PINRO) 6 Knipovich Street 183038 Murmansk Russian Federation
TEL: +7 8152 47 25 32 FAX: +7 8152 47 33 31
Alexey Karsakov
Knipovich Polar Research Institute of Marine Fisheries and Oceanography (PINRO) 6 Knipovich Street 183038 Murmansk Russian Federation
TEL: +7 8152 47 25 32 FAX: +7 8152 47 33 31
Kristján Kristinsson Chair
Marine Research Institute Skúlagata 4 PO Box 1390 121Reykjavík Iceland
TEL: +354 575 2000 FAX: +354 575 2001
52 | ICES WGRS - AUGUST REPORT 2011
Name Address Telephone/Fax E-mail
Viktor Popov Knipovich Polar Research Institute of Marine Fisheries and Oceanography (PINRO) 6 Knipovich Street 183038 Murmansk Russian Federation
TEL: +7 8152 47 25 32 FAX: +7 8152 47 33 31
Alexey Rolskiy Knipovich Polar Research Institute of Marine Fisheries and Oceanography (PINRO) 6 Knipovich Street 183038 Murmansk Russian Federation
TEL: +7 8152 45 05 68 FAX: +7 8152 47 33 31

ICES WGRS - AUGUST REPORT 2011 | 53
Annex 2: Agenda of the meeting
ICES Working Group on Redfish Surveys (WGRS) meeting Murmansk, Russia, 2–4 August 2011
Chair: Kristjan Kristinsson, Iceland
Provisional Agenda
ToR (Recommendation 2010/2/SSGESST03):
b. at the 2–4 August meeting report on the outcome of the 2011 Irminger Sea survey.
Tuesday, 2 August 2011
09:00 Start of the meeting
• Housekeeping, network access • Suggestions for venues of lunch breaks and dinner • Adoption of the agenda
09:30 Plenary:
• Discussion of logistic and technical issues during the survey o Coverage deficiencies due to damages, bad weather, lack of
time etc. o Deviations from survey planning (tracks, depth and duration
of trawling) o Hydroacoustics: transducer frequency and bandwidth, echo
counting(?), noise measurements o Biological sampling; unusual observations (?) o Hydrography: short description of the situation during the
survey • Other relevant observations during the survey (e.g. intensity of fishery
activities, reports on catch rates of the fleet, targeted areas, depth zones etc.)
o Genetic sampling o Sampling of S. mentella on the Greenland slope o Echosounder comparison
• Preliminary biomass and abundance estimates, draft of main tables and figures
• Reporting of length measurements (ToR b and c from the February meeting in 2011)
12:00–13:00 Lunch break
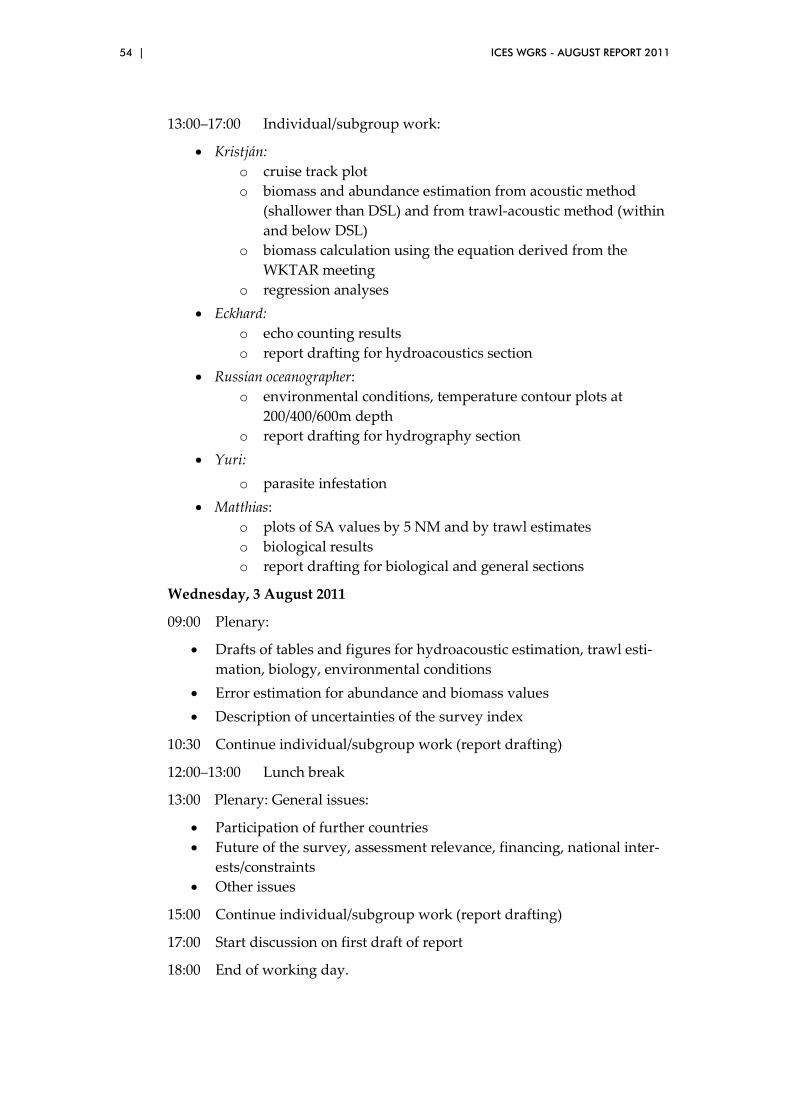
54 | ICES WGRS - AUGUST REPORT 2011
13:00–17:00 Individual/subgroup work:
• Kristján: o cruise track plot o biomass and abundance estimation from acoustic method
(shallower than DSL) and from trawl-acoustic method (within and below DSL)
o biomass calculation using the equation derived from the WKTAR meeting
o regression analyses • Eckhard:
o echo counting results o report drafting for hydroacoustics section
• Russian oceanographer: o environmental conditions, temperature contour plots at
200/400/600m depth o report drafting for hydrography section
• Yuri: o parasite infestation
• Matthias: o plots of SA values by 5 NM and by trawl estimates o biological results o report drafting for biological and general sections
Wednesday, 3 August 2011
09:00 Plenary:
• Drafts of tables and figures for hydroacoustic estimation, trawl esti-mation, biology, environmental conditions
• Error estimation for abundance and biomass values • Description of uncertainties of the survey index
10:30 Continue individual/subgroup work (report drafting)
12:00–13:00 Lunch break
13:00 Plenary: General issues:
• Participation of further countries • Future of the survey, assessment relevance, financing, national inter-
ests/constraints • Other issues
15:00 Continue individual/subgroup work (report drafting)
17:00 Start discussion on first draft of report
18:00 End of working day.
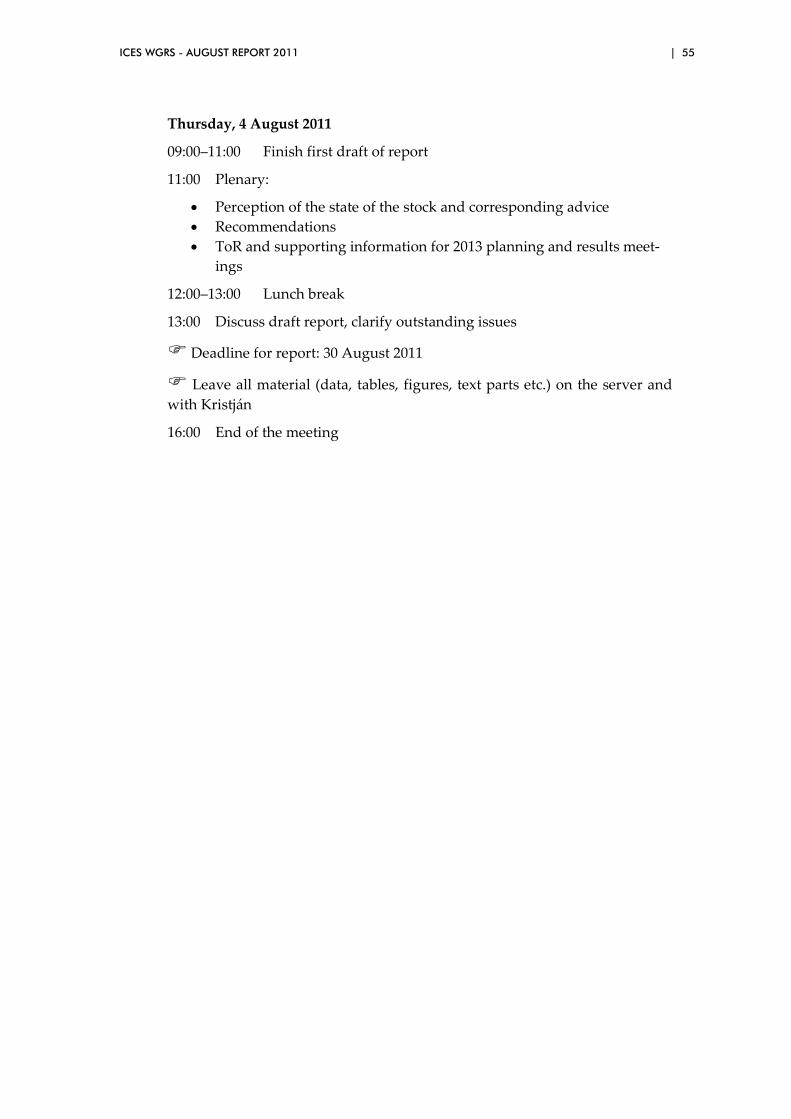
ICES WGRS - AUGUST REPORT 2011 | 55
Thursday, 4 August 2011
09:00–11:00 Finish first draft of report
11:00 Plenary:
• Perception of the state of the stock and corresponding advice • Recommendations • ToR and supporting information for 2013 planning and results meet-
ings
12:00–13:00 Lunch break
13:00 Discuss draft report, clarify outstanding issues
Deadline for report: 30 August 2011
Leave all material (data, tables, figures, text parts etc.) on the server and with Kristján
16:00 End of the meeting
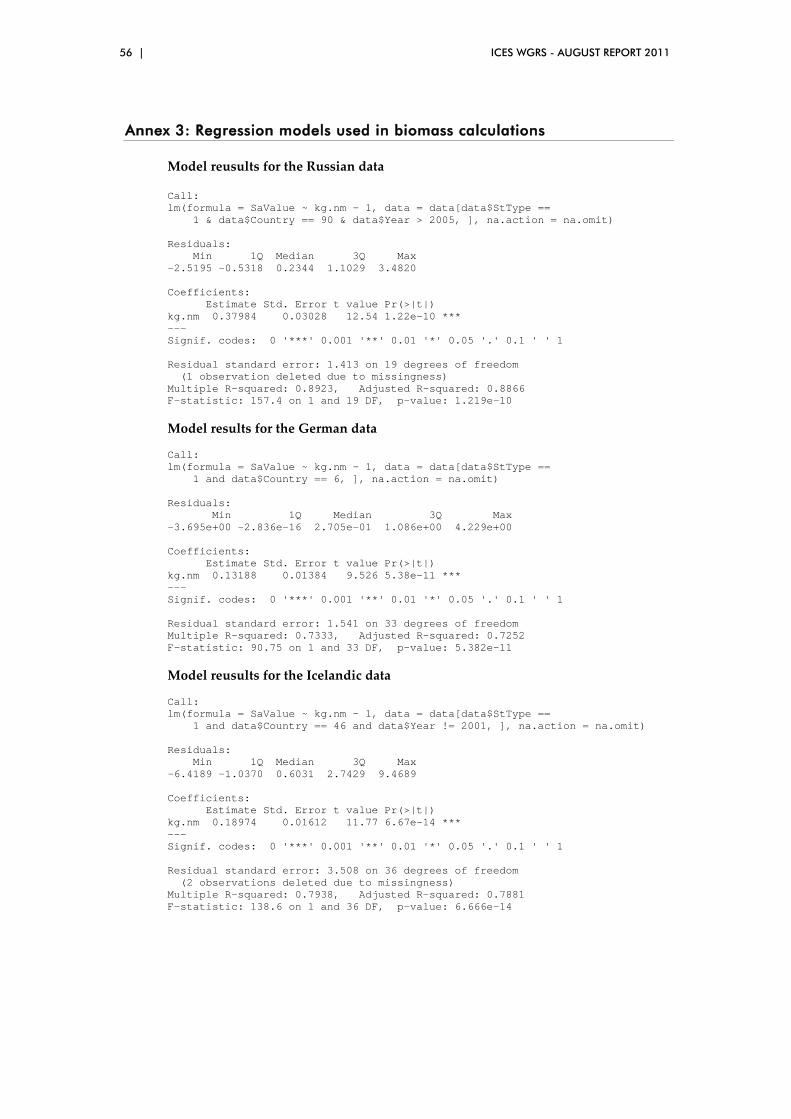
56 | ICES WGRS - AUGUST REPORT 2011
Annex 3: Regression models used in biomass calculations
Model reusults for the Russian data Call: lm(formula = SaValue ~ kg.nm - 1, data = data[data$StType == 1 & data$Country == 90 & data$Year > 2005, ], na.action = na.omit) Residuals: Min 1Q Median 3Q Max -2.5195 -0.5318 0.2344 1.1029 3.4820 Coefficients: Estimate Std. Error t value Pr(>|t|) kg.nm 0.37984 0.03028 12.54 1.22e-10 *** --- Signif. codes: 0 '***' 0.001 '**' 0.01 '*' 0.05 '.' 0.1 ' ' 1 Residual standard error: 1.413 on 19 degrees of freedom (1 observation deleted due to missingness) Multiple R-squared: 0.8923, Adjusted R-squared: 0.8866 F-statistic: 157.4 on 1 and 19 DF, p-value: 1.219e-10
Model results for the German data Call: lm(formula = SaValue ~ kg.nm - 1, data = data[data$StType == 1 and data$Country == 6, ], na.action = na.omit) Residuals: Min 1Q Median 3Q Max -3.695e+00 -2.836e-16 2.705e-01 1.086e+00 4.229e+00 Coefficients: Estimate Std. Error t value Pr(>|t|) kg.nm 0.13188 0.01384 9.526 5.38e-11 *** --- Signif. codes: 0 '***' 0.001 '**' 0.01 '*' 0.05 '.' 0.1 ' ' 1 Residual standard error: 1.541 on 33 degrees of freedom Multiple R-squared: 0.7333, Adjusted R-squared: 0.7252 F-statistic: 90.75 on 1 and 33 DF, p-value: 5.382e-11
Model reusults for the Icelandic data Call: lm(formula = SaValue ~ kg.nm - 1, data = data[data$StType == 1 and data$Country == 46 and data$Year != 2001, ], na.action = na.omit) Residuals: Min 1Q Median 3Q Max -6.4189 -1.0370 0.6031 2.7429 9.4689 Coefficients: Estimate Std. Error t value Pr(>|t|) kg.nm 0.18974 0.01612 11.77 6.67e-14 *** --- Signif. codes: 0 '***' 0.001 '**' 0.01 '*' 0.05 '.' 0.1 ' ' 1 Residual standard error: 3.508 on 36 degrees of freedom (2 observations deleted due to missingness) Multiple R-squared: 0.7938, Adjusted R-squared: 0.7881 F-statistic: 138.6 on 1 and 36 DF, p-value: 6.666e-14
ICES WGRS - AUGUST REPORT 2011 | 57
Annex 4: WGRS Terms of Reference for the 2013 meeting (not finished)
The Working Group on Redfish Surveys (WGRS), chaired by Benjamin Planque, Norway and Kristján Kristinsson, Iceland, will meet at ICES HQ, Copenhagen, Denmark, from (dates to be decided) January 2013, in [venue to be decided] (dates to be de-cided) July 2013 (to be confirmed), and in [venue to be decided] (dates to be de-cided) September 2013 (to be confirmed) to:
a ) plan the international trawl/acoustic survey of redfish to be carried out in the Irminger Sea and adjacent waters in June/July 2013 (January meeting);
b ) plan the international trawl/acoustic survey of redfish to be carried out in the Norwegian Sea and adjacent waters in August 2013 (January meeting);
c ) prepare the report on the outcome of the 2013 Irminger Sea survey (July meeting);
d ) prepare the report on the outcome of the 2013 Norwegian Sea survey (Sep-tember meeting)
WGRS will report by 15 March 2013 (January meeting), 15 August 2013 (July meet-ing), and 15 September 2013 (September meeting) for the attention of the SCICOM and ACOM.
58 | ICES WGRS - AUGUST REPORT 2011
Supporting Information
Priority Essential, primary basis for the advice on the stock status of pelagic redfish in the Irminger Sea and adjacent waters.
Scientific Justification This group was previously the Study Group on Redfish Stocks [SGRS] and the remit was slightly changed to the Planning Group on Redfish Surveys [PGRS] in 2009 then Working Group on Redfish Surveys [WGRS] in 2010. WGRS is responsible for the planning and reporting of the international hydroacoustic-trawl surveys on pelagic redfish (Sebastes mentella) in the Irminger Sea and Norwegian Sea. Redfish in the Norwegian Sea has been fished in an Olympic fishery by an international fleet since 2005. Since 2007, ICES has advised a protection of juveniles, no directed trawl fishery and low bycatch limits for S. mentella in Sub-areas I and II. NEAFC has, since 2007, set a TAC for pelagic S. mentella in this area. The unknown stock size and its relations to other S. mentella stocks have evoked the immediate need for an international survey on redfish in the Norwegian Sea and adjacent waters. WGRS (formerly PGRS/SGRS) has been responsible for the planning of the international trawl/acoustic surveys of redfish in the Irminger Sea and adjacent waters since 1994 and corresponding reports on the survey results. The observed drastic changes in abundance and biomass estimates since 1994 and considerable changes in environmental conditions in recent years confirm the need of precise monitoring of the redfish in the distribution area. WGRS, however, repeatedly faced the problem of a large spacing between hydroacoustic survey tracks and between trawl hauls due to the large survey area (about 400 000 square nautical miles) that has to be covered with only two or three vessels currently participating in the survey. In order to reach a sufficient density of survey tracks and trawls, PGRS recommended (ICES CM 2007/D:03) that “as many vessels as possible (at least four) should participate to improve the quality of the derived estimates. Thus, the efforts directed at involving other nations in the survey should be continued.” Consequently, the potential countries were requested to consider a participation in the redfish survey in June/July 2007. This request was repeated in 2008 and 2011 without success. In 2007 and 2009, only 2 vessels participated in the survey which is insufficient for data quality for the assessment.
Relation to Strategic Plan Provide sound, credible, timely, peer-reviewed, and integrated scientific advice on fishery management and the protection of the marine environment in response to requests from regulatory commissions, Member Countries, and partner organizations.
Resource Requirements N/A
Participants <10 (incl. the cruise leaders of each vessel and the principle experts involved in abundance and biomass calculations)
Secretariat Facilities N/A
Financial None
Linkages to Advisory Committees
ACOM, SSGESST
Linkages to other Committees or Groups
NWWG, AFWG
Linkages to other Organisations
NAFO, NEAFC
ICES WGRS - AUGUST REPORT 2011 | 59
Annex 5: Recommendations
Recommendation Action
Continue international trawl-acoustic survey on pelagic redfish in the Irminger Sea and adjacent waters; keep survey frequency (every second year); participation of as many vessels as possible; keep timing of the survey (June/July).
ICES Secretariat, ICES Delegates, ICES Member Countries
Consider 2011 survey results for advice on pelagic redfish (shallow and deep stocks) to be given in October 2011.
ACOM, NWWG
Involve further nations in the next surveys; Consider chartering of additional vessels and cost share.
ICES Secretariat, ICES Delegates
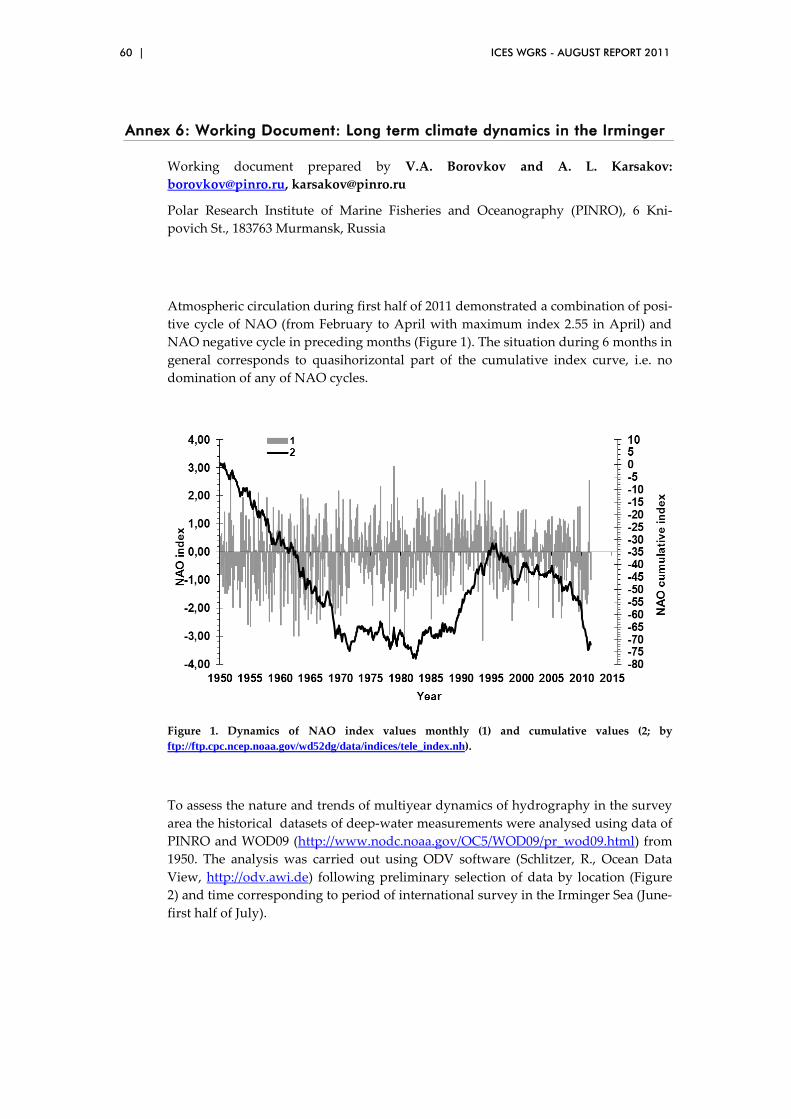
60 | ICES WGRS - AUGUST REPORT 2011
Annex 6: Working Document: Long term climate dynamics in the Irminger
Working document prepared by V.A. Borovkov and A. L. Karsakov: [email protected], [email protected]
Polar Research Institute of Marine Fisheries and Oceanography (PINRO), 6 Kni-povich St., 183763 Murmansk, Russia
Atmospheric circulation during first half of 2011 demonstrated a combination of posi-tive cycle of NAO (from February to April with maximum index 2.55 in April) and NAO negative cycle in preceding months (Figure 1). The situation during 6 months in general corresponds to quasihorizontal part of the cumulative index curve, i.e. no domination of any of NAO cycles.
Figure 1. Dynamics of NAO index values monthly (1) and cumulative values (2; by ftp://ftp.cpc.ncep.noaa.gov/wd52dg/data/indices/tele_index.nh).
To assess the nature and trends of multiyear dynamics of hydrography in the survey area the historical datasets of deep-water measurements were analysed using data of PINRO and WOD09 (http://www.nodc.noaa.gov/OC5/WOD09/pr_wod09.html) from 1950. The analysis was carried out using ODV software (Schlitzer, R., Ocean Data View, http://odv.awi.de) following preliminary selection of data by location (Figure 2) and time corresponding to period of international survey in the Irminger Sea (June-first half of July).

ICES WGRS - AUGUST REPORT 2011 | 61
Figure 2. Position of areas in the central part of the Irminger Sea (black contour) and Reykjanes Ridge (red contour). Lines show isobaths 2000, 2500 and 3000 m.
Results of the assessment show that both areas demonstrate similarity in nature of multiyear dynamics of hydrography and pattern of increased and reduced tempera-ture and salinity (see Figure 3). Conditions associated with increase temperature and salinity values correlate to periods mid 1950s to mid 1970s and late 1990s up to the present, whereas relative cooling of undersurface layer and decreased salinity were observed from mid 1970s to mid 1990s.
Hydrography surveys of 2011 show that the increased temperature background is still in place in the survey area on the level specific for warm and moderately warm years. However as compared to 2007 and 2009 surveys the heat capacity reduction trend is observed. The above mentioned trends may affect spatial distribution of ma-jor concentrations of the beaked redfish both in horizontal and vertical planes.
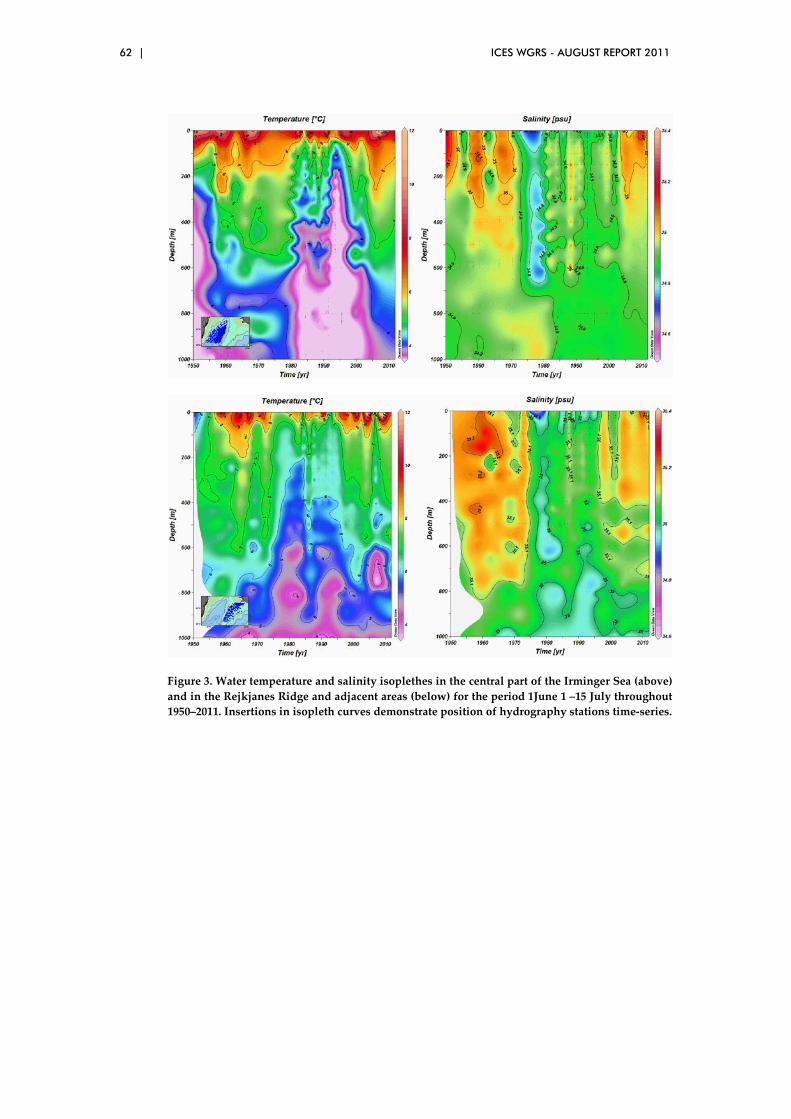
62 | ICES WGRS - AUGUST REPORT 2011
Figure 3. Water temperature and salinity isoplethes in the central part of the Irminger Sea (above) and in the Rejkjanes Ridge and adjacent areas (below) for the period 1June 1 –15 July throughout 1950–2011. Insertions in isopleth curves demonstrate position of hydrography stations time-series.