Embed Size (px)
Citation preview

ICICI Prudential PMS Flexicap Portfolio
A series under "Aggressive" Portfolio
All data/information used in the preparation of this material is dated and may or may not be relevant any time after the issuance of this material. ICICI Prudential Asset Management Company Limited (the
Portfolio Manager/ the AMC) takes no responsibility of updating any data/information in this material from time to time. The recipient of this material is solely responsible for any action taken based on this
material. The information contained herein are strictly confidential and are meant solely for the benefit of the addressee and shall not be altered in any way, transmitted to, copied or distributed, in part or in
whole, to any other person or to the media or reproduced in any form, without prior written consent of the AMC. Further, the information contained herein should not be construed as forecast or promise. Past
performance of the Portfolio Manager may not be indicative of the performance in the future. Please refer to page 15 & 16 for risk factors and disclaimers.

Global Indices Performance – India surges ahead
• Indian markets rose by 7.8%
on the back of increased FII
flows to the tune of Rs. 33,116
Crs
• With China markets
experiencing a slowdown last
year, the economy is gradually
reviving owing to monetary
expansion policies and heavy
infrastructure investments
thus aiding growth
Germany - DAX Index; China - SSE Composite Index; France - CAC 40 Index; Japan - Nikkei; Eurozone - Euronext 100; Hong Kong - HangSeng; US - Dow Jones; Singapore - Strait Times; Russia - RTS Index; Indonesia - Jakarta Composite Index; U.K. - FTSE; South
Korea - Kospi; Brazil - Ibovespa Sao Paulo Index; Indonesia – Jakarta Composite Index; Switzerland – Swiss Market Index; Taiwan – Taiwan Stock Exchange Corporation; India – S&P BSE Sensex; Returns in % terms. Data Source: MFI; Returns are absolute returns for
the PRI variant of the index calculated between Feb 28, 2019 – March 29, 2019. Past performance may or may not be sustained in future
7.8
5.1
2.9 2.8 2.3 2.1
1.5 0.9 0.8
0.4 0.1 0.0 0.0
-0.2 -0.8
-2.5 -4
-2
0
2
4
6
8
10
India
Chin
a
UK
Taiw
an
Europe
Fran
ce
Hong K
ong
Sw
itzerla
nd
Russia
Indo
nesia
Germ
any
US
Sin
gapore
Brazil
Japan
South K
orea
Returns (
%)
Returns Performance - March 2019
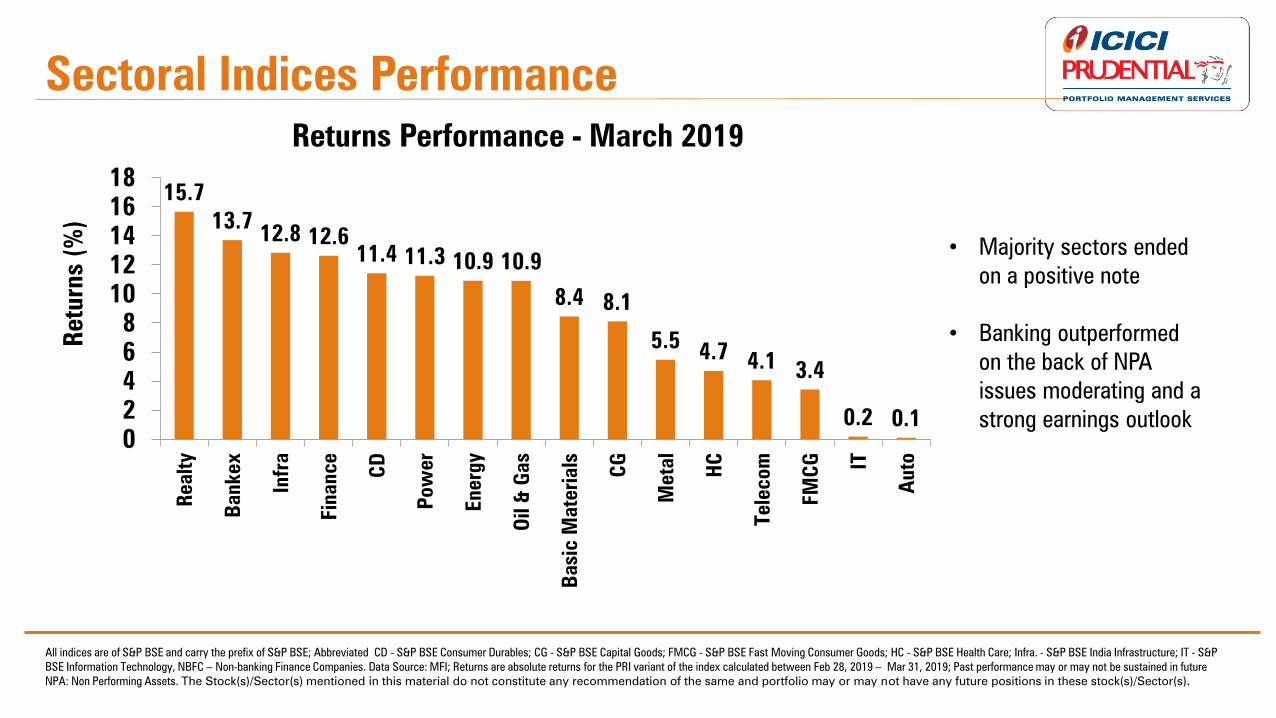
Sectoral Indices Performance
All indices are of S&P BSE and carry the prefix of S&P BSE; Abbreviated CD - S&P BSE Consumer Durables; CG - S&P BSE Capital Goods; FMCG - S&P BSE Fast Moving Consumer Goods; HC - S&P BSE Health Care; Infra. - S&P BSE India Infrastructure; IT - S&P
BSE Information Technology, NBFC – Non-banking Finance Companies. Data Source: MFI; Returns are absolute returns for the PRI variant of the index calculated between Feb 28, 2019 – Mar 31, 2019; Past performance may or may not be sustained in future
NPA: Non Performing Assets. The Stock(s)/Sector(s) mentioned in this material do not constitute any recommendation of the same and portfolio may or may not have any future positions in these stock(s)/Sector(s).
• Majority sectors ended
on a positive note
• Banking outperformed
on the back of NPA
issues moderating and a
strong earnings outlook
15.7
13.7 12.8 12.6
11.4 11.3 10.9 10.9
8.4 8.1
5.5 4.7
4.1 3.4
0.2 0.1
0
2
4
6
8
10
12
14
16
18R
ealt
y
Ban
kex
In
fra
Fin
an
ce
CD
Po
wer
Energy
Oil &
Gas
Basic
Materia
ls
CG
Metal
HC
Tele
com
FM
CG IT
Au
to
Returns (
%)
Returns Performance - March 2019

RESERVE BANK OF INDIA
• India’s GDP growth estimates for FY 2018-19 revised
downwards to 7.0% from 7.2% earlier
• RBI cut repo rates by 25 bps to 6.0% to support
growth and meet inflation target of 4%
Global Growth Concerns
Uncertainty about growth weighed on the minds of central banks everywhere resulting in them adopting a cautious stance.
US FEDERAL RESERVE BANK
• The Fed lowered its GDP
growth forecast (2.1% to
2.3% earlier for 2019) &
inflation expectations
• Adopted a dovish stance of
not hiking rates further in
2019
EUROPEAN CENTRAL BANK
• Weakening economic data
points to a sizeable
moderation in pace of
economic expansion &
underlying inflation continues
to be muted
• Interest Rates to remain
unchanged throughout 2019
Source: RBI, European Central Bank, US Federal Reserve Monetary Policy Meet Minutes

Growth Numbers
Change in US Fed Stance and Opinion Poll Comfort led to record FPI flows (best since March-16). Going forward, FPI
flows could get volatile depending on stability of the new government and Global Central Bank Policies
Source: SEBI, BSE, CDSL, Morgan Stanley Research; Data as of March 31, 2019. FPI: Foreign Portfolio Investor.
21,143
-18,244
30,906
11,654
-28,921
33,981
-40,000
-30,000
-20,000
-10,000
0
10,000
20,000
30,000
40,000
Mar-16
Sep-16
Mar-17
Sep-17
Mar-18
Sep-18
Mar-19
FP
I F
low
s (
In I
NR
Crs.)
FPI Equity Flows (INR Crs)

Key Features
The investment strategy, approach and the structure of the portfolio herein involves risk and there can be no assurance that specific objectives will be met under differing market conditions or cycles.
The investment strategy and the composition of the portfolio as stated herein is only indicative in nature and is subject to change within the provisions of the disclosure document and client
agreement without any prior notice to investors. Please refer to the disclosure document & client agreement for details and risk factors.
The Satellite will be blend of strategies such as Special Situation,
GARP (Growth at Reasonable Price) Philosophy, thematic etc. This
bucket will be used opportunistically to book profit and increase
weight of Core Portfolio.
Core comprises of approximately 60%-70% of the Portfolio. The
core is predominantly targeted towards sectors which are value on a
relative or absolute basis.
Portfolio Strategy
Satellite
Core
• A focused portfolio of 20-25 stock ideas
• Investment Horizon : 3 Years & Above
• Benchmark Index: S & P BSE 200
• Minimum Investment Amount: Rs. 25,00,000

Data source: MFI Explorer; Calendar Year Absolute Performance.
Can you predict which market-cap segment will outperform?
Flexi cap approach
gives flexibility to
Portfolio manager to
move between the
different segments of
the market.
Why Flexicap Approach?
Calendar Year Nifty Mid Small
Cap 400 Nifty Midcap 50 Nifty 50
2018 -18% -11% 3%
2017 55% 51% 29%
2016 4% 7% 3%
2015 9% 1% -4%
2014 63% 46% 31%
2013 -5% -3% 7%
2012 42% 35% 27%
2011 -33% -40% -25%
2010 18% 10% 18%
2009 112% 100% 76%
2008 -67% -65% -52%
2007 82% 71% 54%
2006 28% 25% 40%

Stock Selection Process:
Portfolio uses blend of Top
Down and Bottom-up
approach.
Top-
Down
Bottom
Up
• Top-down approach: Identify key macroeconomic and sectorial
themes and subsequently help identify stocks.
• Bottom-up approach: Believes that individual companies providing
attractive investment opportunities exist in various industries and
market conditions.
• Prominence among the two would vary from time to time depending
on macroeconomic, sectorial and company specific fundamentals.
• The Core Portfolio predominantly invest to capture underlying
value of the business which gets “unlocked” over a period of time.
• The Satellite Portfolio is tactically managed aiming to take advantage of
market trend.
• Rebalancing: Portfolio aims to systematically increase weightage as
risk reward ratio improves in core portfolio by reducing satellite
portfolio weight.
The investment strategy as stated herein is only indicative in nature and is subject to change within the provisions of the disclosure document and client agreement without any prior notice to
investors. Please refer to the disclosure document & client agreement for details and risk factors.
Investment Strategy

Investment Universe
Broad-based market
cap range.
Investment
Concentration
Diversified across
marketcap and sectors.
Concentrated Portfolio of
20-30 stocks.
Investment Style
Core and Satellite
Approach. Blend of
Value & Growth.
Prominence varies
with microeconomic,
sectoral and
company specific
fundamentals
Benchmark
Agnostic Blend
Flexicap Top Down
+
Bottom
Up
Investment Style
Investment Approach

• ICICI Prudential PMS Flexicap Portfolio currently focuses on large cap quality & counter cyclical bets as compared to Midcaps.
• In periods of huge outperformance of midcaps/smallcaps over large caps, the portfolio looks to tilt its exposure towards high
quality large caps, similarly when midcaps/small caps underperform largecaps, the portfolio would look at increasing the exposure
in midcaps and small caps.
• In cricketing terms, there is a consistent player and there is an aggressive player. We believe, in long run a consistent player
generally may outperform an aggressive player (as measured by his batting average).
The table shown above is for illustration purpose only.
• A consistent player performs according to the different pitch and game conditions, similarly ICICI Prudential PMS Flexicap Portfolio
has outperformed its benchmark at various point of time, as showcased below:
T20 ODI Test
Consistent Performer 31 39 52
Aggressive Performer 22 35 49
Consistent’s performance vs.
Aggressive’s performance 41% 11% 6%
Past performance may or may not be sustained in future. Calendar year return in absolute terms.
2018 2017 2016 2015 2014 2013 2012
ICICI Prudential PMS Flexicap Portfolio -5.93 34.89 7.49 0.58 61.71 13.08 39.43
S&P BSE 200 -0.54 33.26 3.95 -1.48 35.47 4.38 30.98
The portfolio performance mentioned above is of benchmark client and the performance of an individual clients may vary significantly from the above.
How consistency helps in long run

Portfolio is tilted towards Large cap due
to relatively attractive valuations.
Top 10 Holdings
Stocks % to Net Assets
Axis Bank Ltd 7.28
HDFC Bank Ltd 6.55
Cipla Ltd 5.47
State Bank of India 5.28
ICICI Bank Ltd 4.82
Motherson Sumi Systems Ltd 4.64
Infosys Ltd 4.49
Orient Electric Limited 4.39
Bajaj Finserv Ltd 4.16
SBI Life Insurance Company Limited 3.92
Market Capitalization Break-up
The Stock(s)/Sector(s) mentioned in this material do not constitute any recommendation of the same and portfolio may or may not have any future positions in these stock(s)/Sector(s).
Data as on 29th
Mar, 2019.
The data mentioned above is of a benchmark client and data of an individual client may vary significantly from the above.
Current Positioning
Large
cap,
66.2
Mid
cap,
10.3
Small
cap,
23.5

• Bottoming of NPA Cycle.
• Passage of bankruptcy code
Chemicals / APIs Financials
•China’s actions on
environmental front
•Supply demand
mismatch. Positive
for local players
•On long term basis
exporters may
continue to gain in
key segments like
IT, Pharma, Auto
Ancillaries
•Bottoming of NPA
Cycle
•Passage of
bankruptcy code
• Increased
Consumption
•Navin Fluorine
International
•Dishman Carbogen
•Axis Bank
•HDFC Bank
•SBI
• ICICI Bank
•Bajaj Finserv
•Motherson Sumi
Systems Ltd
• Infosys Ltd
•Cipla
Core Strategy Core Strategy Core Strategy
Domestic Consumption
•Demographics
• Improved outlook on
rural
•GST Play
•Orient Electric
• Inox Leisure Ltd
•Blue Star
•Voltas
Satellite Strategy
The Stock(s)/Sector(s) mentioned in this material do not constitute any recommendation of the same and portfolio may or may not have any future positions in these stock(s)/Sector(s). API: Active
Pharmaceuticals Ingredients.
Data as on 29th
Mar, 2019
Bottom-up Ideas
•Special Situations
•Favourable Macro-
economic factors
•Potential market
share gain in
medium term
•Bharti Airtel
Exports Basket
Satellite Strategy
Current Theme
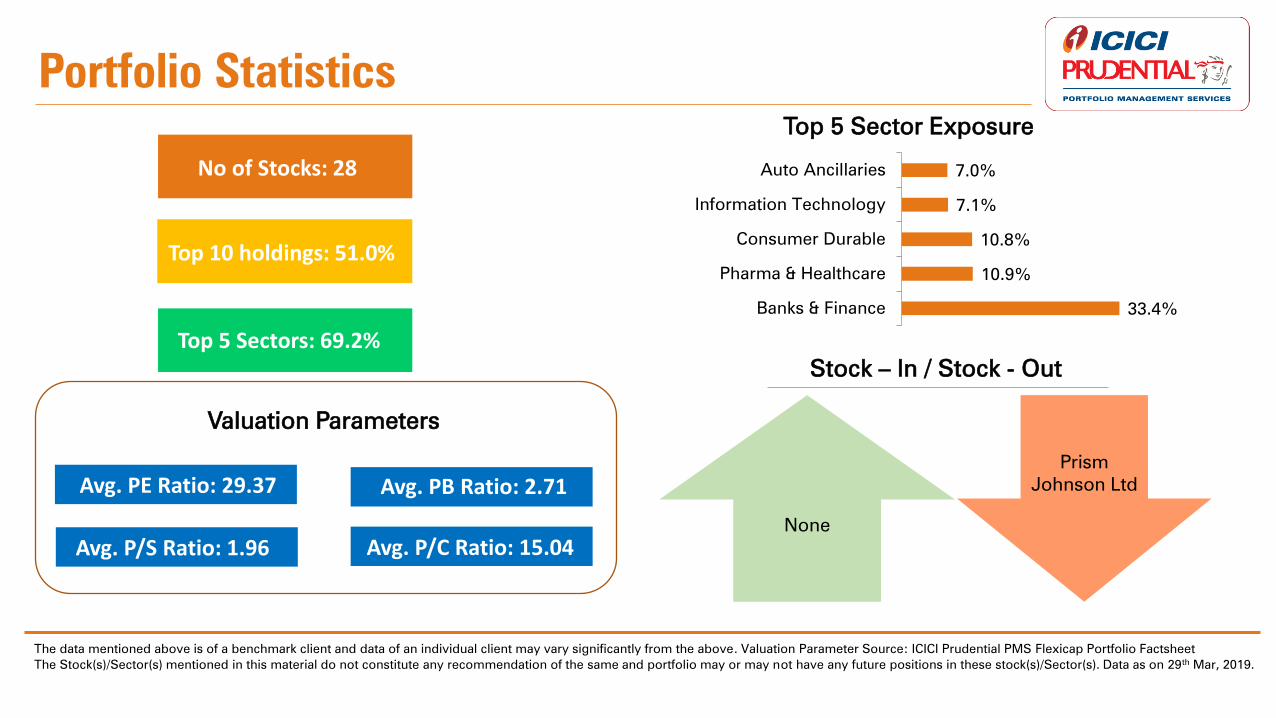
No of Stocks: 28
Top 5 Sectors: 69.2%
Top 10 holdings: 51.0%
Avg. PE Ratio: 29.37 Avg. PB Ratio: 2.71
Valuation Parameters
Avg. P/S Ratio: 1.96 Avg. P/C Ratio: 15.04
Top 5 Sector Exposure
Stock – In / Stock - Out
None
Prism
Johnson Ltd
The Stock(s)/Sector(s) mentioned in this material do not constitute any recommendation of the same and portfolio may or may not have any future positions in these stock(s)/Sector(s). Data as on 29th
Mar, 2019.
The data mentioned above is of a benchmark client and data of an individual client may vary significantly from the above. Valuation Parameter Source: ICICI Prudential PMS Flexicap Portfolio Factsheet
Portfolio Statistics
33.4%
10.9%
10.8%
7.1%
7.0%
Banks & Finance
Pharma & Healthcare
Consumer Durable
Information Technology
Auto Ancillaries

-
5,00,00,000
10,00,00,000
15,00,00,000
20,00,00,000
25,00,00,000
30,00,00,000
ICICI Prudential PMS Flexicap Portfolio S&P BSE 200
Dot-Com
Bubble
Fall of
NDA-I
Govt
LME Price
Crashed. Increase
in US Fed Rates Bull Phase
Global
Financial
Crisis
European
Debt Crises
Rupee
Depreciation
Rally Pre and Post
Union Election
Value rebased to INR 10,000,000.
Data as on 29th
Mar, 2019. Past performance may or may not be sustained in future. The return mentioned above is the return of the oldest client of the portfolio. Further, the portfolio value is re-based
as and when applicable. The portfolio performance mentioned above is of benchmark client and the performance of an individual clients may vary significantly from the above
Growth of Rs.1,00,00,000/-
25,54,21,304
11,49,63,690
19 Years of Track Record
Data as on 29th
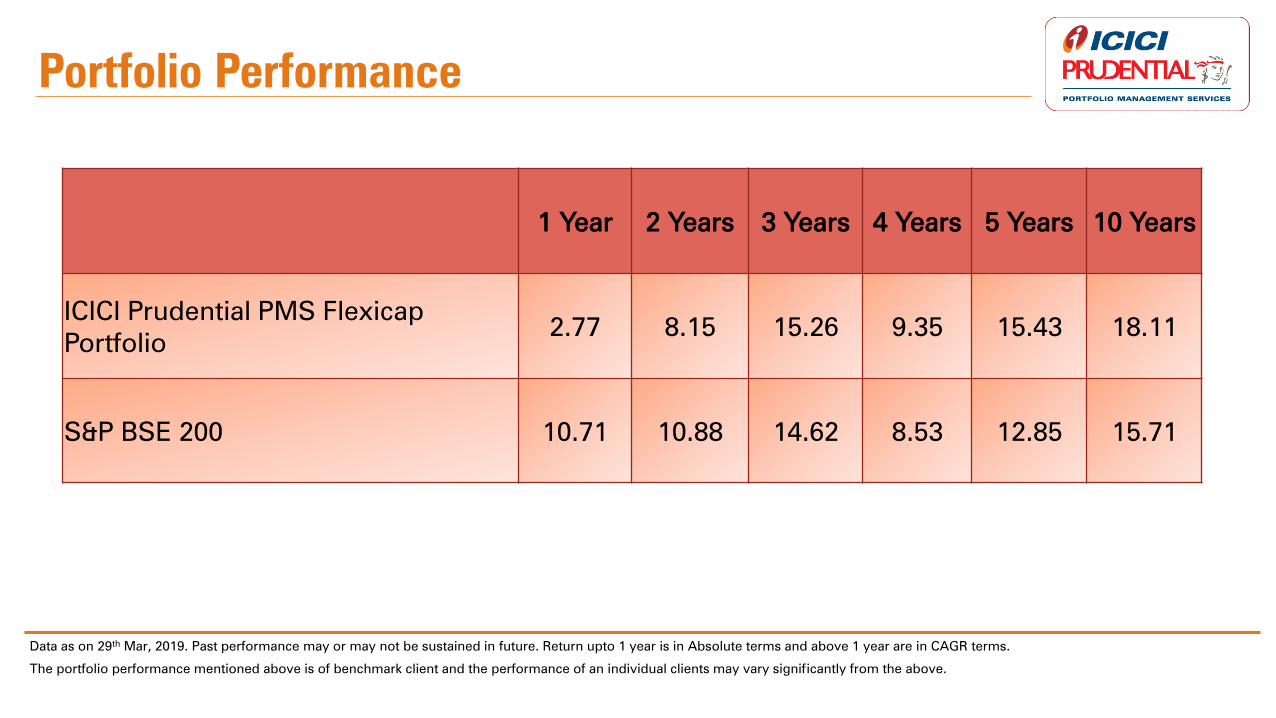
Mar, 2019. Past performance may or may not be sustained in future. Return upto 1 year is in Absolute terms and above 1 year are in CAGR terms.
1 Year 2 Years 3 Years 4 Years 5 Years 10 Years
ICICI Prudential PMS Flexicap
Portfolio 2.77 8.15 15.26 9.35 15.43 18.11
S&P BSE 200 10.71 10.88 14.62 8.53 12.85 15.71
The portfolio performance mentioned above is of benchmark client and the performance of an individual clients may vary significantly from the above.
Portfolio Performance

An Irrational
Market
Sentiment
Investing in securities involves certain risks and considerations associated generally with making investments in securities. The value of the portfolio investments may be affected
generally by factors affecting financial markets, such as price and volume, volatility in interest rates, currency exchange rates, changes in regulatory and administrative policies of the
Government or any other appropriate authority (including tax laws) or other political and economic developments. Consequently, there can be no assurance that the objective of the
Portfolio would be achieved. The value of the portfolios may fluctuate and can go up or down. The Stock(s)/Sector(s) mentioned in this material do not constitute any
recommendation of the same and the portfolios may or may not have any future positions in these Stock(s)/Sector(s).
The composition of the portfolio is subject to changes within the provisions of the disclosure document. The benchmark of the portfolios can be changed from time to time in the
future. The inability of the Portfolio Manager to make intended securities purchases due to settlement problems could cause the portfolio to miss certain investment opportunities. By
the same rationale, the inability to sell securities held in the portfolio due to the absence of a well-developed and liquid secondary market for securities would result, at times, in
potential losses to the portfolio. Please note that past performance of the financial products, instruments and the portfolio does not necessarily indicate the future prospects and
performance thereof. Such past performance may or may not be sustained in future. Portfolio Manager’s investment decisions may not be always profitable, as actual market
movements may be at variance with anticipated trends. The investors are not being offered any guaranteed or assured returns. The AMC may be engaged in buying/selling of such
securities. Please refer to the Disclosure Document and Client Agreement for portfolio specific risk factors.
Individual returns of Clients for a particular portfolio type may vary significantly from the data on performance of the portfolios as may be depicted by the Portfolio Manager from
time to time. This is due to factors such as timing of entry and exit, timing of additional flows and redemptions, individual client mandates, specific portfolio construction
characteristics or structural parameters, which may have a bearing on individual portfolio performance. No claims may be made or entertained for any variances between the
performance depictions and individual portfolio performance. Neither ICICI Prudential Asset Management Company Ltd. (the AMC) nor its Directors, Employees or Sponsors shall be
in any way liable for any variations noticed in the returns of individual portfolios.
The Client shall not make any claim against the Portfolio Manager against any losses (notional or real) or against any loss of opportunity for gain under various PMS Products, on
account of or arising out of such circumstance/ change in market condition or for any other reason which may specifically affect a particular sector or security.]
Risk Factors & Disclaimers
An Irrational
Market
Sentiment
The Portfolio Manager shall have the sole and absolute discretion to invest in respect of the Client’s investment in any type of security subject to the Agreement and as stated in the
Disclosure Document and make such changes in the investments and invest some or all of the Client’s investment amount in such manner and in such markets as it deems fit would
benefit the Client. The Portfolio Manager’s decision (taken in good faith) in deployment of the Clients’ account is absolute and final and can never be called in question or be open to
review at any time during the currency of the agreement or any time thereafter except on the ground of malafide, fraud, conflict of interest or gross negligence. This right of the
Portfolio Manager shall be exercised strictly in accordance with the relevant Acts, rules and regulations, guidelines and notifications in force from time to time.
By their nature, certain market risk disclosures are only estimates and could be materially different from what actually occurs in the future. As a result, actual future gains or losses
could materially differ from those that have been estimated. The recipient(s) alone shall be fully responsible/are liable for any decision taken on the basis of this material. All recipients
of this material should before dealing and/or transacting in any of the products referred to in this material make their own investigation, seek appropriate professional advice. The
investments discussed in this may not be suitable for all investors. Financial products and instruments are subject to market risks and yields may fluctuate depending on various
factors affecting capital/debt markets. There is no assurance or guarantee that the objectives of the portfolio will be achieved. Please note that past performance of the financial
products, instruments and the portfolio does not necessarily indicate the future prospects and performance thereof. Such past performance may or may not be sustained in future.
Portfolio Manager’s investment decisions may not be always profitable, as actual market movements may be at variance with anticipated trends. The investors are not being offered
any guaranteed or assured returns.
In the preparation of this material the AMC has used information that is publicly available, including information developed in-house. Some of the material used herein may have
been obtained from members/persons other than the AMC and/or its affiliates and which may have been made available to the AMC and/or to its affiliates. Information gathered and
material used herein is believed to be from reliable sources. The AMC however does not warrant the accuracy, reasonableness and/or completeness of any information. For data
reference to any third party in this material no such party will assume any liability for the same. We have included statements/opinions/recommendations in this material, which
contain words, or phrases such as “will”, “expect”, “should”, “believe” and also PE ratios, EPS and Earnings Growth for forthcoming years and similar expressions or variations of
such expressions, that are “forward looking statements”. Actual results may differ materially from those suggested by the forward looking statements due to risk or uncertainties
associated with our expectations with respect to, but not limited to, exposure to market risks, general economic and political conditions in India and other countries globally, the
monitory and interest policies of India, inflation, unanticipated turbulence in interest rates, foreign exchange rates, equity prices, the performance of the financial markets in India and
globally, changes in domestic and foreign laws, regulations and taxes and changes in competition in the industry.
All data/information used in the preparation of this material is dated and may or may not be relevant any time after the issuance of this material. The Portfolio Manager/ the AMC
takes no responsibility of updating any data/information in this material from time to time. The Portfolio Manager/ the AMC (including its affiliates), and any of its officers directors,
personnel and employees, shall not liable for any loss, damage of any nature, including but not limited to direct, indirect, punitive, exemplary, consequential, as also any loss of profit
in any way arising from the use of this material in any manner
Risk Factors & Disclaimers

Thank You