Embed Size (px)
Citation preview
8/2/2019 ICM Weekly Strategic Plan
http://slidepdf.com/reader/full/icm-weekly-strategic-plan 1/20
ICM Weekly Strategic Plan – Feb 6 2012
Interesting week just past as equity markets continued to finish January strong, a Greek refinancing deal
is done/not done ( choose one then choose again), several economic releases disappoint slightly and
then Non-Farm Payrolls and unemployment surprise big though with a few questions.
Liquidity Cycle
The liquidity cycle indicator is giving us reason get on board the equity run as it highlights a shift in
money flows. Let’s start with the indicator itself.
Beginning with the start of 29012 stocks began to rally and as the Liquidity Indicator shows clearly early
cycle components began to outperform the more defensive late cycle groups. The indicator had largely
traded sideways since the big drop in August , but this upturn at New Year’s produced breaikout type
action this past week. The chart below is the Global version of the indicator and it had maintained its
descent from the beginning of 2011 and turned on a dime confirming the action in the US.
8/2/2019 ICM Weekly Strategic Plan
http://slidepdf.com/reader/full/icm-weekly-strategic-plan 2/20
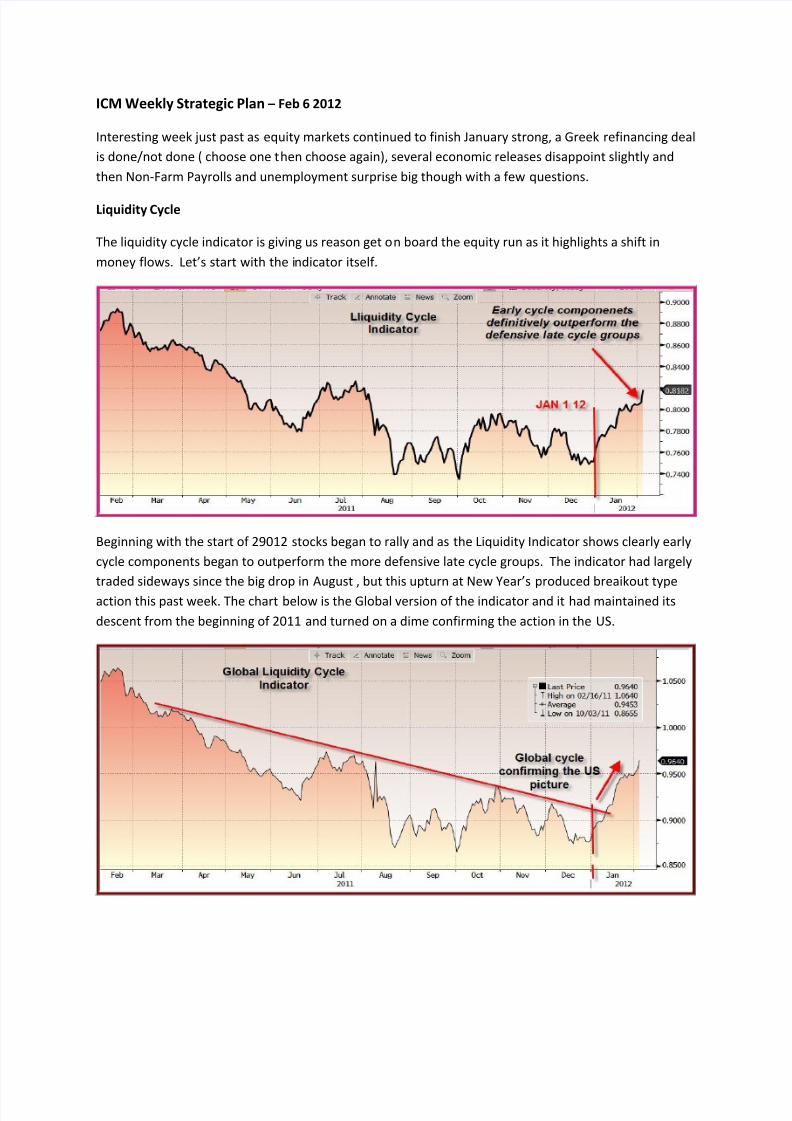
The chart above is the ETF that tracks the SP and though the print is small we can see the breakout tonew highs for the past few months and also how close the market is to the highs of 2011. But check out
the chart below which is the ETF containing the 60 highest yielding stocks in the SP. This ETF tracks the
SPY pretty closely. Now notice the high dividend paying group also made new highs this week,but, not
just for the past few months but, also for the past 4 years. This group has almost taken out its 2008
highs from before the crash. Money pouring into the equities is still being a bit defensive, and reflects
caution and worry. This market is climbing a wall of worry ( with good reason ) and market lore claims
the best markets historically do climb a wall of worry and don’t bubble up in rash speculation.
Returning briefly to the Liquidity Cycle Indicator , the next chart is the comparison of the indicator to the
Economic Research Weekly Index of Leading Indicators. I usually show a 5 year period on this chart
because these two track each other well. This time the chart is from the March 2009 low to the present
to help illustrate the recent divergence as the Liquidity Cycle Indicator has jumped to the upside ahead

8/2/2019 ICM Weekly Strategic Plan
http://slidepdf.com/reader/full/icm-weekly-strategic-plan 3/20
of the ECRI readings. Minor divergences like this happen but this looks very similar to the timing of the
equity rally and firming in the ECRI index that began in early fall 2010 as the Fed began hinting at and
eventually implementing QE2.
If the current talk of QE like policy and low rates into 2014 this equity rally could easily have 5 or 6
months duration and should easily carry through the April tax time retirement contribution period.
Collapse of discussions in Europe could derail this forecast but this is the scenario I expect to play out for
now.
Sectors
Sector performance this past week is consistent with the behavior we should be seeing
according to the LCI.
8/2/2019 ICM Weekly Strategic Plan
http://slidepdf.com/reader/full/icm-weekly-strategic-plan 4/20
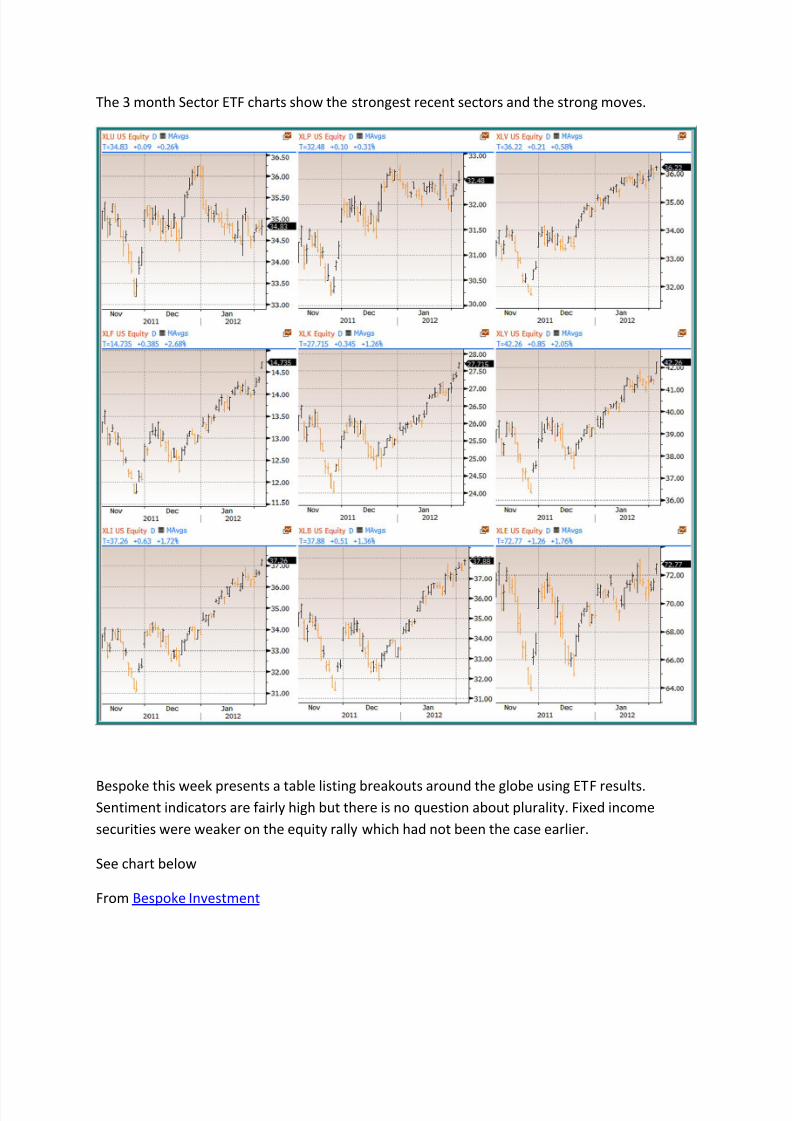
The 3 month Sector ETF charts show the strongest recent sectors and the strong moves.
Bespoke this week presents a table listing breakouts around the globe using ETF results.Sentiment indicators are fairly high but there is no question about plurality. Fixed income
securities were weaker on the equity rally which had not been the case earlier.
See chart below
From Bespoke Investment
8/2/2019 ICM Weekly Strategic Plan
http://slidepdf.com/reader/full/icm-weekly-strategic-plan 5/20
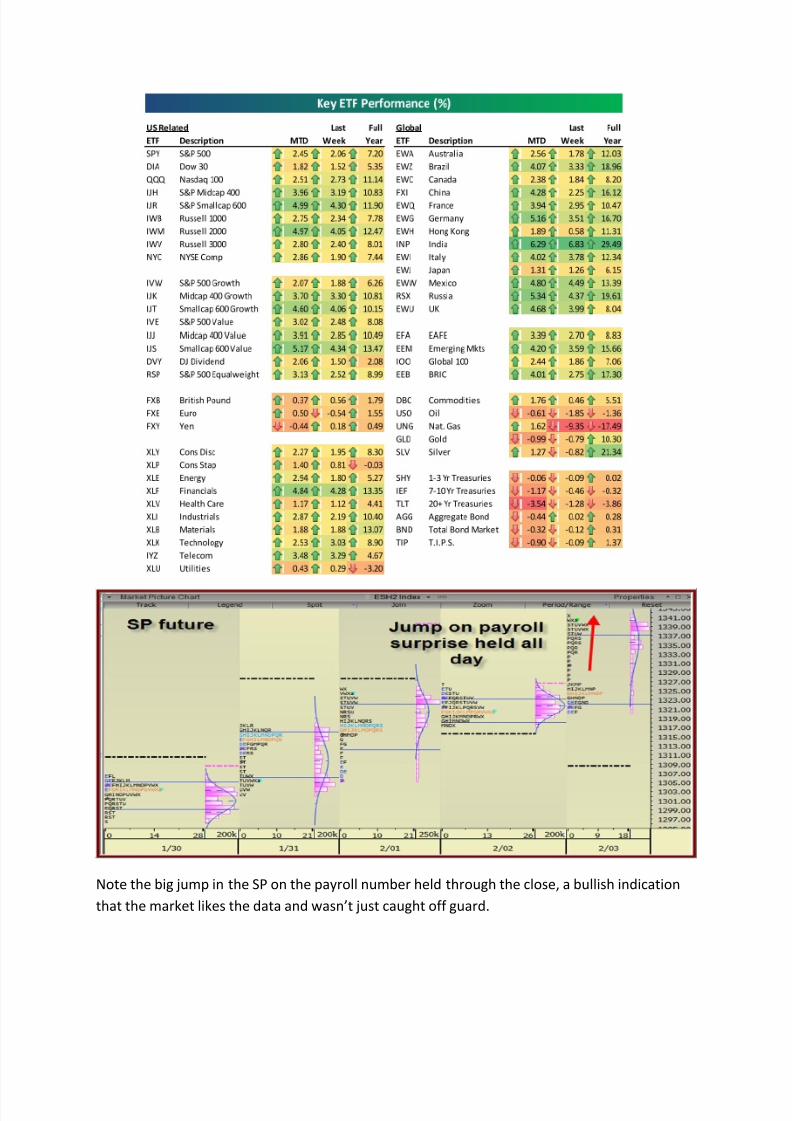
Note the big jump in the SP on the payroll number held through the close, a bullish indication
that the market likes the data and wasn’t just caught off guard.

8/2/2019 ICM Weekly Strategic Plan
http://slidepdf.com/reader/full/icm-weekly-strategic-plan 6/20
International Indices Rankings
The table gives us longer term performance rankings of Country indices based on their local
currencies. Several have turned up enough to generate buy signals. One should also check for
the performance measured in dollar terms as a big currency move versus the dollar can
mislead. For example 2 years ago Venezuela was the strongest index in the world in localcurrency terms but the performance against the dollar made the Venezuela marke the worst
performer for a dollar based investor because the currency had been devalued 50%. The next
chart will show this same table but measured in dollar terms. But either way we are seeing
better performance than in 2011.
8/2/2019 ICM Weekly Strategic Plan
http://slidepdf.com/reader/full/icm-weekly-strategic-plan 7/20
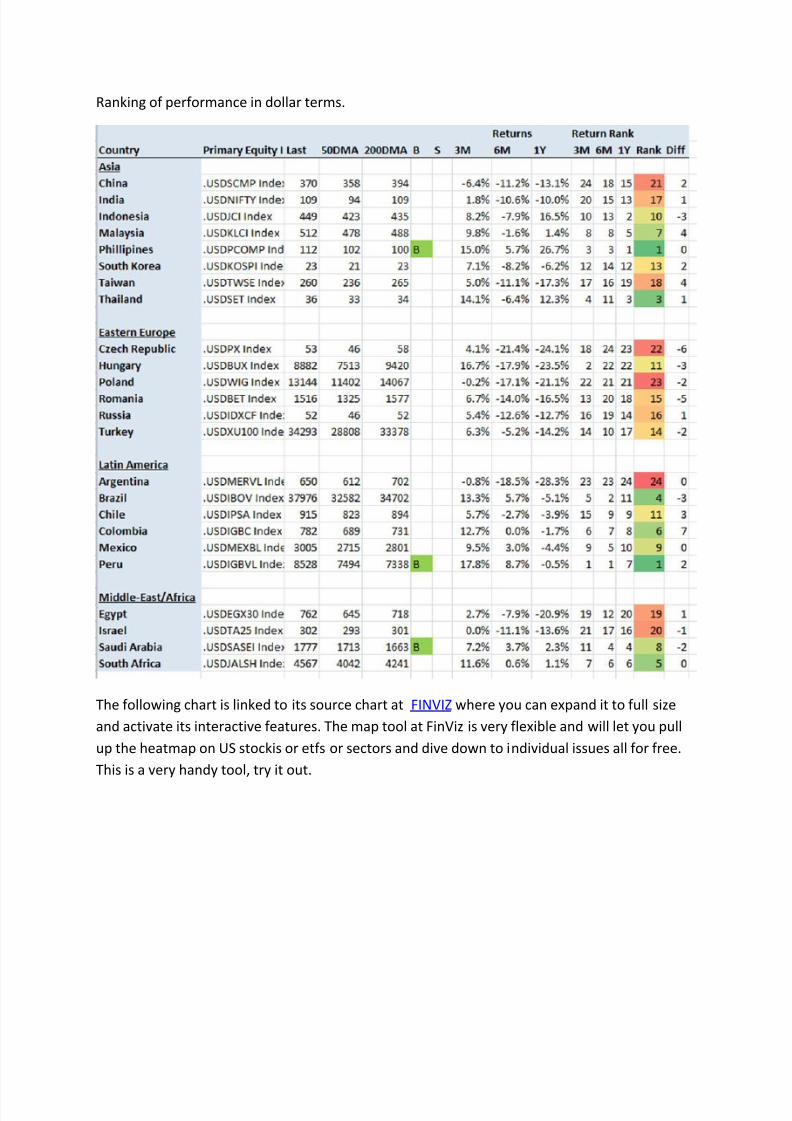
Ranking of performance in dollar terms.
The following chart is linked to its source chart at FINVIZ where you can expand it to full size
and activate its interactive features. The map tool at FinViz is very flexible and will let you pull
up the heatmap on US stockis or etfs or sectors and dive down to individual issues all for free.
This is a very handy tool, try it out.

8/2/2019 ICM Weekly Strategic Plan
http://slidepdf.com/reader/full/icm-weekly-strategic-plan 8/20
Heatmap of Global stocks traded on US equity exchanges:
Interactive chart from FINVIZ.COM
One month into 2012 where do we expect outperformance. The rankings tables presented
earlier reveal that in dollar terms The United States equity market was the best performer in
2011 finishing nearly flat while most markets sold off, some sharply. Imposition of austerity in
Europe should inhibit those markets but the weakness of last year does likely reflect some
discounting of expected economic weakness, and may be boosted by massive monetary policy
support which usually first stimulates equity prices. Asia which is high beta to the global
economy out performed in 2009/2010, but had a dismal 2011 on inflation fighting policy
tightness looks to rebound sharply on any good news. January has seen a fast start in Asia.
I will take the following approach with equity allocations which I am increasing. Split between
US and Emerging economies with the following characteristics. Yield above relevant 10 tr
government bonds, solid balance sheets, real assets and strong brand or franchise. The chart
below from Bank Credit Analyst shows the long run trend in emerging markets relative to global
markets. The higher beta shows rather clearly and the upward tilt is even more obvious.
Currently emerging markets indices are near the 2 standard deviation lows from trend and a
8/2/2019 ICM Weekly Strategic Plan
http://slidepdf.com/reader/full/icm-weekly-strategic-plan 9/20
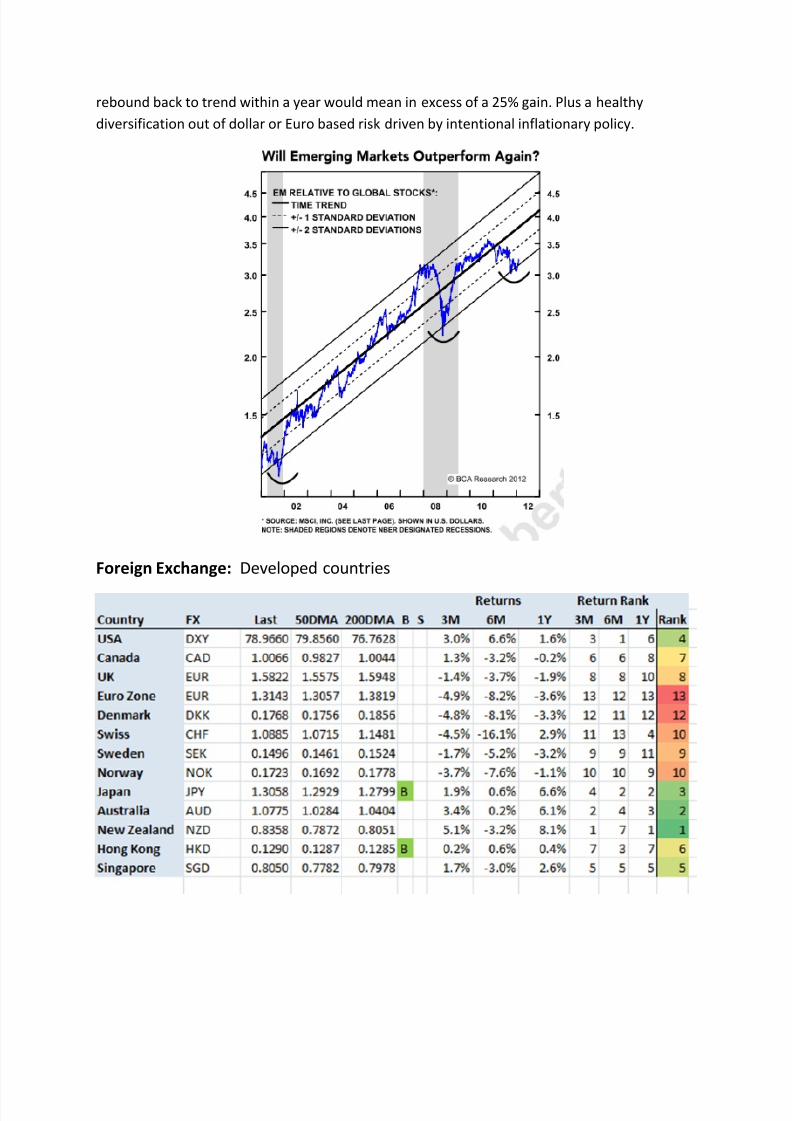
rebound back to trend within a year would mean in excess of a 25% gain. Plus a healthy
diversification out of dollar or Euro based risk driven by intentional inflationary policy.
Foreign Exchange: Developed countries
8/2/2019 ICM Weekly Strategic Plan
http://slidepdf.com/reader/full/icm-weekly-strategic-plan 10/20
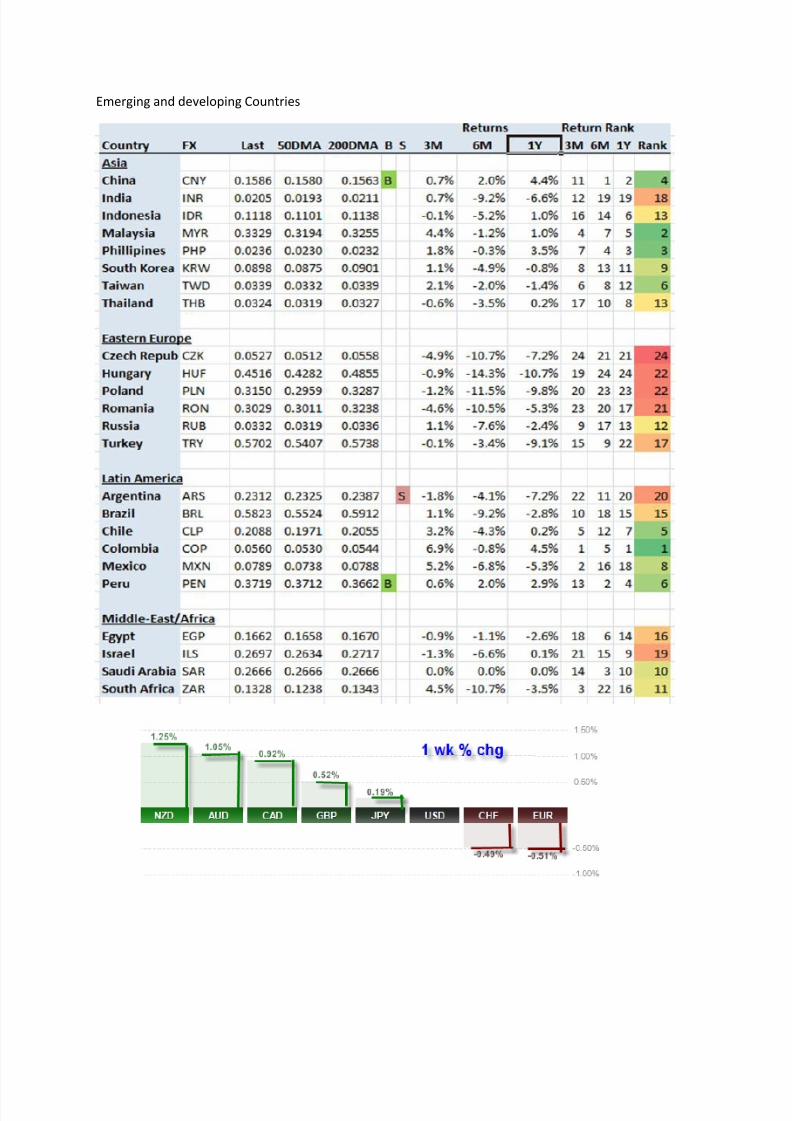
Emerging and developing Countries
8/2/2019 ICM Weekly Strategic Plan
http://slidepdf.com/reader/full/icm-weekly-strategic-plan 11/20
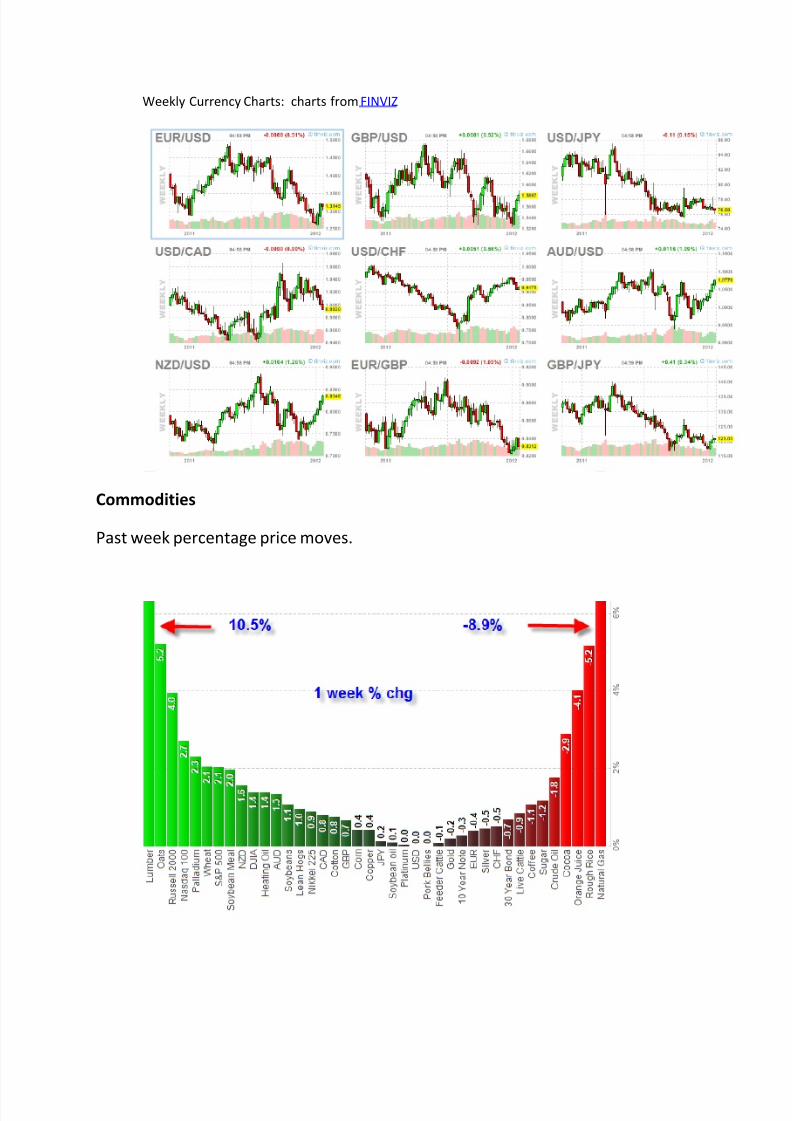
Weekly Currency Charts: charts from FINVIZ
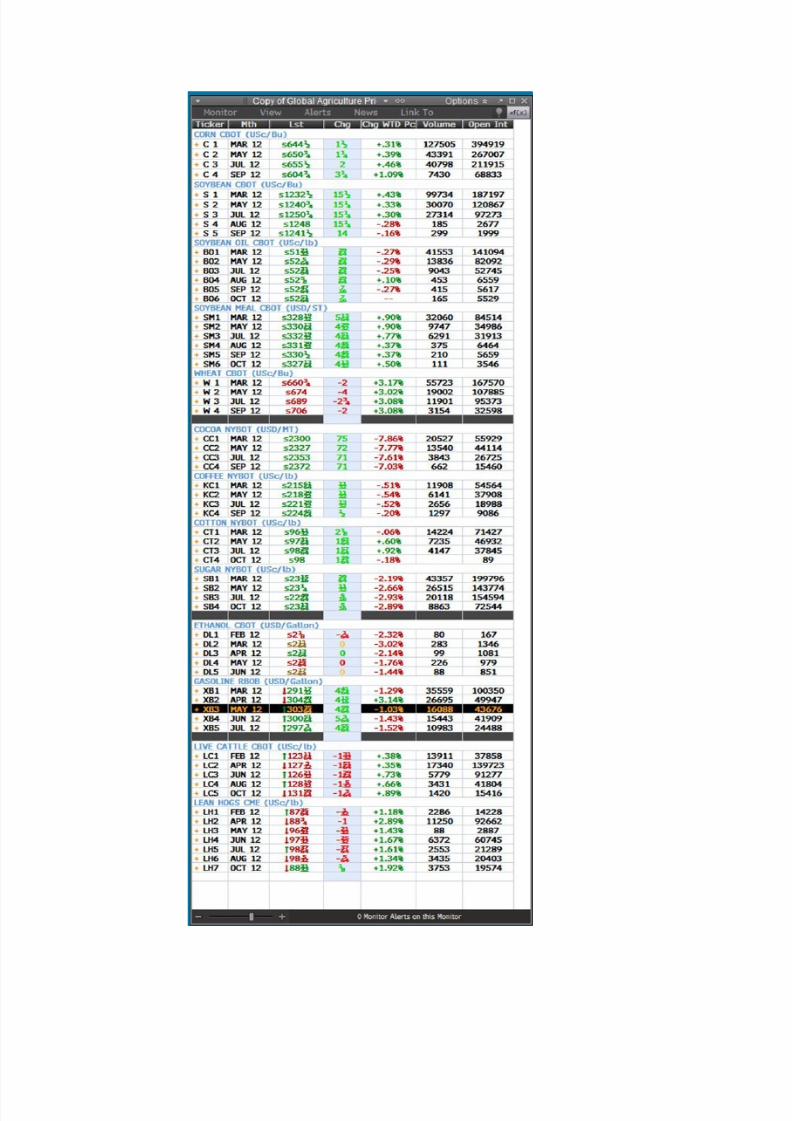
Commodities
Past week percentage price moves.
8/2/2019 ICM Weekly Strategic Plan
http://slidepdf.com/reader/full/icm-weekly-strategic-plan 12/20

8/2/2019 ICM Weekly Strategic Plan
http://slidepdf.com/reader/full/icm-weekly-strategic-plan 13/20
Crude prices had relative tight ranges but WTI and Brent diverged on bearish
storage build up in Cushing but bullish scares around Iranian supplies.
Spread movement in energies was weak in WTI but only in the very front Brent.
8/2/2019 ICM Weekly Strategic Plan
http://slidepdf.com/reader/full/icm-weekly-strategic-plan 14/20
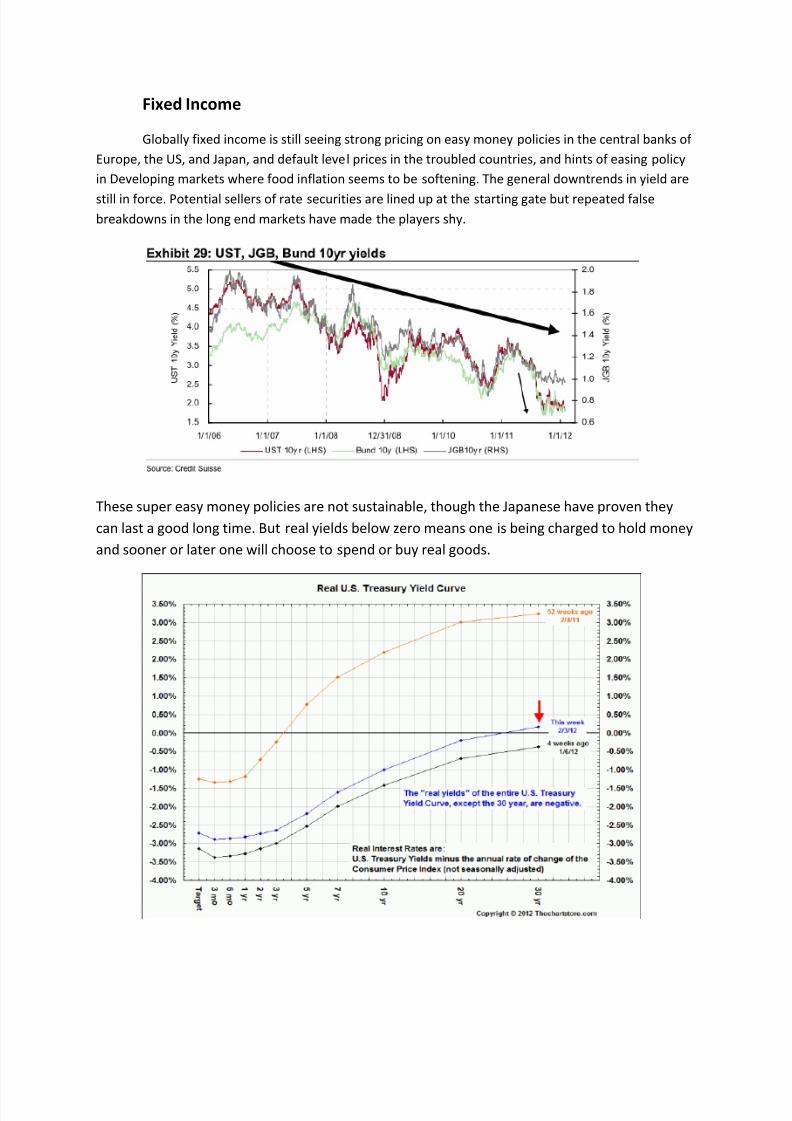
Fixed Income
Globally fixed income is still seeing strong pricing on easy money policies in the central banks of
Europe, the US, and Japan, and default level prices in the troubled countries, and hints of easing policy
in Developing markets where food inflation seems to be softening. The general downtrends in yield are
still in force. Potential sellers of rate securities are lined up at the starting gate but repeated false
breakdowns in the long end markets have made the players shy.
These super easy money policies are not sustainable, though the Japanese have proven they
can last a good long time. But real yields below zero means one is being charged to hold money
and sooner or later one will choose to spend or buy real goods.
8/2/2019 ICM Weekly Strategic Plan
http://slidepdf.com/reader/full/icm-weekly-strategic-plan 15/20
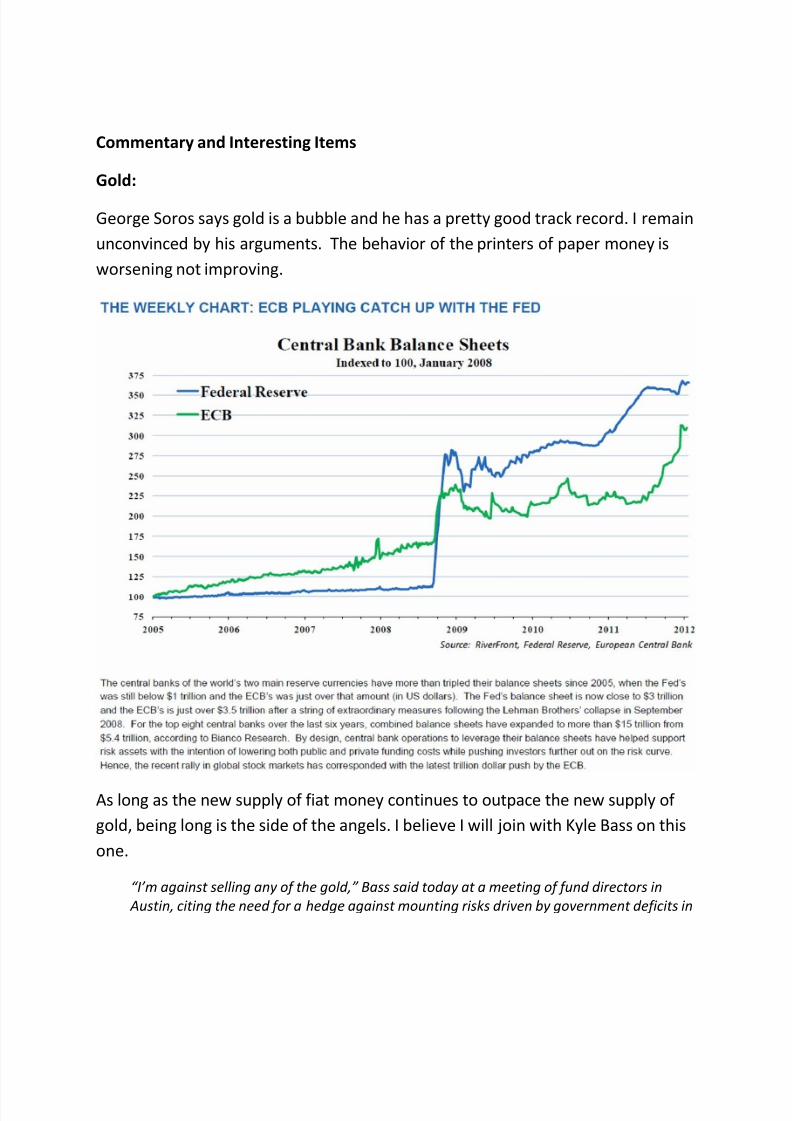
Commentary and Interesting Items
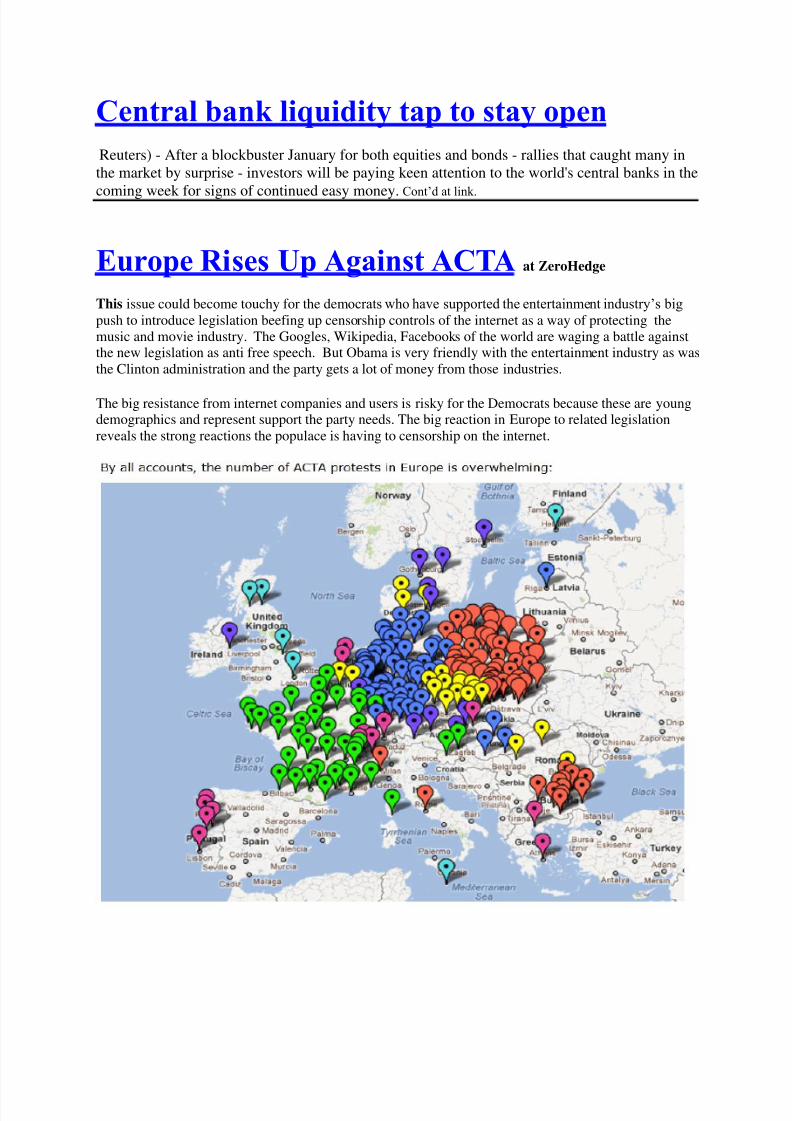
Gold:
George Soros says gold is a bubble and he has a pretty good track record. I remain
unconvinced by his arguments. The behavior of the printers of paper money is
worsening not improving.
As long as the new supply of fiat money continues to outpace the new supply of
gold, being long is the side of the angels. I believe I will join with Kyle Bass on this
one.
“I’m against selling any of the gold,” Bass said today at a meeting of fund directors in
Austin, citing the need for a hedge against mounting risks driven by government deficits in
8/2/2019 ICM Weekly Strategic Plan
http://slidepdf.com/reader/full/icm-weekly-strategic-plan 16/20
the U.S. and Europe. “As every day goes by , I see deflation in the things you own and
inflation in the things you need.”
From Kyle Bass Urges Texas Endowment Fund to Hold Gold Hedge as Assets Shrink
Contango Widest Since October in Cushing Deluge: Energy Markets from Bloomberg
By Aaron Clark and Grant Smith
Feb. 3 (Bloomberg) -- Oil in America has become so plentiful that crude for future delivery is the most
expensive in three months compared with supplies today.
The so-called contango reached 38 cents today as West Texas Intermediate crude for delivery in April
traded at $97.93 a barrel on the New York Mercantile Exchange, compared with the contract for March
at $97.55. While the gap is smaller than the 45-cent average over the past decade, the relationship had
been in the reverse situation, which traders call backwardation, as recently as November.
Crude is flooding into storage terminals in Cushing, Oklahoma, the delivery point for WTI futures, as
production from Canada and North Dakota increases, curbing the U.S. dependence on imports to theleast in more than a decade, according to Energy Department data. Inventories at Cushing climbed 1.48
million barrels to 30.1 million in the week ended Jan. 27, the highest level since Dec. 16, the department
said.
“We are starting to see a build again mostly because there is a lot of Canadian pressure to come into
Cushing,” Abudi Zein, a senior vice president at Genscape Inc., a Louisville, Kentucky-based energy-data
provider, said during a presentation at the Argus Americas Crude Summit in Houston on Jan. 27.
As stockpiles at Cushing increased 6.5 percent in the past two weeks, WTI’s discount to Brent crude
on ICE Futures Europe, the European benchmark, widened to $16.17 a barrel today from $9.90 on Jan.
18.
Declining Imports
The U.S. is becoming less dependent on imports from outside North America as domestic crude
production and imports from Canada accounted for 55 percent of U.S. refinery demand for oil
in November, the highest level for that month in at least 10 years, Energy Department data show.
U.S. imports of oil and refined products dropped 25 percent to 9.44 million barrels a day in 2010 from
a peak of 12.55 million barrels in 2005 as output from the U.S. and Canada surged, the use of renewable
fuels increased and total consumption levels declined. U.S. fuel demand fell 9.5 percent
in the five years to 2009 because of the recession, improvements in fuel efficiency and changes in
consumer behavior.
Canadian oils have become cheaper as Alberta producers boost output and a mild winter has limited
disruptions. Syncrude Canada Ltd. increased production by 11 percent in January from
the previous month to 313,200 barrels a day, Canadian Oil Sands Ltd. said in a statement on its websiteyesterday.
North Dakota oil production surged 42 percent to 510,000 barrels a day in November, exceeding the
output of OPEC member Ecuador, as energy explorers accelerated drilling in the Bakken Shale
formation, according to the North Dakota Oil and Gas Division.
Pipeline Demand
8/2/2019 ICM Weekly Strategic Plan
http://slidepdf.com/reader/full/icm-weekly-strategic-plan 17/20
Demand to ship on Enbridge Inc.’s Spearhead pipeline from near Chicago to Cushing in February
jumped nearly eightfold from the previous month. The discount for Syncrude oil from Alberta
slumped to the lowest since at least 2006 yesterday as producers boosted output. Bakken oil produced
in North Dakota dipped yesterday to the steepest discount to WTI since at least 2010.
Shippers requested space for 737,500 barrels a day on the 650-mile (1,046-kilometer) Spearhead line
for February compared with 93,300 barrels in January, Calgary-based Enbridge said Jan.
26. The line has a capacity of 193,600 barrels.
Companies also are increasing shipments to Cushing in anticipation of the reversal of the 500-mile
Seaway pipeline in June. Enterprise Products Partners LP and Enbridge, which operate the link, said Nov.
16 they plan to reverse flows away from the storage center to ease a bottleneck, giving producers from
Canada and North Dakota access to Gulf coast refineries.
Rising Storage
“We can expect to see further inventory builds in Cushing and the contango getting wider,” said
Torbjoern Kjus, an oil- market analyst at DnB NOR ASA in Oslo. “The key reason is that the Seaway
pipeline is going to reverse, and there’s competition to get a place booked on that pipeline when it
opens.” Alberta and North Dakota crudes have weakened to levels making it profitable to store the grades in
Cushing. The discount for Syncrude widened $5.50 to $13.50 below WTI, the cheapest since at least
2006, according to data compiled by Bloomberg.
The discount for Western Canada Select, an oil from Alberta, weakened $2.75 to $31 below WTI, the
cheapest in more than a year. Bakken oil’s discount strengthened 25 cents to $12 below the U.S.
benchmark. Yesterday the grade traded at the cheapest since at least 2010.
“You’ll see as much volume as possible leaving Western Canada and North Dakota and getting into
Cushing markets,” Tyler Radcliffe, a Calgary-based vice president of supply and facilities at Trafigura AG,
said Feb. 1 during a presentation at the Bakken Product Markets & Takeaway Capacity 2012 conference
in Denver.
TransCanada Corp.’s Keystone pipeline also is increasing shipments to Cushing, diverting oil from theline’s other terminus in Patoka, Illinois, according to Zein. In January, the 591,000 barrel-a-day pipe
shipped 82 percent of volumes to Patoka. In December, the line directed 83 percent to Patoka.
“Toward the end of the month, we observed a marked increase in Keystone shipments to Cushing,”
Zein said in an e- mail today. “If the trend continues, February will see a heavy inflow of Canadian crude
into Cushing since Spearhead is also running higher.”
--With assistance from Joe Carroll in Chicago and David Marino
in New York. Editors: Dan
Stets, Margot Habiby
To contact the reporters on this story:
Aaron Clark in New York at +1-212-617-2473 or
[email protected] ;Grant Smith in London at +44-20-7330-7353 or
To contact the editor responsible for this story:
Dan Stets at +1-212-617-4403 or

8/2/2019 ICM Weekly Strategic Plan
http://slidepdf.com/reader/full/icm-weekly-strategic-plan 18/20
Morgan Stanley lowers forecast for EUR/USD.
"Reverting back to our trusty key correlation of 2012, namely the comparison of the Fed and ECBbalance sheet, it would mean that absent a proportional Fed response, the fair value of the EURUSD
would collapse to a shocking 1.12 as the ECB's balance sheet following this LTRO would grow from €2.7 trillion to €3.7 trillion." And the reason why the latter extract should remind readers of the former
is because it is the basis for the just released conclusion by Morgan Stanley cutting its EURUSD price
target from 1.20 to 1.15.
As for the basis of our assessment, we used the following chart showing the relative and projected sizes of
the ECB and Fed balance sheets as the basis of EURUSD correlations: from ZeroHedge
________________________________________________________________________________________
8/2/2019 ICM Weekly Strategic Plan
http://slidepdf.com/reader/full/icm-weekly-strategic-plan 19/20

8/2/2019 ICM Weekly Strategic Plan
http://slidepdf.com/reader/full/icm-weekly-strategic-plan 20/20
Superbowl in about 40 minutes so I will wrap up and give everyone a break. But first I want to include a
link to a short video and urge all of you to take the time to watch. New tends to run to emergencies,
crises, disasters and tragedies because they more easily grab our attention. One can find oneself feelingdiscouraged about the state of the world and the future. Once in a while though apiece of information
comes your way that offers such hope to people and such evidence of the power of creativity and
scientific endeavor to improve lives that it restores ones optimism about what humans are and can be. I
felt this way watching this short news clip. Take a look
Feb 5 2012
Bruce B. Lawrence