Embed Size (px)
Citation preview

Copyright � 2010 by the Genetics Society of AmericaDOI: 10.1534/genetics.109.111880
Identification of a Maize Locus That Modulates the Hypersensitive DefenseResponse, Using Mutant-Assisted Gene Identification and Characterization
Satya Chintamanani,* Scot H. Hulbert,† Gurmukh S. Johal* and Peter J. Balint-Kurti‡,1
*Department of Botany and Plant Pathology, Purdue University, West Lafayette, Indiana 47907–2054, †Department of Plant Pathology,Washington State University, Pullman, Washington 99164-6430, ‡United States Department of Agriculture–Agricultural Research
Service (USDA–ARS) Plant Science Research Unit and Department of Plant Pathology, North Carolina State University,Raleigh, North Carolina 27695-7616
Manuscript received November 7, 2009Accepted for publication December 8, 2009
ABSTRACT
Potentially useful naturally occurring genetic variation is often difficult to identify as the effects ofindividual genes are subtle and difficult to observe. In this study, a novel genetic technique called Mutant-Assisted Gene Identification and Characterization is used to identify naturally occurring loci modulat-ing the hypersensitive defense response (HR) in maize. Mutant-Assisted Gene Identification andCharacterization facilitates the identification of naturally occurring alleles underlying phenotypicvariation from diverse germplasm, using a mutant phenotype as a ‘‘reporter.’’ In this study the reporterphenotype was caused by a partially dominant autoactive disease resistance gene, Rp1-D21, which causedHR lesions to form spontaneously all over the plant. Here it is demonstrated that the Rp1-D21 phenotypeis profoundly affected by genetic background. By crossing the Rp1-D21 gene into the IBM mappingpopulation, it was possible to map and identify Hrml1 on chromosome 10, a locus responsible formodulating the HR phenotype conferred by Rp1-D21. Other loci with smaller effects were identified onchromosomes 1 and 9. These results demonstrate that Mutant-Assisted Gene Identification andCharacterization is a viable approach for identifying naturally occurring useful genetic variation.
POTENTIALLY useful naturally occurring geneticvariation is often difficult to identify as the effects
of individual genes are subtle and difficult to observe.Furthermore, so many different alleles are available thatit is a major challenge just to sift through the enormousdiversity available. To this end, we recently conceptual-ized a simple yet effective method to discover and char-acterize variation present naturally in plant germplasm( Johal et al. 2008). This method, Mutant-Assisted GeneIdentification and Characterization, makes use of amutant phenotype for a gene affecting the trait ofinterest as a reporter to discover and analyze relevant,interacting genes present naturally in diverse germ-plasm. Mutant-Assisted Gene Identification and Char-acterization involves crossing a mutant to diversegermplasm and then evaluating the mutant progeny fortransgressive changes (both suppressed and severe) inthe mutant phenotype(s). If the mutation is recessive,the population needs to be advanced to the F2
generation to be able to detect and analyze such varia-tion. However, for a dominant or partially dominantmutant, evaluations can be made immediately in the F1
to discover lines that contain suppressors or enhancers
of the trait (mutation) under study. Mutant F1 pro-genies from such crosses can then be propagated fur-ther to identify, map, and clone genes/QTL that affectthe trait positively or negatively. In the case of maizeand other species for which genetically characterizedmapping populations are available, modifying loci canbe rapidly mapped by crossing a mutant line to eachmember of a mapping population and evaluating theresulting F1 families. In this study we provide a proof-of-concept for the Mutant-Assisted Gene Identificationand Characterization technique, using it to identify lociinvolved in the defense response of maize.
Plants are constantly exposed to numerous potentialpathogens with diverse modes of attack. Nevertheless, itis rather rare to see plants succumbing to disease. Onekey reason for this is the presence of a highly effectiveand inducible defense system, a major component ofwhich is the hypersensitive response (HR). HR is usuallyassociated with a specific recognition event and is ac-tivated after other nonspecific resistance mechanismshave been overcome or evaded (see Bent and Mackey
2007). Although it was initially coined to refer to therapid collapse of cells at the site of infection, over theyears the term HR has been used to refer to both celldeath and the associated induction of a number of otherdefense responses, including the accumulation ofphytoalexins and pathogenesis-related (PR) proteinsat the site of infection, to name a few (Mur et al. 2007).
1Corresponding author: USDA–ARS Plant Science Research Unit andDepartment of Plant Pathology, North Carolina State University, 3418Gardner Hall, Raleigh, NC 27695-7616.E-mail: [email protected]
Genetics 184: 813–825 (March 2010)

Reactive oxygen species such as superoxide and H2O2
appear to be causally involved in cell death underlyingthe HR response ( Jones and Dangl 2006).
HR is under the control of a subset of disease-resistance genes, commonly referred to as R genes.These R genes specifically recognize matching avirulence(Avr) effectors from the pathogen. Many R genesencode products containing a nucleotide-binding site(NBS) domain in the middle of the protein and aleucine-rich repeat (LRR) domain at the C-terminal end(Bent and Mackey 2007). R proteins are involved bothin the recognition of the pathogen and the subsequentinduction of the HR response. How R proteins remainin a quiescent but ‘‘vigilant’’ state remains to be estab-lished. Certain mutations in R genes have been foundthat abolish their dependence on AVR proteins foractivation. Such aberrant R genes mostly behave as dom-inant or partially dominant alleles and trigger the HRconstitutively in the absence of the pathogen (Hu et al.1996; Zhang et al. 2003; Dodds et al. 2006). Twoconsequences of such ‘‘autoactive’’ or ‘‘ectopically ac-tive’’ R genes are a massive induction of cell death andthe consequential stunting of the organism (Dodds et al.2006). Although autoactive R genes have been found toexist in many plant species, the first few examples camefrom the maize Rp1 locus, which confers race-specificresistance to common rust, caused by Puccinia sorghi(Hu et al. 1996). Such autoactive R genes can be usedto investigate HR genetics and etiology in the absenceof confounding effects from the pathogen and consti-tute an excellent candidate for analysis using Mutant-Assisted Gene Identification and Characterization.
The details of the HR cell death reaction as well as thepathway(s) that link R gene activation with the HRremain unclear (Mur et al. 2007). Despite considerableresearch over the past decade, only a few componentshave been found thus far. Some of these, Ndr1, Eds1,Pad4, Rar1, and Sgt1, were identified in mutagenesisscreens conducted to identify mutants that failed toundergo an HR reaction in response to infection by anavirulent pathogen (reviewed in Bent and Mackey
2007). A few others, RIN4, for example, were identifiedin yeast two-hybrid assays using an NBS–LRR proteinas bait (Mackey et al. 2003). Recently, an Arabidopsisgain-of-function mutant that carries a point mutation inan R gene analog (a gene with the structure of an R genebut not known to be involved in resistance to anypathogen) was used to isolate a few more potentialgenes in the HR pathway in a second site suppressorapproach following mutagenesis with ethane methylsulfonate (EMS) (Palma et al. 2005; Zhang andLi 2005; Goritschnig et al. 2007). A problem withapproaches based on intentional mutagenesis is thatthey fail to uncover genes that have either redundant oressential functions. One way to avoid this problemwould be to seek naturally occurring allelic variantsaffecting HR. Such natural variation is pervasive in all
species, being generated and selected for over millionsof years of evolution.
Although natural variation has served as a constantprovider of the R genes in all plant species, naturalvariability has not been tapped as a tool for understand-ing other aspects of the disease-resistance response(Holub 2007). The Rp1-D21 gene is an autoactive allelefrom the maize Rp1 disease-resistance locus that initiatesHR randomly all over the plant (Pryor 1993; Collins
et al. 1999; Sun et al. 2001). Our objective for this studywas to use the Rp1-D21 gene phenotype as a test case forthe Mutant-Assisted Gene Identification and Character-ization approach. We show here that enormous varia-tion exists in the maize germplasm that is capable ofaffecting the HR response positively or negatively andwe identify loci that modulate expression of the HRphenotype segregating in the well-known IntermatedB73 3 Mo17 (IBM) advanced intercross line (AIL)population (Coe et al. 2002; Lee et al. 2002). Thisconstitutes the first demonstration of the utility of theMutant-Assisted Gene Identification and Characteriza-tion approach—an approach that is likely to provewidely applicable.
MATERIALS AND METHODS
Plant materials: The Rp1-D21-H95 line was generated bycrossing the Rp1-D21 variant to the maize inbred line H95 andbackcrossing to the H95 parent four times, while selecting forthe HR phenotype indicated by the spontaneous formation ofcell death lesions. Since Rp1-D21 homozygotes in the H95background are often unable to produce and sustain a viableear, this stock is maintained in heterozygous condition byrepeatedly crossing it to the H95 inbred.
The Rp1-D21-H95 heterozygote was crossed both to acollection of maize inbred lines (see Table 1) and to 233recombinant inbred lines (RILs) from the maize IBM pop-ulation (Lee et al. 2002). As expected, in each case, theresulting F1 families segregated in a 1:1 ratio for mutant (withRp1-D21 HR lesions) to wild-type individuals. The IBMmapping population itself is composed of 302 F7:8 RILsderived from the cross of maize inbred lines B73 and Mo17.This population was intermated four times following the F2
stage before inbred lines were derived (Lee et al. 2002). Seed ofIBM lines was received from the Maize Genetic Stock Centerand also as gifts from Drs. A. Stapleton and O. Hoekenga.
Field trials: Experiments were performed at the NorthCarolina State University Central Crops Research Stationlocated at Clayton, North Carolina, in the summers of 2006,2007, and 2008 and at the Purdue Agronomy Center forResearch and Education (ACRE) in West Lafayette, Indiana, inthe summers of 2006 and 2007.
In Clayton 10 seeds per plot were planted in each plot androws were not thinned. One plot of inbred border was plantedon all sides of the experiment. Overhead irrigation was appliedas needed to ensure satisfactory plant growth. Standardfertilizer and herbicide regimes for central North Carolinawere used. Plots were 2 m in length with a 0.6-m alley at the endof each plot. Interrow spacing was 0.97 m. In 2009 F1 crossesbetween the Rp1-D21-H95 heterozygote and a set of diverselines were planted in two replications. For the QTL mappingexperiment, two replicates of the F1 families derived fromcrosses of the Rp1-D21-H95 heterozygote with individual IBM
814 S. Chintamanani et al.

lines and the parental lines (B73 and Mo17) were planted in2007 and 2008. In 2007, 184 F1 families were evaluated and in2008, 233 F1 families were evaluated. Experimental unitsin each case consisted of single-row plots arranged in random-ized complete blocks with two replications.
In West Lafayette, Indiana, 20 seeds per row were planted in6-m rows spaced 0.76 m apart. As in Clayton, progenies ofcrosses of Rp1-D21-H95 with diverse inbreds were planted in2009, while the test-cross progenies of 184 IBM RILs with Rp1-D21 were planted in 2007. Plants were drip irrigated as needed.
Scores were assigned on a row basis, only considering themutant Rp1-D21 individuals within each row. They were scoredon a 1–5 quantitative scale for HR lesion severity with 1 beingcomplete absence of lesions and 5 being complete coverage ofthe ear leaf with lesions. In North Carolina, the plants werescored seven times in 2007 and 10 times in 2008 at approxi-mately 1-week intervals during June and July. In Indiana theplants were scored twice, once on June 29 and once on July 9,2007. At the end of the season the heights of all the plants weremeasured. In North Carolina in 2007, the time to anthesis ofeach plant was also measured.
Greenhouse trials: F1 families from 184 different Rp1-D21-H95 heterozygote 3 IBM lines were examined in the green-house in Raleigh, North Carolina, in January 2006. Sixcomplete randomized blocks were planted using single plantsin 3-in.-diameter clay pots as experimental units. Pots werefilled with a 50:50 mixture of Metromix (Scott’s Inc., Marys-ville, OH) and sterilized soil. Supplemental lighting was usedfor 14hr/day to maintain a�16-hr day length. The plants weremaintained at 26� during the day and 22� during the night.The actual temperature rarely deviated more than 4� fromthese target temperatures.
Each F1 family segregated 1:1 for the mutant to wild-typeindividuals so on average, only three Rp1-D21 individuals weregrown for each family. By chance, for 10 families only wild-typeplants and no mutant plants were planted while 5 familiesconsisted solely of mutant Rp1-D21 plants. Plants were scoredevery 4 or 5 days from 17 days after planting to 44 days afterplanting on a 1–5 scale similarly to the field experiments. At 44days, the height of all the plants was measured. For each familythe average score of the Rp1-D21 phenotype (regardless of howmany plants this was) was used as the score for subsequentanalyses.
Marker-assisted analysis of Hrml1 in A632: To check thestatus of Hrml1 in the maize line A632 a ‘‘pseudo-F2 popula-tion’’ was generated by crossing A632 and Rp1-D21-H95 togenerate an F1 population segregating 1:1 for wild-type tomutant plants. Wild-type F1 plants were then crossed withmutant F1 plants to generate the pseudo-F2, which againsegregated 1:1 for wild-type to mutant plants. A number of SSRmarkers located in bins 10.2 and 10.3 were examined forpolymorphism between A632 and Rp1-D21-H95. The markerumc1962 was selected and used to genotype extreme segre-gants from the pseudo-F2. DNA was extracted by a fast extractprotocol as described by Xin et al. (2003). PCR was performedin a total volume of 20 ml containing 2.5 mm MgCl2, 0.4 mm
each dNTPs, 50 ng each of forward and reverse primers, and0.3 units of Taq polymerase (Promega, Madison, WI). The PCRconditions were 30 sec each at 94�, 57�, and 72� for 35 cycles.
Expression analyses: Expression analysis of maize defenseresponse genes was conducted using semiquantitative reversetranscriptase polymerase chain reaction (RT–PCR). TotalRNA was extracted from maize leaf tissue using TRIZOL(Invitrogen, Carlsbad, CA) and was treated with RNase-freeDNase I (Promega Corp., Madison, WI). For RT–PCR, 200 ngof total RNA was reverse transcribed using oligo(dT) primersand AMV reverse transcriptase (Promega) to synthesize first-strand cDNA. In accordance with the manufacturer’s instruc-
tions, 0.5 mg oligo(dT) primer/mg RNA was mixed innuclease-free water and incubated at 70� for 5 min and thenchilled on ice for 5 min. The AMV RTreaction mix (Promega)was then added to a final volume of 25 ml and the sample wasincubated at 42� for 1 hr followed by 15 min at 70� to deactivatethe reverse transcriptase. The resulting cDNA was then used toquantify transcript levels of several maize defense genes usingthe following PCR conditions: 94� for 30 sec, 57� for 30 sec,and 72� for 30 sec (32 cycles for the defense response genesand 28 cycles for the 18S ribosomal RNA [18S rRNA] control).The primers 18S-F (59-TCCTGAGTAACGAACGAGACC-39) and18S-R (59-CACGATGAAATTTCCCAAGAT-39) were used toamplify the 18S rRNA control. The primers PR1-F (59-AGGCTCGCGTGCCTCCTAGCTCTGG-39) and PR1-R (59-GGAGTCGCGCCACACCACCTGCGTG-39) were used to amplifythe maize PR1 defense response gene. The primers PR5-F (59-AACAACTGCGGTTCACCGTG-39) and PR5-R (59-ACCGAGATGTCGTAGAAGTCC-39) were used to amplify the PR5defense response gene. The primer pair PRms-F (59-ACCTGGAGCACGAAGCTGCAG-39) and PRms-R (59-GCAGCCGATGCTTGTAGTGGC-39) was used to amplify the maize defenseresponse gene PRms. The primers WIP1-F (59-TGCTGATCCTGTGCCTCCAG-39) and WIP1-R (59-CTCTCTGATCTAGCACTTGGGG-39) were used to amplify the WIP1 gene. All primerswere obtained from Integrated DNA Technologies (Coralville,IA). Reaction products were visualized via gel electrophoresis(1% agarose) using a Gel-Doc imaging and documentationsystem (Bio-Rad, Hercules, CA).
Detection of H2O2 and superoxide ions: The in situpresence of H2O2 and superoxide in Rp1-D21 leaves wasvisually detected with 3,3-diaminobenzidine (DAB) and nitro-blue tetrazolium (NBT), respectively, using the proceduresdescribed by Thordal-Christensen et al. (1997). The leavesundergoing Rp1-D21 lesion initiation were excised with a razorblade and allowed to take up NBT (1 mg/ml) or DAB (1 mg/ml) through the cut ends under high light intensity at roomtemperature. After 3 hr incubation, leaves were decolorized byboiling in 96% ethanol to remove chlorophyll before exam-ining under a bright light transmission microscope.
Statistical analysis and QTL mapping: F1 families derivedfrom the cross between the Rp1-D21-H95 heterozygote lineand 233 IBM lines were assessed in the field in both Clayton,North Carolina, in 2007 and 2008 and West Lafayette, Indiana,in 2007 (henceforth called NC 907 and NC 908 and IN,respectively). The population was also assessed in the green-house as juvenile plants in the winter of 2006. The populationwas scored for HR lesion intensity and severity (‘‘necrosis’’)and mutant:wild type height ratio within an F1 family(‘‘height’’) in all four environments and for differentialbetween anthesis date of mutant and wild-type plants withinan F1 family (‘‘anthesis) in NC 907 (see materials and
methods for details of trait measurement). Least-squaresmeans were calculated for the height and necrosis sAUDPC(standardized area under disease progress curve) traits mea-sured in the three field trials. The traits were called ‘‘overallnecrosis’’ and ‘‘overall height.’’ All correlation calculationswere made using the PROC CORR procedure of SAS. TheWindows QTL cartographer software package (Department ofStatistics, North Carolina State University, Raleigh, NC) wasused to detect the QTL. Composite interval mapping was usedwith a walk speed of 0.5 cM, window size 10 cM. Model 6 wasused with five control markers and threshold values de-termined by permutation analysis with a significance level of0.05. The following eleven traits were used for QTL analysis:
GH necrosis: The average standardized area under diseaseprogress curve (sAUDPC) score was determined for all ofthe lesion mimic individuals for each Rp1-D21-H95 hetero-
Mutant-Assisted Gene Identification and Characterization Identifies Variation Controlling HR 815

zygote 3 IBM lines F1 family grown on the greenhouse.sAUDPC ratings were calculated in the following way: Theaverage value of two consecutive ratings was obtained andmultiplied by the number of days between the ratings.Values were then summed over all intervals and then dividedby the number of days of evaluation to determine theweighted average. This method is a standard way ofmeasuring disease (or in this case lesion) development overtime (Shaner and Finney 1977; Campbell and Madden
1990).GH height: The ratio of the average height of the disease
mimic plants divided by the average height of the wild-typeplants within each Rp1-D21-H95 heterozygote 3 IBM line F1
family grown in the greenhouse at 44 days after planting.IN necrosis: This is the average of the two scores for each Rp1-
D21-H95 heterozygote 3 IBM lines F1 family grown in WestLafayette, Indiana, scored on the 1–5 scale described. In thiscase a single replication was assessed.
IN height: The ratio of the average height of the disease mimicplants divided by the average height of the wild-type plantswithin each Rp1-D21-H95 heterozygote 3 IBM line F1 familygrown in West Lafayette, Indiana, in 2007, measured at theend of the season. By using the mutant:wild type height ratiorather than just the average height of the mutants, we couldaccount for the variable levels of heterosis seen in each F1
family.NC ‘07 necrosis and NC ’08 necrosis: The average sAUDPC
score for each Rp1-D21-H95 heterozygote 3 IBM lines F1
family grown in Clayton, North Carolina, in 2007 and 2008.Two replications were grown in complete randomizedblocks. The sAUDPC was calculated for each F1 family foreach replication and the average of the two sAUDPC scoresfor each F1 family was used.
NC height ‘07 and NC height ’08: The ratio of the averageheight of the disease mimic plants divided by the averageheight of the wild-type plants within each Rp1-D21-H95
heterozygote 3 IBM lines F1 family grown in Clayton, NorthCarolina, 2007 and in 2008. Two replications were grown incomplete randomized blocks. The height ratio was calcu-lated for each F1 family in each replication and the averageof the ratios for each F1 family was used.
NC anthesis 07: The average difference in days to anthesis ofthe disease mimic plants compared to the time to anthesis ofthe wild-type plants within each Rp1-D21-H95 heterozygote 3IBM lines F1 family grown in Clayton, North Carolina. Tworeplications were grown in complete randomized blocksand the average of the anthesis differentials for each F1
family was used.Overall necrosis: The least-squares means sAUDPC score for
each F1 family over the three environments, NC ‘07, NC ’08,and IN.
Overall height: The least-squares means height ratio for each F1
family over the three environments, NC ‘07, NC ’08, and IN.
RESULTS
Rp1-D21 lesions form spontaneously in a develop-mentally programmed fashion: Like many diseaselesion mimic mutations, the HR lesions on Rp1-D21mutants followed a developmental progression for ini-tiation and expansion and were significantly affected bythe environmental conditions. In the H95 background,cell death lesions first initiated on the oldest leaf ataround week 2 after planting in the field (the three-leafstage) but around week 3 in the glasshouse (the four-leaf stage). These lesions enlarged slightly and the newones formed down the leaf blade in a basipetal fashion(i.e., progressing from the tip of the leaf to the base)
Figure 1.—Manifestation of the Rp1-D21 phe-notype in the heterozygous state in the Rp1-D21-H95 line. Phenotype of field-grown Rp1-D21-H95plants 3 weeks after planting (A) and 8 weeksafter planting (B). (C) An adult Rp1-D21-H95mutant with a relatively normal tassel but no ear.
816 S. Chintamanani et al.
(Figure 1). By the time they covered most of the leaf,new HR lesions initiated near the tip of the second leaf.This pattern of lesion initiation and expansion was re-peated progressively as the plant grew and all the leaveswere covered with Rp1-D21 lesions by anthesis with thelowermost leaves becoming entirely necrotic (Figure 1).The lesion initiation/formation was uniform either ina GH or field setting and their progression up the plantwas gradual, suggesting that the lesions form spontane-ously and did not need a stimulus for initiation.
The growth and vigor of the Rp1-D21 mutants wassignificantly curtailed compared to their wild-type sib-lings. In the H95 background, Rp1-D21 mutants wereabout half the size of wild-type siblings. Rp1-D21-H95plants were able to produce a small tassel that shed pollennormally, but they were never able to sustain a viable ear.As a result, the Rp1-D21-H95 line was maintained asheterozygotes by fertilizing H95 females with pollen froma Rp1-D21-H95 plant heterozygous for the Rp1-D21 gene.
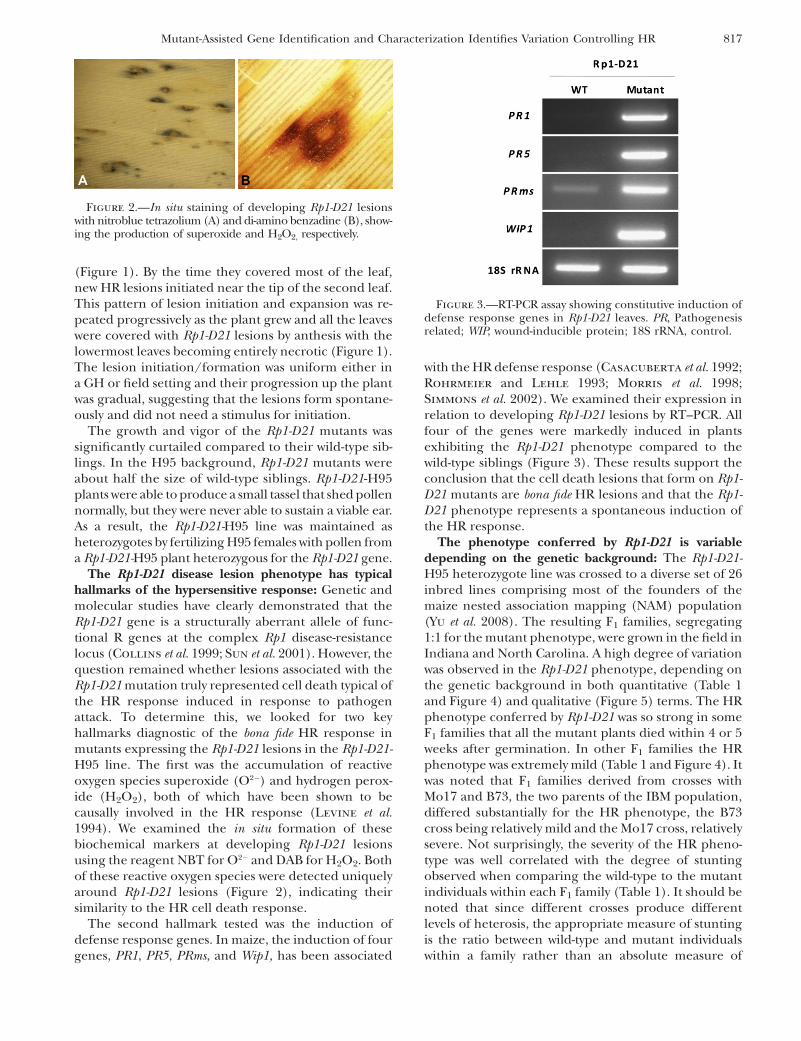
The Rp1-D21 disease lesion phenotype has typicalhallmarks of the hypersensitive response: Genetic andmolecular studies have clearly demonstrated that theRp1-D21 gene is a structurally aberrant allele of func-tional R genes at the complex Rp1 disease-resistancelocus (Collins et al. 1999; Sun et al. 2001). However, thequestion remained whether lesions associated with theRp1-D21 mutation truly represented cell death typical ofthe HR response induced in response to pathogenattack. To determine this, we looked for two keyhallmarks diagnostic of the bona fide HR response inmutants expressing the Rp1-D21 lesions in the Rp1-D21-H95 line. The first was the accumulation of reactiveoxygen species superoxide (O2�) and hydrogen perox-ide (H2O2), both of which have been shown to becausally involved in the HR response (Levine et al.1994). We examined the in situ formation of thesebiochemical markers at developing Rp1-D21 lesionsusing the reagent NBT for O2� and DAB for H2O2. Bothof these reactive oxygen species were detected uniquelyaround Rp1-D21 lesions (Figure 2), indicating theirsimilarity to the HR cell death response.
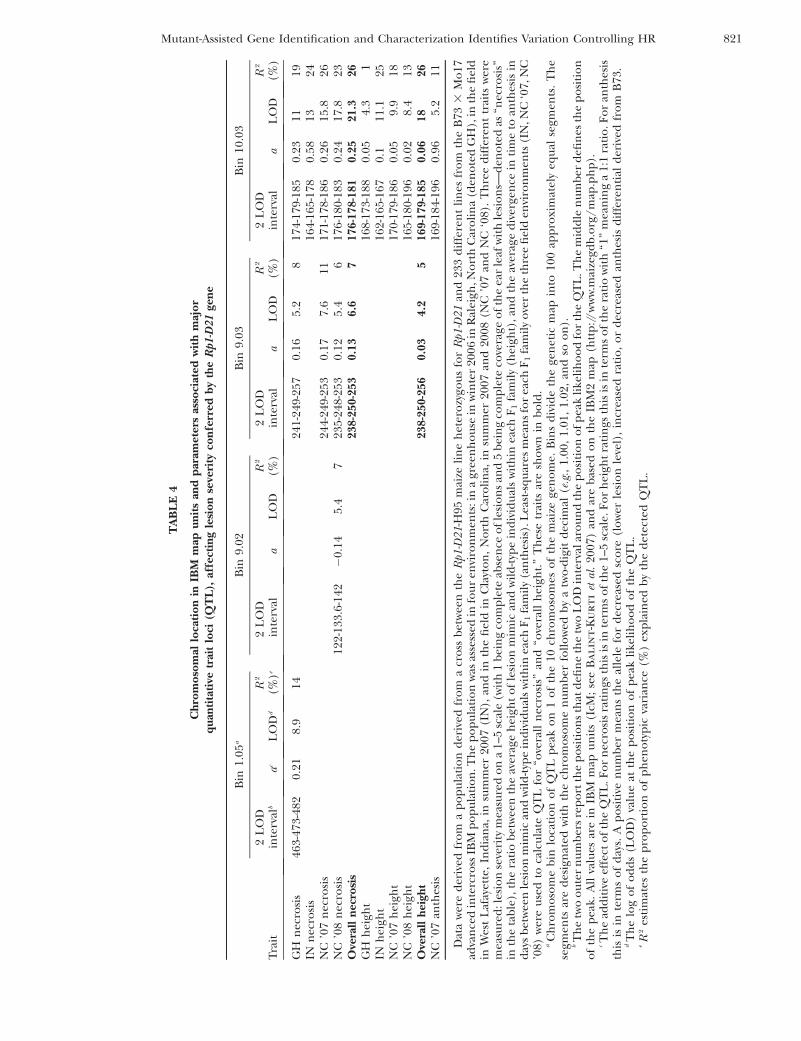
The second hallmark tested was the induction ofdefense response genes. In maize, the induction of fourgenes, PR1, PR5, PRms, and Wip1, has been associated
with the HR defense response (Casacuberta et al. 1992;Rohrmeier and Lehle 1993; Morris et al. 1998;Simmons et al. 2002). We examined their expression inrelation to developing Rp1-D21 lesions by RT–PCR. Allfour of the genes were markedly induced in plantsexhibiting the Rp1-D21 phenotype compared to thewild-type siblings (Figure 3). These results support theconclusion that the cell death lesions that form on Rp1-D21 mutants are bona fide HR lesions and that the Rp1-D21 phenotype represents a spontaneous induction ofthe HR response.
The phenotype conferred by Rp1-D21 is variabledepending on the genetic background: The Rp1-D21-H95 heterozygote line was crossed to a diverse set of 26inbred lines comprising most of the founders of themaize nested association mapping (NAM) population(Yu et al. 2008). The resulting F1 families, segregating1:1 for the mutant phenotype, were grown in the field inIndiana and North Carolina. A high degree of variationwas observed in the Rp1-D21 phenotype, depending onthe genetic background in both quantitative (Table 1and Figure 4) and qualitative (Figure 5) terms. The HRphenotype conferred by Rp1-D21 was so strong in someF1 families that all the mutant plants died within 4 or 5weeks after germination. In other F1 families the HRphenotype was extremely mild (Table 1 and Figure 4). Itwas noted that F1 families derived from crosses withMo17 and B73, the two parents of the IBM population,differed substantially for the HR phenotype, the B73cross being relatively mild and the Mo17 cross, relativelysevere. Not surprisingly, the severity of the HR pheno-type was well correlated with the degree of stuntingobserved when comparing the wild-type to the mutantindividuals within each F1 family (Table 1). It should benoted that since different crosses produce differentlevels of heterosis, the appropriate measure of stuntingis the ratio between wild-type and mutant individualswithin a family rather than an absolute measure of
Figure 2.—In situ staining of developing Rp1-D21 lesionswith nitroblue tetrazolium (A) and di-amino benzadine (B), show-ing the production of superoxide and H2O2, respectively.
Figure 3.—RT-PCR assay showing constitutive induction ofdefense response genes in Rp1-D21 leaves. PR, Pathogenesisrelated; WIP, wound-inducible protein; 18S rRNA, control.
Mutant-Assisted Gene Identification and Characterization Identifies Variation Controlling HR 817

height or yield. It was also evident that while the scoresrecorded in Indiana and North Carolina were highlycorrelated (.0.8 Person correlation coefficient for bothtraits), the phenotype was generally more severe inIndiana. This is likely due to the lower temperatures inthe field in Indiana; the Rp1-D21 phenotype is temper-ature sensitive (Hu et al. 1996).
Identification of a QTL for suppression of the Rp1-D21 phenotype: F1 families derived from the crossbetween the Rp1-D21-H95 heterozygote line and 233IBM lines were assessed and scored as detailed inmaterials and methods. The correlations betweenthe average sAUDPC scores for the two replications inNC ’07 and NC ’08 were 0.75 and 0.80, respectively. Thecorrelations between all traits for all environments were
moderate to high and all were highly significant (P ,
0.0001; see Table 2). In the field tests, line and line-by-environment interactions were the main significantcontributors to phenotypic variance for sAUDPC andheight (Table 3). Environmental effects were large forboth the phenotypes but they were not significant dueto their large standard errors (Table 3).
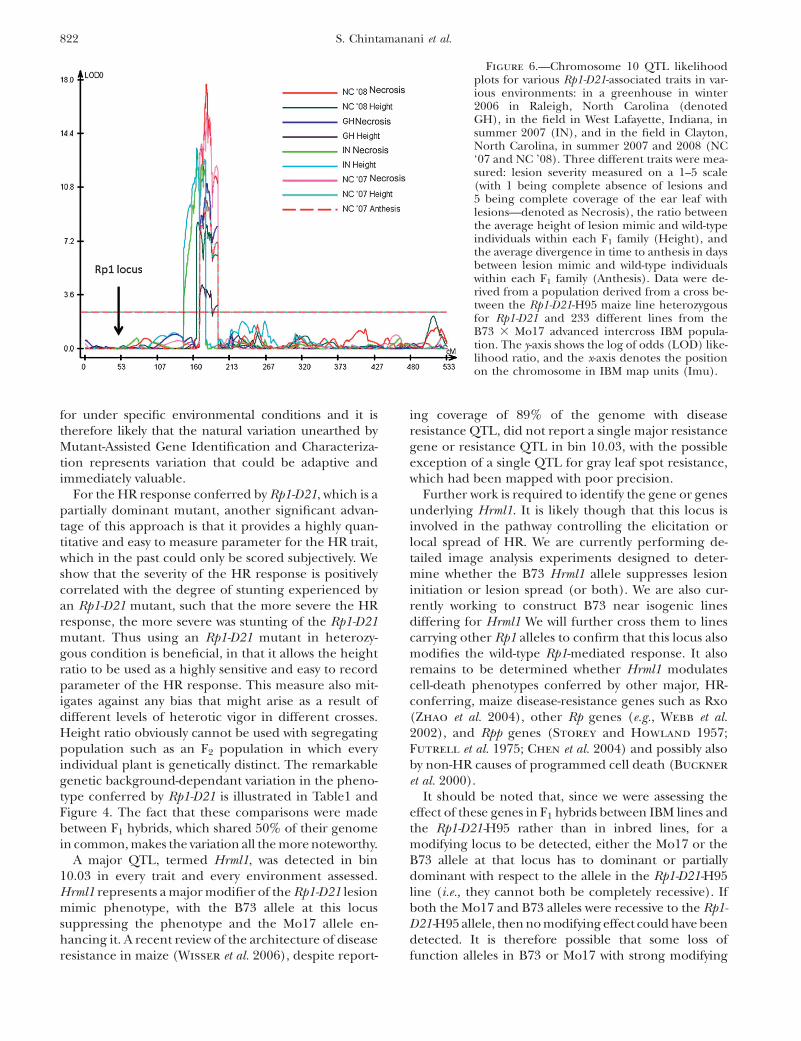
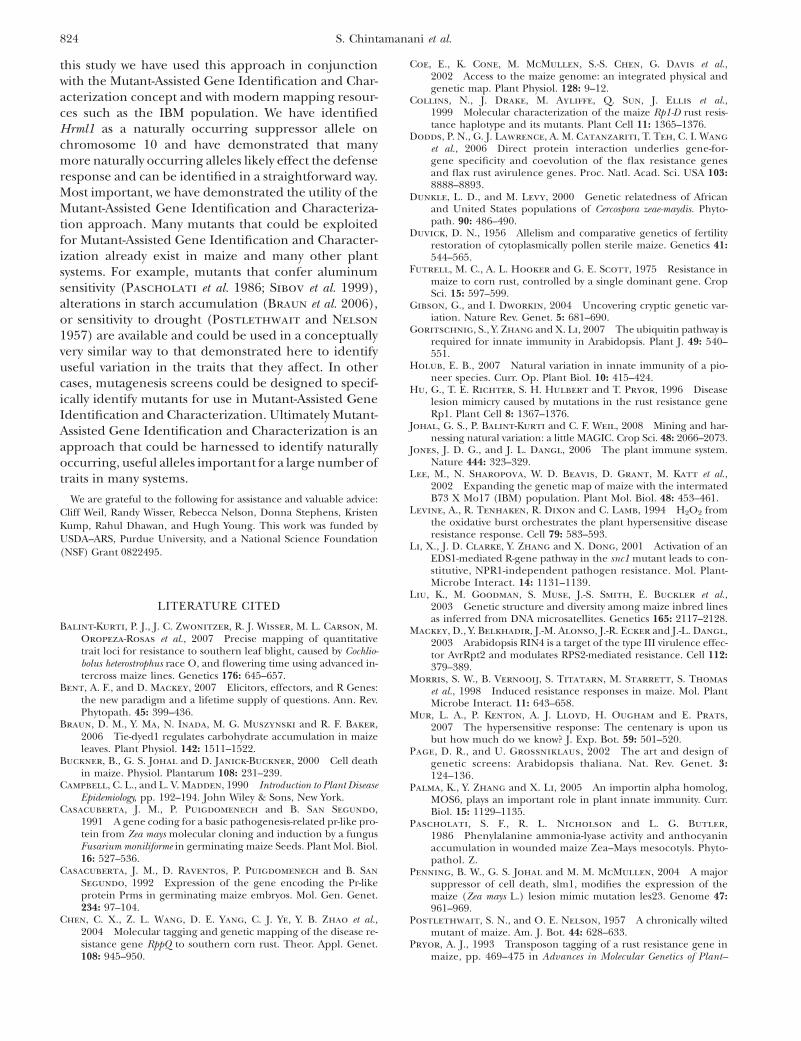
The strongest QTL identified for each trait and foreach environment was on chromosome 10 in bin 10.03(see Table 4). Although the detected QTL did notcompletely overlap in every case, they were so close thatit is likely that they were all caused by the same under-lying gene or genes (Figure 6). This QTL accountedfor between 10 and 26% of the total variation, depend-ing on the trait and the environment. For 6 of the11 trait/environment combinations analyzed, the bin10.03 QTL was the only significant QTL detected. Wehave termed this QTL Hrml1 for HR-modulating locus1. A smaller effect QTL for GH Necrosis and NCNecrosis was also detected in bin 9.03 for 5 trait/environments including overall necrosis and overallheight. A QTL of modest effect was identified in bin9.02 for NC ’08 necrosis. Effects were also detected atthis locus in bin 9.02 for most of the necrosis traits, butthey did not rise to the level of significance as defined bypermutation analysis.
A QTL for GH Necrosis was detected in bin 1.05.There was no effect at this locus for any other trait. Sincethe GH traits were measured on young plants usingscores taken between 17 days after planting to 44 daysafter planting, we thought this might be a juvenile-plant-specific QTL. To test this hypothesis we analyzed alonethe earliest scores taken in NC ’07 and NC ’08 (whichwere taken at 24 and 37 days after planting respectively).We did not find an effect on these traits in bin 1.05 (datanot shown).
The Hrml1 locus effects the RP1-D21 phenotype inother crosses: To check if the Hrml1 locus modulatedthe effect of Rp1-D21 in other crosses, we analyzed thegenetic basis for suppression of the Rp1-D21 HR phe-notype in another inbred line A632, which, in crosseswith Rp1-D21-H95, suppressed the Rp1-D21 phenotypeeven more strongly than B73. To accomplish this, a‘‘pseudo-F2 population’’ was generated by crossing A632and Rp1-D21-H95 to generate an F1 population segre-gating 1:1 for wild-type to mutant plants. Wild-type F1
plants were then crossed as females to their mutantsiblings. The key reason for using this approach to gen-erate an F2 mapping population was to keep the copynumber of the Rp1-D21 allele constant in all mutantplants so that variation in the mutant phenotype was notdue to different numbers of copies (one vs. two) of theRp1-D21 allele. Because Rp1-D21 behaves in a partiallydominant manner, plants containing two copies of themutant allele (homozygous for Rp1-D21) would be moresevere than plants carrying a single Rp1-D21 allele (Rp1-D21 heterozygotes). As expected, a range of variation
TABLE 1
The diversity of the Rp1-D21-mediated HR in maize
Indiana scores NC scores
CrossHeightratio
Necrosisscore
Heightratio
Necrosisscore
A632 3 Rp1-D21-H95 0.8 1.5 0.67 2.3B73 3 Rp1-D21-H95 0.64 4 0.74 2.2B97 3 Rp1-D21-H95 0.82 2 0.73 3.4CM103 3 Rp1-D21-H95 0.23 7 0.50 5.6CML228 3 Rp1-D21-H95 0.73 3.5 0.89 1.9CML322 3 Rp1-D21-H95 0 10 0.32 7.2CML333 3 Rp1-D21-H95 0.4 4 0.69 3.1CML69 3 Rp1-D21-H95 0.48 6 — —CML277 3 Rp1-D21-H95 0.19 7 0.62 3.6CML247 3 Rp1-D21-H95 0.73 3 — —IL14H 3 Rp1-D21-H95 0.22 8 0.60 5.7Ki3 3 Rp1-D21-H95 0 10 0.35 6.4Ki11 3 Rp1-D21-H95 0.73 3 — —Ky21 3 Rp1-D21-H95 0.18 9 0.37 6.6M162W 3 Rp1-D21-H95 0 10 0.30 7.8M37W 3 Rp1-D21-H95 0 10 0 10Mo17 3 Rp1-D21-H95 0.39 6 0.48 6.3Mo18w 3 Rp1-D21-H95 0.68 3 0.66 4.3MS-71 3 Rp1-D21-H95 0.35 6.5 0.82 5.2NC350 3 Rp1-D21-H95 0 10 0 10NC358 3 Rp1-D21-H95 0.44 6 0.72 5.1Oh43 3 Rp1-D21-H95 0.76 3.5 0.89 2.7Oh7B 3 Rp1-D21-H95 0.68 3 — —P39 3 Rp1-D21-H95 0 10 — —Tx303 3 Rp1-D21-H95 0 10 0.34 6.3Tzi8 3 Rp1-D21-H95 0.51 4.5 0.81 3.9
F1 families were derived from crosses between a number ofinbreds and the Rp1-D21-H95 line, which was heterozygousfor the Rp1-D21 gene. The resulting F1 families therefore seg-regated 1:1 for the necrotic spotting phenotype associatedwith Rp1-D21. The height ratio was the ratio between the av-erage height of the mutant and wild-type plants within a fam-ily. If all the mutant plants died as seedlings the height ratiowas reported as 0. This was measured in Clayton, North Carolina,in 2006. The same families were planted in West Lafayette,Indiana, in 2009. In this case severity scores were taken on a0–10 scale with 0 being no lesions at all and 10 being dead.
818 S. Chintamanani et al.

of the Rp1-D21 phenotype was detected in the F2 pop-ulation, including many plants that exhibited a highlysuppressed Rp1-D21 phenotype. DNA was extracted from35 of the most highly suppressed plants as well as fromanother 23 mutants randomly selected from a popula-tion of about 250 plants. These samples were evaluatedfor the segregation pattern of an Hrml1-linked SSRmarker (umc1962), which was found to be polymorphic
between A632 and H95. This marker exhibited nosignificant segregation distortion at the marker locusin the randomly selected Rp1-D21 plants (5 homozygousH95, 13 heterozygotes, 5 homozygous A632). However,all 35 Rp1-D21 plants having a highly suppressed phe-notype were homozygous for the A632 allele at umc1962,suggesting that these suppressed plants were homozy-gous for the A632 Hrml1 allele and that the suppressive
Figure 4.—The progression of the Rp1-D21phenotype in crosses between the Rp1-D21-H95line and the lines indicated.
Figure 5.—Examples of different morphol-ogy, size, and color of lesion of Rp1-D21 le-sions in different backgrounds.
Mutant-Assisted Gene Identification and Characterization Identifies Variation Controlling HR 819

effect of the A632 Hrml1 allele was either recessive orpartially dominant.
DISCUSSION
One standard way to identify components comprisinggenetic networks controlling biological processes is todo second-site mutagenesis (SSM) in lines that alreadypossess mutations in genes affecting the phenotype ofinterest to reveal other genes that suppress or enhancethe effect of the mutation (Page and Grossniklaus
2002). For instance, many of the genes known to beinvolved in the plant defense response were identifiedby this method (e.g., Li et al. 2001). Mutant-AssistedGene Identification and Characterization provides acomplimentary approach that allows one to tap into an
additional, vast resource of genetic variation—naturalvariation, produced over millions of years of evolution( Johal et al. 2008). Results presented here show thatMutant-Assisted Gene Identification and Characteriza-tion is a viable approach for discovering natural varia-tion underlying the HR response. Just as breeders havefor many years exploited the high level of diversity in Rgenes produced by diversifying selection during evolu-tion, so now Mutant-Assisted Gene Identification andCharacterization provides a way in which diversity in thedownstream components of the HR can be systemati-cally identified. Mutant-Assisted Gene Identification andCharacterization is conceptually similar to the SSMapproach; however, instead of using induced variation,it relies on variation that is present naturally. For eachlocus, each different allele has presumably been selected
TABLE 2
Pearson correlation coefficients between different measured parameters affecting lesion mimic severity conferredby the Rp1-D21 gene
GHnecrosis
GHheight
INnecrosis
INheight
NC ‘07necrosis
NC ’08necrosis
NC ‘07height
NC ‘08height
GH height 0.58IN necrosis 0.54 0.52IN height 0.60 0.60 0.85NC ’07 necrosis 0.69 0.50 0.73 0.72NC ’08 necrosis 0.63 0.47 0.72 0.72 0.77NC ’07 height 0.52 0.43 0.68 0.66 0.71 0.71NC ’08 height 0.46 0.34 0.58 0.55 0.54 0.77 0.57NC ’07 anthesis �0.39 �0.46 �0.56 �0.54 �0.56 �0.48 �0.61 �0.28
Data were derived from a population from a cross between the Rp1-D21-H95 maize line heterozygous for Rp1-D21 and 233 dif-ferent lines from the B73 3 Mo17 advanced intercross IBM population. The population was assessed in four environments: in agreenhouse in winter 2006 in Raleigh, North Carolina (denoted GH), in the field in West Lafayette, Indiana, in summer 2007(IN), and in the field in Clayton, North Carolina, in summer 2007 and 2008 (NC ’07 and NC ‘08). Three different traits weremeasured: lesion severity measured on a 1–5 scale (with 1 being complete absence of lesions and 5 being complete coverage of theear leaf with lesions—denoted as ‘‘necrosis’’ in the table), the ratio between the average height of lesion mimic and wild-typeindividuals within each F1 family (height), and the average divergence in time to anthesis in days between lesion mimic andwild-type individuals within each F1 family (anthesis). This last trait was measured only in Clayton, North Carolina, on 2007.
TABLE 3
Variance component estimates and standard errors for standardized area under disease progress curve(sAUDPC) for the Rp1-D21 lesion phenotype and the mutant:wild type height ratio (Height) for a
population consisting of F1 families from a cross between Rp1-D21-H95 heterozygote and233 lines from the IBM population
Variance component estimates (standard error) and P-values
Parameter sAUDPC P-value Height (310�2) P-value
Environment 0.09 (0.09)a NS 1.37 (1.46) NSReplication within environment 0.01 (0.01) NS 0.11 (0.11) NSLine 0.18 (0.02) ,0.01 0.82 (0.11) ,0.01Environment by line 0.03 (0.01) ,0.01 0.27 (0.07) ,0.01Residual 0.06 (0.004) ,0.01 0.71 (0.06) ,0.01
The populations were scored in the field in Clayton, North Carolina, in the summers of 2007 and 2008 (tworeplications each) and in West Lafayette, Indiana, in 2007 (one replication). NS, not significant.
a Standard error.
820 S. Chintamanani et al.
TA
BL
E4
Ch
rom
oso
mal
loca
tio
nin
IBM
map
un
its
and
par
amet
ers
asso
ciat
edw
ith
maj
or
qu
anti
tati
vetr
ait
loci
(QT
L),
affe
ctin
gle
sio
nse
veri
tyco
nfe
rred
by
the
Rp
1-D
21ge
ne
Bin
1.05
aB
in9.
02B
in9.
03B
in10
.03
Tra
it2
LO
Din
terv
alb
acL
OD
d
R2
(%)e
2L
OD
inte
rval
aL
OD
R2
(%)
2L
OD
inte
rval
aL
OD
R2
(%)
2L
OD
inte
rval
aL
OD
R2
(%)
GH
nec
rosi
s46
3-47
3-48
20.
218.
914
241-
249-
257
0.16
5.2
817
4-17
9-18
50.
2311
19IN
nec
rosi
s16
4-16
5-17
80.
5813
24N
C’0
7n
ecro
sis
244-
249-
253
0.17
7.6
1117
1-17
8-18
60.
2615
.826
NC
’08
nec
rosi
s12
2-13
3.6-
142�
0.14
5.4
723
5-24
8-25
30.
125.
46
176-
180-
183
0.24
17.8
23O
vera
lln
ecro
sis
23
8-2
50
-25
30
.13
6.6
71
76
-17
8-1
81
0.2
52
1.3
26
GH
hei
ght
168-
173-
188
0.05
4.3
1IN
hei
ght
162-
165-
167
0.1
11.1
25N
C’0
7h
eigh
t17
0-17
9-18
60.
059.
918
NC
’08
hei
ght
165-
180-
196
0.02
8.4
13O
vera
llh
eigh
t2
38
-25
0-2
56
0.0
34
.25
16
9-1
79
-18
50
.06
18
26
NC
’07
anth
esis
169-
184-
196
0.96
5.2
11
Dat
aw
ere
der
ived
fro
ma
po
pu
lati
on
der
ived
fro
ma
cro
ssb
etw
een
the
Rp1
-D2
1-H
95m
aize
lin
eh
eter
ozy
gou
sfo
rR
p1-D
21
and
233
dif
fere
nt
lin
esfr
om
the
B73
3M
o17
adva
nce
din
terc
ross
IBM
po
pu
lati
on
.Th
ep
op
ula
tio
nw
asas
sess
edin
fou
ren
viro
nm
ents
:in
agr
een
ho
use
inw
inte
r20
06in
Ral
eigh
,No
rth
Car
oli
na
(den
ote
dG
H),
inth
efi
eld
inW
est
Laf
ayet
te,
Ind
ian
a,in
sum
mer
2007
(IN
),an
din
the
fiel
din
Cla
yto
n,
No
rth
Car
oli
na,
insu
mm
er20
07an
d20
08(N
C’0
7an
dN
C‘0
8).
Th
ree
dif
fere
nt
trai
tsw
ere
mea
sure
d:l
esio
nse
veri
tym
easu
red
on
a1–
5sc
ale
(wit
h1
bei
ng
com
ple
teab
sen
ceo
fle
sio
ns
and
5b
ein
gco
mp
lete
cove
rage
of
the
ear
leaf
wit
hle
sio
ns—
den
ote
das
‘‘nec
rosi
s’’
inth
eta
ble
),th
era
tio
bet
wee
nth
eav
erag
eh
eigh
to
fle
sio
nm
imic
and
wil
d-t
ype
ind
ivid
ual
sw
ith
inea
chF
1fa
mil
y(h
eigh
t),
and
the
aver
age
div
erge
nce
inti
me
toan
thes
isin
day
sb
etw
een
lesi
on
mim
ican
dw
ild
-typ
ein
div
idu
als
wit
hin
each
F1
fam
ily
(an
thes
is).
Lea
st-s
qu
ares
mea
ns
for
each
F1
fam
ily
ove
rth
eth
ree
fiel
den
viro
nm
ents
(IN
,NC
‘07,
NC
’08)
wer
eu
sed
toca
lcu
late
QT
Lfo
r‘‘o
vera
lln
ecro
sis’
’an
d‘‘o
vera
llh
eigh
t.’’
Th
ese
trai
tsar
esh
ow
nin
bo
ld.
aC
hro
mo
som
eb
inlo
cati
on
of
QT
Lp
eak
on
1o
fth
e10
chro
mo
som
eso
fth
em
aize
gen
om
e.B
ins
div
ide
the
gen
etic
map
into
100
app
roxi
mat
ely
equ
alse
gmen
ts.
Th
ese
gmen
tsar
ed
esig
nat
edw
ith
the
chro
mo
som
en
um
ber
foll
ow
edb
ya
two
-dig
itd
ecim
al(e
.g.,
1.00
,1.
01,
1.02
,an
dso
on
).bT
he
two
ou
ter
nu
mb
ers
rep
ort
the
po
siti
on
sth
atd
efin
eth
etw
oL
OD
inte
rval
aro
un
dth
ep
osi
tio
no
fp
eak
like
lih
oo
dfo
rth
eQ
TL
.Th
em
idd
len
um
ber
defi
nes
the
po
siti
on
of
the
pea
k.A
llva
lues
are
inIB
Mm
apu
nit
s(I
cM;
see
Ba
lin
t-K
ur
ti
etal
.20
07)
and
are
bas
edo
nth
eIB
M2
map
(htt
p://
ww
w.m
aize
gdb
.org
/m
ap.p
hp
).cT
he
add
itiv
eef
fect
of
the
QT
L.F
or
nec
rosi
sra
tin
gsth
isis
inte
rms
of
the
1–5
scal
e.F
or
hei
ght
rati
ngs
this
isin
term
so
fth
era
tio
wit
h‘‘1
’’m
ean
ing
a1:
1ra
tio
.Fo
ran
thes
isth
isis
inte
rms
of
day
s.A
po
siti
ven
um
ber
mea
ns
the
alle
lefo
rd
ecre
ased
sco
re(l
ow
erle
sio
nle
vel)
,in
crea
sed
rati
o,
or
dec
reas
edan
thes
isd
iffe
ren
tial
der
ived
fro
mB
73.
dT
he
log
of
od
ds
(LO
D)
valu
eat
the
po
siti
on
of
pea
kli
keli
ho
od
of
the
QT
L.
eR
2es
tim
ates
the
pro
po
rtio
no
fp
hen
oty
pic
vari
ance
(%)
exp
lain
edb
yth
ed
etec
ted
QT
L.
Mutant-Assisted Gene Identification and Characterization Identifies Variation Controlling HR 821
for under specific environmental conditions and it istherefore likely that the natural variation unearthed byMutant-Assisted Gene Identification and Characteriza-tion represents variation that could be adaptive andimmediately valuable.
For the HR response conferred by Rp1-D21, which is apartially dominant mutant, another significant advan-tage of this approach is that it provides a highly quan-titative and easy to measure parameter for the HR trait,which in the past could only be scored subjectively. Weshow that the severity of the HR response is positivelycorrelated with the degree of stunting experienced byan Rp1-D21 mutant, such that the more severe the HRresponse, the more severe was stunting of the Rp1-D21mutant. Thus using an Rp1-D21 mutant in heterozy-gous condition is beneficial, in that it allows the heightratio to be used as a highly sensitive and easy to recordparameter of the HR response. This measure also mit-igates against any bias that might arise as a result ofdifferent levels of heterotic vigor in different crosses.Height ratio obviously cannot be used with segregatingpopulation such as an F2 population in which everyindividual plant is genetically distinct. The remarkablegenetic background-dependant variation in the pheno-type conferred by Rp1-D21 is illustrated in Table1 andFigure 4. The fact that these comparisons were madebetween F1 hybrids, which shared 50% of their genomein common, makes the variation all the more noteworthy.
A major QTL, termed Hrml1, was detected in bin10.03 in every trait and every environment assessed.Hrml1 represents a major modifier of the Rp1-D21 lesionmimic phenotype, with the B73 allele at this locussuppressing the phenotype and the Mo17 allele en-hancing it. A recent review of the architecture of diseaseresistance in maize (Wisser et al. 2006), despite report-
ing coverage of 89% of the genome with diseaseresistance QTL, did not report a single major resistancegene or resistance QTL in bin 10.03, with the possibleexception of a single QTL for gray leaf spot resistance,which had been mapped with poor precision.
Further work is required to identify the gene or genesunderlying Hrml1. It is likely though that this locus isinvolved in the pathway controlling the elicitation orlocal spread of HR. We are currently performing de-tailed image analysis experiments designed to deter-mine whether the B73 Hrml1 allele suppresses lesioninitiation or lesion spread (or both). We are also cur-rently working to construct B73 near isogenic linesdiffering for Hrml1 We will further cross them to linescarrying other Rp1 alleles to confirm that this locus alsomodifies the wild-type Rp1-mediated response. It alsoremains to be determined whether Hrml1 modulatescell-death phenotypes conferred by other major, HR-conferring, maize disease-resistance genes such as Rxo(Zhao et al. 2004), other Rp genes (e.g., Webb et al.2002), and Rpp genes (Storey and Howland 1957;Futrell et al. 1975; Chen et al. 2004) and possibly alsoby non-HR causes of programmed cell death (Buckner
et al. 2000).It should be noted that, since we were assessing the
effect of these genes in F1 hybrids between IBM lines andthe Rp1-D21-H95 rather than in inbred lines, for amodifying locus to be detected, either the Mo17 or theB73 allele at that locus has to dominant or partiallydominant with respect to the allele in the Rp1-D21-H95line (i.e., they cannot both be completely recessive). Ifboth the Mo17 and B73 alleles were recessive to the Rp1-D21-H95 allele, then no modifying effect could have beendetected. It is therefore possible that some loss offunction alleles in B73 or Mo17 with strong modifying
Figure 6.—Chromosome 10 QTL likelihoodplots for various Rp1-D21-associated traits in var-ious environments: in a greenhouse in winter2006 in Raleigh, North Carolina (denotedGH), in the field in West Lafayette, Indiana, insummer 2007 (IN), and in the field in Clayton,North Carolina, in summer 2007 and 2008 (NC‘07 and NC ’08). Three different traits were mea-sured: lesion severity measured on a 1–5 scale(with 1 being complete absence of lesions and5 being complete coverage of the ear leaf withlesions—denoted as Necrosis), the ratio betweenthe average height of lesion mimic and wild-typeindividuals within each F1 family (Height), andthe average divergence in time to anthesis in daysbetween lesion mimic and wild-type individualswithin each F1 family (Anthesis). Data were de-rived from a population derived from a cross be-tween the Rp1-D21-H95 maize line heterozygousfor Rp1-D21 and 233 different lines from theB73 3 Mo17 advanced intercross IBM popula-tion. The y-axis shows the log of odds (LOD) like-lihood ratio, and the x-axis denotes the positionon the chromosome in IBM map units (Imu).
822 S. Chintamanani et al.

effects when present in homozygous form could havebeen missed by this approach. This class of modifierscould in theory be identified by generating additionalsegregating populations, such as a backcross or an F2
population such as the population used in this article toshow that Rp1-D21-suppressing alleles of Hrml1 also exitsin A632. Conversely, the A632 Hrml1 allele identified herecannot be completely dominant as otherwise a mixture ofA632 heterozygotes and homozygotes at the Hrml1 locuswould have been identified among the most repressedindividuals in the F2 population, rather than them allbeing A632 homozygotes. It is therefore quite likely thatthe Hrml1 suppressive allele is partially dominant in bothcases. Further work using near-isogenic lines will clarifythe allelic relationships at this locus.
It should also be noted that, in addition to Hrml1, theRp1 locus itself is present on chromosome 10. Howeverit is more than 100 IBM map units (approximatelyequivalent to 25 cM) away from the main QTL peak andtherefore cannot be responsible for the QTL. Toconfirm this we divided up the IBM population intotwo groups, one homozygous B73 across the Rp1 locusand the other homozygous Mo17 (there was also asizable group that was recombinant across the Rp1locus—this group was ignored for this analysis). A highlysignificant effect at Hrml1 was detected by analysis ofeach group separately (data not shown). In other words,an Hrml1 effect could be detected in populations inwhich Rp1 was not segregating. Further evidence for thefact that Hrml1 is not an Rp1 allele comes from theanalysis of the A632 3 Rp1-D21-H95 F2 population. Inthis case, all the F2 plants that show a Rp1-D21 pheno-type must be heterozygous at the Rp1 locus, with onecopy of Rp1-D21 and one copy of either the wild-typeA632 Rp1 allele or the wild-type H95 allele. In thispopulation the profound effect of Hrml1 can still bedetected as all the most suppressed plants are A632homozygotes at the Hrml1 locus.
Although Mutant-Assisted Gene Identification andCharacterization was conceived during genetic dissec-tion of genetic background effects on les23, a recessivelesion mimic mutant of maize (Penning et al. 2004), useof an aberrant phenotype to identify genes involved inspecifying specific phenotypes, one of the ideas un-derlying Mutant-Assisted Gene Identification and Char-acterization, has been used in the past in both plantsand animals. Indeed, most restorers of fertility genes inall crops have been identified essentially by geneticschemes akin to Mutant-Assisted Gene Identificationand Characterization (Duvick 1956). In Drosophila,many components of the sevens pathway that executeseye formation were identified using a genetically hyper-sensitive background generated by the ectopic expres-sion of a component of the pathway (Gibson andDworkin 2004). With Mutant-Assisted Gene Identifica-tion and Characterization we are able to additionallyharness both the large amount of genetic diversity in
maize (Liu et al. 2003) and the excellent genetic andgenomic resources available for the crop such as RILsand NILs for the discovery of natural genes or genevariants. A key advantage here is that, in many cases, onemust do the phenotyping only, the genotyping data ofthe resource being already available. The IBM mappingpopulation used to uncover Hrml1 is an AIL maizepopulation derived from a cross between the maizeinbreds B73 and Mo17 with four generations of randommating following the formation of the F2 generation andprior to the development of inbred lines (Lee et al.2002). The increased opportunity for recombinationhas had the effect of expanding the genetic mapapproximately fourfold compared to nonintermated,conventional RIL populations (Lee et al. 2002). The IBMpopulation consists of a relatively large number of lines(302), which have been densely genotyped with morethan 2000 molecular markers (Coe et al. 2002). Anotheradvantage of using RILs for gene discovery is that thescores are derived from families and not individualsegregants, as in an F2 population. So the same pop-ulation can be evaluated for multiple traits, multipletimes, and at multiple locations.
The maize nested association mapping (NAM) pop-ulation (Yu et al. 2008) is a recently established 5200-linemapping population that consists of 26 RIL subpopula-tions, each of which was derived from a cross betweenB73 and 1 of 25 other diverse lines. Additional Hrml locican almost certainly be identified using the NAMpopulation with an approach identical to that usedhere. We demonstrate in this work that a great deal ofdiversity capable of modulating the HR response existsin the NAM founders (Table 1). A study is underway inour labs to conduct a Mutant-Assisted Gene Identifica-tion and Characterization screen on the NAM RILs.
One concern could be whether Rp1-D21 triggers abona fide HR rather than causing cell death by someother mechanism. There are many reasons to suggestthat it does. First, we know that Rp1-D21 is an autoactiveallele of Rp1, a known disease resistance gene thatconfers an HR in response to specific P. sorghi isolates. Inaddition, Figures 2 and 3 show that the Rp1-D21phenotype is associated with the production of super-oxide and H2O2, together with the induction of thegenes PR1, PR5, PRms, and WIP1, all hallmarks of a bonafide HR. It should be noted that these genes can also beinduced by a defense response not including HR and byvarious other stresses including wounding (Casacuberta
et al. 1991, 1992; Rohrmeier and Lehle 1993; Morris
et al. 1998; Dunkle and Levy 2000). Even so, thepreponderance of evidence suggests that Rp1-D21triggers an exaggerated form of the normal maizehypersensitive response.
In 1983 it was proposed that mutants such as Rp1-D21could be used as ‘‘a simplified system for the plantresponse to disease and stress’’ without the causativeagent needing to be present (Walbot et al. 1983). In
Mutant-Assisted Gene Identification and Characterization Identifies Variation Controlling HR 823
this study we have used this approach in conjunctionwith the Mutant-Assisted Gene Identification and Char-acterization concept and with modern mapping resour-ces such as the IBM population. We have identifiedHrml1 as a naturally occurring suppressor allele onchromosome 10 and have demonstrated that manymore naturally occurring alleles likely effect the defenseresponse and can be identified in a straightforward way.Most important, we have demonstrated the utility of theMutant-Assisted Gene Identification and Characteriza-tion approach. Many mutants that could be exploitedfor Mutant-Assisted Gene Identification and Character-ization already exist in maize and many other plantsystems. For example, mutants that confer aluminumsensitivity (Pascholati et al. 1986; Sibov et al. 1999),alterations in starch accumulation (Braun et al. 2006),or sensitivity to drought (Postlethwait and Nelson
1957) are available and could be used in a conceptuallyvery similar way to that demonstrated here to identifyuseful variation in the traits that they affect. In othercases, mutagenesis screens could be designed to specif-ically identify mutants for use in Mutant-Assisted GeneIdentification and Characterization. Ultimately Mutant-Assisted Gene Identification and Characterization is anapproach that could be harnessed to identify naturallyoccurring, useful alleles important for a large number oftraits in many systems.
We are grateful to the following for assistance and valuable advice:Cliff Weil, Randy Wisser, Rebecca Nelson, Donna Stephens, KristenKump, Rahul Dhawan, and Hugh Young. This work was funded byUSDA–ARS, Purdue University, and a National Science Foundation(NSF) Grant 0822495.
LITERATURE CITED
Balint-Kurti, P. J., J. C. Zwonitzer, R. J. Wisser, M. L. Carson, M.Oropeza-Rosas et al., 2007 Precise mapping of quantitativetrait loci for resistance to southern leaf blight, caused by Cochlio-bolus heterostrophus race O, and flowering time using advanced in-tercross maize lines. Genetics 176: 645–657.
Bent, A. F., and D. Mackey, 2007 Elicitors, effectors, and R Genes:the new paradigm and a lifetime supply of questions. Ann. Rev.Phytopath. 45: 399–436.
Braun, D. M., Y. Ma, N. Inada, M. G. Muszynski and R. F. Baker,2006 Tie-dyed1 regulates carbohydrate accumulation in maizeleaves. Plant Physiol. 142: 1511–1522.
Buckner, B., G. S. Johal and D. Janick-Buckner, 2000 Cell deathin maize. Physiol. Plantarum 108: 231–239.
Campbell, C. L., and L. V. Madden, 1990 Introduction to Plant DiseaseEpidemiology, pp. 192–194. John Wiley & Sons, New York.
Casacuberta, J. M., P. Puigdomenech and B. San Segundo,1991 A gene coding for a basic pathogenesis-related pr-like pro-tein from Zea mays molecular cloning and induction by a fungusFusarium moniliforme in germinating maize Seeds. Plant Mol. Biol.16: 527–536.
Casacuberta, J. M., D. Raventos, P. Puigdomenech and B. San
Segundo, 1992 Expression of the gene encoding the Pr-likeprotein Prms in germinating maize embryos. Mol. Gen. Genet.234: 97–104.
Chen, C. X., Z. L. Wang, D. E. Yang, C. J. Ye, Y. B. Zhao et al.,2004 Molecular tagging and genetic mapping of the disease re-sistance gene RppQ to southern corn rust. Theor. Appl. Genet.108: 945–950.
Coe, E., K. Cone, M. McMullen, S.-S. Chen, G. Davis et al.,2002 Access to the maize genome: an integrated physical andgenetic map. Plant Physiol. 128: 9–12.
Collins, N., J. Drake, M. Ayliffe, Q. Sun, J. Ellis et al.,1999 Molecular characterization of the maize Rp1-D rust resis-tance haplotype and its mutants. Plant Cell 11: 1365–1376.
Dodds, P. N., G. J. Lawrence, A. M. Catanzariti, T. Teh, C. I. Wang
et al., 2006 Direct protein interaction underlies gene-for-gene specificity and coevolution of the flax resistance genesand flax rust avirulence genes. Proc. Natl. Acad. Sci. USA 103:8888–8893.
Dunkle, L. D., and M. Levy, 2000 Genetic relatedness of Africanand United States populations of Cercospora zeae-maydis. Phyto-path. 90: 486–490.
Duvick, D. N., 1956 Allelism and comparative genetics of fertilityrestoration of cytoplasmically pollen sterile maize. Genetics 41:544–565.
Futrell, M. C., A. L. Hooker and G. E. Scott, 1975 Resistance inmaize to corn rust, controlled by a single dominant gene. CropSci. 15: 597–599.
Gibson, G., and I. Dworkin, 2004 Uncovering cryptic genetic var-iation. Nature Rev. Genet. 5: 681–690.
Goritschnig, S., Y. Zhang and X. Li, 2007 The ubiquitin pathway isrequired for innate immunity in Arabidopsis. Plant J. 49: 540–551.
Holub, E. B., 2007 Natural variation in innate immunity of a pio-neer species. Curr. Op. Plant Biol. 10: 415–424.
Hu, G., T. E. Richter, S. H. Hulbert and T. Pryor, 1996 Diseaselesion mimicry caused by mutations in the rust resistance geneRp1. Plant Cell 8: 1367–1376.
Johal, G. S., P. Balint-Kurti and C. F. Weil, 2008 Mining and har-nessing natural variation: a little MAGIC. Crop Sci. 48: 2066–2073.
Jones, J. D. G., and J. L. Dangl, 2006 The plant immune system.Nature 444: 323–329.
Lee, M., N. Sharopova, W. D. Beavis, D. Grant, M. Katt et al.,2002 Expanding the genetic map of maize with the intermatedB73 X Mo17 (IBM) population. Plant Mol. Biol. 48: 453–461.
Levine, A., R. Tenhaken, R. Dixon and C. Lamb, 1994 H2O2 fromthe oxidative burst orchestrates the plant hypersensitive diseaseresistance response. Cell 79: 583–593.
Li, X., J. D. Clarke, Y. Zhang and X. Dong, 2001 Activation of anEDS1-mediated R-gene pathway in the snc1 mutant leads to con-stitutive, NPR1-independent pathogen resistance. Mol. Plant-Microbe Interact. 14: 1131–1139.
Liu, K., M. Goodman, S. Muse, J.-S. Smith, E. Buckler et al.,2003 Genetic structure and diversity among maize inbred linesas inferred from DNA microsatellites. Genetics 165: 2117–2128.
Mackey, D., Y. Belkhadir, J.-M. Alonso, J.-R. Ecker and J.-L. Dangl,2003 Arabidopsis RIN4 is a target of the type III virulence effec-tor AvrRpt2 and modulates RPS2-mediated resistance. Cell 112:379–389.
Morris, S. W., B. Vernooij, S. Titatarn, M. Starrett, S. Thomas
et al., 1998 Induced resistance responses in maize. Mol. PlantMicrobe Interact. 11: 643–658.
Mur, L. A., P. Kenton, A. J. Lloyd, H. Ougham and E. Prats,2007 The hypersensitive response: The centenary is upon usbut how much do we know? J. Exp. Bot. 59: 501–520.
Page, D. R., and U. Grossniklaus, 2002 The art and design ofgenetic screens: Arabidopsis thaliana. Nat. Rev. Genet. 3:124–136.
Palma, K., Y. Zhang and X. Li, 2005 An importin alpha homolog,MOS6, plays an important role in plant innate immunity. Curr.Biol. 15: 1129–1135.
Pascholati, S. F., R. L. Nicholson and L. G. Butler,1986 Phenylalanine ammonia-lyase activity and anthocyaninaccumulation in wounded maize Zea–Mays mesocotyls. Phyto-pathol. Z.
Penning, B. W., G. S. Johal and M. M. McMullen, 2004 A majorsuppressor of cell death, slm1, modifies the expression of themaize (Zea mays L.) lesion mimic mutation les23. Genome 47:961–969.
Postlethwait, S. N., and O. E. Nelson, 1957 A chronically wiltedmutant of maize. Am. J. Bot. 44: 628–633.
Pryor, A. J., 1993 Transposon tagging of a rust resistance gene inmaize, pp. 469–475 in Advances in Molecular Genetics of Plant–
824 S. Chintamanani et al.

Microbe Interactions, edited by E. Nester and D. Verma. KluwerAcademic, Dordrecht, The Netherlands.
Rohrmeier, T., and L. Lehle, 1993 WIP1, a wound-inducible genefrom maize with homology to Bowman–Birk proteinase inhibi-tors. Plant Mol. Biol. 22: 783–792.
Shaner, G., and P. E. Finney, 1977 The effect of nitrogen fertilizeron expression of slow mildewing resistance in Knox wheat. Phy-topath. 67: 1051–1056.
Sibov, S. T., M. Gaspar, M. J. Silva, L. M. M. Ottoboni, P. Arruda et al.,1999 Two genes control aluminum tolerance in maize: ge-netic and molecular mapping analyses. Genome 42: 475–482.
Simmons, C. R., J. T. Tossberg, G. A. Sandahl, W. A. Marsh, P. F.Dowd et al., 2002 Maize pathogen defenses activated by aviru-lence gene avrRxv. Maize Genet. Coop. Newsl. 76: 40–41.
Storey, H. H., and A. K. Howland, 1957 Resistance in maize to thetropical American rust fungus, Puccinia polysora Underw. I. GenesRpp1 and Rpp2. Heredity 11: 289–301.
Sun, Q., N. Collins, M. Ayliffe, S. M. Smith, J. Drake et al.,2001 Recombination between paralogues at the Rp1 rust resis-tance locus in maize. Genetics 158: 423–438.
Thordal-Christensen, H., Z. G. Zhang, Y. D. Wei and D. B. Collinge,1997 Subcellular localization of H2O2 in plants: H2O2 accumula-tion in papillae and hypersensitive response during the barley-powdery mildew interaction. Plant J. 11: 1187–1194.
Walbot, V., D. Hoisington and M. G. Neuffer, 1983 Disease le-sion mimic mutations, pp. 431–432 in Genetic Engineering ofPlants, edited by T. Kosuge, C. P. Meredith and A. Hollaender.Plenum Press, New York.
Webb, C. A., T. E. Richter, N. C. Collins, M. Nicolas, H. N. Trick
et al., 2002 Genetic and molecular characterization of the maizeRp3 rust resistance locus. Genetics 162: 381–394.
Wisser, R. J., P. J. Balint-Kurti and R. J. Nelson, 2006 The geneticarchitecture of disease resistance in maize: a synthesis of pub-lished studies. Phytopath. 96: 120–129.
Xin, Z., J. P. Velten, M. J. Oliver and J. J. Burke, 2003 High-throughput DNA extraction method suitable for PCR. BioTech-niques 34: 820–826.
Yu, J., J. B. Holland, M. D. McMullen and E. S. Buckler,2008 Genetic design and statistical power of nested associationmapping in maize. Genetics 178: 539–551.
Zhang, Y., S. Goritschnig, X. Dong and X. Li, 2003 A gain-of-functionmutation in a plant disease resistance gene leads to constitutiveactivation of downstream signal transduction pathways in sup-pressor of npr1–1, constitutive 1. Plant Cell 15: 2636–2646.
Zhang, Y., and X. Li, 2005 A putative nucleoporin 96 Is required forboth basal defense and constitutive resistance responses medi-ated by suppressor of Npr1–1, constitutive 1. Plant Cell 17:1306–1316.
Zhao, B. Y., E. Ardales, E. Brasset, L. E. Claflin, J. E. Leach et al.,2004 The Rxo1/ Rba1 locus of maize controls resistance reac-tions to pathogenic and non-host bacteria. Theor. Appl. Genet.109: 71–79.
Communicating editor: A. H. Paterson
Mutant-Assisted Gene Identification and Characterization Identifies Variation Controlling HR 825


![Identification and Characterization of Maize oury4 …Identification and Characterization of Maizefloury4 as a Novel Semidominant Opaque Mutant That Disrupts Protein Body Assembly1[W][OPEN]](https://img.pdfslide.net/doc/110x75/5e4a4e7897d31144b35737e6/identiication-and-characterization-of-maize-oury4-identiication-and-characterization.jpg)