Embed Size (px)
Citation preview
Identification and Evaluation of Potential Best Practices for Greenhouse Gas Emissions Reductions in Freight Transportation
Identification and Evaluation of Potential Best Practices for Greenhouse Gas Emissions Reductions in Freight Transportation
H. Christopher Frey, Ph.D.
Department of Civil, Construction, and Environmental EngineeringNorth Carolina State UniversityRaleigh, NC 27695
Prepared for:
Chair’s Air Pollution Seminar Air Resources Board California Environmental Protection AgencySacramento, California
January 9, 2008
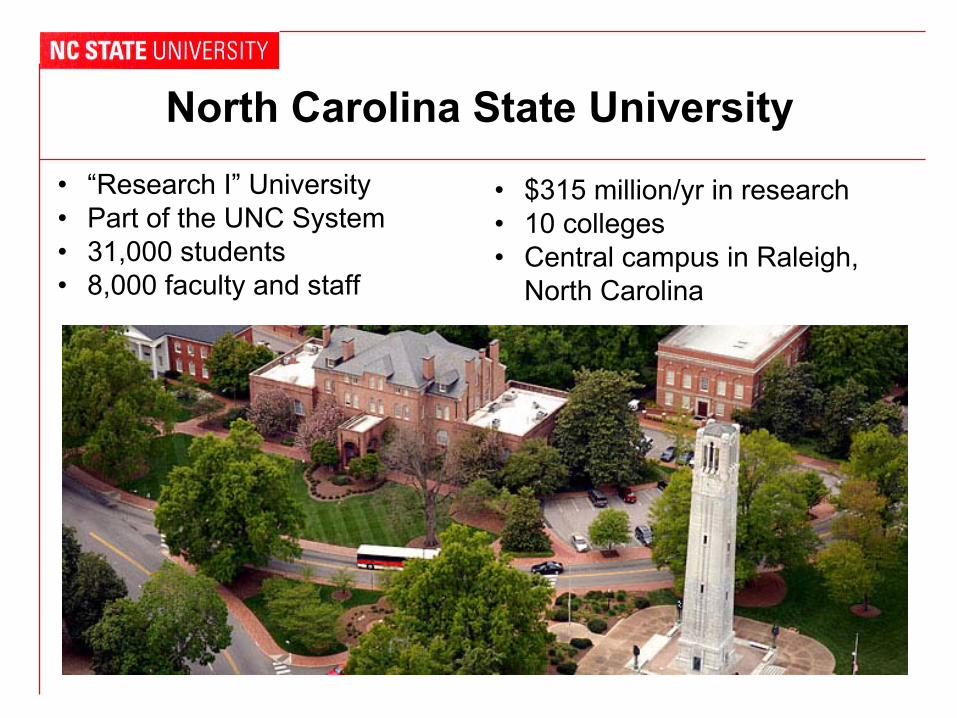
North Carolina State University • “Research I” University • $315 million/yr in research • Part of the UNC System • 10 colleges • 31,000 students • Central campus in Raleigh, • 8,000 faculty and staff North Carolina
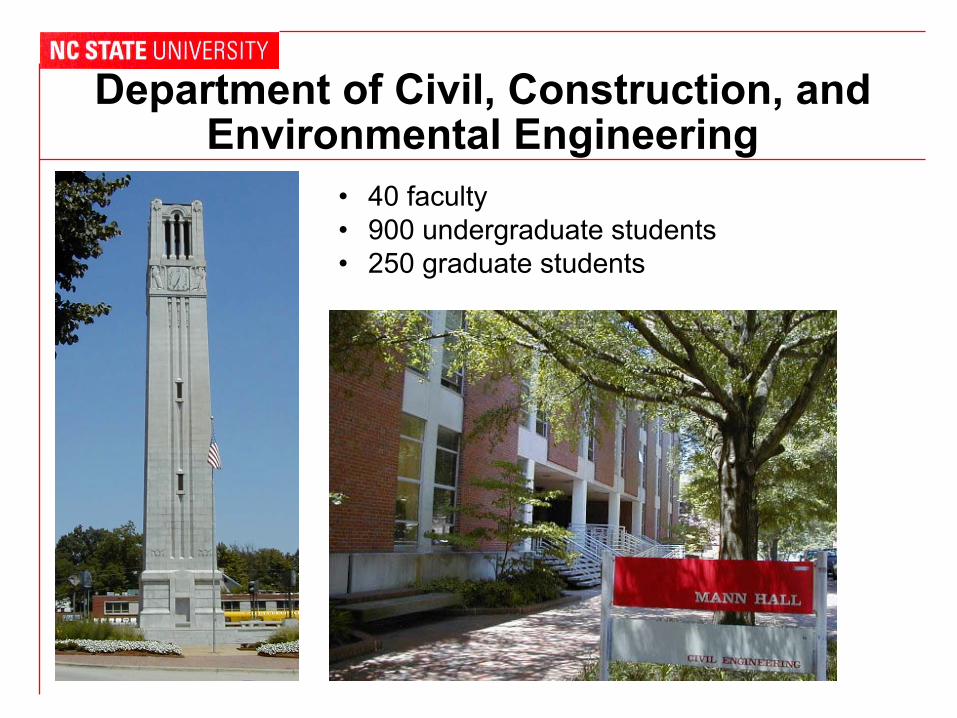
Department of Civil, Construction, andEnvironmental Engineering
• 40 faculty • 900 undergraduate students • 250 graduate students
Energy and Environmental Research
• Measurement and modeling of activity, fuel use, and emissions of onroad and nonroad vehicles, using Portable Emission Measurement Systems (PEMS)
• Modeling and evaluation of advanced power generation and environmental control technologies
• Quantification of uncertainty in emission inventories • Life cycle inventory and energy mix modeling of energy
technologies and systems • Environmental exposure and risk assessment • Systems analysis methods for environmental models:
variability, uncertainty, sensitivity, optimization
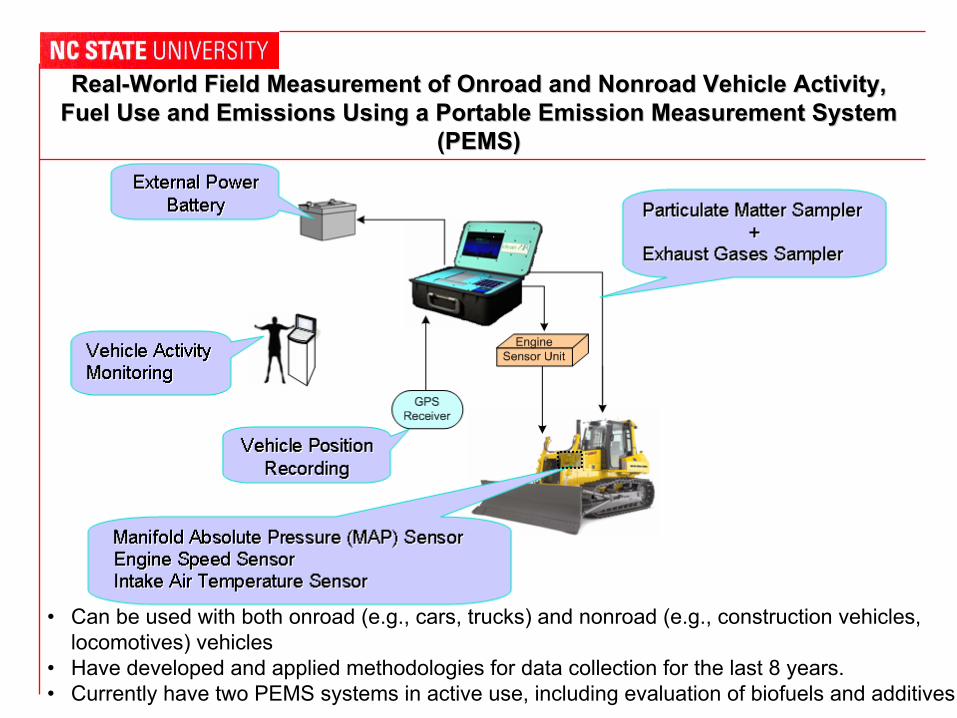
Real-World Field Measurement of Onroad and Nonroad Vehicle Activity, Fuel Use and Emissions Using a Portable Emission Measurement System
(PEMS)
Real-World Field Measurement of Onroad and Nonroad Vehicle Activity, Fuel Use and Emissions Using a Portable Emission Measurement System
(PEMS)
• Can be used with both onroad (e.g., cars, trucks) and nonroad (e.g., construction vehicles, locomotives) vehicles
• Have developed and applied methodologies for data collection for the last 8 years. • Currently have two PEMS systems in active use, including evaluation of biofuels and additives
Related Research and Projects
• Measurement and Modeling of Real-World Vehicle Emissions
– Development of Micro-scale and Modal Models of Fuel Use and Emissions Rates
– Light Duty Gasoline Vehicles, Light Duty Diesel Vehicles, Heavy Duty Diesel Vehicles (e.g., dump trucks,combination trucks, cement mixers), Nonroad vehicles (e.g., backhoes, bulldozers, excavators, front-endloaders, motor graders, skid steer loaders, nonroad dump trucks)
– Comparison of B20 versus petroleum diesel – Evaluation of fuel additive – Assessment of duty cycles – Comparison of engine certification tiers
Related Research and Projects
• Assessment of auxiliary power units for long-haul sleeper cab freight trucks
– Field data collection on 20 trucks for approx. 1 year in collaboration with Volvo
– Detailed analysis of vehicle activity, fuel use, and emissions for APU and base engines
• Effect of Land-Use on Mobile Source Emissions – Assessment of land-use scenarios – Development of new modal emission modes for advanced
vehicle technologies – Coupling of a travel demand model and new emissions models
to estimate mobile source emissions inventory • Life cycle inventory modeling for comparison of alternative fuels
and vehicle technologies (e.g., biodiesel, ethanol, electric vehicles)
• Evaluation of highway emissions on near-roadway air quality
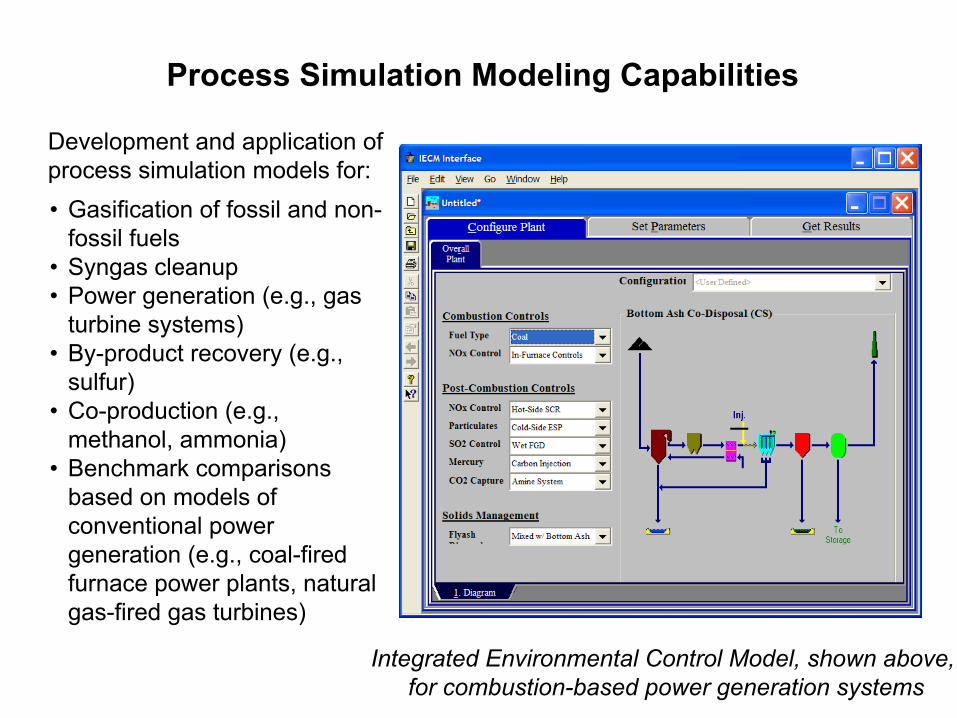
Process Simulation Modeling Capabilities
Development and application of process simulation models for: • Gasification of fossil and non-
fossil fuels • Syngas cleanup • Power generation (e.g., gas
turbine systems) • By-product recovery (e.g.,
sulfur) • Co-production (e.g.,
methanol, ammonia) • Benchmark comparisons
based on models of conventional power generation (e.g., coal-fired furnace power plants, natural gas-fired gas turbines)
Integrated Environmental Control Model, shown above, for combustion-based power generation systems
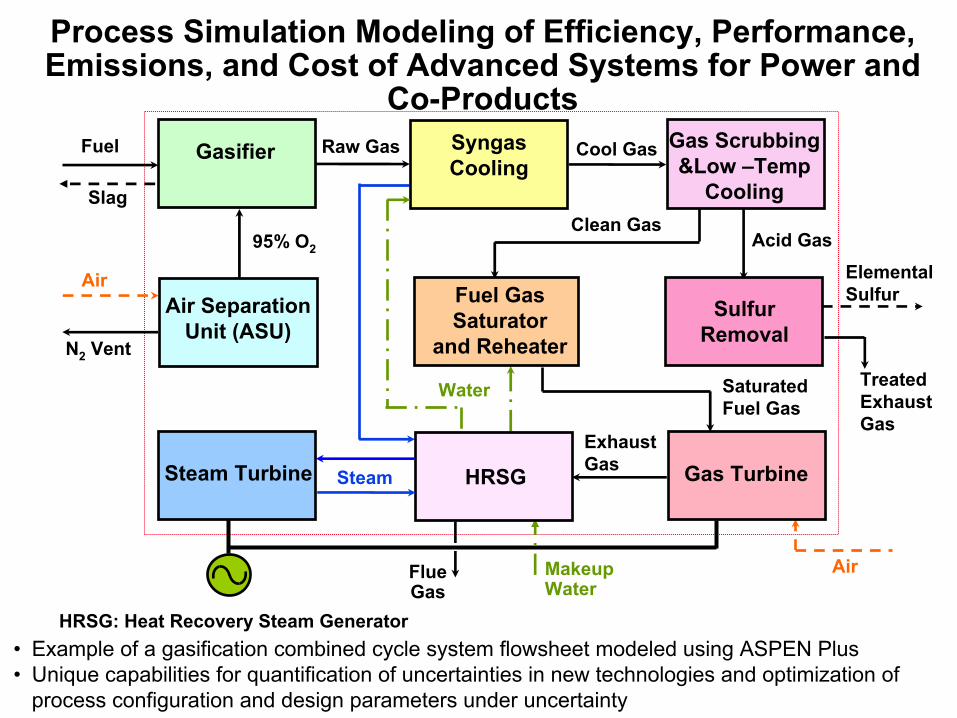
Process Simulation Modeling of Efficiency, Performance,Emissions, and Cost of Advanced Systems for Power and
Co-Products
HRSG: Heat Recovery Steam Generator
Air
Slag
Acid Gas Clean Gas
95% O2
Fuel Raw GasGasifier Syngas Cooling
Cool Gas
MakeupWater
Sulfur Removal
Fuel Gas Saturator
and Reheater
Water
Air Separation Unit (ASU)
N2 Vent
Air
Exhaust Gas
Steam HRSGSteam Turbine
Elemental Sulfur
Saturated Fuel Gas
Treated Exhaust Gas
Gas Turbine
Gas Scrubbing &Low –Temp
Cooling
Flue Gas
• Example of a gasification combined cycle system flowsheet modeled using ASPEN Plus • Unique capabilities for quantification of uncertainties in new technologies and optimization of
process configuration and design parameters under uncertainty
ObjectivesObjectives
• Identify and characterize potential best practices for reduction of greenhouse gas (GHG) emissions from the freight transportation sector
• Quantify and compare the potential reductions in GHG emissions
• Analyze cost effectiveness of each best practice if quantitative cost information is available
• Develop a guidebook regarding these best practices
Outline
• Definition of Key Concepts • Study Methodology • List of Best Practices • Total Modal GHG Emissions Reductions • Comparisons of Best Practices Whose Costs
Are Assessed Quantitatively • Inter-modal Substitutions • Overview of the Guidebook • Conclusions and Recommendations
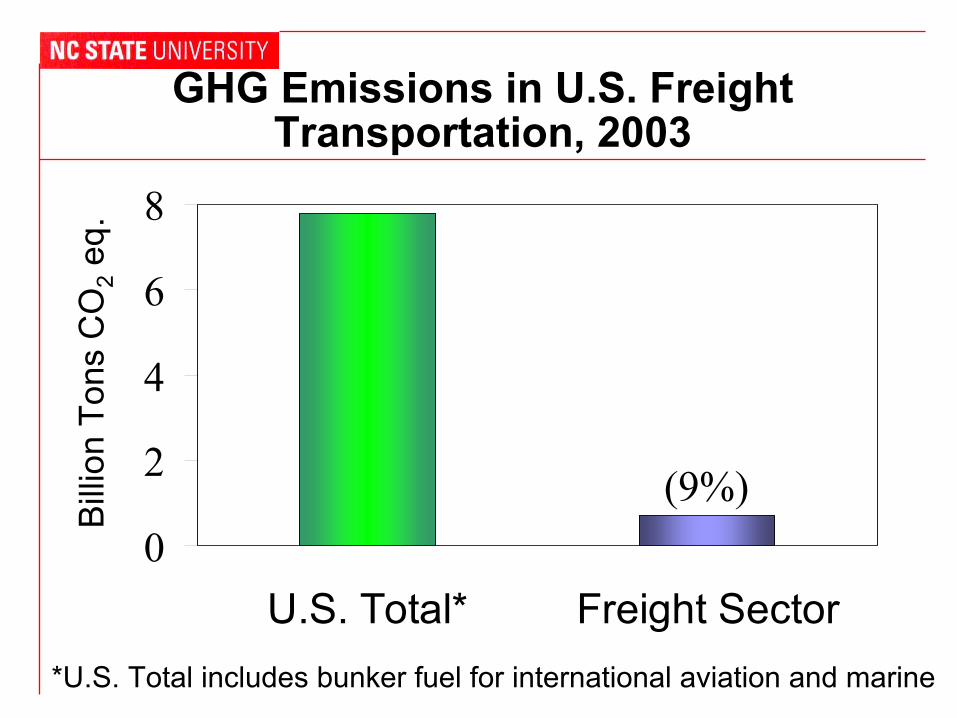
GHG Emissions in U.S. FreightTransportation, 2003
0
2
4
6
8
(9%)
Bill
ion
Tons
CO
2 eq
.
U.S. Total* Freight Sector *U.S. Total includes bunker fuel for international aviation and marine
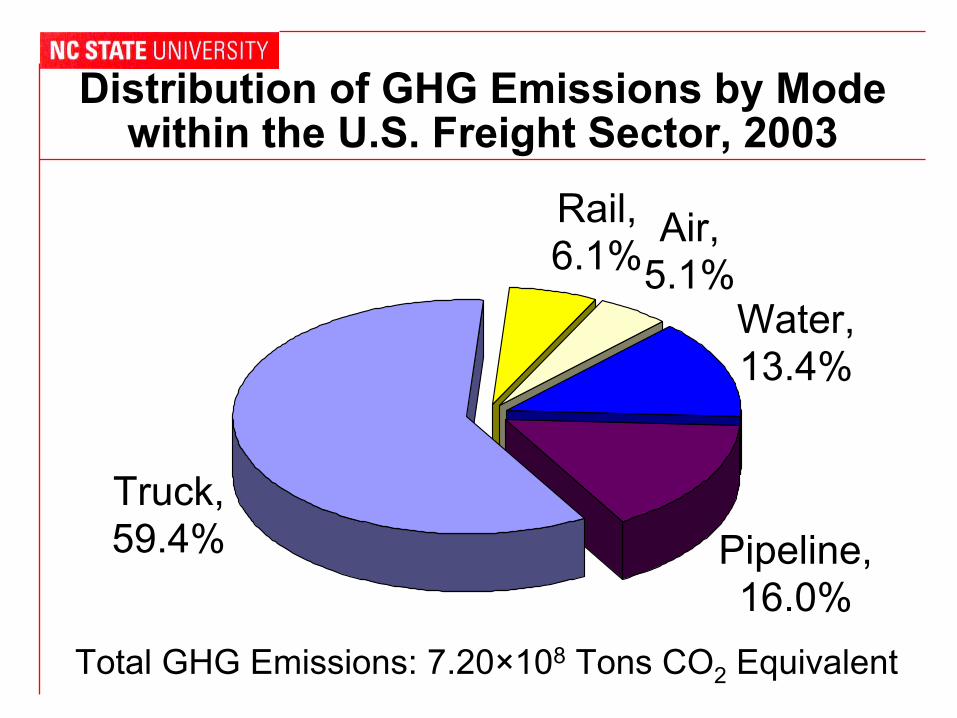
Distribution of GHG Emissions by Modewithin the U.S. Freight Sector, 2003
Rail, Air,6.1%5.1%
Water, 13.4%
Truck, 59.4% Pipeline,
16.0% Total GHG Emissions: 7.20×10⁸ Tons CO2 Equivalent
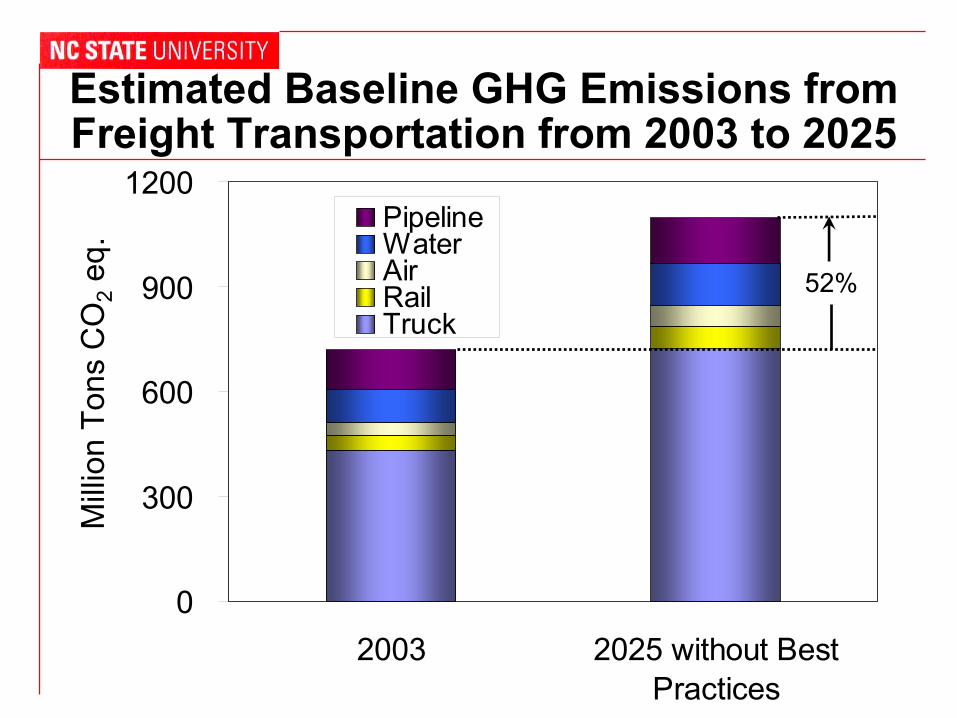
Estimated Baseline GHG Emissions from Freight Transportation from 2003 to 2025
1200
900
600
300
0
Mill
ion
Tons
CO
2 eq
.
2003 2025 without Best Practices
PipelineWater Air Rail Truck
52%
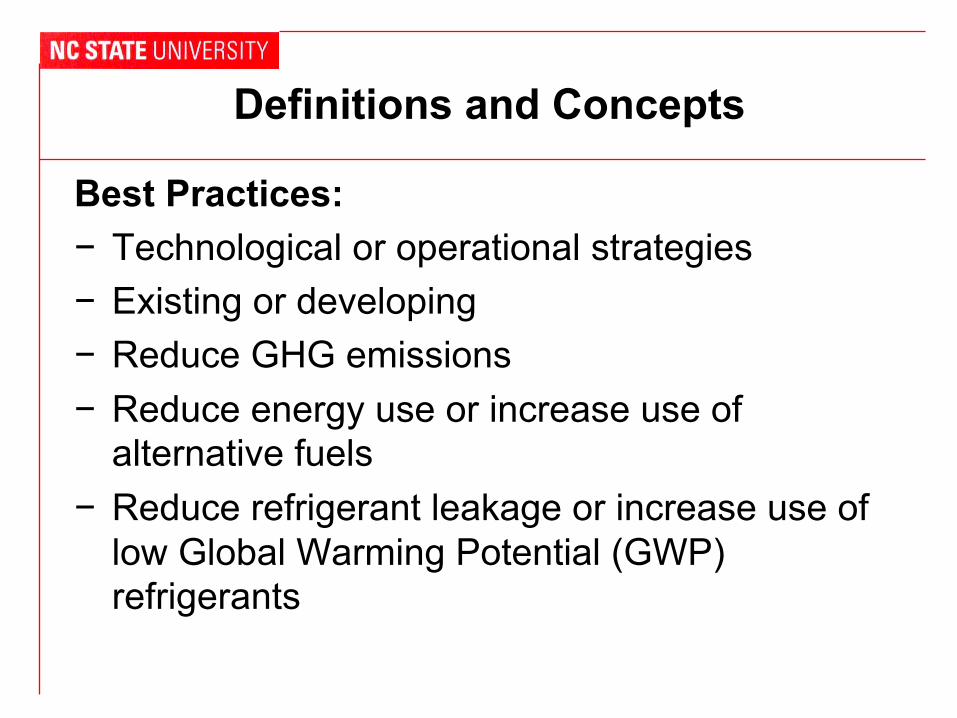
Definitions and Concepts
Best Practices: − Technological or operational strategies − Existing or developing − Reduce GHG emissions − Reduce energy use or increase use of
alternative fuels − Reduce refrigerant leakage or increase use of
low Global Warming Potential (GWP) refrigerants
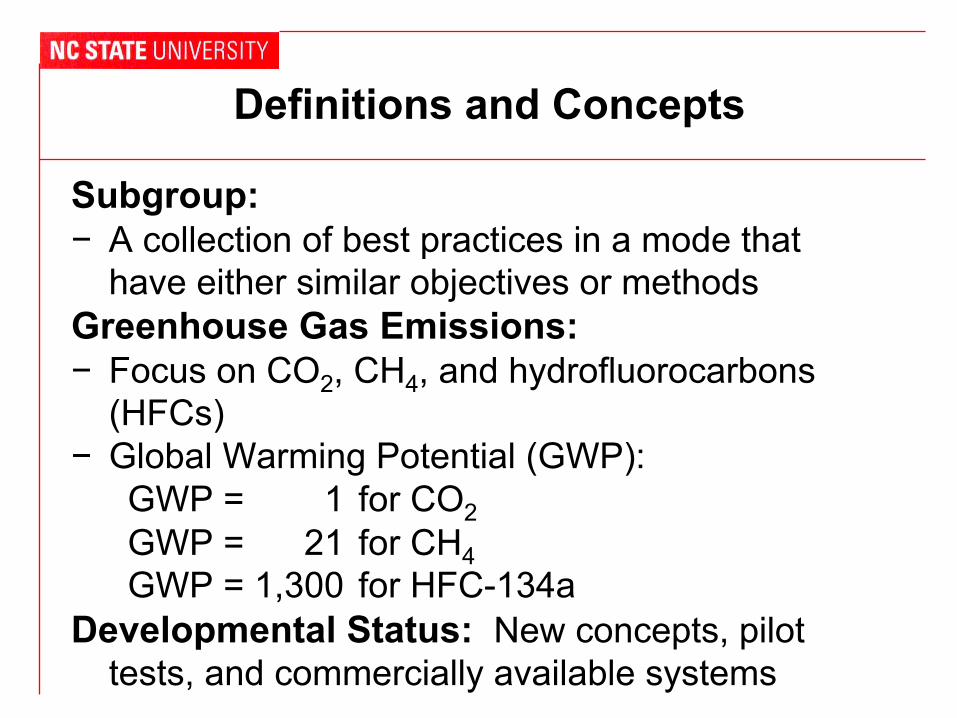
Definitions and Concepts
Subgroup: − A collection of best practices in a mode that
have either similar objectives or methods Greenhouse Gas Emissions: − Focus on CO2, CH4, and hydrofluorocarbons
(HFCs) − Global Warming Potential (GWP):
GWP = 1 for CO2 GWP = 21 for CH4 GWP = 1,300 for HFC-134a
Developmental Status: New concepts, pilot tests, and commercially available systems
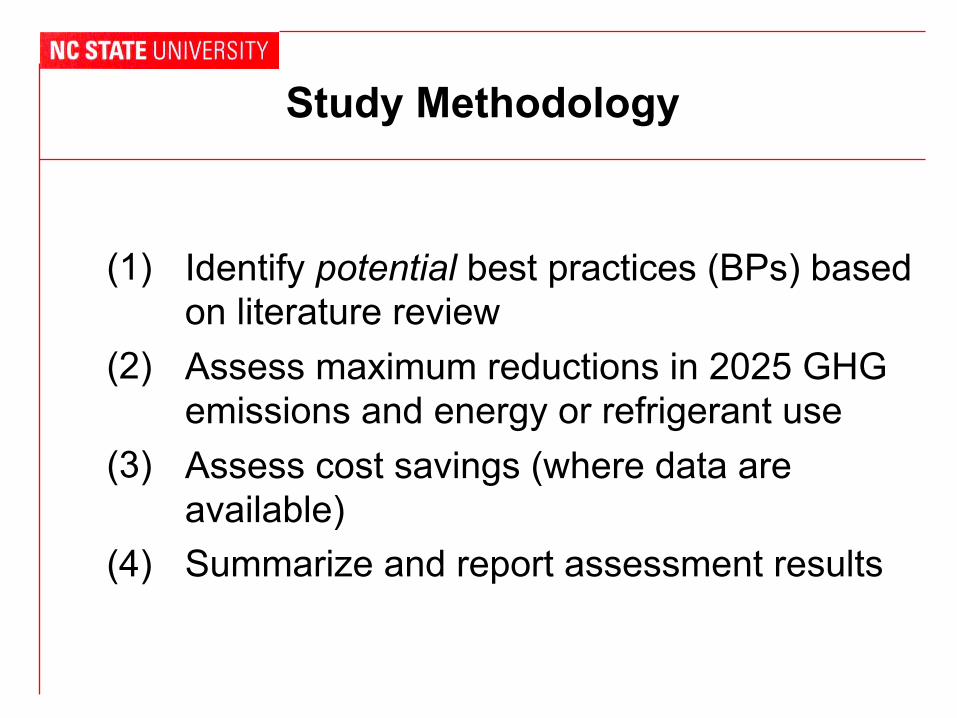
Study Methodology
(1) Identify potential best practices (BPs) based on literature review
(2) Assess maximum reductions in 2025 GHG emissions and energy or refrigerant use
(3) Assess cost savings (where data are available)
(4) Summarize and report assessment results
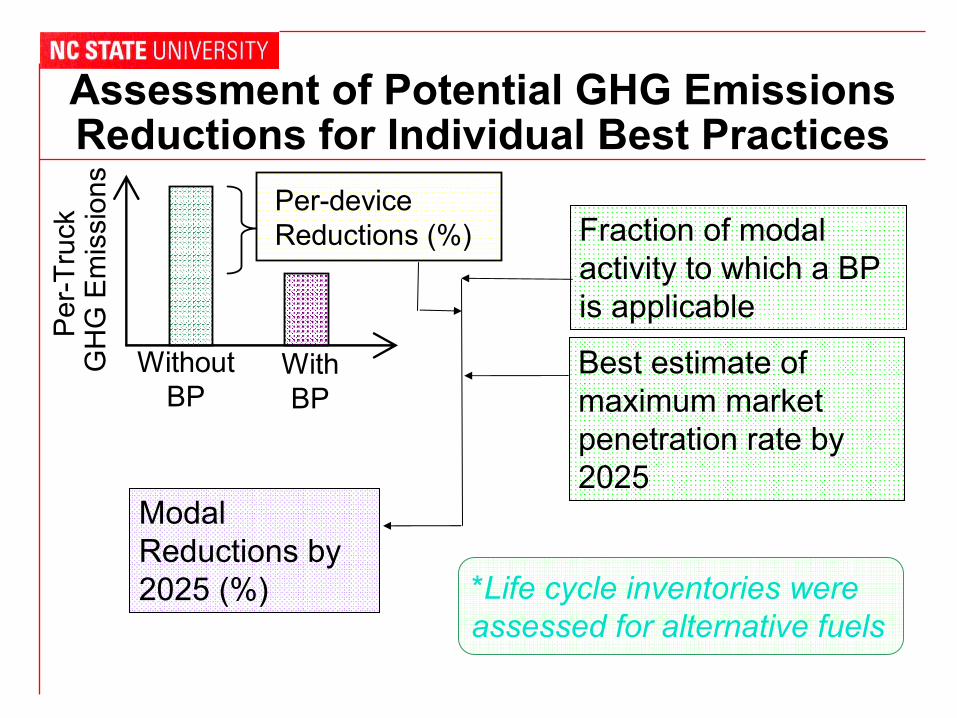
GH
G E
mis
sion Per-device
Reductions (%) Fraction of modal activity to which a BP is applicable
s
Without With Best estimate of BP BP maximum market
penetration rate by 2025
Modal
Per
-Tru
ck
Assessment of Potential GHG Emissions Reductions for Individual Best Practices
Reductions by 2025 (%) *Life cycle inventories were
assessed for alternative fuels
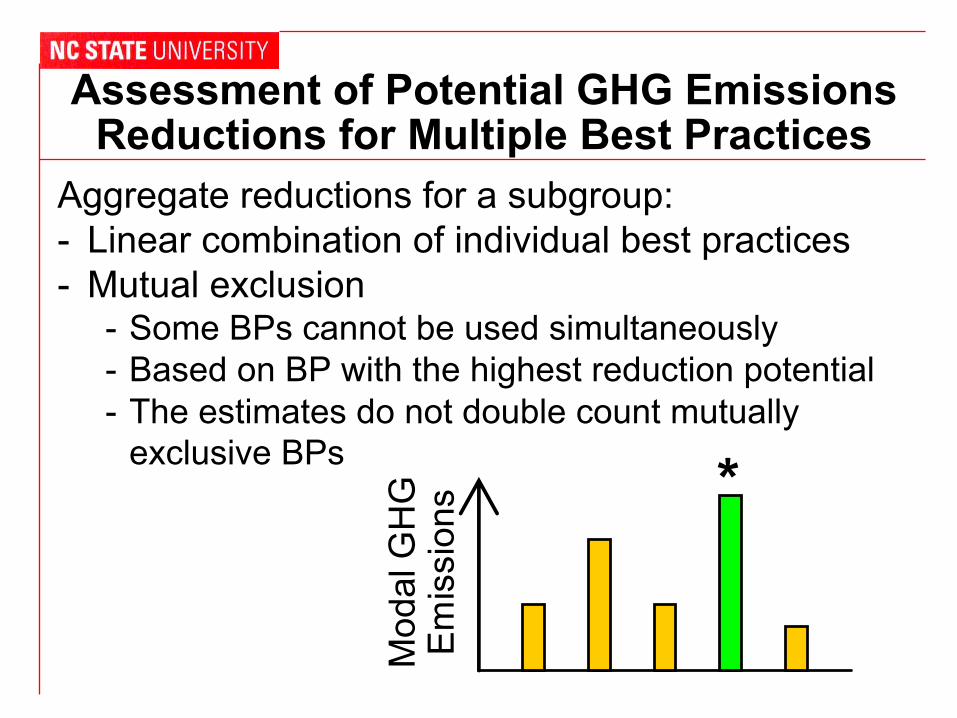
Assessment of Potential GHG Emissions Reductions for Multiple Best Practices
Aggregate reductions for a subgroup: - Linear combination of individual best practices - Mutual exclusion
- Some BPs cannot be used simultaneously - Based on BP with the highest reduction potential - The estimates do not double count mutually
exclusive BPs *M
odal
GH
GEm
issi
ons

Assessment of Potential GHG Emissions Reductions for Multiple Best Practices
Aggregate reductions for a subgroup: - Interaction:
- Some BPs can be used together but interact ?
- Quantification of interaction is unknown or not reported
- Used a linear combination as an estimate
- May overestimate the maximum possible reduction for the subgroup
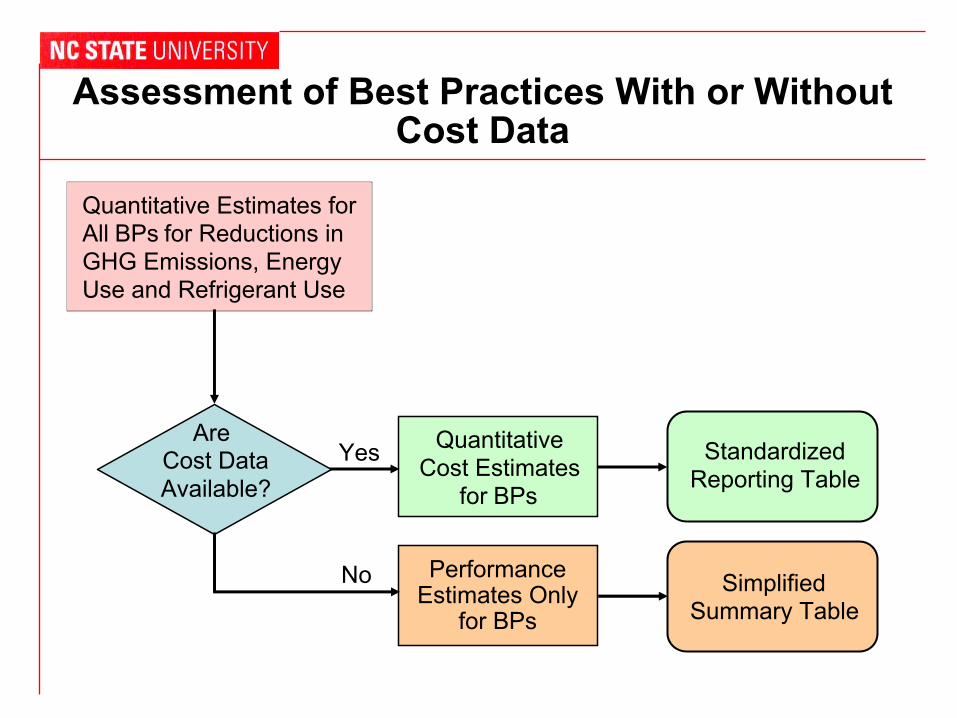
Assessment of Best Practices With or Without Cost Data
Quantitative Estimates for All BPs for Reductions in GHG Emissions, Energy Use and Refrigerant Use
Quantitative Cost Estimates
for BPs
Standardized Reporting Table
Simplified Summary Table
Are Cost Data Available?
Yes
Performance Estimates Only
for BPs
No
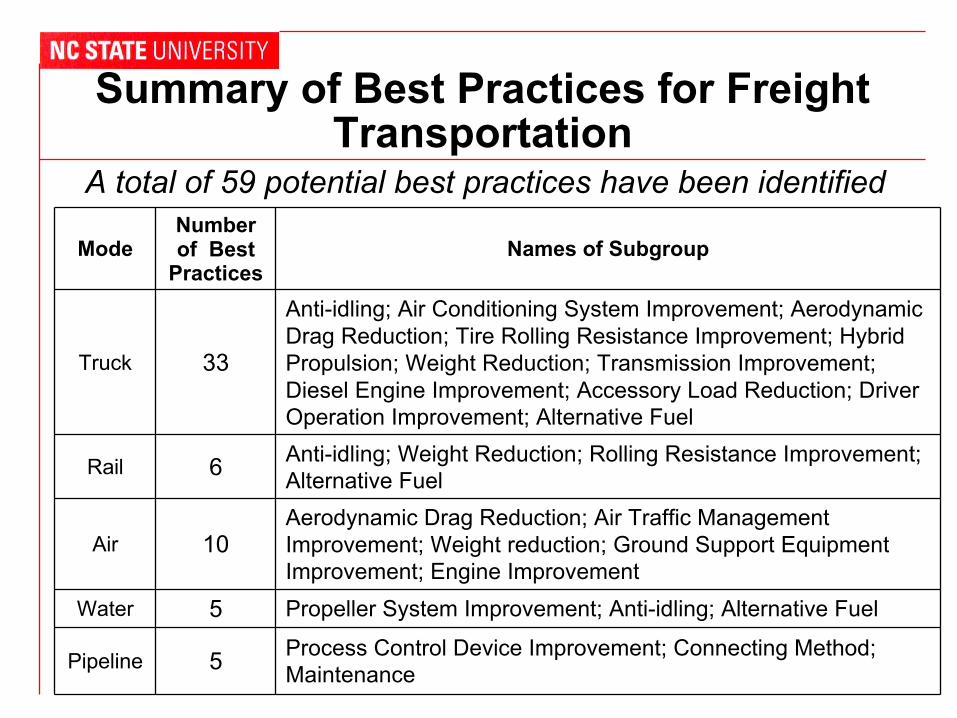
Summary of Best Practices for FreightTransportation
A total of 59 potential best practices have been identified
Mode Number of Best
Practices Names of Subgroup
Truck 33
Anti-idling; Air Conditioning System Improvement; Aerodynamic Drag Reduction; Tire Rolling Resistance Improvement; Hybrid Propulsion; Weight Reduction; Transmission Improvement; Diesel Engine Improvement; Accessory Load Reduction; Driver Operation Improvement; Alternative Fuel
Rail 6 Anti-idling; Weight Reduction; Rolling Resistance Improvement; Alternative Fuel
Air 10 Aerodynamic Drag Reduction; Air Traffic Management Improvement; Weight reduction; Ground Support Equipment Improvement; Engine Improvement
Water 5 Propeller System Improvement; Anti-idling; Alternative Fuel
Pipeline 5 Process Control Device Improvement; Connecting Method; Maintenance
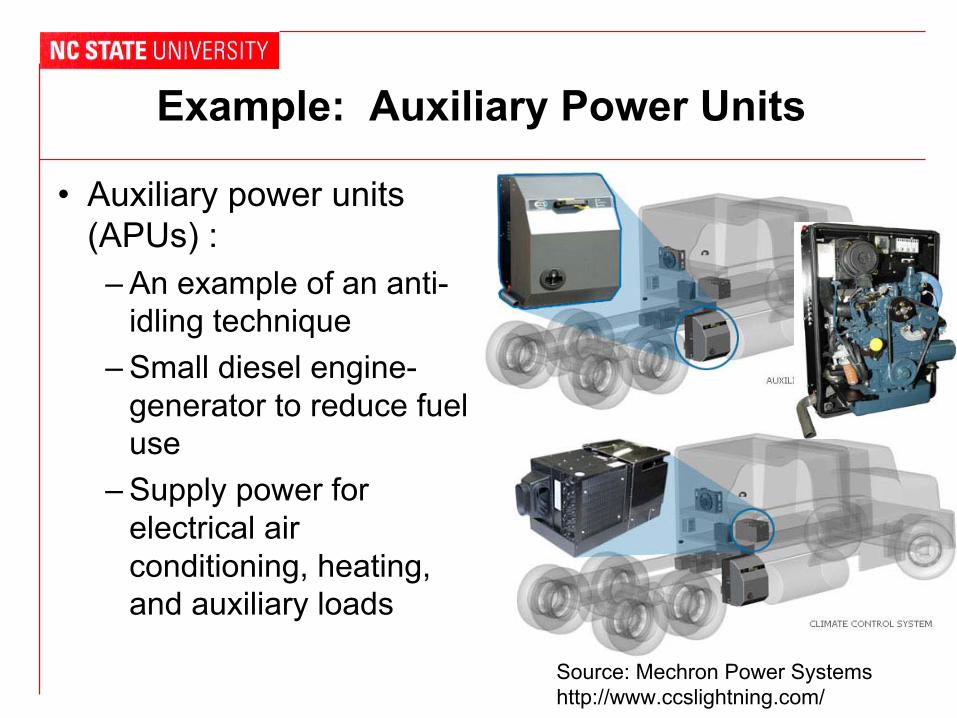
Example: Auxiliary Power Units
• Auxiliary power units (APUs) :
– An example of an anti-idling technique
– Small diesel engine-generator to reduce fuel use
– Supply power for electrical air conditioning, heating, and auxiliary loads
Source: Mechron Power Systems http://www.ccslightning.com/
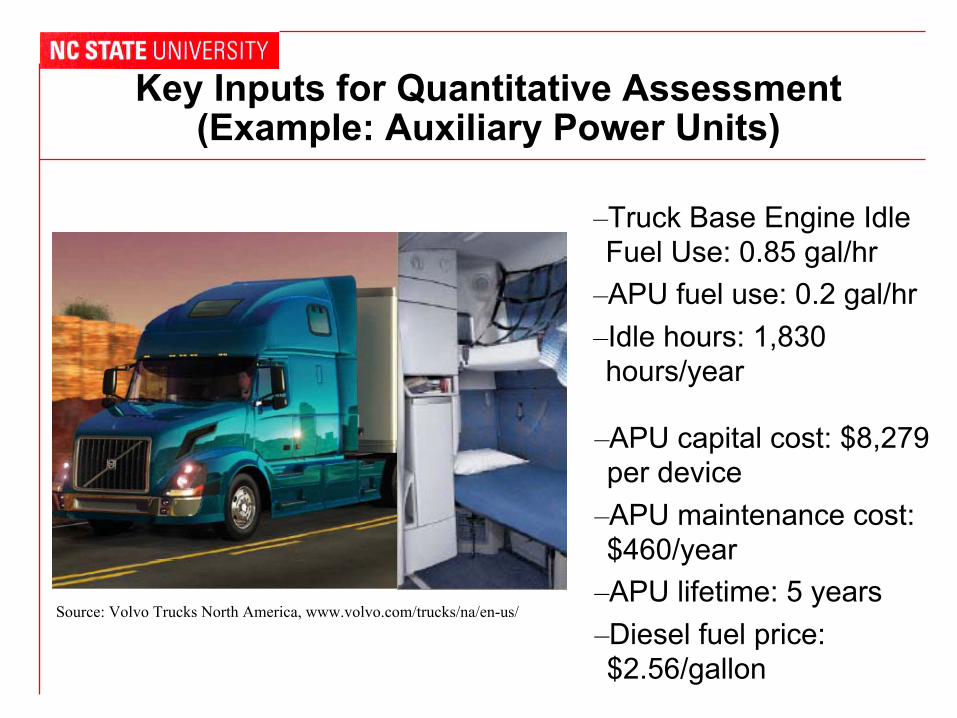
Key Inputs for Quantitative Assessment(Example: Auxiliary Power Units)
Source: Volvo Trucks North America, www.volvo.com/trucks/na/en-us/
–Truck Base Engine Idle Fuel Use: 0.85 gal/hr
–APU fuel use: 0.2 gal/hr –Idle hours: 1,830 hours/year
–APU capital cost: $8,279 per device
–APU maintenance cost: $460/year
–APU lifetime: 5 years –Diesel fuel price: $2.56/gallon
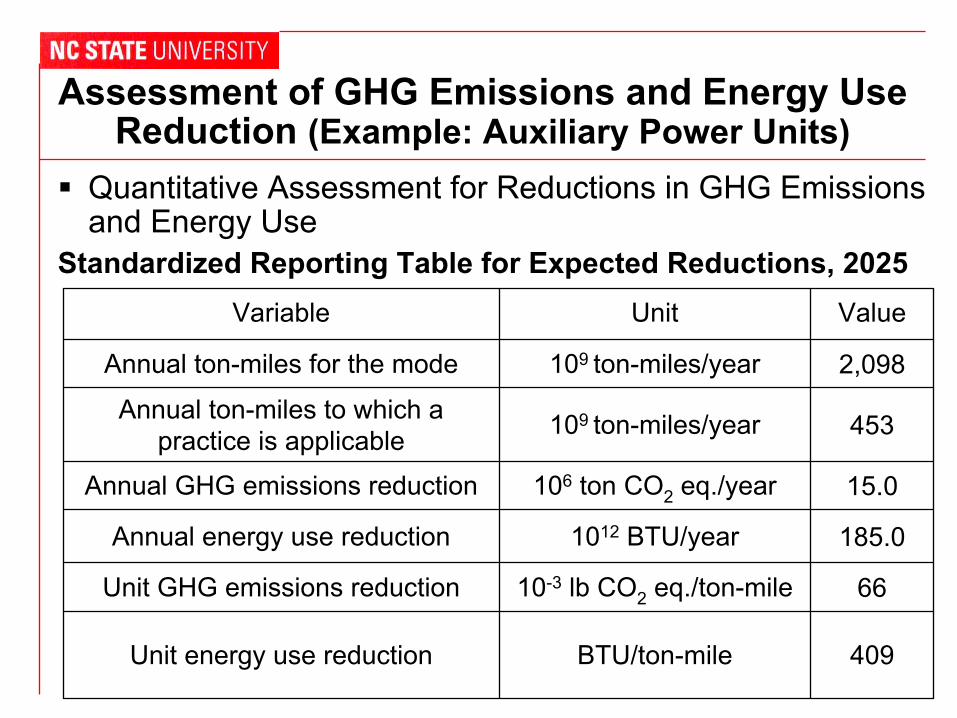
Assessment of GHG Emissions and Energy UseReduction (Example: Auxiliary Power Units)
Quantitative Assessment for Reductions in GHG Emissions and Energy Use
Standardized Reporting Table for Expected Reductions, 2025 Variable Unit Value
Annual ton-miles for the mode 109 ton-miles/year 2,098
Annual ton-miles to which a practice is applicable 109 ton-miles/year 453
Annual GHG emissions reduction 106 ton CO2 eq./year 15.0
Annual energy use reduction 1012 BTU/year 185.0
Unit GHG emissions reduction 10-3 lb CO2 eq./ton-mile 66
Unit energy use reduction BTU/ton-mile 409
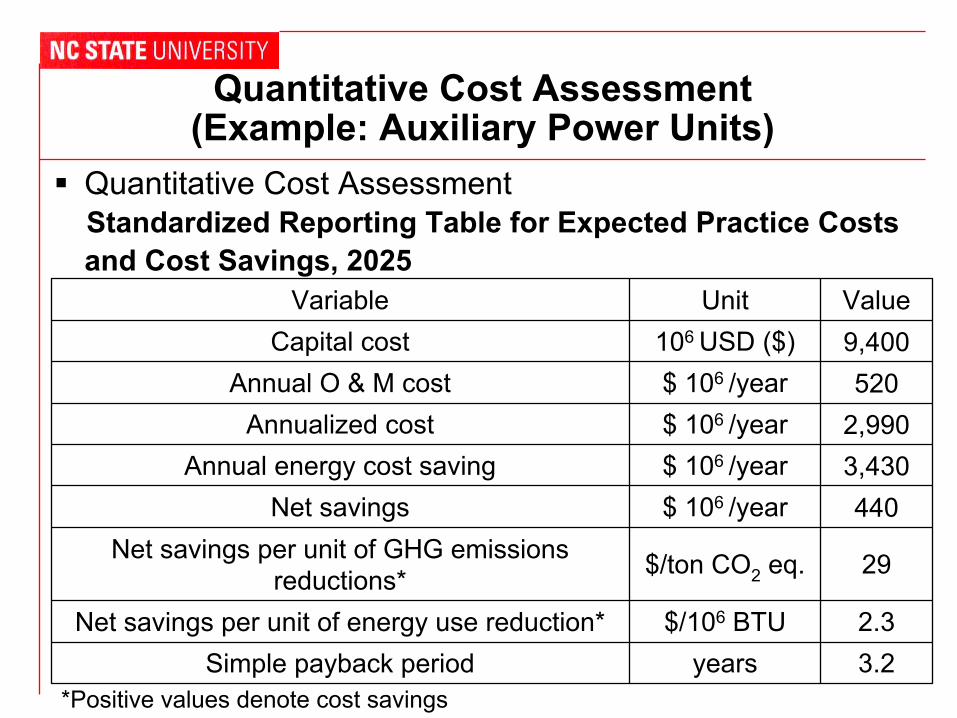
Quantitative Cost Assessment (Example: Auxiliary Power Units)
Quantitative Cost Assessment Standardized Reporting Table for Expected Practice Costs and Cost Savings, 2025
Variable Capital cost
Annual O & M cost Annualized cost
Annual energy cost saving Net savings
Net savings per unit of GHG emissions reductions*
Net savings per unit of energy use reduction* Simple payback period
Unit Value 106 USD ($) 9,400 $ 106 /year 520 $ 106 /year 2,990 $ 106 /year 3,430 $ 106 /year 440
$/ton CO2 eq. 29
$/106 BTU 2.3 years 3.2
*Positive values denote cost savings
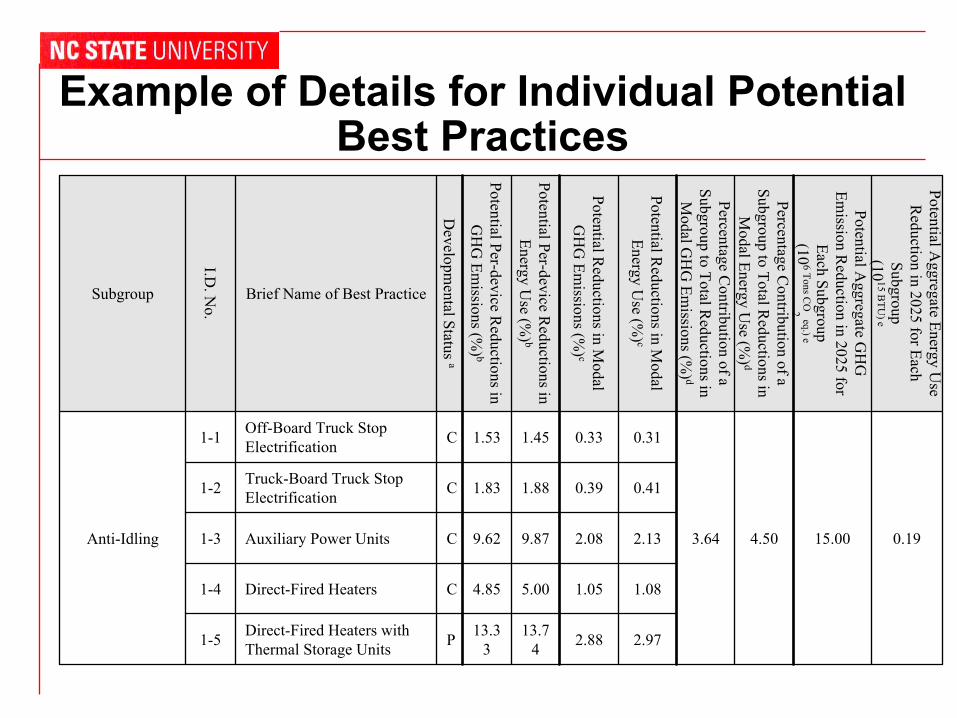
Example of Details for Individual PotentialBest Practices
Subgroup
I.D. N
o.
Brief Name of Best Practice
Developm
ental Status a
Potential Per-device Reductions in
GH
G Em
issions (%) b
Potential Per-device Reductions in
Energy Use (%
) b
Potential Reductions in M
odalG
HG
Emissions (%
) c
Potential Reductions in M
odalEnergy U
se (%) c
Percentage Contribution of a
Subgroup to Total Reductions in
Modal G
HG
Emissions (%
) d
Percentage Contribution of a
Subgroup to Total Reductions in
Modal Energy U
se (%) d
Potential Aggregate G
HG
Em
ission Reduction in 2025 for
Each Subgroup(10
6 Tons CO
eq.) e
2
Potential Aggregate Energy U
se R
eduction in 2025 for Each Subgroup(10 15 B
TU) e
1-1 Off-Board Truck Stop Electrification C 1.53 1.45 0.33 0.31
3.64 4.50 15.00 0.19
1-2 Truck-Board Truck Stop Electrification C 1.83 1.88 0.39 0.41
Anti-Idling 1-3 Auxiliary Power Units C 9.62 9.87 2.08 2.13
1-4 Direct-Fired Heaters C 4.85 5.00 1.05 1.08
1-5 Direct-Fired Heaters with Thermal Storage Units P 13.3
3 13.7
4 2.88 2.97
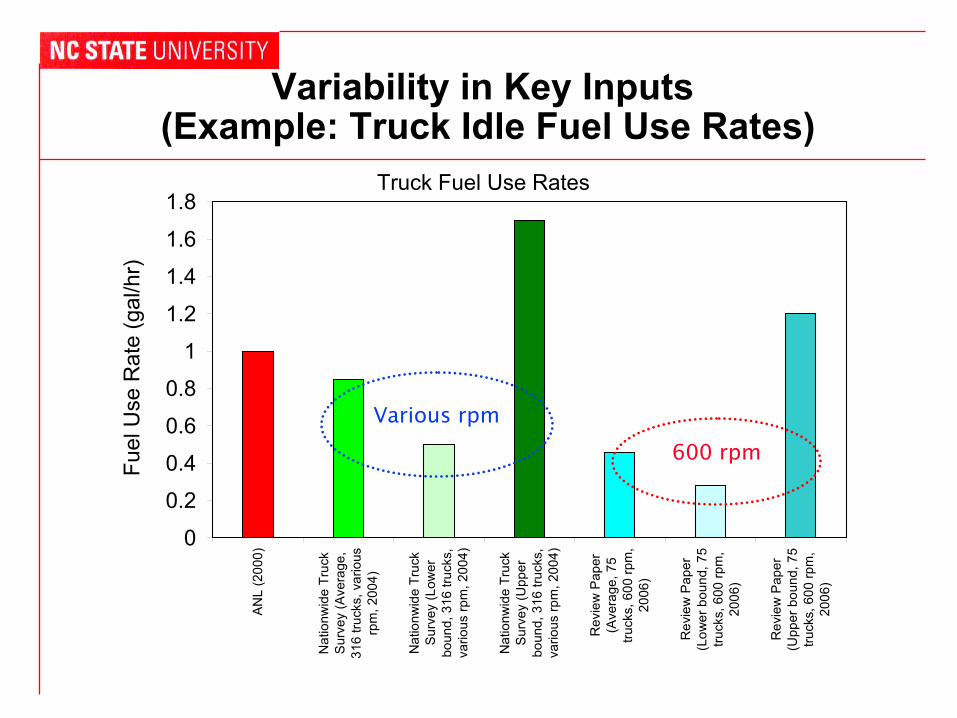
Variability in Key Inputs(Example: Truck Idle Fuel Use Rates)
Truck Fuel Use Rates
0
0.2
0.4
0.6
0.8
1
1.2
1.4
1.6
1.8
AN
L (2
000)
Nat
ionw
ide
Truc
kS
urve
y (A
vera
ge,
316
truck
s, v
ario
usrp
m, 2
004)
Nat
ionw
ide
Truc
kS
urve
y (L
ower
boun
d, 3
16 tr
ucks
,va
rious
rpm
, 200
4)
Nat
ionw
ide
Truc
kS
urve
y (U
pper
boun
d, 3
16 tr
ucks
,va
rious
rpm
, 200
4)
Rev
iew
Pap
er(A
vera
ge, 7
5tru
cks,
600
rpm
,20
06)
Rev
iew
Pap
er(L
ower
bou
nd, 7
5tru
cks,
600
rpm
,20
06)
Rev
iew
Pap
er(U
pper
bou
nd, 7
5tru
cks,
600
rpm
,20
06)
Fuel
Use
Rat
e (g
al/h
r)
Various rpm
600 rpm
Mec
hron
(14,
000
BTU
/hrC
oolin
g, 0
kW
load
,Vo
lvo
Test
ed, 2
007)
Mec
hron
(14,
000
BTU
/hrC
oolin
g, 6
kW
load
,Vo
lvo
Test
ed, 2
007)
Cum
min
s (1
4,00
0 BT
U/h
rCoo
ling,
0 k
Wlo
ad, V
olvo
Tes
ted,
200
7)
Cum
min
s (1
4,00
0 B
TU/h
rCoo
ling,
3.6
kW
load
, Vol
vo T
este
d, 2
007)
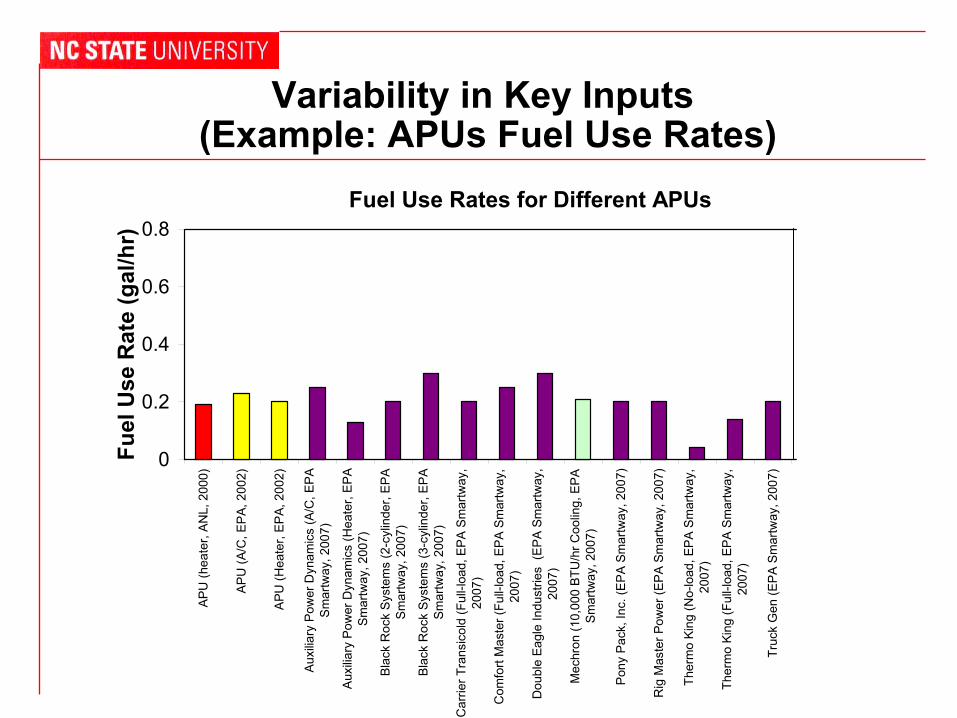
Variability in Key Inputs(Example: APUs Fuel Use Rates)
Fuel Use Rates for Different APUs
0
0.2
0.4
0.6
0.8 A
PU (h
eate
r, A
NL,
200
0)
APU
(A/C
, EPA
, 200
2)
APU
(Hea
ter,
EPA,
200
2)
Auxi
liary
Pow
er D
ynam
ics
(A/C
, EPA
Sm
artw
ay, 2
007)
Aux
iliary
Pow
er D
ynam
ics
(Hea
ter,
EPA
Smar
tway
, 200
7)
Blac
k R
ock
Syst
ems
(2-c
ylin
der,
EPA
Sm
artw
ay, 2
007)
Blac
k R
ock
Syst
ems
(3-c
ylin
der,
EPA
Sm
artw
ay, 2
007)
Car
rier T
rans
icol
d (F
ull-l
oad,
EPA
Sm
artw
ay,
2007
)
Com
fort
Mas
ter (
Full-
load
, EP
A S
mar
tway
,20
07)
Dou
ble
Eagl
e In
dust
ries
(EP
A Sm
artw
ay,
2007
)
Mec
hron
(10,
000
BTU
/hr C
oolin
g, E
PAS
mar
tway
, 200
7)
Pon
y Pa
ck, I
nc. (
EP
A Sm
artw
ay, 2
007)
Rig
Mas
ter P
ower
(EP
A Sm
artw
ay, 2
007)
Ther
mo
King
(No-
load
, EP
A S
mar
tway
,20
07)
Ther
mo
King
(Ful
l-loa
d, E
PA
Sm
artw
ay,
2007
)
Truc
k G
en (E
PA
Sm
artw
ay, 2
007)
Fuel
Use
Rat
e (g
al/h
r)
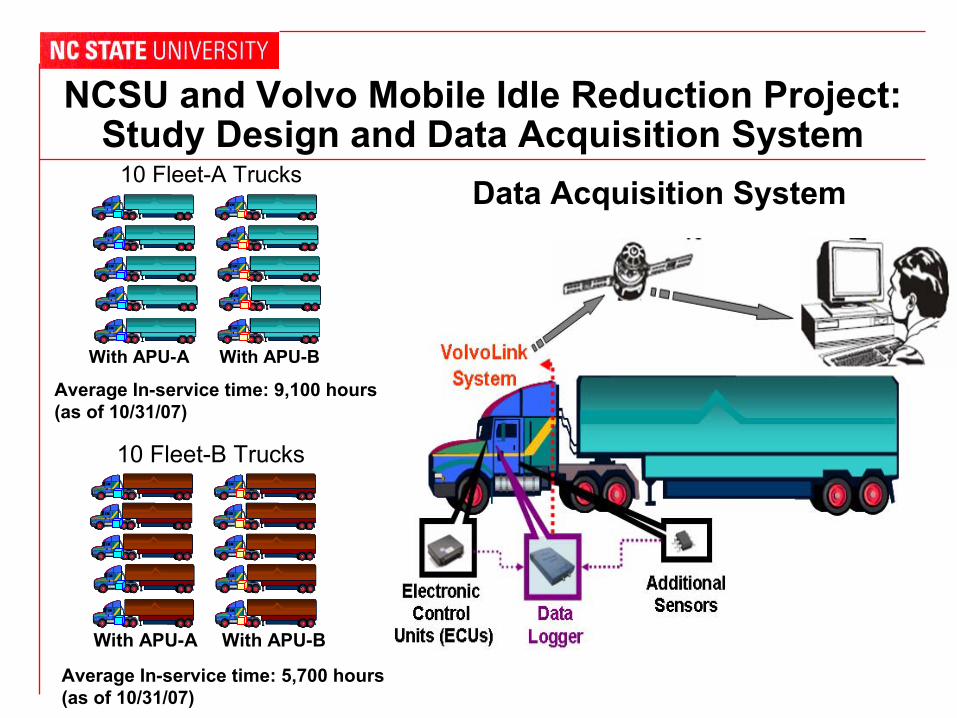
NCSU and Volvo Mobile Idle Reduction Project:Study Design and Data Acquisition System
10 Fleet-A Trucks Data Acquisition System
With APU-A With APU-B
Average In-service time: 9,100 hours (as of 10/31/07)
10 Fleet-B Trucks
With APU-A With APU-B
Average In-service time: 5,700 hours (as of 10/31/07)
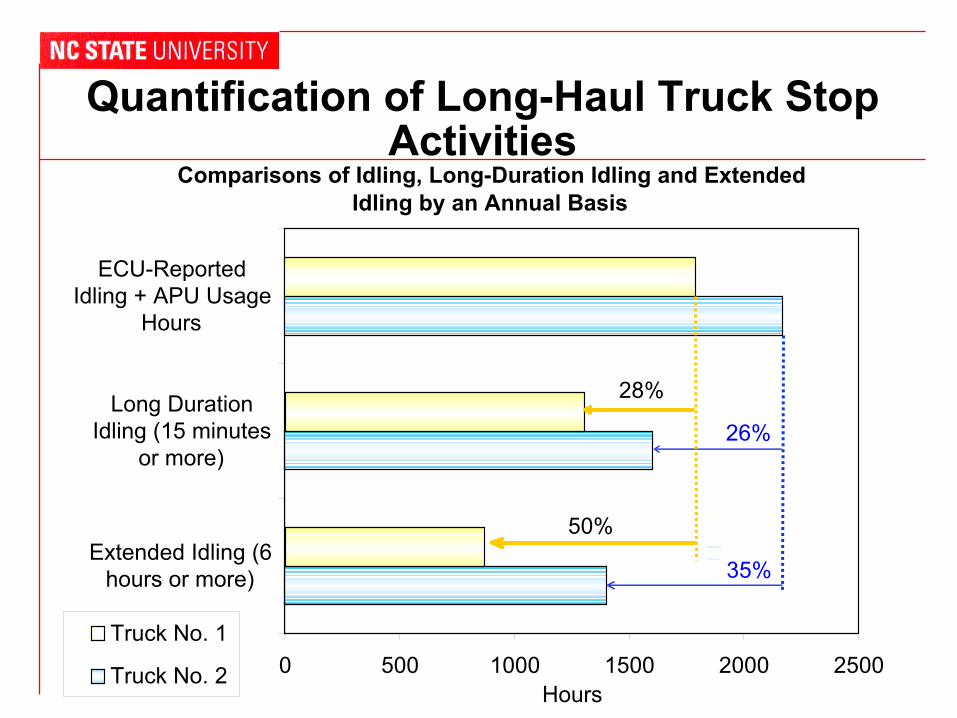
Quantification of Long-Haul Truck StopActivities
Comparisons of Idling, Long-Duration Idling and Extended Idling by an Annual Basis
ECU-Reported Idling + APU Usage
Hours
Long Duration Idling (15 minutes
or more)
Extended Idling (6 hours or more)
Truck No. 1
Truck No. 2 Hours
50%
28%
26%
35%
0 500 1000 1500 2000 2500
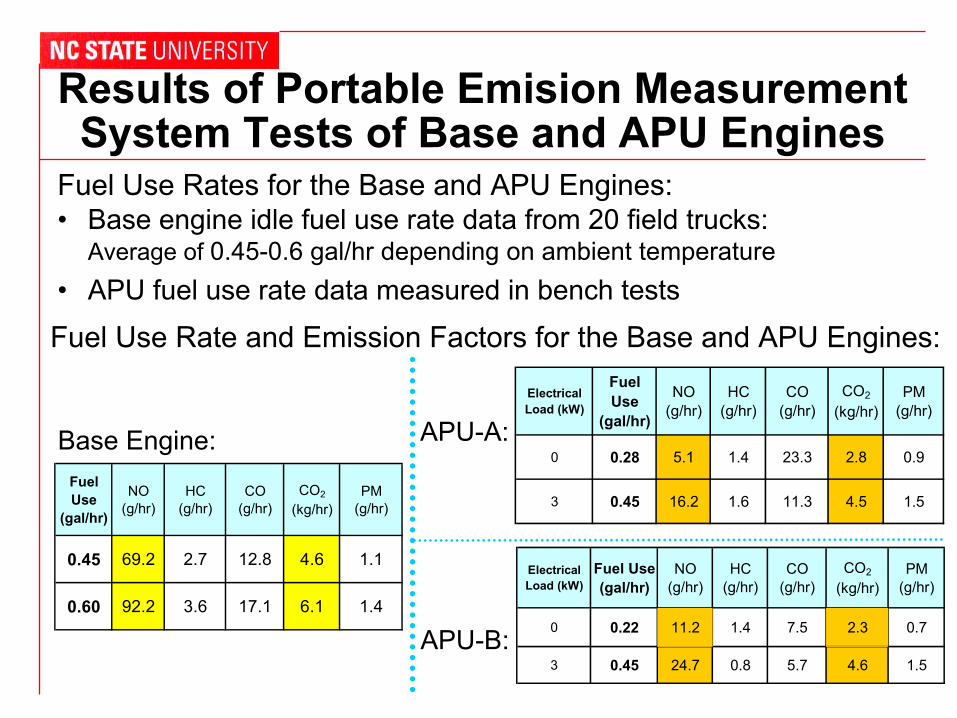
Results of Portable Emision Measurement System Tests of Base and APU Engines
Fuel Use Rates for the Base and APU Engines: • Base engine idle fuel use rate data from 20 field trucks:
Average of 0.45-0.6 gal/hr depending on ambient temperature • APU fuel use rate data measured in bench tests
Fuel Use Rate and Emission Factors for the Base and APU Engines:
Base Engine: Fuel Use
(gal/hr)
NO (g/hr)
HC (g/hr)
CO (g/hr)
CO2
(kg/hr) PM
(g/hr)
0.45 69.2 2.7 12.8 4.6 1.1
0.60 92.2 3.6 17.1 6.1 1.4
APU-A: Electrical Load (kW)
Fuel Use
(gal/hr)
NO (g/hr)
HC (g/hr)
CO (g/hr)
CO2
(kg/hr) PM
(g/hr)
0 0.28 5.1 1.4 23.3 2.8 0.9
3 0.45 16.2 1.6 11.3 4.5 1.5
Fuel Use NO HC CO PMElectrical CO2 Load (kW) (g/hr) (g/hr) (g/hr) (g/hr) (gal/hr) (kg/hr)
0 0.22 11.2 1.4 7.5 2.3 0.7 APU-B: 3 24.7 0.8 5.7 4.6 1.5 0.45
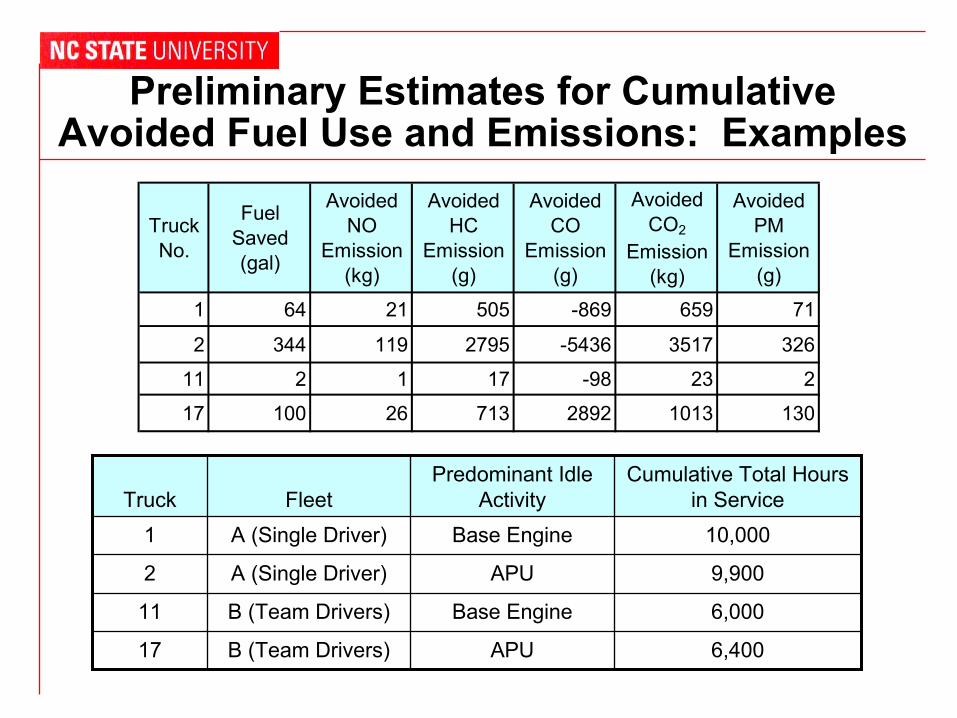
Preliminary Estimates for CumulativeAvoided Fuel Use and Emissions: Examples
Truck No.
Fuel Saved (gal)
Avoided NO
Emission (kg)
Avoided HC
Emission (g)
Avoided CO
Emission (g)
Avoided CO2
Emission (kg)
Avoided PM
Emission (g)
1 64 21 505 -869 659 71
2 344 119 2795 -5436 3517 326
11 2 1 17 -98 23 2
17 100 26 713 2892 1013 130
Truck Fleet Predominant Idle
Activity Cumulative Total Hours
in Service 1 A (Single Driver) Base Engine 10,000
2 A (Single Driver) APU 9,900
11 B (Team Drivers) Base Engine 6,000
17 B (Team Drivers) APU 6,400
Site-Specific Variability
• The actual fuel savings, emissions reductions, and cost for APUs (and other best practices) can be highly variable depending on specific situations.
• The results here provide comparisons based on typical, but not necessarily site-specific, values.
• There is a need for a tool to enable users to identify, compare, and evaluate potential best practices using relevant data.
Example of Assessment of Life Cycle Inventory and Real World Tailpipe Emissions for Soy-Based B20 vs. Petroleum Diesel
• Life cycle inventory comparison of fuels • Geospatial implications of biofuel use • Real-world implications for tailpipe emissions
for 35 diesel engines –12 dump trucks –8 cement mixer trucks –15 nonroad construction vehicles
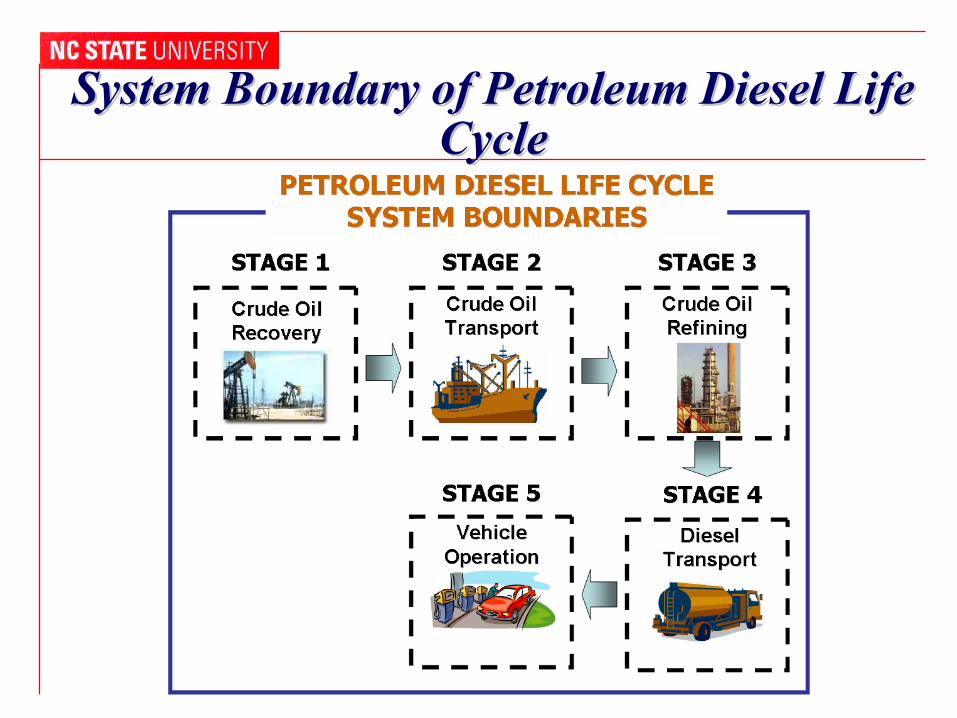
System Boundary of Petroleum Diesel Life Cycle
System Boundary of Petroleum Diesel LifeCycle
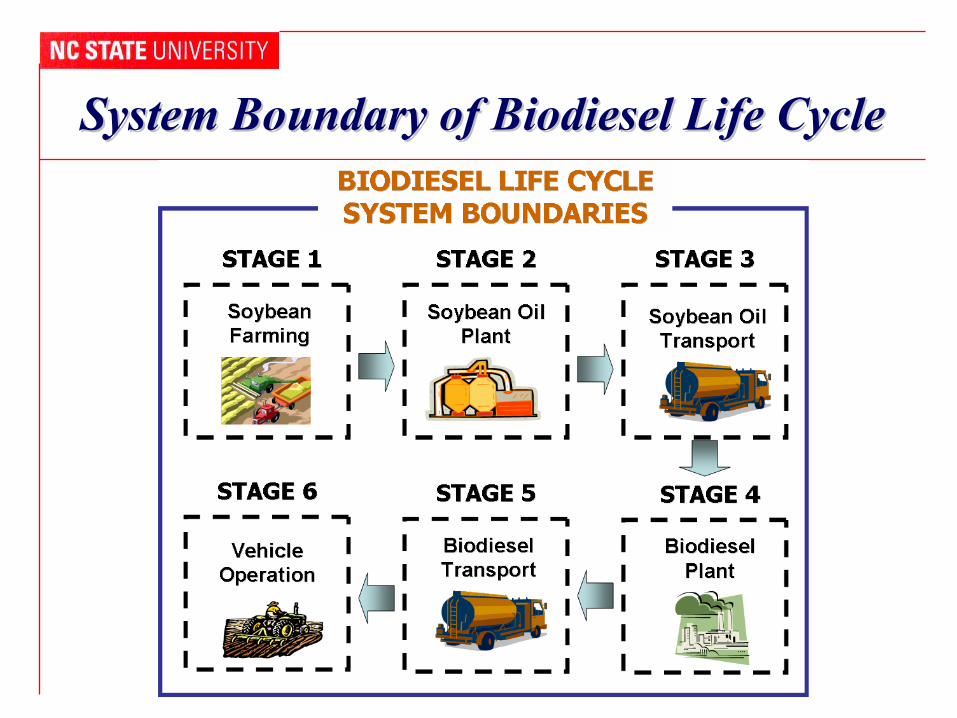
System Boundary of Biodiesel Life CycleSystem Boundary of Biodiesel Life Cycle
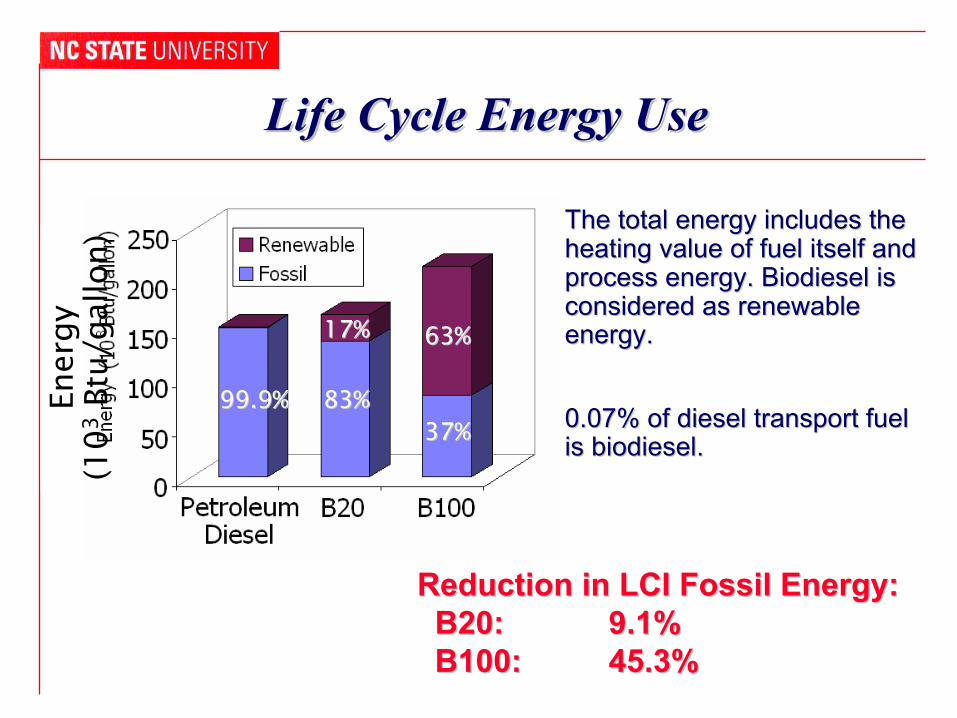
Life Cycle Energy Use
The total energy includes the heating value of fuel itself and process energy. Biodiesel is considered as renewable energy.
0.07% of diesel transport fuel is biodiesel.
Reduction in LCI Fossil Energy:B20: 9.1%B100: 45.3%
Life Cycle Energy Use En
ergy
(10
3 B
tu/g
allo
n)
99.9%99.9% 83%83%
17%17%
37%37%
63%63%
The total energy includes the heating value of fuel itself andprocess energy. Biodiesel isconsidered as renewable energy.
0.07% of diesel transport fuelis biodiesel.
Reduction in LCI Fossil Energy: B20: 9.1% B100: 45.3%
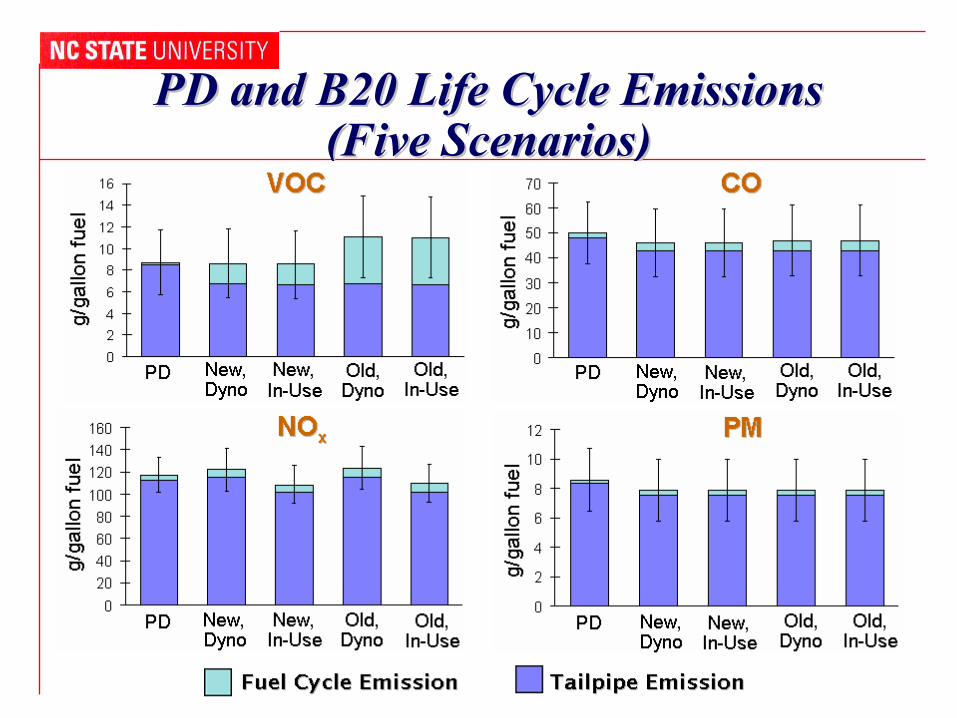
PD and B20 Life Cycle Emissions (Five Scenarios)
PD and B20 Life Cycle Emissions(Five Scenarios)
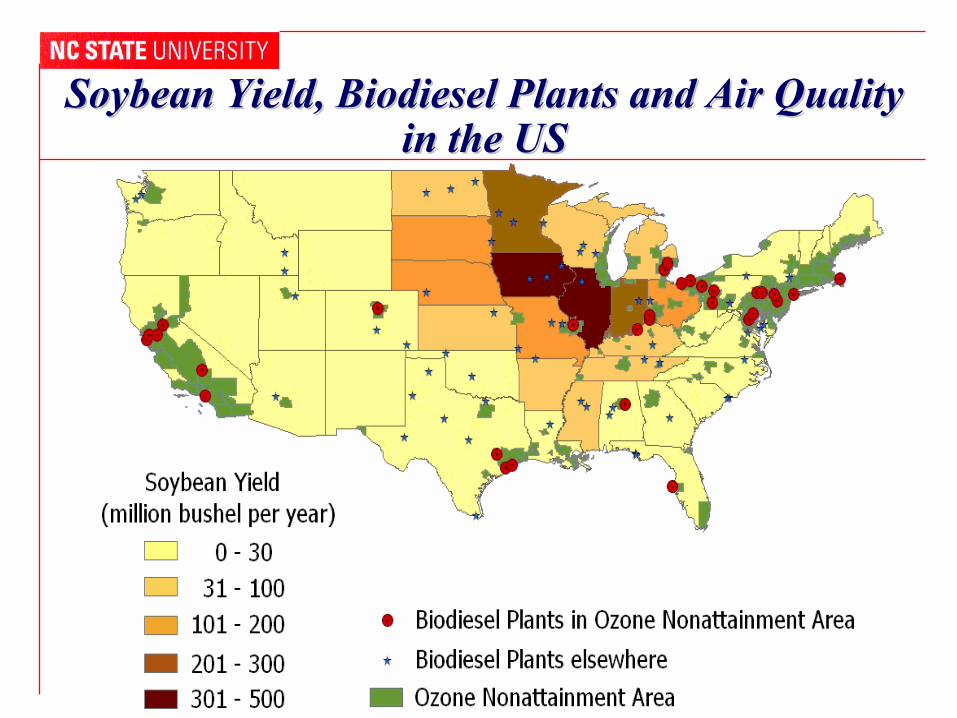
Soybean Yield, Biodiesel Plants and Air Quality in the US
Soybean Yield, Biodiesel Plants and Air Qualityin the US
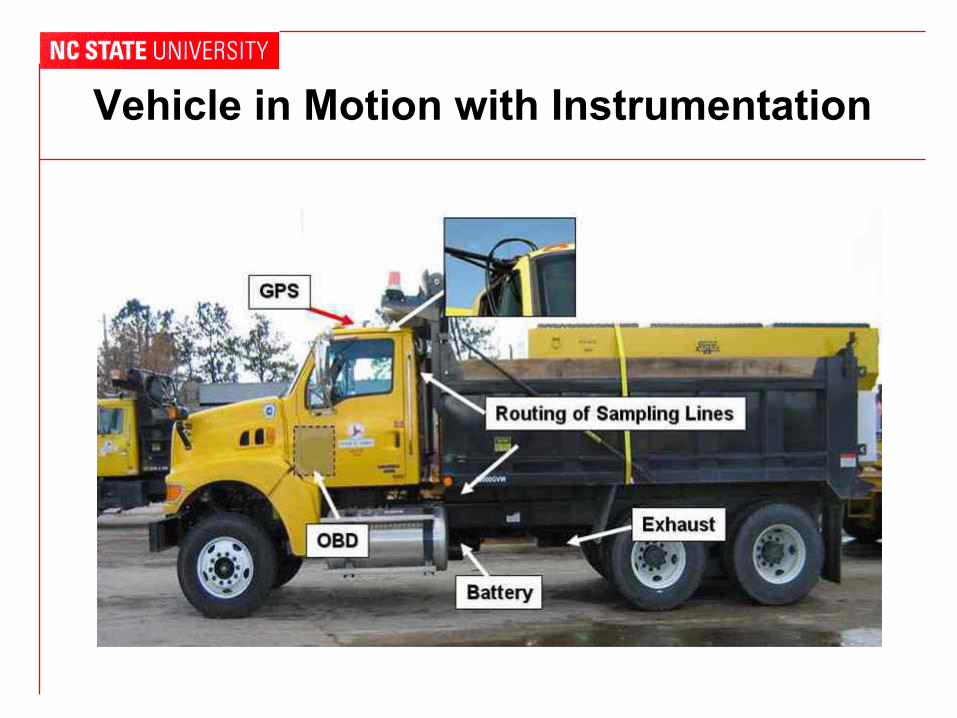
Vehicle in Motion with Instrumentation
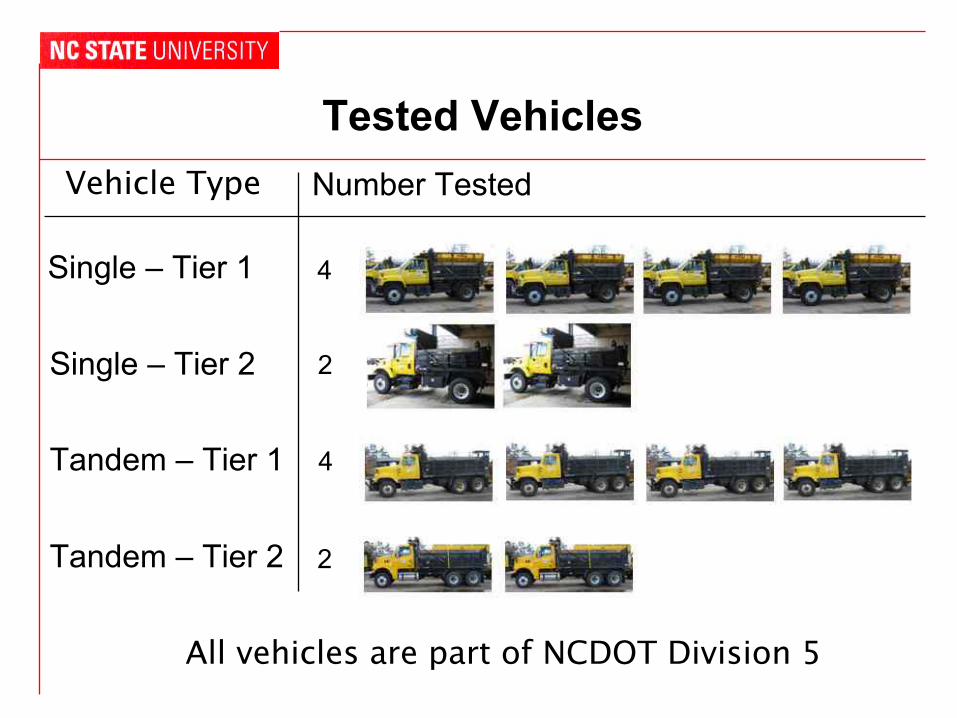
Tested Vehicles
Single – Tier 1
Single – Tier 2
Tandem – Tier 1
Tandem – Tier 2
Vehicle Type Number Tested
4
4
2
2
All vehicles are part of NCDOT Division 5
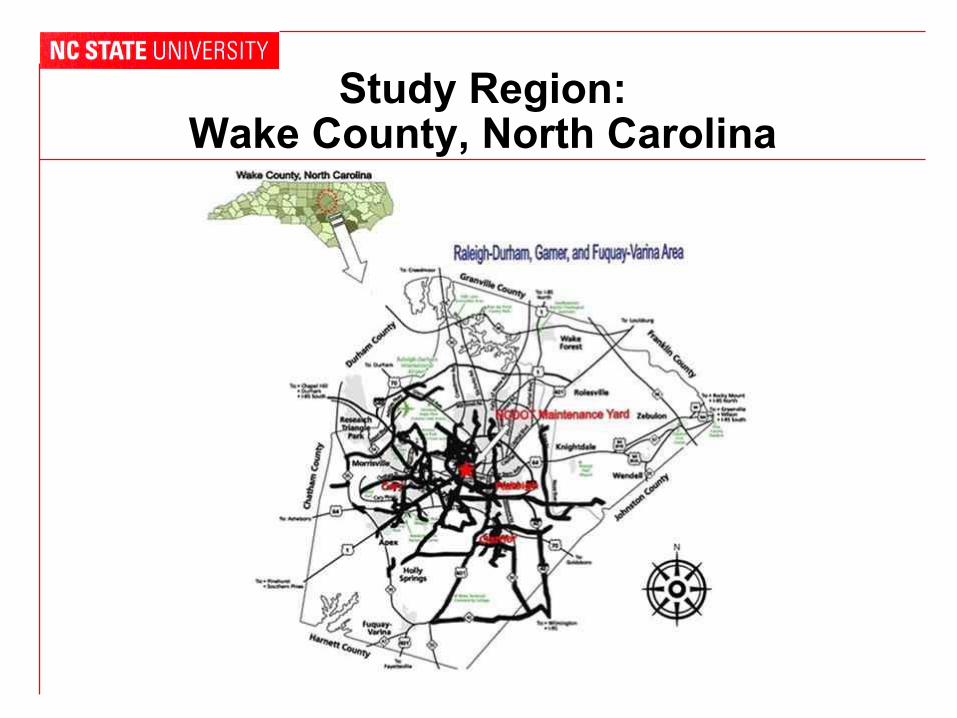
Study Region:Wake County, North Carolina
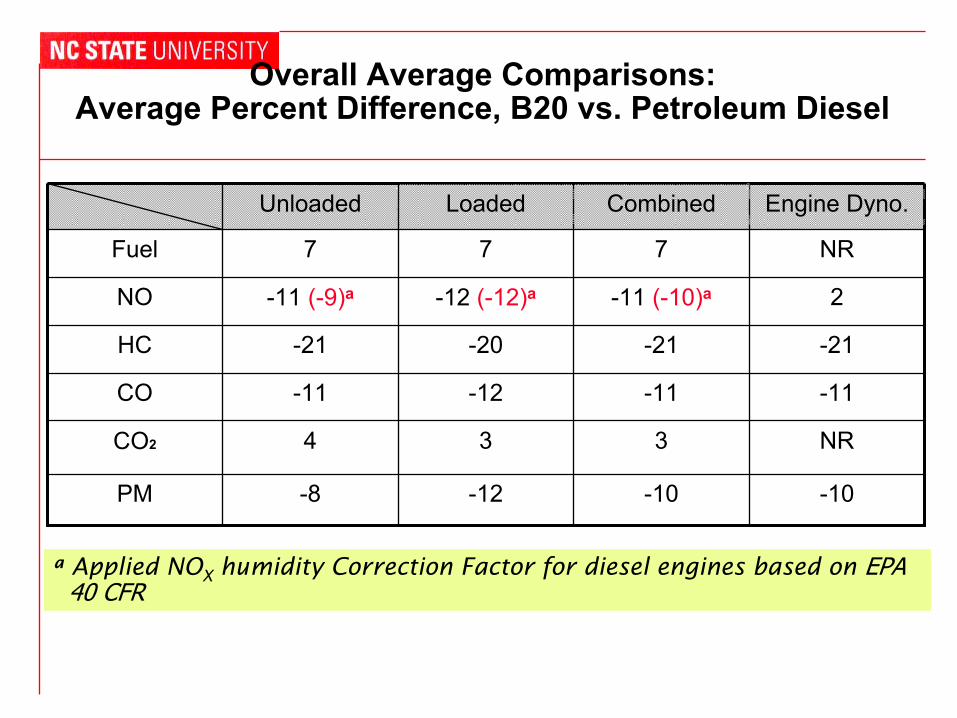
Overall Average Comparisons:Average Percent Difference, B20 vs. Petroleum Diesel
Fuel 7 7 7 NR
NO 2-11 (-9)a -12 (-12)a -11 (-10)a
HC -21 -20 -21 -21
CO -11 -12 -11 -11
4 3 3 NRCO2
PM -8 -12 -10 -10
a Applied NOX humidity Correction Factor for diesel engines based on EPA 40 CFR
Engine Dyno.CombinedLoadedUnloaded
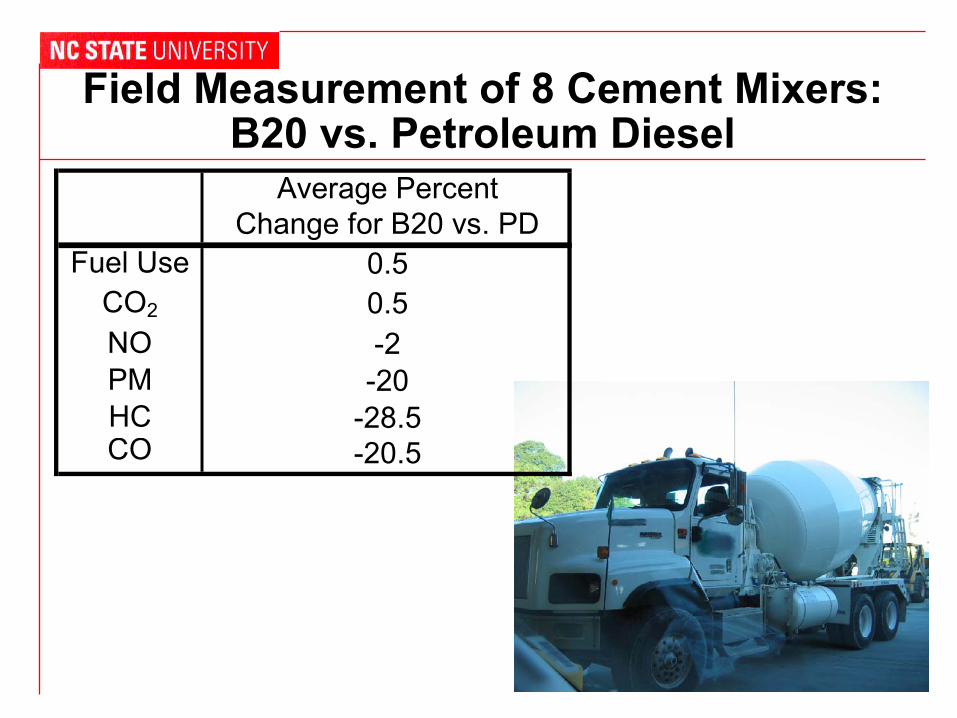
Field Measurement of 8 Cement Mixers: B20 vs. Petroleum Diesel
Fuel Use CO2
NO PM HC CO
Average Percent Change for B20 vs. PD
0.5 0.5 -2
-20 -28.5 -20.5
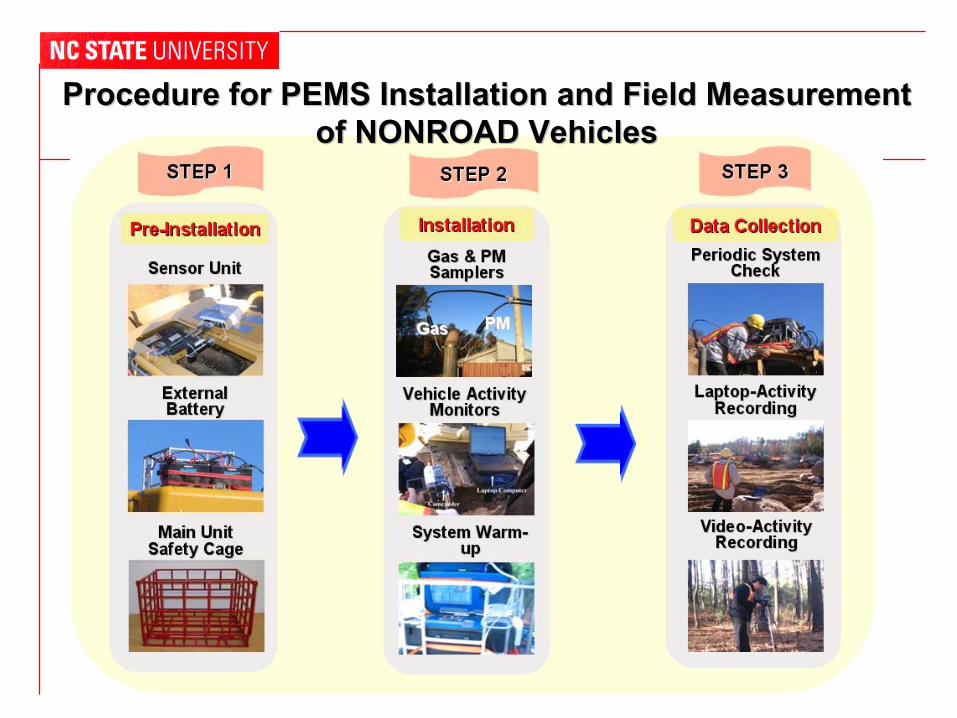
Procedure for PEMS Installation and Field Measurement Procedure for PEMS Installation and Field Measurement of NONROAD Vehiclesof NONROAD Vehicles
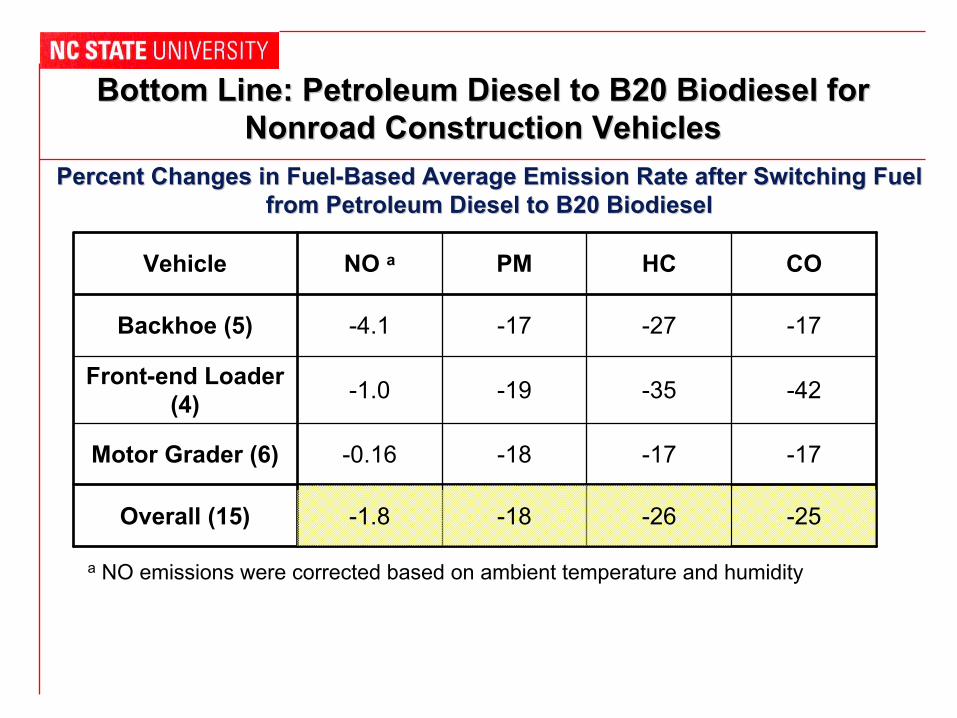
Bottom Line: Petroleum Diesel to B20 Biodiesel for Nonroad Construction Vehicles
Percent Changes in Fuel-Based Average Emission Rate after Switching Fuel from Petroleum Diesel to B20 Biodiesel
Bottom Line: Petroleum Diesel to B20 Biodiesel for Nonroad Construction Vehicles
Percent Changes in Fuel-Based Average Emission Rate after Switching Fuel from Petroleum Diesel to B20 Biodiesel
Vehicle NO a PM HC CO
Backhoe (5) -4.1 -17 -27 -17
Front-end Loader (4) -1.0 -19 -35 -42
Motor Grader (6) -0.16 -18 -17 -17
Overall (15) -1.8 -18 -26 -25
a NO emissions were corrected based on ambient temperature and humidity
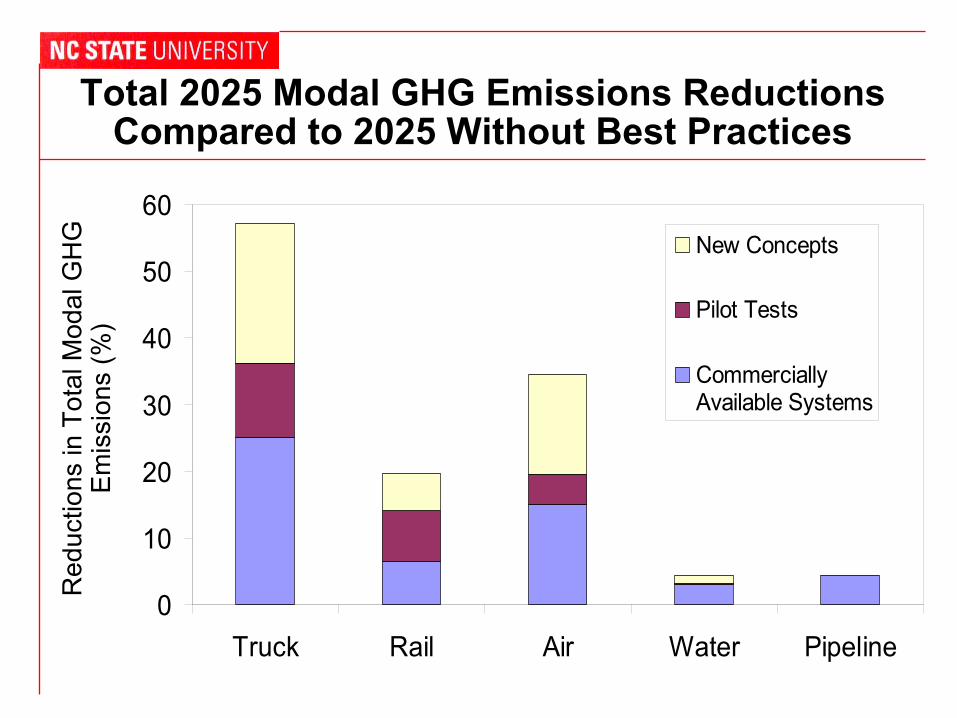
Total 2025 Modal GHG Emissions Reductions Compared to 2025 Without Best Practices
Truck Rail Air Water Pipeline 0
10
20
30
40
50
60 New Concepts
Pilot Tests
Commercially Available Systems
Red
uctio
ns in
Tot
al M
odal
GH
G
Em
issi
ons
(%)
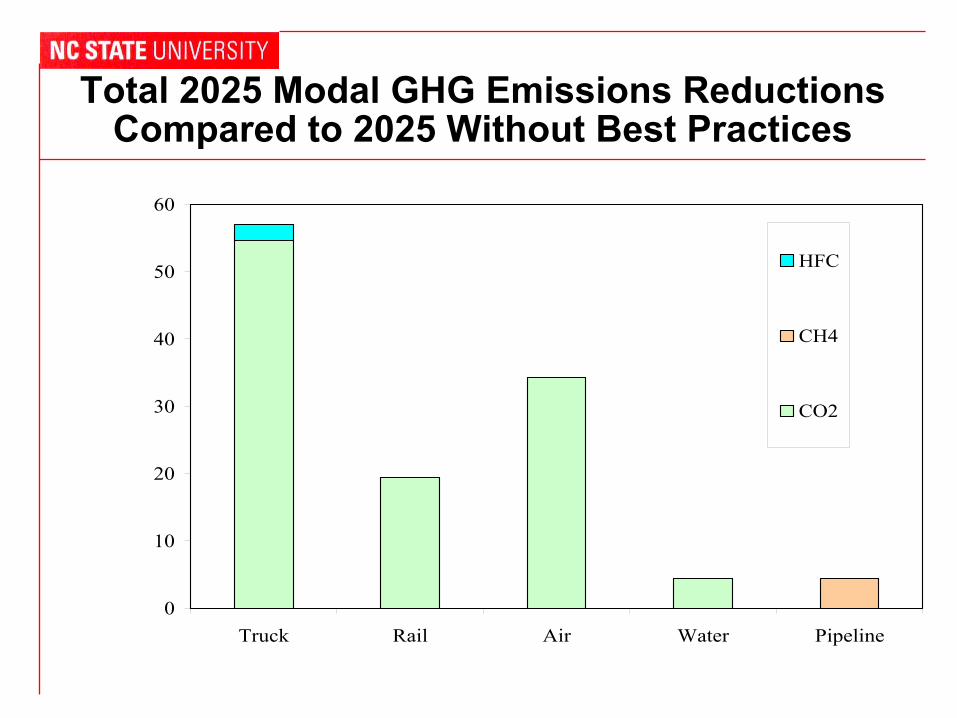
Total 2025 Modal GHG Emissions Reductions Compared to 2025 Without Best Practices
Truck Rail Air Water Pipeline 0
10
20
30
40
50
60
HFC
CH4
CO2
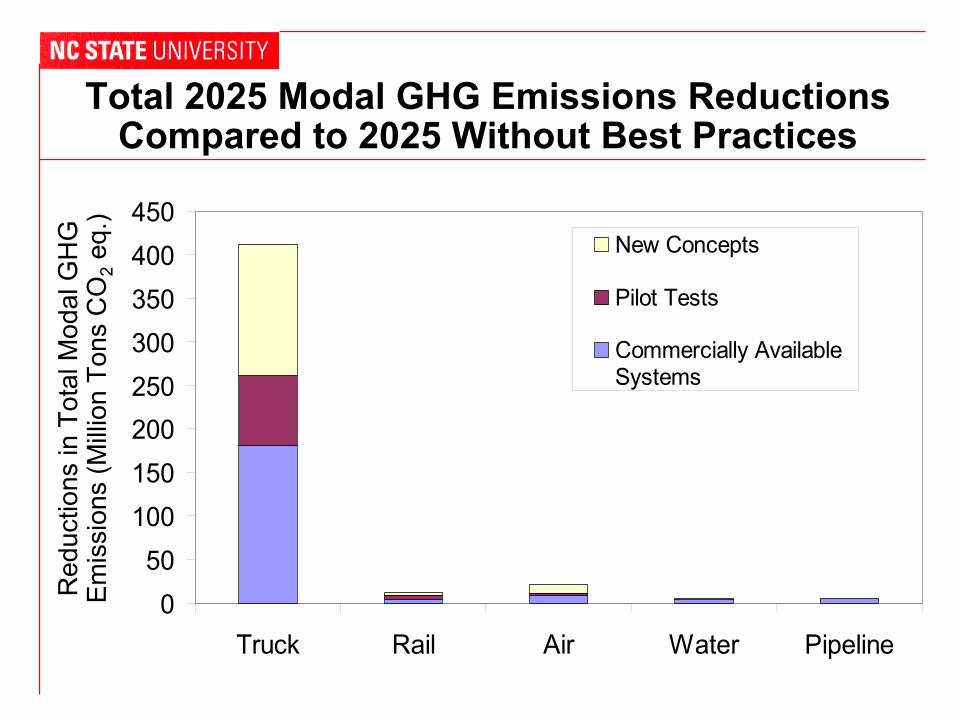
Total 2025 Modal GHG Emissions Reductions Compared to 2025 Without Best Practices
Red
uctio
ns in
Tot
al M
odal
GH
G
Em
issi
ons
(Mill
ion
Tons
CO
2 eq
.) 450 400 350 300 250 200 150 100 50
New Concepts
Pilot Tests
Commercially Available Systems
0 Truck Rail Air Water Pipeline
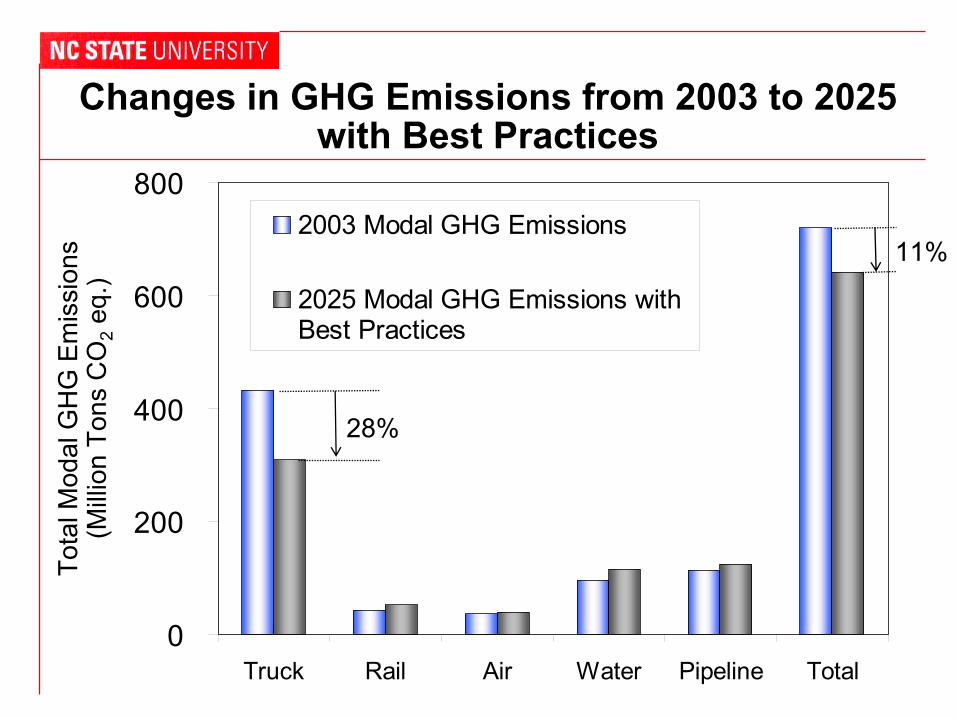
Changes in GHG Emissions from 2003 to 2025with Best Practices
Tota
l Mod
al G
HG
Em
issi
ons
(Mill
ion
Tons
CO
2 eq
.)
0
200
400
600
800
Truck Rail Air Water Pipeline Total
2003 Modal GHG Emissions
2025 Modal GHG Emissions with Best Practices
28%
11%
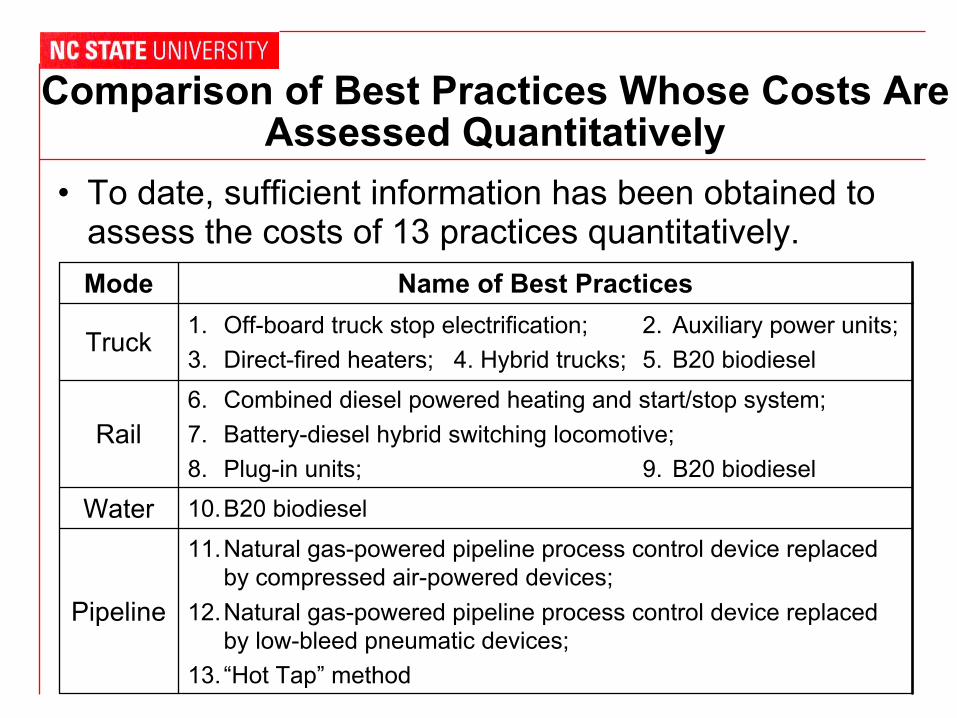
Comparison of Best Practices Whose Costs AreAssessed Quantitatively
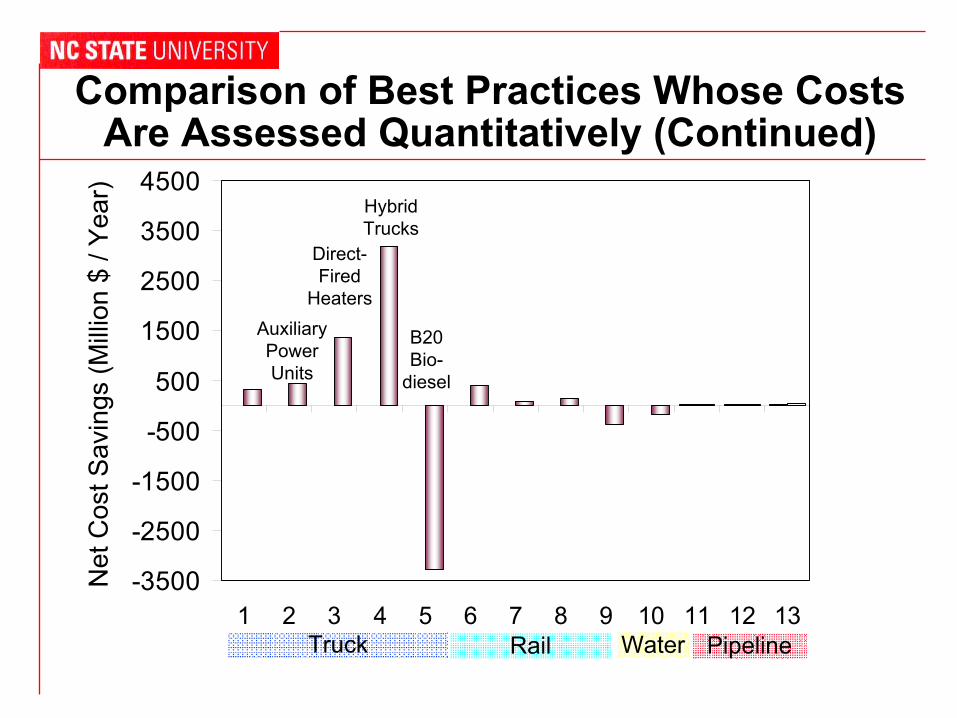
• To date, sufficient information has been obtained to assess the costs of 13 practices quantitatively. Mode Name of Best Practices
Truck 1. Off-board truck stop electrification; 2. Auxiliary power units; 3. Direct-fired heaters; 4. Hybrid trucks; 5. B20 biodiesel
Rail 6. Combined diesel powered heating and start/stop system; 7. Battery-diesel hybrid switching locomotive; 8. Plug-in units; 9. B20 biodiesel
Water 10.B20 biodiesel
Pipeline
11.Natural gas-powered pipeline process control device replaced by compressed air-powered devices;
12.Natural gas-powered pipeline process control device replaced by low-bleed pneumatic devices;
13. “Hot Tap” method
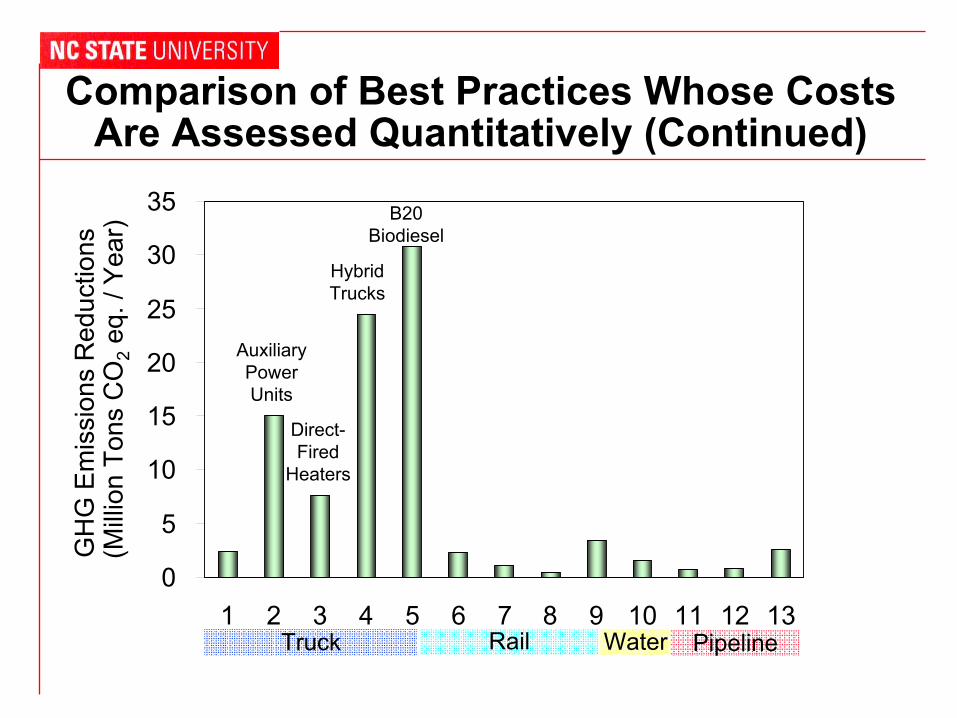
Comparison of Best Practices Whose CostsAre Assessed Quantitatively (Continued)
1 2 3 4 5 6 7 8 9 10 11 12 13 0
5
10
15
20
25
30
35
GH
G E
mis
sion
s R
educ
tions
(Mill
ion
Tons
CO
2 eq
. / Y
ear)
Auxiliary Power Units
Hybrid Trucks
B20 Biodiesel
Direct-Fired
Heaters
Truck Rail Water Pipeline
Comparison of Best Practices Whose CostsAre Assessed Quantitatively (Continued)
4500
3500
2500
1500
500
-500
-1500
-2500
-3500 Net
Cos
t Sav
ings
(Mill
ion
$ / Y
ear)
1 2 3 4 5 6 7 8 9 10 11 12 13
Auxiliary Power Units
Hybrid Trucks
B20 Bio-
diesel
Direct-Fired
Heaters
Truck Rail Water Pipeline

Inter-Modal Comparison of Average ModalGHG Emission Rates
GH
G E
mis
sion
s pe
r Uni
t of F
reig
ht
Tran
spor
t (lb
CO
2 eq
. / to
n-m
ile) 2.5
2.0
1.5
1.0
0.5
0.0 Truck Rail Air Water Pipeline
For example, GHG emissions reductions of 85% are possible if long-haul truck transport is replaced with a combination of rail and truck transport.
Actual reductions will depend on site-specific logistics.
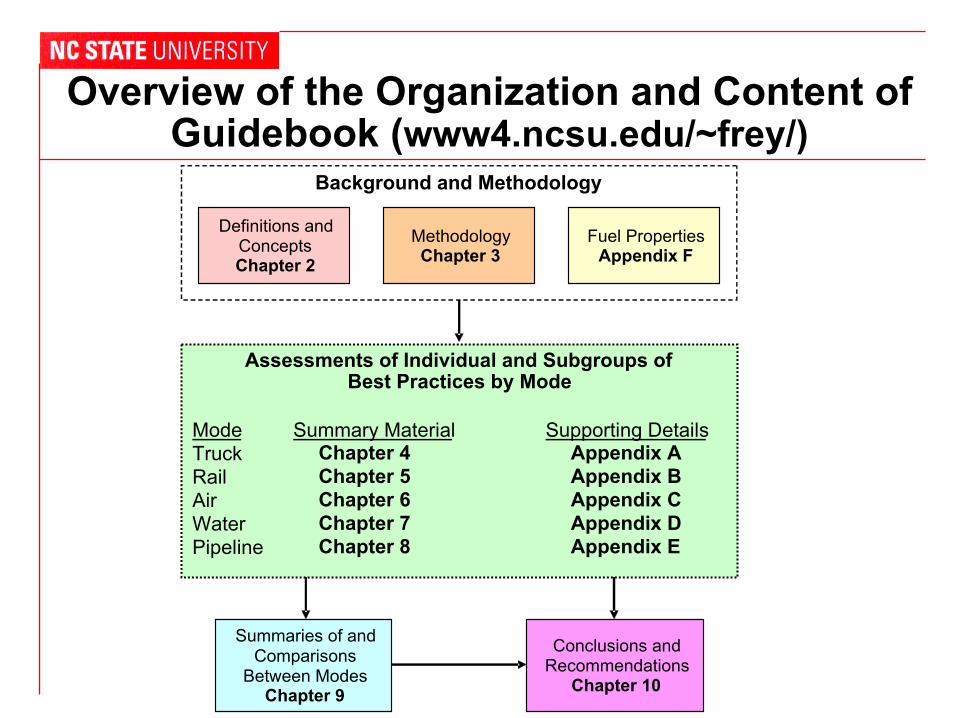
Overview of the Organization and Content ofGuidebook (www4.ncsu.edu/~frey/)
Definitions and Concepts Chapter 2
Methodology Chapter 3
Fuel Properties Appendix F
Background and Methodology
Assessments of Individual and Subgroups of Best Practices by Mode
Mode Summary Material Supporting Details Truck Chapter 4 Appendix A Rail Chapter 5 Appendix B Air Chapter 6 Appendix C Water Chapter 7 Appendix D Pipeline Chapter 8 Appendix E
Summaries of and Comparisons
Between Modes Chapter 9
Conclusions and Recommendations
Chapter 10
Conclusions
• Aggressive implementation of best practices may lead to a net decrease in total GHG emissions in freight transportation
• Even larger percentage reductions are possible if inter-modal shifts (e.g., substitute rail for truck) are encourage
Conclusions (Continued)
• There is limited quantitative cost data upon which to base assessments of the costs of best practices
• For 13 best practices for which adequate cost data are available:
The normalized cost savings per unit of GHG emissions reduction was highly variable The variability mostly depends on the magnitudes of their energy cost savings
Conclusions (Continued)
• Some best practices (e.g., biodiesel for trucks) offer potential for large magnitudes in GHG emissions reductions, but may not be as cost-effective
– From a national policy perspective, governments should promote research, development, and demonstration (RD&D) to foster best practices that lead to large absolute reductions in GHG emissions
• Some best practices may lead to “no regrets” – e.g., net cost savings to an operator – Additional benefits of GHG emissions or energy use
reduction
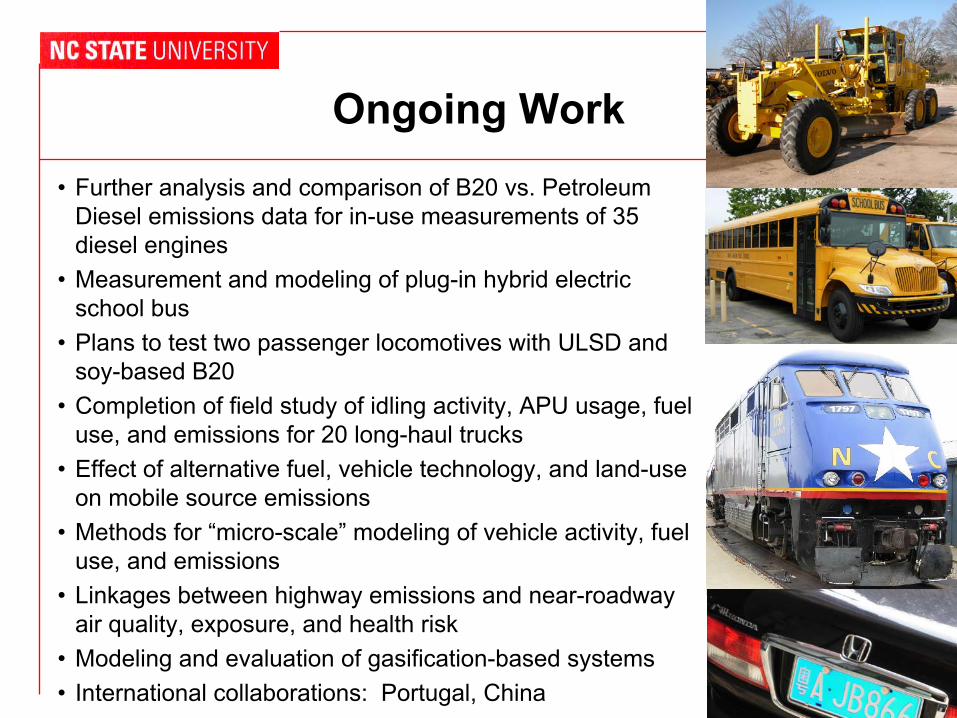
Ongoing Work • Further analysis and comparison of B20 vs. Petroleum
Diesel emissions data for in-use measurements of 35 diesel engines
• Measurement and modeling of plug-in hybrid electric school bus
• Plans to test two passenger locomotives with ULSD and soy-based B20
• Completion of field study of idling activity, APU usage, fuel use, and emissions for 20 long-haul trucks
• Effect of alternative fuel, vehicle technology, and land-use on mobile source emissions
• Methods for “micro-scale” modeling of vehicle activity, fuel use, and emissions
• Linkages between highway emissions and near-roadway air quality, exposure, and health risk
• Modeling and evaluation of gasification-based systems • International collaborations: Portugal, China
Recommendations
• Update GHG potential best practice information as new information becomes available
• Revise or develop cost estimates as new data become available
• Evaluate key assumptions (e.g., market penetration rates) that influence the selection ofbest practices via sensitivity analysis
• Develop tools (e.g., a decision tree, a decision support framework) to support decision makingregarding best practices
Acknowledgements
• This work was supported by – U.S. Department of Transportation via Center for
Transportation and the Environment – National Science Foundation – NC Department of Transportation – U.S. Environmental Protection Agency
• The authors are responsible for the facts and accuracy of the data presented herein.
• Po-Yao Kuo, Kangwook Kim, Shih-hao Pang, Haibo Zhai, Phil Lewis, William Rasdorf, Charles Villa