Embed Size (px)
Citation preview
Identification of ESGs - The Key IssueIdentification of ESGs - The Key Issue Emerging Challenges for IndiaEmerging Challenges for India
S. K. MohantyS. K. MohantySenior Fellow, RISSenior Fellow, RIS
Trade and Climate Change in Emerging Trade and Climate Change in Emerging EconomiesEconomies
The Competitiveness, Technology and IPR DimensionsThe Competitiveness, Technology and IPR Dimensions
RIS and ICTSDRIS and ICTSDMarch 30-31, 2010March 30-31, 2010
New DelhiNew Delhi
22
Trade policy consistent with the sustainable Trade policy consistent with the sustainable growthgrowth
Identification of Environmentally Sensitive Goods (ESG)
APEC and OECD lists Alternative approach to identify ESGs Relevance of these products for the global
and domestic trade sector
Scheme of the Presentation
33
Trade policy supports growth oriented development Trade policy supports growth oriented development policypolicy
India followed ELG and DDLG approaches simultaneously
External sector a major contributor to domestic growth India’s concern for climate change issues ‘Pollution haven hypothesis’- World Bank in the 1990s Work on Environmentally Sensitive Goods – late 1990s Alternative Approach to Identify ESGs Relevance of ESG trade for India Magnitude of Indian trade in ESGs Coverage of ESGs Trade Protection: TBs Vrs NTBs (Mohanty &
Manoharan, 2002) Trade opportunities in the region (Mohanty & Chaturvedi,
2006)
Background
44
How to identify ESGs?
Growing consumer expectations for ‘green products’
Volume of global trade in ESGs
Size of the ESG market in India
Technology intensity of ESGs
Implications for the domestic employment
Key Issues in ESGs
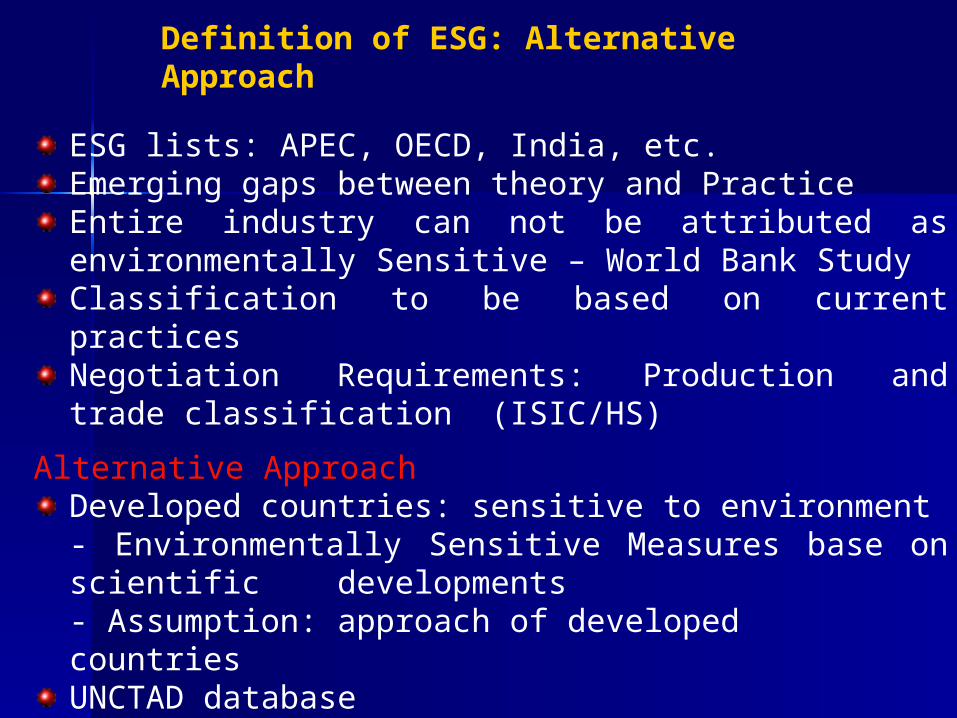
ESG lists: APEC, OECD, India, etc.Emerging gaps between theory and PracticeEntire industry can not be attributed as environmentally Sensitive – World Bank StudyClassification to be based on current practicesNegotiation Requirements: Production and trade classification (ISIC/HS)
Alternative ApproachDeveloped countries: sensitive to environment- Environmentally Sensitive Measures base on scientific developments- Assumption: approach of developed countriesUNCTAD databaseComprehensive list based on ES NTBs in six DCs/Reg
Definition of ESG: Alternative Approach
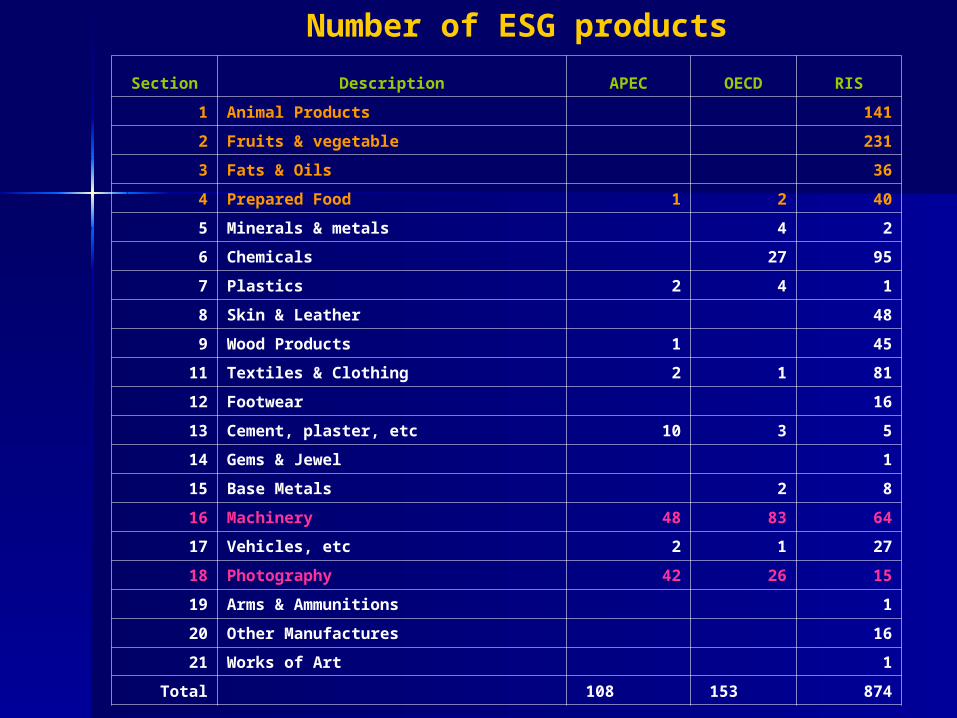
Number of ESG products Section Description APEC OECD RIS
1 Animal Products 141
2 Fruits & vegetable 231
3 Fats & Oils 36
4 Prepared Food 1 2 40
5 Minerals & metals 4 2
6 Chemicals 27 95
7 Plastics 2 4 1
8 Skin & Leather 48
9 Wood Products 1 45
11 Textiles & Clothing 2 1 81
12 Footwear 16
13 Cement, plaster, etc 10 3 5
14 Gems & Jewel 1
15 Base Metals 2 8
16 Machinery 48 83 64
17 Vehicles, etc 2 1 27
18 Photography 42 26 15
19 Arms & Ammunitions 1
20 Other Manufactures 16
21 Works of Art 1
Total 108 153 874
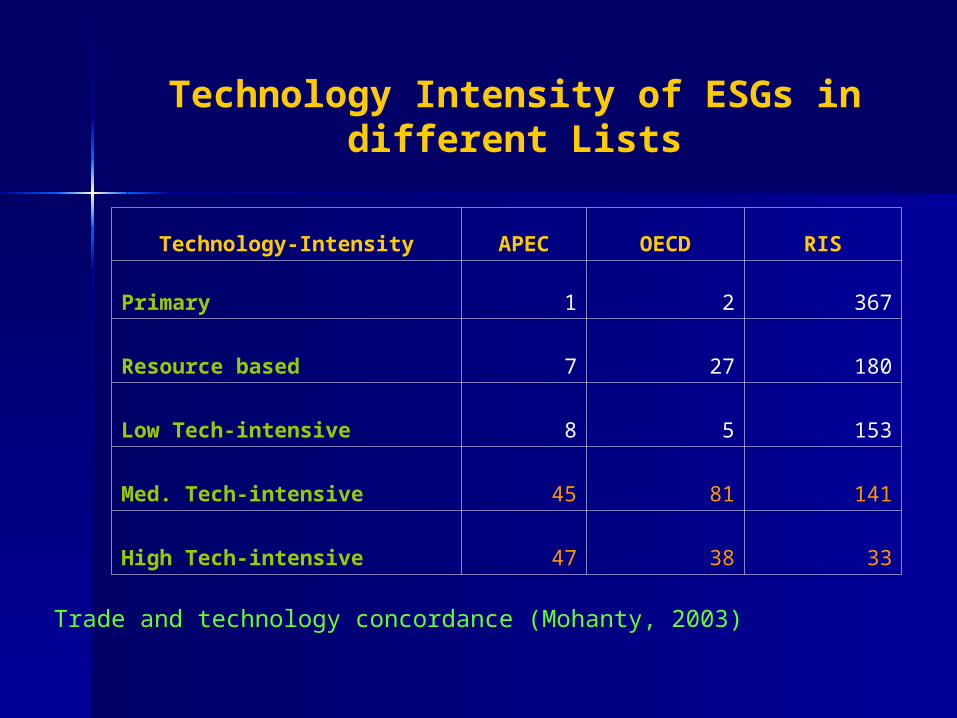
Technology-Intensity APEC OECD RIS
Primary 1 2 367
Resource based 7 27 180
Low Tech-intensive 8 5 153
Med. Tech-intensive 45 81 141
High Tech-intensive 47 38 33
Technology Intensity of ESGs in different Lists
Trade and technology concordance (Mohanty, 2003)
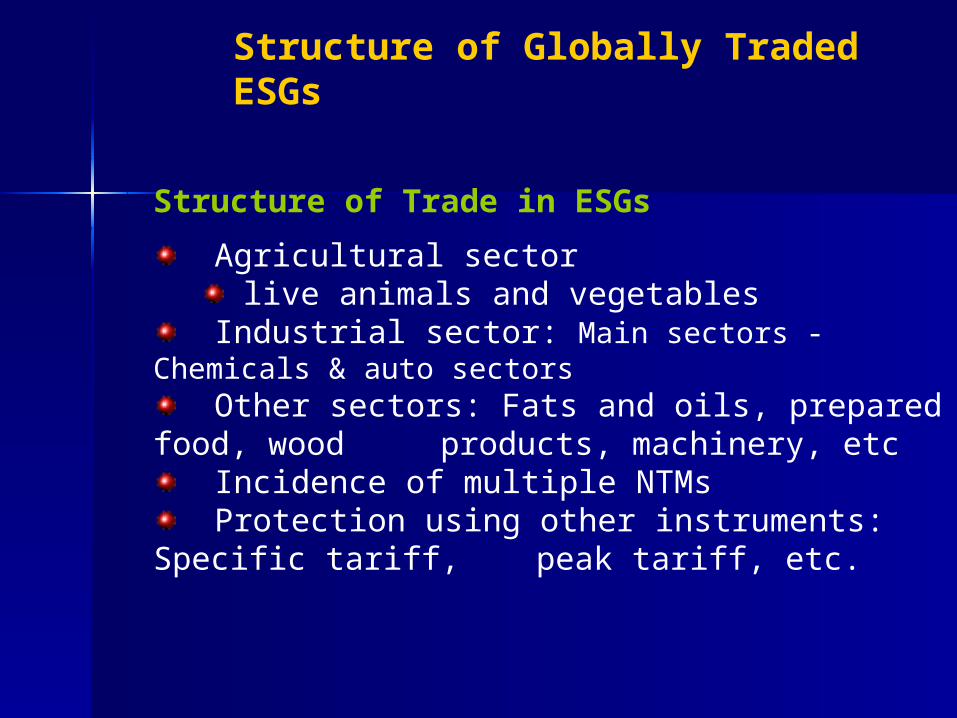
Structure of Trade in ESGs
Agricultural sector live animals and vegetables
Industrial sector: Main sectors - Chemicals & auto sectors
Other sectors: Fats and oils, prepared food, wood products, machinery, etc
Incidence of multiple NTMs Protection using other instruments: Specific
tariff, peak tariff, etc.
Structure of Globally Traded ESGs
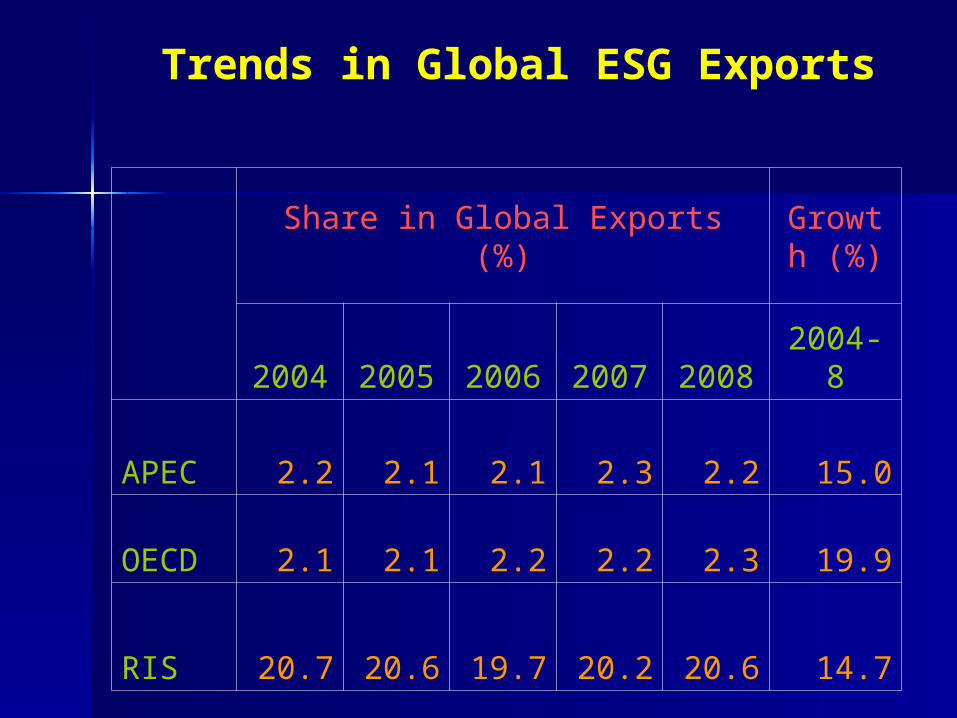
Trends in Global ESG Exports
Share in Global Exports (%)Growth
(%)
2004 2005 2006 2007 2008 2004-8
APEC 2.2 2.1 2.1 2.3 2.2 15.0
OECD 2.1 2.1 2.2 2.2 2.3 19.9
RIS 20.7 20.6 19.7 20.2 20.6 14.7
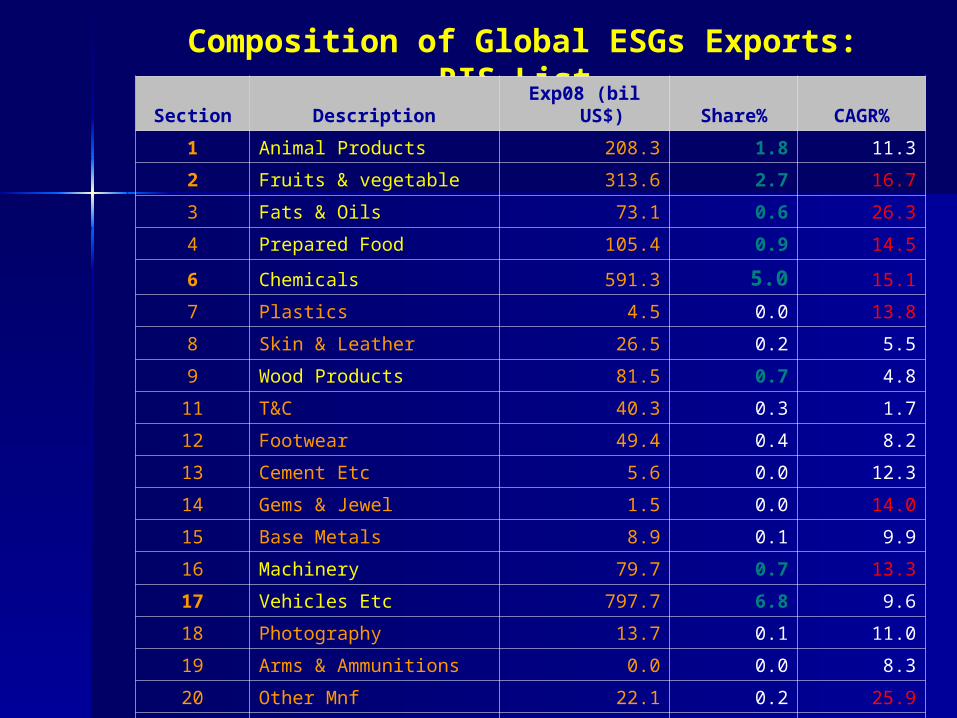
Composition of Global ESGs Exports: RIS List Section Description Exp08 (bil US$) Share% CAGR%
1 Animal Products 208.3 1.8 11.3
2 Fruits & vegetable 313.6 2.7 16.7
3 Fats & Oils 73.1 0.6 26.3
4 Prepared Food 105.4 0.9 14.5
6 Chemicals 591.3 5.0 15.1
7 Plastics 4.5 0.0 13.8
8 Skin & Leather 26.5 0.2 5.5
9 Wood Products 81.5 0.7 4.8
11 T&C 40.3 0.3 1.7
12 Footwear 49.4 0.4 8.2
13 Cement Etc 5.6 0.0 12.3
14 Gems & Jewel 1.5 0.0 14.0
15 Base Metals 8.9 0.1 9.9
16 Machinery 79.7 0.7 13.3
17 Vehicles Etc 797.7 6.8 9.6
18 Photography 13.7 0.1 11.0
19 Arms & Ammunitions 0.0 0.0 8.3
20 Other Mnf 22.1 0.2 25.9
21 Works of Art 0.6 0.0 10.0
1111
ESG exports form large part of total Exports ESG exports form large part of total Exports
Constant market share but growing at 21.6% CAGR
Certain sectors are affected more than others
Significant impact on employment
ESG Trade in India
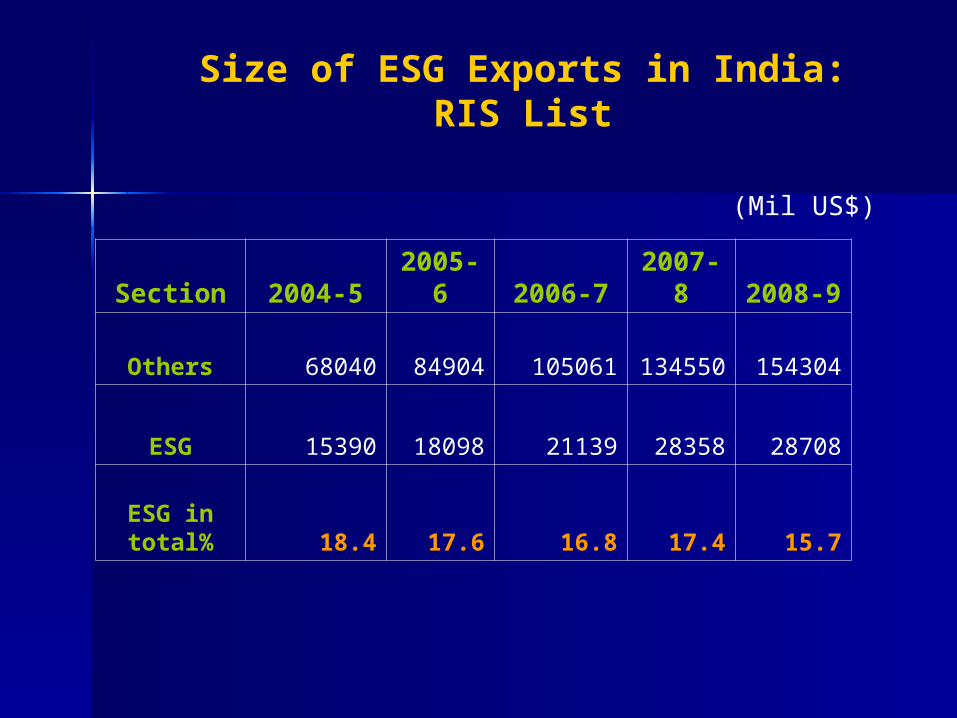
Size of ESG Exports in India: RIS List
(Mil US$)
Section 2004-5 2005-6 2006-7 2007-8 2008-9
Others 68040 84904 105061 134550 154304
ESG 15390 18098 21139 28358 28708
ESG in total% 18.4 17.6 16.8 17.4 15.7
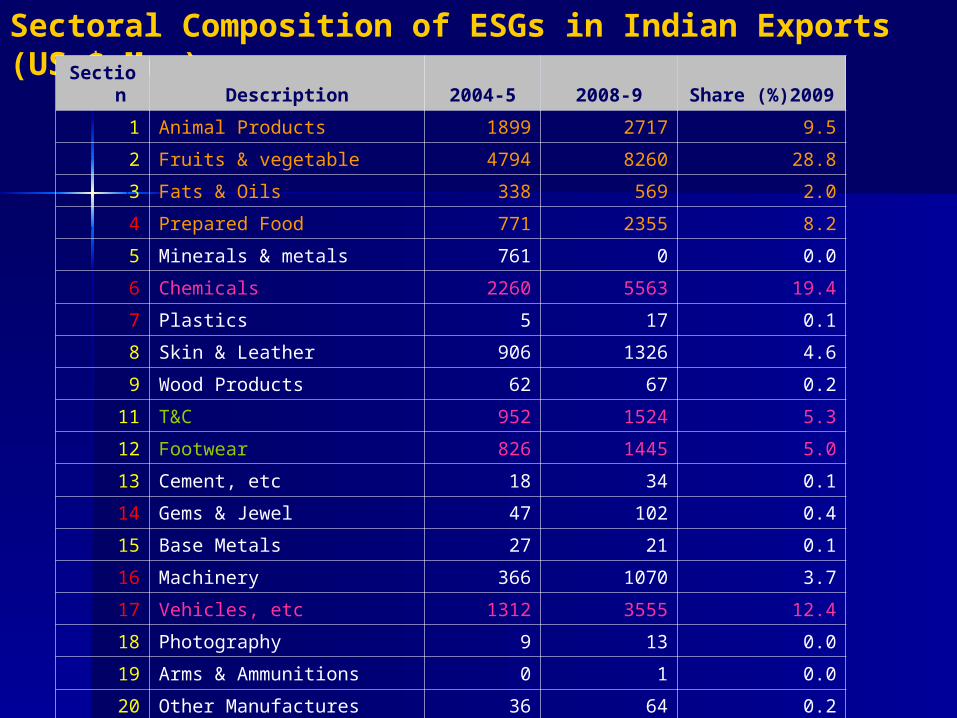
Sectoral Composition of ESGs in Indian Exports (US $ Mn.)Section Description 2004-5 2008-9 Share (%)2009
1 Animal Products 1899 2717 9.5
2 Fruits & vegetable 4794 8260 28.8
3 Fats & Oils 338 569 2.0
4 Prepared Food 771 2355 8.2
5 Minerals & metals 761 0 0.0
6 Chemicals 2260 5563 19.4
7 Plastics 5 17 0.1
8 Skin & Leather 906 1326 4.6
9 Wood Products 62 67 0.2
11 T&C 952 1524 5.3
12 Footwear 826 1445 5.0
13 Cement, etc 18 34 0.1
14 Gems & Jewel 47 102 0.4
15 Base Metals 27 21 0.1
16 Machinery 366 1070 3.7
17 Vehicles, etc 1312 3555 12.4
18 Photography 9 13 0.0
19 Arms & Ammunitions 0 1 0.0
20 Other Manufactures 36 64 0.2
21 Works of Art 1 2 0.0
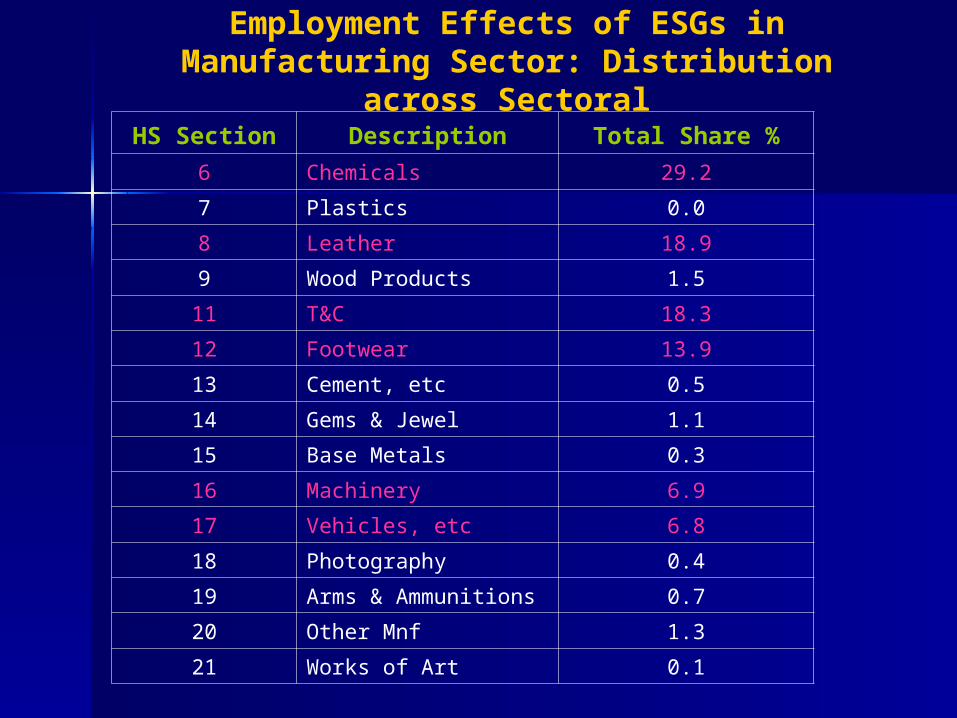
Employment Effects of ESGs in Manufacturing Sector: Distribution across
SectoralHS Section Description Total Share %
6 Chemicals 29.2
7 Plastics 0.0
8 Leather 18.9
9 Wood Products 1.5
11 T&C 18.3
12 Footwear 13.9
13 Cement, etc 0.5
14 Gems & Jewel 1.1
15 Base Metals 0.3
16 Machinery 6.9
17 Vehicles, etc 6.8
18 Photography 0.4
19 Arms & Ammunitions 0.7
20 Other Mnf 1.3
21 Works of Art 0.1
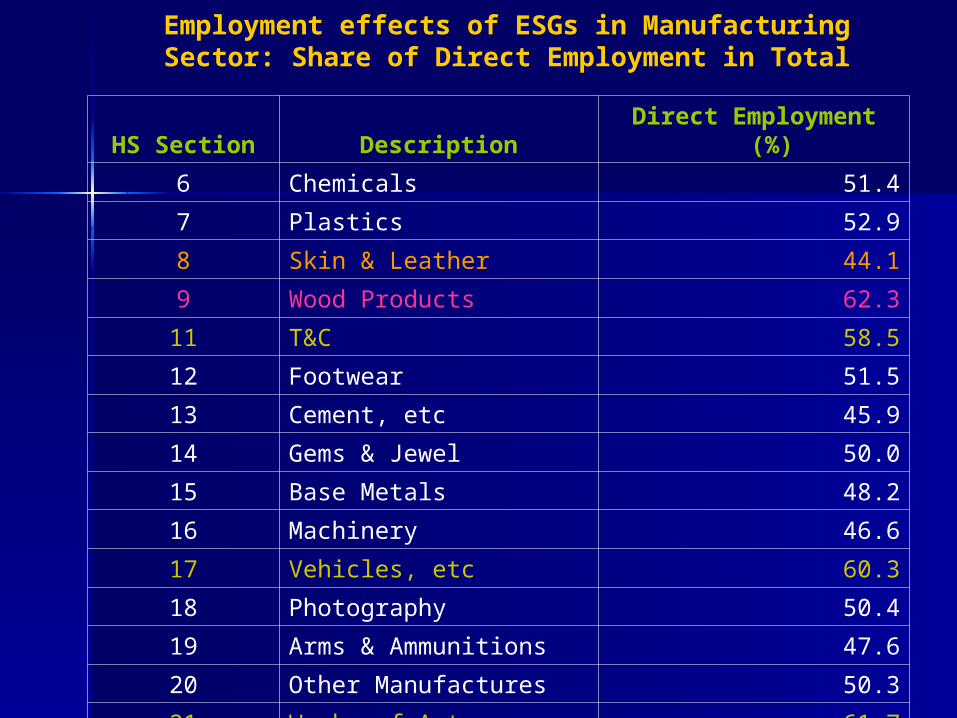
Employment effects of ESGs in Manufacturing Sector: Share of Direct Employment in Total
HS Section Description Direct Employment (%)
6 Chemicals 51.4
7 Plastics 52.9
8 Skin & Leather 44.1
9 Wood Products 62.3
11 T&C 58.5
12 Footwear 51.5
13 Cement, etc 45.9
14 Gems & Jewel 50.0
15 Base Metals 48.2
16 Machinery 46.6
17 Vehicles, etc 60.3
18 Photography 50.4
19 Arms & Ammunitions 47.6
20 Other Manufactures 50.3
21 Works of Art 61.7

1616
Need for a comprehensive definition and Need for a comprehensive definition and identification of ESGsidentification of ESGs
ESGs lists prepared by APEC and OECD - not complete
RIS list could be an alternative one Trend in Global exports of ESGs – Growing fast
and sharing more than 20% of global exports ESGs covering large part of the agriculture and
selected sub-sectors of the manufacturing sector India’s exports of ESGs – lower than global
average Critically affected sectors- Fruits & Vegetables,
Chemicals & auto Employment will be affected in various tech-
intensive sectors
Summing Up

1717
Thank youThank you