Embed Size (px)
Citation preview
Dissertation
zur Erlangung des Doktorgrades der Fakultät für Chemie und Pharmazie
der Ludwig-Maximilians-Universität München
Identification of microRNAs regulating adipocyte
differentiation via mTOR nutrient-signaling
Theresa Christina Käuferle
aus Aichach
2015
Dissertation zur Erlangung des Doktorgrades
der Fakultät für Chemie und Pharmazie
der Ludwig-Maximilians-Universität München
Identification of microRNAs regulating adipocyte
differentiation via mTOR nutrient-signaling
Theresa Christina Käuferle
aus
Aichach, Deutschland
2015

Erklärung
Diese Dissertation wurde im Sinne von § 7 der Promotionsordnung vom 28.November 2011
von Herrn Prof Dr. Adelbert Roscher betreut und von Herrn Prof. Dr. Klaus Förstemann vor
der Fakultät für Chemie und Pharmazie vertreten.
Eidesstattliche Versicherung
Diese Dissertation wurde eigenständig und ohne unerlaubte Hilfe erarbeitet.
München, den 07.04.2015
………………………………………………………………….
(Unterschrift des Autors)
Dissertation eingereicht am: 10.04.2015
1. Gutachter: Herr Prof. Dr. Klaus Förstemann
2. Gutachter: Herr Prof. Dr. Adelbert Roscher
Mündliche Prüfung am: 06.05.2015

Meinen Eltern

„I’m still confused, but on a higher level“
(Enrico Fermi)
TABLE OF CONTENTS
Inhalt
A Introduction .......................................................................................................... 1
1. Adipocyte differentiation in obesity .................................................................... 1
2. Adipocyte differentiation .................................................................................... 1
2.1 Sequential gene expression during adipocyte differentiation ...................... 1
2.2 Stimulatory regulators of adipocyte differentiation ...................................... 2
3. mTOR nutrient signaling ................................................................................... 3
3.1 Upstream regulators of mTOR ................................................................... 4
3.2 Cellular processes downstream of mTOR .................................................. 5
3.3 mTOR inhibition by rapamycin ................................................................... 6
4. miRNAs in gene regulation ............................................................................... 7
4.1 Biology of miRNAs ..................................................................................... 7
4.2 MiRNA biogenesis and mechanism of action ............................................. 7
4.3 MiRNAs in adipogenesis and nutrient sensing ........................................... 9
5. Aims of the thesis............................................................................................ 10
B Material and Methods ......................................................................................... 11
1. Material ........................................................................................................... 11
1.1 Sources of chemicals, reagents and enzymes ......................................... 11
1.2 Buffers and solutions ............................................................................... 12
1.3 Plasmids and oligonucleotides ................................................................. 14
1.4 Antibodies ................................................................................................ 15
1.5 Commercial kits ....................................................................................... 16
1.6 Cell lines .................................................................................................. 16
1.7 Consumables ........................................................................................... 16
1.8 Equipment and software .......................................................................... 17
2. Methods .......................................................................................................... 18
2.1 In silico target prediction .......................................................................... 18
2.2 Luciferase reporter assay ........................................................................ 18
2.3 Transfection experiment .......................................................................... 21
2.4 Differentiation experiment ........................................................................ 21
2.5 RNA/DNA analysis ................................................................................... 23
2.6 Immunoblot analysis ................................................................................ 25
2.7 Flow cytometry analysis ........................................................................... 25
2.8 Statistical analysis ................................................................................... 26

TABLE OF CONTENTS
C Results ............................................................................................................... 27
1. 3T3-L1 adipocyte model characterization ........................................................ 27
2. In silico target prediction ................................................................................. 28
3. Functional validation of miRNA-target gene pairs ........................................... 30
4. MiRNA-mediated regulation of mTOR effectors .............................................. 33
5. MiRNA-mediated effects on adipocyte differentiation ...................................... 35
6. Candidate targets for miRNA effects upstream Tsc1 ....................................... 40
7. Evaluation of miRNA families and clusters on adipocyte differentiation ........... 41
D Discussion .......................................................................................................... 45
1. Rapamycin alters expression of miRNAs ........................................................ 45
2. Selected miRNAs target predicted genes ........................................................ 46
2.1 In silico target prediction .......................................................................... 46
2.2 Functional confirmation by luciferase-based reporter assays ................... 47
2.3 Functional confirmation by transfection experiments ................................ 48
2.4 Functional confirmation on protein level ................................................... 49
3. Effects of selected miRNAs on mTOR-signaling ............................................. 51
4. Effects of selected miRNAs on adipocyte differentiation ................................. 52
5. MiRNA cluster 183/96/182 and miRNA family 103/107 ................................... 56
E Summary ............................................................................................................ 58
F References ......................................................................................................... 59
G Appendix ............................................................................................................ 66
1. Supplementary data ........................................................................................ 66
2. List of abbreviations ........................................................................................ 73
3. Curriculum vitae and publications ................................................................... 75
4. Acknowledgements ......................................................................................... 76

INTRODUCTION
1
A Introduction
1. Adipocyte differentiation in obesity
Obesity is defined as abnormal or excessive fat accumulation which may have adverse
effects on health1. According to World Health organization, people with a Body Mass
Index (BMI) of 30 or more are obese (BMI = body weight in kilograms divided by the
square of body height in metres: kg/m2). More than 2.8 million adults die each year from
obesity-related diseases such as metabolic syndrome, type 2 diabetes, musculo-
skeletal disorders and cardiovascular diseases1. The increasing prevalence of obesity is
not only a growing public health problem, but also a policy challenge as its
consequences have been responsible for 2-8 % of public health service costs2.
In the pathogenetic chain of events leading to obesity and its systemic complications
multiple mechanisms of food intake control become important3. Fuel-communicating
hormones as well as circulating nutrients can be detected by neurons resulting in
control of food intake, energy expenditure and glucose homeostasis. On adipose tissue
level the development of obesity involves adipocyte hypertrophy (increase in fat cell
size), adipogenesis (increase in fat cell number) and angiogenesis (formation of blood
vessels)4. Adipogenesis is mainly stimulated in times of caloric intake exceeding
nutritional requirements and includes pre-adipocyte proliferation as well as adipocyte
differentiation.
2. Adipocyte differentiation
2.1 Sequential gene expression during adipocyte di fferentiation
Whereas pre-adipocyte proliferation implies the replication of adipocyte precursors,
adipocyte differentiation includes the transition from fibroblast-like, stellate-shaped
precursor cells into mature, spherical adipocytes accumulating lipid droplets4. The
changes in cell shape are accompanied by molecular changes, such as alterations in
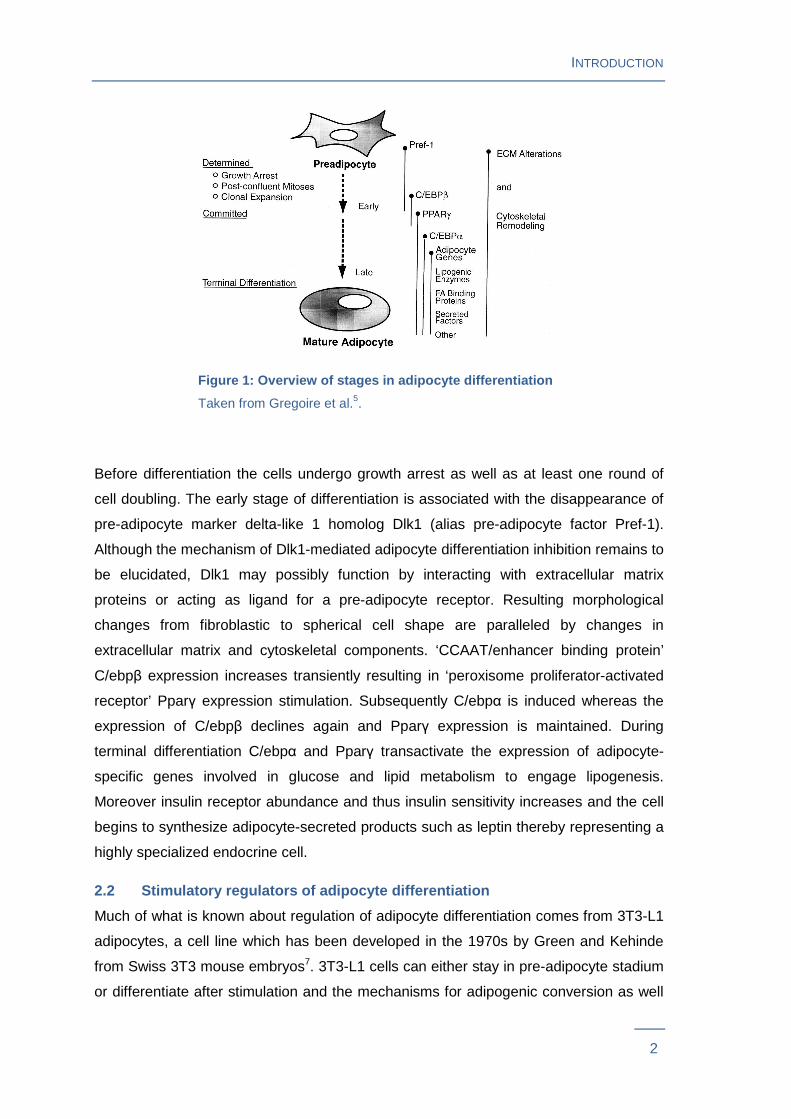
gene expression patterns resulting in an increased ability for lipid synthesis4-6 (Figure
1).
INTRODUCTION
2
Figure 1: Overview of stages in adipocyte different iation
Taken from Gregoire et al.5.
Before differentiation the cells undergo growth arrest as well as at least one round of
cell doubling. The early stage of differentiation is associated with the disappearance of
pre-adipocyte marker delta-like 1 homolog Dlk1 (alias pre-adipocyte factor Pref-1).
Although the mechanism of Dlk1-mediated adipocyte differentiation inhibition remains to
be elucidated, Dlk1 may possibly function by interacting with extracellular matrix
proteins or acting as ligand for a pre-adipocyte receptor. Resulting morphological
changes from fibroblastic to spherical cell shape are paralleled by changes in
extracellular matrix and cytoskeletal components. ‘CCAAT/enhancer binding protein’
C/ebpβ expression increases transiently resulting in ‘peroxisome proliferator-activated
receptor’ Pparγ expression stimulation. Subsequently C/ebpα is induced whereas the
expression of C/ebpβ declines again and Pparγ expression is maintained. During
terminal differentiation C/ebpα and Pparγ transactivate the expression of adipocyte-
specific genes involved in glucose and lipid metabolism to engage lipogenesis.
Moreover insulin receptor abundance and thus insulin sensitivity increases and the cell
begins to synthesize adipocyte-secreted products such as leptin thereby representing a
highly specialized endocrine cell.
2.2 Stimulatory regulators of adipocyte differenti ation
Much of what is known about regulation of adipocyte differentiation comes from 3T3-L1
adipocytes, a cell line which has been developed in the 1970s by Green and Kehinde
from Swiss 3T3 mouse embryos7. 3T3-L1 cells can either stay in pre-adipocyte stadium
or differentiate after stimulation and the mechanisms for adipogenic conversion as well
INTRODUCTION
3
as their morphological and biochemical characteristics of 3T3-L1 cells have been
described as similar to those of normal adipocytes in vivo. Moreover these cells have
several practical advantages over primary preadipocytes4, 5. Firstly, they provide a
continuous source of cells as they differentiate with high efficiency also after high
passage numbers, whereas primary adipocytes require a constant fresh supply due to
their limited lifetime in cell culture. Secondly, 3T3-L1 cells are a homogenous
population, all in the same stage of differentiation and thirdly they can be used for the
study of both, early and late adipogenic events. An advantage of primary pre-
adipocytes is that they can be isolated from adipose tissue of various species, at
different postnatal stages of development and from various anatomic locations4, 5.
In vitro studies have uncovered the mechanisms that drive the adipogenic process,
involving extracellular signals such as nutrient sufficiency, cAMP elevating agents,
hormonal and paracrine regulators4-6. 3T3-L1 cells for example can differentiate into
mature adipocytes in high-glucose growth medium after stimulation with a combination
of agents including ‘isobutyl-methylxanthine’ IBMX, dexamethasone and insulin4.
Isobutyl-methylxanthine IBMX enhances adipocyte differentiation by increasing
intracellular cAMP levels resulting in increased C/ebpβ expression. Just like hormones
in general, insulin and dexamethasone also mediate adipogenic effects by inducing
transcription of adipogenic genes via specific receptors. Insulin stimulates Pparγ
expression via Igf-I receptor activation whereas the synthetic glucocorticoid
dexamethasone up-regulates C/ebpδ via glucocorticoid receptor activation. The most
essential paracrine signaling molecule ‘insulin-like growth factor’ Igf-I is secreted by
expanding adipocytes and shares its mechanism with insulin. Further, nutrient
sufficiency, such as high glucose levels induces adipocyte differentiation by increasing
C/ebpα and Pparγ levels.
3. mTOR nutrient signaling
Various nutrient-signaling pathways are responsible for adapting cell differentiation as
well as cell growth to nutrient availability towards maintenance of whole-body metabolic
homeostasis8. Among these, the mechanistic target of rapamycin (mTOR) pathway is
an evolutionary conserved and well-studied intracellular nutrient-signaling pathway
involved in the regulation of adipocyte differentiation, lipogenesis and intracellular
accumulation of triglycerides8, 9. mTOR itself is a multifunctional protein kinase
consisting of two distinct complexes, termed mTOR complex 1 (mTORC1) and mTOR
complex 2 (mTORC2) differing in their protein composition. mTORC1 consists of the
INTRODUCTION
4
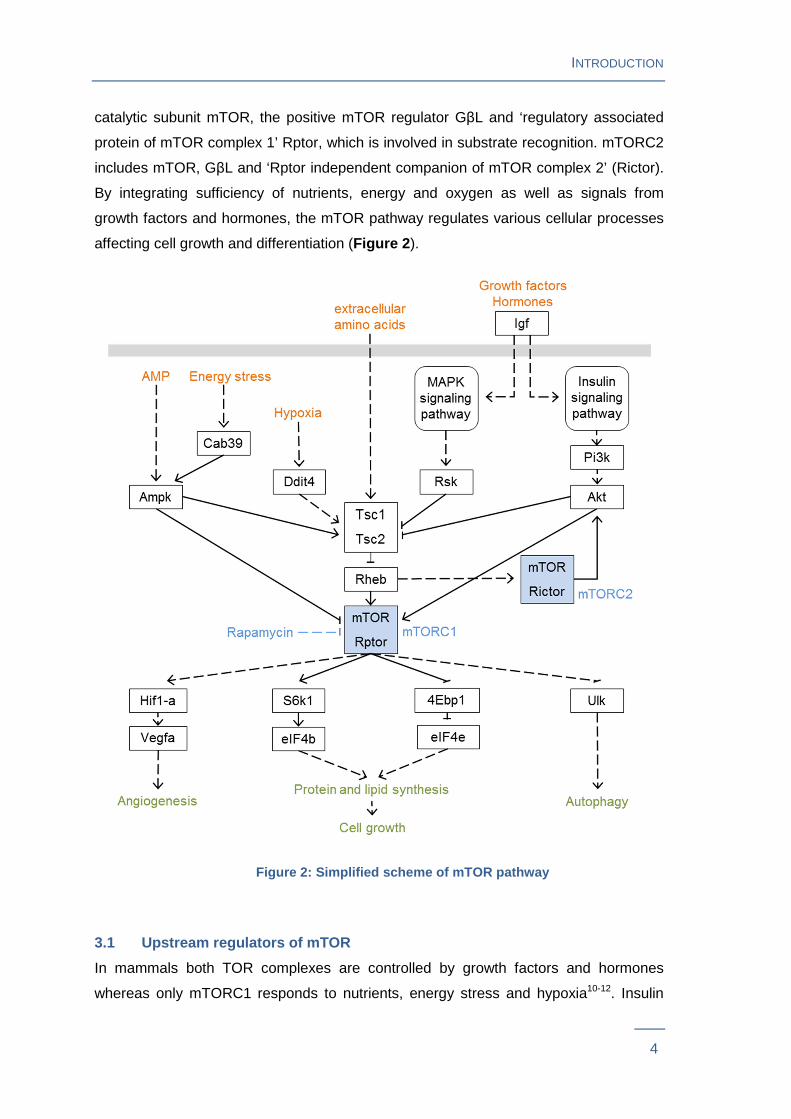
catalytic subunit mTOR, the positive mTOR regulator GβL and ‘regulatory associated
protein of mTOR complex 1’ Rptor, which is involved in substrate recognition. mTORC2
includes mTOR, GβL and ‘Rptor independent companion of mTOR complex 2’ (Rictor).
By integrating sufficiency of nutrients, energy and oxygen as well as signals from
growth factors and hormones, the mTOR pathway regulates various cellular processes
affecting cell growth and differentiation (Figure 2 ).
Figure 2: Simplified scheme of mTOR pathway
3.1 Upstream regulators of mTOR
In mammals both TOR complexes are controlled by growth factors and hormones
whereas only mTORC1 responds to nutrients, energy stress and hypoxia10-12. Insulin
INTRODUCTION
5
and Igf bind to their receptors, which in turn activate key transduction pathways such as
the insulin or the MAPK signaling pathway. In case of activated insulin signaling
‘phosphatidylinositol 3-kinase’ Pi3k is stimulated leading to phosphorylation of
‘thymoma viral proto-oncogene’ Akt. MAPK signaling cascade in the end stimulates
‘ribosomal protein S6 kinase‘ Rsk. Both cascades result in mTORC1 stimulation via
‘tuberous sclerosis complex’ (Tsc) inhibition. Tsc includes Tsc1 (alias hamartin) and
Tsc2 (alias tuberin) forming a physical and functional complex which acts via Rheb as
an important negative regulator of mTORC1. However, Akt can also promote mTORC1
activity in a Tsc-independent manner. mTORC2 responds to growth factors through a
Pi3k-dependent mechanism, which is poorly defined.
Nutrients, energy stress and hypoxia control mTOR signaling only via mTORC1. Firstly
it has long been known that re-addition of amino acids, such as leucine, to starved cells
can strongly stimulate mTORC1 activity, but the mechanism behind is not yet fully
understood. Secondly, since cell growth is an energy-intensive process, mTOR nutrient
signaling is also regulated by an energy sensor. Ampk is activated by increased
intracellular AMP or ADP levels that can occur during energy stress. Ampk activation
can also be triggered by Cab39, which in turn is also activated under conditions of
energy stress. Ampk then blocks mTORC1 signaling via Tsc2 or Rptor. Thirdly, cellular
metabolism is dependent on sufficient oxygen. Hypoxia inhibits mTORC1 by inducing
Ddit4 expression, which in turn activates mTORC1 inhibitor Tsc.
3.2 Cellular processes downstream of mTOR
mTOR senses these upstream signals in order to control various components of the
translation machinery, angiogenesis and regulation of autophagy10-12. Protein synthesis
is adapted to nutrient availability through translation initiation of a subset of genes via
phosphorylation of S6k1 and 4Ebp1. mTORC1-mediated S6k1 phosphorylation of
Thr389 results in phosphorylation of translation initiation factors and RNA binding
proteins such as eIF4b thereby driving efficient translation. mTORC1-mediated 4Ebp1
phosphorylation prevents its inhibitory activity by leading to dissociation from eIF4e
thereby allowing initiation of translation. Via a widely unknown mechanism, mTORC1
activates the translation of many lipogenic genes such as fatty acid synthase.
Experiments especially in the cancer field of mTOR-research show that tissue growth
beyond a certain size is dependent on angiogenesis and that mTOR serves as a central
regulator13. Stimulated by hypoxia, mTORC1 increases ‘vascular endothelial growth
factor’ (Vegfa) gene expression via Hif1-a14.
INTRODUCTION
6
Focused on the positive effects on anabolic processes so far, mTOR also promotes
growth by negatively regulating autophagy. Therefore mTORC1 directly suppresses
‘unc-51 like autophagy activating kinase’ Ulk, a kinase complex required to initiate
autophagy.
Until today it has been well established that mTOR plays an important role in adipocyte
differentiation11, 15. mTOR signaling regulates adipocyte differentiation mainly by
adjusting the cellular biosynthetic capacity to nutrient availability. On the one hand it
has been shown that mTORC1 overactivation stimulates adipogenesis. On the other
hand rapamycin-mediated mTORC1 inhibition down-regulates transcription factors such
as C/ebpα and Pparγ thereby decreasing the translation of proteins critical for
adipogenesis. Whereas 4Ebp1 controls terminal differentiation via the master regulator
Pparγ, mTOR effector S6k1 regulates the expression of early adipogenic transcription
factors. The mTORC1-mediated effect on adipogenesis has also been confirmed in
vivo. Mice with adipose-specific loss of mTORC1 are lean animals with fewer and
smaller adipocytes being resistant to high fat diet-induced obesity16. In vivo studies in
humans showed that chronic nutrient overload activates mTOR signaling and leads to
insulin resistance17, whereas inhibiting TOR-signaling in Drosophila blocks metabolic
and cardiotoxic phenotypes caused by high fat diet18.
3.3 mTOR inhibition by rapamycin
In the early 1990s mTOR has been discovered as the physical target of rapamycin
(alias sirolimus), a macrolide with anti-proliferative properties which has first been
isolated from a soil sample of Rapa Nui island11, 19. Rapamycin, which is produced by
Streptomyces hygroscopicus, acts by complexing with the highly conserved
immunophilin ‘FK506 binding protein 12’ (Fkbp12). Subsequently Fkbp12 binds and
inhibits mTORC1, whereas mTORC2 acts rapamycin insensitive.
In clinical practice, rapamycin and its derivatives are mainly used in transplant patients
due to their immunosuppressive activity. During treatments, weight loss which appears
to be mTOR-associated has been observed in kidney transplant and kidney disease
patients20, 21. Nevertheless in vivo application of rapamycin and its derivatives in obese
subjects for the purpose of inhibiting nutrient-driven mTOR overactivation and adipocyte
differentiation is precluded by associated unfavorable side-effects on pancreatic islet
cells, glucose homeostasis and insulin resistance22-24. Another disadvantage is that,
after initial inhibition, 4Ebp1 becomes rapamycin-resistant in cells subjected to high
dose or chronic rapamycin exposure resulting in sustained protein translation25.
INTRODUCTION
7
4. miRNAs in gene regulation
4.1 Biology of miRNAs
Whole genome sequencing in mammals revealed that 98 % of genetic material is non-
coding RNA, which in part is involved in gene regulation26, 27. MicroRNAs (miRNAs) are
a group of highly conserved, 18-25 bp long noncoding RNAs that regulate gene
expression in animals and in plants28-30. The first miRNA, namely lin-4, was discovered
in 1993 in Caenorhabditis elegans by Victor Ambros and colleagues as a regulator of
developmental timing. Ambros and Ruvkun groups noticed sequence complementarity
between the short RNA product encoded by the lin-4 gene and the 3´-UTR of lin-14
mRNA. Further they described that this complementarity was necessary for LIN-14
protein translational inhibition and thereby discovered a new mechanism of gene
regulation. In the following years growing numbers of small RNAs with regulatory roles
were discovered and in 2001, this class of RNAs was termed ‘microRNAs’. Until now,
more than 1,800 human and 1,100 murine miRNAs have been identified (miRbase
version 20). With the discovery of more of their respective targets and regulatory
functions, the enormous biological impact of miRNA-mediated gene regulation became
evident. MiRNAs are estimated to influence at least 30 % of genes in the human
genome and it has been described that single miRNAs can control whole signaling
cascades by targeting few key regulatory molecules within a given pathway31. As
functional consequences miRNAs were shown to play major roles in a variety of
biological processes and diseases including cell differentiation, proliferation and growth,
apoptosis and cancer.
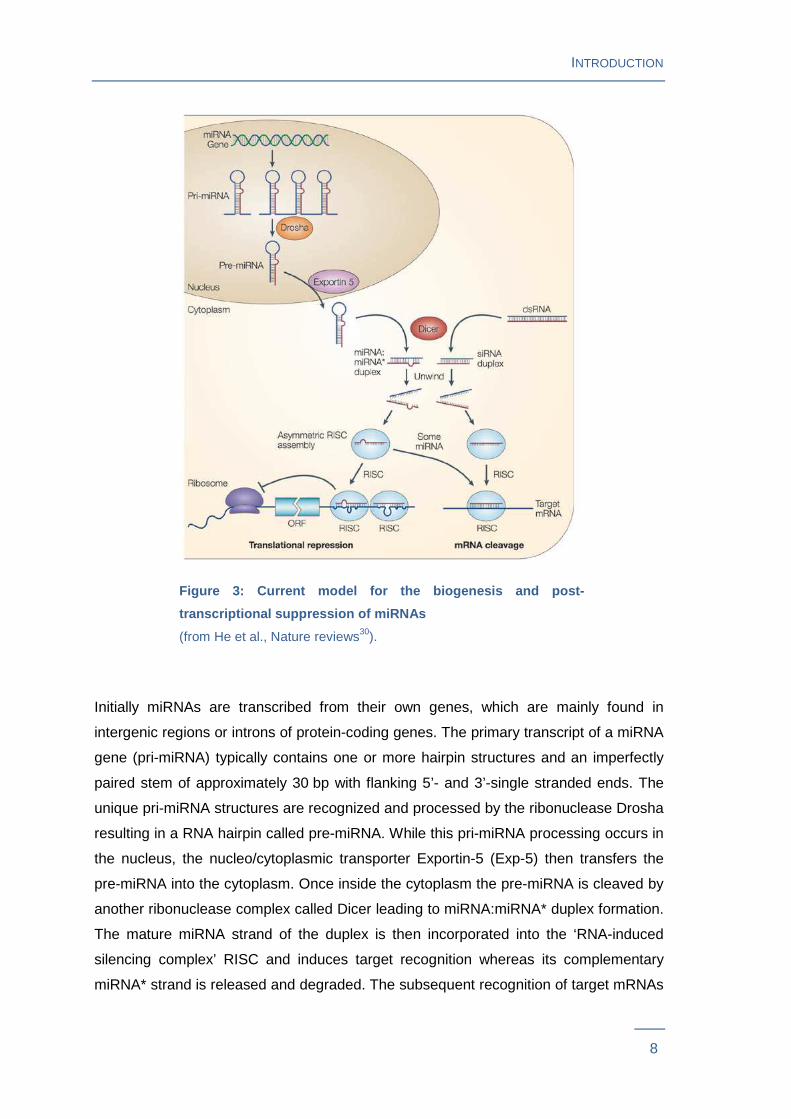
4.2 MiRNA biogenesis and mechanism of action
MiRNAs control gene expression post-transcriptionally through partial base-pairing with
their target mRNAs, which leads to mRNA degradation or repression of translation28-30
(Figure 3 ).
INTRODUCTION
8
Figure 3: Current model for the biogenesis and post -
transcriptional suppression of miRNAs
(from He et al., Nature reviews30).
Initially miRNAs are transcribed from their own genes, which are mainly found in
intergenic regions or introns of protein-coding genes. The primary transcript of a miRNA
gene (pri-miRNA) typically contains one or more hairpin structures and an imperfectly
paired stem of approximately 30 bp with flanking 5’- and 3’-single stranded ends. The
unique pri-miRNA structures are recognized and processed by the ribonuclease Drosha
resulting in a RNA hairpin called pre-miRNA. While this pri-miRNA processing occurs in
the nucleus, the nucleo/cytoplasmic transporter Exportin-5 (Exp-5) then transfers the
pre-miRNA into the cytoplasm. Once inside the cytoplasm the pre-miRNA is cleaved by
another ribonuclease complex called Dicer leading to miRNA:miRNA* duplex formation.
The mature miRNA strand of the duplex is then incorporated into the ‘RNA-induced
silencing complex’ RISC and induces target recognition whereas its complementary
miRNA* strand is released and degraded. The subsequent recognition of target mRNAs
INTRODUCTION
9
is based on the sequence complementarity of nucleotide positions 2–7 of the miRNA
(named seed sequence) to its binding site, mostly located in the 3’UTR of a target gene.
If perfect complementarity leads to target mRNA cleavage and central mismatches lead
to repression of translation is an ongoing debate. However, miRNA-mediated mRNA
degradation seems to be based on de-capping, de-adenylation and exonucleolytic
digestion, whereas translation inhibition is poorly understood and may involve multiple
mechanisms, such as inhibition of translation initiation and translation inhibition at the
post-initiation stage28-30.
Interestingly, a study in humans showed that 37 % of the known miRNA genes appear
in clusters of two or more miRNAs28, 32. These miRNAs derive from a common multi-
cistronic pri-miRNA and sometimes even show high sequence similarity. Clustered
miRNAs are influenced by similar regulation mechanisms and thus they may regulate a
common set of target mRNAs resulting in a functional relationship.
Further many mammalian miRNA genes were found to have paralogues that derived
from gene duplication thereby forming miRNA families. Since paralogues often have
identical seed sequences they may act redundantly33.
4.3 MiRNAs in adipogenesis and nutrient sensing
Several high throughput studies have identified a number of miRNAs, which are de-
regulated during mouse adipogenesis and some have also been experimentally
validated as regulators of 3T3-L1 adipocyte differentiation34. These include miR-143,
miR-103 and cluster 17/92, which increase triglyceride accumulation and/or 3T3-L1
differentiation as well as miR-27a, let-7, miR-15a and miR-448, which attenuate 3T3-L1
differentiation. The mTOR pathway is well-characterized as a nutrient signaling pathway
regulating cell differentiation. So far, however, only 3 miRNAs, namely miR-99a, -100
and -199a* have been confirmed to regulate mTOR signaling in the context of cancer
and dermal wound healing35-38. Thus the pattern of miRNA regulation involved in mTOR
signaling during adipocyte differentiation is not yet fully elucidated. A study of our group
experimentally identified a set of mTOR-associated miRNAs and provides a list of their
in silico predicted target genes within the mTOR pathway39.
Some miRNAs, such as miR-103 and miR-107 were shown to play a role in obesity and
its associated pathologies34, 40. This knowledge has been transferred to treat e.g.
hypercholesterolemia and liver steatosis in mice41, thereby demonstrating that miRNAs
can provide a promising target class for novel therapeutic options.
INTRODUCTION
10
5. Aims of the thesis
Understanding the molecular basis of nutrient-driven adipogenesis is essential to
identify and monitor new therapeutics, either by drugs or diets that could ameliorate the
adverse sequels of obesity. The identification of specific targets that exert rapamycin-
like effects on nutrient signaling might provide an approach to search for alternative
therapeutic options. In this study, we specifically aimed at identifying distinct miRNA-
target pairs that are associated with the inhibition of adipogenesis via mTOR nutrient
signaling. Specifically, the present study aimed at experimentally confirming selected
miRNA-target pairs within the mTOR nutrient signaling pathway and at investigating
candidate miRNAs’ influence on adipocyte differentiation via the mTOR pathway.
MATERIAL AND METHODS
11
B Material and Methods
1. Material
1.1 Sources of chemicals, reagents and enzymes
AppliChem, Darmstadt, Germany
Albumin Fraction V pH 7.0, NaN3
Applied Biosystems, Carlsbad, USA
Nuclease-free water, Power SYBR® Green Mastermix, TaqMan® Universal PCR Master
Mix
Aventis, Sanofi, Paris, France
Insulin Insuman rapid (40 I.E./ml)
Calbiochem®, Merck, Darmstadt Germany
Glycerol, Phosphatase Inhibitor Cocktail Set II, Protease Inhibitor Cocktail Set III
Carl Roth, Karlsruhe, Germany
Agar-Agar, Ampicillin, Bromphenol Blue, Isopropanol (≥99.8 %), MgSO4, ATP,
(MgCO3)4Mg(OH)2, MgSO4, sodium acetate, Tricine, Tris, Tween20
Fermentas, Waltham, USA
dNTPs, Gene RulerTM 1 kb DNA Ladder,NotI restriction enzyme (Buffer 0), PfuDNA
Polymerase (Pfu buffer without MgSO4), T4 DNA ligase (T4 DNA ligase buffer)
GIBCO, Carlsbad, USA
FBS
Invitrogen, Carlsbad, USA
Agarose, PBS, LipofectamineTM2000, DMSO
Merck, Darmstadt, Germany
NaCl
New England Biolabs, Beverly, USA
ApaLI restriction enzyme (NEBuffer 4), AsiI restriction enzyme (NEBuffer 4)
PAA Laboratories GmbH, Pasching, Austria
MATERIAL AND METHODS
12
Antibiotic-antimycotic solution, DMEM (4.5 g/L glucose, with L-Glutamin), Trypsin-EDTA
(10x)
pjk, Kleinblittersdorf, Germany
Coenzym A, DTT
Qiagen, Hilden, Germany
Qiazol Lysis Reagent
Serva, Heidelberg, Germany
rapamycin stock (0.92mg/ml in DMSO)
Sigma-Aldrich, St. Louis, USA
7-AAD, Chloroform (>99 %), Dexamethasone 98 %, DMSO, EDTA, IBMX (1 M), LB
Agar, Oil Red O stock (5 mg/ml), SDS, Triton X-100, Trypan Blue, 25 % glutaric acid
SynChem, Illinois, USA
coelenterazine, D-Luciferin
Thermo Fisher Scientific, Waltham, USA
RestoreTM PLUS Western Blot Stripping Buffer
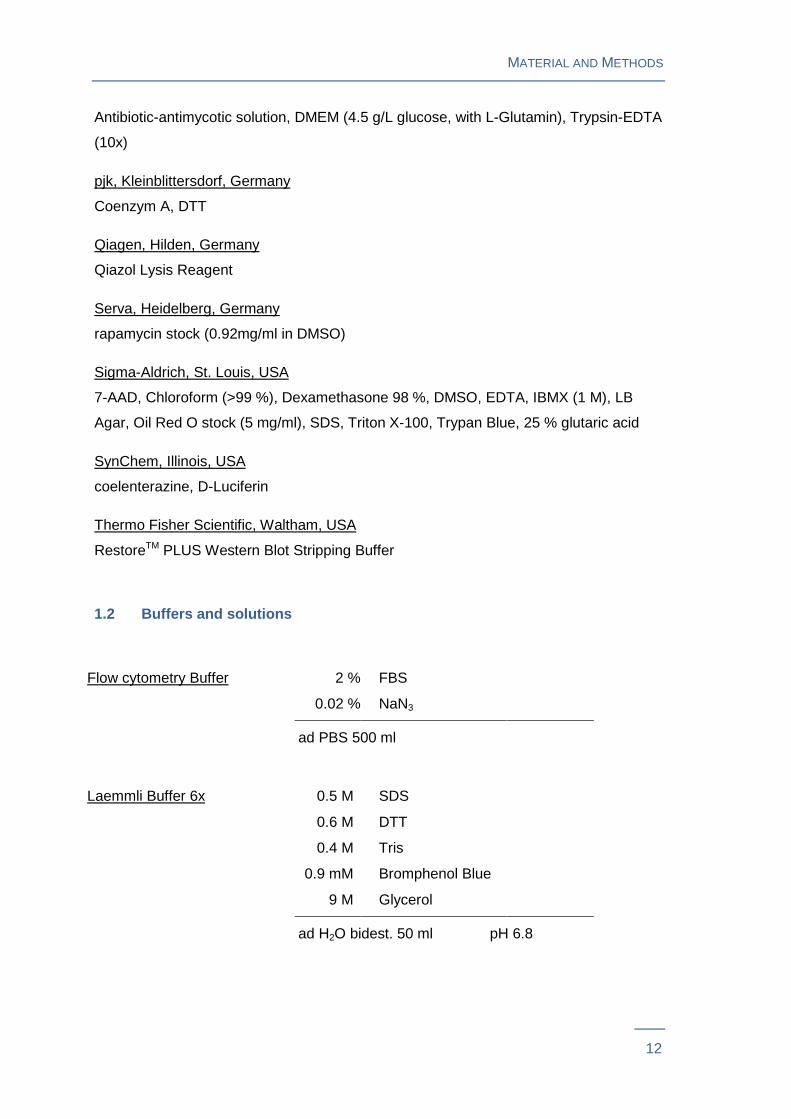
1.2 Buffers and solutions
Flow cytometry Buffer 2 % FBS
0.02 % NaN3
ad PBS 500 ml
Laemmli Buffer 6x 0.5 M SDS
0.6 M DTT
0.4 M Tris
0.9 mM Bromphenol Blue
9 M Glycerol
ad H2O bidest. 50 ml pH 6.8
MATERIAL AND METHODS
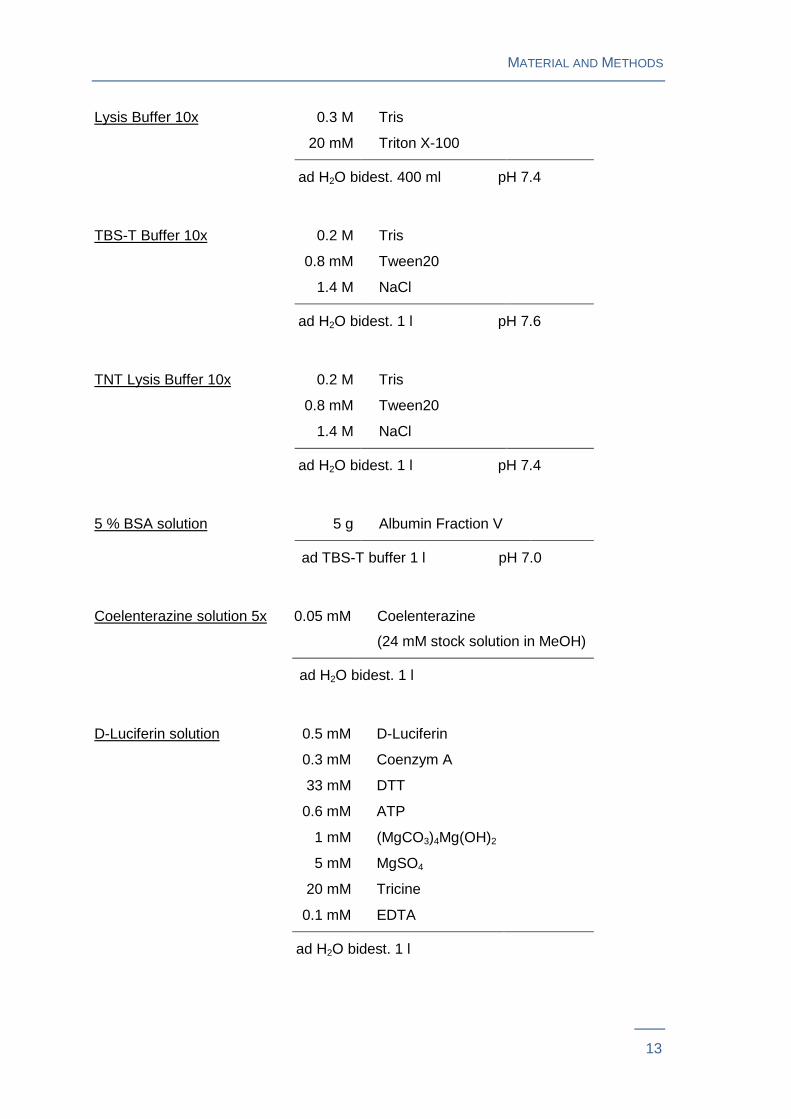
13
Lysis Buffer 10x 0.3 M Tris
20 mM Triton X-100
ad H2O bidest. 400 ml pH 7.4
TBS-T Buffer 10x 0.2 M Tris
0.8 mM Tween20
1.4 M NaCl
ad H2O bidest. 1 l pH 7.6
TNT Lysis Buffer 10x 0.2 M Tris
0.8 mM Tween20
1.4 M NaCl
ad H2O bidest. 1 l pH 7.4
Coelenterazine solution 5x 0.05 mM Coelenterazine
(24 mM stock solution in MeOH)
ad H2O bidest. 1 l
D-Luciferin solution 0.5 mM D-Luciferin
0.3 mM Coenzym A
33 mM DTT
0.6 mM ATP
1 mM (MgCO3)4Mg(OH)2
5 mM MgSO4
20 mM Tricine
0.1 mM EDTA
ad H2O bidest. 1 l
5 % BSA solution 5 g Albumin Fraction V
ad TBS-T buffer 1 l pH 7.0
MATERIAL AND METHODS
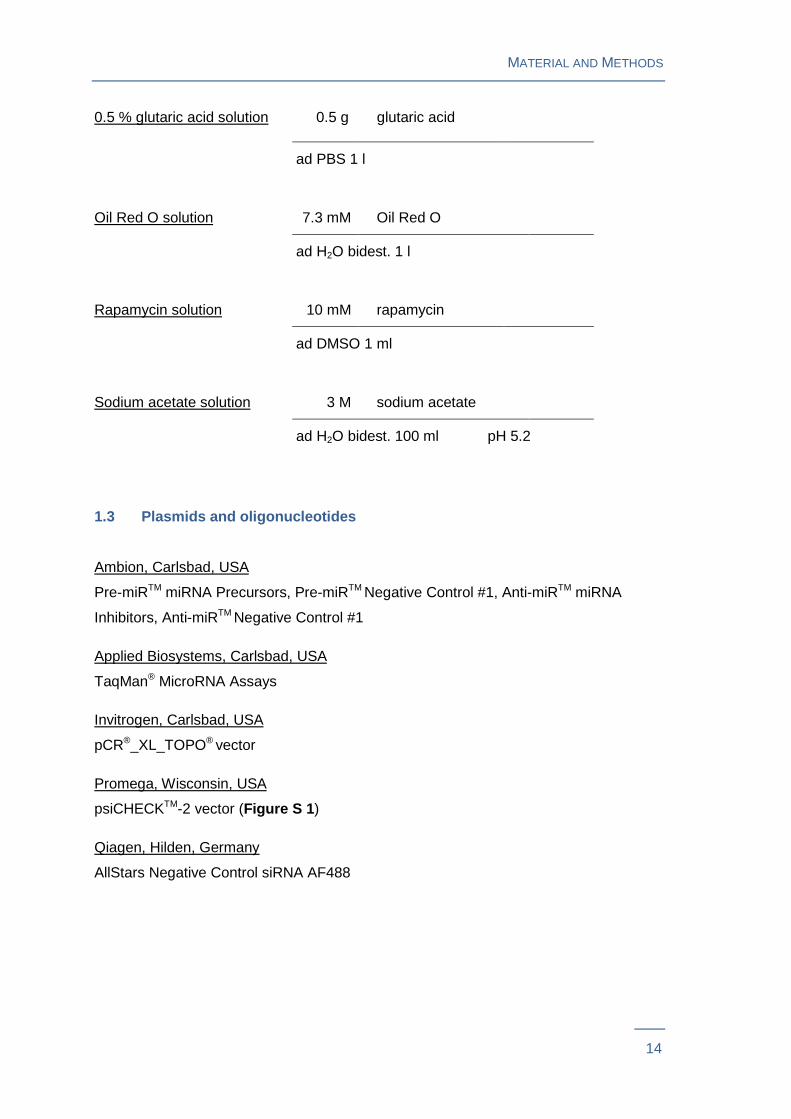
14
0.5 % glutaric acid solution 0.5 g glutaric acid
ad PBS 1 l
Oil Red O solution 7.3 mM Oil Red O
ad H2O bidest. 1 l
Rapamycin solution 10 mM rapamycin
ad DMSO 1 ml
Sodium acetate solution 3 M sodium acetate
ad H2O bidest. 100 ml pH 5.2
1.3 Plasmids and oligonucleotides
Ambion, Carlsbad, USA
Pre-miRTM miRNA Precursors, Pre-miRTM Negative Control #1, Anti-miRTM miRNA
Inhibitors, Anti-miRTM Negative Control #1
Applied Biosystems, Carlsbad, USA
TaqMan® MicroRNA Assays
Invitrogen, Carlsbad, USA
pCR®_XL_TOPO® vector
Promega, Wisconsin, USA
psiCHECKTM-2 vector (Figure S 1 )
Qiagen, Hilden, Germany
AllStars Negative Control siRNA AF488
MATERIAL AND METHODS
15
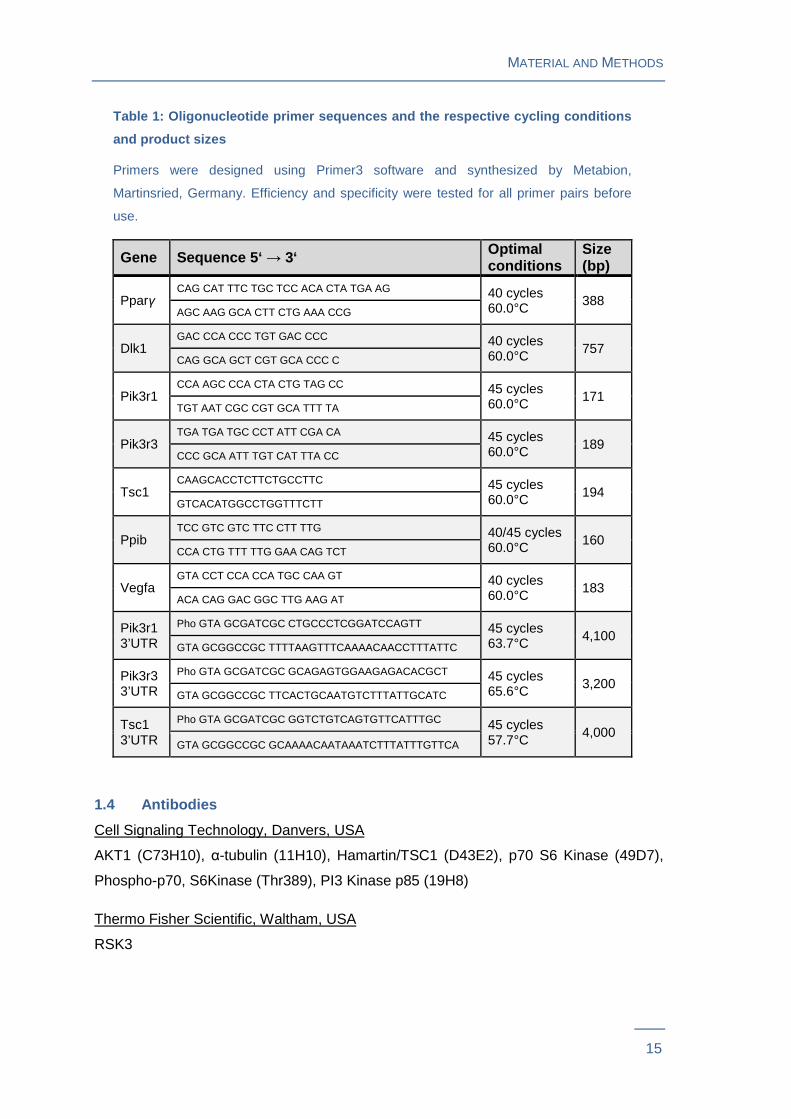
Table 1: Oligonucleotide primer sequences and the r espective cycling conditions
and product sizes
Primers were designed using Primer3 software and synthesized by Metabion,
Martinsried, Germany. Efficiency and specificity were tested for all primer pairs before
use.
Gene Sequence 5‘ → 3‘ Optimal conditions
Size (bp)
Pparγ CAG CAT TTC TGC TCC ACA CTA TGA AG 40 cycles
60.0°C 388 AGC AAG GCA CTT CTG AAA CCG
Dlk1 GAC CCA CCC TGT GAC CCC 40 cycles
60.0°C 757 CAG GCA GCT CGT GCA CCC C
Pik3r1 CCA AGC CCA CTA CTG TAG CC 45 cycles
60.0°C 171 TGT AAT CGC CGT GCA TTT TA
Pik3r3 TGA TGA TGC CCT ATT CGA CA 45 cycles
60.0°C 189 CCC GCA ATT TGT CAT TTA CC
Tsc1 CAAGCACCTCTTCTGCCTTC 45 cycles
60.0°C 194 GTCACATGGCCTGGTTTCTT
Ppib TCC GTC GTC TTC CTT TTG 40/45 cycles
60.0°C 160 CCA CTG TTT TTG GAA CAG TCT
Vegfa GTA CCT CCA CCA TGC CAA GT 40 cycles
60.0°C 183 ACA CAG GAC GGC TTG AAG AT
Pik3r1 3’UTR
Pho GTA GCGATCGC CTGCCCTCGGATCCAGTT 45 cycles 63.7°C 4,100
GTA GCGGCCGC TTTTAAGTTTCAAAACAACCTTTATTC
Pik3r3 3’UTR
Pho GTA GCGATCGC GCAGAGTGGAAGAGACACGCT 45 cycles 65.6°C 3,200
GTA GCGGCCGC TTCACTGCAATGTCTTTATTGCATC
Tsc1 3’UTR
Pho GTA GCGATCGC GGTCTGTCAGTGTTCATTTGC 45 cycles 57.7°C
4,000 GTA GCGGCCGC GCAAAACAATAAATCTTTATTTGTTCA
1.4 Antibodies
Cell Signaling Technology, Danvers, USA
AKT1 (C73H10), α-tubulin (11H10), Hamartin/TSC1 (D43E2), p70 S6 Kinase (49D7),
Phospho-p70, S6Kinase (Thr389), PI3 Kinase p85 (19H8)
Thermo Fisher Scientific, Waltham, USA
RSK3
MATERIAL AND METHODS
16
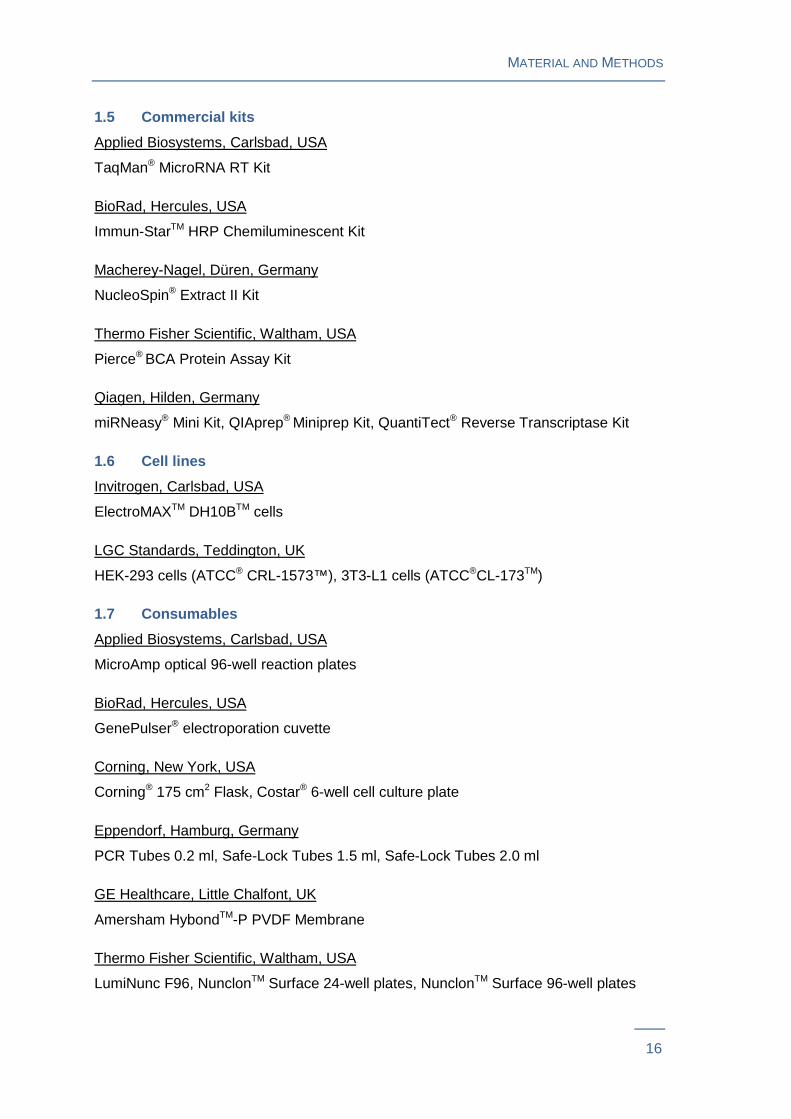
1.5 Commercial kits
Applied Biosystems, Carlsbad, USA
TaqMan® MicroRNA RT Kit
BioRad, Hercules, USA
Immun-StarTM HRP Chemiluminescent Kit
Macherey-Nagel, Düren, Germany
NucleoSpin® Extract II Kit
Thermo Fisher Scientific, Waltham, USA
Pierce® BCA Protein Assay Kit
Qiagen, Hilden, Germany
miRNeasy® Mini Kit, QIAprep® Miniprep Kit, QuantiTect® Reverse Transcriptase Kit
1.6 Cell lines
Invitrogen, Carlsbad, USA
ElectroMAXTM DH10BTM cells
LGC Standards, Teddington, UK
HEK-293 cells (ATCC® CRL-1573™), 3T3-L1 cells (ATCC®CL-173TM)
1.7 Consumables
Applied Biosystems, Carlsbad, USA
MicroAmp optical 96-well reaction plates
BioRad, Hercules, USA
GenePulser® electroporation cuvette
Corning, New York, USA
Corning® 175 cm2 Flask, Costar® 6-well cell culture plate
Eppendorf, Hamburg, Germany
PCR Tubes 0.2 ml, Safe-Lock Tubes 1.5 ml, Safe-Lock Tubes 2.0 ml
GE Healthcare, Little Chalfont, UK
Amersham HybondTM-P PVDF Membrane
Thermo Fisher Scientific, Waltham, USA
LumiNunc F96, NunclonTM Surface 24-well plates, NunclonTM Surface 96-well plates
MATERIAL AND METHODS
17
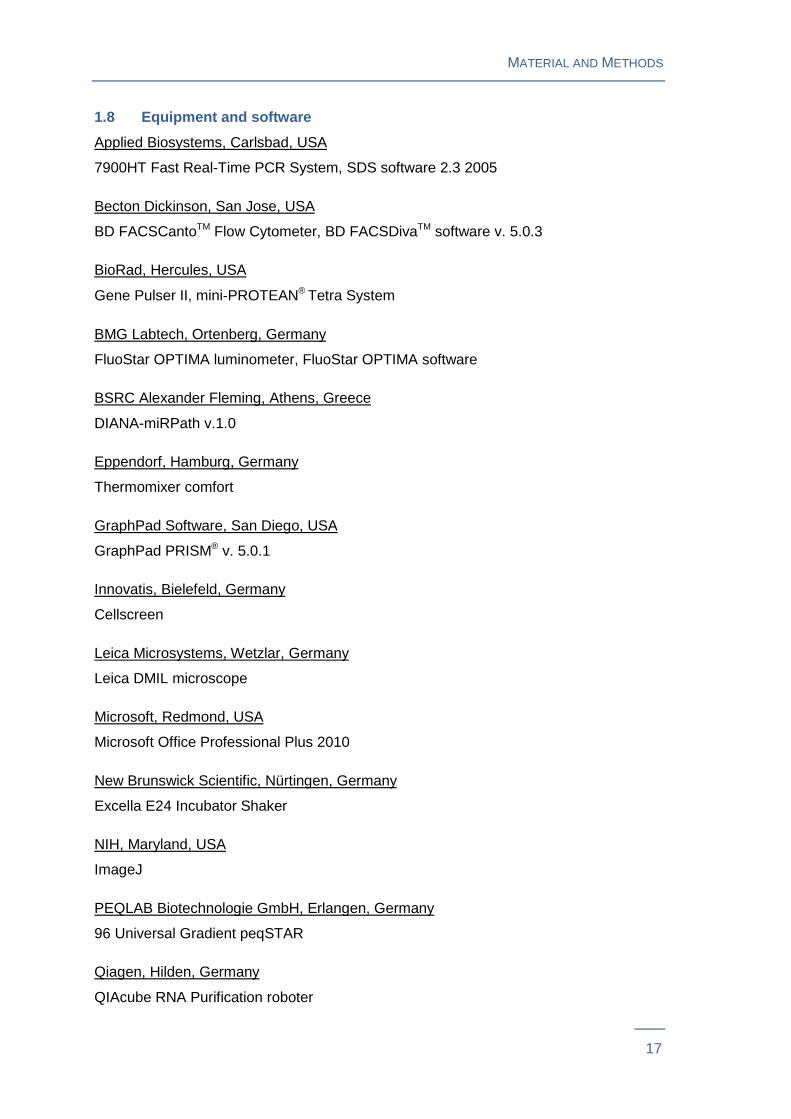
1.8 Equipment and software
Applied Biosystems, Carlsbad, USA
7900HT Fast Real-Time PCR System, SDS software 2.3 2005
Becton Dickinson, San Jose, USA
BD FACSCantoTM Flow Cytometer, BD FACSDivaTM software v. 5.0.3
BioRad, Hercules, USA
Gene Pulser II, mini‐PROTEAN® Tetra System
BMG Labtech, Ortenberg, Germany
FluoStar OPTIMA luminometer, FluoStar OPTIMA software
BSRC Alexander Fleming, Athens, Greece
DIANA-miRPath v.1.0
Eppendorf, Hamburg, Germany
Thermomixer comfort
GraphPad Software, San Diego, USA
GraphPad PRISM® v. 5.0.1
Innovatis, Bielefeld, Germany
Cellscreen
Leica Microsystems, Wetzlar, Germany
Leica DMIL microscope
Microsoft, Redmond, USA
Microsoft Office Professional Plus 2010
New Brunswick Scientific, Nürtingen, Germany
Excella E24 Incubator Shaker
NIH, Maryland, USA
ImageJ
PEQLAB Biotechnologie GmbH, Erlangen, Germany
96 Universal Gradient peqSTAR
Qiagen, Hilden, Germany
QIAcube RNA Purification roboter
MATERIAL AND METHODS
18
Scientific Industries, New York, USA
Vortex Genie 2
Thermo Fisher Scientific, Waltham, USA
HERAcell 240 incubator, Heraeus Fresco 17 Centrifuge, Nanodrop® MD-1000
Universität Düsseldorf, Düsseldorf, Germany
Ligation Calculator
Whitehead Institute for Biomedical Research
Primer3 v. 0.4.0
2. Methods
2.1 In silico target prediction
Prediction of direct miRNA targets was performed using five prediction programs: PITA,
miRanda, targetScanS, pictar and targetspy. Targets with consensus target prediction
of at least 2 algorithms were considered predicted. Because of the similarity of their
seed sequences, miRNAs belonging to the same family were grouped. For pathway
enrichment analysis, DIANA-miRPath (v.1.0) software was used applying PicTar 4-way
and TargetScan 5 algorithms42.
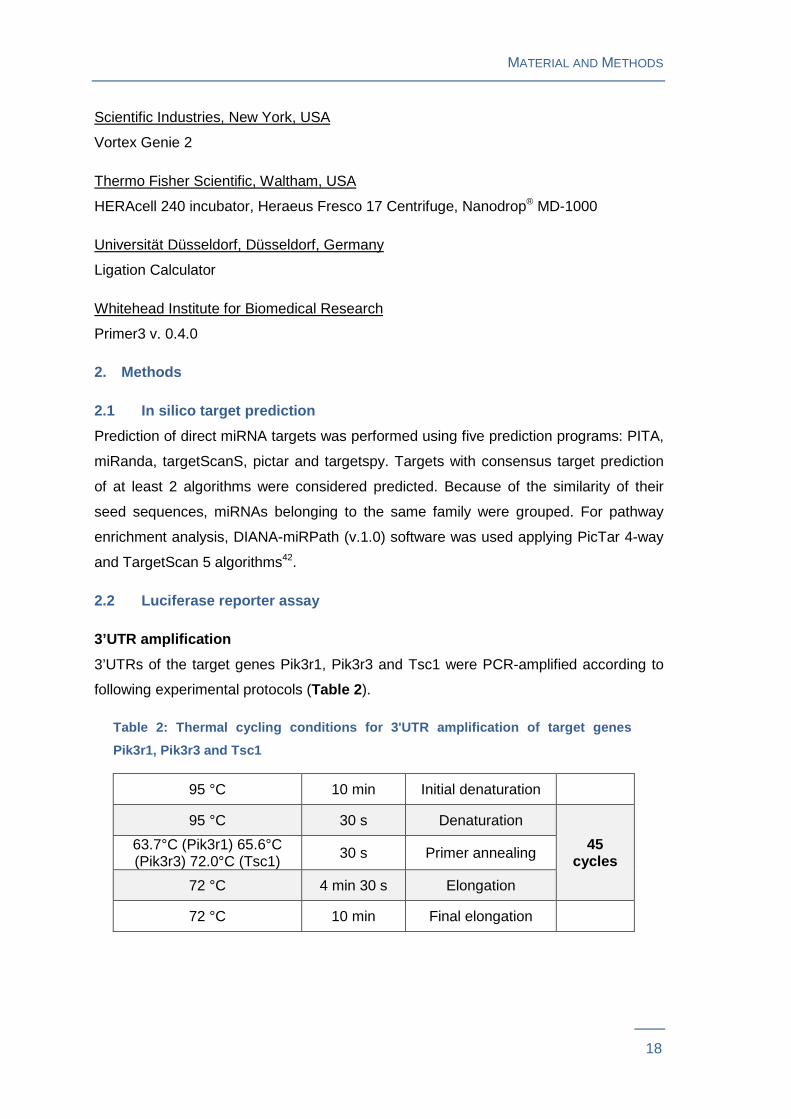
2.2 Luciferase reporter assay
3’UTR amplification
3’UTRs of the target genes Pik3r1, Pik3r3 and Tsc1 were PCR-amplified according to
following experimental protocols (Table 2 ).
Table 2: Thermal cycling conditions for 3'UTR ampli fication of target genes
Pik3r1, Pik3r3 and Tsc1
95 °C 10 min Initial denaturation
95 °C 30 s Denaturation
45 cycles
63.7°C (Pik3r1) 65.6°C (Pik3r3) 72.0°C (Tsc1) 30 s Primer annealing
72 °C 4 min 30 s Elongation
72 °C 10 min Final elongation
MATERIAL AND METHODS
19
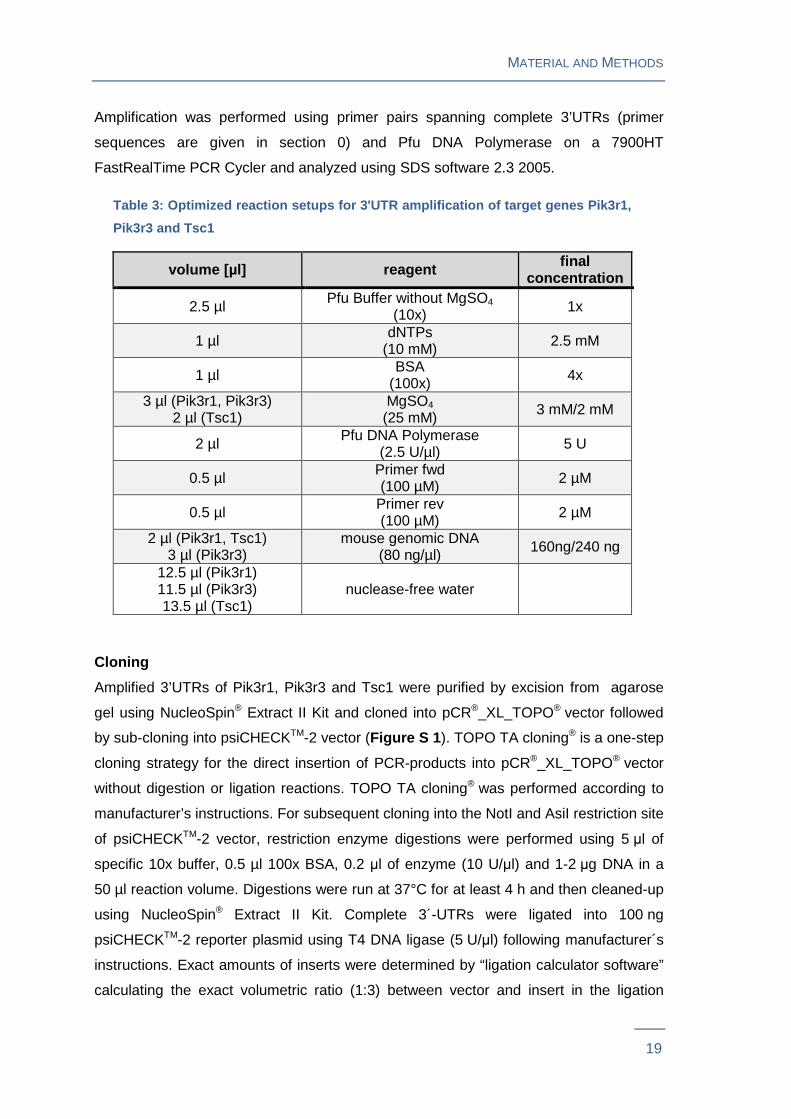
Amplification was performed using primer pairs spanning complete 3’UTRs (primer
sequences are given in section 0) and Pfu DNA Polymerase on a 7900HT
FastRealTime PCR Cycler and analyzed using SDS software 2.3 2005.
Table 3: Optimized reaction setups for 3'UTR amplif ication of target genes Pik3r1,
Pik3r3 and Tsc1
volume [µl] reagent final concentration
2.5 µl Pfu Buffer without MgSO4 (10x) 1x
1 µl dNTPs (10 mM) 2.5 mM
1 µl BSA (100x) 4x
3 µl (Pik3r1, Pik3r3) 2 µl (Tsc1)
MgSO4
(25 mM) 3 mM/2 mM
2 µl Pfu DNA Polymerase (2.5 U/µl) 5 U
0.5 µl Primer fwd (100 µM) 2 µM
0.5 µl Primer rev (100 µM) 2 µM
2 µl (Pik3r1, Tsc1) 3 µl (Pik3r3)
mouse genomic DNA (80 ng/µl) 160ng/240 ng
12.5 µl (Pik3r1) 11.5 µl (Pik3r3) 13.5 µl (Tsc1)
nuclease-free water
Cloning
Amplified 3’UTRs of Pik3r1, Pik3r3 and Tsc1 were purified by excision from agarose
gel using NucleoSpin® Extract II Kit and cloned into pCR®_XL_TOPO® vector followed
by sub-cloning into psiCHECKTM-2 vector (Figure S 1 ). TOPO TA cloning® is a one-step
cloning strategy for the direct insertion of PCR-products into pCR®_XL_TOPO® vector
without digestion or ligation reactions. TOPO TA cloning® was performed according to
manufacturer’s instructions. For subsequent cloning into the NotI and AsiI restriction site
of psiCHECKTM-2 vector, restriction enzyme digestions were performed using 5 µl of
specific 10x buffer, 0.5 µl 100x BSA, 0.2 µl of enzyme (10 U/µl) and 1-2 µg DNA in a
50 µl reaction volume. Digestions were run at 37°C for at least 4 h and then cleaned-up
using NucleoSpin® Extract II Kit. Complete 3´-UTRs were ligated into 100 ng
psiCHECKTM-2 reporter plasmid using T4 DNA ligase (5 U/µl) following manufacturer´s
instructions. Exact amounts of inserts were determined by “ligation calculator software”
calculating the exact volumetric ratio (1:3) between vector and insert in the ligation
MATERIAL AND METHODS
20
reaction. In order to verify the identity of the cloned insert, digestions using ApaLI
according to manufacturer’s guidelines were set up for an analytical agarose gel. To
purify and concentrate vector constructs, chloroform precipitation was used as
described in section B 2.5.
In order to amplify the vector constructs electrocompetent E.coli cells were transformed
by electroporation. For this purpose, 2 µl of electrocompetent E.coli were added to 50
and 100 ng plasmid vector in 50 µl nuclease-free water. The mixtures were transferred
to a pre-cooled GenePulser® electroporation cuvette and transformation was performed
on a Gene Pulser II using the following conditions: 1,800 V, 100 Ω, 25 µF. The mixtures
were pipetted into pre-warmed LB medium directly after electroporation and incubated
at 37°C for 1 h, followed by centrifugation at 4,000 rpm for 4 min. Subsequently the
supernatant was discarded and the pellet was resuspended in the remaining liquid. 50
µl and 100 µl of resuspension was spread on LB-Amp100 agar plates (15 g Agar-Agar in
1 l LB medium) and cultured at 37°C overnight. Formed colonies were picked and
transferred to 5 ml LB-Amp100 overnight cultures incubated at 37°C. For plasmid
purification QIAprep® Miniprep Kit was applied following manufacturer´s instructions.
Clones were verified by control digestion with ApaLI.
Measurement of reporter gene expression
Direct interaction between the candidate miRNAs and the 3´-UTRs of the predicted
target genes Tsc1, Pik3r1 and Pik3r3 was examined by luciferase-based reporter
assays. Therefore HEK-293 cells, cultured in DMEM (4.5 g/L glucose, with L-Glutamin)
supplemented with 10 % heat-inactivated FBS and 1 % antibiotic-antimycotic solution in
24-well plates, were transfected using Lipofectamine2000 according to the
manufacturer’s instructions. 20 pmol of the respective Pre-miRTM miRNA Precursor or
negative control #1 and 100 ng of the reporter vector-3’UTR constructs were co-
transfected per well.
In case of effective silencing by the respective miRNAs Renilla luciferase activity is
reduced due to the adjacently inserted 3’UTR. Firefly luciferase activity was used as a
control for transfection efficiency. Renilla luciferase activity was quantified using
coelenterazine as substrate whereas firefly luciferase activity was quantified by addition
of its substrate luciferin. Therefore cells were lysed 72 h after transfection by addition of
120 µl lysis buffer per well and incubated for 10 min at room temperature with constant
agitation. Using a white 96-well plate, 100 µl of the respective substrate solutions were
added automatically to 50 µl of lysed sample and luminescence was measured by
MATERIAL AND METHODS
21
FluoStar OPTIMA luminometer. Background luminescence was subtracted for each well
by FluoStar software. Subsequently, Renilla luciferase activity was normalized to firefly
luciferase activity for each sample. Luciferase assay was performed in two independent
experiments each performed in triplicates.
2.3 Transfection experiment
Culture of 3T3-L1 adipocytes
For transfection and differentiation experiments, 3T3-L1 cells were pre-cultured in
DMEM (4.5 g/l glucose) supplemented with 10 % heat-inactivated FBS and 1 %
antibiotics/antimycotics at 37°C and 5 % CO2 under standard conditions. Detachment of
cells was achieved by addition of 2 ml Trypsin-EDTA (0.05 % (w/v) Trypsin and 0.5 mM
EDTA) per 175 cm2 cell culture flask and subsequent incubation for 4 min at 37°C. As
soon as detachment was visible, cell culture medium was added to stop the enzymatic
reaction.
Transfection
For transfection, cells were seeded in 24-well plates (80,000 cells per well). After 24
hours cells reached confluence and transfection was performed using
Lipofectamine2000 following manufacturer´s instructions. 20 pmol of the respective Pre-
miRTM miRNA Precursors and or Anti-miRTM miRNA Inhibitors were transfected. Cells
transfected with Pre-miRTM miRNA Precursor Negative Control #1 or Anti-miRTM miRNA
Inhibitor Negative Control #1 were used as control.
Cell harvest
After 3 days, cells were harvested by adding 200 µl Qiazol Lysis Reagent and
incubated at 37°C for 2 minutes. Four independent experiments were performed, with
each treatment done in 6 replicates, which were pooled. RNA was isolated and miRNA-
as well as mRNA levels were quantified as described in section B 2.5. Harvesting of
cells for immunoblots is described in section B 2.6.
2.4 Differentiation experiment
Cell culture and transfection
3T3-L1 adipocytes were pre-cultured as for transfection experiments. For differentiation
experiments, cells were seeded in 6-well plates (250,000 cells/well). After 24 hours cells
were transfected with 80 pmol pre-/anti-miRNAs using Lipofectamine2000 as described
MATERIAL AND METHODS
22
in section B 2.3. Cells transfected with negative control pre-/anti-miRNAs were used as
control.
Differentiation
Two days after transfection, differentiation was initiated (designated as day 0) by the
addition of 200 nM insulin, 1 µM dexamethasone and 0.5 mM IBMX to growth medium.
After 3 days cells were further grown in growth medium supplemented with 200 nM
insulin and medium was changed again at day 5. A rapamycin concentration of 20 nM
directly added to the medium was used for inhibition of 3T3-L1 adipogenic
differentiation. Cells were visually monitored for viability during the whole procedure.
Cell harvest
Cells were harvested at day 0, day 3 and day 6 of differentiation by the addition of
750 µl Qiazol Lysis Reagent per well. Two independent experiments were performed,
each measured in technical triplicates. RNA was isolated and miRNA- as well as mRNA
levels were quantified as described for transfection experiments.
Lipid droplet quantification
Oil Red O staining of 3T3-L1 adipocytes was performed following the procedure
described by Green and Kehinde43 with minor modifications. Briefly, cells were washed
with PBS and fixed in 0.5 % glutaric acid solution for 5 min. Cells were washed twice
with PBS followed by a wash step with 60 % isopropanol. Cells were stained in freshly
prepared Oil Red O solution for 1 h. After staining, the cells were subsequently washed
with 60 % isopropanol and PBS. Quantification of lipid droplet size (µm2) and number
was evaluated optically by light microscopy at day 6 of differentiation using a digital
image analysis approach as previously described44. For this purpose, Oil Red O stained
cell images were thresholded for the lipid droplet signal via imaging software ImageJ. In
order to identify single droplets and separate overlapping droplets the image was
subjected to watershed object separation. Data were exported and analyzed using
Microsoft Excel software.
In a second confirmatory approach, lipid droplets were quantified by an absorbance
based method. Therefore cells were de-stained with 100 % isopropanol for 30 minutes
and the Oil Red O content in the supernatant was measured by FluoStar OPTIMA
luminometer. Absorbance was normalized to the percentage of well area covered by
cells as determined using Cellscreen automated microscopy.
MATERIAL AND METHODS
23
2.5 RNA/DNA analysis
Isolation of total RNA including small RNAs
For total RNA-isolation, 3T3-L1 cells were lysed directly by adding QIAzol Lysis
Reagent. Lysates were transferred into a microcentrifuge tube and cooled on ice until
RNA was isolated with miRNeasy Mini Kit and QIACube RNA Purification roboter
according to manufacturer’s instructions.
Chloroform precipitation for DNA purification
Vector constructs were purified and concentrated after ligation reaction as followed: An
equal volume of chloroform was added to the sample and the tube was mixed
vigorously until an emulsion was formed. The aqueous phase was transferred to a fresh
tube, while the organic and interphase were discarded. For DNA precipitation 0.3 M
final concentration of sodium acetate pH 5.2 and two volumes of 100 % ethanol were
added. Samples were incubated at -20°C for 1 h and subsequently centrifuged at 4°C
for 30 min. After removal of the supernatant, the pellet was washed once with 70 %
ethanol, air-dried and resuspended in 10-50 µl aqua ad injectabilia.
RNA Quality testing
RNA quality and concentration was determined by absorbance measurement.
Acceptable values were defined as 260/280 nm ratios above 2.0 and 260/230 nm ratios
above 1.0. In addition, RNA integrity was analyzed by native agarose gel
electrophoresis. Therefore, 1-3 µg RNA was denatured at 85°C for 3 min. After cooling
on ice and addition of 2 µl loading dye, samples were loaded on a 0.8 % agarose gel in
TAE buffer with 0.5 µg/ml ethidium bromide added to the gel and run at 75 V.
miRNA analysis
For miRNA quantification, RNA was reverse transcribed and subjected to real-time PCR
(rt-PCR) analysis. Therefore cDNA synthesis from 50 ng total RNA was performed
using TaqMan® MicroRNA RT Kit (Applied Biosystems) and TaqMan® MicroRNA Assay
RT Primer according to manufacturer’s instructions on a 96 Universal Gradient
peqSTAR. Components for subsequent rt-PCR reaction were 3.3 ng cDNA, 1x
respective TaqMan® MicroRNA Assay PCR Primer and 1x TaqMan® Universal PCR
Master Mix. Total reaction volume was 15 µl. Reactions were run in triplicates on a
7900HT Fast Real-Time PCR System (Applied Biosystems) following the thermal profile
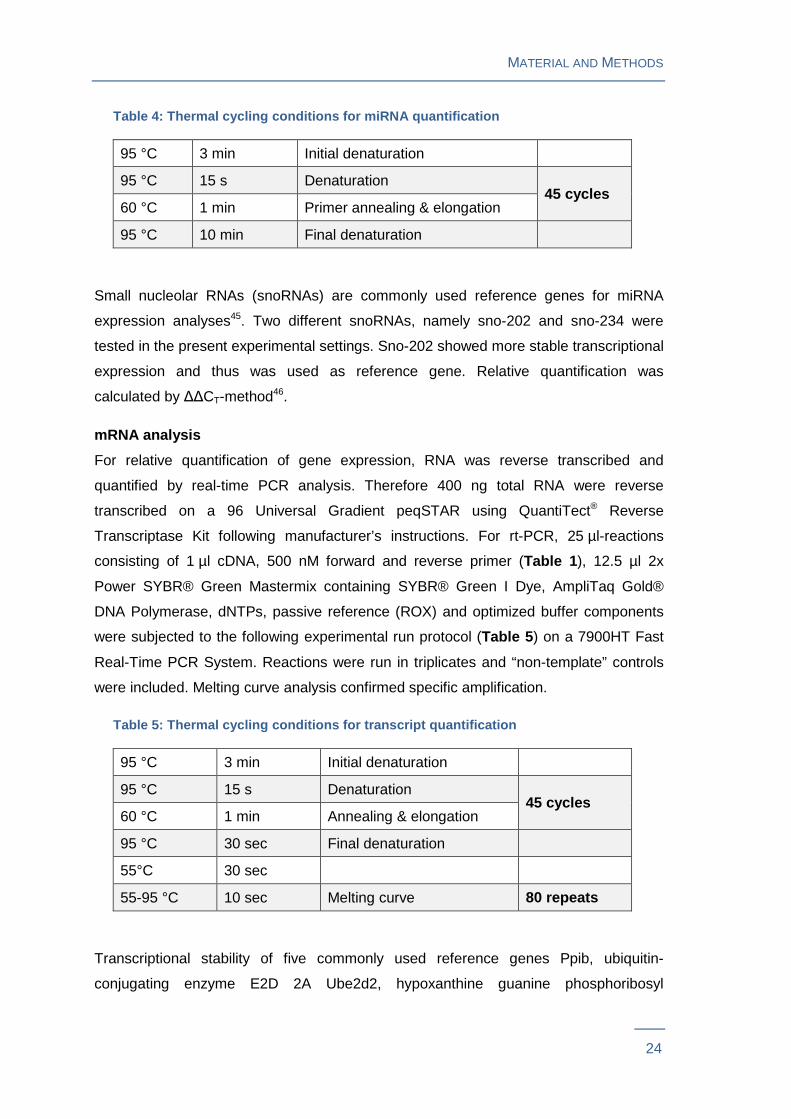
in Table 4 . “Non-template” controls were included.
MATERIAL AND METHODS
24
Table 4: Thermal cycling conditions for miRNA quant ification
95 °C 3 min Initial denaturation
95 °C 15 s Denaturation 45 cycles
60 °C 1 min Primer annealing & elongation
95 °C 10 min Final denaturation
Small nucleolar RNAs (snoRNAs) are commonly used reference genes for miRNA
expression analyses45. Two different snoRNAs, namely sno-202 and sno-234 were
tested in the present experimental settings. Sno-202 showed more stable transcriptional
expression and thus was used as reference gene. Relative quantification was
calculated by ∆∆CT-method46.
mRNA analysis
For relative quantification of gene expression, RNA was reverse transcribed and
quantified by real-time PCR analysis. Therefore 400 ng total RNA were reverse
transcribed on a 96 Universal Gradient peqSTAR using QuantiTect® Reverse
Transcriptase Kit following manufacturer’s instructions. For rt-PCR, 25 µl-reactions
consisting of 1 µl cDNA, 500 nM forward and reverse primer (Table 1), 12.5 µl 2x
Power SYBR® Green Mastermix containing SYBR® Green I Dye, AmpliTaq Gold®
DNA Polymerase, dNTPs, passive reference (ROX) and optimized buffer components
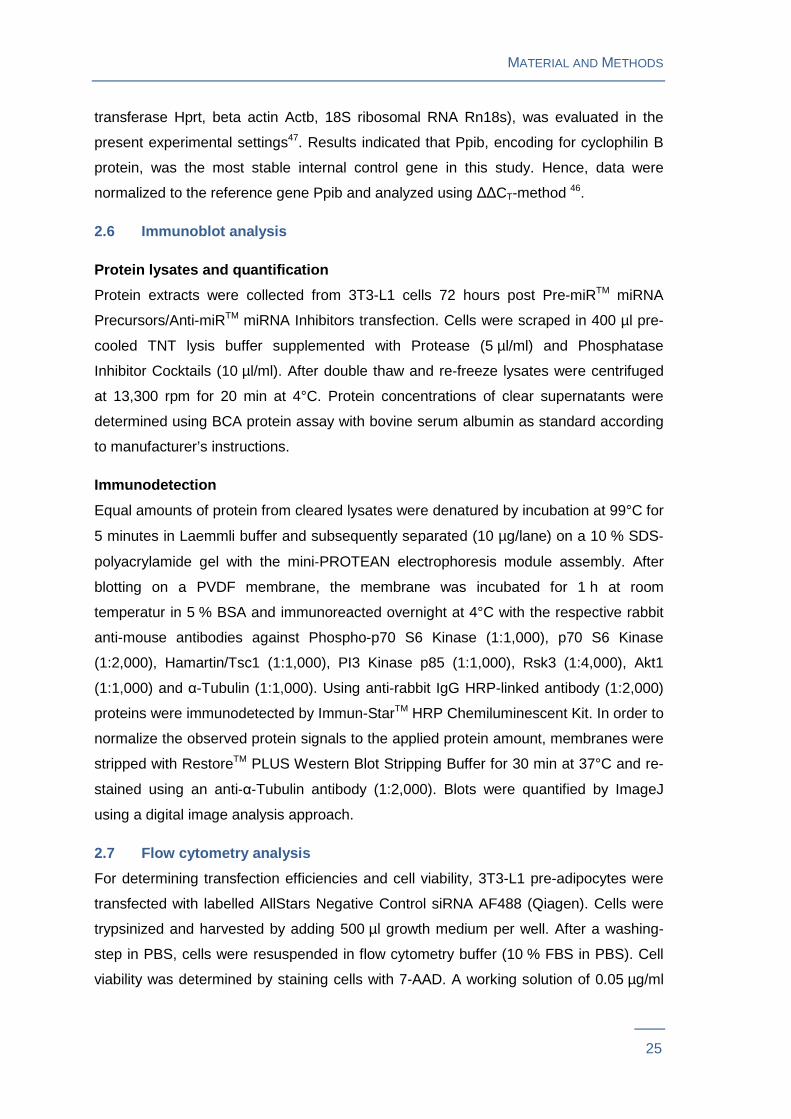
were subjected to the following experimental run protocol (Table 5 ) on a 7900HT Fast
Real-Time PCR System. Reactions were run in triplicates and “non-template” controls
were included. Melting curve analysis confirmed specific amplification.
Table 5: Thermal cycling conditions for transcript quantification
95 °C 3 min Initial denaturation
95 °C 15 s Denaturation 45 cycles
60 °C 1 min Annealing & elongation
95 °C 30 sec Final denaturation
55°C 30 sec
55-95 °C 10 sec Melting curve 80 repeats
Transcriptional stability of five commonly used reference genes Ppib, ubiquitin-
conjugating enzyme E2D 2A Ube2d2, hypoxanthine guanine phosphoribosyl
MATERIAL AND METHODS
25
transferase Hprt, beta actin Actb, 18S ribosomal RNA Rn18s), was evaluated in the
present experimental settings47. Results indicated that Ppib, encoding for cyclophilin B
protein, was the most stable internal control gene in this study. Hence, data were
normalized to the reference gene Ppib and analyzed using ∆∆CT-method 46.
2.6 Immunoblot analysis
Protein lysates and quantification
Protein extracts were collected from 3T3-L1 cells 72 hours post Pre-miRTM miRNA
Precursors/Anti-miRTM miRNA Inhibitors transfection. Cells were scraped in 400 µl pre-
cooled TNT lysis buffer supplemented with Protease (5 µl/ml) and Phosphatase
Inhibitor Cocktails (10 µl/ml). After double thaw and re-freeze lysates were centrifuged
at 13,300 rpm for 20 min at 4°C. Protein concentrations of clear supernatants were
determined using BCA protein assay with bovine serum albumin as standard according
to manufacturer’s instructions.
Immunodetection
Equal amounts of protein from cleared lysates were denatured by incubation at 99°C for
5 minutes in Laemmli buffer and subsequently separated (10 µg/lane) on a 10 % SDS‐
polyacrylamide gel with the mini‐PROTEAN electrophoresis module assembly. After
blotting on a PVDF membrane, the membrane was incubated for 1 h at room
temperatur in 5 % BSA and immunoreacted overnight at 4°C with the respective rabbit
anti-mouse antibodies against Phospho-p70 S6 Kinase (1:1,000), p70 S6 Kinase
(1:2,000), Hamartin/Tsc1 (1:1,000), PI3 Kinase p85 (1:1,000), Rsk3 (1:4,000), Akt1
(1:1,000) and α-Tubulin (1:1,000). Using anti-rabbit IgG HRP-linked antibody (1:2,000)
proteins were immunodetected by Immun-StarTM HRP Chemiluminescent Kit. In order to
normalize the observed protein signals to the applied protein amount, membranes were
stripped with RestoreTM PLUS Western Blot Stripping Buffer for 30 min at 37°C and re-
stained using an anti‐α‐Tubulin antibody (1:2,000). Blots were quantified by ImageJ
using a digital image analysis approach.
2.7 Flow cytometry analysis
For determining transfection efficiencies and cell viability, 3T3-L1 pre-adipocytes were
transfected with labelled AllStars Negative Control siRNA AF488 (Qiagen). Cells were
trypsinized and harvested by adding 500 µl growth medium per well. After a washing-
step in PBS, cells were resuspended in flow cytometry buffer (10 % FBS in PBS). Cell
viability was determined by staining cells with 7-AAD. A working solution of 0.05 µg/ml

MATERIAL AND METHODS
26
7-AAD in PBS was prepared and 5 µl were added to a cell suspension of 1 million cells
following incubation at room temperature for 7 min. A BD FACSCantoTM flow cytometer
was used to analyze both, cell viability and transfection efficiencies. 10,000 cells were
measured for each treatment group. Data were collected and analyzed by BD
FACSDivaTM software.
2.8 Statistical analysis
Statistically significant differences of quantitative PCR and reporter assays were
evaluated using Student’s t-test provided in GraphPad Prism 5.0 (GraphPad Software,
San Diego, CA, USA). P values of 0.05 or less were considered significant. * indicates
P ≤ 0.05, ** P ≤ 0.01 and *** P ≤ 0.001.
RESULTS
27
C Results
1. 3T3-L1 adipocyte model characterization
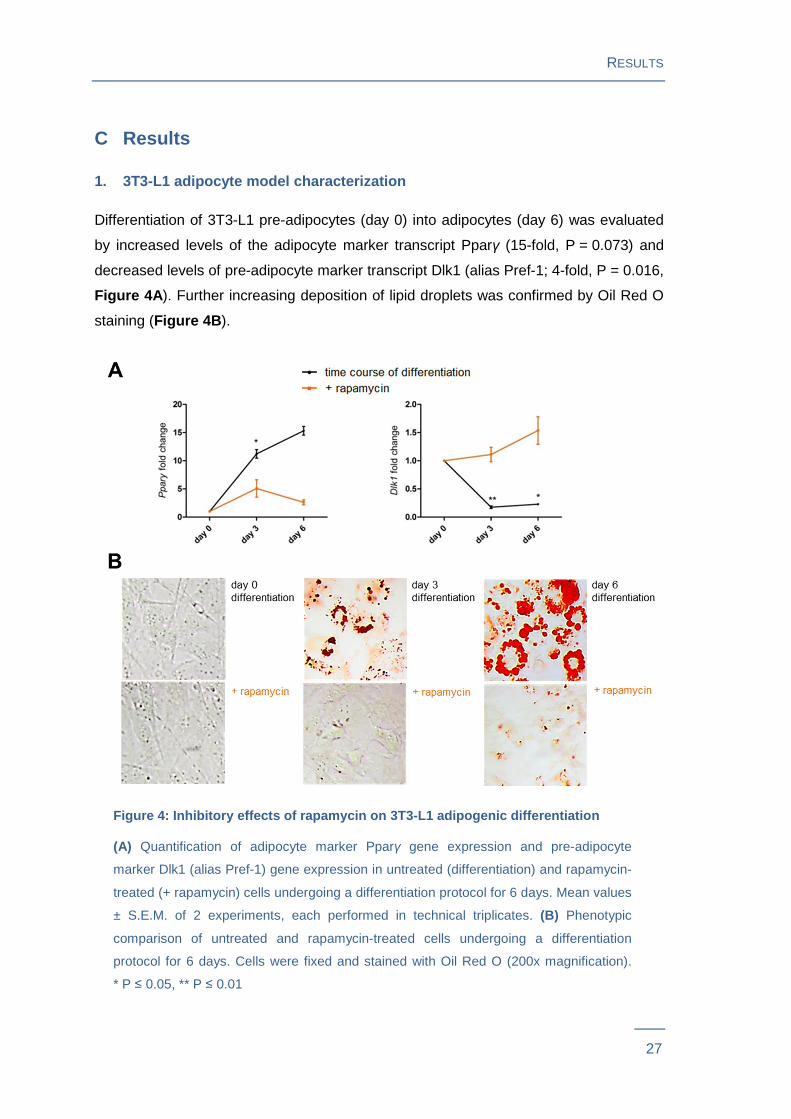
Differentiation of 3T3-L1 pre-adipocytes (day 0) into adipocytes (day 6) was evaluated
by increased levels of the adipocyte marker transcript Pparγ (15-fold, P = 0.073) and
decreased levels of pre-adipocyte marker transcript Dlk1 (alias Pref-1; 4-fold, P = 0.016,
Figure 4A ). Further increasing deposition of lipid droplets was confirmed by Oil Red O
staining (Figure 4B ).
Figure 4: Inhibitory effects of rapamycin on 3T3-L1 adipogenic differentiation
(A) Quantification of adipocyte marker Pparγ gene expression and pre-adipocyte
marker Dlk1 (alias Pref-1) gene expression in untreated (differentiation) and rapamycin-
treated (+ rapamycin) cells undergoing a differentiation protocol for 6 days. Mean values
± S.E.M. of 2 experiments, each performed in technical triplicates. (B) Phenotypic
comparison of untreated and rapamycin-treated cells undergoing a differentiation
protocol for 6 days. Cells were fixed and stained with Oil Red O (200x magnification).
* P ≤ 0.05, ** P ≤ 0.01
RESULTS
28
The expression of marker genes in rapamycin-treated adipocytes resembled pre-
adipocytes at early stage of differentiation. Additionally, a markedly decreased
cytoplasmic lipid droplet accumulation compared to mature adipocytes was observed
(P = 0.012, Figure 4 ).
2. In silico target prediction
A study of our group experimentally identified a set of 22 candidate miRNAs associated
with both, adipocyte differentiation and mTOR nutrient signaling39. Discovering the
targets of these miRNAs is essential to unravel their regulatory function. A stringent in
silico target prediction approach using five different algorithms revealed that 16
miRNAs, which previously showed rapamycin dependent expression changes in
differentiation experiments, were also predicted to target mTOR pathway genes (Table
S 1). Relationship upstream and downstream of the predicted mTOR targets to mTOR
complex 1 is shown in Figure 5 .
Further molecular pathways being altered by the set of rapamycin-sensitive miRNAs
were identified using the computational pathway-prediction tool DIANA-miRPath.
Pathway enrichment analysis revealed that the in silico predicted targets were
significantly enriched in the mTOR pathway (PPicTar 4-way = 1.95E-03, PTargetScan5 = 5.41E-
03) and other mTOR-related pathways such as insulin signaling (PPicTar 4-way = 7.23E-07,
PTargetScan5 = 1.90E-03) or MAPK signaling pathway (PPicTar 4-way = 3.01E-09, PTargetScan5 =
1.53E-09).
A subset of five miRNA-target pairs, namely miR-183 - Tsc1, miR-378 - Tsc1, miR-103 -
Pik3r1, miR-107 - Pik3r1 and miR-182 - Pik3r3 were subsequently selected for
confirmation of direct miRNA-target interaction. Selection criteria were significant
rapamycin effects on 3T3-L1 adipogenic differentiation, prediction of targets that are
central genes of the mTOR pathway and/or members of miRNA clusters and families.
Rapamycin-sensitive expression of these miRNAs was first reproduced and indeed
confirmed in the current experimental setting (Figure S 2 ).
RESULTS
29
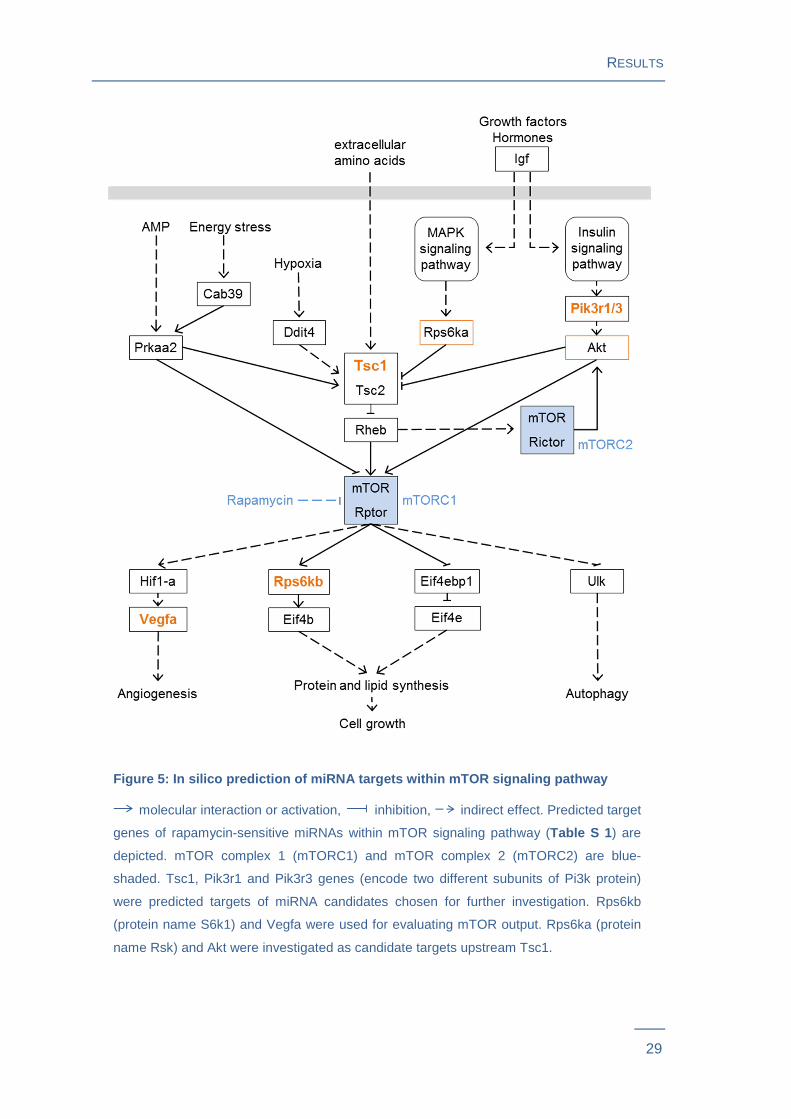
Figure 5: In silico prediction of miRNA targets within mTOR signaling pathway
molecular interaction or activation, inhibition, indirect effect. Predicted target
genes of rapamycin-sensitive miRNAs within mTOR signaling pathway (Table S 1 ) are
depicted. mTOR complex 1 (mTORC1) and mTOR complex 2 (mTORC2) are blue-
shaded. Tsc1, Pik3r1 and Pik3r3 genes (encode two different subunits of Pi3k protein)
were predicted targets of miRNA candidates chosen for further investigation. Rps6kb
(protein name S6k1) and Vegfa were used for evaluating mTOR output. Rps6ka (protein
name Rsk) and Akt were investigated as candidate targets upstream Tsc1.
RESULTS
30
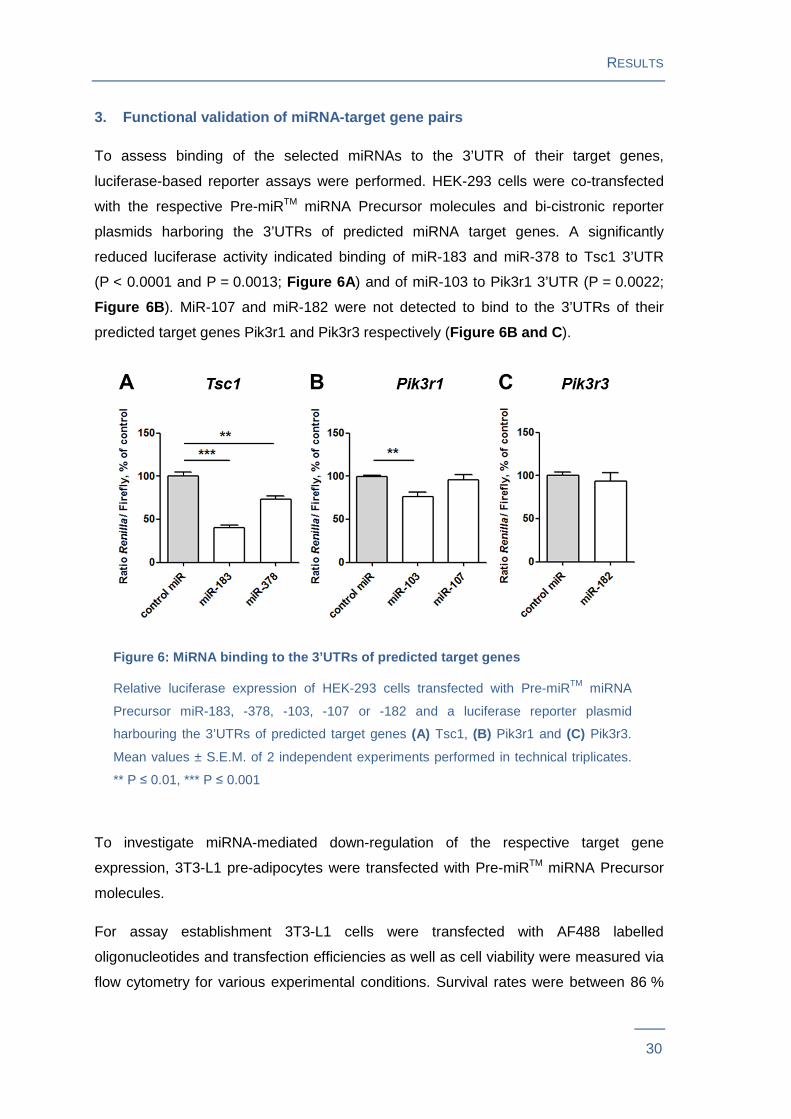
3. Functional validation of miRNA-target gene pairs
To assess binding of the selected miRNAs to the 3’UTR of their target genes,
luciferase-based reporter assays were performed. HEK-293 cells were co-transfected
with the respective Pre-miRTM miRNA Precursor molecules and bi-cistronic reporter
plasmids harboring the 3’UTRs of predicted miRNA target genes. A significantly
reduced luciferase activity indicated binding of miR-183 and miR-378 to Tsc1 3’UTR
(P < 0.0001 and P = 0.0013; Figure 6A ) and of miR-103 to Pik3r1 3’UTR (P = 0.0022;
Figure 6B ). MiR-107 and miR-182 were not detected to bind to the 3’UTRs of their
predicted target genes Pik3r1 and Pik3r3 respectively (Figure 6B and C ).
Figure 6: MiRNA binding to the 3’UTRs of predicted target gen es
Relative luciferase expression of HEK-293 cells transfected with Pre-miRTM miRNA
Precursor miR-183, -378, -103, -107 or -182 and a luciferase reporter plasmid
harbouring the 3’UTRs of predicted target genes (A) Tsc1, (B) Pik3r1 and (C) Pik3r3.
Mean values ± S.E.M. of 2 independent experiments performed in technical triplicates.
** P ≤ 0.01, *** P ≤ 0.001
To investigate miRNA-mediated down-regulation of the respective target gene
expression, 3T3-L1 pre-adipocytes were transfected with Pre-miRTM miRNA Precursor
molecules.
For assay establishment 3T3-L1 cells were transfected with AF488 labelled
oligonucleotides and transfection efficiencies as well as cell viability were measured via
flow cytometry for various experimental conditions. Survival rates were between 86 %
RESULTS
31
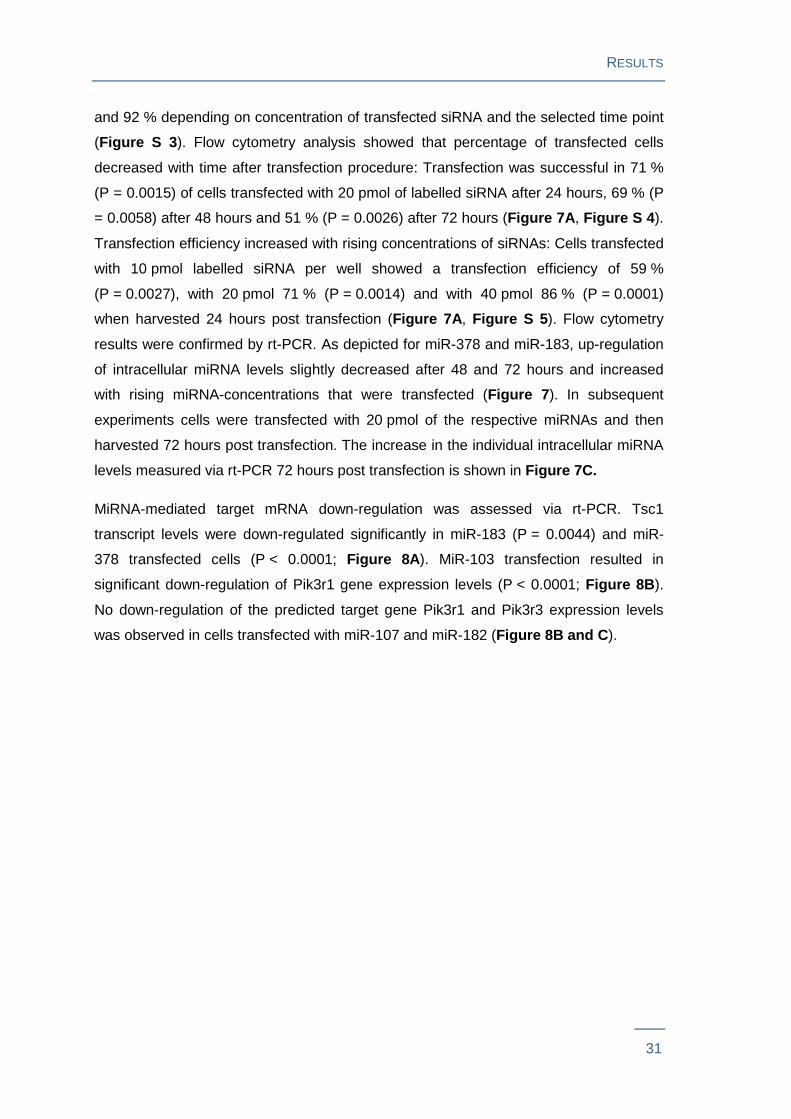
and 92 % depending on concentration of transfected siRNA and the selected time point
(Figure S 3 ). Flow cytometry analysis showed that percentage of transfected cells
decreased with time after transfection procedure: Transfection was successful in 71 %
(P = 0.0015) of cells transfected with 20 pmol of labelled siRNA after 24 hours, 69 % (P
= 0.0058) after 48 hours and 51 % (P = 0.0026) after 72 hours (Figure 7A , Figure S 4 ).
Transfection efficiency increased with rising concentrations of siRNAs: Cells transfected
with 10 pmol labelled siRNA per well showed a transfection efficiency of 59 %
(P = 0.0027), with 20 pmol 71 % (P = 0.0014) and with 40 pmol 86 % (P = 0.0001)
when harvested 24 hours post transfection (Figure 7A , Figure S 5 ). Flow cytometry
results were confirmed by rt-PCR. As depicted for miR-378 and miR-183, up-regulation
of intracellular miRNA levels slightly decreased after 48 and 72 hours and increased
with rising miRNA-concentrations that were transfected (Figure 7 ). In subsequent
experiments cells were transfected with 20 pmol of the respective miRNAs and then
harvested 72 hours post transfection. The increase in the individual intracellular miRNA
levels measured via rt-PCR 72 hours post transfection is shown in Figure 7C.
MiRNA-mediated target mRNA down-regulation was assessed via rt-PCR. Tsc1
transcript levels were down-regulated significantly in miR-183 (P = 0.0044) and miR-
378 transfected cells (P < 0.0001; Figure 8A ). MiR-103 transfection resulted in
significant down-regulation of Pik3r1 gene expression levels (P < 0.0001; Figure 8B ).
No down-regulation of the predicted target gene Pik3r1 and Pik3r3 expression levels
was observed in cells transfected with miR-107 and miR-182 (Figure 8B and C).
RESULTS
32
Figure 7: Time course and concentration-dependency of intracellular miRNA
increase after transfection
(A) Percentage of transfected 3T3-L1 pre-adipocytes measured by flow cytometry at
different time points post transfection and in cells transfected with different
concentrations of labelled siRNA. (B) Time course and concentration dependency of
miRNA increase after transfection with a candidate Pre-miRTM miRNA quantified by rt-
PCR. (C) Intracellular miRNA levels after transfection with 20 pmol of the respective
Pre-miRTM miRNA measured via rt-PCR 72 hours post transfection. Mean values ±
S.E.M. of 2 independent experiments being performed in 6 well replicates. ** P ≤ 0.01,
*** P ≤ 0.001
RESULTS
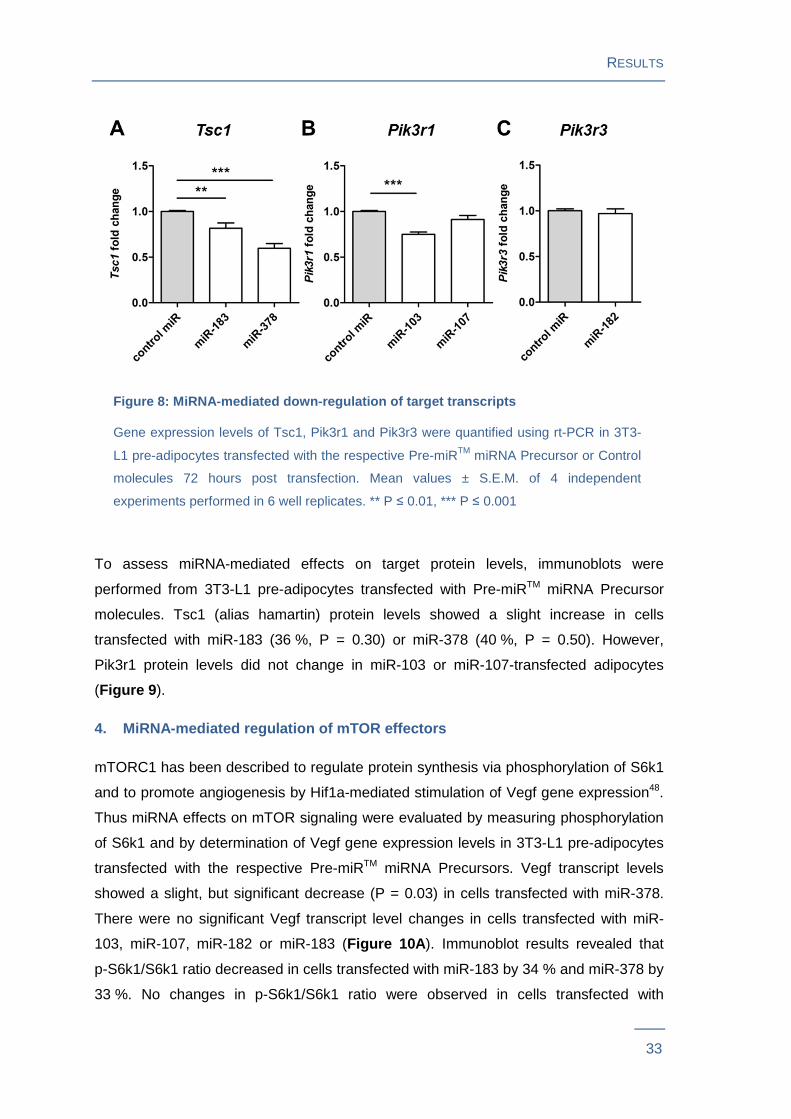
33
Figure 8: MiRNA-mediated down-regulation of target transcript s
Gene expression levels of Tsc1, Pik3r1 and Pik3r3 were quantified using rt-PCR in 3T3-
L1 pre-adipocytes transfected with the respective Pre-miRTM miRNA Precursor or Control
molecules 72 hours post transfection. Mean values ± S.E.M. of 4 independent
experiments performed in 6 well replicates. ** P ≤ 0.01, *** P ≤ 0.001
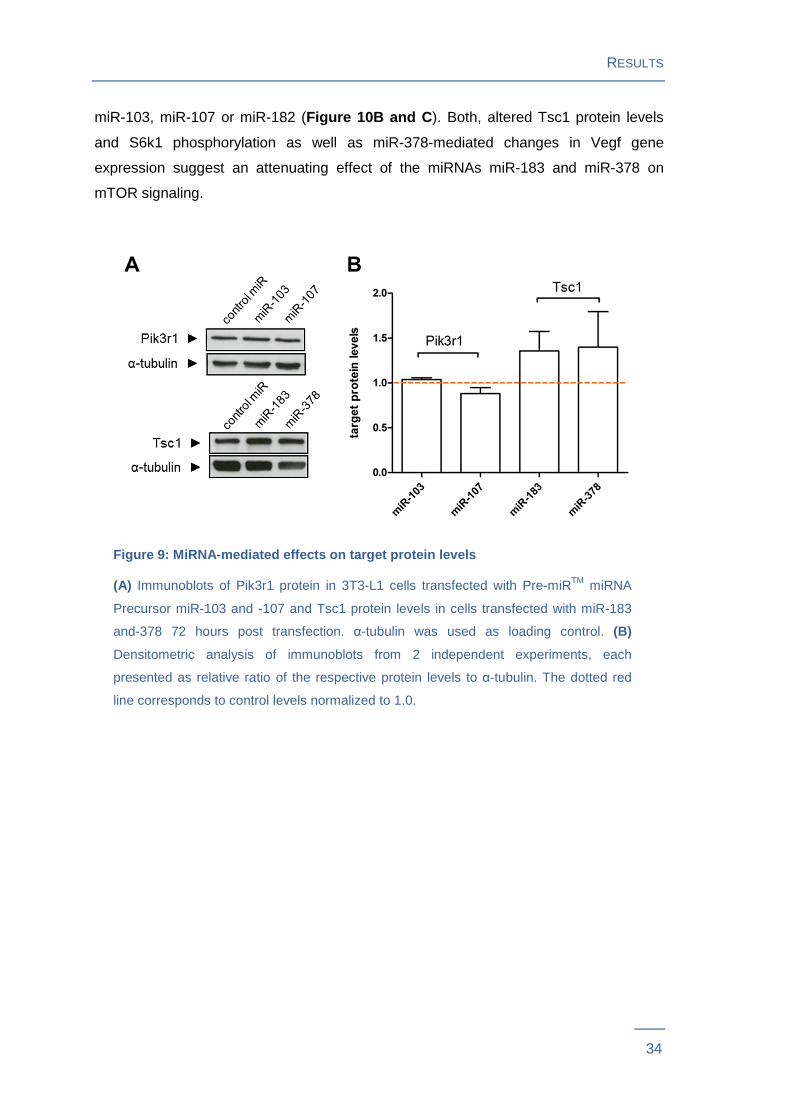
To assess miRNA-mediated effects on target protein levels, immunoblots were
performed from 3T3-L1 pre-adipocytes transfected with Pre-miRTM miRNA Precursor
molecules. Tsc1 (alias hamartin) protein levels showed a slight increase in cells
transfected with miR-183 (36 %, P = 0.30) or miR-378 (40 %, P = 0.50). However,
Pik3r1 protein levels did not change in miR-103 or miR-107-transfected adipocytes
(Figure 9 ).
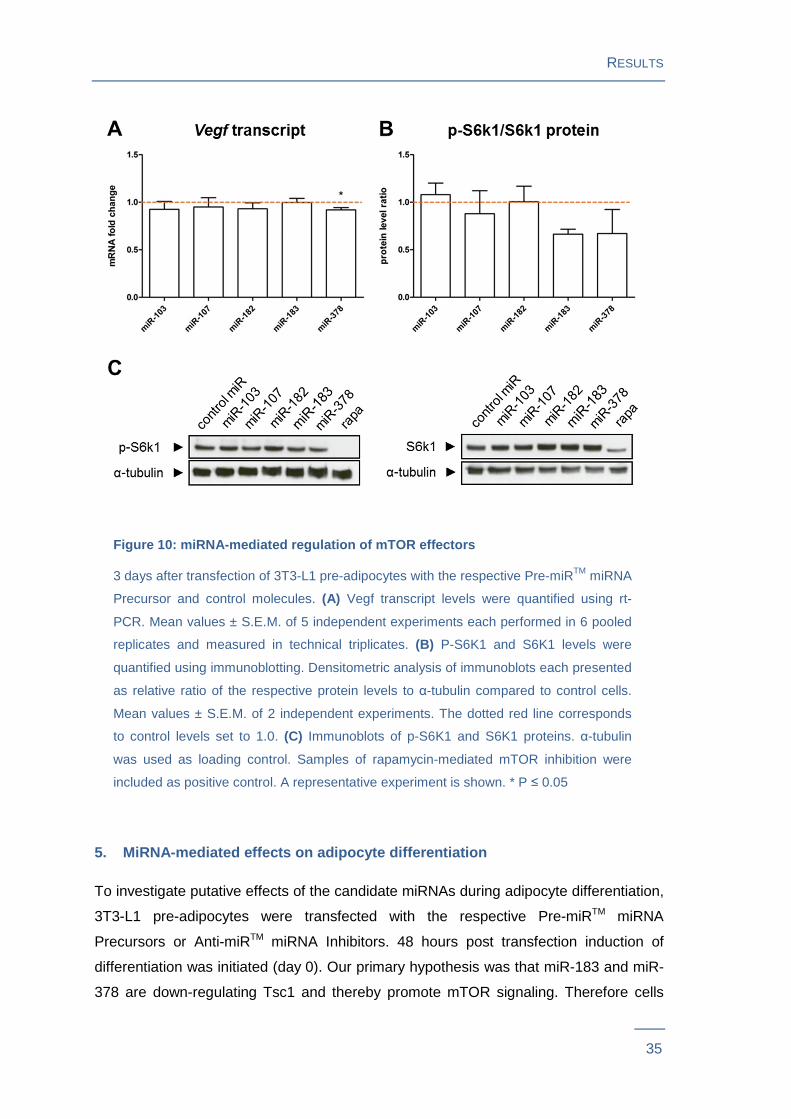
4. MiRNA-mediated regulation of mTOR effectors
mTORC1 has been described to regulate protein synthesis via phosphorylation of S6k1
and to promote angiogenesis by Hif1a-mediated stimulation of Vegf gene expression48.
Thus miRNA effects on mTOR signaling were evaluated by measuring phosphorylation
of S6k1 and by determination of Vegf gene expression levels in 3T3-L1 pre-adipocytes
transfected with the respective Pre-miRTM miRNA Precursors. Vegf transcript levels
showed a slight, but significant decrease (P = 0.03) in cells transfected with miR-378.
There were no significant Vegf transcript level changes in cells transfected with miR-
103, miR-107, miR-182 or miR-183 (Figure 10A ). Immunoblot results revealed that
p-S6k1/S6k1 ratio decreased in cells transfected with miR-183 by 34 % and miR-378 by
33 %. No changes in p-S6k1/S6k1 ratio were observed in cells transfected with
RESULTS
34
miR-103, miR-107 or miR-182 (Figure 10B and C ). Both, altered Tsc1 protein levels
and S6k1 phosphorylation as well as miR-378-mediated changes in Vegf gene
expression suggest an attenuating effect of the miRNAs miR-183 and miR-378 on
mTOR signaling.
Figure 9: MiRNA-mediated effects on target protein levels
(A) Immunoblots of Pik3r1 protein in 3T3-L1 cells transfected with Pre-miRTM miRNA
Precursor miR-103 and -107 and Tsc1 protein levels in cells transfected with miR-183
and-378 72 hours post transfection. α-tubulin was used as loading control. (B)
Densitometric analysis of immunoblots from 2 independent experiments, each
presented as relative ratio of the respective protein levels to α-tubulin. The dotted red
line corresponds to control levels normalized to 1.0.
RESULTS
35
Figure 10: miRNA-mediated regulation of mTOR effectors
3 days after transfection of 3T3-L1 pre-adipocytes with the respective Pre-miRTM miRNA
Precursor and control molecules. (A) Vegf transcript levels were quantified using rt-
PCR. Mean values ± S.E.M. of 5 independent experiments each performed in 6 pooled
replicates and measured in technical triplicates. (B) P-S6K1 and S6K1 levels were
quantified using immunoblotting. Densitometric analysis of immunoblots each presented
as relative ratio of the respective protein levels to α-tubulin compared to control cells.
Mean values ± S.E.M. of 2 independent experiments. The dotted red line corresponds
to control levels set to 1.0. (C) Immunoblots of p-S6K1 and S6K1 proteins. α-tubulin
was used as loading control. Samples of rapamycin-mediated mTOR inhibition were
included as positive control. A representative experiment is shown. * P ≤ 0.05
5. MiRNA-mediated effects on adipocyte differentiat ion
To investigate putative effects of the candidate miRNAs during adipocyte differentiation,
3T3-L1 pre-adipocytes were transfected with the respective Pre-miRTM miRNA
Precursors or Anti-miRTM miRNA Inhibitors. 48 hours post transfection induction of
differentiation was initiated (day 0). Our primary hypothesis was that miR-183 and miR-
378 are down-regulating Tsc1 and thereby promote mTOR signaling. Therefore cells
RESULTS
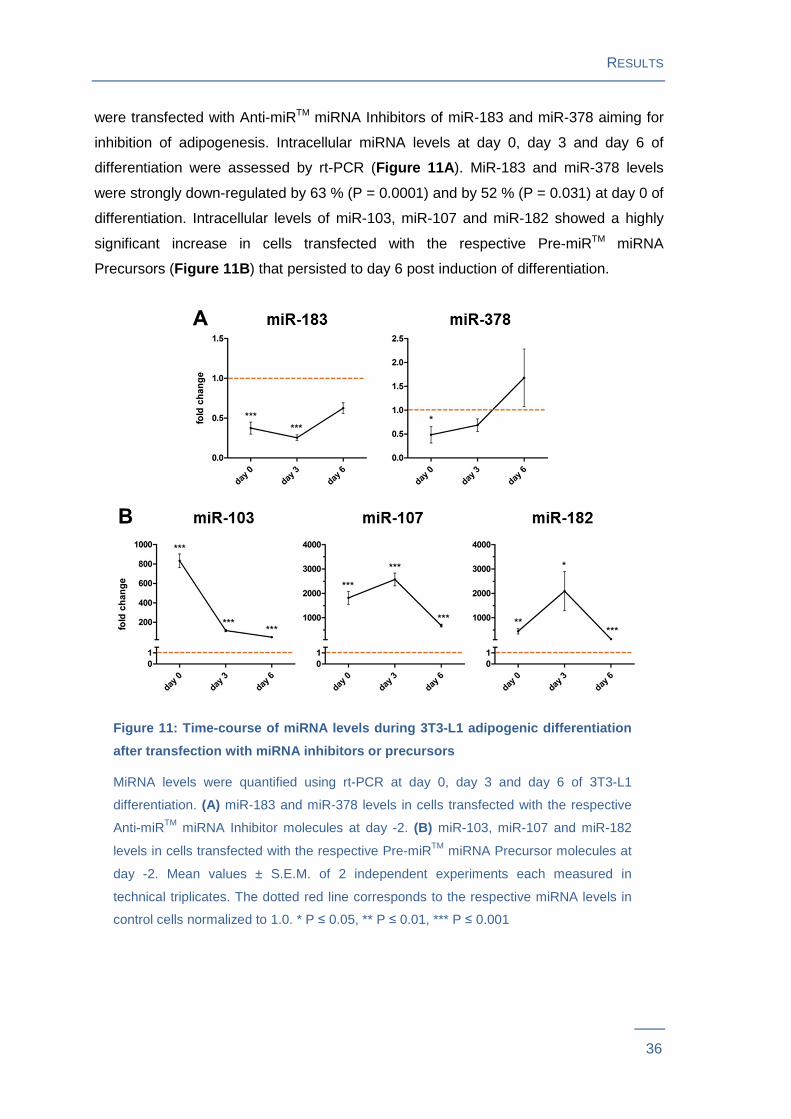
36
were transfected with Anti-miRTM miRNA Inhibitors of miR-183 and miR-378 aiming for
inhibition of adipogenesis. Intracellular miRNA levels at day 0, day 3 and day 6 of
differentiation were assessed by rt-PCR (Figure 11A ). MiR-183 and miR-378 levels
were strongly down-regulated by 63 % (P = 0.0001) and by 52 % (P = 0.031) at day 0 of
differentiation. Intracellular levels of miR-103, miR-107 and miR-182 showed a highly
significant increase in cells transfected with the respective Pre-miRTM miRNA
Precursors (Figure 11B ) that persisted to day 6 post induction of differentiation.
Figure 11: Time-course of miRNA levels during 3T3-L1 adipogeni c differentiation
after transfection with miRNA inhibitors or precurs ors
MiRNA levels were quantified using rt-PCR at day 0, day 3 and day 6 of 3T3-L1
differentiation. (A) miR-183 and miR-378 levels in cells transfected with the respective
Anti-miRTM miRNA Inhibitor molecules at day -2. (B) miR-103, miR-107 and miR-182
levels in cells transfected with the respective Pre-miRTM miRNA Precursor molecules at
day -2. Mean values ± S.E.M. of 2 independent experiments each measured in
technical triplicates. The dotted red line corresponds to the respective miRNA levels in
control cells normalized to 1.0. * P ≤ 0.05, ** P ≤ 0.01, *** P ≤ 0.001
RESULTS
37
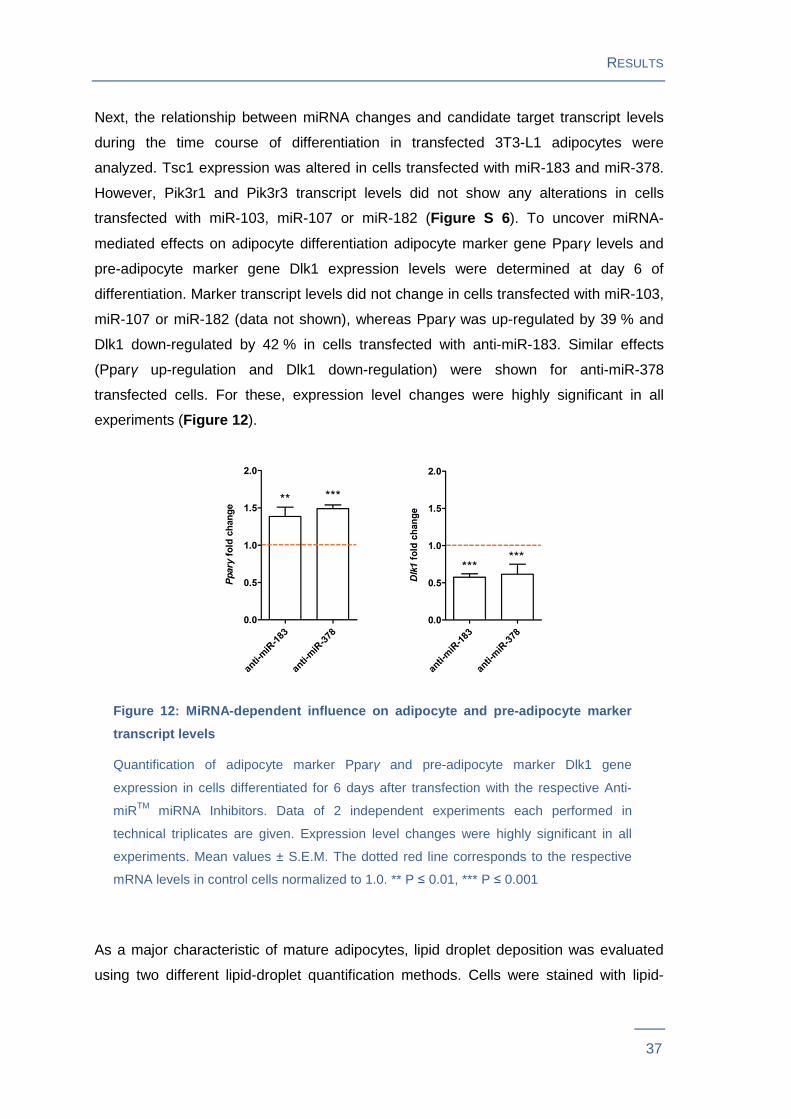
Next, the relationship between miRNA changes and candidate target transcript levels
during the time course of differentiation in transfected 3T3-L1 adipocytes were
analyzed. Tsc1 expression was altered in cells transfected with miR-183 and miR-378.
However, Pik3r1 and Pik3r3 transcript levels did not show any alterations in cells
transfected with miR-103, miR-107 or miR-182 (Figure S 6 ). To uncover miRNA-
mediated effects on adipocyte differentiation adipocyte marker gene Pparγ levels and
pre-adipocyte marker gene Dlk1 expression levels were determined at day 6 of
differentiation. Marker transcript levels did not change in cells transfected with miR-103,
miR-107 or miR-182 (data not shown), whereas Pparγ was up-regulated by 39 % and
Dlk1 down-regulated by 42 % in cells transfected with anti-miR-183. Similar effects
(Pparγ up-regulation and Dlk1 down-regulation) were shown for anti-miR-378
transfected cells. For these, expression level changes were highly significant in all
experiments (Figure 12 ).
Figure 12: MiRNA-dependent influence on adipocyte and pre-adip ocyte marker
transcript levels
Quantification of adipocyte marker Pparγ and pre-adipocyte marker Dlk1 gene
expression in cells differentiated for 6 days after transfection with the respective Anti-
miRTM miRNA Inhibitors. Data of 2 independent experiments each performed in
technical triplicates are given. Expression level changes were highly significant in all
experiments. Mean values ± S.E.M. The dotted red line corresponds to the respective
mRNA levels in control cells normalized to 1.0. ** P ≤ 0.01, *** P ≤ 0.001
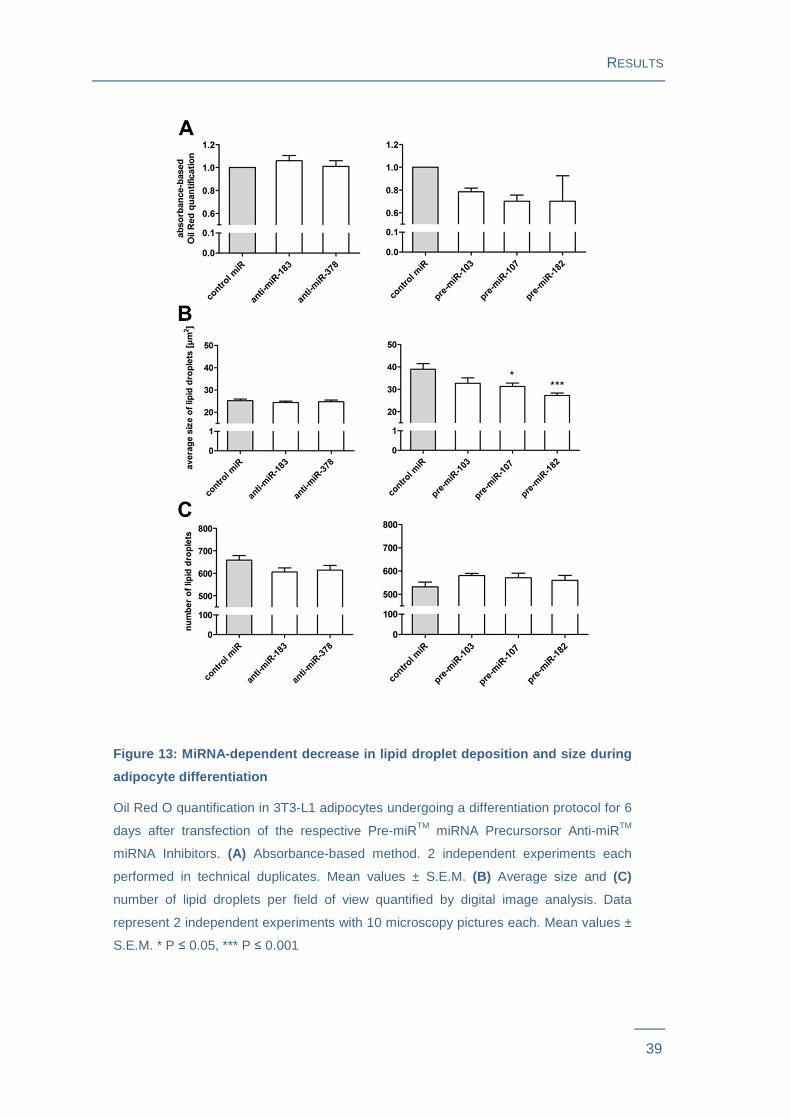
As a major characteristic of mature adipocytes, lipid droplet deposition was evaluated
using two different lipid-droplet quantification methods. Cells were stained with lipid-

RESULTS
38
specific Oil Red O. An absorbance based quantification method determined the Oil Red
O content in the supernatant of de-stained cells. This approach revealed that the
miRNAs miR-103, miR-107 and miR-182 decreased lipid droplet deposition, while
miR-183 and miR-378 had no influence (Figure 13A ). Digital image analysis-based
method additionally evaluated number and size of Oil Red O stained droplets by
microscopy. This method revealed that the Oil Red O decrease in cells transfected with
miR-107 or miR-182 was due to a reduced average lipid droplet size whereas the
number of droplets did not change significantly. Reducing effects of miR-103 were not
confirmed with this approach, since neither size nor number of lipid droplets reached
statistical significance. The digital image-based approach further confirmed that anti-
miR-183 and anti-miR-378 transfection did not influence lipid droplet size or numbers
(Figure 13B and C ).
RESULTS
39
Figure 13: MiRNA-dependent decrease in lipid droplet depositio n and size during
adipocyte differentiation
Oil Red O quantification in 3T3-L1 adipocytes undergoing a differentiation protocol for 6
days after transfection of the respective Pre-miRTM miRNA Precursorsor Anti-miRTM
miRNA Inhibitors. (A) Absorbance-based method. 2 independent experiments each
performed in technical duplicates. Mean values ± S.E.M. (B) Average size and (C)
number of lipid droplets per field of view quantified by digital image analysis. Data
represent 2 independent experiments with 10 microscopy pictures each. Mean values ±
S.E.M. * P ≤ 0.05, *** P ≤ 0.001
RESULTS
40
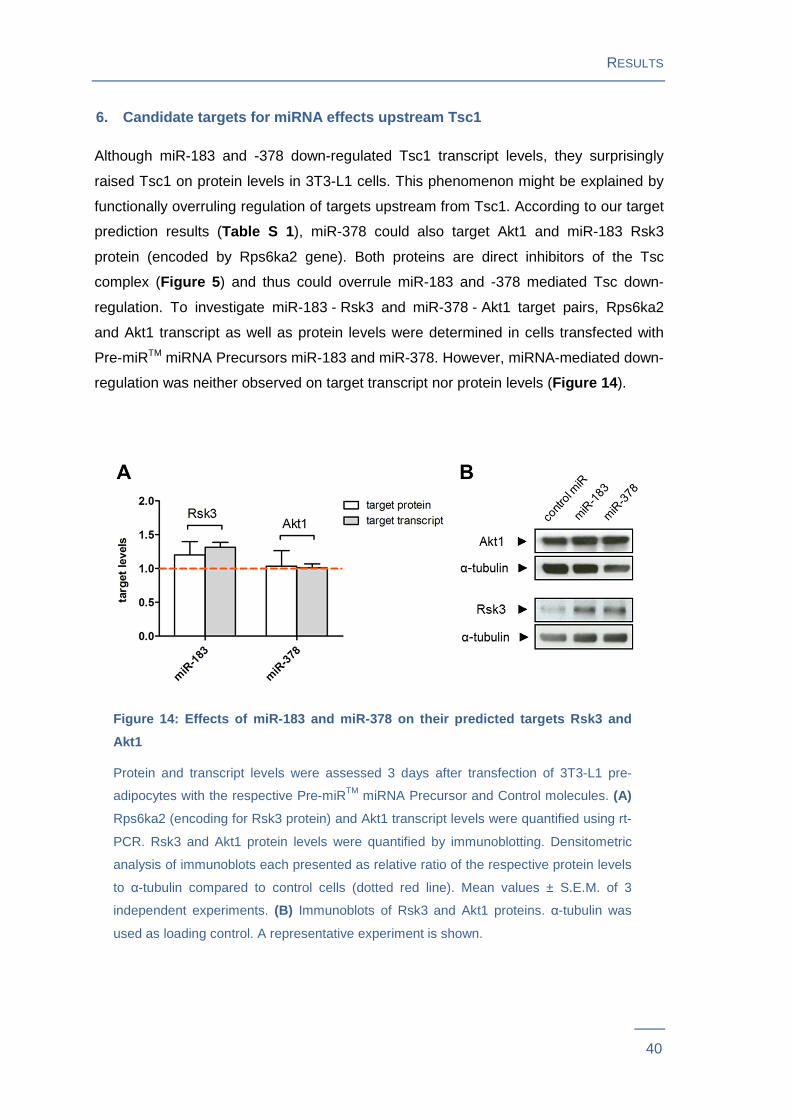
6. Candidate targets for miRNA effects upstream Tsc 1
Although miR-183 and -378 down-regulated Tsc1 transcript levels, they surprisingly
raised Tsc1 on protein levels in 3T3-L1 cells. This phenomenon might be explained by
functionally overruling regulation of targets upstream from Tsc1. According to our target
prediction results (Table S 1 ), miR-378 could also target Akt1 and miR-183 Rsk3
protein (encoded by Rps6ka2 gene). Both proteins are direct inhibitors of the Tsc
complex (Figure 5 ) and thus could overrule miR-183 and -378 mediated Tsc down-
regulation. To investigate miR-183 - Rsk3 and miR-378 - Akt1 target pairs, Rps6ka2
and Akt1 transcript as well as protein levels were determined in cells transfected with
Pre-miRTM miRNA Precursors miR-183 and miR-378. However, miRNA-mediated down-
regulation was neither observed on target transcript nor protein levels (Figure 14 ).
Figure 14: Effects of miR-183 and miR-378 on their predicted t argets Rsk3 and
Akt1
Protein and transcript levels were assessed 3 days after transfection of 3T3-L1 pre-
adipocytes with the respective Pre-miRTM miRNA Precursor and Control molecules. (A)
Rps6ka2 (encoding for Rsk3 protein) and Akt1 transcript levels were quantified using rt-
PCR. Rsk3 and Akt1 protein levels were quantified by immunoblotting. Densitometric
analysis of immunoblots each presented as relative ratio of the respective protein levels
to α-tubulin compared to control cells (dotted red line). Mean values ± S.E.M. of 3
independent experiments. (B) Immunoblots of Rsk3 and Akt1 proteins. α-tubulin was
used as loading control. A representative experiment is shown.
RESULTS
41
7. Evaluation of miRNA families and clusters on adi pocyte differentiation
Particular attention was paid to the miRNA candidates miR-103 and -107 as well as
miR-183 and -182, since these miRNAs hold special genetic backgrounds. The
candidate miRNAs miR-103 and -107 form a miRNA family as their genes are
paralogues deriving from gene duplication33.
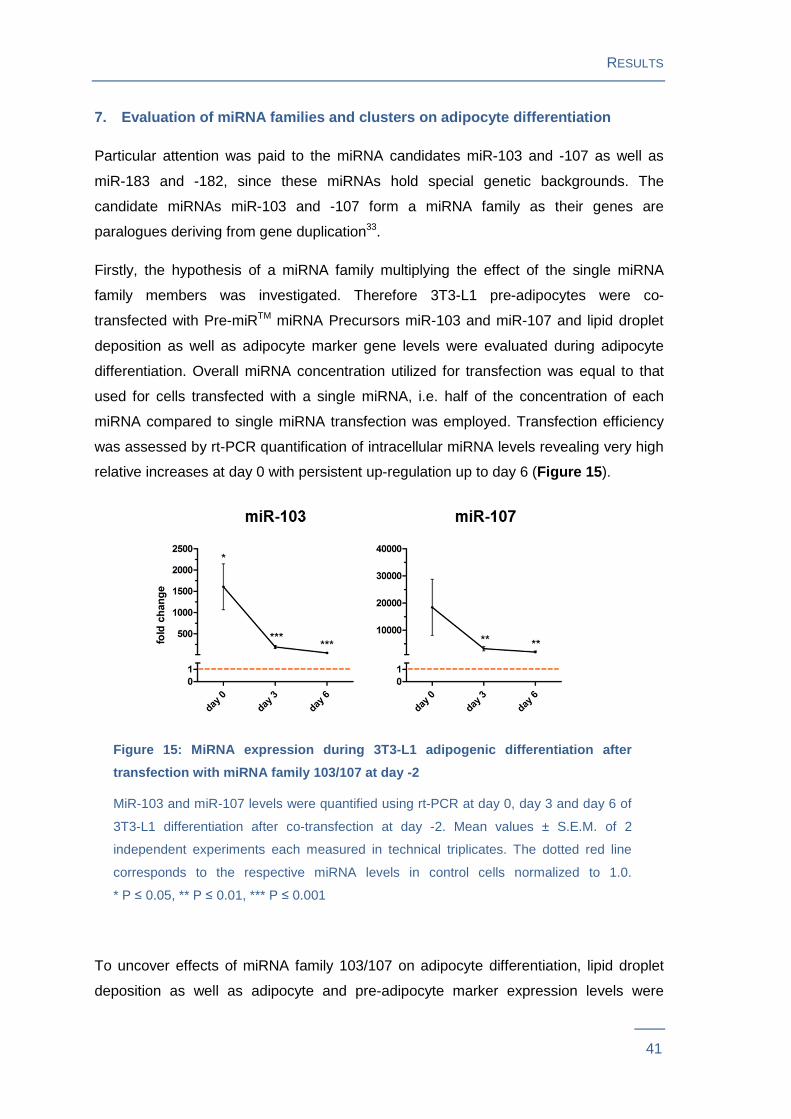
Firstly, the hypothesis of a miRNA family multiplying the effect of the single miRNA
family members was investigated. Therefore 3T3-L1 pre-adipocytes were co-
transfected with Pre-miRTM miRNA Precursors miR-103 and miR-107 and lipid droplet
deposition as well as adipocyte marker gene levels were evaluated during adipocyte
differentiation. Overall miRNA concentration utilized for transfection was equal to that
used for cells transfected with a single miRNA, i.e. half of the concentration of each
miRNA compared to single miRNA transfection was employed. Transfection efficiency
was assessed by rt-PCR quantification of intracellular miRNA levels revealing very high
relative increases at day 0 with persistent up-regulation up to day 6 (Figure 15 ).
Figure 15: MiRNA expression during 3T3-L1 adipogenic different iation after
transfection with miRNA family 103/107 at day -2
MiR-103 and miR-107 levels were quantified using rt-PCR at day 0, day 3 and day 6 of
3T3-L1 differentiation after co-transfection at day -2. Mean values ± S.E.M. of 2
independent experiments each measured in technical triplicates. The dotted red line
corresponds to the respective miRNA levels in control cells normalized to 1.0.
* P ≤ 0.05, ** P ≤ 0.01, *** P ≤ 0.001
To uncover effects of miRNA family 103/107 on adipocyte differentiation, lipid droplet
deposition as well as adipocyte and pre-adipocyte marker expression levels were
RESULTS
42
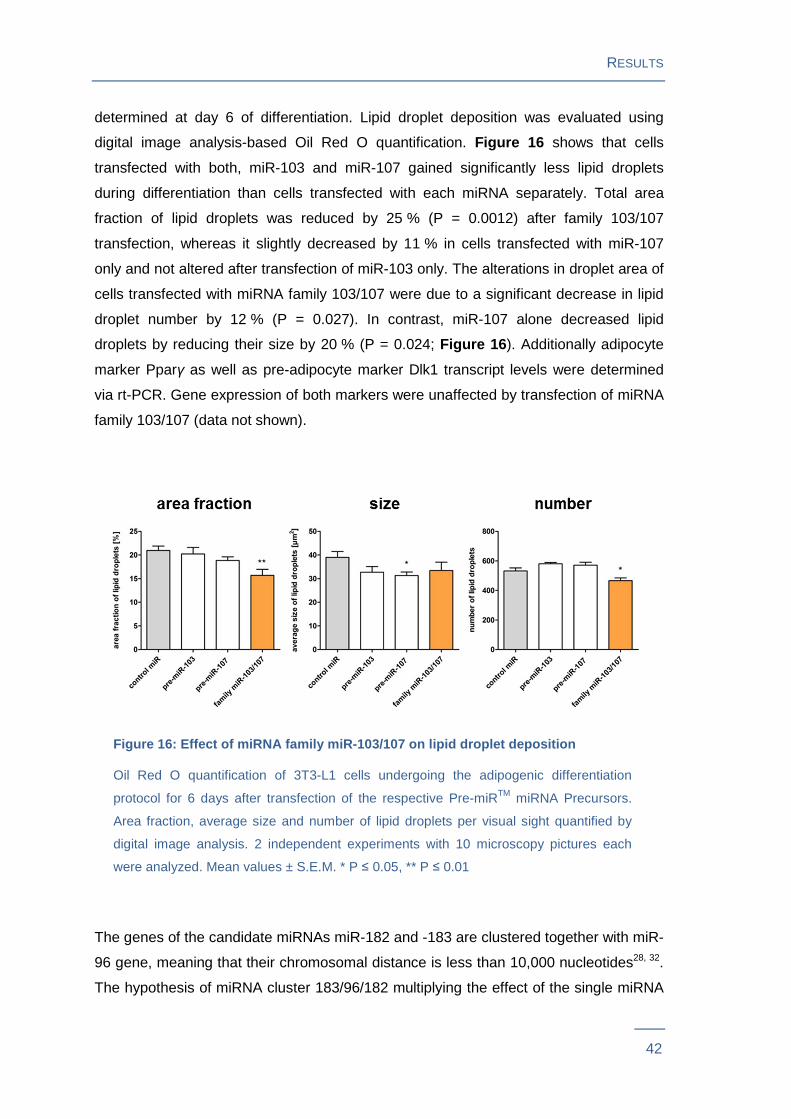
determined at day 6 of differentiation. Lipid droplet deposition was evaluated using
digital image analysis-based Oil Red O quantification. Figure 16 shows that cells
transfected with both, miR-103 and miR-107 gained significantly less lipid droplets
during differentiation than cells transfected with each miRNA separately. Total area
fraction of lipid droplets was reduced by 25 % (P = 0.0012) after family 103/107
transfection, whereas it slightly decreased by 11 % in cells transfected with miR-107
only and not altered after transfection of miR-103 only. The alterations in droplet area of
cells transfected with miRNA family 103/107 were due to a significant decrease in lipid
droplet number by 12 % (P = 0.027). In contrast, miR-107 alone decreased lipid
droplets by reducing their size by 20 % (P = 0.024; Figure 16 ). Additionally adipocyte
marker Pparγ as well as pre-adipocyte marker Dlk1 transcript levels were determined
via rt-PCR. Gene expression of both markers were unaffected by transfection of miRNA
family 103/107 (data not shown).
Figure 16: Effect of miRNA family miR-103/107 on lipid droplet deposition
Oil Red O quantification of 3T3-L1 cells undergoing the adipogenic differentiation
protocol for 6 days after transfection of the respective Pre-miRTM miRNA Precursors.
Area fraction, average size and number of lipid droplets per visual sight quantified by
digital image analysis. 2 independent experiments with 10 microscopy pictures each
were analyzed. Mean values ± S.E.M. * P ≤ 0.05, ** P ≤ 0.01
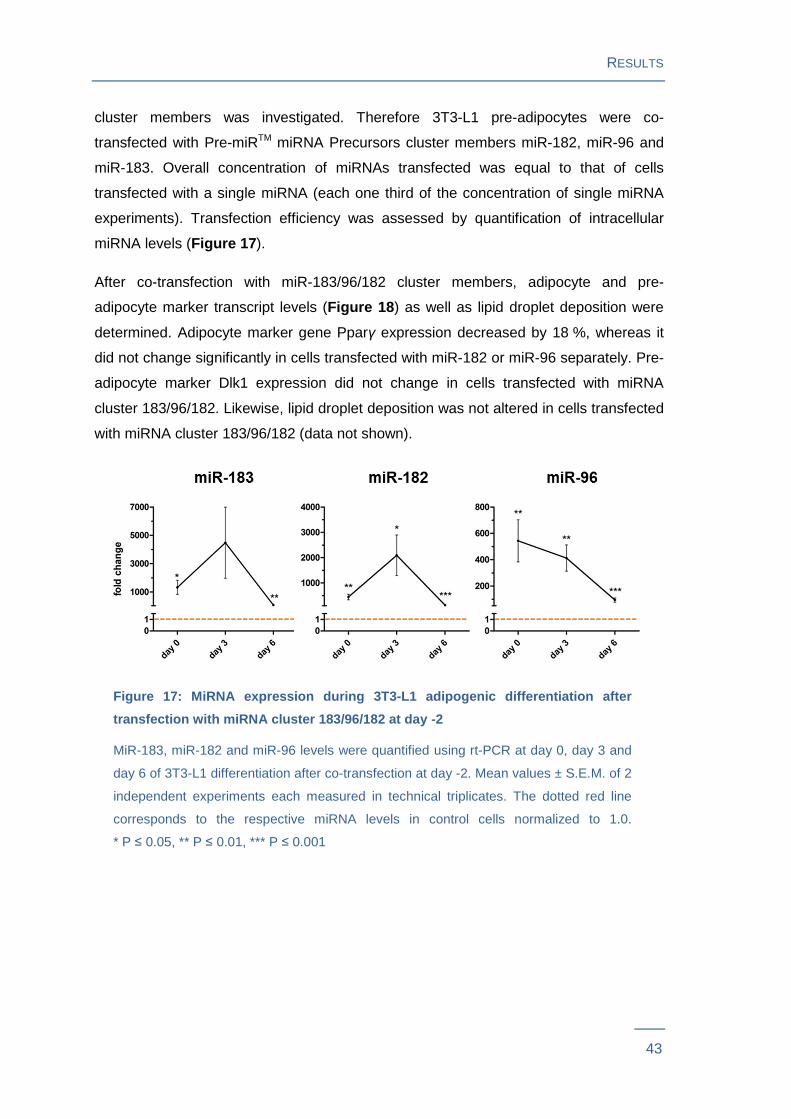
The genes of the candidate miRNAs miR-182 and -183 are clustered together with miR-
96 gene, meaning that their chromosomal distance is less than 10,000 nucleotides28, 32.
The hypothesis of miRNA cluster 183/96/182 multiplying the effect of the single miRNA
RESULTS
43
cluster members was investigated. Therefore 3T3-L1 pre-adipocytes were co-
transfected with Pre-miRTM miRNA Precursors cluster members miR-182, miR-96 and
miR-183. Overall concentration of miRNAs transfected was equal to that of cells
transfected with a single miRNA (each one third of the concentration of single miRNA
experiments). Transfection efficiency was assessed by quantification of intracellular
miRNA levels (Figure 17 ).
After co-transfection with miR-183/96/182 cluster members, adipocyte and pre-
adipocyte marker transcript levels (Figure 18 ) as well as lipid droplet deposition were
determined. Adipocyte marker gene Pparγ expression decreased by 18 %, whereas it
did not change significantly in cells transfected with miR-182 or miR-96 separately. Pre-
adipocyte marker Dlk1 expression did not change in cells transfected with miRNA
cluster 183/96/182. Likewise, lipid droplet deposition was not altered in cells transfected
with miRNA cluster 183/96/182 (data not shown).
Figure 17: MiRNA expression during 3T3-L1 adipogenic different iation after
transfection with miRNA cluster 183/96/182 at day - 2
MiR-183, miR-182 and miR-96 levels were quantified using rt-PCR at day 0, day 3 and
day 6 of 3T3-L1 differentiation after co-transfection at day -2. Mean values ± S.E.M. of 2
independent experiments each measured in technical triplicates. The dotted red line
corresponds to the respective miRNA levels in control cells normalized to 1.0.
* P ≤ 0.05, ** P ≤ 0.01, *** P ≤ 0.001
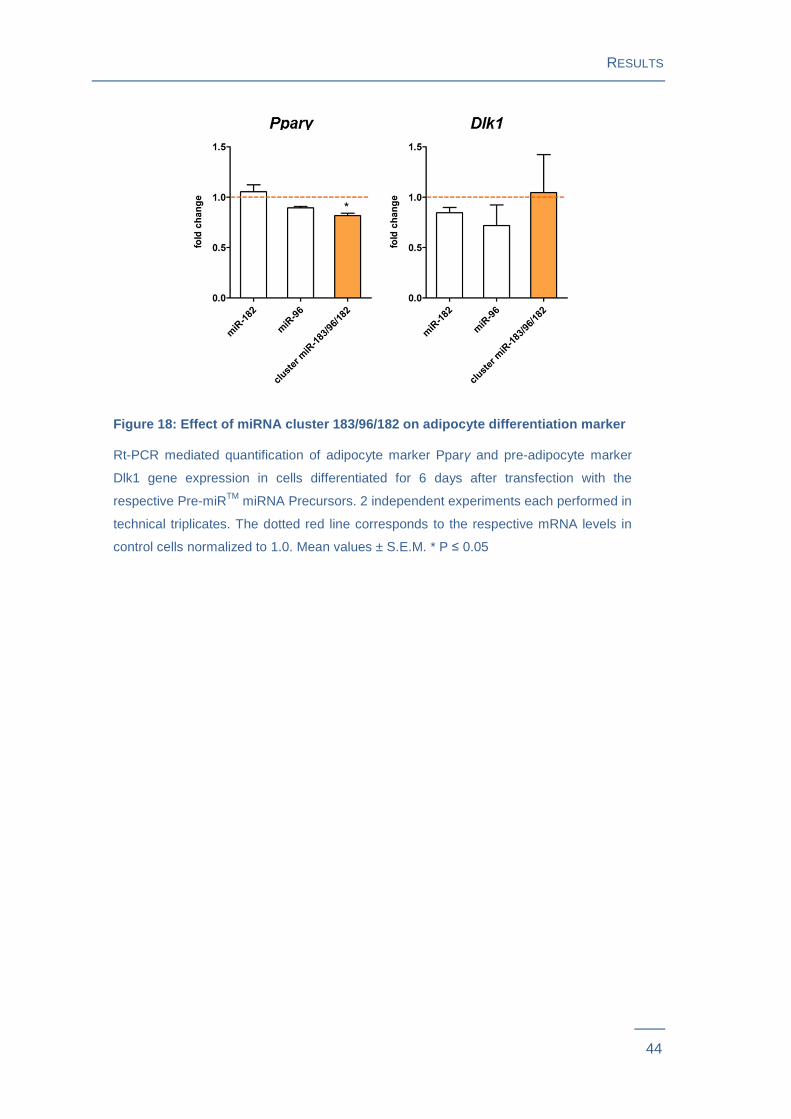
RESULTS
44
Figure 18: Effect of miRNA cluster 183/96/182 on adipocyte dif ferentiation marker
Rt-PCR mediated quantification of adipocyte marker Pparγ and pre-adipocyte marker
Dlk1 gene expression in cells differentiated for 6 days after transfection with the
respective Pre-miRTM miRNA Precursors. 2 independent experiments each performed in
technical triplicates. The dotted red line corresponds to the respective mRNA levels in
control cells normalized to 1.0. Mean values ± S.E.M. * P ≤ 0.05
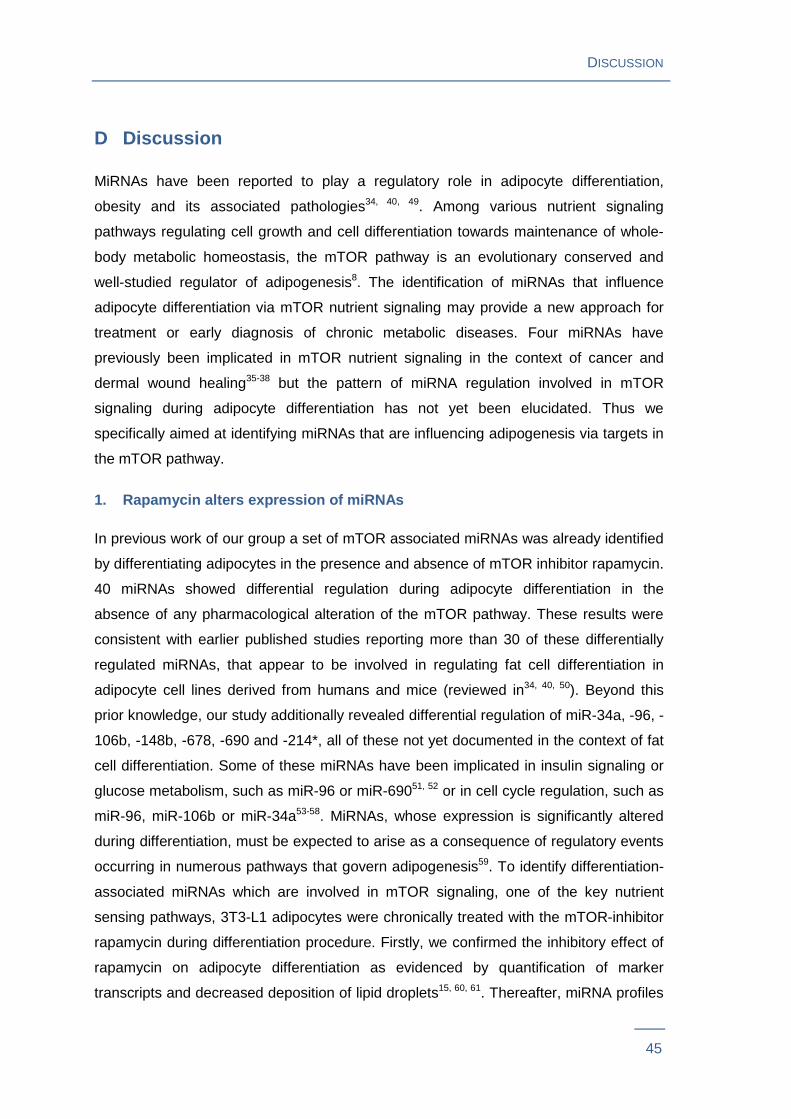
DISCUSSION
45
D Discussion
MiRNAs have been reported to play a regulatory role in adipocyte differentiation,
obesity and its associated pathologies34, 40, 49. Among various nutrient signaling
pathways regulating cell growth and cell differentiation towards maintenance of whole-
body metabolic homeostasis, the mTOR pathway is an evolutionary conserved and
well-studied regulator of adipogenesis8. The identification of miRNAs that influence
adipocyte differentiation via mTOR nutrient signaling may provide a new approach for
treatment or early diagnosis of chronic metabolic diseases. Four miRNAs have
previously been implicated in mTOR nutrient signaling in the context of cancer and
dermal wound healing35-38 but the pattern of miRNA regulation involved in mTOR
signaling during adipocyte differentiation has not yet been elucidated. Thus we
specifically aimed at identifying miRNAs that are influencing adipogenesis via targets in
the mTOR pathway.
1. Rapamycin alters expression of miRNAs
In previous work of our group a set of mTOR associated miRNAs was already identified
by differentiating adipocytes in the presence and absence of mTOR inhibitor rapamycin.
40 miRNAs showed differential regulation during adipocyte differentiation in the
absence of any pharmacological alteration of the mTOR pathway. These results were
consistent with earlier published studies reporting more than 30 of these differentially
regulated miRNAs, that appear to be involved in regulating fat cell differentiation in
adipocyte cell lines derived from humans and mice (reviewed in34, 40, 50). Beyond this
prior knowledge, our study additionally revealed differential regulation of miR-34a, -96, -
106b, -148b, -678, -690 and -214*, all of these not yet documented in the context of fat
cell differentiation. Some of these miRNAs have been implicated in insulin signaling or
glucose metabolism, such as miR-96 or miR-69051, 52 or in cell cycle regulation, such as
miR-96, miR-106b or miR-34a53-58. MiRNAs, whose expression is significantly altered
during differentiation, must be expected to arise as a consequence of regulatory events
occurring in numerous pathways that govern adipogenesis59. To identify differentiation-
associated miRNAs which are involved in mTOR signaling, one of the key nutrient
sensing pathways, 3T3-L1 adipocytes were chronically treated with the mTOR-inhibitor
rapamycin during differentiation procedure. Firstly, we confirmed the inhibitory effect of
rapamycin on adipocyte differentiation as evidenced by quantification of marker
transcripts and decreased deposition of lipid droplets15, 60, 61. Thereafter, miRNA profiles
DISCUSSION
46
from 3T3-L1 cells undergoing an adipogenic differentiation protocol over eight days in
the presence and in the absence of rapamycin were compared. Almost half of the
miRNAs differentially regulated during adipogenesis were also sensitive to rapamycin-
treatment. Chronic mTOR inhibition resulted in attenuation of regulation of these
differentiation-associated miRNAs and corroborates the central role of mTOR in nutrient
driven adipocyte differentiation. Four additional miRNAs were identified as ‘rapamycin-
sensitive’, though showing no differential regulation during adipogenesis. These
miRNAs may mediate differentiation-independent effects of mTOR signaling.
2. Selected miRNAs target predicted genes
2.1 In silico target prediction
The specific aim of this study was to discover the targets of mTOR associated miRNAs
to unravel their regulatory function within mTOR signaling. To identify presumptive
direct miRNA-target pairs within the mTOR pathway, our set of ‘rapamycin-sensitive’
miRNAs was subjected to a stringent in silico target prediction. This is an important step
for high-throughput pre-selection of putative targets, to narrow down the number of
miRNA-target pairs which have to be functionally confirmed in the next steps.
Computational miRNA target prediction still remains challenging as the binding of
miRNAs to their respective target genes does not require full complementarity and the
binding patterns are not yet fully understood62. Various prediction tools have been
developed based firstly on the complementarity between the 5’ seed region of the
miRNA and the 3’UTR of the target gene, secondly on thermodynamic stability of
miRNA-target alignments and thirdly on miRNA:mRNA duplex conservation between
species63. Since each prediction tool applies distinct algorithms, they predict differing
sets of targets. Furthermore, it has already been reported that target predictions may
generate an estimated rate of 31 % false positive targets64. To overcome these
limitations we aimed to increase the prediction specificity by combining five different
prediction algorithms. The set of ‘rapamycin-sensitive’ miRNAs was subjected to PITA,
miRanda, targetScanS, pictar and targetspy algorithms and only those miRNA-target
pairs with a consensus target prediction of at least 2 algorithms were considered as
presumptive candidates. Although this stringent approach may lead to higher specificity
(percentage of correctly predicted among overall predicted ones), it may result in
decreased sensitivity (percentage of correctly predicted targets out of total correct
ones)62. This may lead to the loss of some miRNA-target pairs in our approach.
DISCUSSION
47
However, subjecting the ‘rapamycin-sensitive’ miRNAs to our stringent prediction
approach revealed that more than two thirds of these miRNAs were indeed predicted to
target genes of the mTOR pathway. This finding indirectly confirmed the utility of
rapamycin in the experimental discovery approach. For functional confirmation we
selected five miRNA-target pairs according to the in silico prediction results: miR-183-
Tsc1, miR-378-Tsc1, miR-103-Pik3r1, miR-107-Pik3r1 and miR-182-Pik3r3. All of these
miRNAs already showed strong rapamycin effects in the differentiation experiments and
were predicted to target central genes of the mTOR pathway.
To validate the set of ‘rapamycin-sensitive’ miRNAs in reverse, the computational
pathway-prediction tool DIANA-miRPath was used. This tool is focused on the
identification of miRNA targeted pathways and thus provides an insight into functional
characterization of the predicted miRNA target genes65. With this method, we
investigated the molecular pathways which may be altered by the set of rapamycin-
sensitive miRNAs. Here, mTOR pathway targets were found to be significantly enriched
in the set of predicted rapamycin-sensitive miRNA targets. These results are in line with
the findings of in silico target prediction and they additionally confirm our experimental
discovery approach.
2.2 Functional confirmation by luciferase-based re porter assays
In a first step, functional confirmation of miRNA targets was investigated by luciferase-
based reporter assays, a routinely used and efficient assay for the validation of
individual miRNA-mRNA interactions. For this purpose, HEK-293 cells were co-
transfected with the respective miRNA molecules and reporter plasmids harboring the
3’UTRs of the respective, predicted miRNA target genes.
Reporter assays revealed that miR-183 and miR-378 bind to the 3’UTR of their
predicted target gene Tsc1 and that miR-103 binds to its target gene Pik3r1. However,
physical interaction of miR-107 with Pik3r1 3’UTR and miR-182 with Pik3r3 3’UTR was
not confirmed. Herewith we show that miR-183, miR-378 and miR-103 may target
components of mTOR signaling, which needs to be further confirmed in a second,
functional approach. The rate of interactions we detected is concordant with Lewis et al.
reporting an estimated false positive in silico prediction rate as high as one third64.
Nevertheless, all five miRNA-mRNA target pairs were subjected to further functional
confirmation assays.
DISCUSSION
48
2.3 Functional confirmation by transfection experim ents
As a second approach for functional confirmation of the miRNA-target pairs, miRNA-
mediated effects on target gene expression were investigated. Therefore adipocytes
were transfected with the respective miRNAs and target transcript levels were
quantified.
To identify ideal concentrations of miRNA that are transfected and appropriate time
points for cell harvest, some pre-experiments were performed. Transfection efficiencies
were evaluated by determination of intracellular miRNA levels via rt-PCR and by
measuring the percentage of transfected cells via flow cytometry. On the one hand the
flow cytometry-based approach for establishment of transfection conditions is very fast,
simple in workflow and enables simultaneous determination of cell viability. On the other
hand this approach investigates conditions in cells transfected with a labelled control
siRNA and thus is not specific for individual miRNAs. We thus additionally confirmed
flow cytometry results via a rt-PCR-based approach. Although rt-PCR is more time-
consuming, this approach enables to investigate fold changes of individual miRNAs and
thus is essential to validate successful transfection in the experiment.
For both approaches cells were transfected with various concentrations of
siRNA/miRNA and harvested at various time points. Flow cytometry results of siRNA
transfected cells as well as rt-PCR results of cells transfected with the respective
candidate miRNAs were concordant: Transfection efficiency increased with increasing
concentrations of transfected miRNA molecules and decreased with time. Since a
longer time span post transfection allows the cell to process miRNA-mediated effects on
target transcripts and to retain a high number of viable cells, transfection was carried
out with 20 pmol of the respective miRNAs and cells were harvested 72 hours post
transfection for further validation experiments. These pre-experiments showed that the
flow-cytometry based approach is suitable for fast screening of many different
experimental conditions of transfection, whereas rt-PCR based validation of successful
transfection is mandatory to control intracellular levels of the individual miRNAs. We
thus validated successful transfection in our experiments via quantification of the
respective intracellular miRNA levels and noticed that the relative increase is miRNA
dependent. This may be due to individual endogenous expression levels of the
respective miRNAs. MiR-107 for example showed lower endogenous expression
(CT = 34.5±0.3) and consequently higher fold changes (~7,400), whereas miR-182 is
DISCUSSION
49
higher expressed under physiological conditions (CT = 28.6±0.4) and increases 923-fold
after transfection.
With this knowledge, miRNA-mediated effects on target transcript levels were
investigated for further functional confirmation in transfection experiments. For this
purpose, target gene expression changes were quantified in adipocytes transfected with
the respective miRNAs. These experiments revealed that miR-183 and miR-378 down-
regulated Tsc1 gene expression and miR-103 down-regulated Pik3r1 expression,
whereas miR-107 did not change its predicted target transcript Pik3r1 levels and miR-
182 did not change Pik3r3 transcript levels. These results resemble those of luciferase-
based reporter assays. However, a limitation of these experiments is that miRNA
transfection results in supra-physiological miRNA levels, which may lead to multiple
artifacts66. Another drawback for validation of miRNA-target pairs with this method is
that transcriptomes highly depend on cell type, culture conditions etc.62. That is why our
experiments were performed using adipocytes in an environment of nutrient
satisfaction, where mTOR signaling should be activated and hence even lower gene
expression changes are detectable. Additionally, the miRNA-transfection approach can
not distinguish direct from indirect targets, a disadvantage we overcome by combination
with reporter assay results, which are indicating direct miRNA effects62. To eliminate
effects on cells and gene expression mediated by the transfection procedure, we used
cells transfected with a control miRNA for normalization. These findings, together with
the results from luciferase-based reporter assays indicate that miR-183, miR-378 and
miR-103 may target genes within mTOR signaling, which needs to be further confirmed
on protein level.
2.4 Functional confirmation on protein level
Thus, in the next step candidate miRNA-mediated effects on mTOR targets were
investigated on protein level. Therefore protein level changes were quantified in
adipocytes transfected with the respective miRNAs.
Immunoblotting of miR-103 and miR-107-transfected cells revealed that there were no
detectable changes in Pik3r1 protein levels. The result for miR-107-transfected cells is
not surprising as miR-107 did neither change Pik3r1 transcript levels nor luciferase
activity in reporter assays. In contrast, Pik3r1 protein levels remained unaffected in
miR-103 transfected cells, although miR-103 has been shown to down-regulate Pik3r1
gene expression in the above experiments. Although immunoblotting is considered as a
rather qualitative method to detect a protein in a complex sample, improvements in
DISCUSSION
50
terms of sensitivity and stability of the detection signal allow its use for relative
quantification. However, due to limitations resulting from a narrow detection range,
difficulties to determine linear quantification ranges for each protein and variance
arising from sample loading, protein transfer and signal imaging, the detection of small
alterations in protein levels via immunoblotting still remains challenging67, 68. Thus either
the miR-103-mediated effect on its target gene is not powerful enough to be functionally
relevant on protein level or the alteration in protein expression is not strong enough to
be detected by semi-quantitative immunoblotting. Moreover, as described for the
transcriptome, also the proteome is highly dependent on cell physiology, so that
miRNA-independent regulation mechanisms may overrule miRNA-mediated protein
down-regulation62. For elimination of putative cell physiological effects, all cells were
cultured under equal conditions of an environment of nutrient satisfaction, where mTOR
signaling is activated and hence gene expression changes detectable, as for
transfection experiments. A putative effect of miR-103 as well as of miR-107 on mTOR
signaling (possibly via so far uninvestigated targets) was examined in subsequent
experiments.
MiR-183 and miR-378 transfection resulted in a slight Tsc1 protein up-regulation, even
though both miRNAs have been shown to decrease Tsc1 on transcript level. The
unexpected phenomenon of inversely correlated Tsc1 transcript and protein levels
could be due to functionally overruling regulation of up-stream targets resulting in de-
regulated protein levels in the downstream signaling cascade. To further investigate this
hypothesis, we returned to in silico target prediction. MiR-183 was additionally predicted
to target Rps6ka2 gene encoding Rsk3 protein and miR-378 was predicted to target
Akt1, both up-stream inhibitors of the Tsc complex. Overruling down-regulation of up-
stream inhibitors could explain the observed Tsc1 protein increase. Thus we
determined Rsk3 and Akt1 transcript and protein levels in 3T3-L1 cells transfected with
miR-183 and miR-378 respectively. However, results showed that neither miR-183 nor
miR-378 down-regulated the predicted targets.
Table 6 provides an overview of miRNA-mediated effects on predicted targets, mTOR
signaling and adipocyte differentiation.
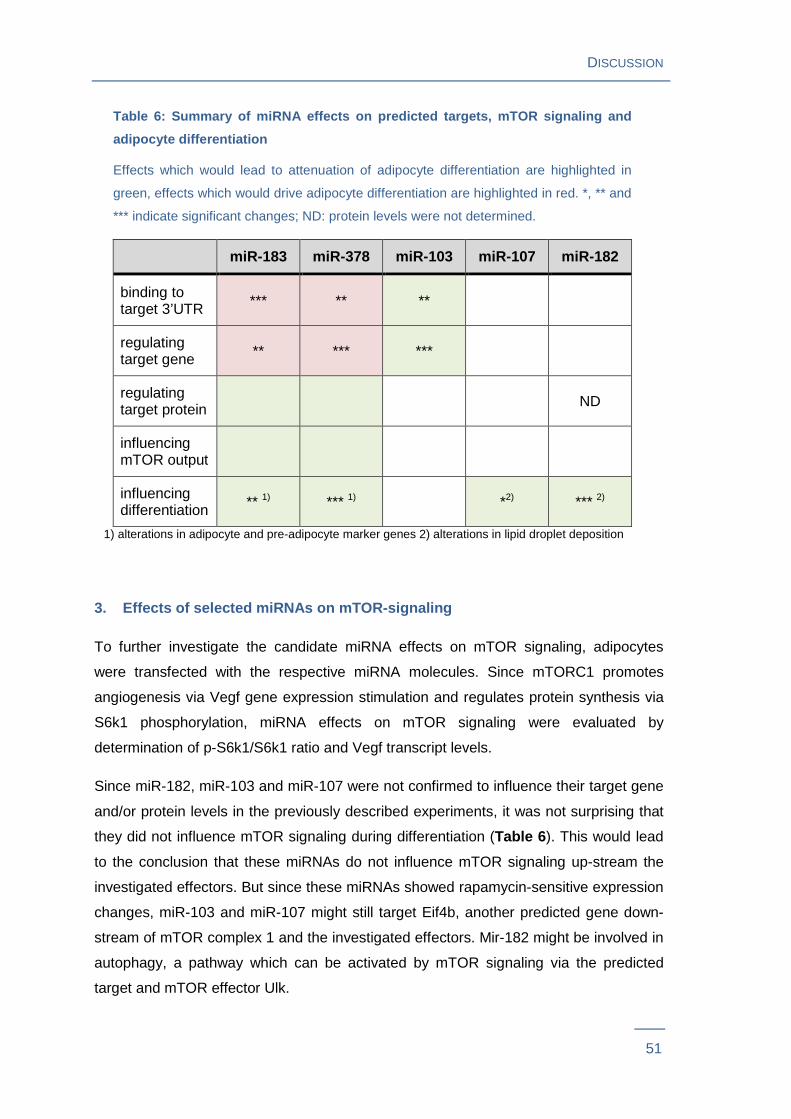
DISCUSSION
51
Table 6: Summary of miRNA effects on predicted targets, mTOR signaling and
adipocyte differentiation
Effects which would lead to attenuation of adipocyte differentiation are highlighted in
green, effects which would drive adipocyte differentiation are highlighted in red. *, ** and
*** indicate significant changes; ND: protein levels were not determined.
miR-183 miR-378 miR-103 miR-107 miR-182
binding to target 3’UTR *** ** **
regulating target gene ** *** ***
regulating target protein ND
influencing mTOR output
influencing differentiation ** 1) *** 1) *2) *** 2)
1) alterations in adipocyte and pre-adipocyte marker genes 2) alterations in lipid droplet deposition
3. Effects of selected miRNAs on mTOR-signaling
To further investigate the candidate miRNA effects on mTOR signaling, adipocytes
were transfected with the respective miRNA molecules. Since mTORC1 promotes
angiogenesis via Vegf gene expression stimulation and regulates protein synthesis via
S6k1 phosphorylation, miRNA effects on mTOR signaling were evaluated by
determination of p-S6k1/S6k1 ratio and Vegf transcript levels.
Since miR-182, miR-103 and miR-107 were not confirmed to influence their target gene
and/or protein levels in the previously described experiments, it was not surprising that
they did not influence mTOR signaling during differentiation (Table 6 ). This would lead
to the conclusion that these miRNAs do not influence mTOR signaling up-stream the
investigated effectors. But since these miRNAs showed rapamycin-sensitive expression
changes, miR-103 and miR-107 might still target Eif4b, another predicted gene down-
stream of mTOR complex 1 and the investigated effectors. Mir-182 might be involved in
autophagy, a pathway which can be activated by mTOR signaling via the predicted
target and mTOR effector Ulk.
DISCUSSION
52
In contrast to miR-103, -107 and -182, transfection of miR-183 and miR-378 decreased
S6k1 phosphorylation though not reaching statistical significance. This result is in
concordance with the previous experiment, in which miR-183 and miR-378 transfection
resulted in increased mTOR inhibitor Tsc1 protein levels (Table 6 ) and may point to an
effect of these miRNAs on general protein synthesis. MiR-378 additionally decreased
Vegf transcript levels significantly and thus this miRNA might affect angiogenesis as
well as general protein synthesis. These findings indicate that miR-183 and miR-378
indeed influence mTOR nutrient signaling and thereby expand the list of the four
previously experimentally confirmed miRNAs that target the mTOR pathway in other
biological settings, namely miR-99a and -b, miR-100 and miR-199a-3p35-38.
4. Effects of selected miRNAs on adipocyte differe ntiation
To investigate the candidate miRNA effects on adipocyte differentiation, adipocytes
were transfected with the respective miRNAs/anti-miRNAs and subsequently
differentiation was initiated. After 6 days of differentiation lipid droplet deposition as well
as adipocyte marker Pparγ and pre-adipocyte marker Dlk1 expression levels were
quantified. Ppary is a transcription factor leading to fundamental changes in gene
expression resulting in the stimulation of proteins critical for adipogenesis. Since Pparγ
expression is maintained throughout the differentiation process, Pparγ transcript levels
are routinely used as adipocyte marker. Although the mechanisms, by which Dlk1 (alias
pre-adipocyte factor-1) influences adipocyte differentiation are not as intensively studied
as those of Pparγ, it is a generally accepted pre-adipocyte marker.
Lipid droplets were visualized via Oil Red O staining and then quantified applying two
different methods. The shorter approach for quantification was absorbance
measurement of the supernatant from de-stained cells. Since the results are strongly
depending on equal confluence of cells between wells, we normalized the values to cell
numbers. In this study Oil Red O absorbance values were normalized to this parameter
via Cellscreen microscopy. There are only few other techniques available to gain more
information about lipid droplets, such as amount and size. Our approach for
determination of lipid droplet size and numbers was to take digital microscopy pictures
of Oil Red O stained cells, which are subsequently analyzed by a digital image analysis
software44. Since microscopy pictures are taken from areas with complete cell
coverage, it is not necessary to determine cell numbers per well. One advantage of this
method is that only a standard light microscope and the freely available software tool
ImageJ is needed. ImageJ enables automating of the commands and thus reduces time
DISCUSSION
53
requirements. Further, because of the simplicity of this software tool, the approach is
applicable for users without previous imaging or programming expertise. The most
important advantage is the possibility to evaluate individual lipid droplet size and
numbers, though a limiting factor can occur by incomplete droplet separation of highly
dense packed droplet clusters. In our study, however, experiments revealed
consistency between the microscopy-based and the absorbance-based method.
Digital microscopy picture analysis showed a significant decrease of lipid droplet
deposition in cells transfected with miR-107 and miR-182. The absorbance-based
method accordingly showed declining absorbance values normalized to cell coverage.
Additionally, the microscopy-based method revealed that the decrease in lipid droplet
formation is due to droplet size reduction. Thus these miRNAs seem to influence
adipocyte differentiation by affecting lipid droplet size (Table 6 ). While the molecular
mechanism are not yet fully understood, it is already known that S6k1, a down-stream
effector of mTOR, controls lipid metabolism69. Although miR-107 and miR-182
expression appeared to be highly sensitive to rapamycin treatment in our study, these
miRNAs influenced lipid droplet formation S6k1 phosphorylation independently in our
study. But there are S6k1-independent mechanisms of mTOR mediated de novo
lipogenesis already known. Firstly, mTOR complex 1 can stimulate lipogenic genes by
induction of the key transcription factor Pparγ via 4Ebp169. However, since the
adipocyte marker gene Pparγ expression remained unchanged in cells which were
differentiated after miR-107 and miR-182 transfection, these miRNAs may not influence
lipid droplet deposition via this mTOR-4Ebp1-Pparγ axis. A second mechanism linking
mTOR to lipid droplet formation is mTOR mediated inhibition of Atgl transcription
(adipose triglyceride lipase), an enzyme which controls lipid homeostasis9. Thirdly it has
been reported that mTOR complex 1 can promote de novo lipogenesis via Srebp-1
activation, a transcription factor controlling gene expression of lipogenic genes69. Thus
miR-182 and miR-107 may influence lipid droplet formation via targets down-stream of
mTOR being part of this Atgl or Srebp-1 mediated mechanisms. Thus these miRNAs
could show rapamycin-sensitivity on the one hand and pS6k1 and Pparγ independence
on the other hand. Concordant to our results, miR-107 and miR-182 have been
implicated in adipocyte differentiation in other studies34, 40. Meng et al. showed that
under hypoxic conditions miR-107 suppressed endothelial progenitor cell differentiation
via Hif1ß, whereas in our study miR-107 did not influence the mTOR-Hif1-Vegf
angiogenesis pathway under physiological oxygen conditions70. These findings
demonstrate an example for a miRNA effect dependent on the respective physiological
DISCUSSION
54
conditions. To the best of our knowledge the targets by which miR-182 influences
adipocyte differentiation have not yet been discovered.
Adipocytes transfected with miR-103 did not show any differences in absorbance-based
or in microscopy-based Oil Red O quantification. Further, the expression of pre-
adipocyte and adipocyte marker genes was not altered by miR-103 transfection (Table
6). Thus miR-103 did neither influence the mTOR effectors investigated nor
differentiation markers or lipid droplet deposition in our study. These findings were
consistent with an earlier study reporting normal triglyceride levels in differentiated 3T3-
L1 adipocytes ectopically expressing miR-103, although the same study reported a
miR-103-mediated increase in triglycerides in the early stage of 3T3-L1 differentiation70.
Reported in vivo studies are inconsistent: in mice mir-103 was found to be down-
regulated in mature adipocytes, whereas it was up-regulated in human adipose tissue34.
Thus miR-103 may accelerate adipocyte differentiation while not affecting the final state
of the differentiated cell.
Lipid droplet deposition remained unchanged in differentiated cells transfected with anti-
miR-183 or anti-miR-378 in our study. However, both miRNAs showed an attenuating
effect on adipocyte differentiation as anti-miR-183 and anti-miR-378 treatments led to
increased adipocyte marker and decreased pre-adipocyte marker gene expression in
our study (Table 6 ). Triacylglycerol molecules are neutral lipids synthesized by cells in
times of nutrition excess and are stored in lipid droplets71. Thus synthesis of
triacylglycerol may correlate with lipid droplet formation. In concordance to our results,
another study inhibiting miR-378 via antagomirs discovered no significant changes in
triacylglycerol levels or adipocyte morphology in the late stages of differentiation.
However, the same study reported increased triacylglycerol levels and accelerated lipid
droplet growth in early stages of differentiation after overexpression of miR-378 and
miR-378*72. Although it was not possible to distinguish whether the effects on
lipogenesis were due to miR-378 or miR-378* in that study, the authors stated that
miR-378 together with miR-378* stimulate adipogenesis in the early stages of
differentiation. Our study describes an attenuating effect of miR-378 in the late stages
of differentiation: the opposite effect in the early stages of differentiation may either be
caused by miR-378*, which is not investigated in our study, and/or miR-378 might be
involved in a negative feedback regulatory mechanism in the late stages of
differentiation. Targeting genes within this feedback mechanism may overrule less
important targets, such as previously described for Tsc1 on protein level, thereby
DISCUSSION
55
leading to inversely correlated Tsc1 transcript and protein levels. Our results showed
firstly that miR-378 was strongly up-regulated in the late phase of adipocyte
differentiation (Figure S 7 ), secondly that miR-378 indirectly increased mTOR inhibitor
Tsc1 and thirdly attenuated mTOR effectors. Taken together these findings are
consistent with our hypothesis of miR-378 being involved in a negative feedback
regulation of mTOR signaling. We propose that miR-378 might be involved in the well
characterized suppression of Pi3k by mTORC1 activated S6k173, 74. In this process
prolonged growth factor-mediated mTOR activation and hence S6k1 phosphorylation
strongly down-regulate insulin signaling via the Pi3k-Tsc-mTOR axis. In vivo this
mechanism of uncoupling Pi3k may be required to block further activation as soon as
sufficient growth has been reached73.
In our study miR-183 did not influence lipid droplet deposition, but revealed an
attenuating effect on adipocyte differentiation as evidenced by its influence on
adipocyte/pre-adipocyte marker gene expression at late stages of differentiation. These
results are in line with the attenuating effect of this miRNA on mTOR effector S6k1 and
the increasing effect on mTOR inhibitor Tsc1. Chen et al. could not detect a miR-183
dependent influence on marker gene expression changes in the late stages of
differentiation, however, in the early stages of differentiation, they report a miR-183
dependent increase in marker gene expression and lipid droplet deposition75. The effect
of miR-183 on adipocyte differentiation seems to be opposed in early and late stages of
differentiation as already described for miR-378. Besides miR-378, miR-183 was also
strongly up-regulated in the late phase of adipocyte differentiation (Figure S 7 ) and
affected genes of the Tsc-mTOR-S6k1 axis in an adipocyte differentiation attenuating
manner. Thus miR-183 may also be part of a negative feedback mechanism, such as
the S6k1 phosphorylation activated Pi3k suppression73, 74. Such mechanism would lead
to overruling effects on previously described miR-183 target Tsc1 on protein level as
already mentioned for miR-378.
The better understanding of the involvement of miRNAs in adipocyte differentiation may
give important inputs about the regulation of mammalian adipogenesis and might even
provide an approach for therapeutic options. For example, recent studies detected
miRNAs as biomarkers in several chronic diseases like cardiovascular disease, cancer
and type 2 diabetes76-78. Thus, in the future, miRNAs might also be used for clinical
diagnosis and treatment monitoring of chronic diseases34.
DISCUSSION
56
5. MiRNA cluster 183/96/182 and miRNA family 103/10 7
Clustered miRNAs derive from a common multi-cistronic pri-miRNA and thus are
influenced by similar regulation mechanisms28, 32. That is why clustered miRNAs are
thought to be functionally related and, like miRNA families, of particular biological
relevance. MiRNA families derived from gene duplication thereby often share seed
sequences33. In contrast to miRNA clusters, miRNA families may act redundantly by
targeting similar gene sets, whereas clustered miRNAs may act coordinately by
targeting different genes within one pathway51. We thus investigated potential additional
effects of clustered miRNAs or miRNA families compared to its individual miRNA
members on adipocyte differentiation. For this purpose, 3T3-L1 pre-adipocytes were
transfected with either miRNA cluster 183/96/182 or miRNA family 103/107 and
subsequently subjected to differentiation.
We found that miRNA cluster 183/96/182 influences adipocyte differentiation by down-
regulating adipocyte marker Pparγ gene expression, while miR-182 and miR-96 alone
did not affect marker gene levels. However, miR-183 alone had a strong effect on Pparγ
and Dlk1 gene expression in the above experiments. The effects of the cluster may thus
mainly be mediated by miR-183 in our study. However, cluster 183/96/182 has
previously been described to play an important regulatory role by targeting several
signaling pathways, including insulin signaling51. Since the expression of this cluster
was characterized by high rapamycin-sensitivity, our study expands this knowledge by
adding mTOR signaling as presumptive function of this cluster.
MiRNA family 103/107 influenced adipocyte differentiation by decreasing lipid droplet
numbers, whereas miR-107 alone reduced lipid droplet size and miR-103 alone did not
affect lipid droplet deposition at all. Although miR-103 and miR-107 reside on different
chromosomes they are located within introns of a set of genes encoding for enzymes
involved in fatty acid, amino acid, cholesterol, pyruvate or glucose metabolism79. Wilfred
et al. reported that bioinformatics predict target genes of these miRNAs in lipid
metabolism, which could result in decreasing fatty acid synthesis and uptake. Until now,
however, experimental data for this hypothesis was lacking79. Our study may provide
the first experimental evidence for the involvement of this miRNA family in lipid
metabolism by decreasing lipid droplet deposition. This effect is likely mTOR-signaling
associated due to the miRNAs’ rapamycin-sensitive expression changes during
adipocyte differentiation. We conclude from these findings, that miRNA families may

DISCUSSION
57
exhibit regulatory effects on adipogenesis additionally to those of the respective single
miRNAs.
Our findings support a recently suggested concept of miRNA regulation: Entire
networks of multiple miRNAs targeting multiple genes should be considered, instead of
one miRNA-one target gene pairs31, 66. On the one hand one gene may be targeted by
multiple miRNAs, on the other hand one miRNA may target multiple genes even within
one pathway, thereby reaching biological importance, despite weak effects of individual
miRNA-target pairs. A more complete understanding of the complex regulatory
networks of miRNAs and their targets still remains a challenge in the miRNA field that
needs to be overcome31, 66.
SUMMARY
58
E Summary
Obesity is defined as abnormal or excessive fat accumulation which may have adverse
effects on health. On adipose tissue level the development of obesity is dependent on
the coordinated interplay of adipocyte hypertrophy, pre-adipocyte proliferation and
differentiation of pre-adipocytes into mature fat cells. The mechanistic target of
rapamycin (mTOR) signaling is an evolutionary conserved and well-studied nutrient-
signaling pathway adapting cell differentiation to nutrient availability. In addition,
miRNAs appear to play a crucial regulatory role as more than 40 miRNAs have
previously been reported as being associated with adipocyte differentiation. In this
study, we specifically aimed at identifying distinct miRNAs that are governing nutrient-
driven adipogenesis via the mTOR pathway.
Taken together, we identified a subset of 16 miRNAs showing both responsiveness to
rapamycin and prediction as targets within the mTOR pathway. We confirmed target
3’UTR binding and target transcript regulation of the predicted miRNA-target pairs
miR-183 - Tsc1, miR-378 - Tsc1 and miR-103 - Pik3r1. Unexpectedly Pik3r1 protein
levels were not altered and Tsc1 protein levels were inversely correlated to Tsc1
transcript levels. Nevertheless Tsc1 protein up-regulation was consistent with an
attenuating effect of miR-183 and miR-378 on mTOR signaling and adipocyte marker
transcript levels. Since miRNA-mediated effects were detected during the late stages of
differentiation, these miRNAs may be involved in negative feedback regulatory
mechanisms. We found that miR-107 and miR-182 reduced lipid droplet size during
adipocyte differentiation. The present study provides first experimental evidence for the
predicted effects of miRNA family 103/107 on lipid metabolism. Moreover, our data are
suggestive that miRNA families may exhibit further effects on adipogenesis additionally
to those of the respective single miRNAs.
Especially the effect of miR-107, miR-182 and miRNA family 103/107 on adipocyte
differentiation makes them promising targets for further investigation. Above all the
attenuating effect of miR-183 and miR-378 on mTOR signaling as well as adipocyte
differentiation may also suggest an utility of these miRNAs as biomarkers for nutrient-
driven dysregulation of adipogenesis.

REFERENCES
59
F References
1. Fact Sheet N°311 - Obesity and overweight. In.: World Health Organization;
2013.
2. Withrow D, Alter DA: The economic burden of obesity worldwide: a systematic
review of the direct costs of obesity. Obes Rev 12, 131-141 (2011).
3. Jordan SD, Konner AC, Bruning JC: Sensing the fuels: glucose and lipid
signaling in the CNS controlling energy homeostasis. Cell Mol Life Sci 67, 3255-
3273 (2010).
4. Avram MM, Avram AS, James WD: Subcutaneous fat in normal and diseased
states 3. Adipogenesis: from stem cell to fat cell. J Am Acad Dermatol 56, 472-
492 (2007).
5. Gregoire FM, Smas CM, Sul HS: Understanding adipocyte differentiation.
Physiol Rev 78, 783-809 (1998).
6. Gregoire FM: Adipocyte differentiation: from fibroblast to endocrine cell. Exp Biol
Med (Maywood) 226, 997-1002 (2001).
7. Green H, Kehinde O: An established preadipose cell line and its differentiation in
culture. II. Factors affecting the adipose conversion. Cell 5, 19-27 (1975).
8. Marshall S: Role of insulin, adipocyte hormones, and nutrient-sensing pathways
in regulating fuel metabolism and energy homeostasis: a nutritional perspective
of diabetes, obesity, and cancer. Sci STKE 2006, re7 (2006).
9. Chakrabarti P, English T, Shi J, Smas CM, Kandror KV: Mammalian target of
rapamycin complex 1 suppresses lipolysis, stimulates lipogenesis, and promotes
fat storage. Diabetes 59, 775-781 (2010).
10. Jewell JL, Guan KL: Nutrient signaling to mTOR and cell growth. Trends
Biochem Sci 38, 233-242 (2013).
11. Laplante M, Sabatini DM: mTOR signaling in growth control and disease. Cell
149, 274-293 (2012).
12. Ma XM, Blenis J: Molecular mechanisms of mTOR-mediated translational
control. Nat Rev Mol Cell Biol 10, 307-318 (2009).
13. Jiang BH, Liu LZ: PI3K/PTEN signaling in angiogenesis and tumorigenesis. Adv
Cancer Res 102, 19-65 (2009).
14. Hudson CC, Liu M, Chiang GG, Otterness DM, Loomis DC, Kaper F, Giaccia
AJ, Abraham RT: Regulation of hypoxia-inducible factor 1alpha expression and

REFERENCES
60
function by the mammalian target of rapamycin. Mol Cell Biol 22, 7004-7014
(2002).
15. Cho HJ, Park J, Lee HW, Lee YS, Kim JB: Regulation of adipocyte
differentiation and insulin action with rapamycin. Biochem Biophys Res Commun
321, 942-948 (2004).
16. Polak P, Cybulski N, Feige JN, Auwerx J, Ruegg MA, Hall MN: Adipose-specific
knockout of raptor results in lean mice with enhanced mitochondrial respiration.
Cell Metab 8, 399-410 (2008).
17. Um SH, D'Alessio D, Thomas G: Nutrient overload, insulin resistance, and
ribosomal protein S6 kinase 1, S6K1. Cell Metab 3, 393-402 (2006).
18. Birse RT, Choi J, Reardon K, Rodriguez J, Graham S, Diop S, Ocorr K, Bodmer
R, Oldham S: High-fat-diet-induced obesity and heart dysfunction are regulated
by the TOR pathway in Drosophila. Cell Metab 12, 533-544 (2010).
19. Crespo JL, Hall MN: Elucidating TOR signaling and rapamycin action: lessons
from Saccharomyces cerevisiae. Microbiol Mol Biol Rev 66, 579-591, table of
contents (2002).
20. Walz G, Budde K, Mannaa M, Nurnberger J, Wanner C, Sommerer C,
Kunzendorf U, Banas B, Horl WH, Obermuller N et al: Everolimus in patients
with autosomal dominant polycystic kidney disease. N Engl J Med 363, 830-840
(2010).
21. Rovira J, Marcelo Arellano E, Burke JT, Brault Y, Moya-Rull D, Banon-Maneus
E, Ramirez-Bajo MJ, Gutierrez-Dalmau A, Revuelta I, Quintana LF et al: Effect
of mTOR inhibitor on body weight: from an experimental rat model to human
transplant patients. Transpl Int 21, 992-998 (2008).
22. Yang SB, Lee HY, Young DM, Tien AC, Rowson-Baldwin A, Shu YY, Jan YN,
Jan LY: Rapamycin induces glucose intolerance in mice by reducing islet mass,
insulin content, and insulin sensitivity. J Mol Med (Berl) 90, 575-585 (2012).
23. Deblon N, Bourgoin L, Veyrat-Durebex C, Peyrou M, Vinciguerra M, Caillon A,
Maeder C, Fournier M, Montet X, Rohner-Jeanrenaud F et al: Chronic mTOR
inhibition by rapamycin induces muscle insulin resistance despite weight loss in
rats. Br J Pharmacol 165, 2325-2340 (2012).
24. Zahr E, Molano RD, Pileggi A, Ichii H, San Jose S, Bocca N, An W, Gonzalez-
Quintana J, Fraker C, Ricordi C et al: Rapamycin impairs beta-cell proliferation
in vivo. Transplant Proc 40, 436-437 (2008).
REFERENCES
61
25. Choo AY, Yoon SO, Kim SG, Roux PP, Blenis J: Rapamycin differentially
inhibits S6Ks and 4E-BP1 to mediate cell-type-specific repression of mRNA
translation. Proc Natl Acad Sci U S A 105, 17414-17419 (2008).
26. Lander ES, Linton LM, Birren B, Nusbaum C, Zody MC, Baldwin J, Devon K,
Dewar K, Doyle M, FitzHugh W et al: Initial sequencing and analysis of the
human genome. Nature 409, 860-921 (2001).
27. Venter JC, Adams MD, Myers EW, Li PW, Mural RJ, Sutton GG, Smith HO,
Yandell M, Evans CA, Holt RA et al: The sequence of the human genome.
Science 291, 1304-1351 (2001).
28. Bartel DP: MicroRNAs: genomics, biogenesis, mechanism, and function. Cell
116, 281-297 (2004).
29. Ul Hussain M: Micro-RNAs (miRNAs): genomic organisation, biogenesis and
mode of action. Cell Tissue Res 349, 405-413 (2012).
30. He L, Hannon GJ: MicroRNAs: small RNAs with a big role in gene regulation.
Nat Rev Genet 5, 522-531 (2004).
31. Lim LP, Lau NC, Garrett-Engele P, Grimson A, Schelter JM, Castle J, Bartel DP,
Linsley PS, Johnson JM: Microarray analysis shows that some microRNAs
downregulate large numbers of target mRNAs. Nature 433, 769-773 (2005).
32. Altuvia Y, Landgraf P, Lithwick G, Elefant N, Pfeffer S, Aravin A, Brownstein MJ,
Tuschl T, Margalit H: Clustering and conservation patterns of human
microRNAs. Nucleic Acids Res 33, 2697-2706 (2005).
33. Kim VN, Han J, Siomi MC: Biogenesis of small RNAs in animals. Nat Rev Mol
Cell Biol 10, 126-139 (2009).
34. McGregor RA, Choi MS: microRNAs in the regulation of adipogenesis and
obesity. Curr Mol Med 11, 304-316 (2011).
35. Doghman M, El Wakil A, Cardinaud B, Thomas E, Wang J, Zhao W, Peralta-Del
Valle MH, Figueiredo BC, Zambetti GP, Lalli E: Regulation of insulin-like growth
factor-mammalian target of rapamycin signaling by microRNA in childhood
adrenocortical tumors. Cancer Res 70, 4666-4675 (2010).
36. Nagaraja AK, Creighton CJ, Yu Z, Zhu H, Gunaratne PH, Reid JG, Olokpa E,
Itamochi H, Ueno NT, Hawkins SM et al: A link between mir-100 and
FRAP1/mTOR in clear cell ovarian cancer. Mol Endocrinol 24, 447-463 (2010).
37. Fornari F, Milazzo M, Chieco P, Negrini M, Calin GA, Grazi GL, Pollutri D, Croce
CM, Bolondi L, Gramantieri L: MiR-199a-3p regulates mTOR and c-Met to
REFERENCES
62
influence the doxorubicin sensitivity of human hepatocarcinoma cells. Cancer
Res 70, 5184-5193 (2010).
38. Jin Y, Tymen SD, Chen D, Fang ZJ, Zhao Y, Dragas D, Dai Y, Marucha PT,
Zhou X: MicroRNA-99 Family Targets AKT/mTOR Signaling Pathway in Dermal
Wound Healing. PLoS One 8, e64434 (2013).
39. Oßwald A: Einfluss des mTOR-Signalwegs auf die differentielle microRNA-
Expression während der Adipozytendifferenzierung. lmu; 2012.
40. Alexander R, Lodish H, Sun L: MicroRNAs in adipogenesis and as therapeutic
targets for obesity. Expert Opin Ther Targets 15, 623-636 (2011).
41. Esau C, Davis S, Murray SF, Yu XX, Pandey SK, Pear M, Watts L, Booten SL,
Graham M, McKay R et al: miR-122 regulation of lipid metabolism revealed by in
vivo antisense targeting. Cell Metab 3, 87-98 (2006).
42. Papadopoulos GL, Alexiou P, Maragkakis M, Reczko M, Hatzigeorgiou AG:
DIANA-mirPath: Integrating human and mouse microRNAs in pathways.
Bioinformatics 25, 1991-1993 (2009).
43. Green H, Kehinde O: Sublines of Mouse 3t3 Cells That Accumulate Lipid. Cell 1,
113-116 (1974).
44. Deutsch MJ, Schriever SC, Roscher AA, Ensenauer R: Digital image analysis
approach for lipid droplet size quantitation of Oil Red O-stained cultured cells.
Anal Biochem (2013).
45. Brattelid T, Aarnes EK, Helgeland E, Guvaag S, Eichele H, Jonassen AK:
Normalization strategy is critical for the outcome of miRNA expression analyses
in the rat heart. Physiol Genomics 43, 604-610 (2011).
46. Pfaffl MW: A new mathematical model for relative quantification in real-time RT-
PCR. Nucleic Acids Res 29, e45 (2001).
47. Lucas ES, Watkins AJ, Cox AL, Marfy-Smith SJ, Smyth N, Fleming TP: Tissue-
specific selection of reference genes is required for expression studies in the
mouse model of maternal protein undernutrition. Theriogenology 76, 558-569
(2011).
48. Tee AR, Blenis J: mTOR, translational control and human disease. Semin Cell
Dev Biol 16, 29-37 (2005).
49. Heneghan HM, Miller N, Kerin MJ: Role of microRNAs in obesity and the
metabolic syndrome. Obes Rev 11, 354-361 (2009).
REFERENCES
63
50. Romao JM, Jin W, Dodson MV, Hausman GJ, Moore SS, Guan le L: MicroRNA
regulation in mammalian adipogenesis. Exp Biol Med (Maywood) 236, 997-1004
(2011).
51. Xu J, Wong C: A computational screen for mouse signaling pathways targeted
by microRNA clusters. RNA 14, 1276-1283 (2008).
52. Tang X, Muniappan L, Tang G, Ozcan S: Identification of glucose-regulated
miRNAs from pancreatic beta cells reveals a role for miR-30d in insulin
transcription. RNA 15, 287-293 (2009).
53. Guttilla IK, White BA: Coordinate regulation of FOXO1 by miR-27a, miR-96, and
miR-182 in breast cancer cells. J Biol Chem 284, 23204-23216 (2009).
54. Myatt SS, Wang J, Monteiro LJ, Christian M, Ho KK, Fusi L, Dina RE, Brosens
JJ, Ghaem-Maghami S, Lam EW: Definition of microRNAs that repress
expression of the tumor suppressor gene FOXO1 in endometrial cancer. Cancer
Res 70, 367-377 (2010).
55. Petrocca F, Vecchione A, Croce CM: Emerging role of miR-106b-25/miR-17-92
clusters in the control of transforming growth factor beta signaling. Cancer Res
68, 8191-8194 (2008).
56. Ivanovska I, Ball AS, Diaz RL, Magnus JF, Kibukawa M, Schelter JM, Kobayashi
SV, Lim L, Burchard J, Jackson AL et al: MicroRNAs in the miR-106b family
regulate p21/CDKN1A and promote cell cycle progression. Mol Cell Biol 28,
2167-2174 (2008).
57. Sun F, Fu H, Liu Q, Tie Y, Zhu J, Xing R, Sun Z, Zheng X: Downregulation of
CCND1 and CDK6 by miR-34a induces cell cycle arrest. FEBS Lett 582, 1564-
1568 (2008).
58. Hermeking H: The miR-34 family in cancer and apoptosis. Cell Death Differ 17,
193-199 (2010).
59. MacDougald OA, Lane MD: Transcriptional regulation of gene expression during
adipocyte differentiation. Annu Rev Biochem 64, 345-373 (1995).
60. Kim JE, Chen J: regulation of peroxisome proliferator-activated receptor-gamma
activity by mammalian target of rapamycin and amino acids in adipogenesis.
Diabetes 53, 2748-2756 (2004).
61. Yeh WC, Bierer BE, McKnight SL: Rapamycin inhibits clonal expansion and
adipogenic differentiation of 3T3-L1 cells. Proc Natl Acad Sci U S A 92, 11086-
11090 (1995).
REFERENCES
64
62. Witkos TM, Koscianska E, Krzyzosiak WJ: Practical Aspects of microRNA
Target Prediction. Curr Mol Med 11, 93-109 (2011).
63. Li L, Xu J, Yang D, Tan X, Wang H: Computational approaches for microRNA
studies: a review. Mamm Genome 21, 1-12 (2010).
64. Lewis BP, Shih IH, Jones-Rhoades MW, Bartel DP, Burge CB: Prediction of
mammalian microRNA targets. Cell 115, 787-798 (2003).
65. Vlachos IS, Kostoulas N, Vergoulis T, Georgakilas G, Reczko M, Maragkakis M,
Paraskevopoulou MD, Prionidis K, Dalamagas T, Hatzigeorgiou AG: DIANA
miRPath v.2.0: investigating the combinatorial effect of microRNAs in pathways.
Nucleic Acids Res 40, W498-504 (2012).
66. Peter ME: Targeting of mRNAs by multiple miRNAs: the next step. Oncogene
29, 2161-2164 (2010).
67. Heidebrecht F, Heidebrecht A, Schulz I, Behrens SE, Bader A: Improved
semiquantitative Western blot technique with increased quantification range. J
Immunol Methods 345, 40-48 (2009).
68. Taylor SC, Posch A: The design of a quantitative western blot experiment.
Biomed Res Int 2014, 361590 (2014).
69. Laplante M, Sabatini DM: An emerging role of mTOR in lipid biosynthesis. Curr
Biol 19, R1046-1052 (2009).
70. Xie H, Lim B, Lodish HF: MicroRNAs induced during adipogenesis that
accelerate fat cell development are downregulated in obesity. Diabetes 58,
1050-1057 (2009).
71. Khor VK, Shen WJ, Kraemer FB: Lipid droplet metabolism. Curr Opin Clin Nutr
Metab Care 16, 632-637 (2013).
72. Gerin I, Bommer GT, McCoin CS, Sousa KM, Krishnan V, MacDougald OA:
Roles for miRNA-378/378* in adipocyte gene expression and lipogenesis. Am J
Physiol Endocrinol Metab 299, E198-206 (2010).
73. Manning BD: Balancing Akt with S6K: implications for both metabolic diseases
and tumorigenesis. J Cell Biol 167, 399-403 (2004).
74. Harrington LS, Findlay GM, Lamb RF: Restraining PI3K: mTOR signalling goes
back to the membrane. Trends Biochem Sci 30, 35-42 (2005).
75. Chen C, Xiang H, Peng YL, Peng J, Jiang SW: Mature miR-183, negatively
regulated by transcription factor GATA3, promotes 3T3-L1 adipogenesis through
inhibition of the canonical Wnt/beta-catenin signaling pathway by targeting
LRP6. Cell Signal 26, 1155-1165 (2014).

REFERENCES
65
76. Sayed AS, Xia K, Salma U, Yang T, Peng J: Diagnosis, Prognosis and
Therapeutic Role of Circulating miRNAs in Cardiovascular Diseases. Heart Lung
Circ (2014).
77. Grange C, Collino F, Tapparo M, Camussi G: Oncogenic micro-RNAs and Renal
Cell Carcinoma. Front Oncol 4, 49 (2014).
78. Kato M, Castro NE, Natarajan R: MicroRNAs: potential mediators and
biomarkers of diabetic complications. Free Radic Biol Med 64, 85-94 (2013).
79. Wilfred BR, Wang WX, Nelson PT: Energizing miRNA research: a review of the
role of miRNAs in lipid metabolism, with a prediction that miR-103/107 regulates
human metabolic pathways. Mol Genet Metab 91, 209-217 (2007).
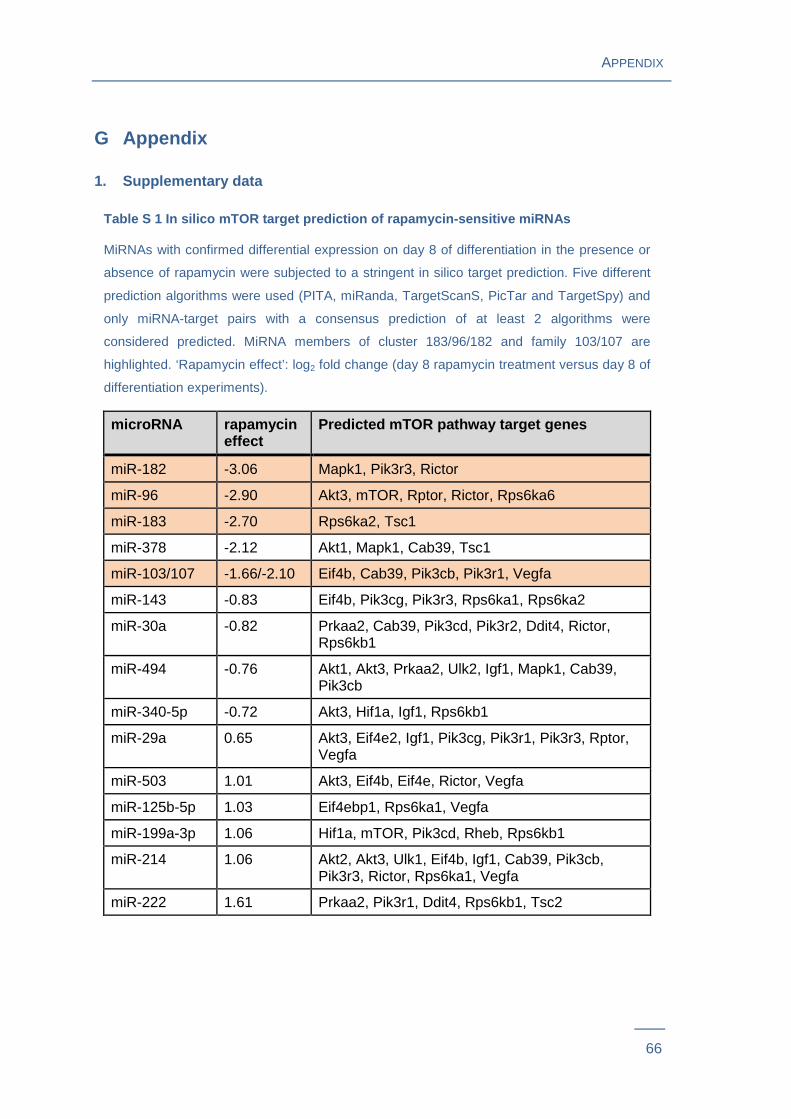
APPENDIX
66
G Appendix
1. Supplementary data
Table S 1 In silico mTOR target prediction of rapamycin-sensitive miRN As
MiRNAs with confirmed differential expression on day 8 of differentiation in the presence or
absence of rapamycin were subjected to a stringent in silico target prediction. Five different
prediction algorithms were used (PITA, miRanda, TargetScanS, PicTar and TargetSpy) and
only miRNA-target pairs with a consensus prediction of at least 2 algorithms were
considered predicted. MiRNA members of cluster 183/96/182 and family 103/107 are
highlighted. ‘Rapamycin effect’: log2 fold change (day 8 rapamycin treatment versus day 8 of
differentiation experiments).
microRNA rapamycin effect
Predicted mTOR pathway target genes
miR-182 -3.06 Mapk1, Pik3r3, Rictor
miR-96 -2.90 Akt3, mTOR, Rptor, Rictor, Rps6ka6
miR-183 -2.70 Rps6ka2, Tsc1
miR-378 -2.12 Akt1, Mapk1, Cab39, Tsc1
miR-103/107 -1.66/-2.10 Eif4b, Cab39, Pik3cb, Pik3r1, Vegfa
miR-143 -0.83 Eif4b, Pik3cg, Pik3r3, Rps6ka1, Rps6ka2
miR-30a -0.82 Prkaa2, Cab39, Pik3cd, Pik3r2, Ddit4, Rictor, Rps6kb1
miR-494 -0.76 Akt1, Akt3, Prkaa2, Ulk2, Igf1, Mapk1, Cab39, Pik3cb
miR-340-5p -0.72 Akt3, Hif1a, Igf1, Rps6kb1
miR-29a 0.65 Akt3, Eif4e2, Igf1, Pik3cg, Pik3r1, Pik3r3, Rptor, Vegfa
miR-503 1.01 Akt3, Eif4b, Eif4e, Rictor, Vegfa
miR-125b-5p 1.03 Eif4ebp1, Rps6ka1, Vegfa
miR-199a-3p 1.06 Hif1a, mTOR, Pik3cd, Rheb, Rps6kb1
miR-214 1.06 Akt2, Akt3, Ulk1, Eif4b, Igf1, Cab39, Pik3cb, Pik3r3, Rictor, Rps6ka1, Vegfa
miR-222 1.61 Prkaa2, Pik3r1, Ddit4, Rps6kb1, Tsc2
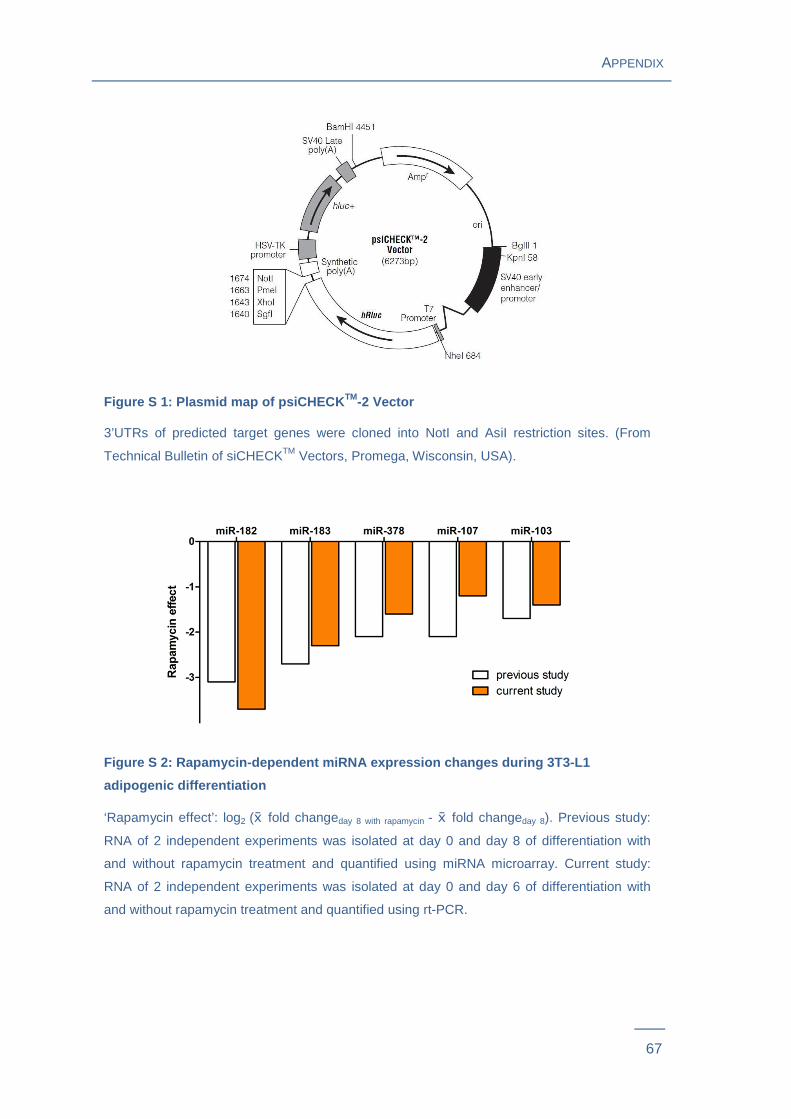
APPENDIX
67
Figure S 1: Plasmid map of psiCHECK TM-2 Vector
3’UTRs of predicted target genes were cloned into NotI and AsiI restriction sites. (From
Technical Bulletin of siCHECKTM Vectors, Promega, Wisconsin, USA).
Figure S 2: Rapamycin-dependent miRNA expression ch anges during 3T3-L1
adipogenic differentiation
‘Rapamycin effect’: log2 ( fold changeday 8 with rapamycin - fold changeday 8). Previous study:
RNA of 2 independent experiments was isolated at day 0 and day 8 of differentiation with
and without rapamycin treatment and quantified using miRNA microarray. Current study:
RNA of 2 independent experiments was isolated at day 0 and day 6 of differentiation with
and without rapamycin treatment and quantified using rt-PCR.
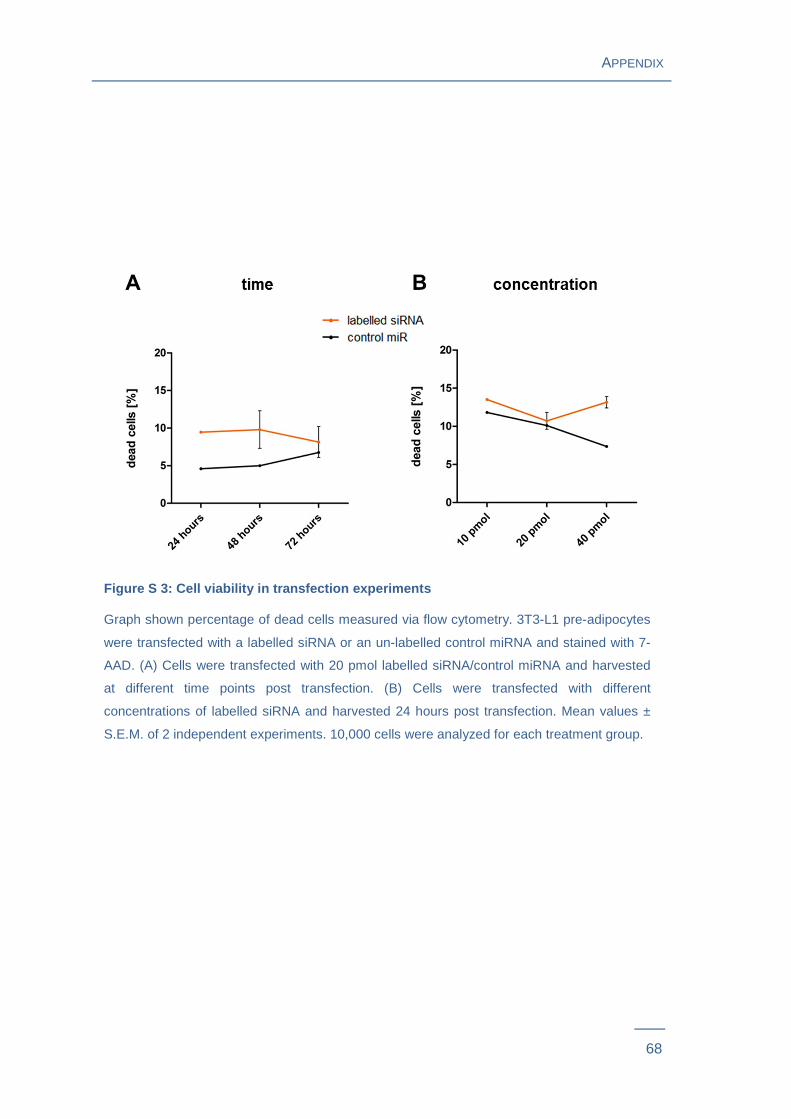
APPENDIX
68
Figure S 3: Cell viability in transfection experime nts
Graph shown percentage of dead cells measured via flow cytometry. 3T3-L1 pre-adipocytes
were transfected with a labelled siRNA or an un-labelled control miRNA and stained with 7-
AAD. (A) Cells were transfected with 20 pmol labelled siRNA/control miRNA and harvested
at different time points post transfection. (B) Cells were transfected with different
concentrations of labelled siRNA and harvested 24 hours post transfection. Mean values ±
S.E.M. of 2 independent experiments. 10,000 cells were analyzed for each treatment group.
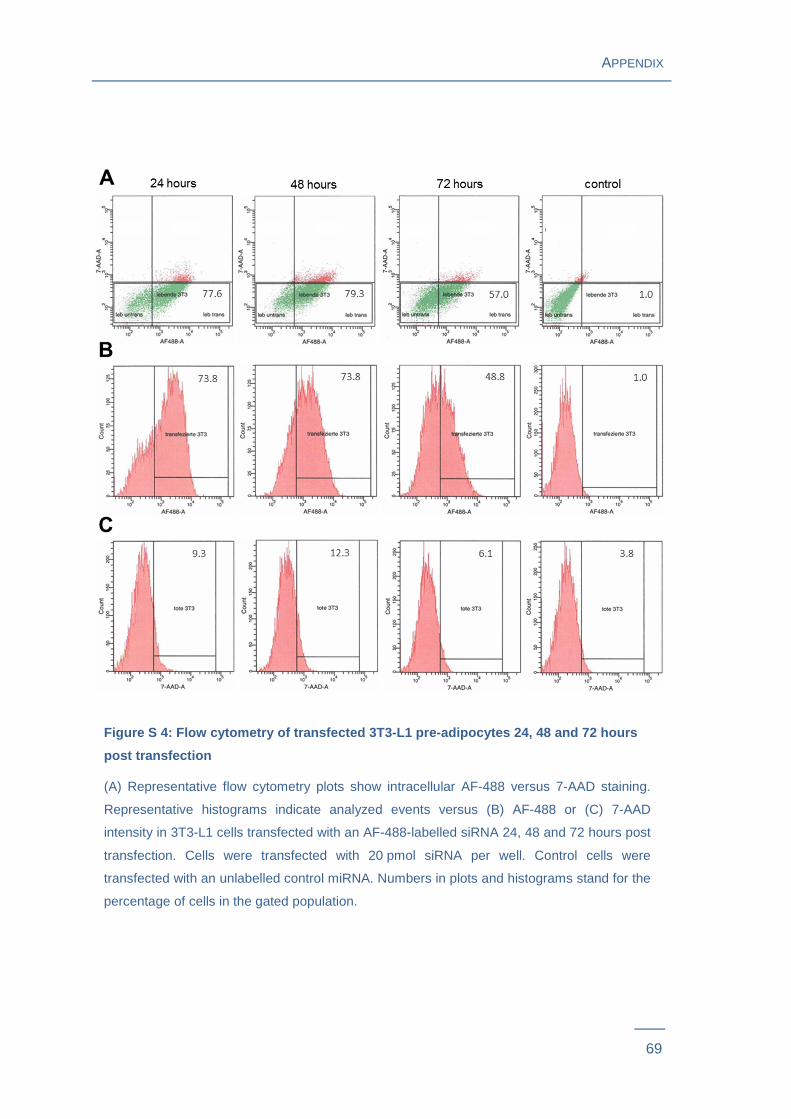
APPENDIX
69
Figure S 4: Flow cytometry of transfected 3T3-L1 pr e-adipocytes 24, 48 and 72 hours
post transfection
(A) Representative flow cytometry plots show intracellular AF-488 versus 7-AAD staining.
Representative histograms indicate analyzed events versus (B) AF-488 or (C) 7-AAD
intensity in 3T3-L1 cells transfected with an AF-488-labelled siRNA 24, 48 and 72 hours post
transfection. Cells were transfected with 20 pmol siRNA per well. Control cells were
transfected with an unlabelled control miRNA. Numbers in plots and histograms stand for the
percentage of cells in the gated population.
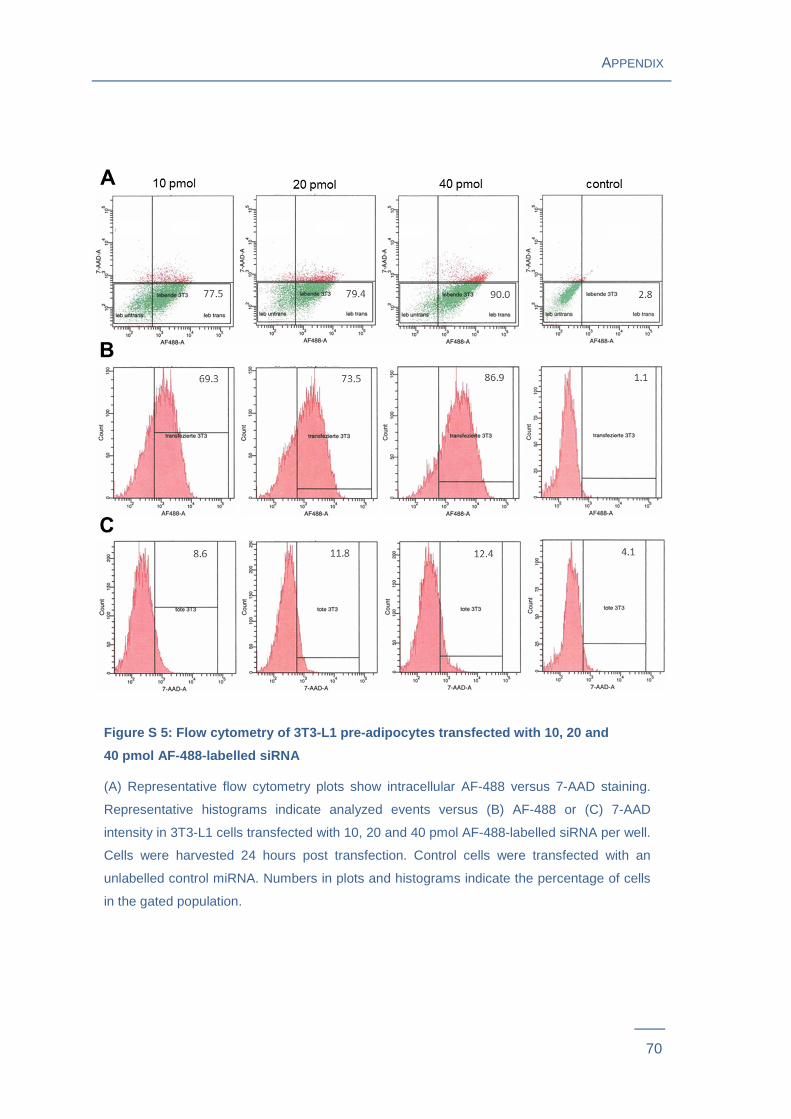
APPENDIX
70
Figure S 5: Flow cytometry of 3T3-L1 pre-adipocytes transfected with 10, 20 and
40 pmol AF-488-labelled siRNA
(A) Representative flow cytometry plots show intracellular AF-488 versus 7-AAD staining.
Representative histograms indicate analyzed events versus (B) AF-488 or (C) 7-AAD
intensity in 3T3-L1 cells transfected with 10, 20 and 40 pmol AF-488-labelled siRNA per well.
Cells were harvested 24 hours post transfection. Control cells were transfected with an
unlabelled control miRNA. Numbers in plots and histograms indicate the percentage of cells
in the gated population.
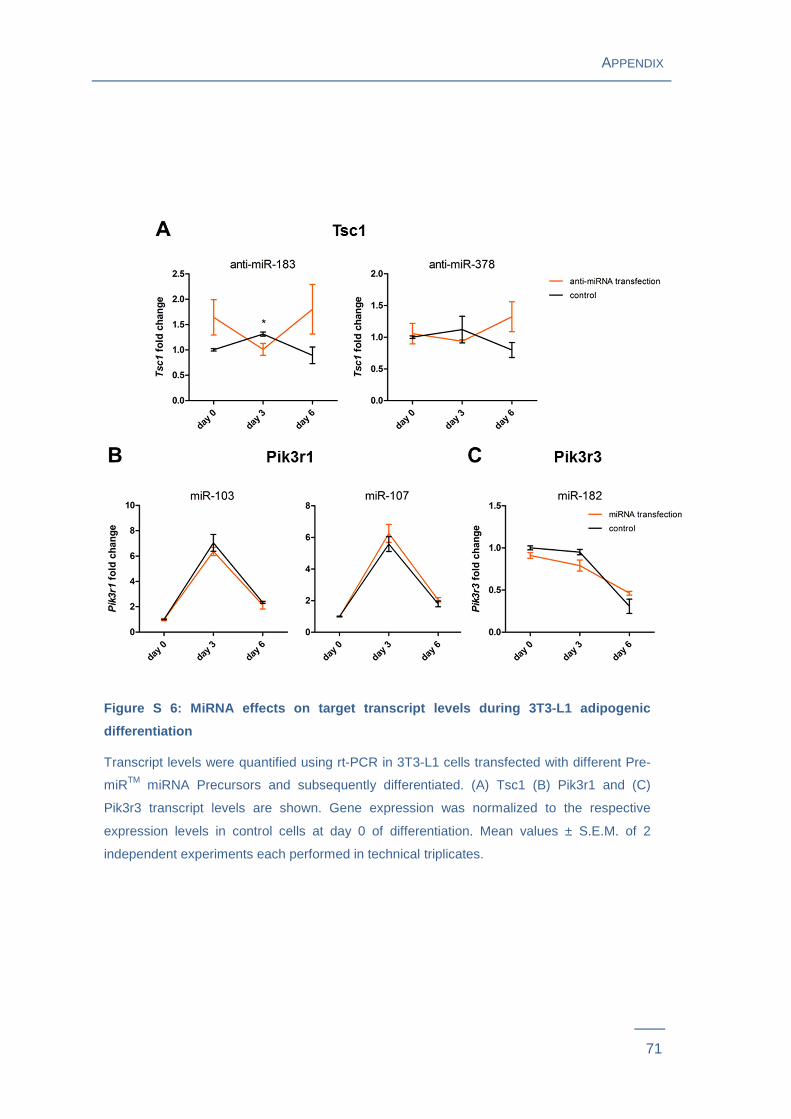
APPENDIX
71
Figure S 6: MiRNA effects on target transcript leve ls during 3T3-L1 adipogenic
differentiation
Transcript levels were quantified using rt-PCR in 3T3-L1 cells transfected with different Pre-
miRTM miRNA Precursors and subsequently differentiated. (A) Tsc1 (B) Pik3r1 and (C)
Pik3r3 transcript levels are shown. Gene expression was normalized to the respective
expression levels in control cells at day 0 of differentiation. Mean values ± S.E.M. of 2
independent experiments each performed in technical triplicates.
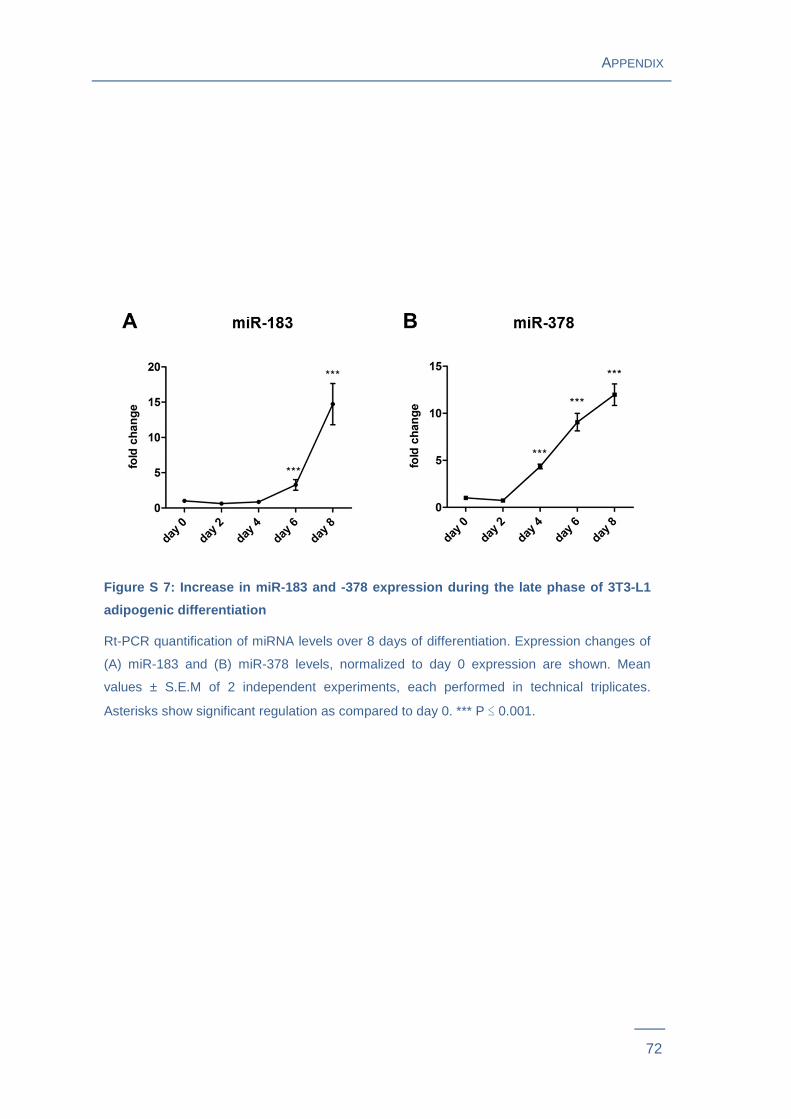
APPENDIX
72
Figure S 7: Increase in miR-183 and -378 expression during the late phase of 3T3-L1
adipogenic differentiation
Rt-PCR quantification of miRNA levels over 8 days of differentiation. Expression changes of
(A) miR-183 and (B) miR-378 levels, normalized to day 0 expression are shown. Mean
values ± S.E.M of 2 independent experiments, each performed in technical triplicates.
Asterisks show significant regulation as compared to day 0. *** P ≤ 0.001.
APPENDIX
73
2. List of abbreviations
7-AAD 7-amino-actinomycin D
Actb beta actin
Akt v-akt murine thymoma viral oncogene
(c)AMP (cyclic) adenosine monophosphate
Ampk AMP-activated protein kinase (gene name Prkaa2)
bp base pair
BMI Body Mass Index
BSA bovine serum albumin
Cab39 calcium binding protein39
C/ebp CCAAT/enhancer binding protein
Ddit DNA-damage-inducible transcript
Dlk1 delta-like 1 homolog
DMEM Dulbecco’s Modified Eagle Medium
DMSO dimethyl sulfoxide
DNA deoxy ribonucleic acid
dNTP deoxy nucleoside triphosphate
DTT dithiothreitol
4Ebp1 eukaryotic translation initiation factor 4E binding protein 1
EDTA ethylenediaminetetraacetic acid
eIF4a/b/e/g eukaryotic translation initiation factor 4A/B/E/G
eIF4ebp1 eukaryotic translation initiation factor 4E binding protein 1
Exp-5 Exportin-5
FACS Fluorescence-activated cell sorting
FBS Fetal Bovine Serum
Fkbp12 FK506-binding protein 12
Gβl G-protein beta-subunit-like
Hif1 hypoxia inducible factor 1
Hprt hypoxanthine guanine phosphoribosyl transferase
IBMX 3-Isobutyl-1-methylxanthine
Igf insulin-like growth factor
KEGG Kyoto Encyclopedia of Genes and Genomes
LB-Amp100 Luria Bertani medium containing 100 µg/ml ampicillin
LDA Low density array
M Molar
APPENDIX
74
Mapk mitogen-activated protein kinase
miR/miRNA microRNA
mTOR mammalian target of rapamycin
mTORC1/2 mammalian target of rapamycin complex 1/2
PBS Phosphate buffered saline
Pfu Pyrococcus furiosus
Pho phosphate
Pik3r1 phosphatidylinositol 3-kinase regulatory subunit 1 (alpha)
Pik3r3 phosphatidylinositol 3-kinase regulatory subunit 3 (gamma)
Pparγ Peroxisome proliferator-activated receptor gamma
Ppib peptidylprolyl isomerase b (cyclophilin B)
Pref-1 pre-adipocyte factor-1
pre-miRNA precursor microRNA
pri-miRNA primary microRNA
Prkaa2 AMP-activated protein kinase alpha 2 catalytic subunit
Rheb Ras homolog enriched in brain
Rictor Rptor independent companion of mTOR complex 2
RISC RNA-induced silencing complex
Rn18s 18S ribosomal RNA
Rps6ka p90 ribosomal protein S6 kinase
Rps6kb p70 ribosomal protein S6 kinase
Rptor regulatory associated protein of mTOR complex 1
Rsk p90 ribosomal protein S6 kinase
RT Reverse Transcription
rt-PCR real-time PCR
S6k1 p70 ribosomal protein S6 kinase 1
SDS software Sequence Detection Systems software
SDS sodium dodecyl sulfate
TAE Tris-acetate-EDTA
TRIS Tris (hydroxymethyl)-aminomethan
Tsc1/2 tuberous sclerosis protein 1/2
Ube2d2 ubiquitin-conjugating enzyme E2D2A
Ulk Unc-51like kinase
UTR untranslated region
Vegfa vascular endothelial growth factor A

APPENDIX
75
3. Curriculum vitae and publications
Education
2010-2015 Ludwig-Maximilians Universität München
Degree: Dr. rer. nat. (expected)
2004-2009 Technische Universität München, Weihenstephan
Degree: Diploma (Dipl. biol.)
1995-2004 Deutschherren-Gymnasium Aichach
Degree: Abitur
Experience
2013-present Klinikum der Ludwig-Maximilians Universität München
BMBF project »Towards newborn screening for primary
immunodeficiencies«
Skills
LMUexcellent: Program of the Center for Leadership and People Management:
»Exzellent führen. Führend forschen.«
GWT Gesellschaft für wissenschaftlichen Tierschutz: Versuchstierkundlicher Kurs
FELASA Kategorie C
Graduate Center of LMU workshops: Presentation skills, Communication and Teams,
Project Management, Scientifc Writing, Writing Proposals
Publications
Kaeuferle T., Osswald A., Fleischmann K.K., Pagel P., v. Frowein J., Krauss-
Etschmann S., Roscher A.A., Identification of microRNAs involved in mTOR nutrient
signaling during adipogenesis in JABB 2394-1081,Vol.: 2, Issue.: 2
Kaeuferle T., Bartel S., Dehmel S., Krauss-Etschmann S., MicroRNA methodology:
advances in microRNA technologies in Methods Mol Biol. 1169: 121-30, 2014

APPENDIX
76
4. Acknowledgements
Without the support, encouragement and guidance of the following people, this
dissertation would not have been completed.
Firstly, I would like to acknowledge the help and support of my supervisors Prof. Dr.
Adelbert Roscher and PD Dr. Susanne Krauss-Etschmann on this research program.
Thank you for giving me the scientific freedom to follow my own ideas. I am also very
thankful to Prof. Klaus Förstemann for being my “Fachvertreter”.
Further, I would like to thank all the present and past members of Krauss-Etschmann
and Oncology Research Group for all the enlightening discussions we had in lab
meetings. Thanks Gaby Heilig and Conny Dalibor for your commitment in endless
numbers of PCRs and RNA isolations. Specifically, I would like to thank Manish Aneja,
Inge Kepert and Katrin Fleischmann for being wonderful lab colleagues. Thanks Manish
for your insight and discussions on several research topics and lab instrumentation as
well as your helpful advice for every life situation. Thanks Inge for cheering me up in
times of frustration and thanks Katrin for your grand help with the publication.
I want to thank my family for their love and support, but also their patience during times
when I was occupied with work. I want to thank with all my heart my brother Uli and his
wife Mony, they always helped me to find inner peace and the will power to go on in
times of frustration.
But life is more than science. Therefore special thanks goes to all members of the
“Held”-family for supporting me by taking over all work and training of my horse in times
of ‘deadlines’ and work overload. Sincere thanks to Heiner, who created an excellent,
funny, exciting and thrilling world full of sporty challenges for me. Thanks Renate for
your flexibility and numerous spontaneous dressage lessons around lab times, without
those international competitions would not have been possible. You all provided a
perfect counterbalance to academic life.
Lastly I would like to acknowledge my funding and graduate program
“Graduiertenkolleg 1202” for their financial support and the opportunities for further
trainings and skill enhancement. Thanks to all GraKo members for crazy evenings at
Corleone pub and amazing trips to retreats and workshops. I will miss you all.