Embed Size (px)
Citation preview
DMD #69112
Page 1
Identification of three novel ring expansion metabolites of KAE609, a new spiroindolone agent for the treatment of malaria, in rat, dog, and human
Su-Er W. Huskey, Chun-qi Zhu, Melissa M. Lin, Ry R. Forseth, Helen Gu, Oliver Simon, Fabian K. Eggimann, Matthias Kittelmann, Alexandre Luneau, Alexandra Vargas, Hongmei Li, Lai Wang, Heidi J. Einolf, Jin Zhang, Sarah Favara, Handan He, and James B. Mangold
Drug Metabolism and Pharmacokinetics, Novartis Institutes for BioMedical Research, East Hanover, NJ (SH, CZ, RF, HG, HL, LW, HE, JZ, SF, HH and JM); Technical Research and Technology, Novartis Pharma (ML); Novartis Institute for Tropical Diseases, Singapore (OS); and Global Discovery Chemistry, Bioreactions group, Novartis Institutes for BioMedical Research at Basel, Switzerland (FE, MK, AL, and AV).
This article has not been copyedited and formatted. The final version may differ from this version.DMD Fast Forward. Published on February 26, 2016 as DOI: 10.1124/dmd.115.069112
at ASPE
T Journals on July 24, 2018
dmd.aspetjournals.org
Dow
nloaded from
DMD #69112
Page 2
Running Title
Ring expansion metabolites of KAE609 (a spiroindolone)
Corresponding Author
Su-Er Wu Huskey
Novartis Institutes for BioMedical Research, One Health Plaza, East Hanover, NJ 07936-1080
Telephone 862-778-0940
Fax 973-781-5023
E-mail Address [email protected]
Text pages 27
Tables 2
Figures 7
References 24
Words in Abstract 255
Words in Introduction 577
Words in Discussion 1026
This article has not been copyedited and formatted. The final version may differ from this version.DMD Fast Forward. Published on February 26, 2016 as DOI: 10.1124/dmd.115.069112
at ASPE
T Journals on July 24, 2018
dmd.aspetjournals.org
Dow
nloaded from
DMD #69112
Page 3
Abbreviations:
KAE609, (1'R,3'S)-5,7'-dichloro-6'-fluoro-3'-methyl-2',3',4',9'-tetrahydrospiro[indoline-3,1'-
pyridol[3,4-b]indol]-2-one; KAE579, (1'R,3'S)-5-chloro-6'-fluoro-3'-methyl-2',3',4',9'-
tetrahydrospiro[indoline-3,1'-pyridol[3,4-b]indol]-2-one; ADME, absorption, distribution,
metabolism and excretion; AUC, area under concentration-time curve; Cmax, the observed
maximum concentration in blood or plasma following drug administration; COSY; correlation
spectroscopy; DQF-COSY, double quantum filter correlation spectroscopy; E. coli, Escherichia
coli; PCT, parasite clearance time; FIH, first in human; HMBC, heteronuclear multiple bond
correlation; HPLC, high performance liquid chromatography; HSQC, heteronuclear single
quantum coherence; i.v., intravenous; LC-MS/MS, liquid chromatography-tandem mass
spectrometry; LSC, liquid scintillation counting; μCi, microcurie; NOESY, nuclear Overhauser
effect spectroscopy; OD600nm, optical density at 600 nm; PK, pharmacokinetics; QC, quality
control; ROESY, rotational frame nuclear Overhauser effect spectroscopy; TOCSY, total
correlation spectroscopy; t1/2, the terminal elimination half-life; tmax, the time to reach the
maximum concentration after drug administration.
.
This article has not been copyedited and formatted. The final version may differ from this version.DMD Fast Forward. Published on February 26, 2016 as DOI: 10.1124/dmd.115.069112
at ASPE
T Journals on July 24, 2018
dmd.aspetjournals.org
Dow
nloaded from
DMD #69112
Page 4
Abstract
KAE609 is a potent, fast-acting, schizonticidal agent being developed for the treatment of
malaria. Following oral dosing of KAE609 to rats and dogs, the major radioactive component in
plasma was KAE609. An oxidative metabolite, M18, was the prominent metabolite in rat and
dog plasma. KAE609 was well absorbed and extensively metabolized such that low levels of
parent compound (≤ 11% of the dose) were detected in feces. The elimination of KAE609 and
metabolites was primarily mediated via biliary pathways (≥ 93% of the dose) in the feces of rats
and dogs. M37 and M23 were the major metabolites in rat and dog feces, respectively. Amongst
the prominent metabolites of KAE609, the isobaric chemical species, M37, was observed,
suggesting the involvement of an isomerization or rearrangement during biotransformation.
Subsequent structural elucidation of M37 revealed that KAE609, a spiroindolone, undergoes an
unusual C-C bond cleavage, followed by a 1, 2-acyl shift to form a ring expansion metabolite
M37. The in vitro metabolism of KAE609 in hepatocytes was investigated to understand this
novel biotransformation. The metabolism of KAE609 was qualitatively similar across the species
studied, thus further investigation was conducted using human recombinant CYP enzymes. The
ring expansion reaction was found to be primarily catalyzed by CYP3A4 yielding M37. M37
was subsequently oxidized to M18 by CYP3A4, and hydroxylated to M23 primarily by
CYP1A2. Interestingly, M37 was colorless while M18 and M23 showed orange yellow color.
The source of the color of M18 and M23 was attributed to their extended conjugated system of
double bonds in the structures.
This article has not been copyedited and formatted. The final version may differ from this version.DMD Fast Forward. Published on February 26, 2016 as DOI: 10.1124/dmd.115.069112
at ASPE
T Journals on July 24, 2018
dmd.aspetjournals.org
Dow
nloaded from
DMD #69112
Page 5
Introduction
Malaria is one of the leading causes of death and disease worldwide, especially among young
children in developing countries. Drug resistance to widely used artemisinin-based therapies
(Carter et al., 2015; Holt et al., 2015) has become an imminent issue since drug resistance strains
were identified in Bangladesh, Cambodia, Thailand, Vietnam, Myanmar and Laos (Hague et al.,
2013; Na-Bangchang and Karbwang, 2013; Witkowski et al., 2013). Growing global efforts are
focusing on finding new cures to combat malaria drug resistance.
KAE609 (Figure 1;Yeung et al., 2010), a spiroindolone, represents a new class of potent, fast-
acting, schizonticidal agents for the treatment of malaria (Rottmann et al., 2010; Meister et al.,
2011; Spillman et al., 2013). More recently, KAE609 was shown to be safe and well-tolerated in
healthy subjects up to a single dose of 300 mg and multiple doses of 150 mg daily for 3 days
(Leong et al., 2014). Evaluation in 21 adult patients with uncomplicated malaria due to either P.
vivax (n=10) or P. falciparum (n=11) showed that once daily dosing of KAE609 at 30 mg for 3
days resulted in a rapid median parasite clearance time (PCT) of approximately 12 h for both P.
vivax and P. falciparum. (White et al., 2014).
In preparation for the clinical investigations described above, efforts were undertaken to
understand in vitro metabolism of KAE609 across species as well as absorption, distribution
metabolism and excretion (ADME) of KAE609 in pre-clinical species. Following oral dosing,
KAE609 was the major component in plasma. An oxidative metabolite, M18, was the major
This article has not been copyedited and formatted. The final version may differ from this version.DMD Fast Forward. Published on February 26, 2016 as DOI: 10.1124/dmd.115.069112
at ASPE
T Journals on July 24, 2018
dmd.aspetjournals.org
Dow
nloaded from
DMD #69112
Page 6
metaboliteb in rat and dog plasma, while M37 and M23 were the major metabolites in rat and dog
feces, respectively. Based on LC-MS/MS analysis, M37 shared the same molecular weight with
KAE609, suggesting M37 was a product of isomerization or rearrangement of KAE609 during
biotransformation. Therefore, the structural elucidation of M37 was undertaken to facilitate the
understanding of this unusual biotransformation. During purification of M37 from rat feces, two
brightly colored yellow fractions were identified corresponding to M18 and M23. The strategies
and approaches we used in the elucidation of structures of M18 and M23 and the metabolic
pathways of KAE609 are described herein.
In parallel to the in vivo studies above, in vitro across species metabolism of KAE609 revealed
that M23 was a prominent metabolite in human hepatocytes. Based on the preclinical ADME
studies, M23 was not detected in rat or dog plasma although M23 was the major metabolite in
dog excreta. In view of MIST and ICH guidance (Baillie et al., 2002 and 2008; Smith and Obach,
2009; Guidance for industry, 2008, 2010, and 2012), we describe herein the strategy we used
regarding the potential exposure coverage of M23 in humans.
In this article, we describe the strategies and approaches used in the structural elucidation of
three key metabolites of KAE609, investigation of the CYP enzymes involved in a novel ring
expansion reaction of KAE609 to generate metabolite M37 and subsequent formation of
oxidative highly colored metabolites from M37. To the best of our knowledge, this is the first
report that revealed the ring expansion of a spiroindolone and generation of two colored
metabolites (M18 and M23) from a colorless precursor metabolite (M37) by a single CYP
catalyzed oxidation reaction. All these three metabolites (M37, M18 and M23) showed no
pharmacological activity after the spiroindolone core of KAE609 was lost by biotransformation.
This article has not been copyedited and formatted. The final version may differ from this version.DMD Fast Forward. Published on February 26, 2016 as DOI: 10.1124/dmd.115.069112
at ASPE
T Journals on July 24, 2018
dmd.aspetjournals.org
Dow
nloaded from
DMD #69112
Page 7
bNomenclature of metabolites was based on their HPLC elution time in the study in which they
were first identified.
This article has not been copyedited and formatted. The final version may differ from this version.DMD Fast Forward. Published on February 26, 2016 as DOI: 10.1124/dmd.115.069112
at ASPE
T Journals on July 24, 2018
dmd.aspetjournals.org
Dow
nloaded from
DMD #69112
Page 8
Materials and Methods
Chemicals
KAE609, KAE579, compound 1 (M37), compound 2 (M18), and compound 3 (M23) were
synthesized by Novartis Institute for Tropical Diseases and compound 3 (M23) was also
prepared by Global Discovery Chemistry, Bioreactions group. [14C]KAE609 was prepared by
Novartis Isotope laboratories and radiochemical purity was >99%.
Microsomal preparations from baculovirus-infected insect cells expressing recombinant human
CYP enzymes [co-expressed with P450 oxidoreductase (OR)]: CYP1A1, CYP1A2, CYP1B1,
CYP2C18, CYP2D6, CYP3A5 or CYP4A11, and recombinant human CYP enzymes [co-
expressed with P450 oxidoreductase and cytochrome b5 (cytb5)]: CYP2A6, CYP2B6, CYP2C8,
CYP2C9 (Arg144,Ile359), CYP2C19, CYP2E1, CYP2J2, CYP3A4, CYP4F2, CYP4F3A,
CYP4F3B or CYP4F12, as well as control CYP microsomes were purchased from Corning,
Discovery Labware. Hepatocytes culture plates were obtained from Corning Incorporated
(Corning, NY). Krebs-Henseleit maintenance medium (KHB), β-NADPH, dimethylsulfoxide
(DMSO), potassium phosphate (mono- and di-basic), MgCl2, sodium bicarbonate, fructose,
glycine, acetonitrile, methanol, ammonium formate, and formic acid were purchased from
Sigma-Aldrich (St. Louis, MO). OPTI-FLUOR liquid scintillant was purchased from Packard
(Downers Grove, IL). Control blank plasma samples from rat and dog were purchased from
Bioreclamation (Hicksville, NY).
Chemical synthesis of metabolites
Chemical synthesis of M37 (compound 1), M18 (compound 2), and M23 (compound 3) was
carried out for structural confirmation and additional biological profiling. A detailed description
This article has not been copyedited and formatted. The final version may differ from this version.DMD Fast Forward. Published on February 26, 2016 as DOI: 10.1124/dmd.115.069112
at ASPE
T Journals on July 24, 2018
dmd.aspetjournals.org
Dow
nloaded from
DMD #69112
Page 9
of the preparation and characterization of the metabolites can be found in the Supplemental
Methods.
Biocatalytic synthesis of compound 3 (M23)
Preparation of biocatalyst: The bioctalyst, Escherichia coli (E. coli) expressing recombinant
human CYP1A2, was prepared as described in Kittelmann et al., 2012.
Biotransformation, preparative conditions (Compound 3, M23)
In a 400 mL polyethylene flask 40 mL of cell suspension (OD600nm =100) in PSE-buffer
(potassium phosphate 50 mM, sucrose 250 mM, and EDTA 0.25 mM, pH 7.5) were mixed with
10 mL of NaCl solution 0.9 % and 5 mL of nutrient solution (40 g/L glucose, 40 g/L lactose, 60
g/L sodium citrate aq.) The biotransformation was initiated by adding the substrate solution,
containing 2 mg of compound 2 (M18) dissolved in 2.5 mL of acetonitrile. The reaction was
incubated with open cap at 30°C and 250 rpm for 16 h in an orbital shaker.
Purification of biotransformation product (compound 3)
After incubation, the reaction was mixed with 5 g of sodium chloride and extracted three times
with 100 mL of ethyl acetate. The combined organic layers were mixed and evaporated to
dryness under reduced pressure. The residual raw product was dissolved in 3 mL acetonitrile and
injected to a 250 x 10 mm Nucloeodur 100-10 C18 ec column (Macherey-Nagel, Düren,
Germany). The conditions for preparative HPLC were: Solvent A, 0.05% trifluoroacetic acid in
water; solvent B, acetonitrile; gradient, 0-5 min 10%B, 5-48 min 10% to 95%B, 48-53 min
100%B; flow rate of 4.5 mL/min; room temperature; UV detection at 320 nm; fraction size 2 mL.
The product eluted between 40 and 50%B. The product containing fractions were combined and
dried by Speedvac lyophilization overnight. The product, 1 mg, was obtained with > 95% purity
This article has not been copyedited and formatted. The final version may differ from this version.DMD Fast Forward. Published on February 26, 2016 as DOI: 10.1124/dmd.115.069112
at ASPE
T Journals on July 24, 2018
dmd.aspetjournals.org
Dow
nloaded from
DMD #69112
Page 10
(HPLC/full diode Array Detector) and analyzed by NMR spectroscopy. The isolated yield was
46%.
In vitro incubations
To identify the CYP enzyme(s) involved in the metabolism of KAE609 or M18 (compound 2)
in humans, test compound (44 μM[14C]KAE609 or 50 μM compound 2) was incubated with 19
commercial available recombinant human P450 enzymes (listed in chemicals section), or control
microsomes in 100 mM potassium phosphate buffer (pH 7.4) containing 5 mM MgCl2. The
reactions were thermo-equilibrated for 3 min at 37°C and initiated by the addition of 1 mM β-
NADPH. The reactions were incubated for 30 min at 37°C and were quenched by the addition of
an equal volume of cold acetonitrile. After vortex-mixing and centrifugation, an aliquot of each
sample was analyzed by LC-MS/MS.
Animals
Male Wistar Hannover rats (~227-310 g, n=12) were purchased from Harlan Laboratories (South
Easton, MA). Catheters were surgically implanted into the carotid artery and/or jugular vein of
rats by the vendor (only one catheter was implanted into carotid artery for blood collection from
rats receiving oral dose). All rats were housed individually in Culex metabolism cages (Culex
Autosampler, BAS, Indianapolis, IN) in a temperature and humidity (22 ± 2°C; 50 ± 15%)
controlled room with free access to food and water (food was withheld until 4 h post-dose).
Male beagles (~10-14 kg, n=5) were purchased from Marshall farms (North Rose, NY) and kept
in animal facility at Novartis for Pharmacokinetics (PK) and ADME studies. The dogs were
housed individually in a temperature and humidity controlled room. Dogs were acclimated to the
This article has not been copyedited and formatted. The final version may differ from this version.DMD Fast Forward. Published on February 26, 2016 as DOI: 10.1124/dmd.115.069112
at ASPE
T Journals on July 24, 2018
dmd.aspetjournals.org
Dow
nloaded from
DMD #69112
Page 11
metabolism cages one night prior to dosing. Dogs had free access to water and were given food
once daily (food was withheld until 2 h post-dose).
Dose administration
All doses were based on the individual body weights of animals on the day of dosing.
[14C]KAE609 (specific activity 40 μCi/mg at 5 mg/kg for rats; and 50 μCi/mg at 1 mg/kg for
dogs) was dissolved in ethanol, polyethylene glycol (PEG300) and pluronic F68 (5% in water)
(10:20:70, v/v/v) for intravenous (i.v.) dosing. [14C]KAE609 (specific activity 20 μCi/mg at 10
mg/kg) was prepared in solution containing 1N HCl (0.28%), solutol HS 15 (5%), 50 mM citrate
buffer pH 3 (94.7%) for oral doing to rats. [14C]KAE609 (specific activity 16.7 μCi/mg at 3
mg/kg) was prepared in suspension containing 0.5% (w/v) methyl cellulose (MC) and 2% solutol
HS 15 in water for oral dosing to dogs.
Each rat received an i.v. bolus injection via the jugular vein cannula. Each dog received i.v. slow
bolus injection via the cephalic vein. Oral dose was administered by gavage in both rat and dog.
Blood Collection
Blood samples (200 µL) were collected from the carotid artery of rats at selected time intervals
in Culex tubes. Saline (200 µL) was automatically injected after sample was collected to clear
the cannula and replace the volume of blood samples. Blood samples were collected via
catheters placed in the cephalic vein of each dog at selected time intervals. The total blood
volume collected did not exceed 1% of the body weights of rat and dog.
Urine and feces collection
This article has not been copyedited and formatted. The final version may differ from this version.DMD Fast Forward. Published on February 26, 2016 as DOI: 10.1124/dmd.115.069112
at ASPE
T Journals on July 24, 2018
dmd.aspetjournals.org
Dow
nloaded from
DMD #69112
Page 12
Urine and feces were collected daily from each of the animals for 7 days. Up to 3 days the urine
collection tubes were cooled with ice. After the final collection, each cage was rinsed with water
followed by 50% methanol. The cage wash was assayed for radioactivity. Urine and feces
samples were stored at -20 °C until analysis.
Sample preparation
The plasma was obtained by centrifugation of blood samples at 4°C (2000 x g) for 10 min. An
aliquot of each blood sample was used for radioactivity analysis (see sample analysis section).
An aliquot of plasma sample was counted directly for radioactivity. The remaining plasma
samples were stored at -20 °C until analysis.
Plasma for the quantification of KAE609
Blank plasma and study samples were thawed at room temperature. Standards and quality control
(QC) samples were prepared on the day of analysis by adding appropriate standard or QC (25 µL)
spiking solution to 475 µL of blank plasma. Samples were loaded using a Sirocco protein
precipitation plate which was attached above a 1 mL 96-well assay plate. An aliquot (25 µL) of
study samples, blanks, standards or QC samples was added to the appropriate well followed by
the addition of acetonitrile (100 μL) and the internal standard (KAE579; 25 µL, 500 ng/mL) to
each well. Samples were mixed for 5 min and centrifuged at 2500 rpm for 15 min at 25 ºC. The
filtrate was evaporated to dryness at ~45ºC under a stream of nitrogen (TurboVap LV; Zymark
Corp., Taunton, MA). The residues were reconstituted with 300 µL of acetonitrile:water:formic
acid (10:90:0.1, v/v/v). An aliquot (10 µL) was analyzed for KAE609 and KAE579 by LC-
MS/MS.
Plasma and fecal homogenates for metabolic profiling of KAE609
This article has not been copyedited and formatted. The final version may differ from this version.DMD Fast Forward. Published on February 26, 2016 as DOI: 10.1124/dmd.115.069112
at ASPE
T Journals on July 24, 2018
dmd.aspetjournals.org
Dow
nloaded from
DMD #69112
Page 13
All plasma samples were thawed at room temperature and a 150 µL aliquot was pooled from
each animal at each time point. Each plasma pool was diluted with 250 μL water and extracted
with 2 mL of acetonitrile:methanol:acetic acid (50:50:0.1, v/v/v). Fecal samples (5% and 1% by
weight from rat and dog feces, respectively) were pooled from fecal homogenate prepared from
rats during 0-96 h postdose and from dogs 0-72 h postdose. The resulting pooled fecal samples
were extracted three times with 3 volumes of acetonitrile:methanol:acetic acid (50:50:0.1, v/v/v).
After centrifugation at 3,500 x rpm for 10 min, the supernatants were combined and concentrated
under a stream of nitrogen. Residues were reconstituted with acetonitrile:deionized water (50/50,
v/v). The recoveries of radioactivity from rat feces were 63.4% (i.v.) and 64.1% (oral), and from
dog feces were 60.7% (i.v.) and 66.7% (oral), respectively.
Sample Analysis
Determination of radioactivity
The radioactivity of all samples was determined by liquid scintillation counting (LSC). For
quench correction an external standard ratio method was used. Quench correction curves were
established by means of sealed standards. An aliquot of plasma and urine samples were counted
directly for radioactivity.
Solvable (500 μL) was added to each blood sample and incubated in a shaking water bath at
50°C for 2 h. After incubation, 50 µL of 100 mM EDTA as an anti-foaming agent and 200 µL of
30% hydrogen peroxide were added to decolorize the samples. The sample vials were loosely
capped and returned to the water bath for 3 h. Thereafter, 10 mL of Formula 989 scintillation
This article has not been copyedited and formatted. The final version may differ from this version.DMD Fast Forward. Published on February 26, 2016 as DOI: 10.1124/dmd.115.069112
at ASPE
T Journals on July 24, 2018
dmd.aspetjournals.org
Dow
nloaded from
DMD #69112
Page 14
cocktail was added and the samples were placed in the dark overnight to reduce
chemiluminescence prior to counting for radioactivity.
Fecal samples from animals were homogenized with 2 or 3 volume of water. Duplicate samples
(~100 mg) of the slurry were weighed into scintillation vials and processed as described above
for blood samples prior to radioactivity determination. The remaining fecal homogenate was
stored frozen at -20°C until LC-MS/MS analysis.
Quantification of KAE609 by LC-MS/MS
Samples were analyzed on an LC-MS/MS system consisting of a Shimadzu HPLC System and
Sciex API4000 mass spectrometer using Analyst software version 1.4.2 (Foster City, CA, USA).
The mass spectrometer was operated in the positive ion mode, using turbo spray ionization, with
a source temperature of 425° C. Chromatographic separation was carried out on a Mac-Mod
Analytical ACE 5 C8 50 x 2.1 mm column. KAE609 and the internal standard (KAE579, Figure
1) were eluted using a gradient method with a mobile phase consisting of A: water containing 0.1%
formic acid; and B: acetonitrile containing 0.1% formic acid. The gradient was 35%B for 0.5
min; increased to 90%B from 0.5 to 2 min; followed by a 1 min hold at 90%B. The multiple
reaction monitoring (MRM) transitions for KAE609 and KAE579 were m/z 390.2 to m/z 347.1,
and m/z 356.2 to m/z 313.1, respectively.
Calibration curves were generated by plotting the respective peak area ratios (y) of KAE609 to
the internal standard versus the concentrations (x) of the calibration standards using weighted
1/x2 quadratic least-squares regression. The quantification was performed using Analyst
software and Watson LIMS version 7.2.0.01. Concentrations in QC and study samples were
calculated from the resulting peak area ratios and interpolation from the regression equations of
the calibration curves. The lower limit of quantification was 1.0 ng/mL.
This article has not been copyedited and formatted. The final version may differ from this version.DMD Fast Forward. Published on February 26, 2016 as DOI: 10.1124/dmd.115.069112
at ASPE
T Journals on July 24, 2018
dmd.aspetjournals.org
Dow
nloaded from
DMD #69112
Page 15
Metabolic profiling by LC-MS/MS
Metabolic profiling was performed on a Waters Acquity UPLC System (Waters Corp., Milford,
MA), equipped with an autosampler and a quaternary pump, and an on-line radioactivity monitor
(β-RAM) or a fraction collector. Chromatographic separation was carried out on a Mac-Mod
Analytical Zorbax SB-C18 150 x 3.0 mm, 3.5 μm column. KAE609 and the metabolites were
eluted using a linear gradient method with a mobile phase consisting of A: 5 mM ammonium
acetate containing 0.1% formic acid; and B: acetonitrile/methanol (1:1, v/v) containing 0.1%
formic acid. The gradient was 5%B for 5 min; increased to 50%B from 5 to 12 min; increased to
60%B from 12 to 30 min; increased to 75%B from 30 to 40 min; increased to 85%B from 40 to
45 min; increasedto 98%B from 45 to 50 min; followed by a 3 min hold at 98%B.
The HPLC column eluent was split 1:4 (MS/fraction collector or MS/β-RAM). The eluent from
the fraction collector was mixed with methanol (0.5 mL/min) and collected directly into 96-
Deepwell LumaPlates coated with solid scintillant at 0.15 min/well using a Fraction collector.
The plates were dried at 40°C under a stream of nitrogen. The plates were counted for 10-15
min/well in a TopCount Model NXT radioactivity detector. On-line monitoring with β-RAM
employed a 250 µL liquid cell and eluent was mixed with 1 mL/min IN-Flow 2:1 (IN/US
Systems, Tampa, FL) liquid scintillant. The resulting data were processed using the Laura™
Data System (LabLogic, Inc., ver. 4.0). All quantification was based on the radioactivity
associated with the chromatographic peaks.
Online hydrogen/deuterium (H/D) exchange LC/MS-MS method
Hydrogen/deuterium (H/D) exchange LC/MS experiments were conducted. In these experiments,
water was substituted with deuterium oxide (D2O) in the HPLC mobile phase (A: 5 mM
This article has not been copyedited and formatted. The final version may differ from this version.DMD Fast Forward. Published on February 26, 2016 as DOI: 10.1124/dmd.115.069112
at ASPE
T Journals on July 24, 2018
dmd.aspetjournals.org
Dow
nloaded from
DMD #69112
Page 16
ammonium formate in D2O containing 0.1 % formic acid). Samples were analyzed under the
identical LC-MS/MS method, as described below.
LC-MS instrumentation and operating conditions
The structural characterization of metabolites was carried out using the above HPLC profiling
method coupled to a two-channel Z-spray (LockSprayTM) Waters Synapt G2S quadrupole time-
of-flight mass spectrometer. The Q-TOF Synapt was operated in V-mode with a typical resolving
power of at least 10,000. Qualitative analyses were carried out using electrospray ionization
(ESI) in the positive ionization mode using a lock spray source. Leucine enkephalin was used as
the mass reference standard for exact mass measurements and was delivered via the second spray
channel at a flow rate of 20 µL/min. Accurate mass LC/MS data was collected in an alternating
low energy (MS) and elevated energy (MSE) mode of acquisition. In low energy MS mode, data
was collected at consistent collision energy of 2 eV. In elevated MSE mode, collision energy
was ramped from 15 to 30 eV during data collection cycle.
NMR analysis of M37, M18 and M23
Detailed description of procedures for the isolation of metabolites from rat fecal extract can be
found in Supplemental Methods. 1H spectra were acquired for M37, M18 and M23 (dissolved in
acetonitrile-d3) as well as reference compounds 1, 2 and 3 (~100 μg, dissolved in acetonitrile-d3).
Selective NOESY data were acquired for M37 using a mixing time of 0.4 sec, 32k data point
collection over a spectral width of 12019 Hz, and 2048 scans. A line broadening factor of 1 Hz
was applied to the free induction decay data before Fourier transformation. Double quantum
filter correlation spectroscopy (DQF-COSY) spectrum was acquired for M23. NMR spectra were
This article has not been copyedited and formatted. The final version may differ from this version.DMD Fast Forward. Published on February 26, 2016 as DOI: 10.1124/dmd.115.069112
at ASPE
T Journals on July 24, 2018
dmd.aspetjournals.org
Dow
nloaded from
DMD #69112
Page 17
acquired on a Bruker DRX600 MHz spectrometer equipped with a 3 mm dual CryoProbe at 300
K. For the DQF-COSY spectrum, the 90° pulse (P1) was calibrated at a 1H transmitter power of
0.2 dB, and the following acquisition parameters were used: acquisition time = 0.7 s, complex
increments = 1024, and number of scans = 64. Spectra were processed in MestReNova. DQF-
COSY spectra were processed using 8k (f2) by 2k (f1) zero filling. Window functions were
applied to the raw FID; f2, sine bell; f1, square sine function.
Data Processing
Quantification of KAE609 and metabolites by radiometry
KAE609 and metabolites were quantified in the extracts by radiochromatography. Peaks were
selected visually from the radiochromatogram, and their corresponding areas were determined
via peak integration (LAURA).
The percent of radioactivity (PRA) in a particular peak, Z, was calculated as following:
The concentration or amount of each component was calculated as %PRA (as a fraction)
multiplied by the total concentration (ngEq/mL) or percent of dose in the excreta.
Pharmacokinetic parameters
The pharmacokinetic parameters were calculated using actual recorded sampling times and non-
compartmental method(s) with Phoenix (WinNonlin Version 6.2, Pharsight, Certara L.P., USA).
Concentrations below the lower limit of quantification (LLOQ) were treated as zero for PK
parameter calculations. The linear trapezoidal rule was used for AUC calculation. Regression
analysis of the terminal plasma elimination phase for the determination of t1/2 included at least 3
100 x peaks integrated allin DPM total
peak Zin DPM = in ZPRA %
This article has not been copyedited and formatted. The final version may differ from this version.DMD Fast Forward. Published on February 26, 2016 as DOI: 10.1124/dmd.115.069112
at ASPE
T Journals on July 24, 2018
dmd.aspetjournals.org
Dow
nloaded from
DMD #69112
Page 18
data points after Cmax. If the adjusted R2 value of the regression analysis of the terminal phase
was less than 0.75, no values were reported for t1/2, AUCinf, Vz/F and CL/F.
This article has not been copyedited and formatted. The final version may differ from this version.DMD Fast Forward. Published on February 26, 2016 as DOI: 10.1124/dmd.115.069112
at ASPE
T Journals on July 24, 2018
dmd.aspetjournals.org
Dow
nloaded from
DMD #69112
Page 19
Results
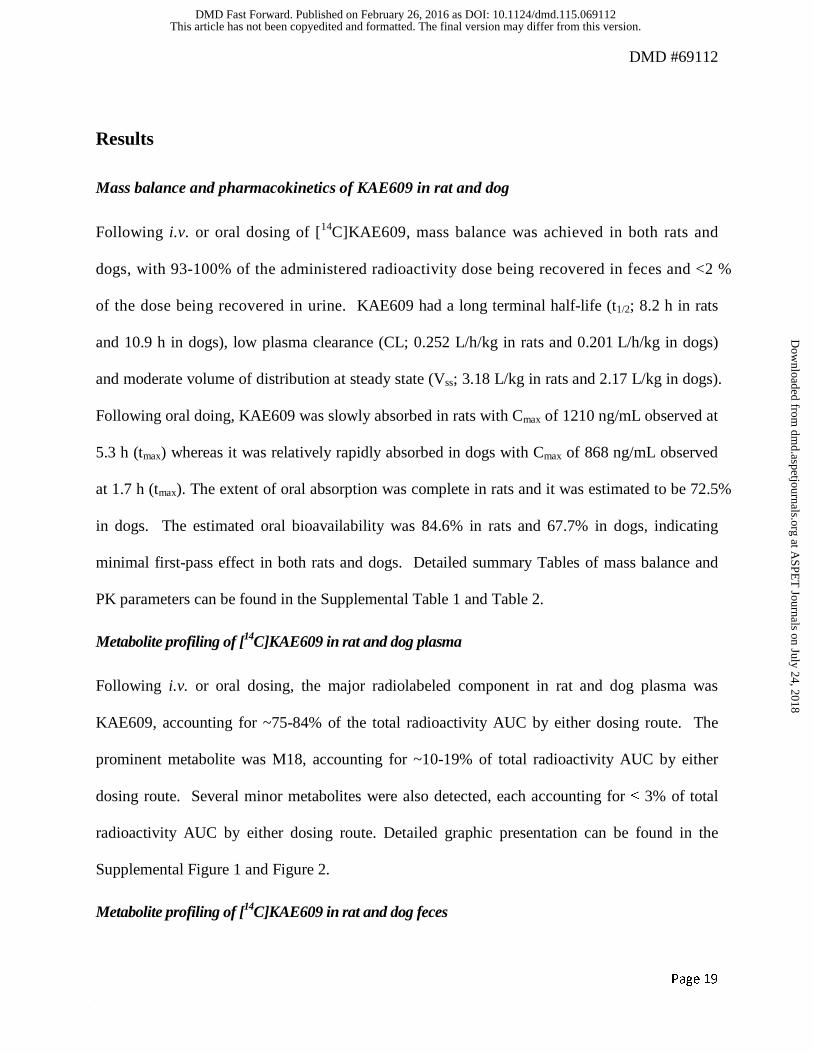
Mass balance and pharmacokinetics of KAE609 in rat and dog
Following i.v. or oral dosing of [14C]KAE609, mass balance was achieved in both rats and
dogs, with 93-100% of the administered radioactivity dose being recovered in feces and <2 %
of the dose being recovered in urine. KAE609 had a long terminal half-life (t1/2; 8.2 h in rats
and 10.9 h in dogs), low plasma clearance (CL; 0.252 L/h/kg in rats and 0.201 L/h/kg in dogs)
and moderate volume of distribution at steady state (Vss; 3.18 L/kg in rats and 2.17 L/kg in dogs).
Following oral doing, KAE609 was slowly absorbed in rats with Cmax of 1210 ng/mL observed at
5.3 h (tmax) whereas it was relatively rapidly absorbed in dogs with Cmax of 868 ng/mL observed
at 1.7 h (tmax). The extent of oral absorption was complete in rats and it was estimated to be 72.5%
in dogs. The estimated oral bioavailability was 84.6% in rats and 67.7% in dogs, indicating
minimal first-pass effect in both rats and dogs. Detailed summary Tables of mass balance and
PK parameters can be found in the Supplemental Table 1 and Table 2.
Metabolite profiling of [14C]KAE609 in rat and dog plasma
Following i.v. or oral dosing, the major radiolabeled component in rat and dog plasma was
KAE609, accounting for ~75-84% of the total radioactivity AUC by either dosing route. The
prominent metabolite was M18, accounting for ~10-19% of total radioactivity AUC by either
dosing route. Several minor metabolites were also detected, each accounting for ≤ 3% of total
radioactivity AUC by either dosing route. Detailed graphic presentation can be found in the
Supplemental Figure 1 and Figure 2.
Metabolite profiling of [14C]KAE609 in rat and dog feces
This article has not been copyedited and formatted. The final version may differ from this version.DMD Fast Forward. Published on February 26, 2016 as DOI: 10.1124/dmd.115.069112
at ASPE
T Journals on July 24, 2018
dmd.aspetjournals.org
Dow
nloaded from
DMD #69112
Page 20
KAE609 was well absorbed and extensively metabolized in rats and dogs such that unchanged
KAE609 accounted for ~10-11% of the dose in rat feces and KAE609 was not detected in dog
feces by either dosing route (Figure 2). M37 was the major component in rat feces, accounting
for ~23-26% of the i.v. or oral dose, whereas M23 was the major metabolite, accounting for ~25-
30% of either i.v. or oral dose. In rat feces, several metabolites (M14, M18, M23, M24, M26,
M36, M44, M47 and M48) were identified, each accounting for ~2-8% of the dose. Two
metabolites (M20 and M20.1) were not separated under the HPLC condition used in this study,
together accounting for ~12-13% of the dose by either dosing route. In dog feces, several
prominent metabolites (M20, M21.2, M34 and M39) were identified, each accounting for ~10-20%
of the dose, and several minor metabolites (M26, M37, M44, M46, and M46), each accounting
for ~4-6% of the dose.
Only 1-2% of i.v. and oral doses were recovered in urine from either rats or dogs during the
period of 0-168 h, therefore, urine was not analyzed for metabolite profile.
Structural characterization of [14C]KAE609 and M37 by LC-MS/MS and NMR
The structures of the metabolites were proposed based on their elemental composition derived
from accurate mass measurements (<3-5 ppm), fragment ions in their data dependent MS2 and
MS3 mass spectra, and exchangeable hydrogen atoms in H/D exchange experiment. Elemental
formula and diagnostic fragmentation ions of KAE609 and metabolites are summarized in Table
1. Detailed product ion spectra of KAE609, M37, M18 and M23 can be found in the
Supplemental Figure 3 to Figure 6.
KAE609 ([MH]+=390) contained two chlorine atoms with isotope ratio of ~100:64 (35Cl:37Cl).
The fragment ion at m/z 347 was formed from loss of vinyl amine moiety. Further loss of Cl
This article has not been copyedited and formatted. The final version may differ from this version.DMD Fast Forward. Published on February 26, 2016 as DOI: 10.1124/dmd.115.069112
at ASPE
T Journals on July 24, 2018
dmd.aspetjournals.org
Dow
nloaded from
DMD #69112
Page 21
radical from m/z 347 gave fragments at m/z 312, and loss of CO from m/z 312 gave fragment at
m/z 284.
Comparison of metabolite fragment ions with those of KAE609 allowed the assignment of
regions of biotransformation. The product ion spectrum of M37 ([MH]+=390) showed fragment
ions at m/z 210 (loss of chloro-dihydro-quinazolin-one). There were no obvious similar
fragmentation patterns between KAE609 and M37, which made the assignment of M37 with
only LC-MS/MS data not feasible.
In the H/D exchange experiment, the full-scan mass spectra of KAE609 and M37 showed a shift
of the protonated molecular ion from m/z 390 to MD+ at m/z 394 in KAE609 and from m/z 390 to
MD+ at m/z 393 in M37, suggesting there are three exchangeable hydrogen atoms in KAE609
and only two exchangeable hydrogen atoms in M37 (data not shown).
A comparison of 1H spectra acquired for the rat feces-derived sample of M37 with KAE609
showed that M37 has 5 aromatic protons with similar coupling patterns as were observed for
KAE609 (Figure 3). The chemical shifts of the M37 aromatic protons are different from
KAE609, with the aromatic singlet of M37 at 7.29 ppm showing the most significant chemical
shift difference relative to the parent molecule. These NMR spectra suggest no metabolism
occurred on the aromatic rings of KAE609 during biotransformation to M37.
In the aliphatic region of the M37 spectrum, a multiplet was observed at 4.95 ppm arising from
the methine of M37 at H-8. The methyl group (1.28 ppm) and the methylene protons (2.59, 3.09
ppm) were identified from correlation spectroscopy (COSY). Both showed COSY correlations to
This article has not been copyedited and formatted. The final version may differ from this version.DMD Fast Forward. Published on February 26, 2016 as DOI: 10.1124/dmd.115.069112
at ASPE
T Journals on July 24, 2018
dmd.aspetjournals.org
Dow
nloaded from
DMD #69112
Page 22
the H-8 proton. The chemical shift of the methine proton suggested that it was still connected to
nitrogen as in KAE609’s structure.
The most significant difference between M37 and the parent drug spectra is an additional singlet
observed at 5.84 ppm (1H) in the metabolite spectrum. Acquisition of 1D NOESY (Nuclear
Overhauser Effect Spectroscopy) spectrum demonstrated that the proton at 5.84 ppm has a
through-space correlation to the methyl doublet at 1.28 ppm and the aromatic singlet at 7.50 ppm,
indicating it is close to the chlorobenzene moiety. Additionally, the aromatic singlet at 7.50 ppm
showed an NOE correlation to the NH proton (H14) at 9.21 ppm. These observations suggest the
spiro ring of KAE609 has expanded and rearranged. Based on the NMR, exchangeable hydrogen
atoms, and MS/MS results, a structure was proposed for M37 as shown in Figure 3. Due to
limited quantity of sample, further structure confirmation via heteronuclear multiple bond
correlation (HMBC) experiments could not be performed. The structure of M37 was further
confirmed by chemical synthesis.
Structural characterization of M18 by LC-MS/MS and NMR
M18 ([MH]+ =388) was an oxidative metabolite of KAE609 with a net decrease of 2 Dalton in
mass. The product ion spectrum showed fragment ions at m/z 359 (loss of ethyl group) and 324
(loss of Cl radical from m/z 359).
1H spectra of the metabolite M18 and KAE609 are shown in Figure 4. In the aliphatic region of
the M18 spectrum, a multiplet was observed at 5.63 ppm corresponding to a methine proton H-8.
The methyl group (1.21 ppm) and the methylene protons (3.20, 3.38 ppm) were identified from
COSY spectrum.
This article has not been copyedited and formatted. The final version may differ from this version.DMD Fast Forward. Published on February 26, 2016 as DOI: 10.1124/dmd.115.069112
at ASPE
T Journals on July 24, 2018
dmd.aspetjournals.org
Dow
nloaded from
DMD #69112
Page 23
1H spectrum of M18 showed 5 aromatic protons with coupling patterns similar to the parent
compound. However, the chemical shifts of M18’s aromatic protons differed from KAE609 with
H-1 showing the most significant difference. The methine singlet observed in M37 is absent.
The MS results showed M18 is 2 Da less than that of M37 and has one less exchangeable proton
compare to M37. The LC-MS and NMR results suggest that M18 appears to be derived from
previously identified M37. The structure of M18 was also confirmed by chemical synthesis.
Structural characterization of M23 by LC-MS/MS and NMR
M23 ([MH]+ =404) was a hydroxylated metabolite of M18 with a net increase of 14 Dalton in
mass vs KAE609. The product ion spectra of M23 showed fragment ions at m/z 375 and 340,
which were 16 Dalton higher in mass than fragment ions from M18, supporting the assignment.
In the H/D exchange experiment, the full-scan mass spectrum of M18 and M23 showed a shift of
the protonated molecular ion from m/z 388 to MD+ at m/z 390 for M18 and from m/z 404 to MD+
at m/z 407 for M23, consistent with the assignment that M23 was a hydroxylated metabolite of
M18 (data not shown).
High resolution mass spectrometry (HR-MS) data of compound 3, generated biocatalytically,
suggested a molecular formula of C19H12Cl2FN3O2 or one oxygen atom more than KAE609 and
two hydrogen atoms less. Compared with the 1H-NMR spectrum of KAE609, the data of
compound 3 showed only 4 aromatics protons (Table 2). The presence of two aromatic protons
(H-10 and H-13) which showed coupling to 19F suggested that the 6-chloro-5-fluoro-indole ring
was intact. However, the 5-chloro-indolone coupling pattern was no longer present. Instead, two
singlets were observed at 6.20 and 8.25 ppm. There was no correlation in COSY and TOCSY
between these two protons. A ROESY correlation was observed between the NH-14 of the 6-
chloro-5-fluoro-indole and the singlet at 8.25 ppm (H-1). Detailed ROSEY correlation spectrum
This article has not been copyedited and formatted. The final version may differ from this version.DMD Fast Forward. Published on February 26, 2016 as DOI: 10.1124/dmd.115.069112
at ASPE
T Journals on July 24, 2018
dmd.aspetjournals.org
Dow
nloaded from
DMD #69112
Page 24
of compound 3 can be found in the Supplemental Figure 7. The proton at 6.20 ppm (H-4)
showed a HMBC correlation with the carbons C-2 and C-14c, confirming the position on C-4.
The chemical shift of C-3 at 174.1 ppm, extracted from the HMBC experiment (H-1 to C-3)
indicated that on position 3 a hydroxylation had occurred. The aliphatic CH resonance at 5.33
ppm (H-8) showed a HMBC correlation to C-14b at 143.0 ppm. This chemical shift indicated
that C-14b was now sp2 hybridized in contrast to KAE609 where it was sp3. This suggested that
the ring of the spiro had opened between C-14b and C-6 and rearranged. The chemical shift of
H-8 indicated the formation of quinazolinone moiety. This was further supported by the down
field shift compared to the KAE609 spectrum due to the anisotropy cone effect of the
neighboring C=O.
NMR analysis of enriched M23 from fecal sample in comparison with authentic compound 3
from bioreactions
Analysis of the 1H spectra revealed that the enriched M23-containing rat fecal sample included a
chemical species with protons of the same chemical shifts and coupling patterns as that of
compound 3: H-1, H-4, H-10, and H-13. Additionally, 1H signals corresponding to H-4 for both
the compound 3 and M23 samples appeared as broad singlets, suggesting that the putative M23
H-4 proton is adjacent to a heteroatom bearing an exchangeable proton. The difference of proton
chemical shift of H-4 (6.20 ppm from compound 3 (Table 2) and 5.95 ppm from M23 from fecal
pool) may be attributed to a difference in sample concentration or pH due to the proximity of the
hydroxyl at C-3.
The aliphatic region of the M23-containing sample 1H spectrum was crowded with signals
corresponding to matrix components. Therefore, to obtain a partially deconvoluted picture of the
1H-1H spin systems in this region, a double quantum filter correlation spectroscopy (DQF-COSY)
This article has not been copyedited and formatted. The final version may differ from this version.DMD Fast Forward. Published on February 26, 2016 as DOI: 10.1124/dmd.115.069112
at ASPE
T Journals on July 24, 2018
dmd.aspetjournals.org
Dow
nloaded from
DMD #69112
Page 25
spectrum was acquired. The DQF-COSY spectrum shows a spin system with chemical shifts and
coupling patterns matching the CH3-CH-CH2 moiety in compound 3. Comparison of NMR
spectra of M23 derived from a rat fecal pool and compound 3 from biosynthesis can be found in
Supplemental Figure 8.
In vitro metabolism of KAE609and M18 by human rCYP enzymes
To examine the roles of specific CYP enzymes involved in the metabolism of [14C]KAE609,
several recombinant CYP enzymes were tested. The recombinant human CYP enzymes found
capable of oxidative metabolism of KAE609 were CYP2C9, CYP2C19, CYP3A4 and CYP3A5
(Figure 5, panel A). M37 and M18 were among the metabolites identified from the incubations.
However, M23 was not detected in any of the incubations with CYP enzymes.
As mentioned previously, structure of M18 was proposed based on NMR analysis and later
confirmed by chemical synthesis (compound 2). Thus, compound 2 (M18) was used as a
substrate in in vitro incubation to determine the CYP enzymes involved in the oxidative
metabolism of M18. M14 was the major metabolite generated in incubations with all
recombinant CYP enzymes tested. Trace levels of M23 were detected in incubations with
CYP1A1, CYP1A2 and CYP1B1 (Figure 5, panel B).
Proposed metabolite pathways of [14C]KAE609 in rats and dogs
Metabolic pathways of KAE609 in rats and dogs are summarized in Figure 6. KAE609
underwent C-C bond cleavage, followed by 1, 2-acyl shift and ring expansion to form M37,
which underwent oxidation to form the colored metabolite M18, which was further hydroxylated
to form another colored metabolite M23. M37 was the major metabolite in rat feces while M23
was the major metabolite in dog feces. KAE609 also underwent oxidation to M40 and M20.1
This article has not been copyedited and formatted. The final version may differ from this version.DMD Fast Forward. Published on February 26, 2016 as DOI: 10.1124/dmd.115.069112
at ASPE
T Journals on July 24, 2018
dmd.aspetjournals.org
Dow
nloaded from
DMD #69112
Page 26
with 2 mass units lower than that of KAE609 and one metabolite (M48) with 4 mass units lower
than that of KAE609. KAE609 was directly hydroxylated to form two metabolites (M26 and
M34). Metabolites (M40, M20.1 and M48) were further hydroxylated to several metabolites
(M14, M20, M21.2, M24, M36, M39, M44 and M46). Several glucuronides were also identified
in bile from bile duct-cannulated rat with the total accounting for ~19% of the oral dose (data not
shown).
This article has not been copyedited and formatted. The final version may differ from this version.DMD Fast Forward. Published on February 26, 2016 as DOI: 10.1124/dmd.115.069112
at ASPE
T Journals on July 24, 2018
dmd.aspetjournals.org
Dow
nloaded from
DMD #69112
Page 27
Discussion
KAE609 is an antimalarial agent that is progressing through clinical development, providing a
potentially new cure to combat malaria drug resistance concerns (Rottmann et al., 2010; Meister
et al., 2011; Spillman et al., 2013). To facilitate the understanding of metabolism and
disposition of KAE609 in humans, ADME studies in nonclinical species and across species in
vitro metabolism studies were conducted.
Following i.v. or oral dosing of [14C]KAE609, mass balance was achieved in both rats and
dogs. The radioactivity was primarily excreted via biliary or fecal pathways (> 93% of dose
recovered in feces). Following oral dosing, KAE609 was well absorbed and extensively
metabolized in rats and dogs. KAE609 showed low clearance, moderate volume distribution and
long terminal half-life in rats and dogs. The most abundant radioactive component in rat and dog
plasma was KAE609, accounting for ~75-84% of the total radioactivity in plasma. M18 was
identified to be the major circulating metabolite in rats and dogs, accounting for ~10-19% of the
total radioactivity in plasma. M37 was the major metabolite in rat feces while M23 was the
major metabolite in dog feces. In spite of M23 being the major metabolite in dog feces, M23 was
not detected in circulation in either rat or dog plasma following i.v. or oral dosing of KAE609.
As mentioned previously, M23 was identified as a human metabolite based on in vitro
incubations of KAE609 with hepatocytes. M23 was not detected in rat and dog plasma from
ADME studies suggesting that M23 may pose exposure coverage concerns if M23 is in the
circulation of humans. Therefore, to determine whether M23 is present in human plasma, we
conducted metabolite identification by LC-MS/MS using the plasma from the first in human
This article has not been copyedited and formatted. The final version may differ from this version.DMD Fast Forward. Published on February 26, 2016 as DOI: 10.1124/dmd.115.069112
at ASPE
T Journals on July 24, 2018
dmd.aspetjournals.org
Dow
nloaded from
DMD #69112
Page 28
(FIH) study. M23 was confirmed to be present in human plasma (data not shown). Consequently,
we decided to conduct a human ADME study to better define the exposure of M23 relative to
total radioactivity exposure in plasma (Huskey et al., 2016). Our findings showed that M23
accounted for ~12% of total radioactivity exposure in human plasma. Based on recommendation
of MIST and ICH guidance (Guidance for industry, 2008, 2010, and 2012), safety testing of M23
in nonclinical species is planned accordingly.
To compliment the aforementioned metabolite in safety testing, it was critical to elucidate the
structures of the metabolites involved in the pathway leading to M23. KAE609, a spiroindolone
derivative, undergoes an unusual C-C bond cleavage, followed by 1, 2-acyl shift to form a ring
expansion product M37. This isomerization and rearrangement reaction was catalyzed by
CYP3A4 and the mechanism of this novel biotransformation reaction is proposed in Figure 7.
KAE609 undergoes oxidation by a single electron transfer to form a radical cation, followed by
C-C bond cleavage to form an isocyanate radical cation intermediate. The isocyanate radical
cation is reduced by a single electron transfer, followed by protonation. Nucleophilic attack by
the amine on the carbonyl carbon of the isocyanate leads to ring closure to form M37. A similar
mechanism via a one electron oxidized intermediate has been proposed for the nonoxidative
decarboxylation of N-alkyl-N-phenylglycines by horseradish peroxidase in the absence of H2O2
and O2 (Totah and Hanzlik, 2002 and 2004).
As mentioned previously, structures of M37 and M18 were proposed based on a combination of
LC-MS/MS, exchangeable hydrogen atoms, and NMR analyses. However, structural assignment
for M23 was not achievable due to an insufficient quantity of sample isolated from rat feces.
This article has not been copyedited and formatted. The final version may differ from this version.DMD Fast Forward. Published on February 26, 2016 as DOI: 10.1124/dmd.115.069112
at ASPE
T Journals on July 24, 2018
dmd.aspetjournals.org
Dow
nloaded from
DMD #69112
Page 29
Therefore, our strategy was to utilize in vitro incubations to facilitate the M23 structural
assignment. Specifically, we incubated M18 with a panel of human recombinant CYP enzymes
and identified CYP1A1, CYP1A2, and CYP1B1 as responsible for the formation of M23 from
M18. We then pursued this CYP-catalyzed reaction using recombinant human CYP1A2 (whole
cell biotransformation with genetically modified E. coli) to generate ~1 mg of M23 for structural
elucidation and evaluation of pharmacological activity.
The metabolic pathways of KAE609 are proposed (Figure 6) based on metabolite profiling and
characterization efforts conducted using LC-MS/MS and NMR analyses of metabolites.
KAE609, a spiroindolone derivative, undergoes an unusual C-C bond cleavage, followed by 1, 2-
acyl shift to form a ring expansion product M37. This novel biotransformation reaction was
primarily catalyzed by CYP3A4. M37 was subsequently oxidized to M18 by CYP3A4, and
hydroxylated to M23 by CYP1A1, CYP1A2 and CYP1B1. All three metabolites had conjugated
systems of double bonds, which imparted their characteristic color. As expected, M37 was
colorless having two isolated conjugation systems. With only one additional double bond, M18
and M23 gained an elongated conjugation system, resulting in M18 with an orange yellow color
and M23 with a yellow color. The proposed structures of the three metabolites were chemically
synthesized and thereby confirmed their structural assignments. They were found to be
pharmacologically inactive since the spiroindolone core, required for pharmacological activity,
was lost during biotransformation. Moreover, safety evaluation of M23 showed it to be negative
in the AMES test and in the human lymphocyte chromosomal aberration test.
This article has not been copyedited and formatted. The final version may differ from this version.DMD Fast Forward. Published on February 26, 2016 as DOI: 10.1124/dmd.115.069112
at ASPE
T Journals on July 24, 2018
dmd.aspetjournals.org
Dow
nloaded from
DMD #69112
Page 30
It is interesting that M23 was the major metabolite in dog feces and a minor metabolite in rat
feces; however, M23 was not in either rat or dog plasma. In contrast, M23 was the major
metabolite in human plasma and feces (Huskey et al., 2016). Apparently, M23 was generated
enzymatically in liver from KAE609 via intermediates M37 and M18 in all three species.
However, the distribution of these three metabolites was different in rats and dogs vs. humans.
Thus, we hypothesized that species differences in transporters dictate the distribution of M23 to
blood (human) or excretion into biliary or fecal pathways (rat, dog and human).
The prediction of circulating metabolites in human and why certain metabolites circulate are
topics of interest in drug metabolism research, as discussed in several publications (Anderson et
al 2009; Deepak 2009, and Smith and Deepak 2012). When species differences are observed in
the disposition of metabolites, as was the case for metabolite M23 of KAE609, it may lead to the
necessary safety evaluation of metabolites depending on their exposure in humans (Guidance for
industry, 2008, 2010, and 2012). Thus, it is crucial to proactively address such concerns during
early development to avoid potential delays in new drug application (NDA) approval.
This article has not been copyedited and formatted. The final version may differ from this version.DMD Fast Forward. Published on February 26, 2016 as DOI: 10.1124/dmd.115.069112
at ASPE
T Journals on July 24, 2018
dmd.aspetjournals.org
Dow
nloaded from
DMD #69112
Page 31
Acknowledgements
We thank the constructive discussion and continued encouragement and support from Dr.
Francis Tse. We thank Professor Robert Hanzlik (University of Kansas) for his insightful and
constructive discussion for the mechanism of the novel biotransformation reaction. We thank Dr.
Bryan Yeung for his encouragement and insightful suggestions in the chemical synthesis of
metabolites. We thank Dr. Andreas Fredenhagen for his expert opinions and practical
suggestions. We also thank Dr. Zhigang Jian for the synthesis of [14C]KAE609 and Dr. Amy Wu
and Mr. Lawrence Jones for the purification and analytical certification of [14C]KAE609. We
appreciate Dr. Ziping Yang and Ms. Cindy Chen for the quantification of KAE609 in rat and dog
plasma. We thank Ms. Lolita Rodriguez for the metabolic profiling of KAE609 in biological
matrices from rats.
This article has not been copyedited and formatted. The final version may differ from this version.DMD Fast Forward. Published on February 26, 2016 as DOI: 10.1124/dmd.115.069112
at ASPE
T Journals on July 24, 2018
dmd.aspetjournals.org
Dow
nloaded from
DMD #69112
Page 32
Authorship Contributions
Participated in study design: Zhang, Favara, Handan and Huskey
Performed chemical synthesis of metabolites: Simon
Performed biocatalytic synthesis of metabolites: Vargas and Eggimann
Conducted experiments: Zhu, Gu, Forseth, Simon, Eggimann, Vargas, Zhang, Li, Wang, and
Favara
Performed data analysis: Zhu, Lin, Gu, Forseth, Eggimann, Kittelmann, Luneau and Huskey
Wrote or contributed to the writing of manuscript: Huskey, Forseth, Simon, Eggimann,
Kittelmann, Luneau and Mangold
This article has not been copyedited and formatted. The final version may differ from this version.DMD Fast Forward. Published on February 26, 2016 as DOI: 10.1124/dmd.115.069112
at ASPE
T Journals on July 24, 2018
dmd.aspetjournals.org
Dow
nloaded from
DMD #69112
Page 33
References
Anderson S, Luffer-Atlas D, and Knadler MP (2009) Predicting circulating human metabolites:
How good are we? Chem Res Toxicol 22, 243-256.
Baillie TA, Cayen MN, Fouda H, Gerson RJ, Green JD, Grossman SJ, Klunk LJ, LeBlanc B,
Perkins DG, Shipley LA (2002) Drug metabolites in safety testing. Tox. and Appl. Pharmacol.
182, 188-196.
Baillie T (2008) Metabolism and toxicity of drugs: Two decades of progress in industrial drug
metabolism. Chem. Res. Toxicol, 21: 129–137.
Carter TE, Boulter A, Existe A, Romain JR, St. Victor JY, Mulligan CJ, Okech BA (2015)
Antimisinin resistance-associated polymorphisms at the K13-propeller locus are absent in
Plasmodium falciparum isolates from Haiti. Am J Tropical Med and Hygiene 92:552-554.
Deepak D (2009) Assessment of three human in vitro systems in the generation of major human
excretory and circulating metabolites. Chem. Res. Toxicol. 22, 357-368.
Guidance for industry (2008) Safety testing of drug metabolites U.S. Department of Health and
Human Services Food and drug administration (FDA) and center for drug evaluation and
research (CDER)
http://www.fda.gov/cder/guidance/index.htm
Guidance for industry (2010) M3(R2)Nonclinical safety studies for the conduct of human
clinical trials and marketing authorization for pharmaceuticals. International conference of
harmonization (ICH) revision 1
This article has not been copyedited and formatted. The final version may differ from this version.DMD Fast Forward. Published on February 26, 2016 as DOI: 10.1124/dmd.115.069112
at ASPE
T Journals on July 24, 2018
dmd.aspetjournals.org
Dow
nloaded from
DMD #69112
Page 34
http://www.fda/Drugs/GuidanceComplianceRegulatoryInformation/Guidances/default.htm
Guidance for industry (2012) M3(R2)Nonclinical safety studies for the conduct of human
clinical trials and marketing authorization for pharmaceuticals Questions and answers.
International conference of harmonization (ICH)
http://www.fda.gov/Drugs/GuidanceComplianceRegulatoryInformation/Guidances/default.htm
Hague U, Glass GE, Hague W, Islam N, Roy S, Karim J, Noedl H (2013) Antimalarial drug
resistance in Bangladesh, 1996-2012 Transactions of the Royal Soc of Tropical Med and
Hygiene 107 : 745-752.
Holt A, Casandra D, Sparks KN, Morton LC, Castanares G-G, Rutter A, Kyle D (2015)
Antimisinin-resistant Plasmodium falciparum parasites exhibit altered patterns of development in
infected erythrocytes. Antimicrobial Agents and Chemotherapy 59:3156-3167.
Huskey SE, Zhu C-Q, Fredenhagen A, Kühnöl J, Lumeaux A, Jian Z, Yang Z, Mia Z, Yang F,
Jain JP, Sunkara G, Mangold JB and Stein DS (2016) KAE609 (Cipargamin), a new
spiroindolone agent for the treatment of malaria: Evaluation of the Absorption, Distribution,
Metabolism and Excretion of a single oral 300 mg dose of [14C]KAE609 in healthy male
subjects Drug Metab Dispos (submitted for peer review)
Kittelmann M, Kuhn A, Riepp A, Kühnöl J, Fredenhagen A, Oberer L, Ghisalba O, Luetz S
(2012) Recombinant human cytochrome P450 enzymes expressed in Escherichia coli as whole
cell biocatalysts: Preparative synthesis of oxidized metabolites of an mGlu5 receptor antagonist.
In: Whittall J, Sutton PW, (eds.). Practical methods for biocatalysis and biotransformations 2.
Chichester: John Wiley & Sons, Ltd., p. 138-146.
This article has not been copyedited and formatted. The final version may differ from this version.DMD Fast Forward. Published on February 26, 2016 as DOI: 10.1124/dmd.115.069112
at ASPE
T Journals on July 24, 2018
dmd.aspetjournals.org
Dow
nloaded from
DMD #69112
Page 35
Leong FJ, Li R, Jain JP, Lefevre G, Magnusson B, Diagana TT and Pertel P (2014) A first-in-
human randomized, double-blind, placebo-controlled, single- and multiple-ascending oral dose
study of novel antimalarial spiroindolone KAE609 (ciparagamin) to assess its safety, tolerability,
and pharmacokinetics in healthy adult volunteers. Antimicrobial agents & chemotherapy 58:
6209-6214.
Meister S, Plouffe DM, Kuhen KL, Bonamy GM, Wu T, Barnes SW, Bopp SE, Borboa R, Bright
T, Che J, Cohen S, Dharia NV, Gagaring K, Gettatacamin M, Gordon P, Groessl T, Kato N, Lee
MCS, McNamara CW, Fidock DA, Nagle A, Nam T-g, Richmond W, Roland J, Rottmann M,
Zhou B, Froissard P, Glynne RJ, Mazier D, Sattabongkot J, Schultz PG, Tuntland T, Walker JR,
Zhou Y, Chatterjee A, Diagana TT, and Winzeler EA (2011) Imaging of plasmodium liver
stages to drive next-generation antimalarial drug discovery. Science 34: 1372-1377.
Na-Bangchang K and Karbwang J (2013) Emerging artemisinin resistance in the border areas of
Thailand. Expert Rev Clin Pharmacol 6:307-322.
Rottmann M, McNamara C, Yeung BK, Lee MCS, Zou B, Russell B, Seitz P, Plouffe DM,
Dharia NV, Tan J, Cohen SB, Spencer KR, Gonzale-Paez GE, Lakshminarayana SB, Goh A,
Suwanarusk R, Jegla T, Schmitt EK, Beck H-P, Burn R, Nosten F, Renia L, Dartois V, Keller
TH, Fidock DA, Winzeler EA, and Diagana TT (2010) Spiroindolones, a potent compound class
for the treatment of malaria Science 329: 1175-1180.
Smith D and Deepak D (2012) Why do metabolites circulate? Xenobiotica 42, 107-126
Smith D and Obach RS (2009) Metabolites in safety testing (MIST): Considerations of
mechanism of toxicity with dose, abundance, and duration of treatment Chem. Res. Toxicol. 22:
267-279.
This article has not been copyedited and formatted. The final version may differ from this version.DMD Fast Forward. Published on February 26, 2016 as DOI: 10.1124/dmd.115.069112
at ASPE
T Journals on July 24, 2018
dmd.aspetjournals.org
Dow
nloaded from
DMD #69112
Page 36
Spillman NJ, Allen RJW, McNamara CW, Yeung BKS, Winzeler EA, Diagana TT and Kirk K
(2013) Na+ regulation in the malaria parasite plasmodium falciparum involves the cation ATPase
PfATP4 and is a target of the spiroindolone antimalarial. Cell Host & Microbe 13: 227-237
Totah RA and Hanzlik RP Non-oxidative decarboxylation of glycine derivatives by a peroxidase
(2002) J Am Chem Soc 124, 10000-10001
Totah RA and Hanzlik RP Oxidative and nonoxidative decarboxylation of N-alkyl-N-
phenylglycines by horseradish peroxidase. Mechanistic switching by varying hydrogen peroxide,
oxygen, and solvent deuterium (2004) Biochemistry 43, 7907-7914
White NJ, Pukrittayakamee S, Phyo AP, Rueangweerayut R, Nosten F, Jittamala P, Jeeyapant A,
Jain JP, Lefevre G, Li R, Magnusson B, Diagana TT, Leong FJ (2014) Spiroindolone KAE609
for falciparum and Vivax malaria N Engl J Med 371, 403-410
Witkowski B, Khim N; Chim P; Kim S; Ke S; Kloeung N, Chy S, Duong S, Leang R, Ringwald
P, Dondorp AM, Tripura R, Benoit-Vical F, Berry A, Gorgette O, Ariey F, Barale JC,
Mercereau-Puijalon O, and Menarda D (2013) Reduced artemisinin susceptibility of
Plasmodium falciparum ring stages in western Cambodia Antimicrobial Agents and
Chemotherapy 57: 914-923.
Yeung BKS, Zou B, Rottmann M, Lakshminarayana SB, Ang SH, Leong SY, Tan J, Wong J,
Keller-Maerki S, Fischli C, Goh A, Schmitt EK, Krastel P, Francotte E, Kuhen K, Plouffe D,
Henson K, Wagner T, Winzeler EA, Petersen F, Brun R, Dartois V, Diagana TT, and Keller TH
(2010) Spirotetrahydro β-Carbolines (Spiroindolones): A New Class of Potent and Orally
Efficacious Compounds for the Treatment of Malaria J Med Chem 53: 5155-5164.
This article has not been copyedited and formatted. The final version may differ from this version.DMD Fast Forward. Published on February 26, 2016 as DOI: 10.1124/dmd.115.069112
at ASPE
T Journals on July 24, 2018
dmd.aspetjournals.org
Dow
nloaded from
DMD #69112
Page 37
Footnotes
Author: aMelissa Lin is currently at Merck Research Laboratories, Rahway, NJ
Introduction: bNomenclature of metabolites was based on their HPLC elution time when a metabolite was first identified.
This article has not been copyedited and formatted. The final version may differ from this version.DMD Fast Forward. Published on February 26, 2016 as DOI: 10.1124/dmd.115.069112
at ASPE
T Journals on July 24, 2018
dmd.aspetjournals.org
Dow
nloaded from
DMD #69112
Page 38
Figure Legends
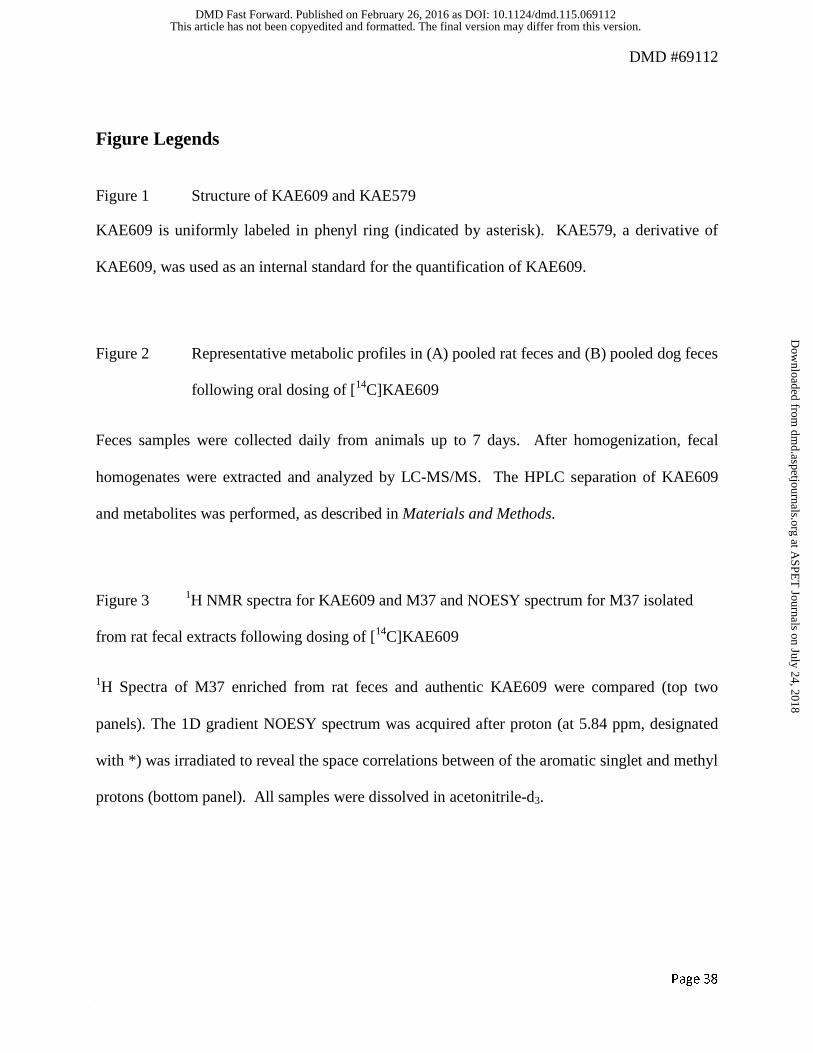
Figure 1 Structure of KAE609 and KAE579
KAE609 is uniformly labeled in phenyl ring (indicated by asterisk). KAE579, a derivative of
KAE609, was used as an internal standard for the quantification of KAE609.
Figure 2 Representative metabolic profiles in (A) pooled rat feces and (B) pooled dog feces
following oral dosing of [14C]KAE609
Feces samples were collected daily from animals up to 7 days. After homogenization, fecal
homogenates were extracted and analyzed by LC-MS/MS. The HPLC separation of KAE609
and metabolites was performed, as described in Materials and Methods.
Figure 3 1H NMR spectra for KAE609 and M37 and NOESY spectrum for M37 isolated
from rat fecal extracts following dosing of [14C]KAE609
1H Spectra of M37 enriched from rat feces and authentic KAE609 were compared (top two
panels). The 1D gradient NOESY spectrum was acquired after proton (at 5.84 ppm, designated
with *) was irradiated to reveal the space correlations between of the aromatic singlet and methyl
protons (bottom panel). All samples were dissolved in acetonitrile-d3.
This article has not been copyedited and formatted. The final version may differ from this version.DMD Fast Forward. Published on February 26, 2016 as DOI: 10.1124/dmd.115.069112
at ASPE
T Journals on July 24, 2018
dmd.aspetjournals.org
Dow
nloaded from
DMD #69112
Page 39
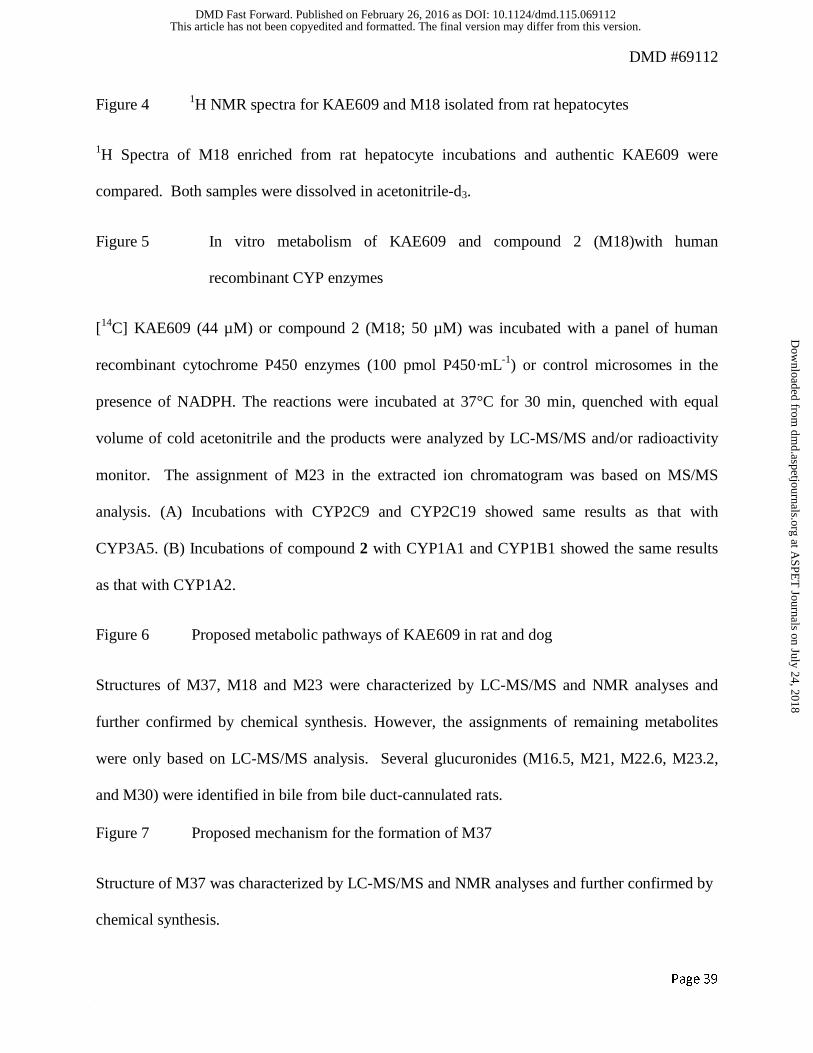
Figure 4 1H NMR spectra for KAE609 and M18 isolated from rat hepatocytes
1H Spectra of M18 enriched from rat hepatocyte incubations and authentic KAE609 were
compared. Both samples were dissolved in acetonitrile-d3.
Figure 5 In vitro metabolism of KAE609 and compound 2 (M18)with human
recombinant CYP enzymes
[14C] KAE609 (44 µM) or compound 2 (M18; 50 µM) was incubated with a panel of human
recombinant cytochrome P450 enzymes (100 pmol P450·mL-1) or control microsomes in the
presence of NADPH. The reactions were incubated at 37°C for 30 min, quenched with equal
volume of cold acetonitrile and the products were analyzed by LC-MS/MS and/or radioactivity
monitor. The assignment of M23 in the extracted ion chromatogram was based on MS/MS
analysis. (A) Incubations with CYP2C9 and CYP2C19 showed same results as that with
CYP3A5. (B) Incubations of compound 2 with CYP1A1 and CYP1B1 showed the same results
as that with CYP1A2.
Figure 6 Proposed metabolic pathways of KAE609 in rat and dog
Structures of M37, M18 and M23 were characterized by LC-MS/MS and NMR analyses and
further confirmed by chemical synthesis. However, the assignments of remaining metabolites
were only based on LC-MS/MS analysis. Several glucuronides (M16.5, M21, M22.6, M23.2,
and M30) were identified in bile from bile duct-cannulated rats.
Figure 7 Proposed mechanism for the formation of M37
Structure of M37 was characterized by LC-MS/MS and NMR analyses and further confirmed by
chemical synthesis.
This article has not been copyedited and formatted. The final version may differ from this version.DMD Fast Forward. Published on February 26, 2016 as DOI: 10.1124/dmd.115.069112
at ASPE
T Journals on July 24, 2018
dmd.aspetjournals.org
Dow
nloaded from
DMD #69112
Page 40
Tables
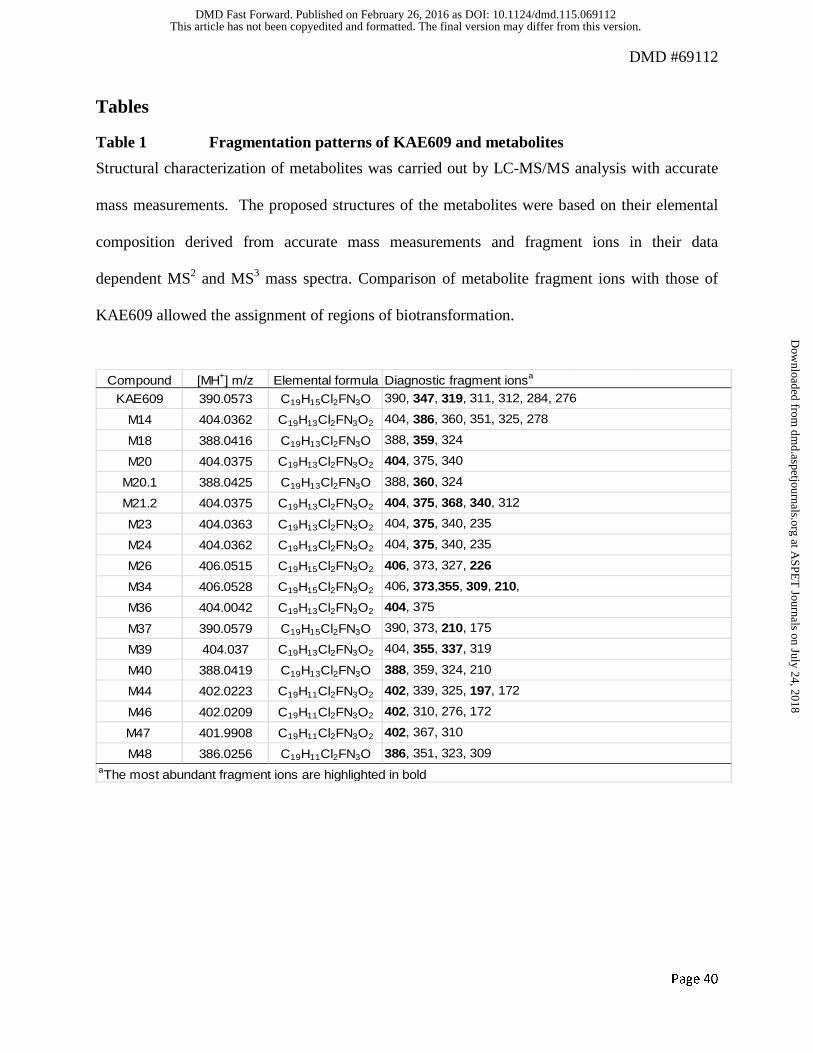
Table 1 Fragmentation patterns of KAE609 and metabolites
Structural characterization of metabolites was carried out by LC-MS/MS analysis with accurate
mass measurements. The proposed structures of the metabolites were based on their elemental
composition derived from accurate mass measurements and fragment ions in their data
dependent MS2 and MS3 mass spectra. Comparison of metabolite fragment ions with those of
KAE609 allowed the assignment of regions of biotransformation.
Compound [MH+] m/z Elemental formula
KAE609 390.0573 C19H15Cl2FN3O
M14 404.0362 C19H13Cl2FN3O2
M18 388.0416 C19H13Cl2FN3O
M20 404.0375 C19H13Cl2FN3O2
M20.1 388.0425 C19H13Cl2FN3O
M21.2 404.0375 C19H13Cl2FN3O2
M23 404.0363 C19H13Cl2FN3O2
M24 404.0362 C19H13Cl2FN3O2
M26 406.0515 C19H15Cl2FN3O2
M34 406.0528 C19H15Cl2FN3O2
M36 404.0042 C19H13Cl2FN3O2
M37 390.0579 C19H15Cl2FN3O
M39 404.037 C19H13Cl2FN3O2
M40 388.0419 C19H13Cl2FN3O
M44 402.0223 C19H11Cl2FN3O2
M46 402.0209 C19H11Cl2FN3O2
M47 401.9908 C19H11Cl2FN3O2
M48 386.0256 C19H11Cl2FN3O 386, 351, 323, 309aThe most abundant fragment ions are highlighted in bold
388, 360, 324
404, 375, 340
404, 375
406, 373, 327, 226
402, 367, 310
404, 355, 337, 319
406, 373,355, 309, 210,
402, 339, 325, 197, 172
402, 310, 276, 172
390, 373, 210, 175
388, 359, 324, 210
404, 375, 368, 340, 312
404, 375, 340, 235
404, 375, 340, 235
Diagnostic fragment ionsa
390, 347, 319, 311, 312, 284, 276
404, 386, 360, 351, 325, 278
388, 359, 324
This article has not been copyedited and formatted. The final version may differ from this version.DMD Fast Forward. Published on February 26, 2016 as DOI: 10.1124/dmd.115.069112
at ASPE
T Journals on July 24, 2018
dmd.aspetjournals.org
Dow
nloaded from
DMD #69112
Page 41
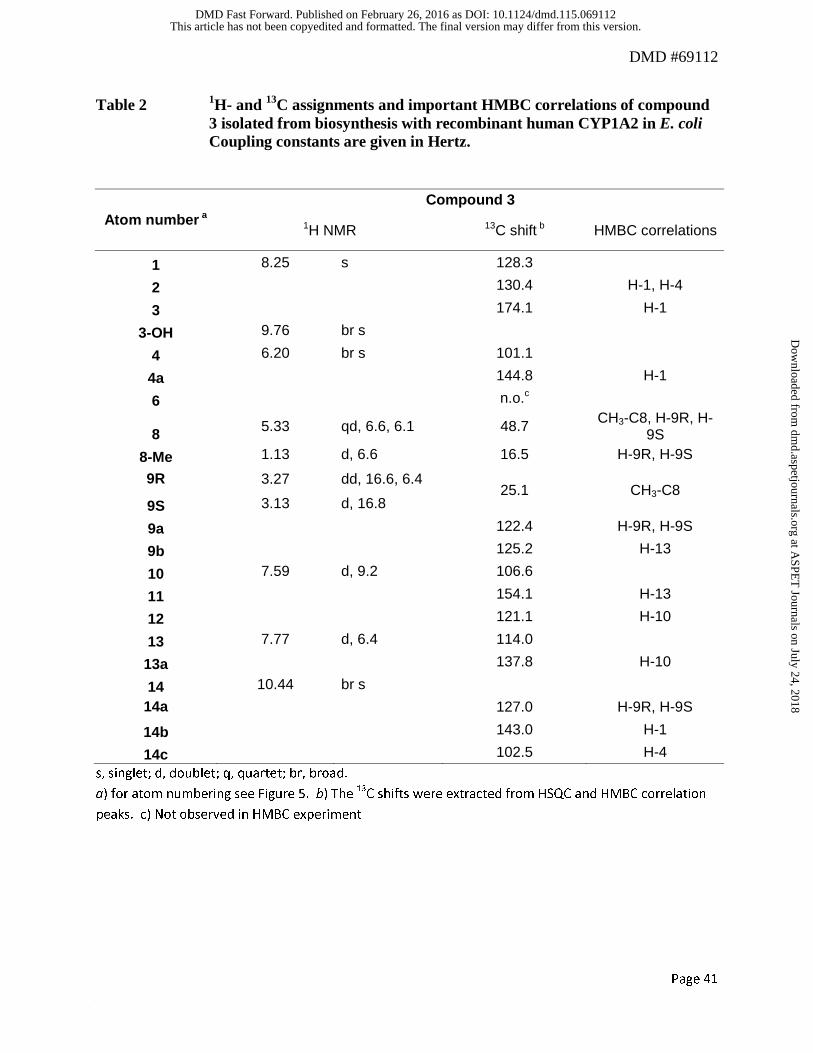
Table 2 1H- and 13C assignments and important HMBC correlations of compound 3 isolated from biosynthesis with recombinant human CYP1A2 in E. coli Coupling constants are given in Hertz.
Atom number a Compound 3
1H NMR 13C shift b HMBC correlations
1 8.25 s 128.3 2 130.4 H-1, H-4
3 174.1 H-1
3-OH 9.76 br s 4 6.20 br s 101.1
4a 144.8 H-1
6 n.o.c
8 5.33 qd, 6.6, 6.1 48.7 CH3-C8, H-9R, H-9S
8-Me 1.13 d, 6.6 16.5 H-9R, H-9S
9R 3.27 dd, 16.6, 6.4 25.1 CH3-C8
9S 3.13 d, 16.8
9a 122.4 H-9R, H-9S
9b 125.2 H-13
10 7.59 d, 9.2 106.6
11 154.1 H-13
12 121.1 H-10
13 7.77 d, 6.4 114.0 13a 137.8 H-10
14 10.44 br s 14a 127.0 H-9R, H-9S
14b 143.0 H-1
14c 102.5 H-4 s, singlet; d, doublet; q, quartet; br, broad.
a) for atom numbering see Figure 5. b) The
13C shifts were extracted from HSQC and HMBC correlation
peaks. c) Not observed in HMBC experiment
This article has not been copyedited and formatted. The final version may differ from this version.DMD Fast Forward. Published on February 26, 2016 as DOI: 10.1124/dmd.115.069112
at ASPE
T Journals on July 24, 2018
dmd.aspetjournals.org
Dow
nloaded from
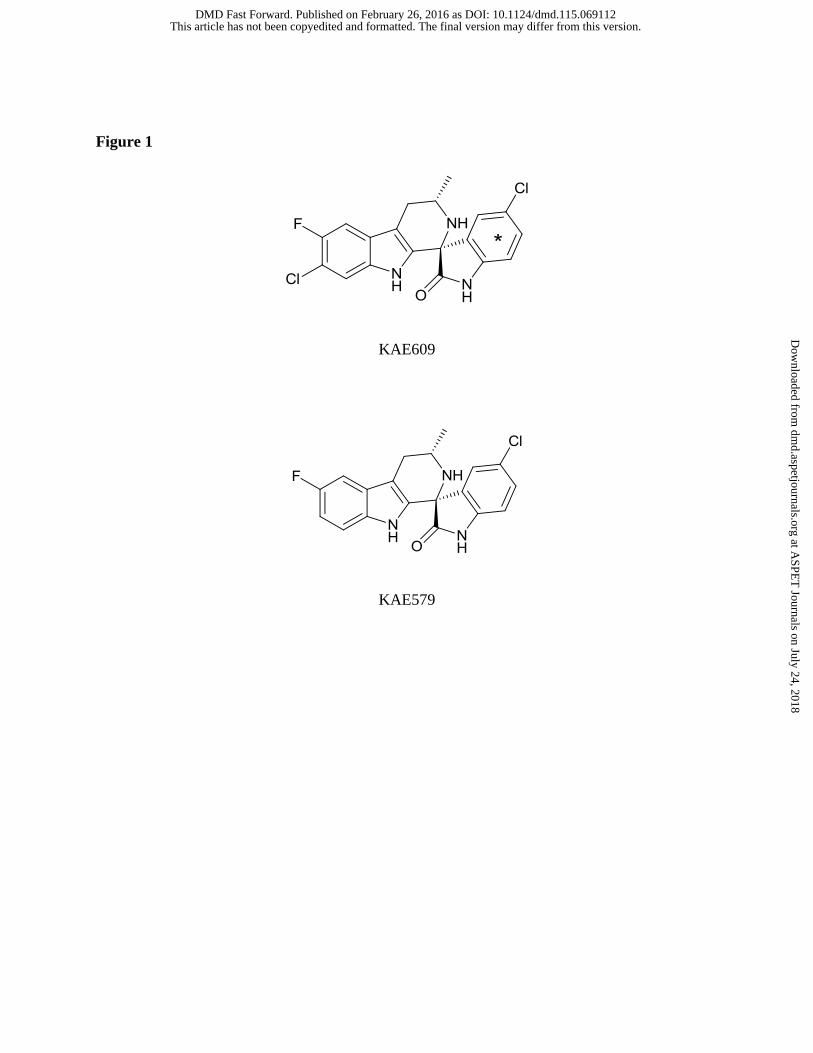
Figure 1
KAE609
KAE579
This article has not been copyedited and formatted. The final version may differ from this version.DMD Fast Forward. Published on February 26, 2016 as DOI: 10.1124/dmd.115.069112
at ASPE
T Journals on July 24, 2018
dmd.aspetjournals.org
Dow
nloaded from
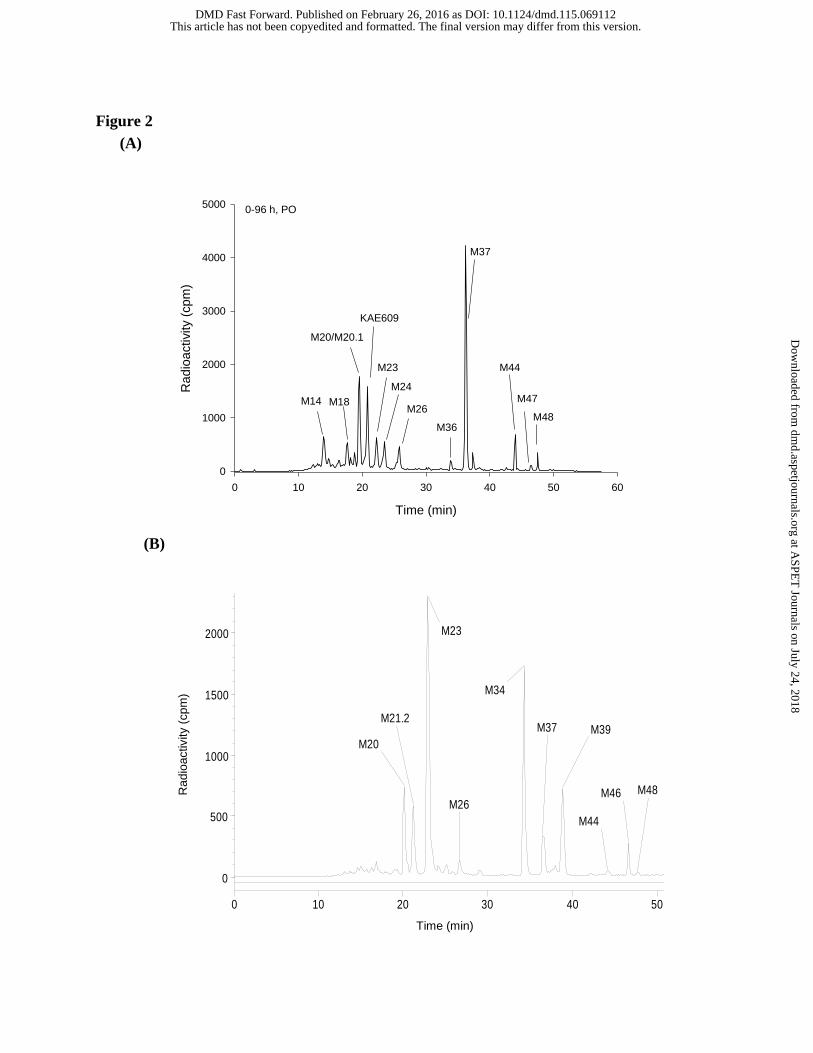
Figure 2
(A)
Time (min)
0 10 20 30 40 50 60
Radio
activity (
cpm
)
0
1000
2000
3000
4000
5000
KAE609
M18
M48
M47
M44
M37
M24
M23
M20/M20.1
M14
0-96 h, PO
M26
M36
(B)
Time (min)
Ra
dio
activity (
cp
m)
M20
M21.2
M23
M26
M34
M37 M39
M44
M46 M48
0 10 20 30 40 50
Time (min)
0
500
1000
1500
2000R
ad
ioa
ctiv
ity (c
pm
)
This article has not been copyedited and formatted. The final version may differ from this version.DMD Fast Forward. Published on February 26, 2016 as DOI: 10.1124/dmd.115.069112
at ASPE
T Journals on July 24, 2018
dmd.aspetjournals.org
Dow
nloaded from
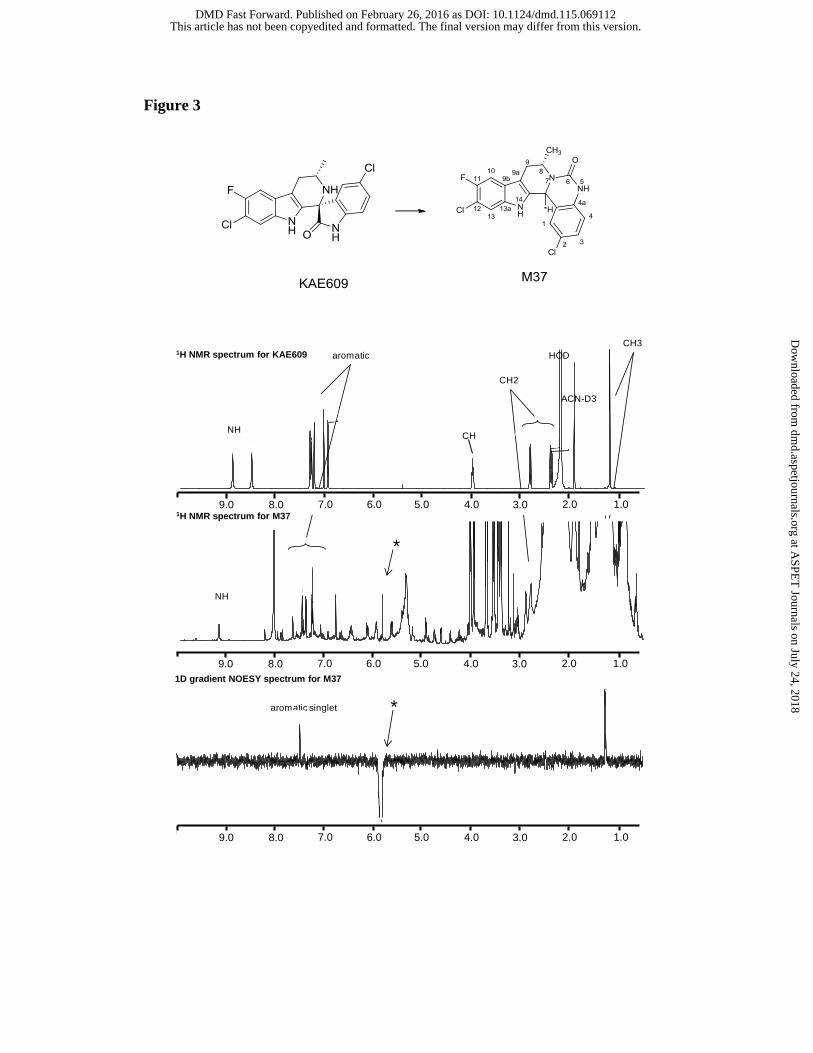
Figure 3
62224N1G100067_001001r
9.5 9.0 8.5 8.0 7.5 7.0 6.5 6.0 5.5 5.0 4.5 4.0 3.5 3.0 2.5 2.0 1.5 1.0 0.5
1.2
0
1.2
2
2.3
9
2.4
12.4
2
2.4
32.8
3
2.8
5
4.0
1
6.9
66.9
7
7.0
5
7.2
6
7.3
3
7.3
5
8.5
3
8.9
2
62224N1G100070_001001r.esp
9.5 9.0 8.5 8.0 7.5 7.0 6.5 6.0 5.5 5.0 4.5 4.0 3.5 3.0 2.5 2.0 1.5 1.0 0.5
9.1
9
7.6
9
7.5
0
7.4
3
7.2
9
7.2
7
6.8
1
6.8
0 5.8
4
4.9
5
3.0
9
2.5
9 1.2
8
62224N1G100070_003001r.esp
9 8 7 6 5 4 3 2 1
7.5
0
5.8
4
1.2
8
NH
NH
aromatic
*
*
HOD
ACN-D3
CH31H NMR spectrum for KAE609
1H NMR spectrum for M37
NOESY spectrum for M37
aromatic singlet
methyl proton
CH2
CH
9.0 8.0 7.0 6.0 5.0 4.0 3.0 2.0 1.0
9.0 8.0 7.0 6.0 5.0 4.0 3.0 2.0 1.0
9.0 8.0 7.0 6.0 5.0 4.0 3.0 2.0 1.0
1D gradient NOESY spectrum for M37
1H NMR spectrum for M37
1H NMR spectrum for KAE609
This article has not been copyedited and formatted. The final version may differ from this version.DMD Fast Forward. Published on February 26, 2016 as DOI: 10.1124/dmd.115.069112
at ASPE
T Journals on July 24, 2018
dmd.aspetjournals.org
Dow
nloaded from
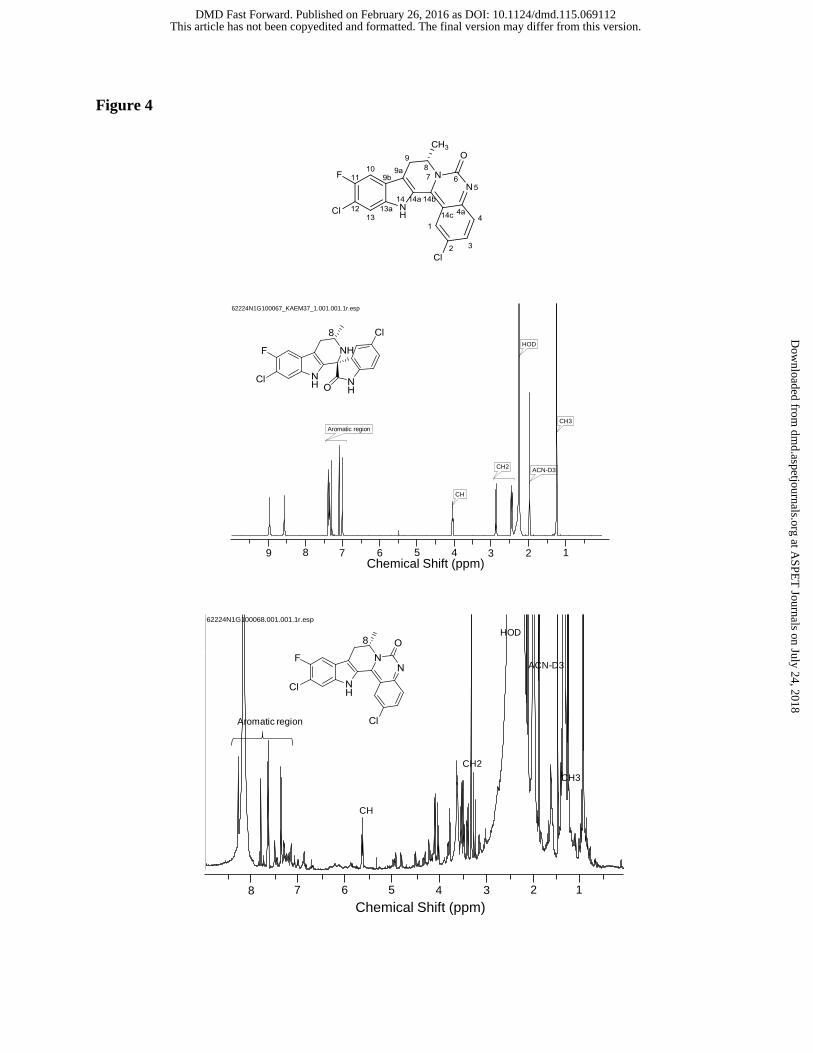
Figure 4
62224N1G100067_KAEM37_1.001.001.1r.esp
9 8 7 6 5 4 3 2 1
Chemical Shift (ppm)
0.05
0.10
0.15
0.20
0.25
0.30
0.35
0.40
0.45
0.50
0.55
Norm
aliz
ed Inte
nsity
CH3
ACN-D3
HOD
CH
CH2
Aromatic region
1
2
CH3
4
5CH6
N
H7
8
9F10
11
NH12
CH13
CH214
CH315
16N
H17
18
19
CH20
CH21
22CH23
Cl24
O25
Cl26
8
9 8 7 6 5Chemical Shift (ppm)
4 3 2 1
62224N1G100068.001.001.1r.esp
8 7 6 5 4 3 2 1
Chemical Shift (ppm)
0.0005
0.0010
0.0015
Norm
alized Inte
nsity
CH
CH2
HOD
ACN-D3
CH3
Aromatic region
8
8 7 6 5 4 3 2 1
Chemical Shift (ppm)
This article has not been copyedited and formatted. The final version may differ from this version.DMD Fast Forward. Published on February 26, 2016 as DOI: 10.1124/dmd.115.069112
at ASPE
T Journals on July 24, 2018
dmd.aspetjournals.org
Dow
nloaded from
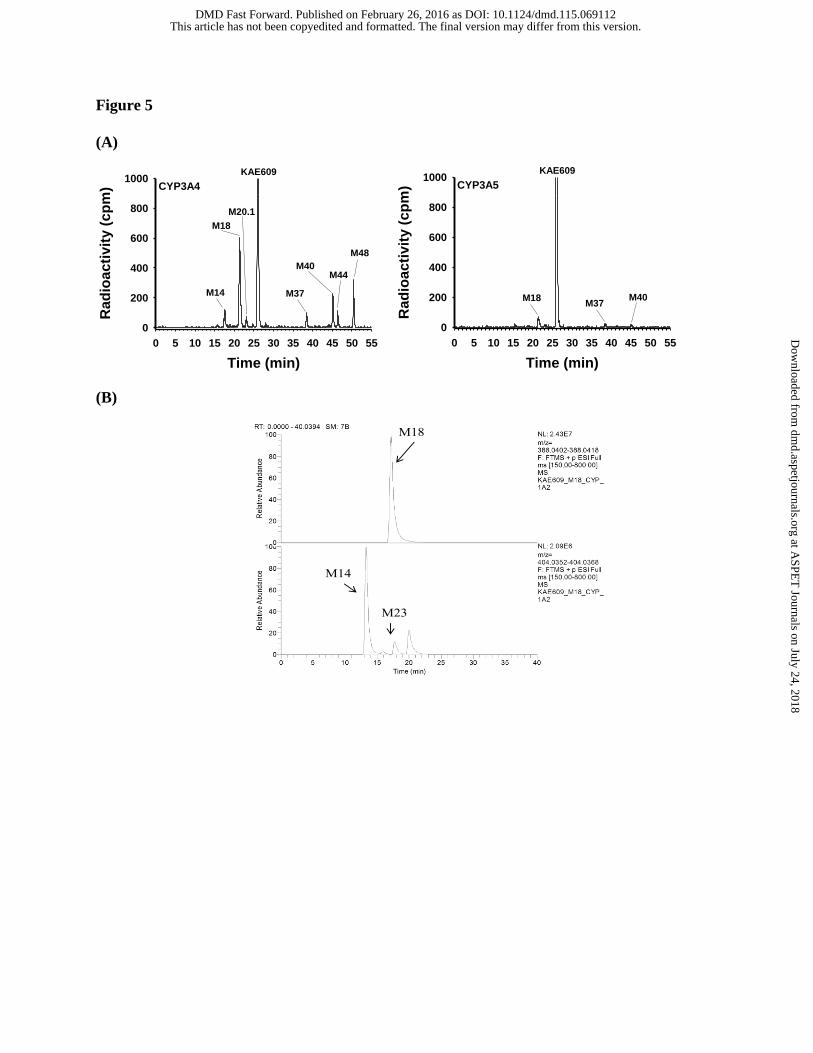
Figure 5
(A)
Time (min)
0 5 10 15 20 25 30 35 40 45 50 55
Rad
ioacti
vit
y (
cp
m)
0
200
400
600
800
1000KAE609
CYP3A4
M18
M37
M40
M48
M44
M14
M20.1
Time (min)
0 5 10 15 20 25 30 35 40 45 50 55
Ra
dio
ac
tiv
ity (
cp
m)
0
200
400
600
800
1000KAE609
CYP3A5
M18M37
M40
(B)
This article has not been copyedited and formatted. The final version may differ from this version.DMD Fast Forward. Published on February 26, 2016 as DOI: 10.1124/dmd.115.069112
at ASPE
T Journals on July 24, 2018
dmd.aspetjournals.org
Dow
nloaded from
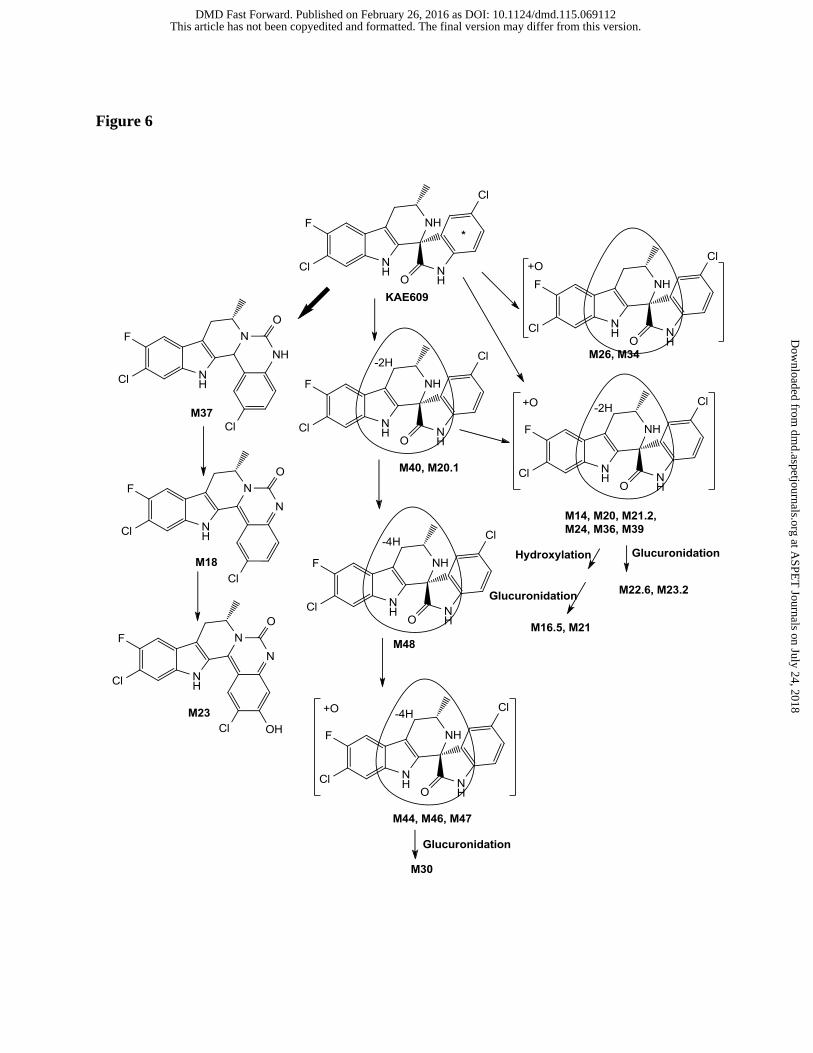
Figure 6
This article has not been copyedited and formatted. The final version may differ from this version.DMD Fast Forward. Published on February 26, 2016 as DOI: 10.1124/dmd.115.069112
at ASPE
T Journals on July 24, 2018
dmd.aspetjournals.org
Dow
nloaded from
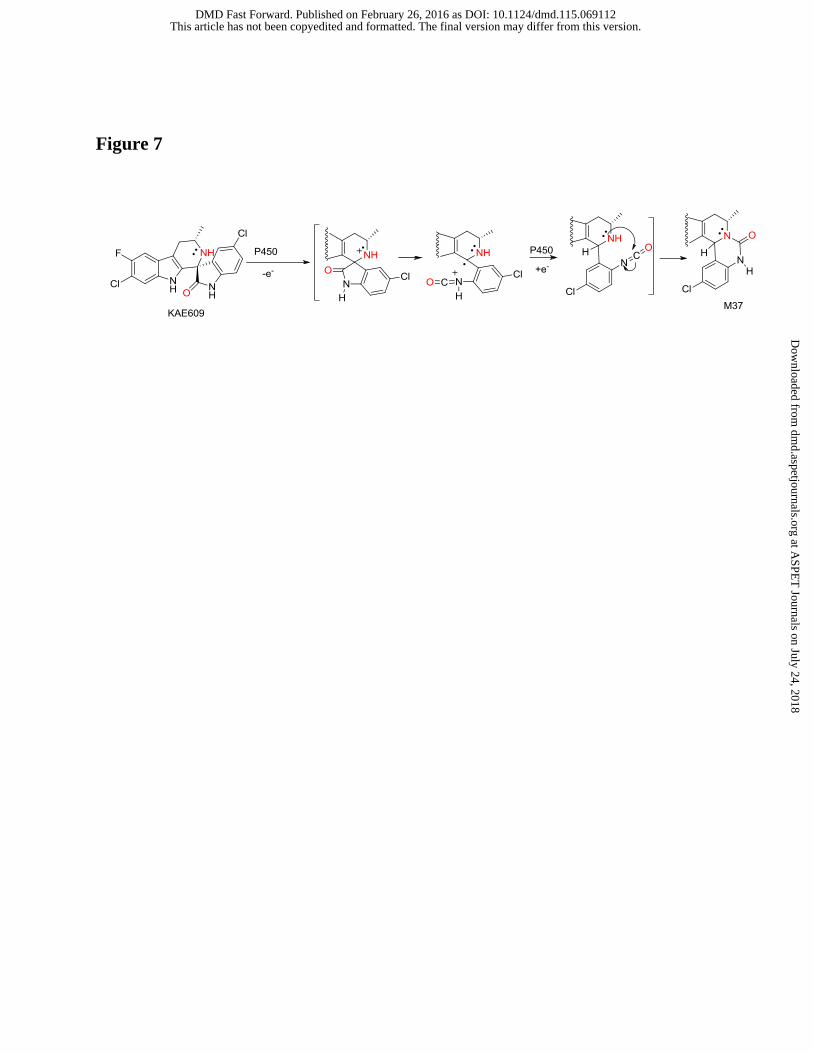
Figure 7
This article has not been copyedited and formatted. The final version may differ from this version.DMD Fast Forward. Published on February 26, 2016 as DOI: 10.1124/dmd.115.069112
at ASPE
T Journals on July 24, 2018
dmd.aspetjournals.org
Dow
nloaded from