Embed Size (px)
Citation preview

Identifying and
Representing Proportional Relationships
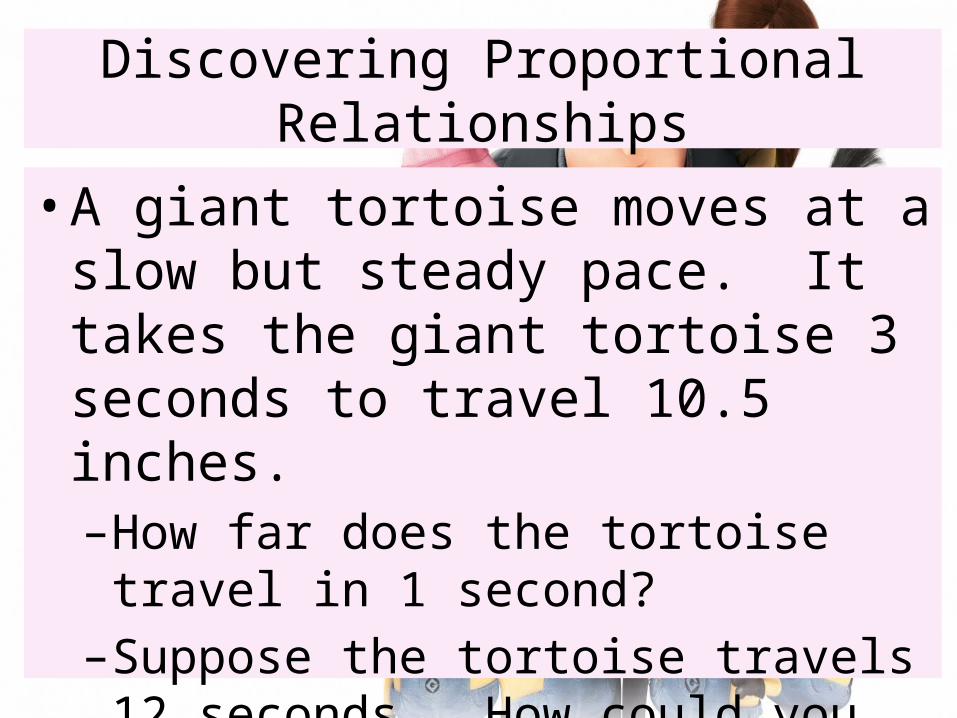
Discovering Proportional Relationships
• A giant tortoise moves at a slow but steady pace. It takes the giant tortoise 3 seconds to travel 10.5 inches. –How far does the tortoise travel in 1
second?–Suppose the tortoise travels 12 seconds.
How could you find the distance the tortoise travels?
Important Terms• Rate of Change: is a rate that
describes how one quantity changes in relation to another quantity.• Proportional Relationship: a
relationship in which the rate of change is constant.
Important Terms• Proportion: a statement that two
rates or ratios are equivalent.• Constant of Proportionality (k): The
ratio of the two quantities or y=kx–Must be multiplied by a constant
amount to get your output.
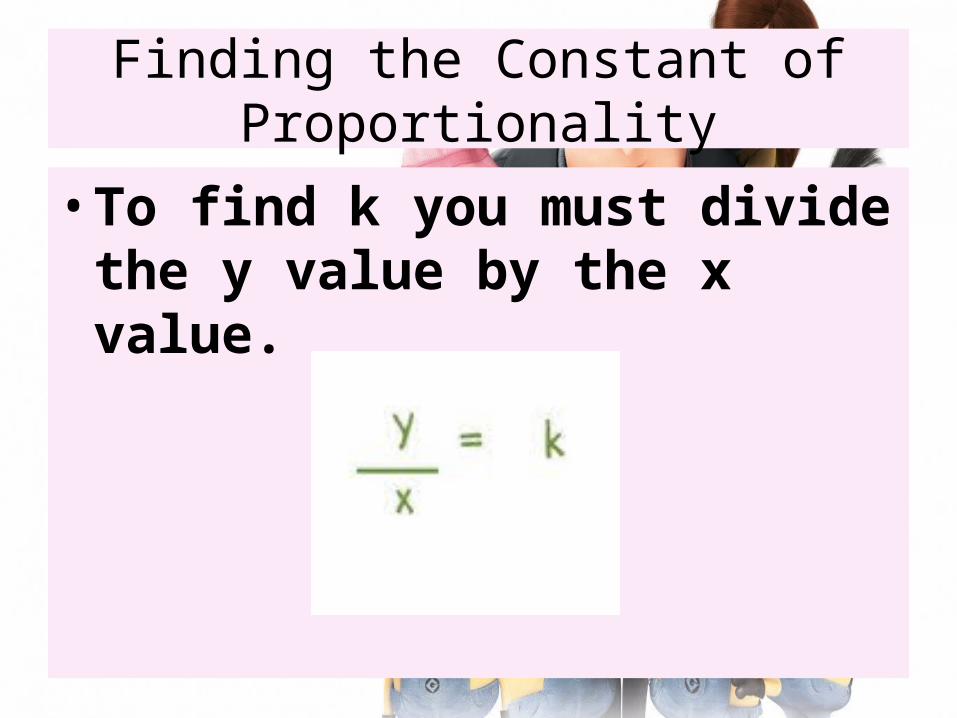
Finding the Constant of Proportionality
• To find k you must divide the y value by the x value.
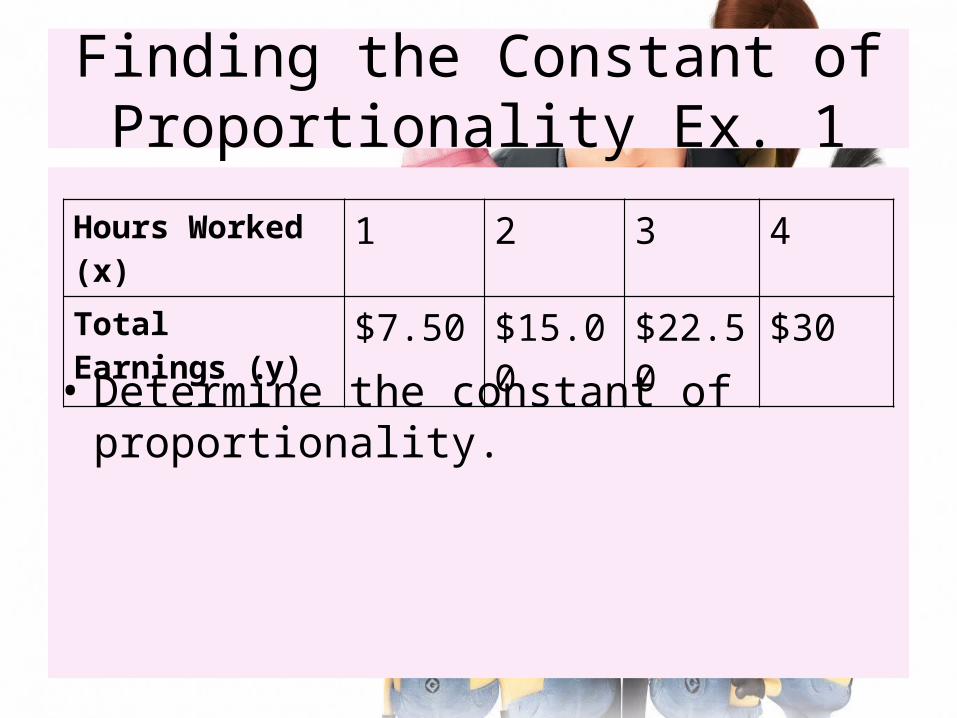
Finding the Constant of Proportionality Ex. 1
• Determine the constant of proportionality.
Hours Worked (x) 1 2 3 4
Total Earnings (y) $7.50 $15.00 $22.50 $30
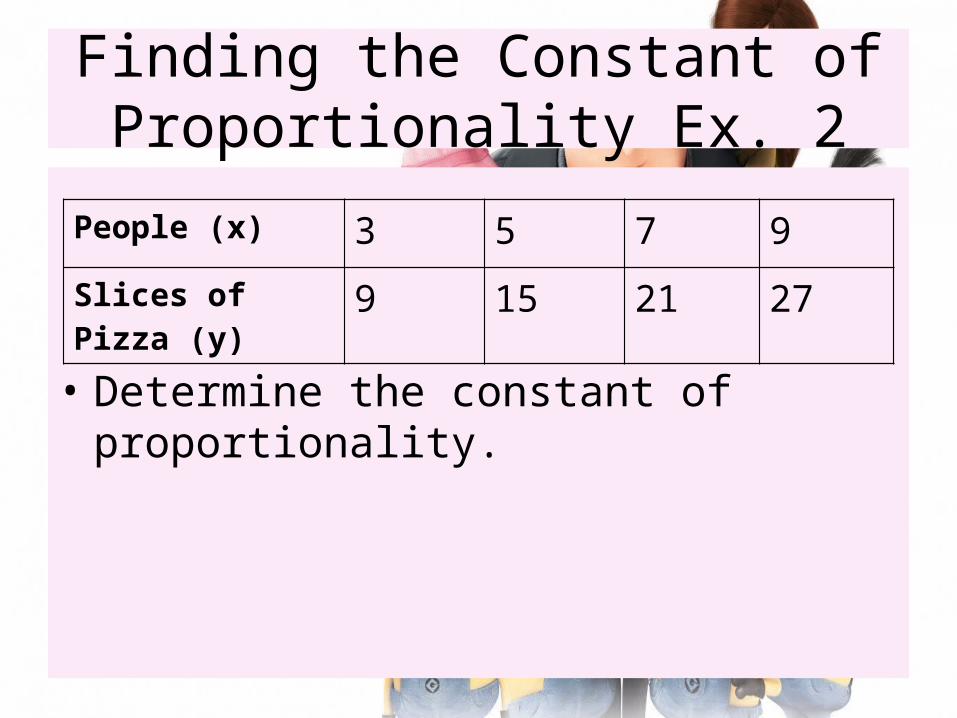
Finding the Constant of Proportionality Ex. 2
• Determine the constant of proportionality.
People (x) 3 5 7 9
Slices of Pizza (y) 9 15 21 27
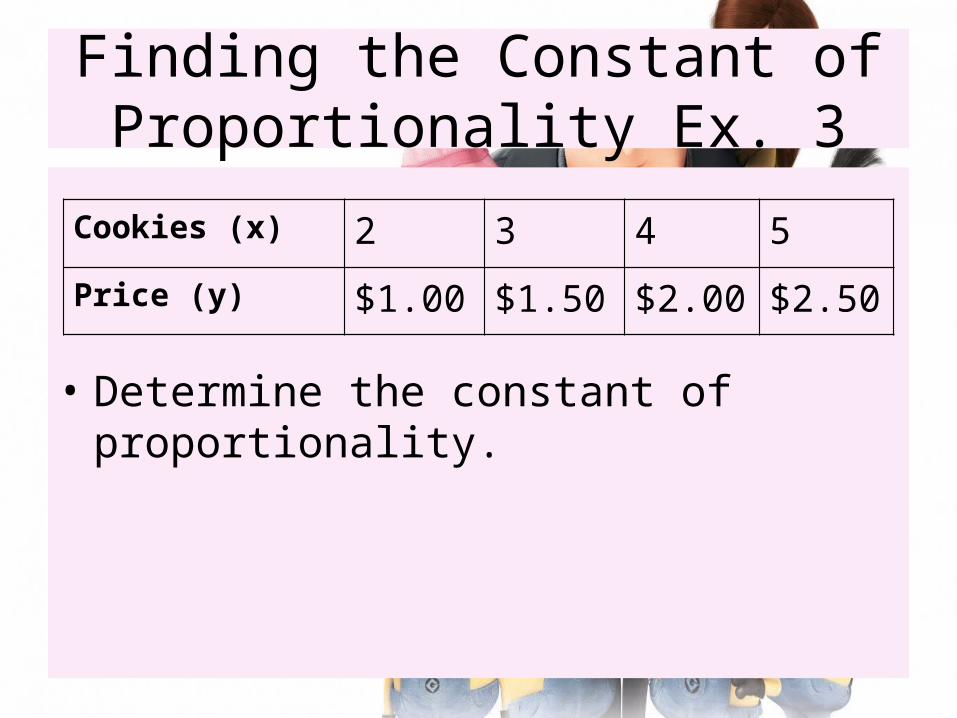
Finding the Constant of Proportionality Ex. 3
• Determine the constant of proportionality.
Cookies (x) 2 3 4 5
Price (y) $1.00 $1.50 $2.00 $2.50
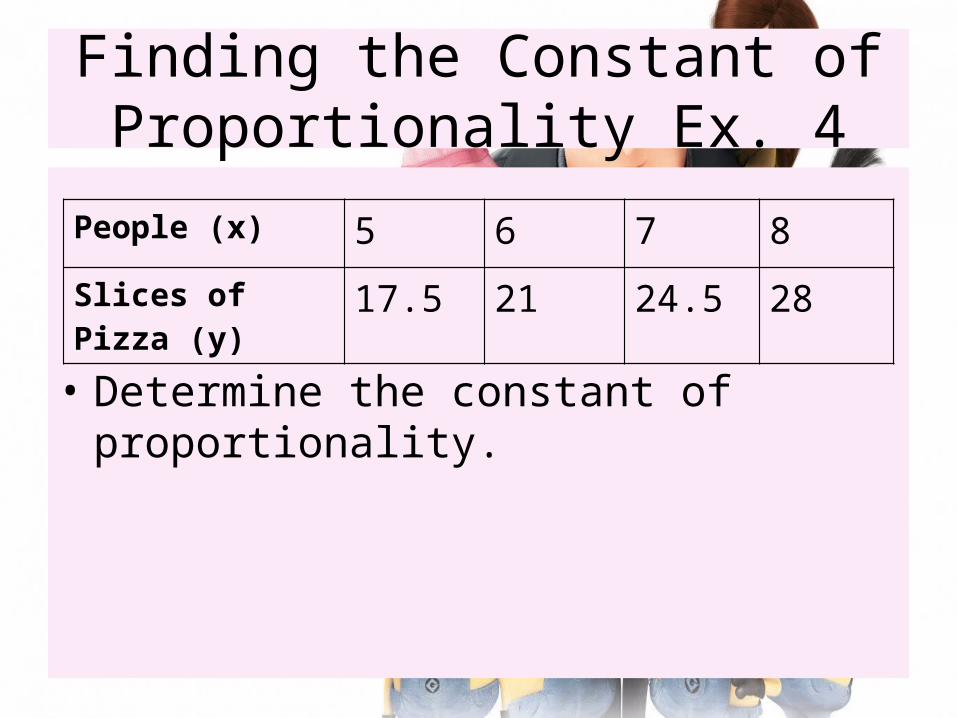
Finding the Constant of Proportionality Ex. 4
• Determine the constant of proportionality.
People (x) 5 6 7 8
Slices of Pizza (y) 17.5 21 24.5 28
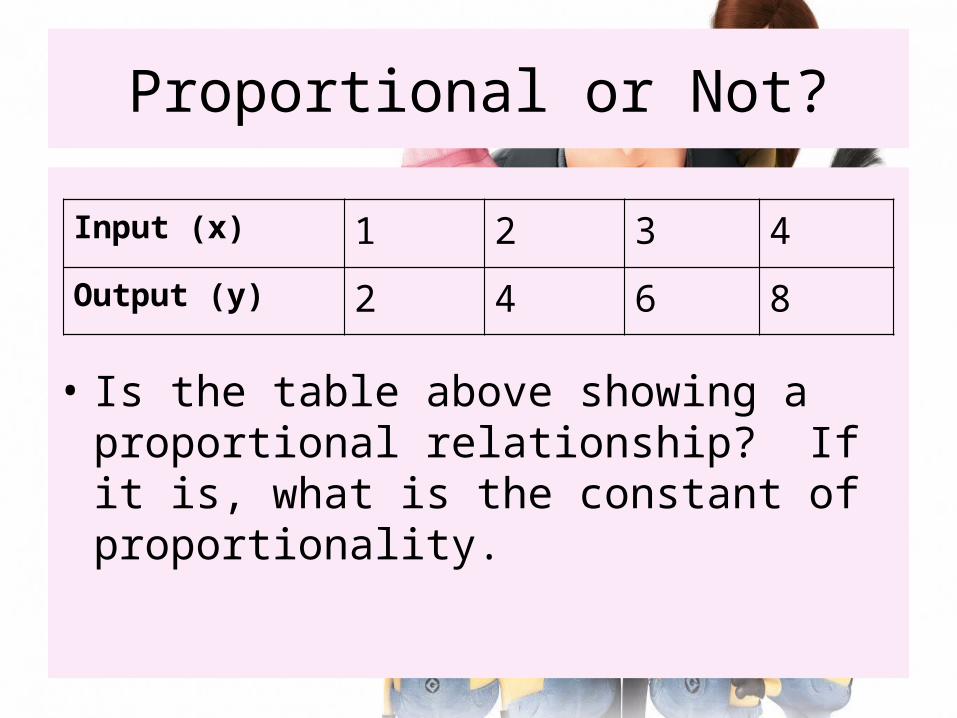
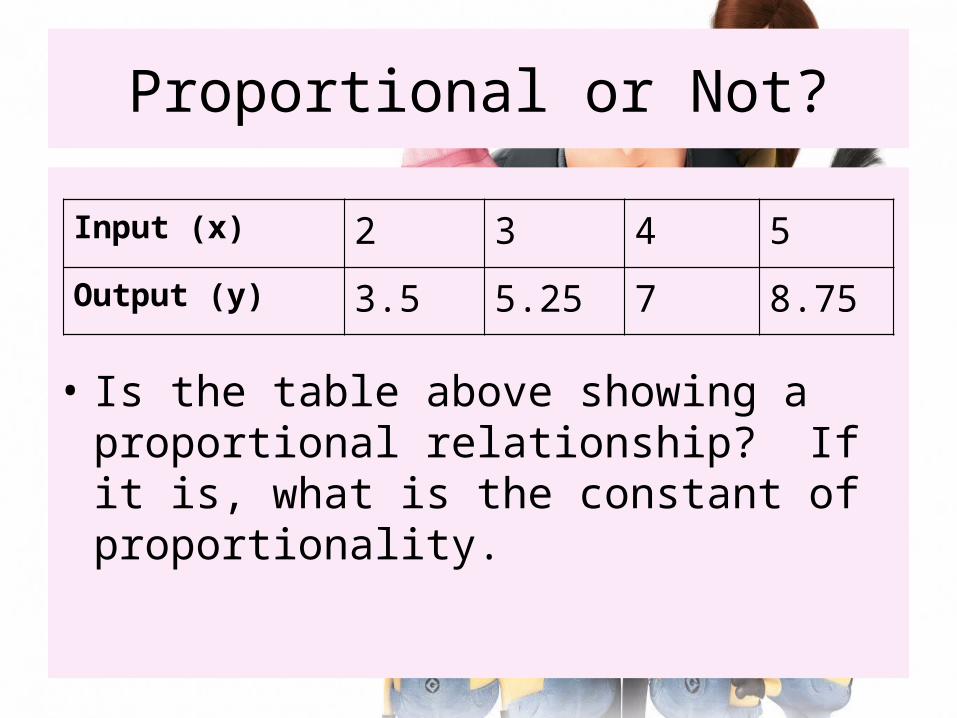
Proportional or Not?
• Is the table above showing a proportional relationship? If it is, what is the constant of proportionality.
Input (x) 1 2 3 4
Output (y) 2 4 6 8

Proportional or Not?
• Is the table above showing a proportional relationship? If it is, what is the constant of proportionality.
Input (x) 3 4 5 6
Output (y) 18 24 30 34
Proportional or Not?
• Is the table above showing a proportional relationship? If it is, what is the constant of proportionality.
Input (x) 2 3 4 5
Output (y) 3.5 5.25 7 8.75
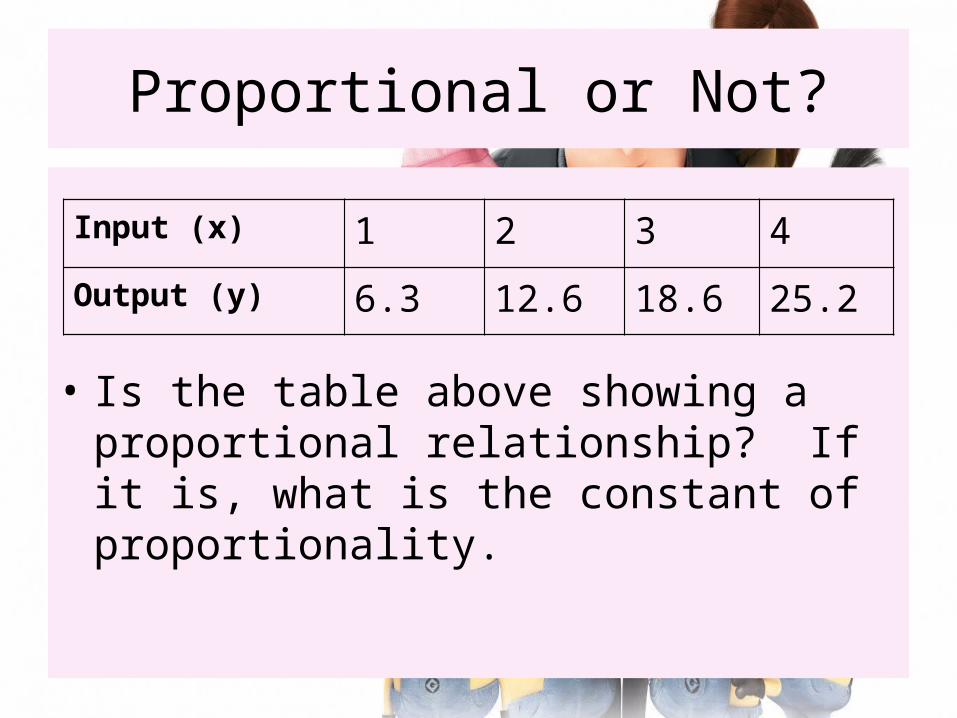
Proportional or Not?
• Is the table above showing a proportional relationship? If it is, what is the constant of proportionality.
Input (x) 1 2 3 4
Output (y) 6.3 12.6 18.6 25.2
Proportional or Not? - Graphs
• Two conditions:–Must pass through the origin–Must be a straight line
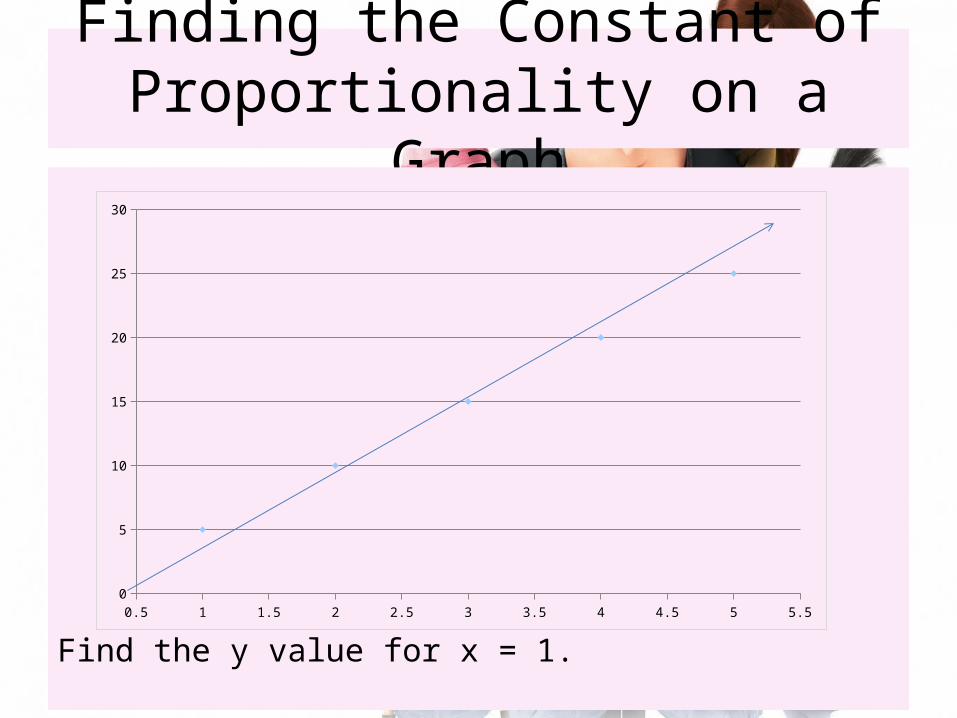
Finding the Constant of Proportionality on a Graph
Find the y value for x = 1.0.5 1 1.5 2 2.5 3 3.5 4 4.5 5 5.5
0
5
10
15
20
25
30
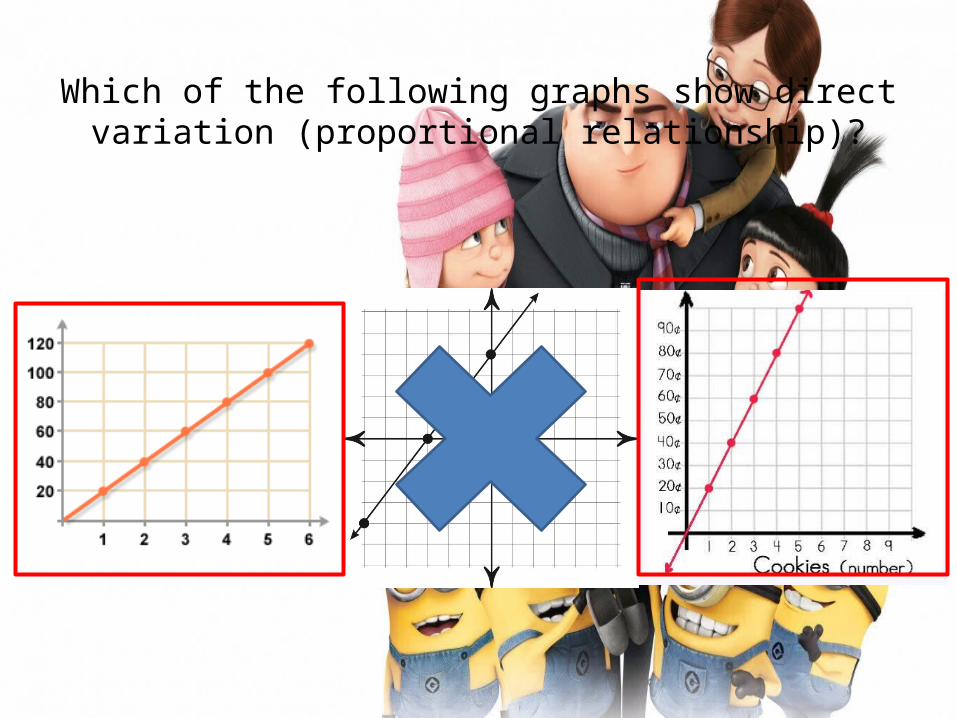
Which of the following graphs show direct variation (proportional relationship)?
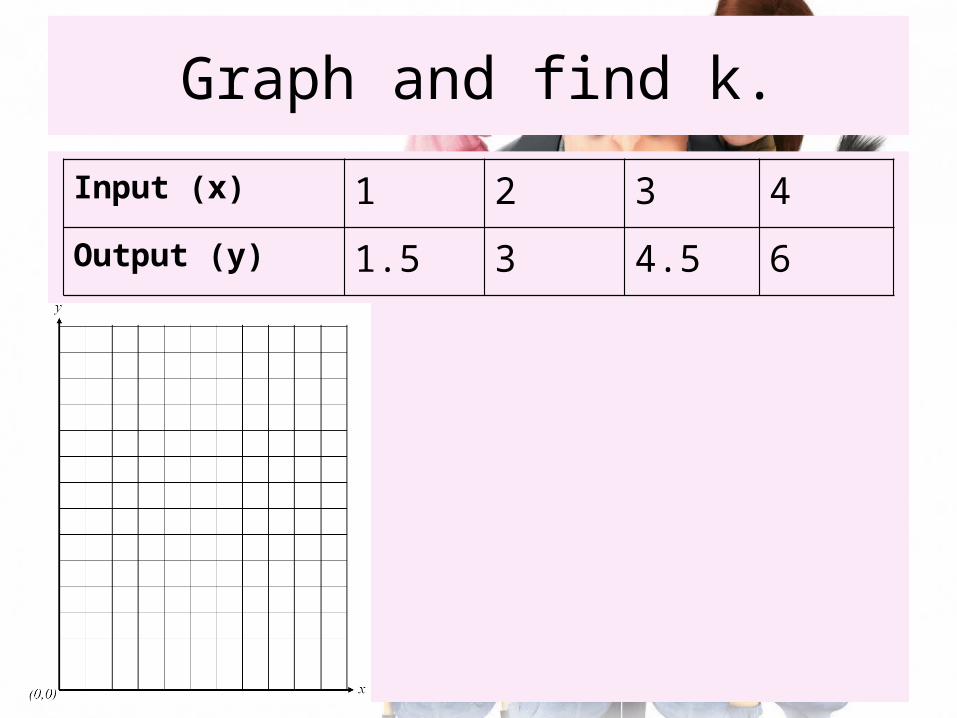
Graph and find k.Input (x) 1 2 3 4
Output (y) 1.5 3 4.5 6
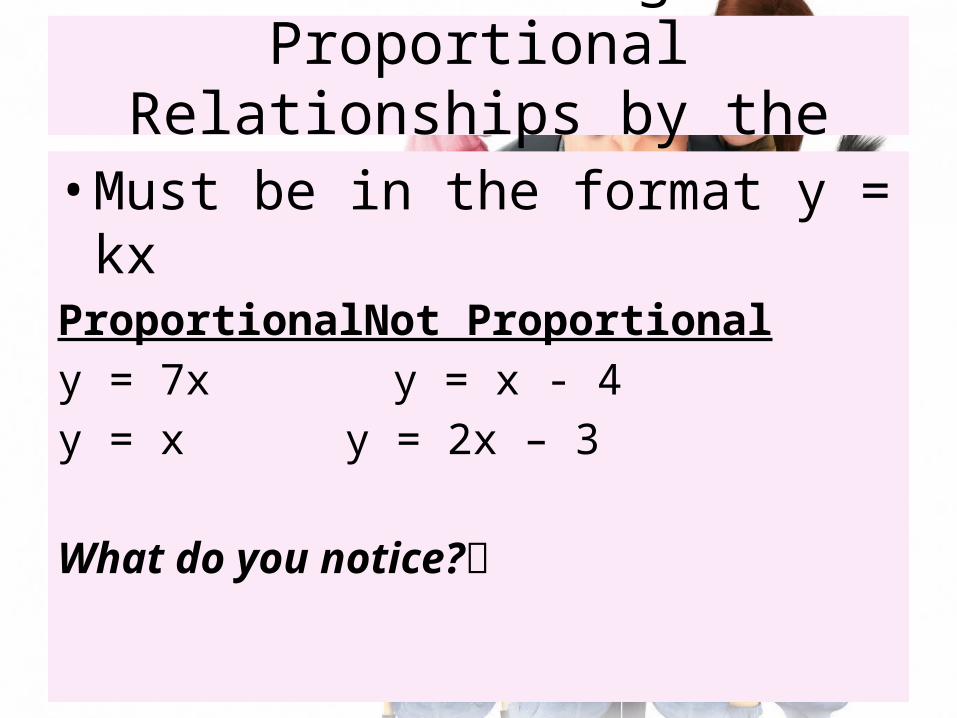
Determining Proportional Relationships by the Equations
• Must be in the format y = kxProportionalNot Proportionaly = 7x y = x - 4y = x y = 2x – 3
What do you notice?
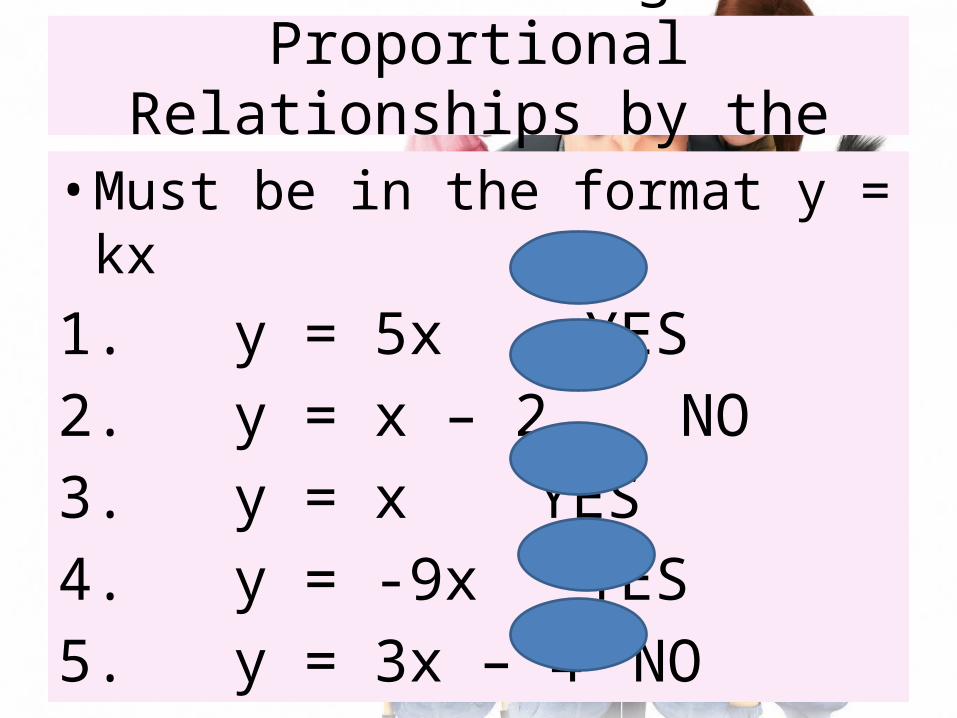
Determining Proportional Relationships by the Equations
• Must be in the format y = kx1. y = 5x YES2. y = x – 2 NO3. y = x YES4. y = -9x YES5. y = 3x – 4 NO