Embed Size (px)
Citation preview
NBER WORKING PAPER SERIES
IDENTIFYING EFFECTIVE CLASSROOM PRACTICES USING STUDENT ACHIEVEMENTDATA
Thomas J. KaneEric S. TaylorJohn H. Tyler
Amy L. Wooten
Working Paper 15803http://www.nber.org/papers/w15803
NATIONAL BUREAU OF ECONOMIC RESEARCH1050 Massachusetts Avenue
Cambridge, MA 02138March 2010
Authors are listed alphabetically. The authors would like to thank Douglas Staiger, Ron Ferguson,and participates at the Brown University seminar on Race and Inequality, the Program on EducationPolicy and Governance Colloquium at Harvard University, and The Institute for Research on EducationPolicy and Practice Speaker Series at Stanford University for helpful comments on previous draftsof this paper. We also acknowledge the Joyce Foundation for their generous support of this project,as well as the cooperation and support of the Cincinnati Public Schools. The views expressed hereinare those of the author(s) and do not necessarily reflect the views of the National Bureau of EconomicResearch.
© 2010 by Thomas J. Kane, Eric S. Taylor, John H. Tyler, and Amy L. Wooten. All rights reserved.Short sections of text, not to exceed two paragraphs, may be quoted without explicit permission providedthat full credit, including © notice, is given to the source.
Identifying Effective Classroom Practices Using Student Achievement DataThomas J. Kane, Eric S. Taylor, John H. Tyler, and Amy L. WootenNBER Working Paper No. 15803March 2010JEL No. I21,J45
ABSTRACT
Recent research has confirmed both the importance of teachers in producing student achievement growthand in the variability across teachers in the ability to do that. Such findings raise the stakes on ourability to identify effective teachers and teaching practices. This paper combines information fromclassroom-based observations and measures of teachers’ ability to improve student achievement asa step toward addressing these challenges. We find that classroom based measures of teaching effectivenessare related in substantial ways to student achievement growth. Our results point to the promise of teacherevaluation systems that would use information from both classroom observations and student test scoresto identify effective teachers. Our results also offer information on the types of practices that are mosteffective at raising achievement.
Thomas J. KaneHarvard Graduate School of EducationGutman Library, Room 455Appian WayCambridge, MA 02138and [email protected]
Eric S. TaylorHarvard Graduate School of Education50 Church St., 4th FloorCambridge, MA [email protected]
John H. TylerBox 193821 Manning WalkBrown UniversityProvidence, RI 02912and [email protected]
Amy L. WootenHarvard Graduate School of Education50 Church St., 4th FloorCambridge, MA [email protected]
1
1. Introduction
More than three decades ago, researchers began reporting large differences in student
achievement gains in different teachers’ classrooms (Hanushek (1971), Murnane and Phillips
(1981)). That literature (much of it done by economists) has undergone a resurgence in recent
years as school districts and state governments have begun to track achievement gains of similar
students assigned to different teachers (Aaronson, Borrow and Sander (2003), Gordon, Kane and
Staiger (2006), Kane, Rockoff and Staiger (2006), Rivkin, Hanushek and Kain (2005), Rockoff
(2004)). The magnitude of the variation in teacher effects is quite large, with most estimates of
the standard deviation ranging between .10 and .25 student-level standard deviations in math
(with somewhat smaller differences reported for English language arts).
The size and consistency of these findings—especially when combined with rising
anxiety about the lagging performance of U.S. students in international comparisons—has
produced a flurry of policy proposals to promote “teacher quality” or “teacher effectiveness”.
Despite the outpouring of interest, little has changed in the way that teachers are evaluated and
compensated, in the content of pre-service training, or in the type of professional development
offered.
The primary stumbling block has been a lack of consensus on valid measures for
recognizing and rewarding effective teaching. On one hand, a handful of districts have begun
using student achievement gains (adjusted for prior achievement and other student
characteristics) as a direct measure of teacher effectiveness (e.g. Hillsborough County Florida,
Dallas and Houston in Texas, Denver Colorado, New York City). However, even supporters of
such policies recognize their limitations. First, the estimates are currently feasible only in a
handful of grades and subjects, where there is mandated annual testing. In fact, less than a
quarter of K-12 teachers are likely to be in grades and subjects where such measures are
possible. Second, in the absence of evidence of effective teaching practices, such measures offer
little guidance on the nature of teacher training. Test-based measures allow one to identify
effective teachers on the job, but not to replicate them. Third, especially if teachers are not
provided with clear signals about legitimate ways in which to improve their practice, there is the
danger that teachers will focus instead on teaching test-taking skills at the cost of teaching other,
more difficult to measure (but valuable) skills. Aside from the above, some have questioned
whether the variation that has been labeled “teacher effects” reflects something different, such as
2
unmeasured differences in baseline characteristics between different classrooms (Rothstein
(2009)).
On the other hand, there are, as yet, few alternatives to the test-based measures providing
reliable valid approaches to scoring a teachers’ classroom practice. Despite decades of evidence
that teachers differ in their impacts on youth, the process of teacher evaluation remains a
perfunctory exercise. In a recent analysis of the teacher evaluation systems in 14 school districts,
Weisberg, Sexton, Mulhern, and Keeling (2009) report that most districts have only a binary
rating system, with more than 98 percent of teachers in the highest category (usually labeled
“satisfactory”). In Chicago, they found that less than one-half of one-percent of teachers were
rated “unsatisfactory”. The rest were not only satisfactory (6%), but excellent (25%) and superior
(69%). Based on such findings, many have questioned whether classroom observations are a
hopelessly flawed approach to assessing teacher-effectiveness.
In this paper, we test whether classroom observations—when done by trained
professionals, external to the school, using an elaborated set of standards—can identify teaching
practices most likely to raise achievement. Using data from the Cincinnati Public School (CPS)
system between 2001 and 2009, we find that they do. Such findings provide support for the idea
that “teacher effectiveness” need not be measured based on student achievement gains alone, but
that it should be possible to build a system which incorporates measures of practice as well.
2. Measuring Teacher Effectiveness
2.1 Measuring Teachers’ Classroom Practices
Teacher evaluation has traditionally been done by district and school administrators.
Historically the criteria were varied and largely subjective, training was poor, and the research
basis was under-developed (Stronge and Tucker (2003), Medley, Coker and Soar (1984)). In the
early 1980s several districts, including Toledo, Ohio and Rochester, New York launched “peer
review” systems (Kahlenberg (2007)). The introduction of peer review systems—in which
teachers are evaluated by other teachers from the same school or other schools—was
accompanied by an effort to be more consistent and clear about scoring rubrics, training scorers,
and record-keeping. Existing literature suggests that quality observation systems should be based
on clear, objective standards of practice; be conducted by multiple, trained evaluators; and
3
consider multiple observations and sources of data collected over time (Donaldson (2009), Goe
and Croft (2009), Toch and Rothman (2008), Danielson and McGreal (2000)).The accumulation
of detailed measurement of the classroom practices provides an opportunity for validation
studies, such as this one.
2.2. Cincinnati’s Teacher Evaluation System
Cincinnati’s Teacher Evaluation System (TES) program grew out of a 1997 collective
bargaining agreement between the Cincinnati Federation of Teachers and the Cincinnati Public
Schools. During the 1999-2000 school year Cincinnati Public Schools field tested the TES
system that utilizes trained evaluators, a specified and research-based evaluation rubric, and
includes multiple classroom observations of teachers during a year.
During the TES process, teachers generally receive four evaluations throughout the
school year by trained peer evaluators. Local school administrators are also trained on the same
rubric used by the external evaluators, and conduct one additional observation. In order to serve
as a peer evaluator, a qualified “lead teacher” must complete extensive training that includes
guidance and practice on how to collect and record evidence, and they must accurately score a
videotaped teaching exercise prior to beginning their term as a peer evaluator. All new teachers
are required to participate in TES during their first year in the district, and must do so again to
achieve career status (in common parlance, “tenure protection”). Career status teachers are
required to participate in TES every fifth year.
The TES rating system is based on Charlotte Danielson’s Enhancing Professional
Practice: A Framework for Teaching. The rubric associated with the “Danielson framework”
includes four domains, fifteen standards and 32 elements that describe the practices, skills, and
characteristics that effective teachers should possess and employ. The domains cover four
practice areas including preparation, classroom management, pedagogical and content
knowledge and application, and collegial responsibilities and engagement. The four domains in
which a teacher is evaluated are: (Domain 1) Planning and Preparing for Student Learning,
(Domain 2) Creating an Environment for Student Learning, (Domain 3) Teaching for Student
Learning, and (Domain 4) Professionalism.
Within each domain, teachers are evaluated against a set of standards, which themselves
are subdivided into elements. Each element has language that describes performance at each

4
level of the rubric: Distinguished, Proficient, Basic, and Unsatisfactory, with evaluators
assigning respective scores of 4, 3, 2, and 1 to these rubric levels.1
<Figure 1 about here>
As an example, Figure 1
reproduces the standard and element language provided for Standard 3.2 which resides in
Domain 3, “Teaching for Student Learning.”
Standard 3.2 has only one element “Instructional Strategies & Content Knowledge,”
which, in turn, has two components (the bullet-level items). A teacher will be evaluated on both
components within the element and the result will be a standard-level score for that observation.
For example, if an evaluator records that a teacher provides accurate information to students in a
way that supports learning then that teacher would receive a score of 3 from the evaluator for
that observation. Data from classroom observations are used in evaluating a teacher on domains
2 and 3, while evidence for domains 1 and 4 comes from the collection of documents such as
lesson plans and goes into a portfolio that is reviewed by the evaluators. Only the first
observation in an evaluation cycle is announced, the remaining observations may be
unannounced, and evaluators are required to submit the evaluation report to the teacher being
evaluated within ten working days of the observation.
At the end of the year evaluators consider evidence from all observations and submitted
evidence for a given teacher in arriving at a final formal standard score for each of the fifteen
standards within domains 1-4. These end-of-year scores are based on a “preponderance of the
evidence” and can take into account improvement in observed practice over the year and thus are
not necessarily simple averages of the scores that a teacher received across all observations for
the year. Once final standard scores are determined, evaluators use those scores to determine
final Domain level scores, which are very close to the simple average of the standard scores
within each domain.2
In their final end-of-year report teachers are provided with the final
domain-level scores.
2.3 Measuring a Teacher’s Effect on Student Achievement Gains
1 The complete TES rubric is available on the Cincinnati Public Schools website: http://www.cps-k12.org/employment/tchreval/stndsrubrics.pdf. 2 The final domain scores are computed using the computational table found in the Appendix.
5
Education researchers have long been interested in measuring a teacher’s contribution to
student achievement (for example Armour (1976), Hanushek (1971), Murnane and Phillips
(1981), Sanders and Rivers (1996), Rockoff (2004), Rivkin, Hanushek and Kain (2005), Gordon,
Kane and Staiger (2006)). While empirical strategies differ somewhat, the common objective is
to isolate an estimate of a teacher’s contribution to student achievement separate from the
student, class, school, and other contributors.
Researchers have made considerable progress in the empirical methods of estimating a
teacher’s contribution to student achievement. Several strategies are now widely practiced; for
example, modeling growth in achievement as opposed to achievement levels, and taking into
account the hierarchical structure of school systems (McCaffrey, Lockwood, Koretz and
Hamilton (2003)). This progress owes much to the proliferation of student achievement data
(particularly due to No Child Left Behind requirements), and advances in the software used to
estimate models (e.g., hierarchical and Bayesian approaches). Nevertheless, a number of
important statistical and interpretive questions remain (Todd and Wolpin (2003), McCaffrey,
Lockwood, Koretz, Louis and Hamilton (2004), Raudenbush (2004)).
Researchers recognize the possibility that non-random assignment of students to teachers
could distort measures of teacher effectiveness. Some teachers, the ubiquitous example states,
are assigned better students who would have achieved highly in many different classrooms.
Some researchers have questioned whether a teacher’s specific contribution can be accurately
estimated given the possibility that students are assigned to teachers based on unmeasured
characteristics not captured by test scores and demographics (Rothstein (2009)). Other
researchers, recognizing the potential for bias, are more optimistic (Koedel and Betts (2009)).
One recent study compared experimental (i.e., classes randomly assigned to teachers) and non-
experimental estimates of teachers’ effects on student achievement growth for a small sample of
teachers in Los Angeles. In that sample the non-experimental or observational measures
predicted the experimental measures with little bias—as long as the observational models
controlled for each student’s prior achievement (Kane and Staiger (2008)).
In a number of studies the effect of teachers in one grade fade out as students progress
through subsequent grades (McCaffrey, Lockwood, Koretz, Louis and Hamilton (2004), Kane
and Staiger (2008), Jacob, Lefgren and Sims (2008), Rothstein (2009)). Hypotheses for fade out
range from artifacts of empirical strategy to the heterogeneity of teacher quality within schools to
6
the relevance of skills gained this year for skills tested next year (Kane and Staiger (2008)).
Understanding the causes and structure of fade out is an emerging area of inquiry.
A few recent studies have found a relationship between a teacher’s measured effect on
student achievement and overall subjective administrator ratings ((Jacob and Lefgren (2008),
Rockoff and Speroni (2009), Rockoff, Staiger, Kane and Taylor (2009)). However, those studies
do not identify the criteria or behaviors principals used to make their judgments. Using data from
the early years of Cincinnati’s evaluation program, Holtzapple (2003) and Milanowski (2004a
and 2004b) demonstrated a positive relationship between teachers’ final overall scores and
student achievement. Our primary contribution to the literature is to link student achievement
gains to specific teaching practices and behaviors—as opposed to general judgments by
principals.
3. Data
3.1 Data from the TES System
Cincinnati Public Schools maintains detailed records for each TES evaluation, including
scores from each classroom observation and each portfolio review that contribute to the final
score. Our data contain records on 2,071 teacher TES evaluations covering 2000-01 through
2008-09 with a high of 292 in 2006-07 and a low of 112 in 2000-01. Each teacher was observed
in the classroom between one and eight times; 97 percent were observed between two and six
times.
While the only TES “scores” in the CPS personnel files are the end-of-year standard and
domain scores, all of the score sheets for each observation of a teacher going back to 2000-01 are
on file, and each score sheet contains the rubric language the evaluator used to score each
element for a given observation of a given teacher. Because the rubric language maps, with very
few exceptions, 1-to-1 onto numeric scores, we have been able to use the district’s files to create
an electronic file of CPS teachers’ TES scores at the element level for all teacher observations
from 2000-01 through 2007-08. Teachers in the data will have scores in domains 2 and 3 that
respond to each time they were observed in an evaluation year.
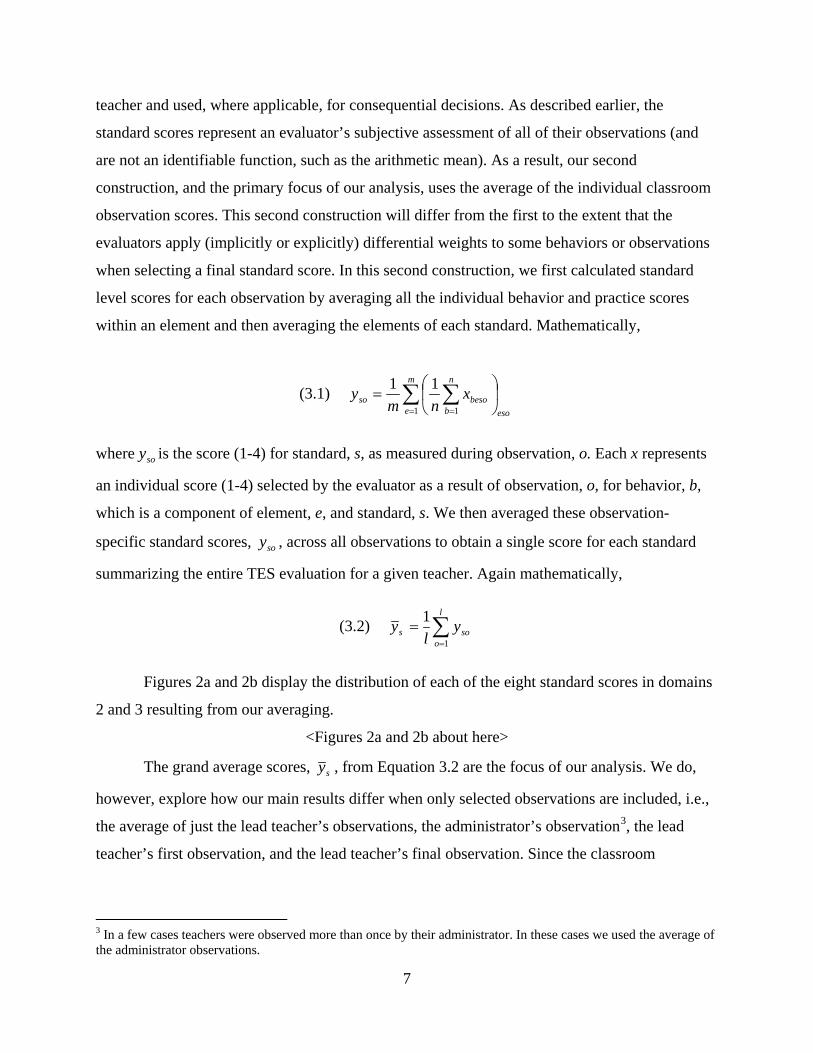
We focus on two constructions of TES scores. The first is simply the final standard and
domain level scores recorded in Cincinnati’s records. These are the formal scores reported to the
7
teacher and used, where applicable, for consequential decisions. As described earlier, the
standard scores represent an evaluator’s subjective assessment of all of their observations (and
are not an identifiable function, such as the arithmetic mean). As a result, our second
construction, and the primary focus of our analysis, uses the average of the individual classroom
observation scores. This second construction will differ from the first to the extent that the
evaluators apply (implicitly or explicitly) differential weights to some behaviors or observations
when selecting a final standard score. In this second construction, we first calculated standard
level scores for each observation by averaging all the individual behavior and practice scores
within an element and then averaging the elements of each standard. Mathematically,
(3.1) ∑ ∑= =
=
m
e eso
n
bbesoso x
nmy
1 1
11
where soy is the score (1-4) for standard, s, as measured during observation, o. Each x represents
an individual score (1-4) selected by the evaluator as a result of observation, o, for behavior, b,
which is a component of element, e, and standard, s. We then averaged these observation-
specific standard scores, soy , across all observations to obtain a single score for each standard
summarizing the entire TES evaluation for a given teacher. Again mathematically,
(3.2) ∑=
=l
osos y
ly
1
1
Figures 2a and 2b display the distribution of each of the eight standard scores in domains
2 and 3 resulting from our averaging.
<Figures 2a and 2b about here>
The grand average scores, sy , from Equation 3.2 are the focus of our analysis. We do,
however, explore how our main results differ when only selected observations are included, i.e.,
the average of just the lead teacher’s observations, the administrator’s observation3
3 In a few cases teachers were observed more than once by their administrator. In these cases we used the average of the administrator observations.
, the lead
teacher’s first observation, and the lead teacher’s final observation. Since the classroom
8
observation component of TES is only relevant in domains 2 and 3, our analysis will focus
primarily on these domains.4
We estimate that differences in evaluator (i.e., lead teachers and administrators) account
for about one-quarter (23%) of the variation in TES scores from individual observations (i.e., the
soy scores), and that the teachers being evaluated account for just under half (45%) of the
variation. Residual variation from observation to observation for the same teacher account for the
just under one-third (32%).5
One additional characteristic of the TES data is important to note. Cincinnati updated the
TES rubric twice during the period under study. TES evaluators used the original version from
2000-01 through 2002-03, a second version for 2003-04 and 2004-05, and the current version
beginning in 2005-06. All three versions measured the same constructs using essentially the
same language to describe behaviors and practices.
6
Nevertheless, we use TES year fixed effects
in our regression specifications to help control for any residual differences attributable to the
different TES rubrics.
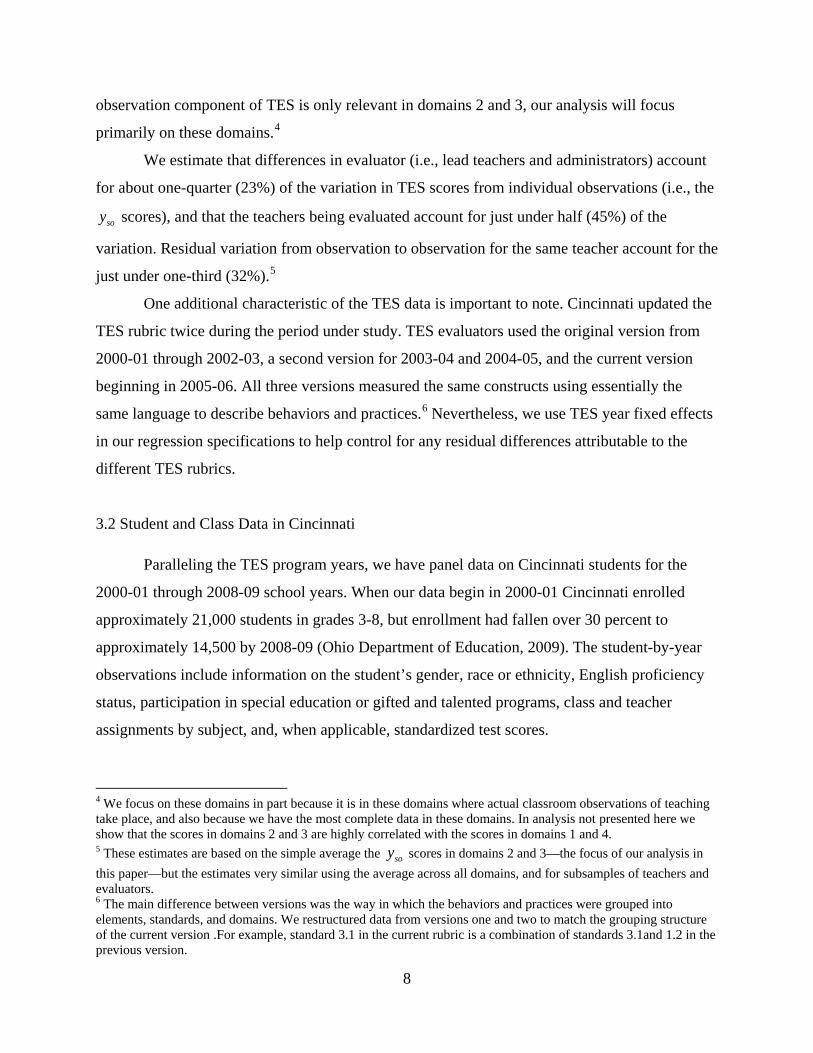
3.2 Student and Class Data in Cincinnati
Paralleling the TES program years, we have panel data on Cincinnati students for the
2000-01 through 2008-09 school years. When our data begin in 2000-01 Cincinnati enrolled
approximately 21,000 students in grades 3-8, but enrollment had fallen over 30 percent to
approximately 14,500 by 2008-09 (Ohio Department of Education, 2009). The student-by-year
observations include information on the student’s gender, race or ethnicity, English proficiency
status, participation in special education or gifted and talented programs, class and teacher
assignments by subject, and, when applicable, standardized test scores.
4 We focus on these domains in part because it is in these domains where actual classroom observations of teaching take place, and also because we have the most complete data in these domains. In analysis not presented here we show that the scores in domains 2 and 3 are highly correlated with the scores in domains 1 and 4. 5 These estimates are based on the simple average the soy scores in domains 2 and 3—the focus of our analysis in this paper—but the estimates very similar using the average across all domains, and for subsamples of teachers and evaluators. 6 The main difference between versions was the way in which the behaviors and practices were grouped into elements, standards, and domains. We restructured data from versions one and two to match the grouping structure of the current version .For example, standard 3.1 in the current rubric is a combination of standards 3.1and 1.2 in the previous version.
9
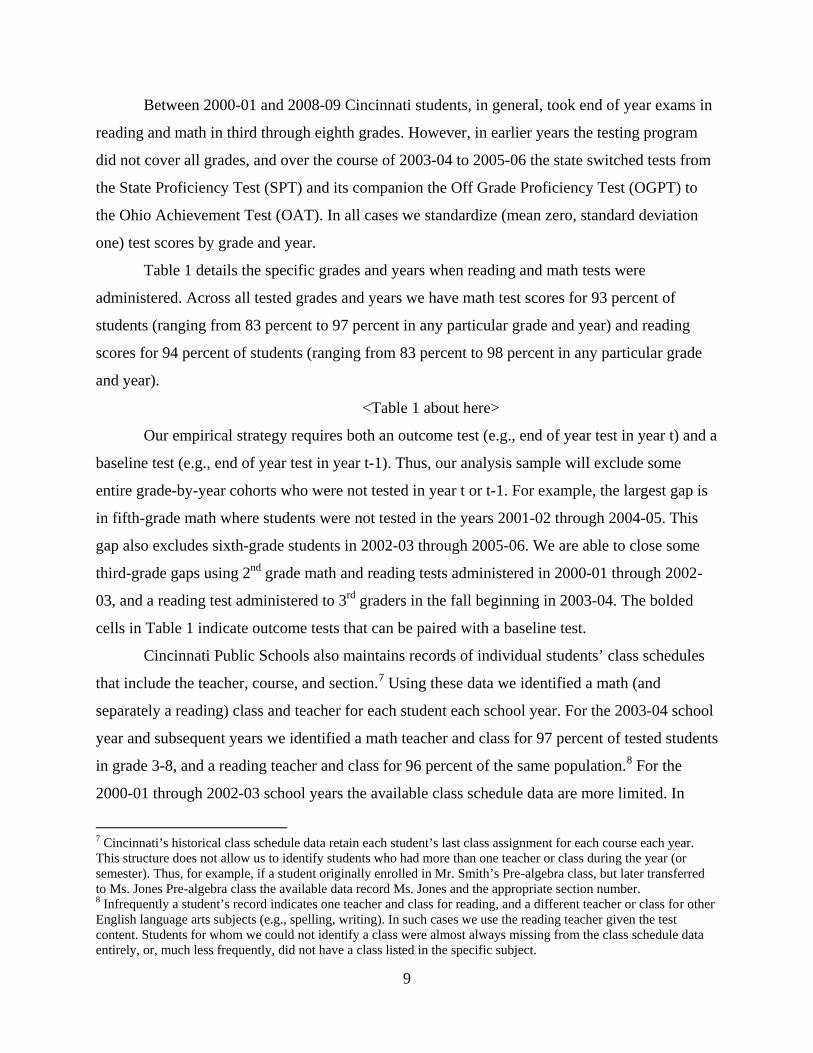
Between 2000-01 and 2008-09 Cincinnati students, in general, took end of year exams in
reading and math in third through eighth grades. However, in earlier years the testing program
did not cover all grades, and over the course of 2003-04 to 2005-06 the state switched tests from
the State Proficiency Test (SPT) and its companion the Off Grade Proficiency Test (OGPT) to
the Ohio Achievement Test (OAT). In all cases we standardize (mean zero, standard deviation
one) test scores by grade and year.
Table 1 details the specific grades and years when reading and math tests were
administered. Across all tested grades and years we have math test scores for 93 percent of
students (ranging from 83 percent to 97 percent in any particular grade and year) and reading
scores for 94 percent of students (ranging from 83 percent to 98 percent in any particular grade
and year).
<Table 1 about here>
Our empirical strategy requires both an outcome test (e.g., end of year test in year t) and a
baseline test (e.g., end of year test in year t-1). Thus, our analysis sample will exclude some
entire grade-by-year cohorts who were not tested in year t or t-1. For example, the largest gap is
in fifth-grade math where students were not tested in the years 2001-02 through 2004-05. This
gap also excludes sixth-grade students in 2002-03 through 2005-06. We are able to close some
third-grade gaps using 2nd grade math and reading tests administered in 2000-01 through 2002-
03, and a reading test administered to 3rd graders in the fall beginning in 2003-04. The bolded
cells in Table 1 indicate outcome tests that can be paired with a baseline test.
Cincinnati Public Schools also maintains records of individual students’ class schedules
that include the teacher, course, and section.7 Using these data we identified a math (and
separately a reading) class and teacher for each student each school year. For the 2003-04 school
year and subsequent years we identified a math teacher and class for 97 percent of tested students
in grade 3-8, and a reading teacher and class for 96 percent of the same population.8
7 Cincinnati’s historical class schedule data retain each student’s last class assignment for each course each year. This structure does not allow us to identify students who had more than one teacher or class during the year (or semester). Thus, for example, if a student originally enrolled in Mr. Smith’s Pre-algebra class, but later transferred to Ms. Jones Pre-algebra class the available data record Ms. Jones and the appropriate section number.
For the
2000-01 through 2002-03 school years the available class schedule data are more limited. In
8 Infrequently a student’s record indicates one teacher and class for reading, and a different teacher or class for other English language arts subjects (e.g., spelling, writing). In such cases we use the reading teacher given the test content. Students for whom we could not identify a class were almost always missing from the class schedule data entirely, or, much less frequently, did not have a class listed in the specific subject.
10
these earlier years teacher and section information is mostly absent; indeed it would be entirely
absent but for the efforts of prior researchers studying the TES program (Holtzapple (2003)). To
facilitate that prior analysis, a previous research team identified student rosters for a number of
teachers evaluated by TES. Thus we can identify a math and reading teacher for selected students
in 2000-01 through 2002-03. This partial data is, however, useful for our empirical approach
(more in the following section) and so we include the earlier years.
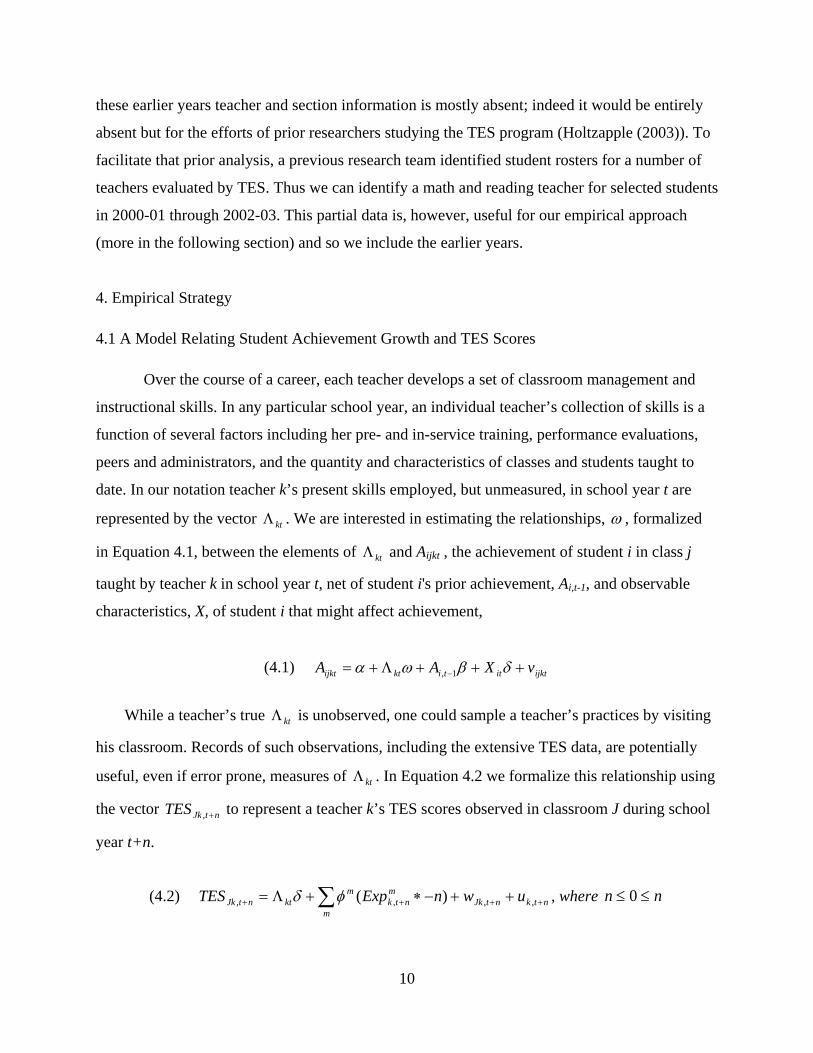
4. Empirical Strategy
4.1 A Model Relating Student Achievement Growth and TES Scores
Over the course of a career, each teacher develops a set of classroom management and
instructional skills. In any particular school year, an individual teacher’s collection of skills is a
function of several factors including her pre- and in-service training, performance evaluations,
peers and administrators, and the quantity and characteristics of classes and students taught to
date. In our notation teacher k’s present skills employed, but unmeasured, in school year t are
represented by the vector ktΛ . We are interested in estimating the relationships, ω , formalized
in Equation 4.1, between the elements of ktΛ and Aijkt , the achievement of student i in class j
taught by teacher k in school year t, net of student i's prior achievement, Ai,t-1, and observable
characteristics, X, of student i that might affect achievement,
(4.1) ijktittiktijkt vXAA +++Λ+= − δβωα 1,
While a teacher’s true ktΛ is unobserved, one could sample a teacher’s practices by visiting
his classroom. Records of such observations, including the extensive TES data, are potentially
useful, even if error prone, measures of ktΛ . In Equation 4.2 we formalize this relationship using
the vector ntJkTES +, to represent a teacher k’s TES scores observed in classroom J during school
year t+n.
(4.2) ntkntJkm
mntk
mktntJk uwnExpTES ++++ ++−∗+Λ= ∑ ,,,, )(φδ , where nn ≤≤ 0
11
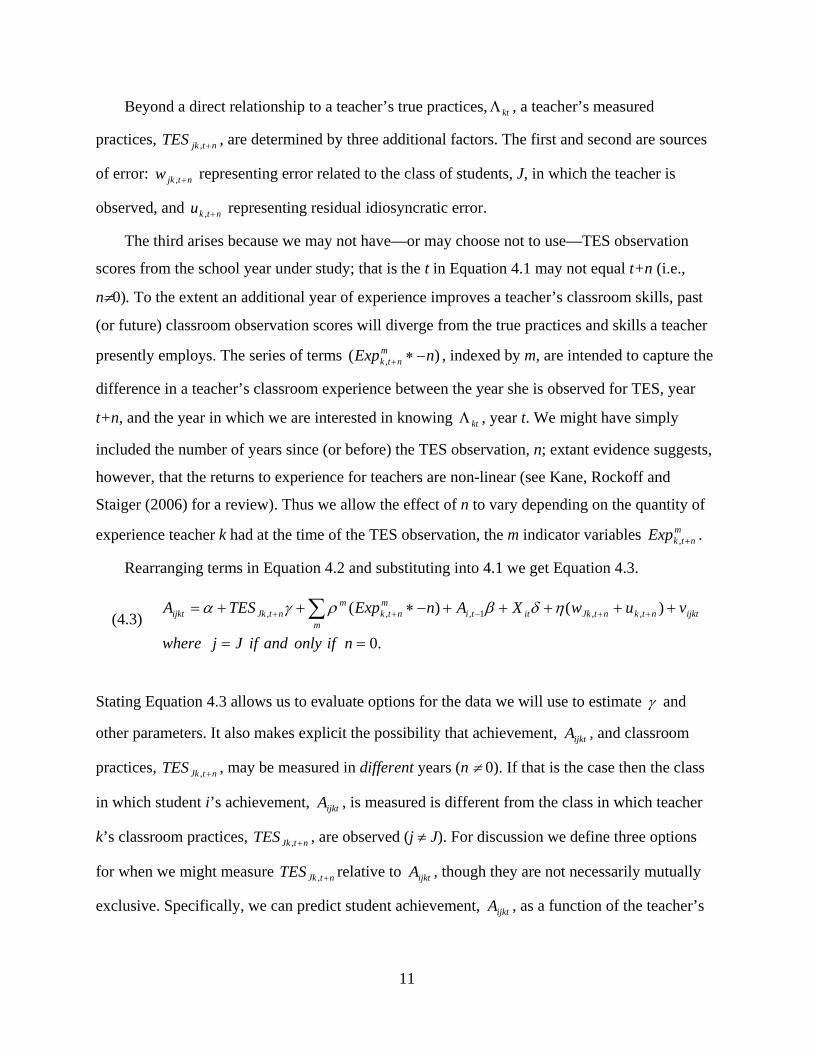
Beyond a direct relationship to a teacher’s true practices, ktΛ , a teacher’s measured
practices, ntjkTES +, , are determined by three additional factors. The first and second are sources
of error: ntjkw +, representing error related to the class of students, J, in which the teacher is
observed, and ntku +, representing residual idiosyncratic error.
The third arises because we may not have—or may choose not to use—TES observation
scores from the school year under study; that is the t in Equation 4.1 may not equal t+n (i.e.,
n≠0). To the extent an additional year of experience improves a teacher’s classroom skills, past
(or future) classroom observation scores will diverge from the true practices and skills a teacher
presently employs. The series of terms )( , nExpmntk −∗+ , indexed by m, are intended to capture the
difference in a teacher’s classroom experience between the year she is observed for TES, year
t+n, and the year in which we are interested in knowing ktΛ , year t. We might have simply
included the number of years since (or before) the TES observation, n; extant evidence suggests,
however, that the returns to experience for teachers are non-linear (see Kane, Rockoff and
Staiger (2006) for a review). Thus we allow the effect of n to vary depending on the quantity of
experience teacher k had at the time of the TES observation, the m indicator variables mntkExp +, .
Rearranging terms in Equation 4.2 and substituting into 4.1 we get Equation 4.3.
(4.3) .0
)()( ,,1,,,
==
+++++−∗++= ++−++ ∑nifonlyandifJjwhere
vuwXAnExpTESA ijktntkntJkittim
mntk
mntJkijkt ηδβργα
Stating Equation 4.3 allows us to evaluate options for the data we will use to estimate γ and
other parameters. It also makes explicit the possibility that achievement, ijktA , and classroom
practices, ntJkTES +, , may be measured in different years (n ≠ 0). If that is the case then the class
in which student i’s achievement, ijktA , is measured is different from the class in which teacher
k’s classroom practices, ntJkTES +, , are observed (j ≠ J). For discussion we define three options
for when we might measure ntJkTES +, relative to ijktA , though they are not necessarily mutually
exclusive. Specifically, we can predict student achievement, ijktA , as a function of the teacher’s
12
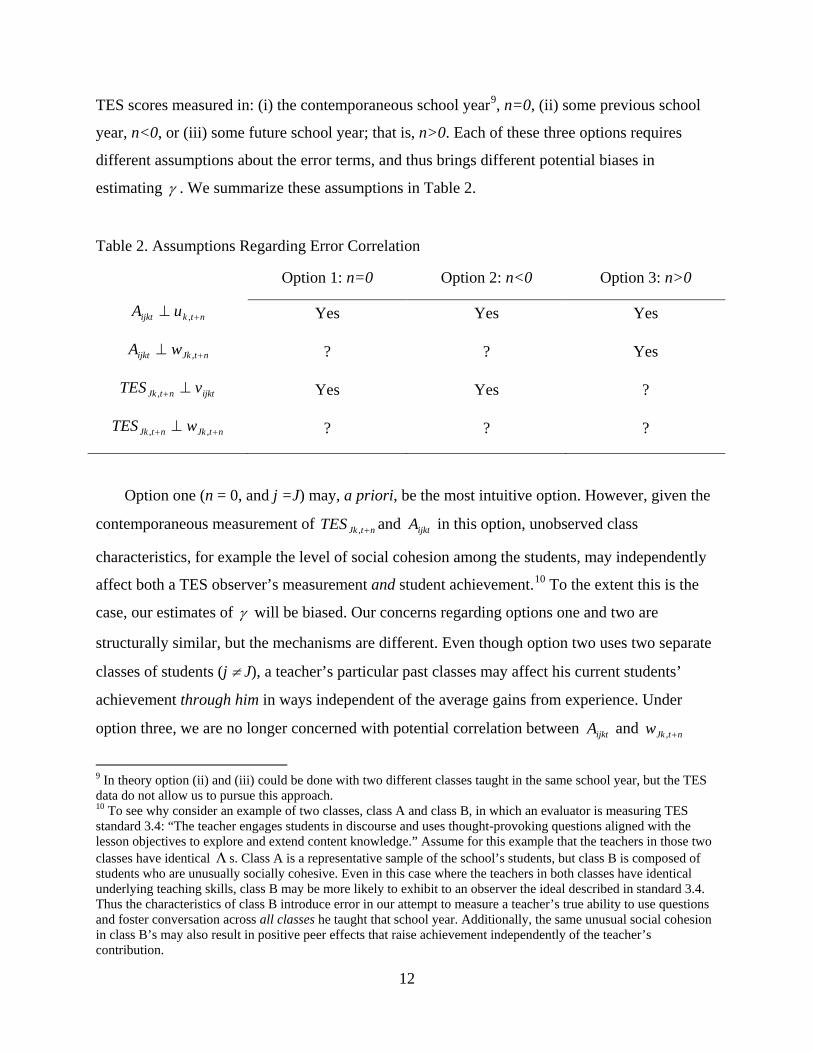
TES scores measured in: (i) the contemporaneous school year9
γ
, n=0, (ii) some previous school
year, n<0, or (iii) some future school year; that is, n>0. Each of these three options requires
different assumptions about the error terms, and thus brings different potential biases in
estimating . We summarize these assumptions in Table 2.
Table 2. Assumptions Regarding Error Correlation
Option 1: n=0 Option 2: n<0 Option 3: n>0
ntkijkt uA +⊥ , Yes Yes Yes
ntJkijkt wA +⊥ , ? ? Yes
ijktntJk vTES ⊥+, Yes Yes ?
ntJkntJk wTES ++ ⊥ ,, ? ? ?
Option one (n = 0, and j =J) may, a priori, be the most intuitive option. However, given the
contemporaneous measurement of ntJkTES +, and ijktA in this option, unobserved class
characteristics, for example the level of social cohesion among the students, may independently
affect both a TES observer’s measurement and student achievement.10
γ
To the extent this is the
case, our estimates of will be biased. Our concerns regarding options one and two are
structurally similar, but the mechanisms are different. Even though option two uses two separate
classes of students (j ≠ J), a teacher’s particular past classes may affect his current students’
achievement through him in ways independent of the average gains from experience. Under
option three, we are no longer concerned with potential correlation between ijktA and ntJkw +,
9 In theory option (ii) and (iii) could be done with two different classes taught in the same school year, but the TES data do not allow us to pursue this approach. 10 To see why consider an example of two classes, class A and class B, in which an evaluator is measuring TES standard 3.4: “The teacher engages students in discourse and uses thought-provoking questions aligned with the lesson objectives to explore and extend content knowledge.” Assume for this example that the teachers in those two classes have identical Λ s. Class A is a representative sample of the school’s students, but class B is composed of students who are unusually socially cohesive. Even in this case where the teachers in both classes have identical underlying teaching skills, class B may be more likely to exhibit to an observer the ideal described in standard 3.4. Thus the characteristics of class B introduce error in our attempt to measure a teacher’s true ability to use questions and foster conversation across all classes he taught that school year. Additionally, the same unusual social cohesion in class B’s may also result in positive peer effects that raise achievement independently of the teacher’s contribution.
13
because class J occurs in the future relative to class j. We are, however, concerned with the effect
of a teacher’s past classes on her future TES scores, again in ways not captured by the average
gains from experience.
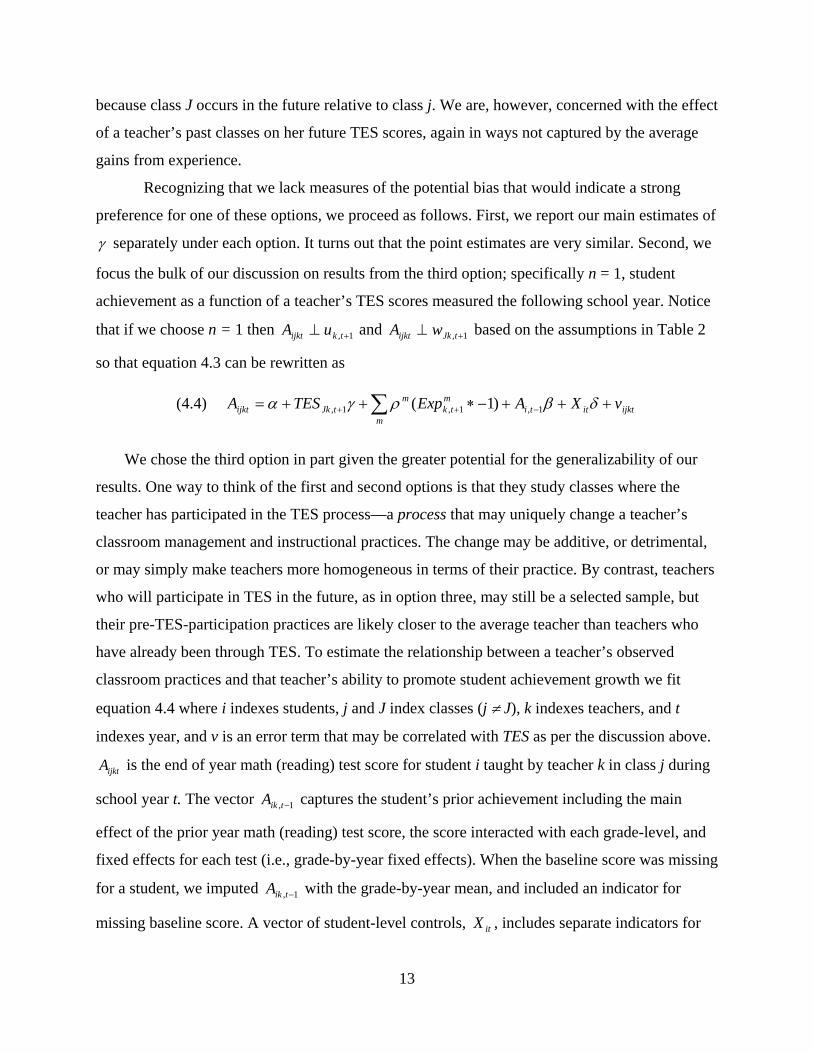
Recognizing that we lack measures of the potential bias that would indicate a strong
preference for one of these options, we proceed as follows. First, we report our main estimates of
γ separately under each option. It turns out that the point estimates are very similar. Second, we
focus the bulk of our discussion on results from the third option; specifically n = 1, student
achievement as a function of a teacher’s TES scores measured the following school year. Notice
that if we choose n = 1 then 1, +⊥ tkijkt uA and 1, +⊥ tJkijkt wA based on the assumptions in Table 2
so that equation 4.3 can be rewritten as
(4.4) ijktittim
mtk
mtJkijkt vXAExpTESA +++−∗++= −++ ∑ δβργα 1,1,1, )1(
We chose the third option in part given the greater potential for the generalizability of our
results. One way to think of the first and second options is that they study classes where the
teacher has participated in the TES process—a process that may uniquely change a teacher’s
classroom management and instructional practices. The change may be additive, or detrimental,
or may simply make teachers more homogeneous in terms of their practice. By contrast, teachers
who will participate in TES in the future, as in option three, may still be a selected sample, but
their pre-TES-participation practices are likely closer to the average teacher than teachers who
have already been through TES. To estimate the relationship between a teacher’s observed
classroom practices and that teacher’s ability to promote student achievement growth we fit
equation 4.4 where i indexes students, j and J index classes (j ≠ J), k indexes teachers, and t
indexes year, and v is an error term that may be correlated with TES as per the discussion above.
ijktA is the end of year math (reading) test score for student i taught by teacher k in class j during
school year t. The vector 1, −tikA captures the student’s prior achievement including the main
effect of the prior year math (reading) test score, the score interacted with each grade-level, and
fixed effects for each test (i.e., grade-by-year fixed effects). When the baseline score was missing
for a student, we imputed 1, −tikA with the grade-by-year mean, and included an indicator for
missing baseline score. A vector of student-level controls, itX , includes separate indicators for
14
student (i) gender, (ii) race or ethnicity, and whether, in our observed data, the student was ever
(iii) retained in grade or participating in (iv) special education, (v) gifted, or (vi) limited English
proficient programs. 1, +tJkTES is a vector of TES measures of the observed classroom practices
of teacher k in class J in year t+1.
The samples in our reported estimates sometimes differ intentionally, as when we compare
the results for grades 3-5 to grades 6-8, or the results for reading to math. But the samples also
sometimes differ due to the structure of the TES program and student testing regime. As
described earlier, not all teachers are evaluated in all years, and not all students are tested in all
years of our data. As a result of this uneven data, we have far more observations, for example,
when using any subsequent TES score, ntJkTES +, , n>0, than when using just TES scores from
just the immediately subsequent year, 1, +tJkTES . We have chosen to report results for the
maximum possible samples even though the teachers included necessarily vary. This limits
somewhat the comparability of our estimates across different constructions of TES scores.
Though not reported in this paper, we do find generally similar (if less precisely estimated)
results when restricting the samples across different constructions of TES scores to identical
teachers; when the results differ under such restricted samples we have noted the differences
below.
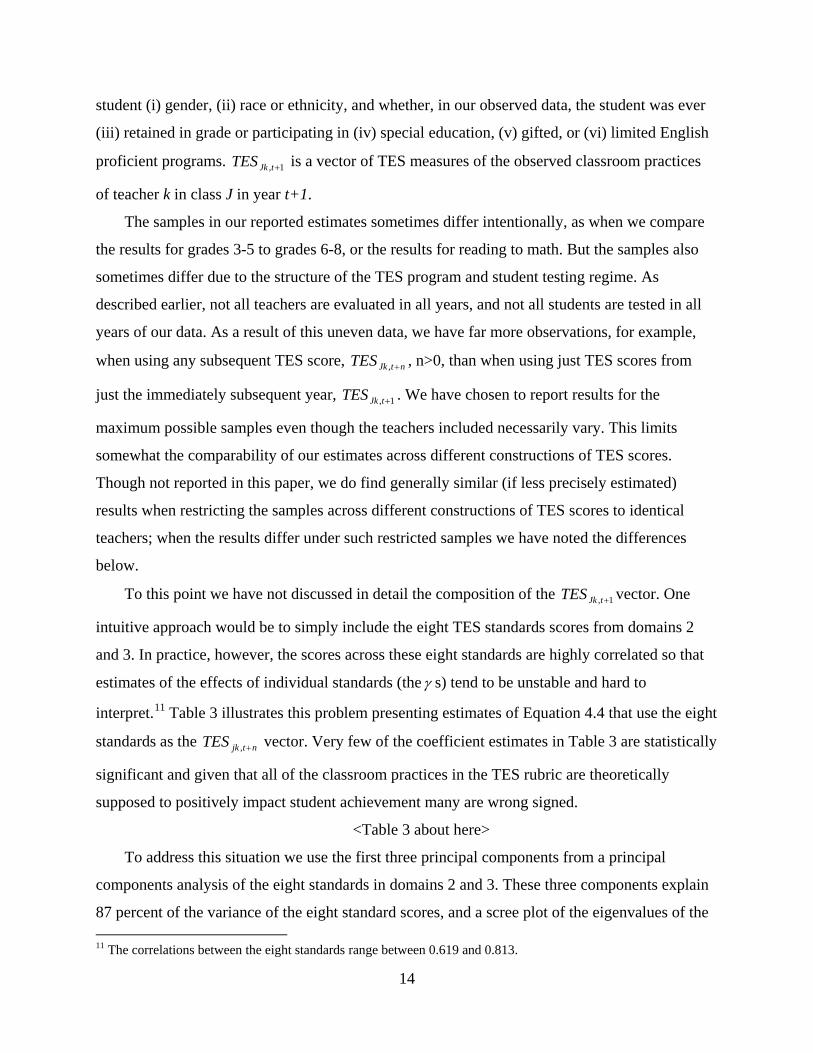
To this point we have not discussed in detail the composition of the 1, +tJkTES vector. One
intuitive approach would be to simply include the eight TES standards scores from domains 2
and 3. In practice, however, the scores across these eight standards are highly correlated so that
estimates of the effects of individual standards (theγ s) tend to be unstable and hard to
interpret.11
ntjkTES +,
Table 3 illustrates this problem presenting estimates of Equation 4.4 that use the eight
standards as the vector. Very few of the coefficient estimates in Table 3 are statistically
significant and given that all of the classroom practices in the TES rubric are theoretically
supposed to positively impact student achievement many are wrong signed.
<Table 3 about here>
To address this situation we use the first three principal components from a principal
components analysis of the eight standards in domains 2 and 3. These three components explain
87 percent of the variance of the eight standard scores, and a scree plot of the eigenvalues of the 11 The correlations between the eight standards range between 0.619 and 0.813.
15
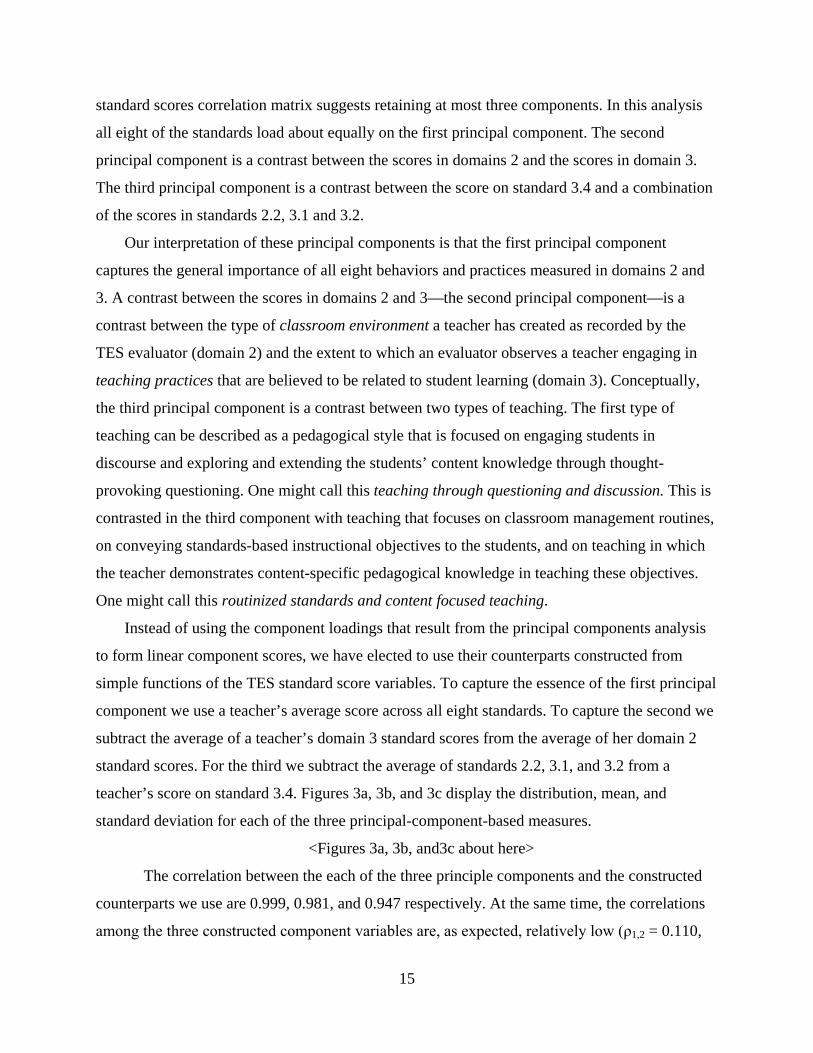
standard scores correlation matrix suggests retaining at most three components. In this analysis
all eight of the standards load about equally on the first principal component. The second
principal component is a contrast between the scores in domains 2 and the scores in domain 3.
The third principal component is a contrast between the score on standard 3.4 and a combination
of the scores in standards 2.2, 3.1 and 3.2.
Our interpretation of these principal components is that the first principal component
captures the general importance of all eight behaviors and practices measured in domains 2 and
3. A contrast between the scores in domains 2 and 3—the second principal component—is a
contrast between the type of classroom environment a teacher has created as recorded by the
TES evaluator (domain 2) and the extent to which an evaluator observes a teacher engaging in
teaching practices that are believed to be related to student learning (domain 3). Conceptually,
the third principal component is a contrast between two types of teaching. The first type of
teaching can be described as a pedagogical style that is focused on engaging students in
discourse and exploring and extending the students’ content knowledge through thought-
provoking questioning. One might call this teaching through questioning and discussion. This is
contrasted in the third component with teaching that focuses on classroom management routines,
on conveying standards-based instructional objectives to the students, and on teaching in which
the teacher demonstrates content-specific pedagogical knowledge in teaching these objectives.
One might call this routinized standards and content focused teaching.
Instead of using the component loadings that result from the principal components analysis
to form linear component scores, we have elected to use their counterparts constructed from
simple functions of the TES standard score variables. To capture the essence of the first principal
component we use a teacher’s average score across all eight standards. To capture the second we
subtract the average of a teacher’s domain 3 standard scores from the average of her domain 2
standard scores. For the third we subtract the average of standards 2.2, 3.1, and 3.2 from a
teacher’s score on standard 3.4. Figures 3a, 3b, and 3c display the distribution, mean, and
standard deviation for each of the three principal-component-based measures.
<Figures 3a, 3b, and3c about here>
The correlation between the each of the three principle components and the constructed
counterparts we use are 0.999, 0.981, and 0.947 respectively. At the same time, the correlations
among the three constructed component variables are, as expected, relatively low (ρ1,2 = 0.110,
16
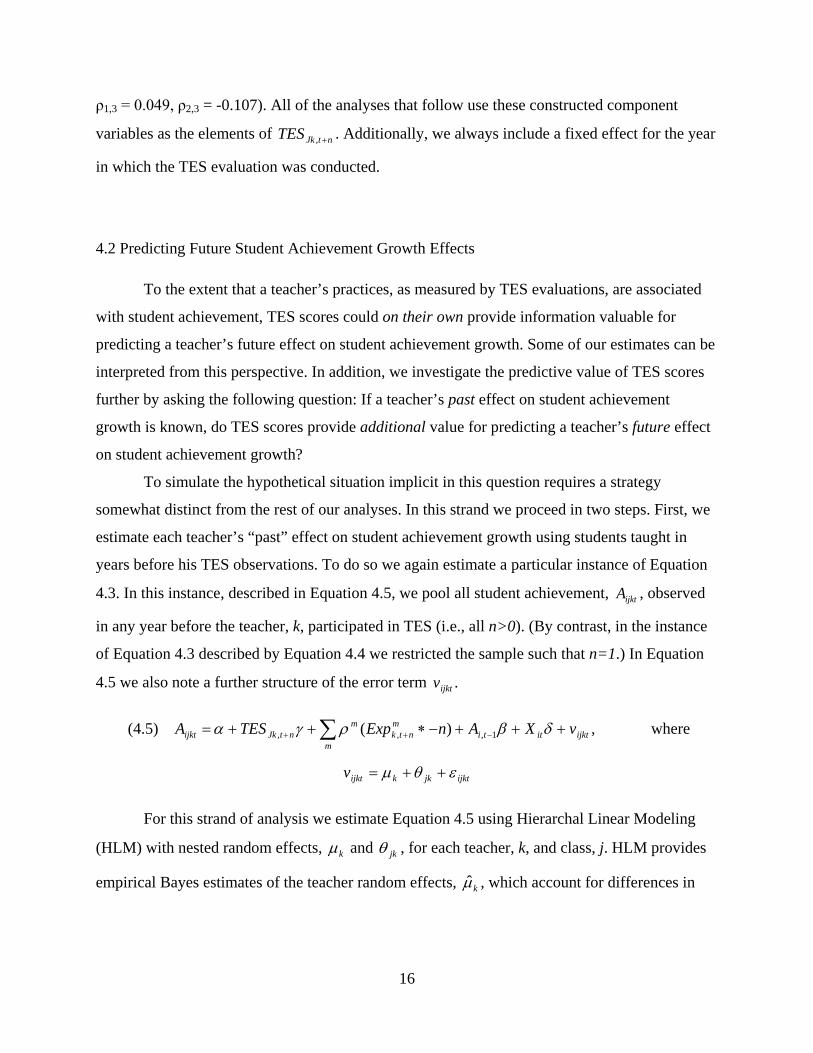
ρ1,3 = 0.049, ρ2,3 = -0.107). All of the analyses that follow use these constructed component
variables as the elements of ntJkTES +, . Additionally, we always include a fixed effect for the year
in which the TES evaluation was conducted.
4.2 Predicting Future Student Achievement Growth Effects
To the extent that a teacher’s practices, as measured by TES evaluations, are associated
with student achievement, TES scores could on their own provide information valuable for
predicting a teacher’s future effect on student achievement growth. Some of our estimates can be
interpreted from this perspective. In addition, we investigate the predictive value of TES scores
further by asking the following question: If a teacher’s past effect on student achievement
growth is known, do TES scores provide additional value for predicting a teacher’s future effect
on student achievement growth?
To simulate the hypothetical situation implicit in this question requires a strategy
somewhat distinct from the rest of our analyses. In this strand we proceed in two steps. First, we
estimate each teacher’s “past” effect on student achievement growth using students taught in
years before his TES observations. To do so we again estimate a particular instance of Equation
4.3. In this instance, described in Equation 4.5, we pool all student achievement, ijktA , observed
in any year before the teacher, k, participated in TES (i.e., all n>0). (By contrast, in the instance
of Equation 4.3 described by Equation 4.4 we restricted the sample such that n=1.) In Equation
4.5 we also note a further structure of the error term .ijktv
(4.5) ijktittim
mntk
mntJkijkt vXAnExpTESA +++−∗++= −++ ∑ δβργα 1,,, )( , where
ijktjkkijktv εθµ ++=
For this strand of analysis we estimate Equation 4.5 using Hierarchal Linear Modeling
(HLM) with nested random effects, kµ and jkθ , for each teacher, k, and class, j. HLM provides
empirical Bayes estimates of the teacher random effects, kµ̂ , which account for differences in
17
the reliability of the estimates from teacher to teacher by shrinking less reliable estimates toward
the mean (Raudenbush and Bryk (2002)).12
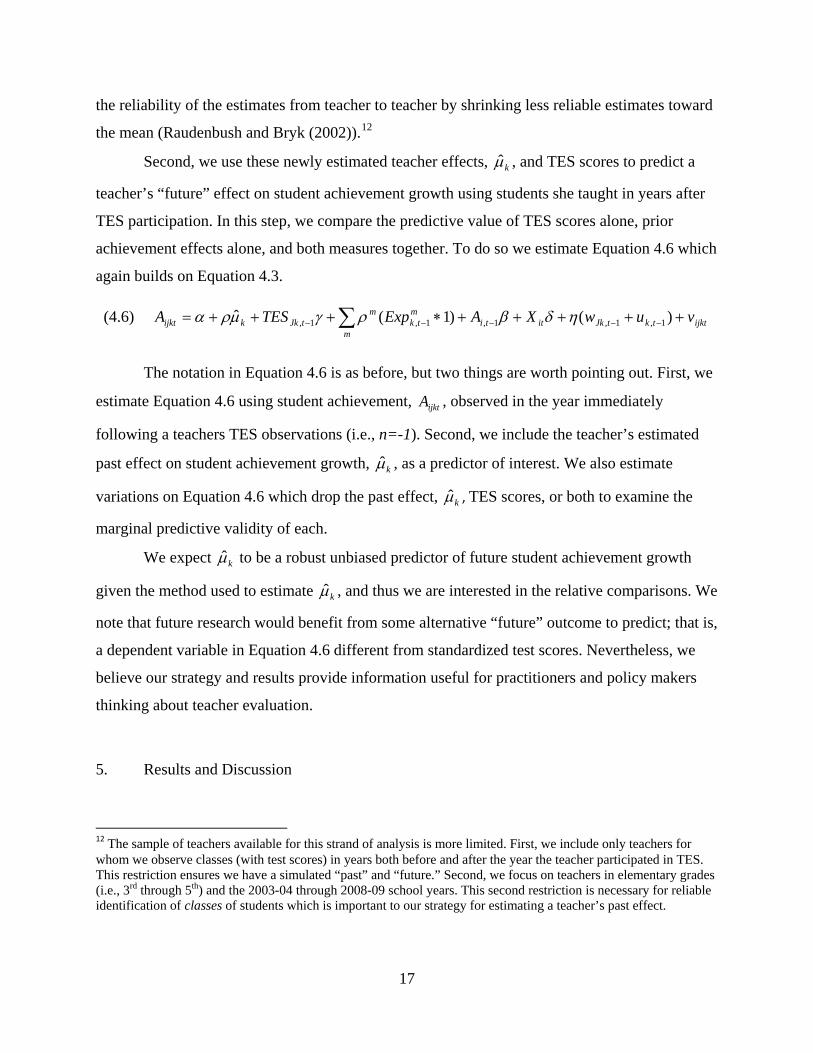
Second, we use these newly estimated teacher effects,
kµ̂ , and TES scores to predict a
teacher’s “future” effect on student achievement growth using students she taught in years after
TES participation. In this step, we compare the predictive value of TES scores alone, prior
achievement effects alone, and both measures together. To do so we estimate Equation 4.6 which
again builds on Equation 4.3.
(4.6) ijkttktJkittim
mtk
mtJkkijkt vuwXAExpTESA +++++∗+++= −−−−− ∑ )()1(ˆ 1,1,1,1,1, ηδβργµρα
The notation in Equation 4.6 is as before, but two things are worth pointing out. First, we
estimate Equation 4.6 using student achievement, ijktA , observed in the year immediately
following a teachers TES observations (i.e., n=-1). Second, we include the teacher’s estimated
past effect on student achievement growth, kµ̂ , as a predictor of interest. We also estimate
variations on Equation 4.6 which drop the past effect, kµ̂ , TES scores, or both to examine the
marginal predictive validity of each.
We expect kµ̂ to be a robust unbiased predictor of future student achievement growth
given the method used to estimate kµ̂ , and thus we are interested in the relative comparisons. We
note that future research would benefit from some alternative “future” outcome to predict; that is,
a dependent variable in Equation 4.6 different from standardized test scores. Nevertheless, we
believe our strategy and results provide information useful for practitioners and policy makers
thinking about teacher evaluation.
5. Results and Discussion
12 The sample of teachers available for this strand of analysis is more limited. First, we include only teachers for whom we observe classes (with test scores) in years both before and after the year the teacher participated in TES. This restriction ensures we have a simulated “past” and “future.” Second, we focus on teachers in elementary grades (i.e., 3rd through 5th) and the 2003-04 through 2008-09 school years. This second restriction is necessary for reliable identification of classes of students which is important to our strategy for estimating a teacher’s past effect.
18
5.1 Relationship Between TES and Student Achievement Growth
As a first step in exploring the relationship between student achievement and measured
classroom practices we asked a simple question: do TES evaluators record differences in the
classroom practices of teachers who tend to promote high versus low student achievement? To
answer this question we first used all of the available data to construct “value added” estimates
for teachers, using a model similar to Equation 4.4, without the TES vector and TES-related
variables, to obtain the estimates.13 We then divided teachers into quartiles of their value added
scores. Table 4 displays for each TES standard in domains 2 and 3 the results of t-tests of the
difference in mean TES standard scores between (1) teachers in the upper quartile of value added
versus those in the lowest value added quartile and (2) upper quartile teachers versus teachers in
the second quartile of value added. Instances of statistically different mean TES scores for higher
value added teachers versus lower value added teachers are marked with an “x” (when
statistically different at the 0.05 level) or a “~” (when statistically different at the 0.10 level).
Based on the results in Table 4 TES evaluators consistently give higher TES ratings to teachers
in the upper quartile of value added scores than they do to teachers in the first or second quartiles
of value added.14
<Table 4 about here>
Table 4 tells a simple but important story: according to TES evaluators, teachers who
tend to promote higher student achievement growth are teaching differently than teachers
associated with lower student achievement growth. We note that this finding is similar to that
reported by Boyd et al. (2009) in a pilot experiment they conducted in the New York City school
district where trained evaluators were randomly assigned a high value added teacher and a
second quartile value added teacher. The evaluators did not know the quartile of value added of
the teachers they observed and were basing their evaluations on a different set of evaluation
13 In this construction a teacher’s value added score was estimated using student achievement in the years prior to the TES evaluation year. 14 We also note that in all instances except for one the difference in mean scores between the top and bottom quartiles is larger than the difference between the top and second quartiles, as would be expected if there were real teaching differences along the distribution of value added and if the TES evaluators were observing and scoring these differences.
19
rubrics than that used by the TES system in Cincinnati. In this experimental setting Boyd et al.
report results that are very similar to those we report in Table 4. 15
The analysis that follows expands on the information in Table 4 as we ask: (1) to what
extent do TES scores predict student achievement growth, and (2) which classroom practices
measured by the TES process are the most effective at promoting student achievement? Table 5
has the first answers to these questions and reports the relationship between TES scores and
student achievement growth as specified in Equation 4.4. In Table 5 a one point increase in
average TES score is associated with a student achievement gain of about one-sixth of a standard
deviation in math and one-fifth in reading. A one point increase in the average scores across the
eight standards represents an increase of about two standard deviations (see Figure 3a).
Meanwhile, a teacher who scores higher on “classroom environment” (Domain 2) relative to
“classroom practices” (Domain 3) is predicted to produce additional student gains; with
coefficients of 0.25 standard deviations in math and 0.15 in reading. Last, a teacher who scores
higher on teaching through questioning and discussion (Standard 3.4) relative to routinized
standards and content focused teaching (Standards 2.2, 3.1 and 3.2) is predicted to produce
student gains in reading but not in math.
16
<Table 5 about here>
To place these results in the context of the TES system, the estimates on the first
principal component suggest that a student assigned a teacher whose average scores placed her in
the “Distinguished” category would, by the end of the school year, score more than one-fifth of a
standard deviation higher in reading than her peer in a class taught by a “Proficient” teacher.
Since the TES system’s “Distinguished” and “Proficient” labels are somewhat arbitrary
(and empirically indicate a very large difference), consider one student assigned a top-quartile
teacher on our overall TES measure and a second student assigned a bottom-quartile teacher. The
estimates in Table 5 suggest that at the end of the school year the first student would score 0.10
standard deviations higher than the second student in math and 0.125 standard deviations higher
in reading. If both students had begun the year at the 50th percentile, at the end of the school year
15 Table 4 is not based on a random assignment design and this raises the specter of evaluators assigning TES scores based on reputation rather than observed performance. While certain CPS teachers may have reputations of being “good” or “struggling” teachers and CPS evaluators may be aware of these reputations, it is highly unlikely that evaluators know where in the “value-added” distribution are the teachers they happen to be observing. 16 When we restrict the sample to teachers for whom we observe classes in all time periods, the results are similar but most similar for the first overall TES measure.
20
the first student would be four percentile points ahead in math, and five percentile points ahead
in reading.
The estimates on the second and third principal components in Table 5 require some
interpretation. The literal interpretation on the second component is that controlling for the
average TES score, a teacher whose domain 2 average is one point higher than her domain 3
average would generate student achievement gains in math that are 0.25 of a standard deviation
higher than a teacher whose average scores in these two domains are the same. The similar
estimate for reading achievement is 0.15 of a standard deviation. That is, the correct
interpretation of the estimated coefficients on the second principal component is that it is the
contrast between the domain 2 and domain 3 averages that matters (that is, among teachers with
similar mean scores). Likewise, when it comes to the third principal component it is a contrast in
teaching styles and emphasis that matters, at least when it comes to reading achievement gains.
One interpretation of the estimated effects of the second and third principal components
on student achievement gains is as follows.17
17 We thank Ron Ferguson for his very helpful insights on these interpretations and this section is largely the product of discussions and correspondence with him on this topic.
The contrasts in these principal components can be
thought of as measures of the relative emphases teachers place on the different things they do in
class while they are being observed by TES evaluators. Thus, the second component can be
viewed as the relative importance a teacher places on the climate of the classroom versus an
emphasis on the exact instructional practices in which she is engaged on the day she is being
observed. Taken literally, the estimates on the second component suggest that given two
classrooms whose teachers have the same overall average scores on domains 2 (classroom
environment) and 3 (instructional practices), the students in the classroom where the TES
evaluator rates the classroom environment to be better than the instructional practices of the
teacher are expected to learn more than the students in a classroom where the classroom
environment and instructional practices of the teacher are rated about equally by the TES
evaluator. For example, it might be that the students in the first class were observed to be better
behaved, more respectful to each other and the teacher, and spending more time on task than the
students in the second class, but the quality of the pedagogy was judged to be lower in the first
class than the second. The estimates in Table 5 suggest the students of the first teacher will learn
more than the students of the second teacher. One possible explanation for this result is that
21
Cincinnati might be operating in the range of the education production function where increases
in classroom environment inputs such as keeping kids on task have bigger payoffs to student
achievement than increases to inputs associated with instructional practice such as the extent to
which teachers “communicate standards-based instructional objectives” to students.
Unfortunately, we have no data that would allow exploration of this possibility.
As stated earlier, the third principal component is a contrast between what we call
teaching through questioning and discussion and routinized content and standards-based
instruction. This contrast suggests that at least when being observed teachers may be making a
tradeoff between placing an emphasis on engaging students in discussion and taking the class
time necessary to do that, and placing an emphasis on “managing transitions to maximize
instructional time,” “communicating standards-based instructional objectives,” and
demonstrating their own content knowledge “by using content specific instructional strategies.”
That is, it may not be possible to do everything during the class period in which a teacher is
being observed. In particular, if it takes time to engage students via questioning and discussion,
and the give and take of discussion, there may be fewer opportunities for a teacher to
demonstrate other instructional practices that are in the TES rubrics. The estimates in Table 5
suggest that to the extent that this is the case, then teachers observed making a tradeoff in favor
of instruction that uses questioning and discussion tend to produce higher student achievement in
reading but not in math.
The discussion over the exact meaning of the estimates on the second and third
components in Table 5 should not obscure the overarching message of the table: namely, that
TES scores are an important predictor of student achievement growth. In particular, while some
of the classroom practices measured by the TES process appear to be more important than others,
a teacher’s TES average across domains 2 and 3 is an important predictor of how well that
teacher’s students will perform. To provide a sense of how important, if fadeout is minimal, a
core of “Distinguished” teachers might well close the black-white achievement gap—often
estimated at one standard deviation—in five to six years relative to the same students being
taught by a core of “Proficient” teachers.
We next turn to the sensitivity of our estimates to our choice of using TES scores from
year t+1. Table 6 shows that our point estimates change somewhat when using TES in years
other than t+1. Most notably, the relationship between the domains 2 and 3 contrast and
22
achievement does not appear in other years (except for the “any following year” reading
estimate). By contrast, the coefficients for the overall TES score remain fairly consistent. Table 7
reports the results of formal comparisons of the coefficients in Table 6. A teacher’s overall TES
score is most strongly associated with achievement gains for the students he taught during the
year of the TES evaluation (i.e., 0.27 in math, 0.26 in reading). This stronger association need
not be unexpected because of the reasons discussed earlier having to do with the correlation
between contemporaneous measures of TES and student achievement growth particular to a
classroom environment. In the remainder of this paper we generally focus, for reasons discussed
earlier, on models that use TES scores measured in the t+1 year.
<Table 6 about here>
<Table 7 about here>
Our estimates of the coefficient on a teacher’s overall TES average (the first principal
component) are similar to estimates found by Jacob and Lefgren (2008) and others (for example
Rockoff and Speroni (2009)). In a specification similar to our own, Jacob and Lefgren report that
students assigned to teachers one standard deviation above the school mean of principal
subjective ratings score 0.058 and 0.137 standard deviations higher in reading and math
respectively. Our comparable estimate is the coefficient on the first principal component using
student achievement in year t (the middle column of Table 6). Normalizing those two
coefficients (the standard deviation is 0.444) we find a teacher one standard deviation above the
district mean is associated with 0.116 and 0.121 standard deviations of student growth in reading
and math respectively. The similarity, especially in math, may lead some to question the need for
the more detailed TES process—Jacob and Lefgren’s principals provided subjective ratings in a
survey. However, the TES program provides detail on the particular classroom practices that
predict achievement. In other words, with TES data we know why one teacher scored higher than
did another, and areas where a lower scoring teacher can begin thinking about making
improvements to practice.
The TES measures used in Tables 5 and 6 are based on an average of all observations
made by all evaluators during the year-long TES process. Table 8 explores how the results from
Table 5 differ when we use TES measures based on selected observations and evaluators. With a
few exceptions, the results are very similar under alternative combinations of the TES
observation scores. The TES scores based on an average of all observations, however, show
23
some of the strongest TES-achievement growth relationships.18
<Table 8 about here>
For reading achievement using
the formal TES scores assigned at the conclusion of the year produces results similar to the
simple average of all observations, but with smaller point estimates. However in math the point
estimates are much smaller and not statistically significant.
Cincinnati (and other districts) invest in a series of observations by peer evaluators and
administrators. The results in Table 8 also provide information for thinking about the marginal
benefit of those investments. First, different observations by the same lead teacher do provide
slightly different information about a teacher, especially in math. In both math and reading, a
teacher’s overall TES score based on just the first observation results in a stronger relationship
between the first TES principal component (the average TES score across the eight standards)
and achievement growth than this relationship based on just the last observation. The coefficient
in math falls from 0.16 to 0.09 but relatively less in reading from 0.20 to 0.15. Meanwhile, the
last lead teacher observation shows a stronger relationship between the “class
environment”/“class practices” contrast and student achievement than does the first lead teacher
evaluation. Second, the lead teacher’s observations taken together (i.e., the specification labeled
“Lead Teacher Average”) appear to provide marginally more information on net for predicting
student achievement than any single observation. This average captures information in the two
TES measures which contrast practices (the second and third TES principal components) that
was not predictive using only the first observation.
Third, in many evaluations systems there is skepticism about what administrator
observations add to the evaluation process. By our estimates the TES scores based just on the
administrator’s observation(s) compare favorably in predicting student achievement. While this
is true generally, the best comparison is probably the administrator’s (only) observation
compared to the lead teacher’s own first observation. In that pair-wise comparison results are
similar.19
18 Lead teachers provide all but one of the observations, thus, not surprisingly, and average of lead teacher observations produces results very similar to the average of all observations.
Administrators, to whom Cincinnati provides substantial TES training, may come to
conclusions not unlike the lead teachers given additional observations. Unfortunately the TES
system does not provide an opportunity to test this hypothesis.
19 Not all teachers were observed and scored by an administrator. When we restrict the sample to just teachers with an administrator’s observation the results are similar to those reported.

24
Our discussion to this point has pooled teachers at all our observed grade levels. Optimal
teaching practices may not, however, be equivalent as students mature and curriculum
progresses. In Table 9 we estimate our main results separately for elementary and middle grades
(i.e., 3-5 and 6-8 in our sample). In math our overall TES measure predicts student achievement
growth much more strongly in elementary grades (0.51 standard deviations) than in middle
grades (0.08 standard deviations and not significant). In reading the coefficient on our overall
TES measure is somewhat larger for middle grades (0.29 versus 0.19). The TES measure
contrasting teaching through questioning and discussion and routinized standards and content
focused teaching (the 3rd principal component) is also even more predictive in middle grades
when it comes to reading achievement. But the contrast of “class environment” and “class
practices” (2nd principal component) is much more strongly associated with student achievement
in elementary grades. It is unclear what drives these grade-level differences. The teaching
practices valuable in elementary grades may not, as some would argue, be equally valuable in
middle grades and visa versa. It is possible, however, that elementary and middle teachers in our
sample differ on other unmeasured characteristics (e.g., experience if the district’s hiring needs
varied between grade levels over the study period).
<Table 9 about here>
Table 9 also reports our main estimates separately for teachers with zero to four years of
experience, and five or more years of experience. Our estimates do suggest there may be
differences related to teacher experience, though there are far fewer young teachers making the
estimates much less precise.
We find these results encouraging first steps for the identification of classroom practices
associated with increased growth in student achievement. However, the heterogeneity across
subjects and grade levels, combined with the small samples that result when we stratify our data
by grade level, suggest caution in extending these relationships to other subjects and to high
school settings.
5.2 TES Growth
While a teacher’s TES scores from a single year contain information valuable for
predicting student achievement growth, we now turn to the question of changes over time in a
25
teacher’s TES scores. A first order question is whether the TES scores of the same teacher do
change over time, and the answer is that they do. In our data, which spans 2000-01 to 2008-09,
430 teachers participated in TES twice. On average teachers’ overall TES scores do increased by
0.30 points (s.d.=0.45) which is about two-thirds of a standard deviation.20
One potential mechanism for TES growth is that teachers become more skilled with
experience on the job and TES is able to measure this growth. A growing literature suggests that
a teacher’s effectiveness—as measured by growth in student achievement—improves during the
first few years in the classroom, but levels off after that (see Kane, Rockoff and Staiger (2006)
for a review). We find somewhat of an association between TES and experience. Table 10
reports the mean and standard deviation of our overall TES measure by years of experience. In
this pooled cross-sectional sample, the average TES score increases more from zero to three
years of experience than after the third year. The difference between the mean rating at year
three (3.21) is roughly three-quarters of a standard deviation higher than it is in year one (2.86)
or, alternatively stated, one-third of the distance between “Proficient” and “Distinguished.” The
correlation between years of experience and TES score is 0.34 in years zero to three and 0.12 in
years four plus. Table 10 also reports the average increase in a teacher’s TES score from the first
to the last observation within the school year. Again, within teachers and years growth is larger
in the first three years of teaching than in the years that follow.
<Table 10 about here>
In addition to returns to experience, there is a second plausible explanation for temporal
growth in TES scores. Over time teachers, individually and generally, have presumably become
more familiar with the TES rubric and the behaviors and practices it advocates. Increased
awareness of those behaviors could lead to growth in TES scores, either because the teachers
invest in learning and adopting TES behaviors permanently or because teachers strategically
demonstrate TES-like behaviors when under observation. 21
20 While the amount of time between TES evaluations varied from one to seven years (with an overwhelming mode of three years) the average change was fairly constant no matter the intervening time period.
The TES data alone cannot
differentiate between these possibilities.
21 Average TES scores may also increase over time if teachers who perform poorly in TES systematically leave the district. This is a distinct possibility. Our data do not provide reliable information when a teacher left the district so we cannot test this hypothesis directly. In a separate qualitative research project our colleagues report that between 2002-03 and 2007-08 Cincinnati did not renew contracts for six novice teachers following their TES evaluations. Over the same period 18 veteran teachers were dismissed (Johnson, Fiarman, Munger, Papay and Qazilbash (2009)).
26
Cincinnati’s data provide a limited opportunity to estimate the relationship between
changes in a teacher’s effect on student achievement over time and changes in the same teacher’s
TES scores over time. Empirically, if teachers do improve their practice, as measured by TES,
we would expect a significant within teacher relationship between TES measures and student
achievement. Put differently, for a teacher observed in two different school years, we would
expect her class’ average achievement growth to be greater in the year her TES scores are higher
(and visa versa). To estimate this within teacher relationship, we focus on teachers for whom we
observe student achievement growth twice and TES scores twice. Unfortunately this sample is
limited to just 29 reading teachers.22
Table 11 column B reports the within teacher relationship between our three TES
measures and student achievement growth. The specifications for columns A and B follow
Equation 4.4 but use student observations from the year of the teacher’s TES evaluation; in the
notation described in section 4, the vector of TES scores is
jktTES . Column A, which does not
include a teacher fixed effect, is thus analogous to the column labeled “Same Year (t)” in Table
5. We find, as reported in column A, somewhat different point estimates for this special sample.
When we add a teacher fixed effect, column B, the coefficients loose statistical significance.
<Table 11 about here>
Taken together these two results—(i) the relationship between TES scores and experience
and (ii) the relationship between TES growth and teacher effects growth—suggest that moving a
teacher one entire rubric level (e.g., from “Proficient” to “Distinguished”) may be more difficult
than simply reading the rubric’s evaluative language would suggest. Our sample is, however,
extremely limited. As the sample of teachers in Cincinnati’s data and the data of other district’s
builds, we will be better equipped to address the question of growth over time.
5.3 Predicting Future Impact on Student Achievement
One motivation for a hybrid approach to teacher evaluation is that combining information
from student achievement growth measures and classroom observation measures may provide
better predictions of future teacher effectiveness than either would singly. Cincinnati’s combined
TES and student achievement data allow us an opportunity to test this hypothesis. 22 We also have nine math teachers who fit these criteria, but concluded the sample was to limited for even preliminary analysis.
27
Table 12 reports the results of estimating Equation 4.6 (column B) and its alternatives
(columns A & C) using OLS. For both reading and math, the estimates in column A suggest a
teacher’s effectiveness in raising student achievement in the past alone is an unbiased predictor
of that teacher’s effectiveness in raising student achievement in the future. Since the estimates
from pre-TES years have been “shrunk” to account for random sources of measurement error, we
would expect a coefficient of one if there were no bias using those estimates as predictors. (For
more on this test, see Kane and Staiger (2008)) In reading, the coefficient is essentially one.
<Table 12 about here>
Overall, our ability to predict future student achievement gains improves (as measured by
comparing the adjusted R-squared in columns A and B).23
However, in math we now reject that
prior achievement growth effects have a coefficient of one. The predicted contribution of TES to
achievement growth itself, shown in column D by including the TES measures as regressors
alone, is a relatively weaker predictor of future teacher effectiveness in raising student
achievement.
6. Conclusion
Our results provide some of the strongest evidence to date that classroom observations
can capture elements of teaching that are related to student achievement. Our estimates show a
positive and non-trivial relationship between TES scores and student achievement growth. Our
main results from Table 5 indicate that moving from, say, an overall TES rating of “Basic” to
“Proficient” or from “Proficient” to “Distinguished” is associated with student achievement
gains of about one-sixth to one-fifth of a standard deviation. Though moving from “Proficient”
to “Distinguished” on the TES scale may be more difficult than a casual reading of the rubric’s
evaluative language would suggest. Put another way, if one student started the year at the 50th
percentile in math and reading and had a teacher in the lowest quartile of the overall TES rating
while a similar student had a teacher in the upper quartile of that rating, we would expect the
23 The change is small in percentage terms in large part because our specification includes controls for prior student achievement. Those predictors explain substantial variation in student achievement. When we estimate Equation 4.6 without any TES predictors or prior teacher effects predictors the Adjusted R-Squared for math is 0.585 and for reading is 0.517.
28
second student to be four percentile points ahead in math and five percentile points ahead in
reading by the end of the year.
Relating observed classroom practices to achievement growth offers some insight
regarding what types of classroom practices may be important in increasing student achievement.
First, we show that a teacher’s overall score is important. Our results predict that policies and
programs that help a teacher get better on all eight “teaching practice” and “classroom
environment” skills measured by TES will lead to student achievement gains. Second, even
among those with the same average rating across all domains, helping teachers improve their
“classroom environment” management (measured in TES domain 2) will likely also generate
higher student achievement. Third, given two teachers who are equally adept at “routinized
content and standards focused teaching,” the teacher who adds pedagogy that utilizes
“questioning and discussion” practices will generate higher reading achievement, but not higher
math achievement. Teachers working to improve their practice should consider their current
performance in these areas.
Yet while our results demonstrate relationships between practices measured in TES and
student achievement growth, we cannot exclude relationships with practices not measured by
TES nor do we intend to suggest that other TES measures should necessarily be discarded. First,
it is unclear whether the relationships we observed would hold if the TES rubric elements, those
in domains 1 and 4, were no longer measured or discussed. Second, a district may value
outcomes for its teachers and students beyond growth in standardized test scores. This latter
decision deserves serious discussion, but is beyond the scope of our analysis. Also, we urge
caution in extrapolating these results beyond Cincinnati where the TES system has been
developed and honed over a ten year period. Our estimated relationships between classroom
practices and student achievement growth might not hold in districts that have less rigorous and
less fully developed teacher evaluation systems.
Last, these results provide initial support for the notion that multiple alternative measures
of teacher effectiveness may be more predictive of future student achievement effects than any
single measure. This is true when classroom observation scores are brought into a model that
previously only had student achievement measures. It is also true, perhaps more so, when student
achievement measures are added to a model that only had classroom observation data. A
teacher’s past student achievement gains are a good predictor of future achievement gains, but

29
measuring classroom practice likely improves the prediction. Teachers or administrators
considering their future prospects for success should be open to including both forms of
measuring past effectiveness.
References
Aaronson, Daniel., Lisa Barrow and William Sander. (2003). “Teachers and student achievement in the Chicago Public Schools” (No. WP-2002-28). Chicago: Federal Reserve Bank of Chicago. Armour, David. T. (1976). Analysis of the school preferred reading program in selected Los Angeles minority schools. R-2007-LAUSD. (Santa Monica, CA: Rand Corporation). Boyd, Donald, Michelle Brown, Julie Cohen, Pamela Grossman, Hamilton Lankford, Susanna Loeb, Dan Mindich, Sinead Mullen, and James Wyckoff. (2009). “Measure for Measure: A Pilot Study Linking English Language Arts Instruction and Teachers’ Value-Added to Student Achievement.” Working paper prepared for the Annual Meeting of The American Education Finance Association, Nashville, TN. March, 2009. Danielson, Charlotte., & Thomas L. McGreal. (2000). Teacher evaluation to enhance professional practice. Alexandria, Va.: Association for Supervision and Curriculum Development. Donaldson, Morgaen L. (2009). So long, Lake Wobegon? Using teacher evaluation to raise teacher quality. Washington, DC: Center for American Progress. Goe, Laura. and Andrew Croft. (2009). Methods of evaluating teacher effectiveness. Washington, DC: National Comprehensive Center for Teacher Quality. Gordon, Robert, Thomas J. Kane and Douglas O. Staiger. (2006). “Identifying Effective Teachers Using Performance on the Job” Hamilton Project Discussion Paper, Published by the Brookings Institution. Hanushek, Eric A. (1971). “Teacher characteristics and gains in student achievement; estimation using micro data”. American Economic Review, 61:280-288. Holtzapple, Elizabeth. (2003). “Criterion-related validity evidence for a standards-based teacher evaluation system,” Journal of Peronnel Evaluation in Education, 17(3): 207-219. Jacob, Brian A., and Lars J. Lefgren. (2008). “Principals as agents: Subjective performance measurement in education” Journal of Labor Economics 26(1): 101-136. Jacob, Brian A., Lars Lefgren, and David Sims. (2008). “The persistence of teacher-induced learning gains,” NBER working paper #14065, June 2008. Kahlenberg, Richard D. (2007). Tough Liberal: Albert Shanker and the Battles Over Schools, Unions, Race, and Democracy. Columbia University Press, NY. Kane, Thomas J. and Douglas O. Staiger. (2008). “Estimating teacher impacts on student achievement: An experimental evaluation.” NBER working paper #14601, December 2008.

Kane, Thomas J., Jonah E. Rockoff, and Douglas O. Staiger. (2006). “What does certification tell us about teacher effectiveness? Evidence from New York City.” NBER working paper #12155, April 2006.
Koedel, Cory and Julian R. Betts. (2009). “Does student sorting invalidate value-added models of teacher effectiveness? An extended analysis of the Rothstein critique.” University of Missouri working paper, July 2009. McCaffrey, Daniel, J.R. Lockwood, Daniel Koretz and Laura Hamilton. (2003). Evaluating Value-Added Models for Teacher Accountability. (Santa Monica, CA: Rand Corporation). McCaffrey, Daniel F., J. R. Lockwood, Daniel Koretz, Thomas A. Louis, Laura Hamilton. (2004). “Models for Value-Added Modeling of Teacher Effects” Journal of Educational and Behavioral Statistics, 29(1):67-101. Medley, Donald M., Homer Coker, and Robert S. Soar (1984). Measurement-Based Evaluation of Teacher Performance: An Empirical Approach. New York, N.Y.: Longman. Milanowski, Anthony. (2004a). “The relationship between teacher performance evaluation scores and student achievement: Evidence from Cincinnati” Peabody Journal of Education. Vol. 79, No. 4, pp. 33-53. Milanowski, Anthony. (2004b). “Relationships among dimension scores of standards-based teacher evaluation systems, and the stability of evaluation score—student achievement relationships over time,” Consortium for Policy Research in Education- University of Wisconsin Working Paper Series, No. TC-04-02, April 2004. Murnane, Richard. J. & Phillips, Barbara. R. (1981). “What do effective teachers of inner-city children have in common?” Social Science Research, 10:83-100. Ohio Department of Education. (2009). Publicly reported enrollment data accessed at http://www.ode.state.oh.us/GD/Templates/Pages/ODE/ODEDetail.aspx?page=3&TopicRelationID=396&ContentID=12261&Content=65241 on September 11, 2009. Raudenbush, Stephen W. (2004). “What are value-added models estimating and what does this imply for statistical practice?” Journal of Educational and Behavioral Statistics, 29(1):121-129. Raudenbush, Stephen W. and Anthony S. Bryk (2002). Hierarchical Linear Models: Applications and Data Analysis Methods, Newbury Park, CA: Sage Publications. Rivkin, Steven, Eric Hanushek and John Kain. (2005). “Teachers, schools and academic achievement” Econometrica, 73(2):417-458.
Rockoff, Jonah. E. (2004). “The impact of individual teachers on student achievement: evidence from panel data,” American Economic Review, 94(2): 247-252. Rockoff, Jonah E. and Cecilia Speroni. (2009). “Subjective and objective evaluations of teacher effectiveness.” Papers and Proceedings of the American Economic Association Forcoming. Rockoff, Jonah E., Douglass O. Staiger, Thomas J. Kane, and Eric S. Taylor. (2009). “Providing information on teacher performance to school principals: Evidence from a randomized intervention in New York City.” Center for Education Policy Research, Harvard University Working Paper. Rothstein, Jesse., (2009). “Teacher quality in educational production: Tracking, decay, and student achievement,” Forthcoming Quarterly Journal of Economics. May 2009. Sanders, William L. and June C. Rivers. (1996). “Cumulative and Residual Effects of Teachers on Future Student Academic Achievement” Research Progress Report University of Tennessee Value-Added Research and Assessment Center. Stronge, James H. and Pamela D. Tucker. (2003) Handbook on Teacher Evalution: Assessing and Improving Performance. Larchmont , N.Y.: Eye on Education. Todd, Petra E. and Kenneth I. Wolpin. (2003). “On the specification and estimation of the production function for cognitive achievement,” Economic Journal, 113(1): 3-33. Toch, Thomas and Robert Rothman. (2008). “Rush to judgment: Teacher evaluation in public education” in Education Sector Reports, January 2008. Weisberg, D., Sexton, S., Mulhern, J. and Keeling, D. (2009). The widget effect: Our national failure to acknowledge and act on teacher effectiveness. New York City, N.Y.: The New Teacher Project.
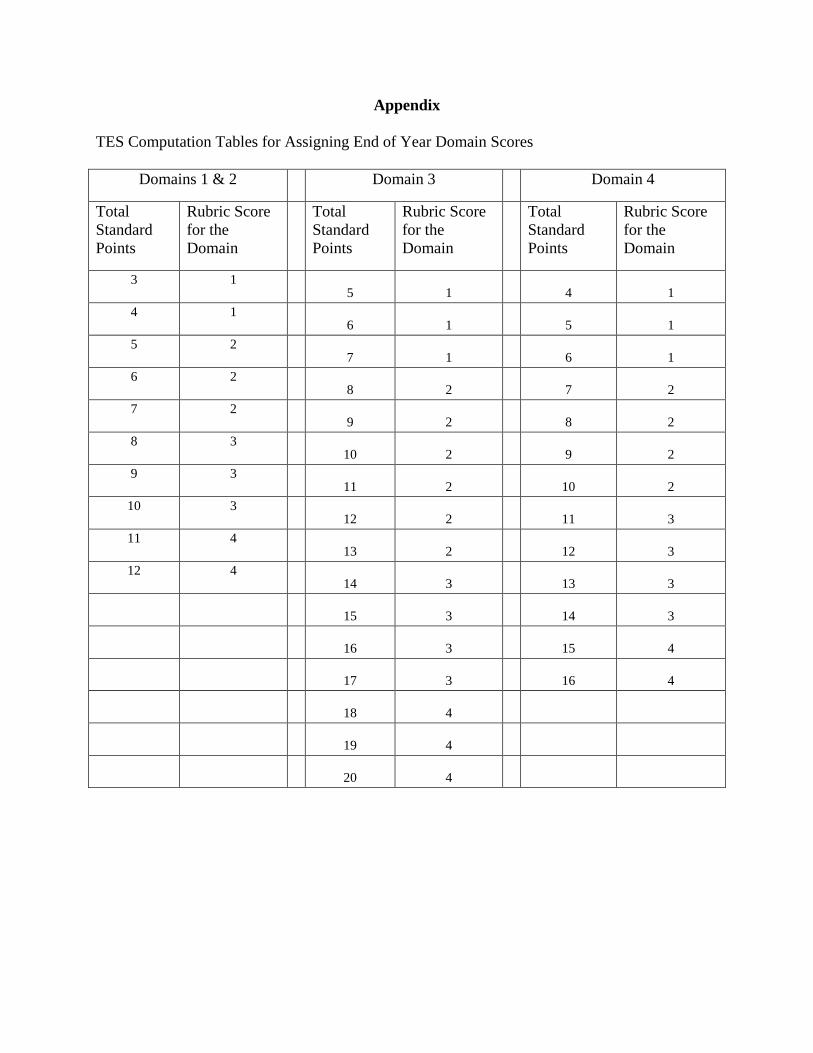
Appendix
TES Computation Tables for Assigning End of Year Domain Scores
Domains 1 & 2 Domain 3 Domain 4
Total Standard Points
Rubric Score for the Domain
Total Standard Points
Rubric Score for the Domain
Total Standard Points
Rubric Score for the Domain
3 1 5 1
4 1
4 1 6 1
5 1
5 2 7 1
6 1
6 2 8 2
7 2
7 2 9 2
8 2
8 3 10 2
9 2
9 3 11 2
10 2
10 3 12 2
11 3
11 4 13 2
12 3
12 4 14 3
13 3
15 3
14 3
16 3
15 4
17 3
16 4
18 4
19 4
20 4
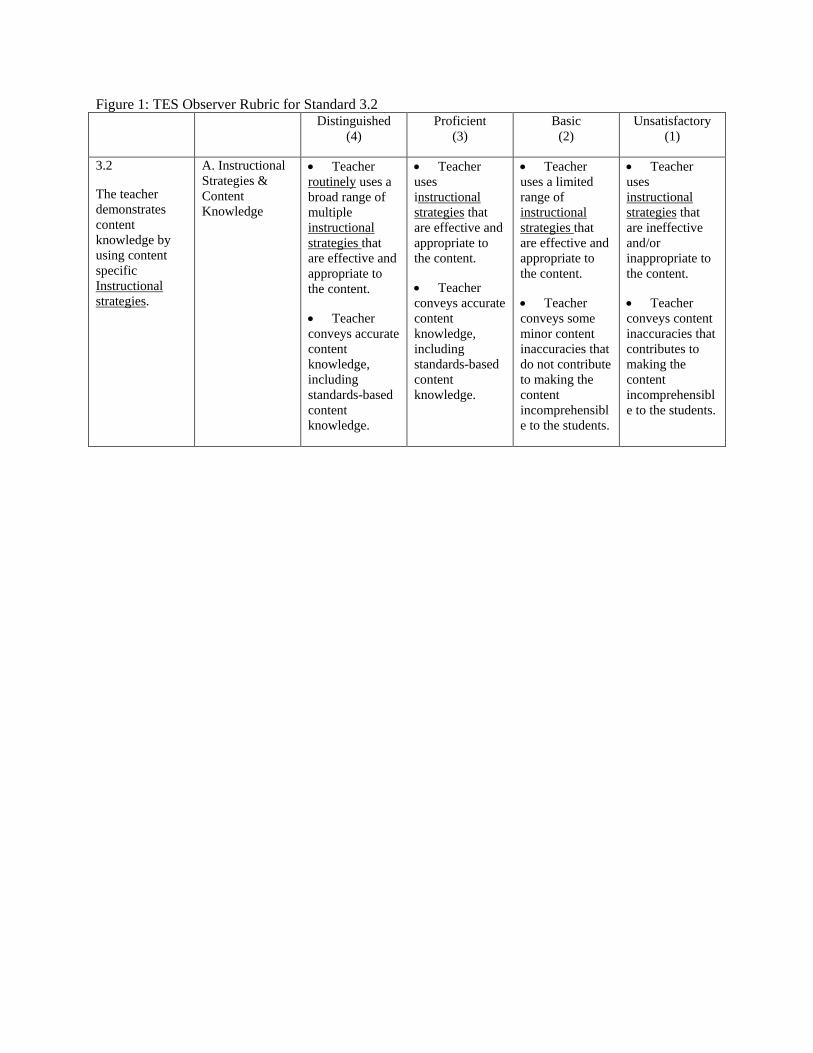
Figure 1: TES Observer Rubric for Standard 3.2 Distinguished
(4) Proficient
(3) Basic
(2) Unsatisfactory
(1)
3.2
The teacher demonstrates content knowledge by using content specific Instructional strategies
A. Instructional Strategies & Content Knowledge
.
• Teacher routinely uses a broad range of multiple instructional strategies
• Teacher conveys accurate content knowledge, including standards-based content knowledge.
that are effective and appropriate to the content.
• Teacher uses instructional strategies
• Teacher conveys accurate content knowledge, including standards-based content knowledge.
that are effective and appropriate to the content.
• Teacher uses a limited range of instructional strategies
• Teacher conveys some minor content inaccuracies that do not contribute to making the content incomprehensible to the students.
that are effective and appropriate to the content.
• Teacher uses instructional strategies
• Teacher conveys content inaccuracies that contributes to making the content incomprehensible to the students.
that are ineffective and/or inappropriate to the content.
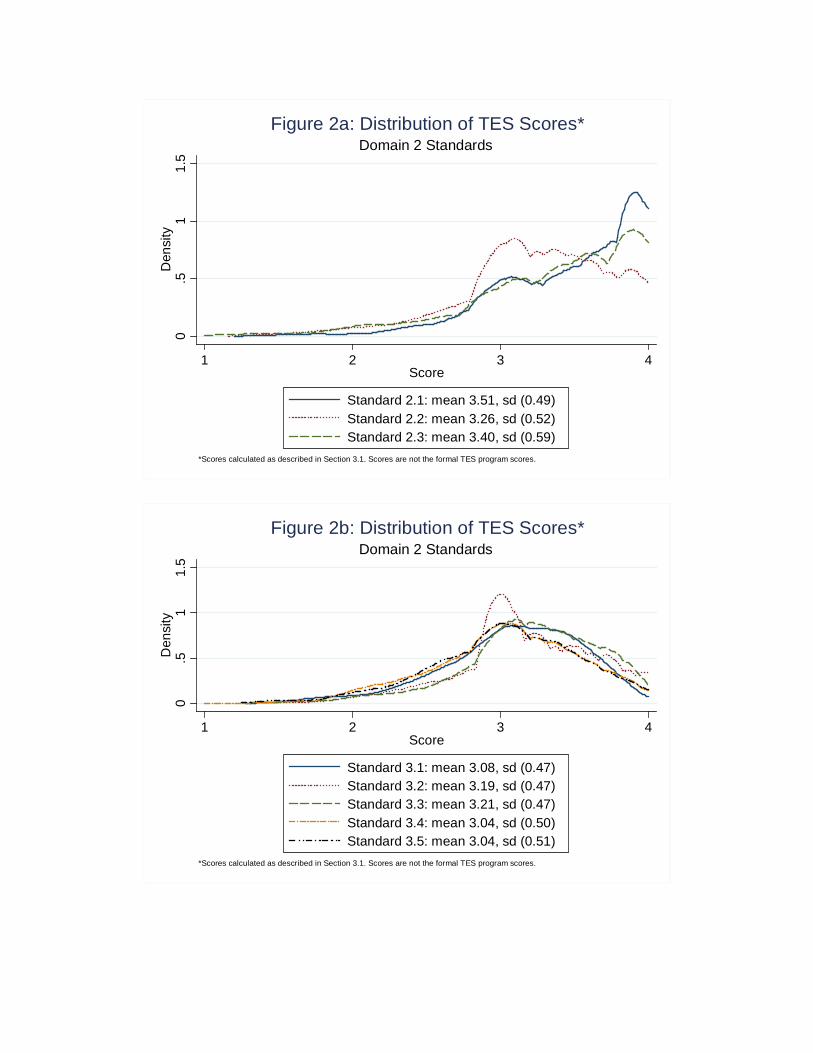
0.5
11.
5D
ensi
ty
1 2 3 4Score
Standard 2.1: mean 3.51, sd (0.49)Standard 2.2: mean 3.26, sd (0.52)Standard 2.3: mean 3.40, sd (0.59)
*Scores calculated as described in Section 3.1. Scores are not the formal TES program scores.
Domain 2 StandardsFigure 2a: Distribution of TES Scores*
0.5
11.
5D
ensi
ty
1 2 3 4Score
Standard 3.1: mean 3.08, sd (0.47)Standard 3.2: mean 3.19, sd (0.47)Standard 3.3: mean 3.21, sd (0.47)Standard 3.4: mean 3.04, sd (0.50)Standard 3.5: mean 3.04, sd (0.51)
*Scores calculated as described in Section 3.1. Scores are not the formal TES program scores.
Domain 2 StandardsFigure 2b: Distribution of TES Scores*
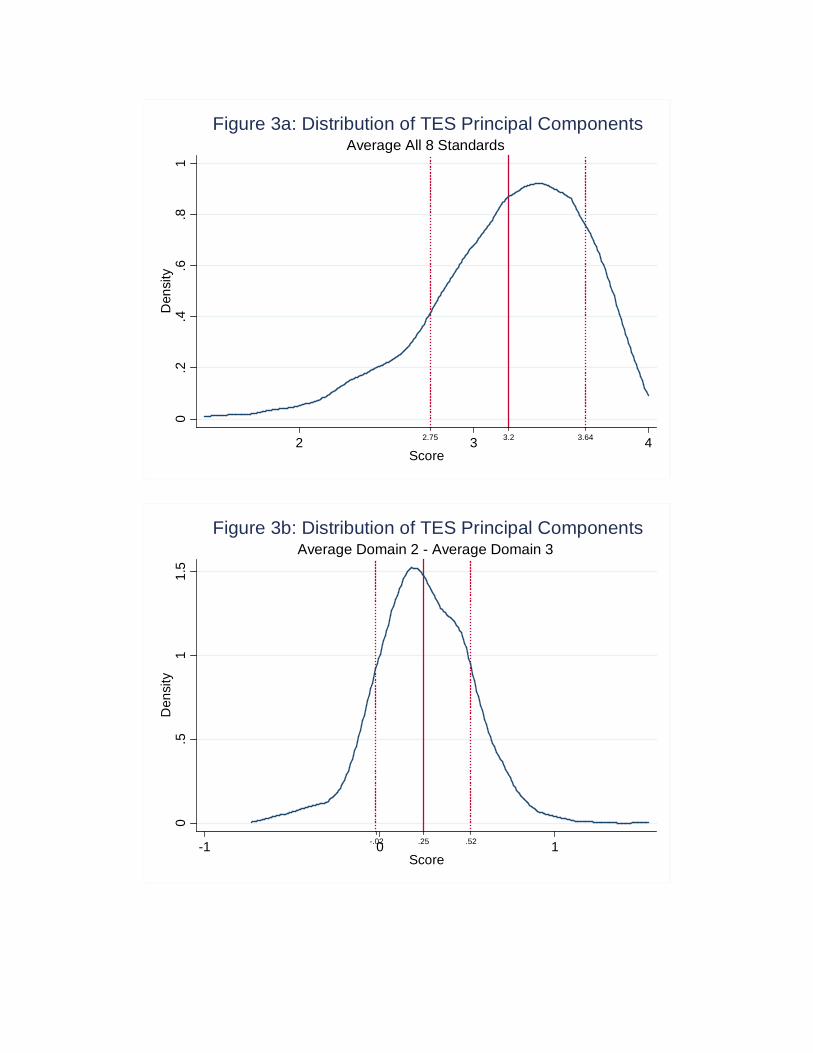
0.2
.4.6
.81
Den
sity
3.2 3.642.752 3 4Score
Average All 8 StandardsFigure 3a: Distribution of TES Principal Components
0.5
11.
5D
ensi
ty
.25 .52-.02-1 0 1Score
Average Domain 2 - Average Domain 3Figure 3b: Distribution of TES Principal Components
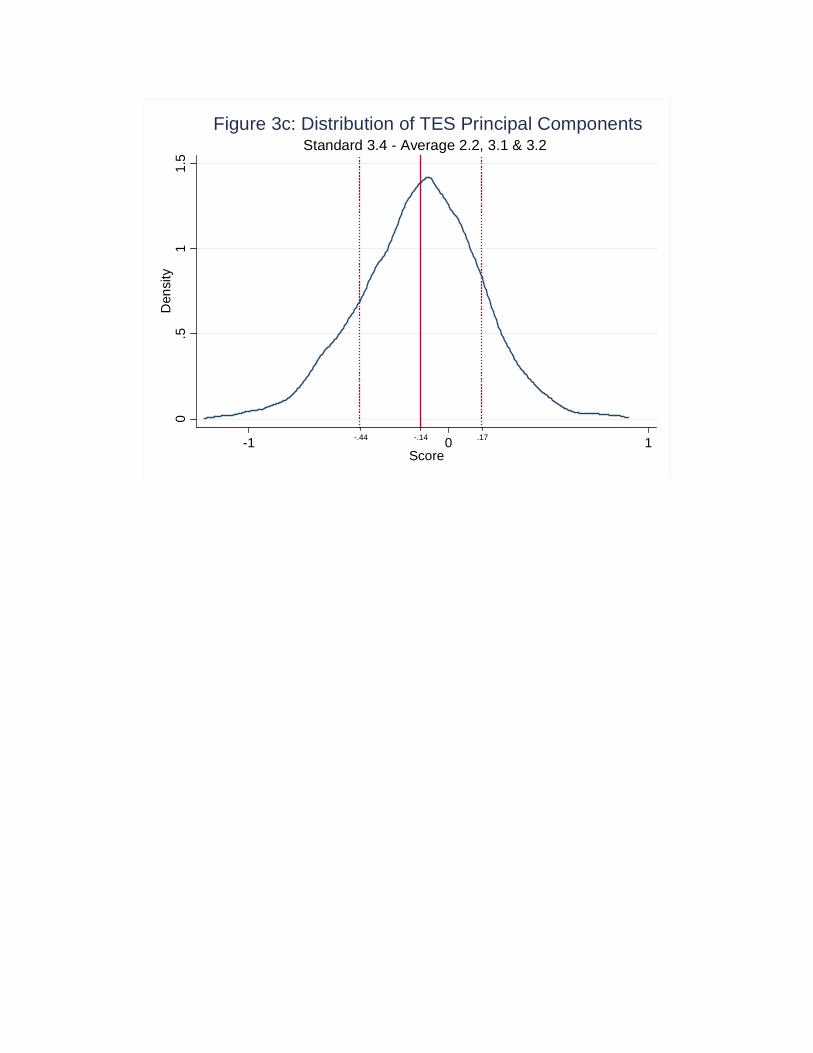
0.5
11.
5D
ensi
ty
-.14 .17-.44-1 0 1Score
Standard 3.4 - Average 2.2, 3.1 & 3.2Figure 3c: Distribution of TES Principal Components
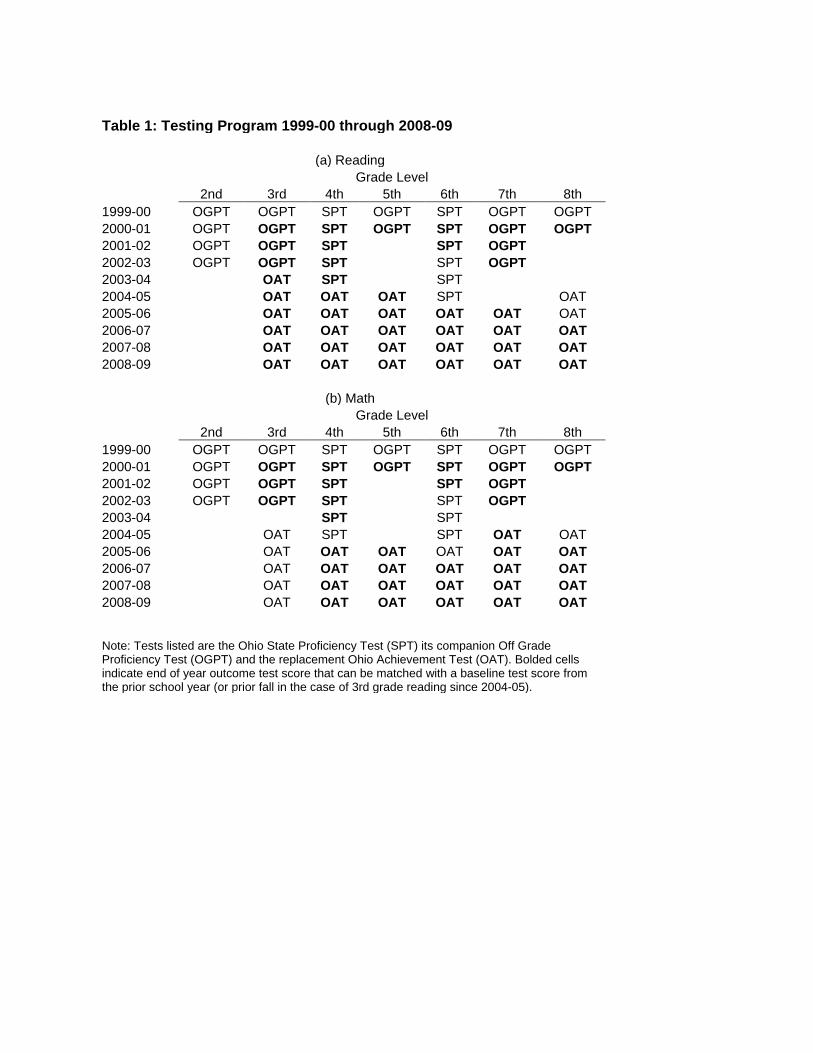
Table 1: Testing Program 1999-00 through 2008-09
(a) Reading Grade Level 2nd 3rd 4th 5th 6th 7th 8th 1999-00 OGPT OGPT SPT OGPT SPT OGPT OGPT 2000-01 OGPT OGPT SPT OGPT SPT OGPT OGPT 2001-02 OGPT OGPT SPT SPT OGPT 2002-03 OGPT OGPT SPT SPT OGPT 2003-04 OAT SPT SPT 2004-05 OAT OAT OAT SPT OAT 2005-06 OAT OAT OAT OAT OAT OAT 2006-07 OAT OAT OAT OAT OAT OAT 2007-08 OAT OAT OAT OAT OAT OAT 2008-09 OAT OAT OAT OAT OAT OAT
(b) Math Grade Level 2nd 3rd 4th 5th 6th 7th 8th 1999-00 OGPT OGPT SPT OGPT SPT OGPT OGPT 2000-01 OGPT OGPT SPT OGPT SPT OGPT OGPT 2001-02 OGPT OGPT SPT SPT OGPT 2002-03 OGPT OGPT SPT SPT OGPT 2003-04 SPT SPT 2004-05 OAT SPT SPT OAT OAT 2005-06 OAT OAT OAT OAT OAT OAT 2006-07 OAT OAT OAT OAT OAT OAT 2007-08 OAT OAT OAT OAT OAT OAT 2008-09 OAT OAT OAT OAT OAT OAT
Note: Tests listed are the Ohio State Proficiency Test (SPT) its companion Off Grade Proficiency Test (OGPT) and the replacement Ohio Achievement Test (OAT). Bolded cells indicate end of year outcome test score that can be matched with a baseline test score from the prior school year (or prior fall in the case of 3rd grade reading since 2004-05).
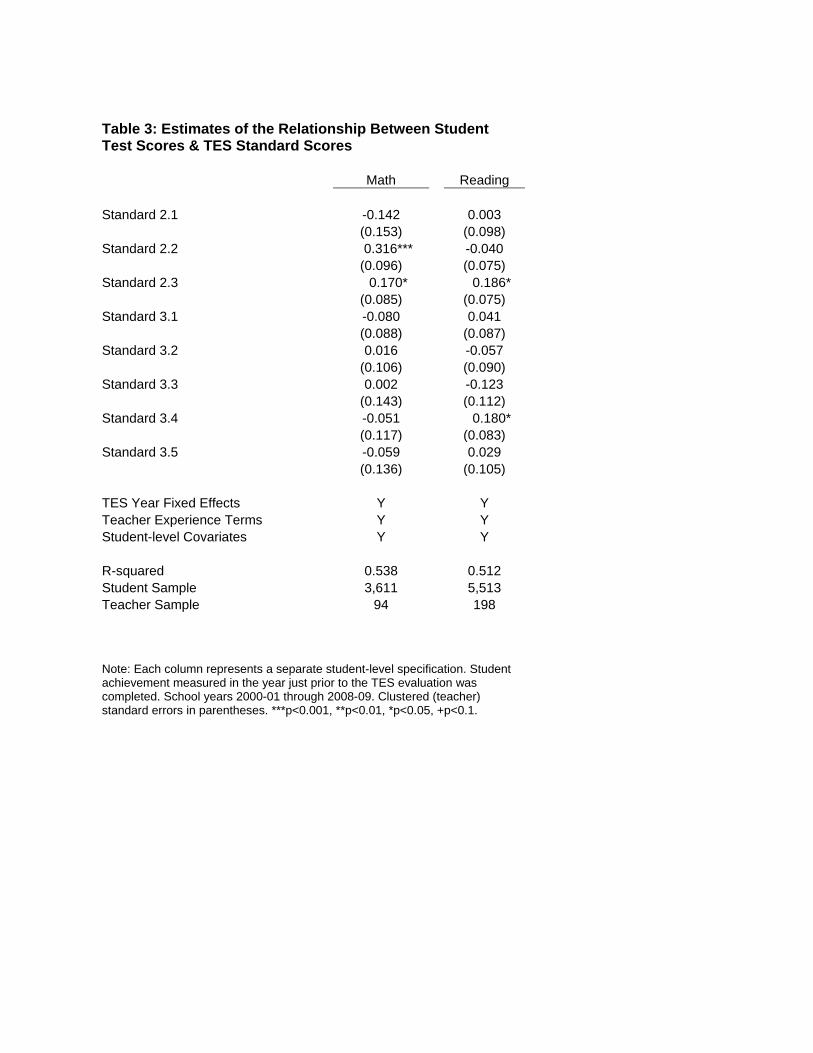
Table 3: Estimates of the Relationship Between Student Test Scores & TES Standard Scores Math Reading Standard 2.1 -0.142 0.003 (0.153) (0.098) Standard 2.2 0.316*** -0.040 (0.096) (0.075) Standard 2.3 0.170* 0.186* (0.085) (0.075) Standard 3.1 -0.080 0.041 (0.088) (0.087) Standard 3.2 0.016 -0.057 (0.106) (0.090) Standard 3.3 0.002 -0.123 (0.143) (0.112) Standard 3.4 -0.051 0.180* (0.117) (0.083) Standard 3.5 -0.059 0.029 (0.136) (0.105) TES Year Fixed Effects Y Y Teacher Experience Terms Y Y Student-level Covariates Y Y R-squared 0.538 0.512 Student Sample 3,611 5,513 Teacher Sample 94 198
Note: Each column represents a separate student-level specification. Student achievement measured in the year just prior to the TES evaluation was completed. School years 2000-01 through 2008-09. Clustered (teacher) standard errors in parentheses. ***p<0.001, **p<0.01, *p<0.05, +p<0.1.
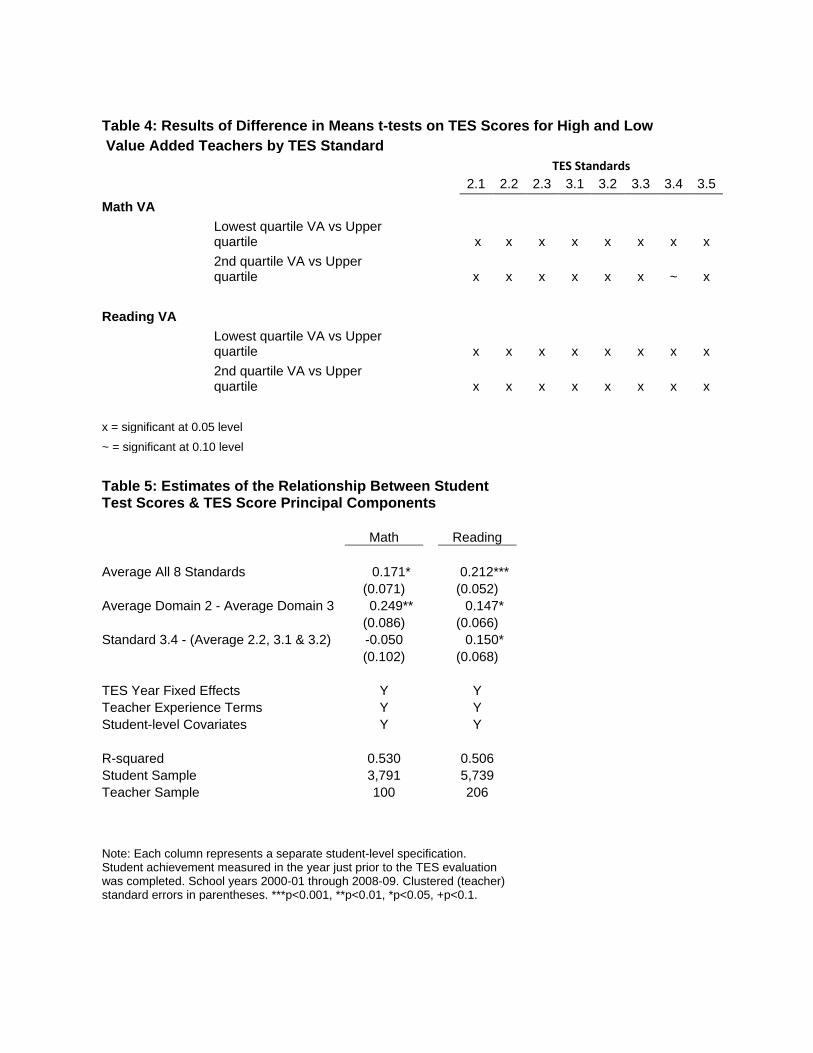
Table 4: Results of Difference in Means t-tests on TES Scores for High and Low Value Added Teachers by TES Standard TES Standards
2.1 2.2 2.3 3.1 3.2 3.3 3.4 3.5
Math VA
Lowest quartile VA vs Upper quartile x x x x x x x x
2nd quartile VA vs Upper quartile x x x x x x ~ x
Reading VA
Lowest quartile VA vs Upper quartile x x x x x x x x
2nd quartile VA vs Upper quartile x x x x x x x x
x = significant at 0.05 level
~ = significant at 0.10 level Table 5: Estimates of the Relationship Between Student Test Scores & TES Score Principal Components Math Reading Average All 8 Standards 0.171* 0.212*** (0.071) (0.052) Average Domain 2 - Average Domain 3 0.249** 0.147* (0.086) (0.066) Standard 3.4 - (Average 2.2, 3.1 & 3.2) -0.050 0.150* (0.102) (0.068) TES Year Fixed Effects Y Y Teacher Experience Terms Y Y Student-level Covariates Y Y R-squared 0.530 0.506 Student Sample 3,791 5,739 Teacher Sample 100 206
Note: Each column represents a separate student-level specification. Student achievement measured in the year just prior to the TES evaluation was completed. School years 2000-01 through 2008-09. Clustered (teacher) standard errors in parentheses. ***p<0.001, **p<0.01, *p<0.05, +p<0.1.
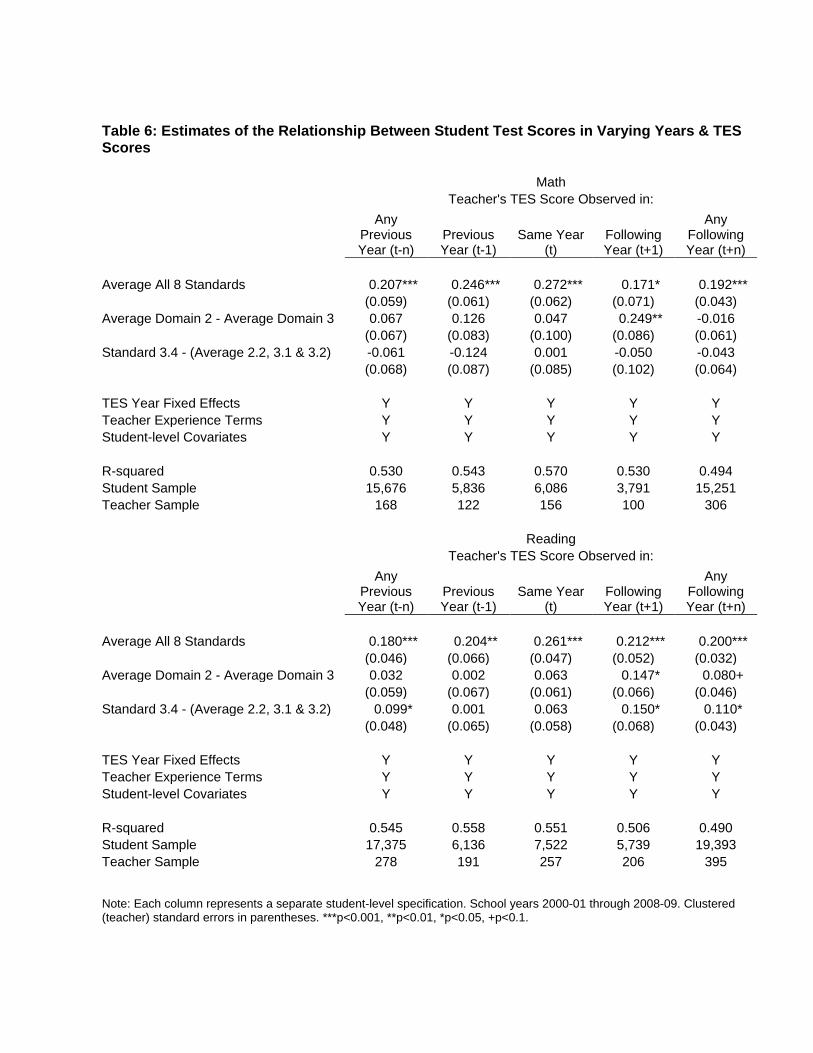
Table 6: Estimates of the Relationship Between Student Test Scores in Varying Years & TES Scores Math Teacher's TES Score Observed in:
Any Previous Year (t-n)
Previous Year (t-1)
Same Year (t)
Following Year (t+1)
Any Following Year (t+n)
Average All 8 Standards 0.207*** 0.246*** 0.272*** 0.171* 0.192*** (0.059) (0.061) (0.062) (0.071) (0.043) Average Domain 2 - Average Domain 3 0.067 0.126 0.047 0.249** -0.016 (0.067) (0.083) (0.100) (0.086) (0.061) Standard 3.4 - (Average 2.2, 3.1 & 3.2) -0.061 -0.124 0.001 -0.050 -0.043 (0.068) (0.087) (0.085) (0.102) (0.064) TES Year Fixed Effects Y Y Y Y Y Teacher Experience Terms Y Y Y Y Y Student-level Covariates Y Y Y Y Y R-squared 0.530 0.543 0.570 0.530 0.494 Student Sample 15,676 5,836 6,086 3,791 15,251 Teacher Sample 168 122 156 100 306 Reading Teacher's TES Score Observed in:
Any Previous Year (t-n)
Previous Year (t-1)
Same Year (t)
Following Year (t+1)
Any Following Year (t+n)
Average All 8 Standards 0.180*** 0.204** 0.261*** 0.212*** 0.200*** (0.046) (0.066) (0.047) (0.052) (0.032) Average Domain 2 - Average Domain 3 0.032 0.002 0.063 0.147* 0.080+ (0.059) (0.067) (0.061) (0.066) (0.046) Standard 3.4 - (Average 2.2, 3.1 & 3.2) 0.099* 0.001 0.063 0.150* 0.110* (0.048) (0.065) (0.058) (0.068) (0.043) TES Year Fixed Effects Y Y Y Y Y Teacher Experience Terms Y Y Y Y Y Student-level Covariates Y Y Y Y Y R-squared 0.545 0.558 0.551 0.506 0.490 Student Sample 17,375 6,136 7,522 5,739 19,393 Teacher Sample 278 191 257 206 395
Note: Each column represents a separate student-level specification. School years 2000-01 through 2008-09. Clustered (teacher) standard errors in parentheses. ***p<0.001, **p<0.01, *p<0.05, +p<0.1.
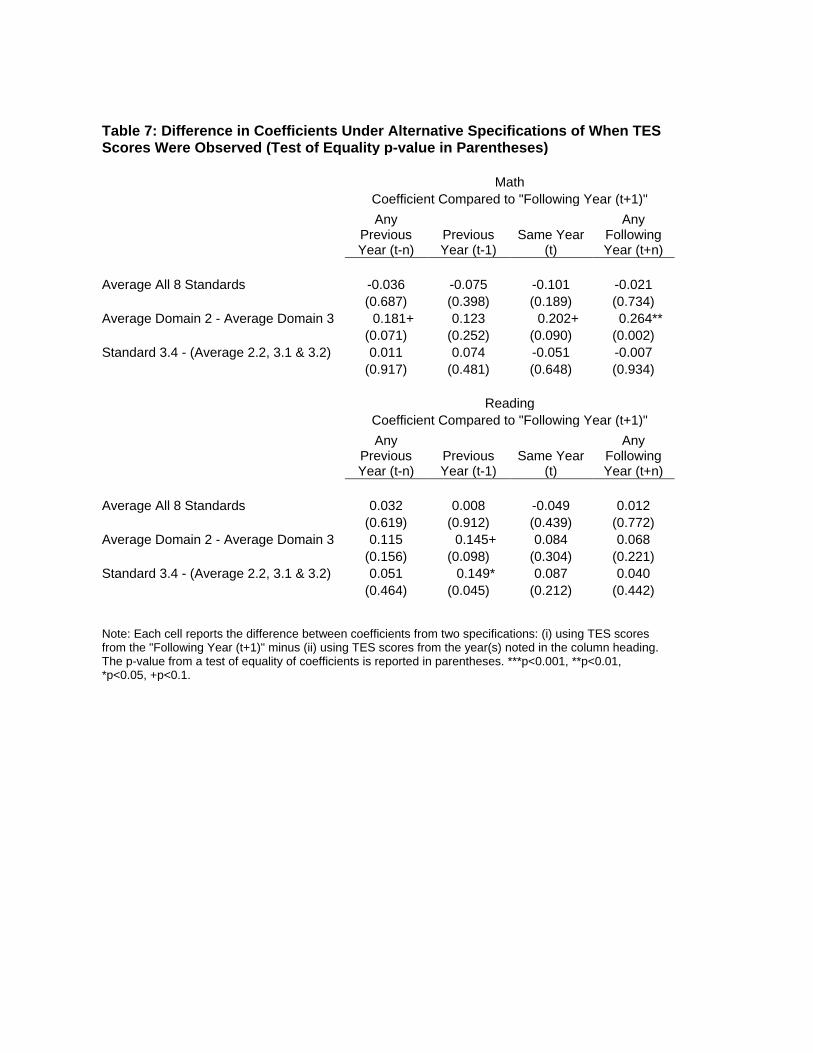
Table 7: Difference in Coefficients Under Alternative Specifications of When TES Scores Were Observed (Test of Equality p-value in Parentheses) Math Coefficient Compared to "Following Year (t+1)"
Any Previous Year (t-n)
Previous Year (t-1)
Same Year (t)
Any Following Year (t+n)
Average All 8 Standards -0.036 -0.075 -0.101 -0.021 (0.687) (0.398) (0.189) (0.734) Average Domain 2 - Average Domain 3 0.181+ 0.123 0.202+ 0.264** (0.071) (0.252) (0.090) (0.002) Standard 3.4 - (Average 2.2, 3.1 & 3.2) 0.011 0.074 -0.051 -0.007 (0.917) (0.481) (0.648) (0.934) Reading Coefficient Compared to "Following Year (t+1)"
Any Previous Year (t-n)
Previous Year (t-1)
Same Year (t)
Any Following Year (t+n)
Average All 8 Standards 0.032 0.008 -0.049 0.012 (0.619) (0.912) (0.439) (0.772) Average Domain 2 - Average Domain 3 0.115 0.145+ 0.084 0.068 (0.156) (0.098) (0.304) (0.221) Standard 3.4 - (Average 2.2, 3.1 & 3.2) 0.051 0.149* 0.087 0.040 (0.464) (0.045) (0.212) (0.442)
Note: Each cell reports the difference between coefficients from two specifications: (i) using TES scores from the "Following Year (t+1)" minus (ii) using TES scores from the year(s) noted in the column heading. The p-value from a test of equality of coefficients is reported in parentheses. ***p<0.001, **p<0.01, *p<0.05, +p<0.1.
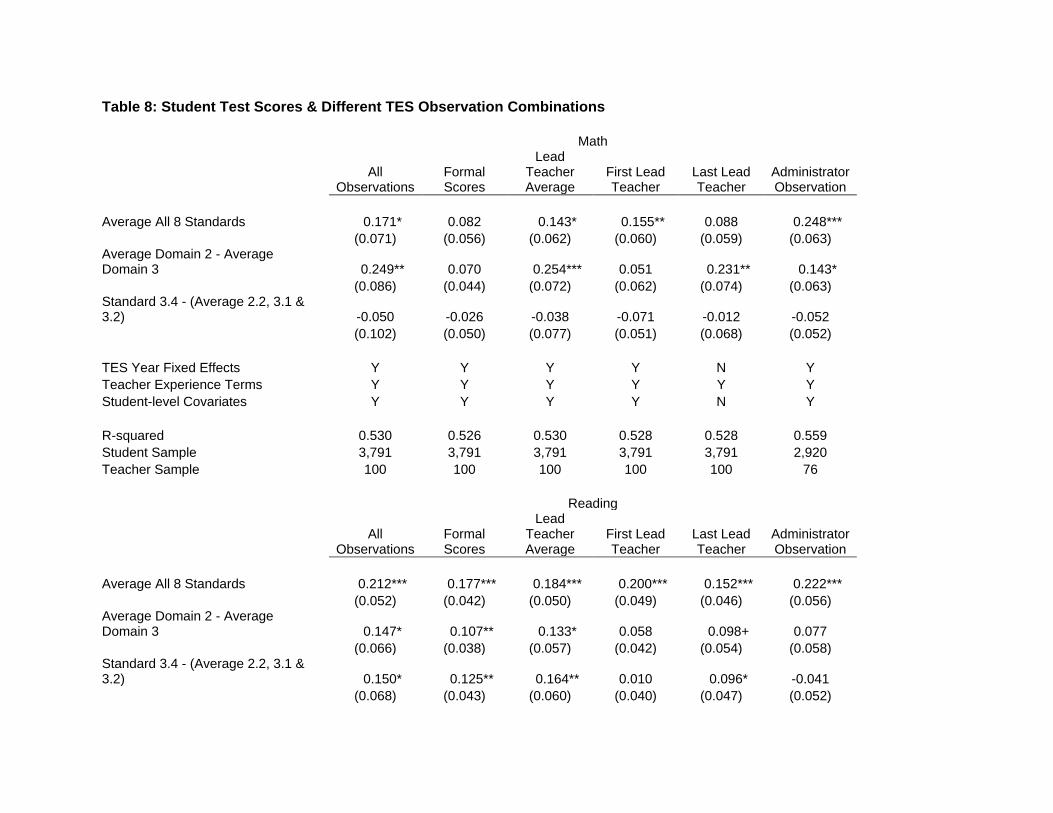
Table 8: Student Test Scores & Different TES Observation Combinations Math
All
Observations Formal Scores
Lead Teacher Average
First Lead Teacher
Last Lead Teacher
Administrator Observation
Average All 8 Standards 0.171* 0.082 0.143* 0.155** 0.088 0.248*** (0.071) (0.056) (0.062) (0.060) (0.059) (0.063) Average Domain 2 - Average Domain 3 0.249** 0.070 0.254*** 0.051 0.231** 0.143* (0.086) (0.044) (0.072) (0.062) (0.074) (0.063) Standard 3.4 - (Average 2.2, 3.1 & 3.2) -0.050 -0.026 -0.038 -0.071 -0.012 -0.052 (0.102) (0.050) (0.077) (0.051) (0.068) (0.052) TES Year Fixed Effects Y Y Y Y N Y Teacher Experience Terms Y Y Y Y Y Y Student-level Covariates Y Y Y Y N Y R-squared 0.530 0.526 0.530 0.528 0.528 0.559 Student Sample 3,791 3,791 3,791 3,791 3,791 2,920 Teacher Sample 100 100 100 100 100 76 Reading
All
Observations Formal Scores
Lead Teacher Average
First Lead Teacher
Last Lead Teacher
Administrator Observation
Average All 8 Standards 0.212*** 0.177*** 0.184*** 0.200*** 0.152*** 0.222*** (0.052) (0.042) (0.050) (0.049) (0.046) (0.056) Average Domain 2 - Average Domain 3 0.147* 0.107** 0.133* 0.058 0.098+ 0.077 (0.066) (0.038) (0.057) (0.042) (0.054) (0.058) Standard 3.4 - (Average 2.2, 3.1 & 3.2) 0.150* 0.125** 0.164** 0.010 0.096* -0.041 (0.068) (0.043) (0.060) (0.040) (0.047) (0.052)
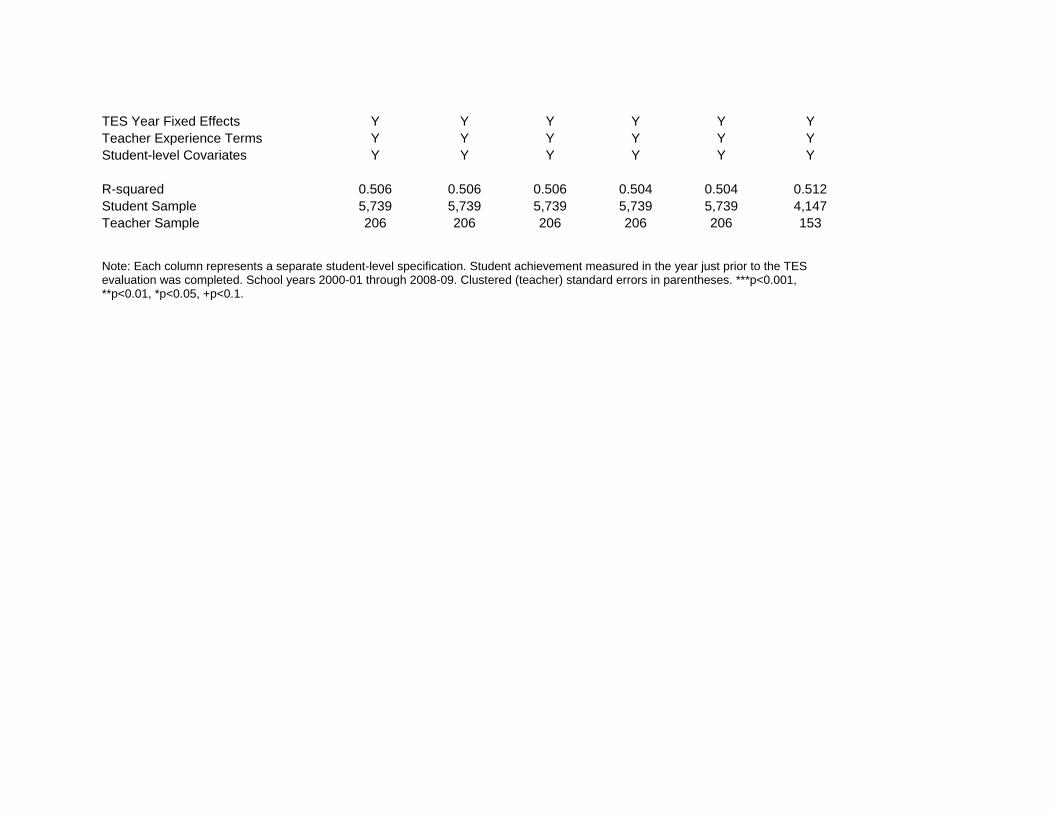
TES Year Fixed Effects Y Y Y Y Y Y Teacher Experience Terms Y Y Y Y Y Y Student-level Covariates Y Y Y Y Y Y R-squared 0.506 0.506 0.506 0.504 0.504 0.512 Student Sample 5,739 5,739 5,739 5,739 5,739 4,147 Teacher Sample 206 206 206 206 206 153
Note: Each column represents a separate student-level specification. Student achievement measured in the year just prior to the TES evaluation was completed. School years 2000-01 through 2008-09. Clustered (teacher) standard errors in parentheses. ***p<0.001, **p<0.01, *p<0.05, +p<0.1.
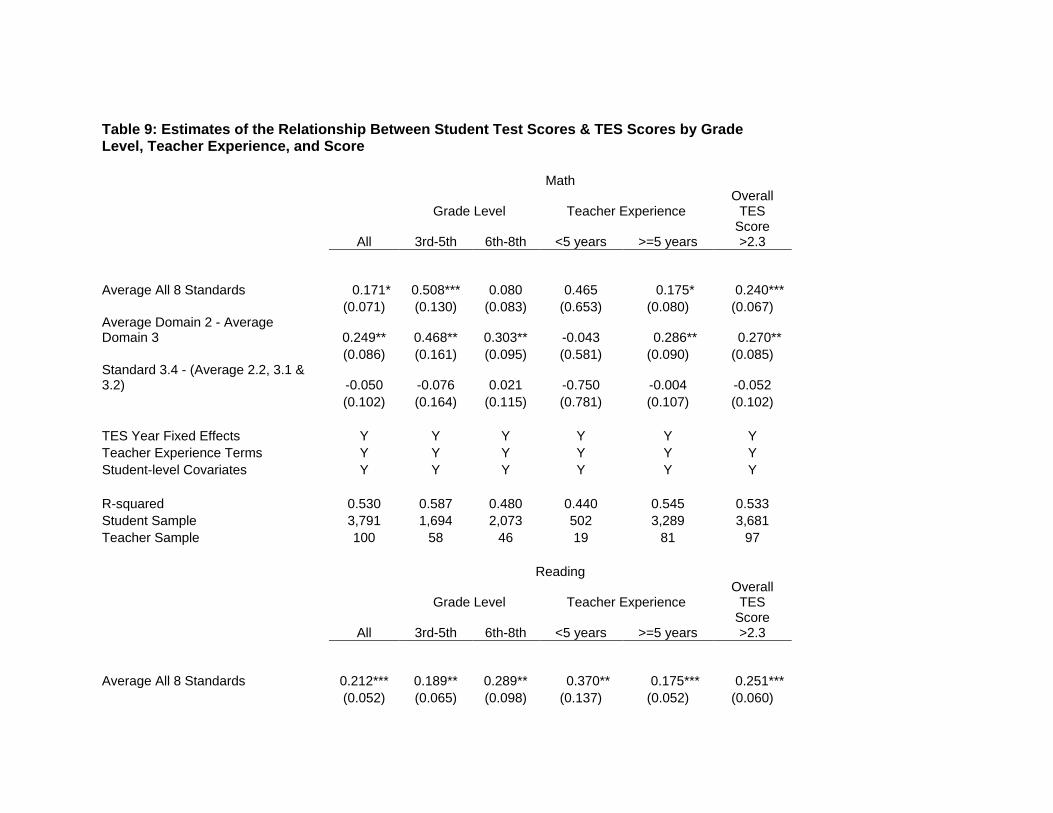
Table 9: Estimates of the Relationship Between Student Test Scores & TES Scores by Grade Level, Teacher Experience, and Score Math
Grade Level Teacher Experience Overall
TES
All 3rd-5th 6th-8th <5 years >=5 years Score >2.3
Average All 8 Standards 0.171*
0.508*** 0.080 0.465 0.175* 0.240*** (0.071) (0.130) (0.083) (0.653) (0.080) (0.067) Average Domain 2 - Average Domain 3
0.249**
0.468**
0.303** -0.043 0.286** 0.270**
(0.086) (0.161) (0.095) (0.581) (0.090) (0.085) Standard 3.4 - (Average 2.2, 3.1 & 3.2) -0.050 -0.076 0.021 -0.750 -0.004 -0.052 (0.102) (0.164) (0.115) (0.781) (0.107) (0.102) TES Year Fixed Effects Y Y Y Y Y Y Teacher Experience Terms Y Y Y Y Y Y Student-level Covariates Y Y Y Y Y Y R-squared 0.530 0.587 0.480 0.440 0.545 0.533 Student Sample 3,791 1,694 2,073 502 3,289 3,681 Teacher Sample 100 58 46 19 81 97 Reading
Grade Level Teacher Experience Overall
TES
All 3rd-5th 6th-8th <5 years >=5 years Score >2.3
Average All 8 Standards
0.212***
0.189**
0.289** 0.370** 0.175*** 0.251*** (0.052) (0.065) (0.098) (0.137) (0.052) (0.060)
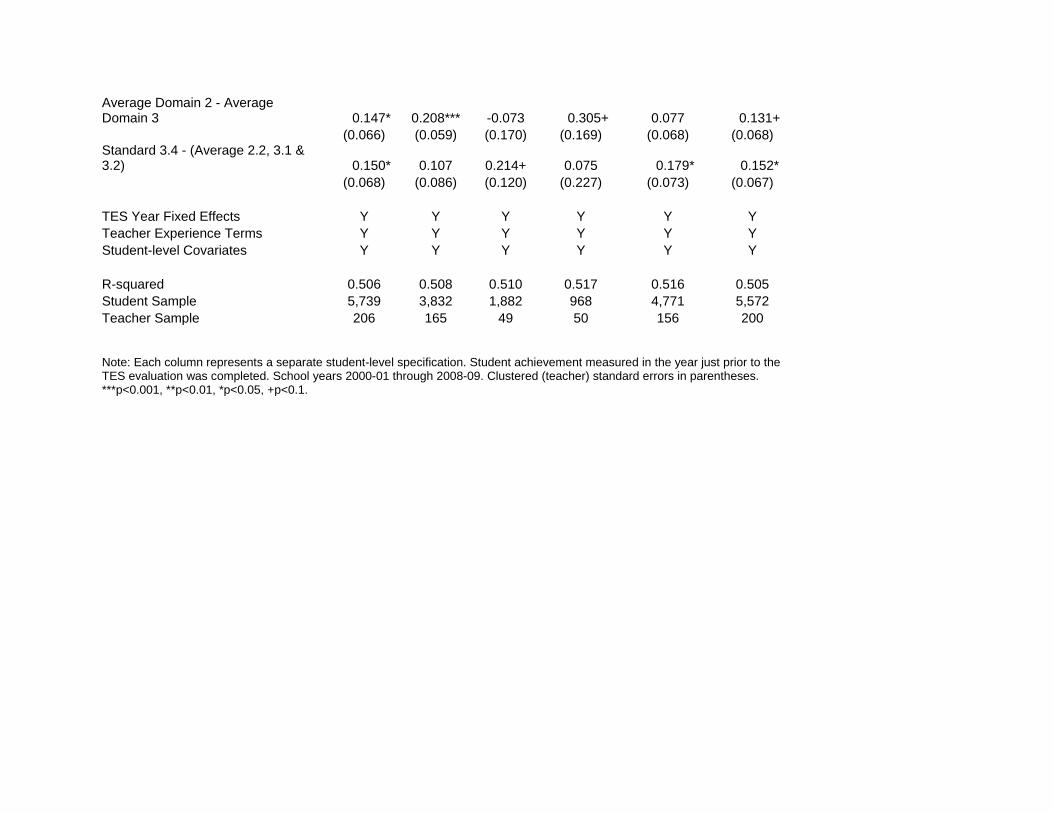
Average Domain 2 - Average Domain 3 0.147*
0.208*** -0.073 0.305+ 0.077 0.131+
(0.066) (0.059) (0.170) (0.169) (0.068) (0.068) Standard 3.4 - (Average 2.2, 3.1 & 3.2) 0.150* 0.107
0.214+ 0.075 0.179* 0.152*
(0.068) (0.086) (0.120) (0.227) (0.073) (0.067) TES Year Fixed Effects Y Y Y Y Y Y Teacher Experience Terms Y Y Y Y Y Y Student-level Covariates Y Y Y Y Y Y R-squared 0.506 0.508 0.510 0.517 0.516 0.505 Student Sample 5,739 3,832 1,882 968 4,771 5,572 Teacher Sample 206 165 49 50 156 200
Note: Each column represents a separate student-level specification. Student achievement measured in the year just prior to the TES evaluation was completed. School years 2000-01 through 2008-09. Clustered (teacher) standard errors in parentheses. ***p<0.001, **p<0.01, *p<0.05, +p<0.1.
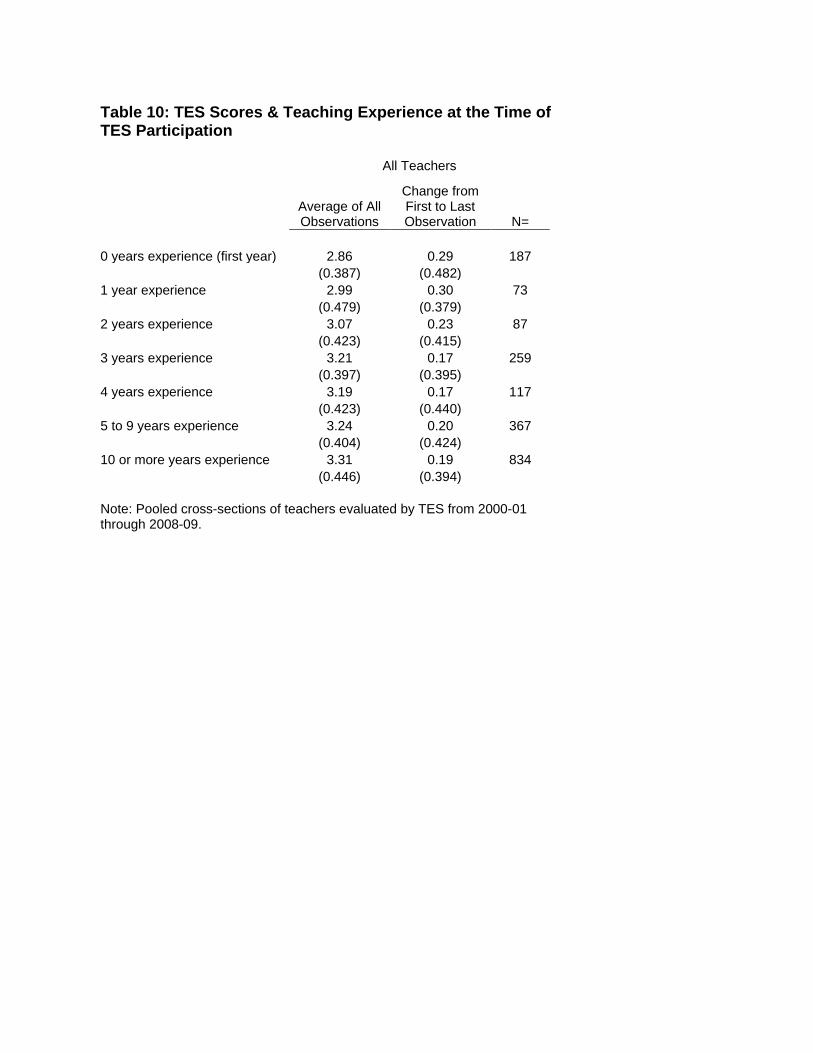
Table 10: TES Scores & Teaching Experience at the Time of TES Participation All Teachers
Average of All Observations
Change from First to Last Observation N=
0 years experience (first year) 2.86 0.29 187 (0.387) (0.482) 1 year experience 2.99 0.30 73 (0.479) (0.379) 2 years experience 3.07 0.23 87 (0.423) (0.415) 3 years experience 3.21 0.17 259 (0.397) (0.395) 4 years experience 3.19 0.17 117 (0.423) (0.440) 5 to 9 years experience 3.24 0.20 367 (0.404) (0.424) 10 or more years experience 3.31 0.19 834 (0.446) (0.394) Note: Pooled cross-sections of teachers evaluated by TES from 2000-01 through 2008-09.
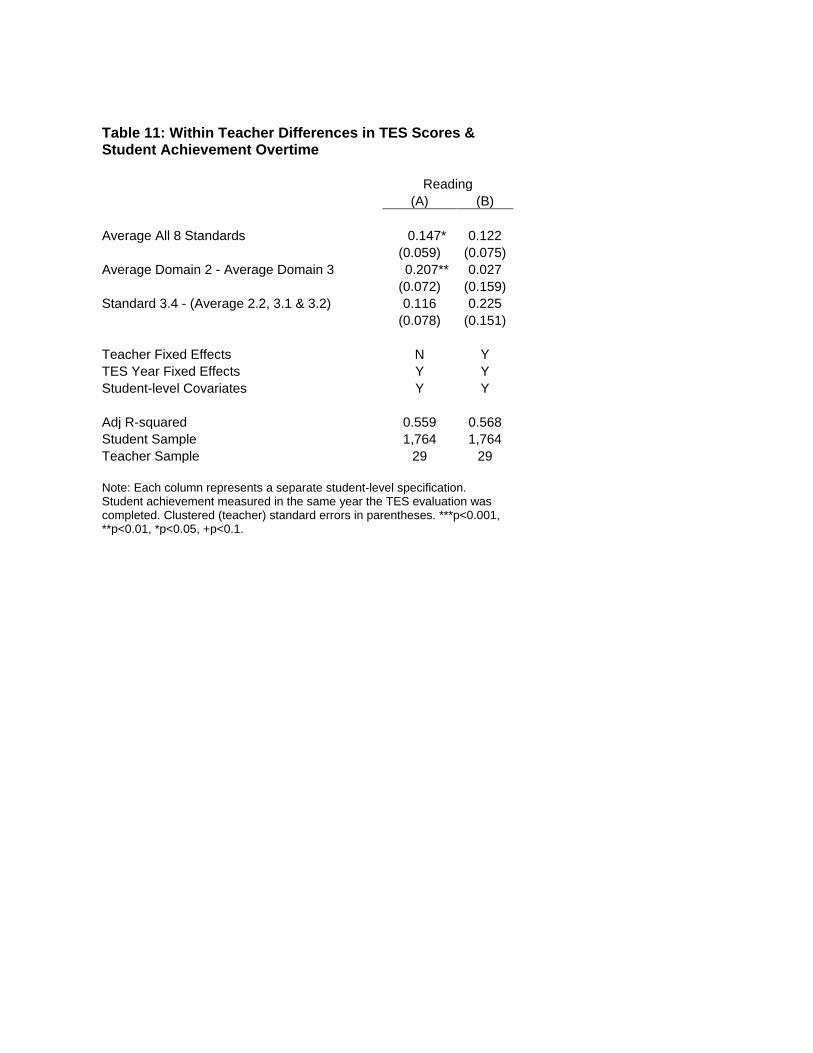
Table 11: Within Teacher Differences in TES Scores & Student Achievement Overtime Reading (A) (B) Average All 8 Standards 0.147* 0.122 (0.059) (0.075) Average Domain 2 - Average Domain 3 0.207** 0.027 (0.072) (0.159) Standard 3.4 - (Average 2.2, 3.1 & 3.2) 0.116 0.225 (0.078) (0.151) Teacher Fixed Effects N Y TES Year Fixed Effects Y Y Student-level Covariates Y Y Adj R-squared 0.559 0.568 Student Sample 1,764 1,764 Teacher Sample 29 29 Note: Each column represents a separate student-level specification. Student achievement measured in the same year the TES evaluation was completed. Clustered (teacher) standard errors in parentheses. ***p<0.001, **p<0.01, *p<0.05, +p<0.1.
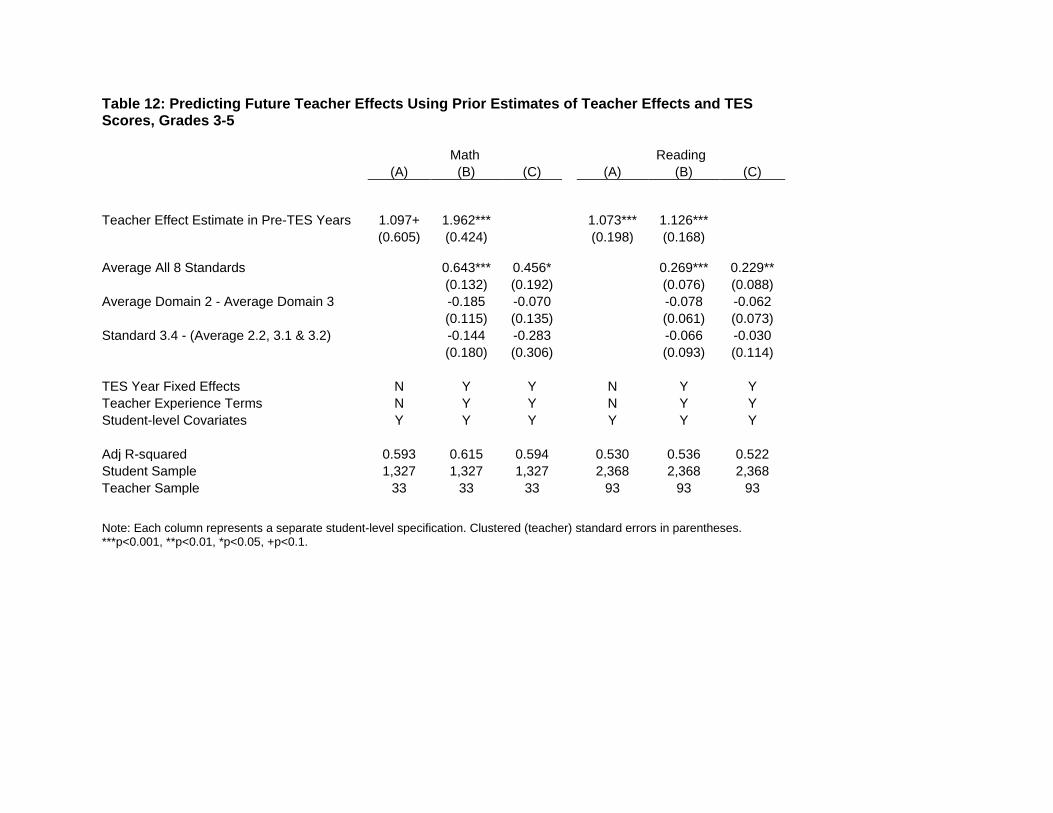
Table 12: Predicting Future Teacher Effects Using Prior Estimates of Teacher Effects and TES Scores, Grades 3-5 Math Reading (A) (B) (C) (A) (B) (C)
Teacher Effect Estimate in Pre-TES Years
1.097+
1.962***
1.073***
1.126*** (0.605) (0.424) (0.198) (0.168)
Average All 8 Standards
0.643***
0.456*
0.269***
0.229** (0.132) (0.192) (0.076) (0.088) Average Domain 2 - Average Domain 3 -0.185 -0.070 -0.078 -0.062 (0.115) (0.135) (0.061) (0.073) Standard 3.4 - (Average 2.2, 3.1 & 3.2) -0.144 -0.283 -0.066 -0.030 (0.180) (0.306) (0.093) (0.114) TES Year Fixed Effects N Y Y N Y Y Teacher Experience Terms N Y Y N Y Y Student-level Covariates Y Y Y Y Y Y Adj R-squared 0.593 0.615 0.594 0.530 0.536 0.522 Student Sample 1,327 1,327 1,327 2,368 2,368 2,368 Teacher Sample 33 33 33 93 93 93
Note: Each column represents a separate student-level specification. Clustered (teacher) standard errors in parentheses. ***p<0.001, **p<0.01, *p<0.05, +p<0.1.