Embed Size (px)
Citation preview

Identifying Good Practice in Benchmarking
16 May 2011

Aims of the day
• To update you on the HESA benchmarking project and associated activities
• To present some benchmarking case studies/perspectives for discussion
• To invite you to discuss a range of issues around good practice in benchmarking, to hear your perspectives and exchange ideas
• To generate material that will feed in to new benchmarking resources for the sector

Agenda
10.15-10.30 Arrival and coffee
10.30-10.45 Welcome and introduction, and the HESA Benchmarking ProjectJonathan Waller, Director of Information and Analysis HESA
10.45-11.10 Warwick’s approach to BI and Benchmarking Giles Carden, Director of MI and Planning, Warwick University
11.10-11.30 International benchmarking: progress on the HESA-commissioned studyMike Boxall and Andrew Webb, PA Consulting
11.30-11.50 The Brunel approach to Financial BenchmarkingJohn Robinson, Finance Director, Brunel University
11.50-12.10 Future directions for benchmarkingPatrick Kennedy, Director of Strategic Planning and Change,
and Nicki Horseman, Assistant Director, Strategic Planning,
Exeter University
12.10-12.30 Questions and discussion on morning sessions Jonathan Waller and Giles Carden
12.30-1.00 Lunch1.00-2.20 Discussions: two groups led by Anita Wright, Head of Information and Planning,
Liverpool
University and Mike Kennerley, Strategy and Performance Manager, Leeds University
2.20-3.00 Plenary report back and summary
The project – ‘Realising business benefits through use of benchmarking’
• Phase 1– HESA commissioned by HEFCE to provide an
assimilation of current benchmarking activity within the UK HE sector
– First phase ran from 24 June 2010 to publication of final report on 4 November 2010
– Project methodology• Survey of academic and other existing studies on
benchmarking• Semi-structured interviews with HEIs, sector associations
and other relevant organisations• Online survey of HE planning community

Phase 1 findings
• ‘Making the case’ for benchmarking
• Sharing of knowledge and good practice
• Development and sharing of methodologies, tools and frameworks
• Weaknesses and access barriers in data
• Use of the heidi system to support benchmarking
• Learning from the experiences of other sectors
• The international dimension
• Recommendations

Phase 2
• Funded primarily from HEFCE University Modernisation Fund
• Project running from November 2010 to April 2012• Objectives
– Promote senior ownership and recognition of the value of benchmarking
– Establish business requirements for benchmarking– Engage with cognate activities in the sector– Develop a communication and dissemination plan
• Web microsite www.benchmarking.hesa.ac.uk• JISC Infonet• Conferences and seminars
– Review techniques and tools in use and ensure these are presented in a way that can be accessed and shared

Phase 2
• Objectives – continued– Map relevant information sources (within and
beyond the sector)• Cluster around business needs• Seek to unlock less known or accessible sources• Provide indication of quality and utility of information
sources
– Develop heidi to support benchmarking– Seek ideas and input on benchmarking activities
from other sectors (public sector and commercial contexts)
– Review and develop the capacity and approach to benchmark internationally

Forthcoming project events
• Strategic planning – use of evidence and benchmarking 7 June, London (GuildHE and AMHEC institutions)
• Process benchmarking 24 June, HESA
• International benchmarking 20 July, London
Warwick’s Approach to BI & Benchmarking
Dr Giles Carden
Director, Management Information and Planning University of Warwick

OutlineOutline

Business Drivers – Why use BI & Benchmarking?Business Drivers – Why use BI & Benchmarking?

Key Objectives of BI AnalysisKey Objectives of BI Analysis

HR Reporting
Time
Com
plex
ity
2006 2010 2012 2014
Pre-award Dashboards PGR Dashboards
Space Dashboards
Publications & Bibliometrics Dashboards
Integrated Reporting
RAE Modelling
2008
QR Modelling HESA Benchmarking
Research Income Dashboards
Utility reporting
OFFA agreement monitoring
Evolving BI LandscapeEvolving BI Landscape

Technology - Organisation of the DataTechnology - Organisation of the Data

Early Stage ProjectsEarly Stage Projects

Warwick’s Design FrameworkWarwick’s Design Framework

Principles for an Effective PresentationPrinciples for an Effective Presentation

Effective Presentation – Effective Presentation – Research DashboardsResearch Dashboards

Effective Visual PresentationEffective Visual Presentation

Effective Presentation Effective Presentation –– Research Income per FTE benchmarkResearch Income per FTE benchmark

Effective Presentation Effective Presentation –– RAE 2008 BenchmarkRAE 2008 Benchmark
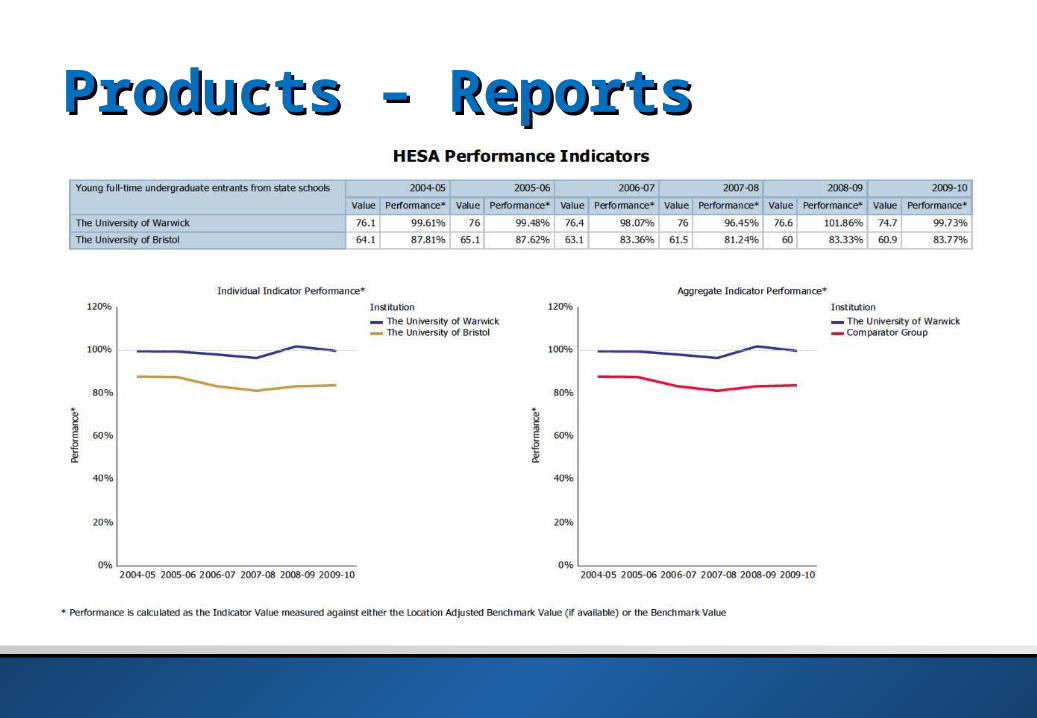
Products – ReportsProducts – Reports

• How are we doing compared to last year/forecast?
• How are we doing against the competition?
Audience - Senior ManagementAudience - Senior Management

• How are individuals performing in my department?
• How can performance improvements be correctly targeted?
Audience - Heads of DepartmentAudience - Heads of Department

• How is my performance compared against previous years?
• How is my performance compared against my peers?
Audience – Individual AcademicsAudience – Individual Academics
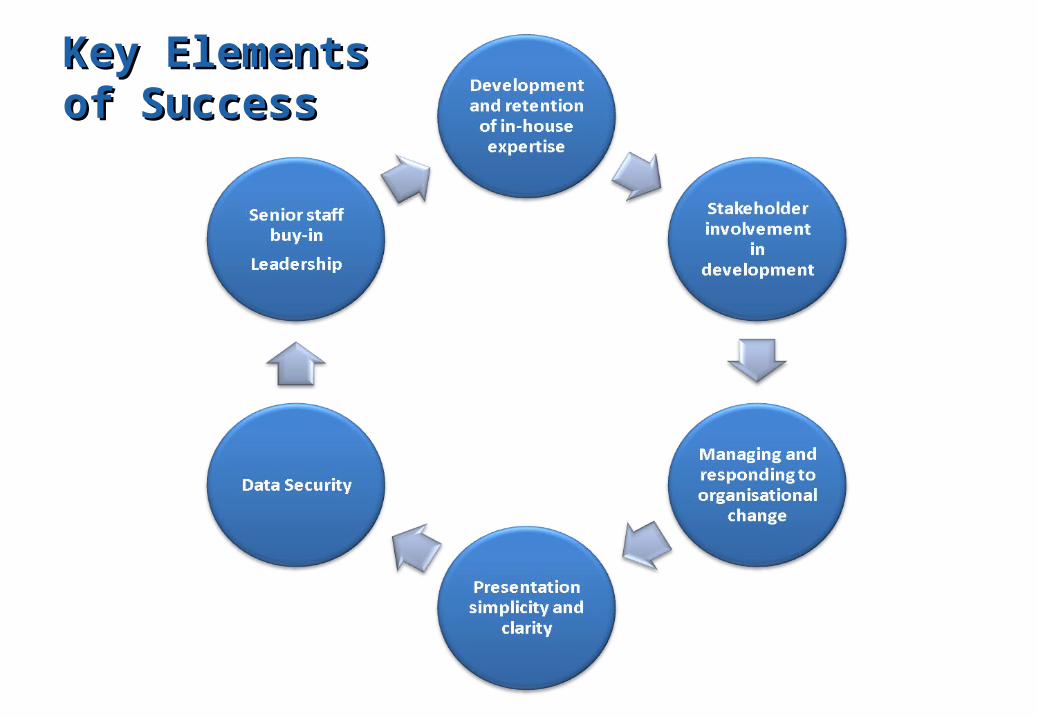
Key Elements Key Elements of Successof Success

Future Benchmarking ProjectsFuture Benchmarking Projects

INTERNATIONAL HIGHER EDUCATION BENCHMARKING IN THE UK
Project Overview
Mike Boxall and Andrew Webb
16th May 2011

© PA Knowledge Limited 2011. Page 29
Agenda/contents
Project aim
Sources identified so far
Information being sought

© PA Knowledge Limited 2011. Page 30
Project Aim
The Benchmarking to improve efficiency status report, published on November 2010 stated:
‘UK universities are under increasing pressure to show how they perform relative to universities in the global community and there is growing interest in transnational
benchmarking to make reliable international comparisons and learn from other HE systems.’
PA are therefore tasked with undertaking the following:
Needs assessment – a brief exercise to identify the critical needs and uses of international benchmark information
Review of available resources – a desk exercise to identify and assess the available resources for each of the five interpretations of benchmarking, grading them against the requirements and criteria identified through the initial needs analysis.
Assessment of gaps and unmet needs – we will apply our judgement and sector knowledge to assess the extent to which the available resources meet the sector’s expressed needs for benchmarking information
Proposals for meeting future benchmarking needs – our report from the previous stages of work will summarise the sector’s needs for international benchmarking information, the extent to which these are or could be met from current resources

© PA Knowledge Limited 2011. Page 31
Sources identified so far
Whole University Ranking
– Times Higher Education Ranking
– QS World Universities Ranking
– Academic Ranking of World Universities (ARWU)
– CHE Excellence Rankings
– RatER Global University Ranking of World Universities
– Webometrics Ranking of World Universities
– 2010 World University Ranking
– SIR World Report
– Leiden Ranking
– University Ranking by Academic Performance
– The Performance Ranking of Scientific Papers for World Universities
– Professional Classification of Higher Education Institutions
– International Student Barometer (ISB)
© PA Knowledge Limited 2011. Page 32
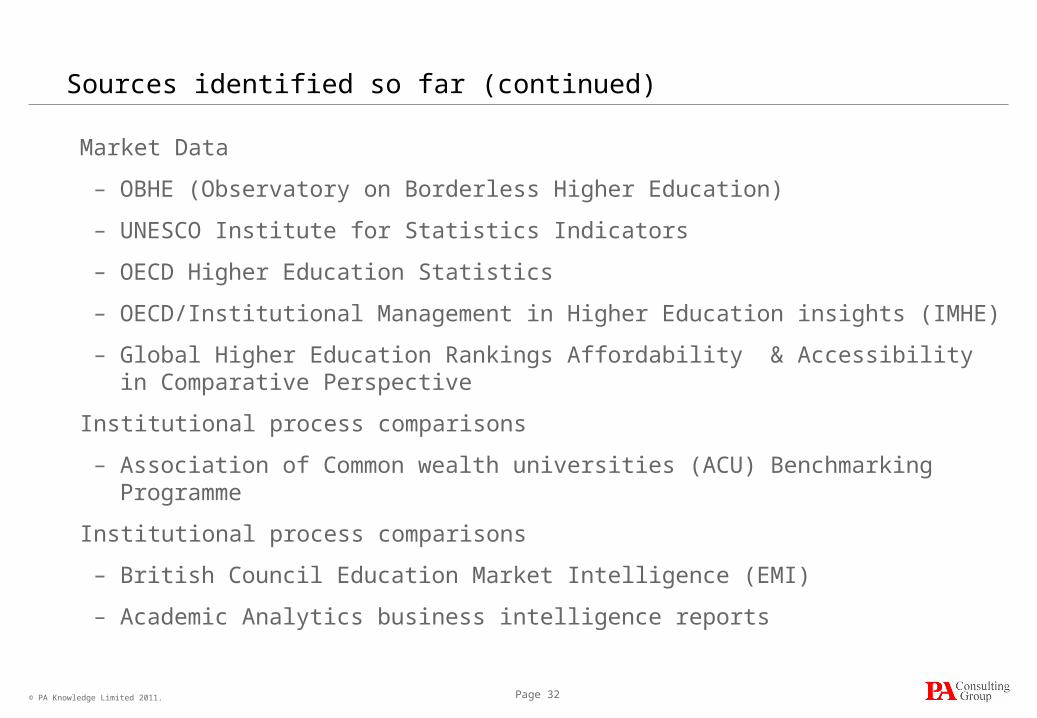
Sources identified so far (continued)
Market Data
– OBHE (Observatory on Borderless Higher Education)
– UNESCO Institute for Statistics Indicators
– OECD Higher Education Statistics
– OECD/Institutional Management in Higher Education insights (IMHE)
– Global Higher Education Rankings Affordability & Accessibility in Comparative Perspective
Institutional process comparisons
– Association of Common wealth universities (ACU) Benchmarking Programme
Institutional process comparisons
– British Council Education Market Intelligence (EMI)
– Academic Analytics business intelligence reports

© PA Knowledge Limited 2011. Page 33
Information being sought
PA are keen to hear views from institutions on:
the key metrics and performance measures you use to test the University's internationalisation strategy and operations
what areas you seek to benchmark and against which classes of institutions: for example
- international ranking tables - research results - staff standing - recruitment - processes and approaches - market intelligence
what sources do you use for benchmarking, and how useful do you find them
what in-house and bespoke benchmarking methods do you use
are there any important unmet benchmarking needs that you would like to see addressed

Benchmarking
John RobinsonDirector of Finance

This is what we are going to do today ...

Overview• What is benchmarking?• Compare and contrast• Financial Applications• Limitations
Motivation for benchmarking?
• To find secrets of business success we need to study successful businesses

What is benchmarking?
• Sometimes easier to see what it is by saying what it isn’t
• Compare and improve different definitions – all in HESA report.

What is benchmarking?
• “Benchmarking is a valuable tool for HEIs in conducting comparative analyses of institutional and external information in order to identify efficiencies and cost reductions and to target these to best effect” HESA p.3

What is benchmarking?HEFCE Definition
• “ A process through which practices are analysed to provide a standard measurement (“benchmark”) of effective performance within an organisation (such as a university). Benchmarks are also used to compare performance with other organisations and other sectors”.

What is benchmarking?HEFCE Definition
• “ A process through which practices are analysed to provide a standard measurement (“benchmark”) of COST effective performance within an organisation (such as a university). Benchmarks are also used to compare performance with other organisations and other sectors” SO AS TO IMPROVE THE ORGANISATION’S COMPETITIVE PERFROMANCE.

What is benchmarking?
• “Benchmarking … allows the University to get a sense of where it is performing well in relation to others” HESA p8

What is Benchmarking?
• Not just - Compare and contrast• Not just analysis of similarity and difference• But some sort of first cousin to these?• To raise questions?• To provide answers?• Indicative or conclusive?
Financial Information barriers (Recommendation 4)
• Data is available, public, consistent over time, granular (?), comparable, accurate, timely.
• Annual Reports and Accounts in standard format with narrative audited and published.
• HEIDI collates this well.• Comparable across sectors and nations

Current £9k Fee Level Announcements• Aston University• University of Bath• University of Birmingham• University of Cambridge• University of Central Lancashire• City University• Coventry University (£7,500 - £9,000)• Durham University• University of Essex• University of Exeter• Imperial College London• Keel University• University of Kent• Lancaster University
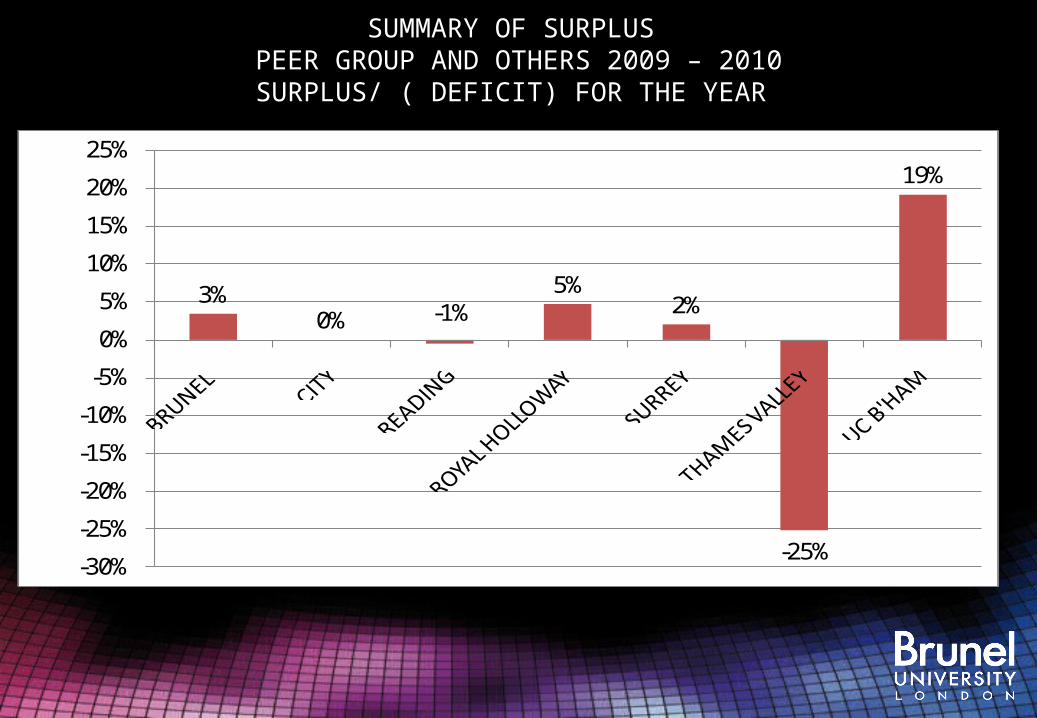
SUMMARY OF SURPLUS PEER GROUP AND OTHERS 2009 – 2010
SURPLUS/ ( DEFICIT) FOR THE YEAR
3%0% -1%
5%2%
-25%
19%
-30%
-25%
-20%
-15%
-10%
-5%
0%
5%
10%
15%
20%
25%
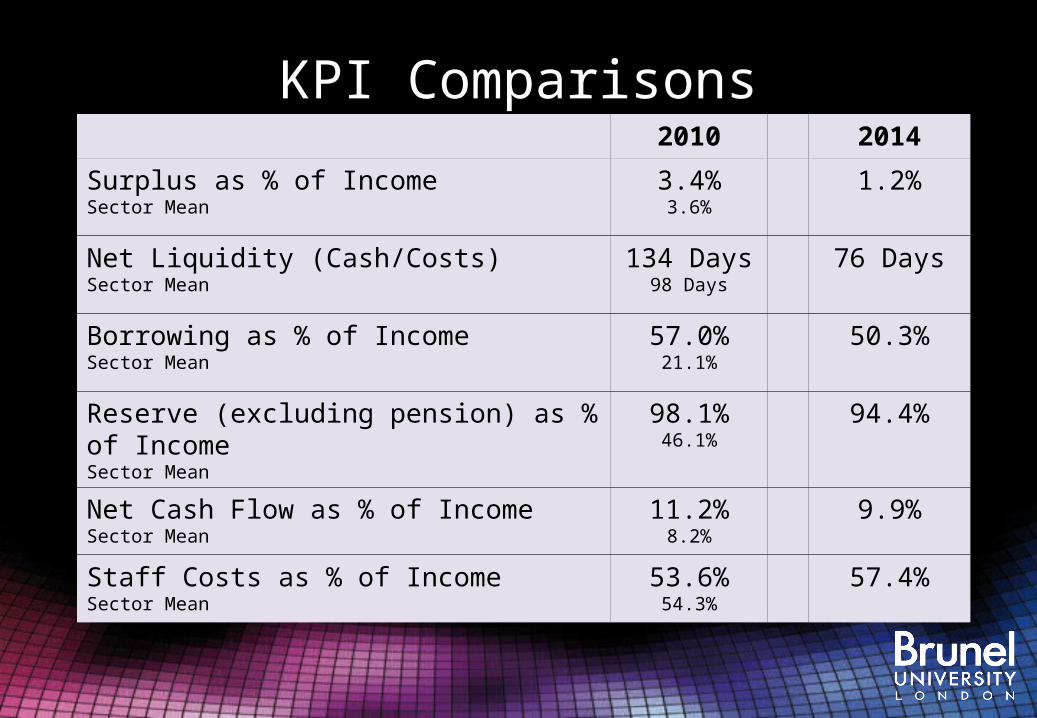
KPI Comparisons2010 2014
Surplus as % of IncomeSector Mean
3.4%3.6%
1.2%
Net Liquidity (Cash/Costs)Sector Mean
134 Days98 Days
76 Days
Borrowing as % of IncomeSector Mean
57.0%21.1%
50.3%
Reserve (excluding pension) as % of IncomeSector Mean
98.1%46.1%
94.4%
Net Cash Flow as % of IncomeSector Mean
11.2%8.2%
9.9%
Staff Costs as % of IncomeSector Mean
53.6%54.3%
57.4%

INCREASING ACADEMIC STAFF IN DIFFICULT TIMES
BRUNEL WARWICK QUEEN MARY TVU
SSR 20.2 14.1 13.6 14.2
COSTS (ADJ)PER STUDENT
£9.2K £15.0K £14.2K £10.0K
SURPLUS % 3% 2% 2% -25%
STAFF COSTS % 53.6% 50.5% 58.8% 69.5%

Comparability at different levels
• External boundaries defined (off balance sheet?)
• Internal boundaries discretionary and vary• Tribal deal with HEI benchmarking of costs• Functional definition of costs– ‘like with like’
• “We use their data for budgeting purposes”• “We say Finance costs are x% of income so that
figure (reversing adjustments) becomes Finance department budget”

Limitations?

DRILLING DOWN (1)
Good Institution (s)
Constituents & Organisation
Components & Structure
Answer
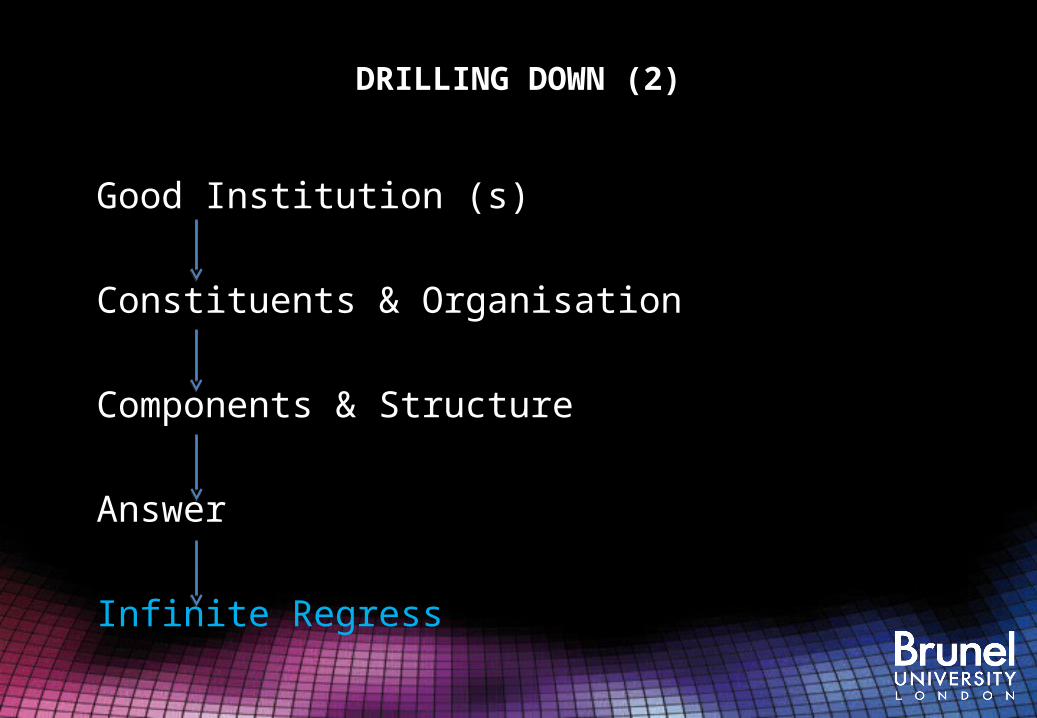
DRILLING DOWN (2)
Good Institution (s)
Constituents & Organisation
Components & Structure
Answer
Infinite Regress

DRILLING DOWN (3)
Good Institution (s)
Constituents & Organisation
Components & Structure
Answer (s)

Drilling down levels

Limitations?

Limitations?: A detour into history

Limitations?

Limitations?

What is Benchmarking?
• Not just - Compare and contrast• Not just analysis of similarity and difference• But some sort of first cousin to these?• To raise questions?• To provide answers?• Indicative or conclusive?

Benchmarking Conclusion
• We all want to drill down and dig deeper• The illusion keeps us going• Don’t wait for heidi• Look at the indicators in the round (4Es)• Use judgement• Get on with it• Improve things

Benchmarking
John RobinsonLooking forward by looking back
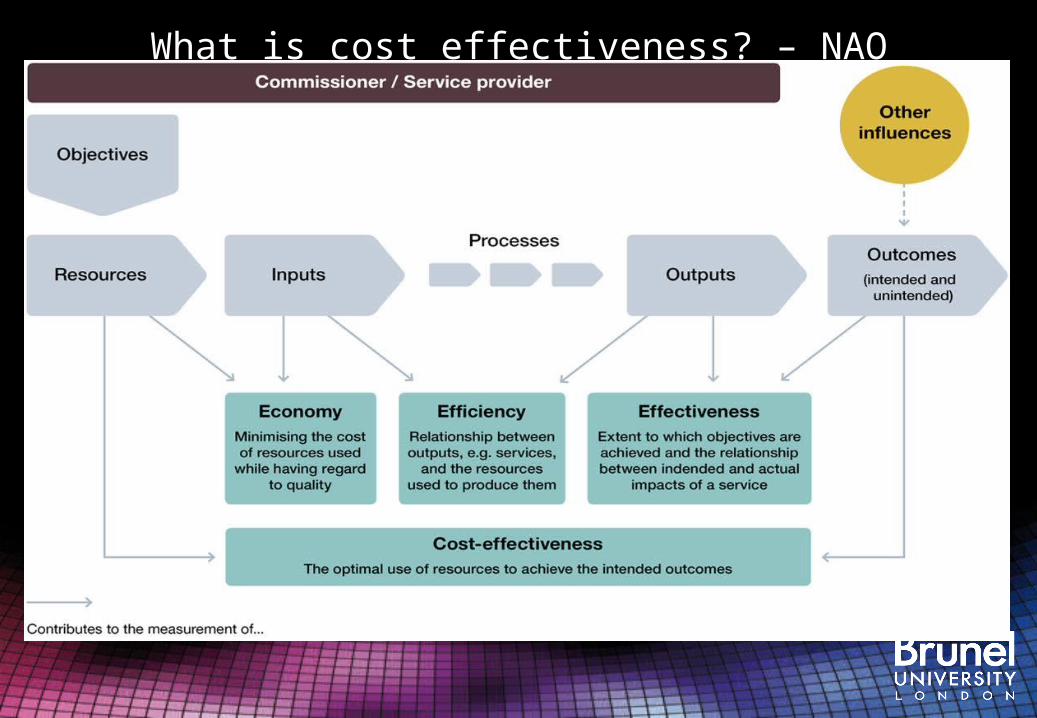
What is cost effectiveness? – NAO

Future Directions for Benchmarking in HE?
Nicki Horseman, Patrick Kennedy
Strategic Planning & Change
May 2011

To identify some possible future
directions for benchmarking in HE, by…
2 perspectives on ‘what I want from
benchmarking’
And offering some future ‘necessary
conditions’ for high quality benchmarking
Overall purpose

College (aka Faculty or School)
Dean and/or College Manager
Director of Strategy/Planning
2 perspectives

• Currency• Context• Credibility / Confidence
College Dean

College DeanPGR/Staff FTE - Physics
0.0
1.0
2.0
3.0
4.0
5.0
2005/06 2006/07 2007/08 2008/09
Durham
Edinburgh
Exeter
King's
Lancaster
Warwick
York

Ratios, groupings + uni
Drill downs to categories for more
understanding
HR, finance, estates data
Secure in same treatment (apples)
Ease of access, strong appetite for
excellence/depth of service
Director of Strategy /
Planning


Necessary conditionsfor quality benchmarking?• Data quality strategy/practice & core systems: HESA/HEIs • Brainpower beats benchmarking, incessant questioning • Inputs the easy bit, what about the outputs• A shared service development?• More granular (opt-in club) HESA returns?• Appetite
...Legal permission...
Wrapping up, final thoughts
• Good base established• Data structures and systems (BI) development well underway• Plenty of appetite out there; strong investment case• What are the primary paths for BM: HESA data, associated services, bought-in / bespoke, BM clusters of HEIs...?

Questions and discussion