Embed Size (px)
Citation preview

IDFC Presentation
May 2010
May 21, 2010 11Any unauthorized disclosure, copying or distribution of the contents of this information is prohibited.

Indian Infrastructure
Brief History, Shareholding & Board
Strategy, Structure, Core Team and Businesses
Performance
Conclusion
May 2010 2

Huge Investments Over the Past Decade….but, Still a HUGE Deficit!
~US$436bn invested in infrastructure since 2003
Driving acceleration in GDP growth
Infrastructure investment (US$ bn)7888
Real GDP growth10.0%
3238 43
5359 63
708
22
44
66
4.0%
6.0%
8.0%
Power: 16% shortfall at peak demand; per capita usage at 10% of global average
Ports: Major ports operating at 95% capacity with demand growing at 10%
0FY03 FY04 FY05 FY06 FY07 FY08 FY09 FY10
2.0%FY00 FY01 FY02 FY03 FY04 FY05 FY06 FY07 FY08 FY09 FY10E
Ports: Major ports operating at 95% capacity, with demand growing at 10%
Roads: National and state highways are stretched beyond maximum capacitiesaverage trucks coverage of 200km per day (25% of the global average).
Railways: Both coverage and efficiency is lacking track length of 35km/1,000 sq km vs. global average of 125, average train speed 25km/hr vs. China’s 150km/hr.
Airports: Penetration is low (25% of Brazil’s, 20% of China’s, 2% of US’)efficiency beginning to improve
Any unauthorized disclosure, copying or distribution of the contents of this information is prohibited. 3May 2010
Source: IDFC SecuritiesInfra investments... Not a choice, but a NECESSITY!

Infrastructure…Ambitious Plans & Aggressive Investments
The 11th Five-Year Plan (FY08-12) envisages investments of US$500 bn* in infrastructure
Initial projections for 12th Five-Year Plan (FY13-17) at ~US$1trn
100,000MW generation capacity addition
Port capacity to almost double; non-metro airports to see major push
Others1%
Ports & Airports
6%6%Water Supply &
Sanitation12%
Power35%
Total investments
US$500 bnIrrigation
13%
Dedicated Freight Corridor
Roads18%
Railways15%
40,000km of road development/expansion
Any unauthorized disclosure, copying or distribution of the contents of this information is prohibited. 4May 2010
Source: IDFC Securities*Excluding telecom
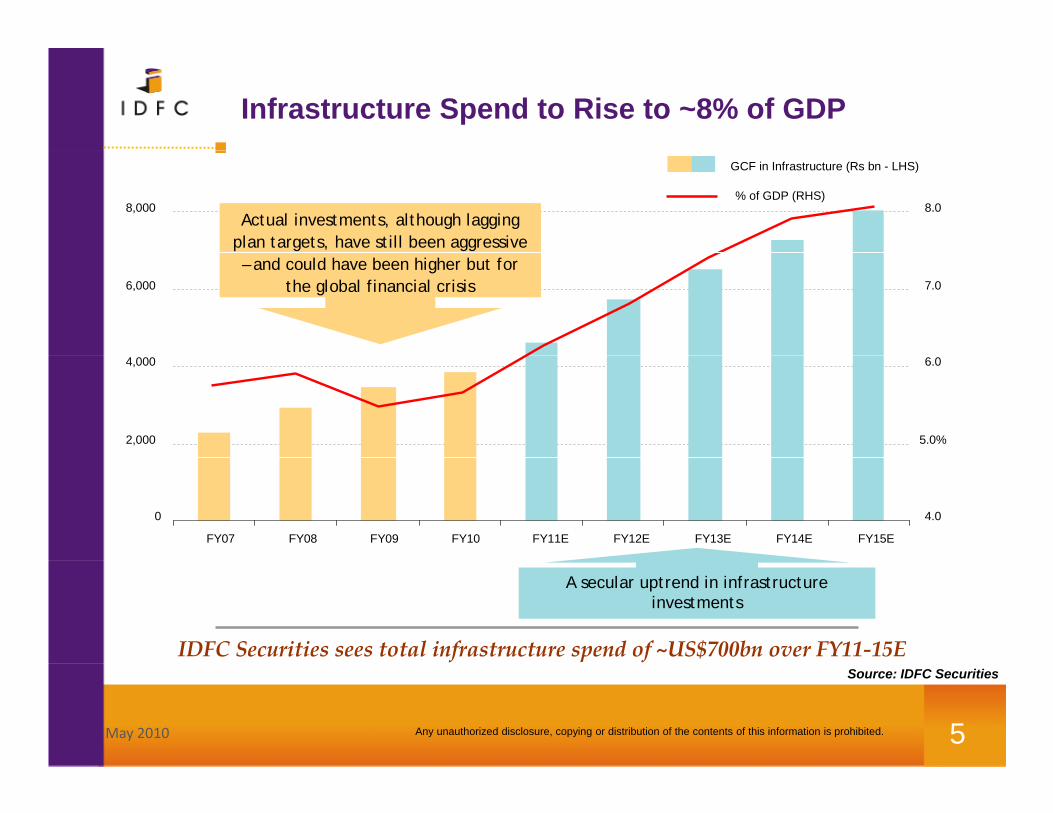
Infrastructure Spend to Rise to ~8% of GDP
8,000 8.0
GCF in Infrastructure (Rs bn - LHS)
% of GDP (RHS)
Actual investments, although lagging plan targets, have still been aggressive
6,000 7.0– and could have been higher but for
the global financial crisis
2,000
4,000
5.0%
6.0
0
FY07 FY08 FY09 FY10 FY11E FY12E FY13E FY14E FY15E
4.0
A secular uptrend in infrastructure investments
IDFC Securities sees total infrastructure spend of ~US$700bn over FY11‐15E
Any unauthorized disclosure, copying or distribution of the contents of this information is prohibited. 5May 2010
Source: IDFC Securities

Infrastructure…Increasing Private Sector Participation
Public investments to dominate spend, but private investments to grow 3x!
2,550
3,110
3,9008,000
Public Private
24% CAGR for private investments over FY10-15
1 2111,350
1,650
2,084
4 000
6,000
3 274 3,6504,100
4,100
1,211
2,000
4,000
2,237 2,516 2,9153,274 ,
0
FY09 FY10E FY11E FY12E FY13E FY14E FY15E
Any unauthorized disclosure, copying or distribution of the contents of this information is prohibited. 6May 2010
Source: IDFC SecuritiesFY09 FY10E FY11E FY12E FY13E FY14E FY15E

Indian Infrastructure
Brief History, Shareholding & Board
Strategy, Structure, Core Team and Businesses
Performance
Conclusion
May 2010 7

History (1997-2009)History (1997 2009)
1997
♦ IDFC was founded on the recommendations of the 'Expert Group on Commercialisation of Infrastructure Projects' under the Chairmanship of Dr. Rakesh Mohan.
♦ IDFC, a Public Private Partnership, incorporated in Chennai. Government holds 40% of the company, 40% is held by foreign shareholders and the rest by domestic entities.
♦ IDFC commences business operations with a mission to lead private capital to commercially viable infrastructure projects.
2004 ♦ IDFC successfully raises $200 million for the India Development Fund, the first infrastructure focused private equity fund.
2005
♦ IDFC goes public through a successful public offering that is oversubscribed 38 times. Shares issued at Rs. 34 a share. Lists on the National and Bombay Stock Exchanges.
♦ Government shareholding reduces from 40% to 26%.
2007 ♦ IDFC raises additional capital of USD 500 million through a Qualified Institutional Placement at Rs. 127 a share. Government shareholding reduces to 23%.
2006 ♦ IDFC successfully raises $450 million for its second infrastructure focused private equity fund .
♦ Acquired controlling stake in SSKIq g♦ IDFC successfully raises $930 million India Infrastructure Fund (IDFC Project Equity) ♦ IDFC successfully raises $700 million for its third infrastructure focused private equity fund .♦ IDFC enters into asset management by acquiring the AMC business of Standard Chartered Bank in India.
♦ IDFC becomes part of Nifty 50
2008
2009
8
♦ IDFC becomes part of Nifty 50
May 2010
2009

Shareholding Pattern & Board of DirectorsShareholding Pattern & Board of Directors
Shareholding Pattern (March 31, 2010) Deepak Parekh, Non-executive Chairman, HDFC Non-executive Chairman
G. C. Chaturvedi, Additional Secretary
GoI20.2%
MF
Corporate Bodies3.0%
Retail9.6%
G. C. Chaturvedi, Additional Secretary, Department of Financial Services, Ministry
of Finance
S. S. Kohli
Abdul Rahim Abu Bakar, Chairman, UEM Builders Berhad, Opus Group Berhad
Nominees of Ministry of Finance, Government of
India
Nominees of Domestic andMF5.5%
Khazanah
Dimitris Tsitsiragos, Director – Global Manufacturing & Services, International
Finance Corporation
S. H. Khan
Nominees of Domestic and Foreign Institutional
Shareholders
FII / FDI45.4%
FIs / Insurance Co / Banks16.4%
Shardul Shroff
Gautam Kaji
Omkar Goswami
Donald Peck
R ji B L ll M i Di t & CEO
Independent Directors
Rajiv B. Lall Managing Director & CEO
Vikram Limaye Whole-time Director
9May 2010

Indian Infrastructure
Brief History, Shareholding & Board
Strategy, Structure, Core Team and Businesses
Performance
Conclusion
May 2010 10

Strategygy
PPP Initiative
F db k
Advisory Group Project Finance
I t t
Private Equity
Project Equity
Project Finance
Investment Banking
Investment Banking
Asset Management
Project EquityIDFC Capital
Feedback Investment Banking Proprietary Equity Project Equity
g
Financial Ad i D bt E it R fi i Di t ib ti
EngineeringDesign
Agent Advisory Process Mgt.
Debt Equity Refinancing DistributionDesign Structuring Advice
Bidding Construction & Project Mgt. O&M Sale / ListingPrincipalProject preparation
IDFC Projects IDFC Projects IDFC Projects
Bidding Co st uct o & oject Mgt. Sale / Listingp preparation
IDFC is a one-stop-shop for all products and services across the infrastructure value chain
Pre-development Development Asset Maintenance Exit
11
IDFC is a one stop shop for all products and services across the infrastructure value chain
May 2010
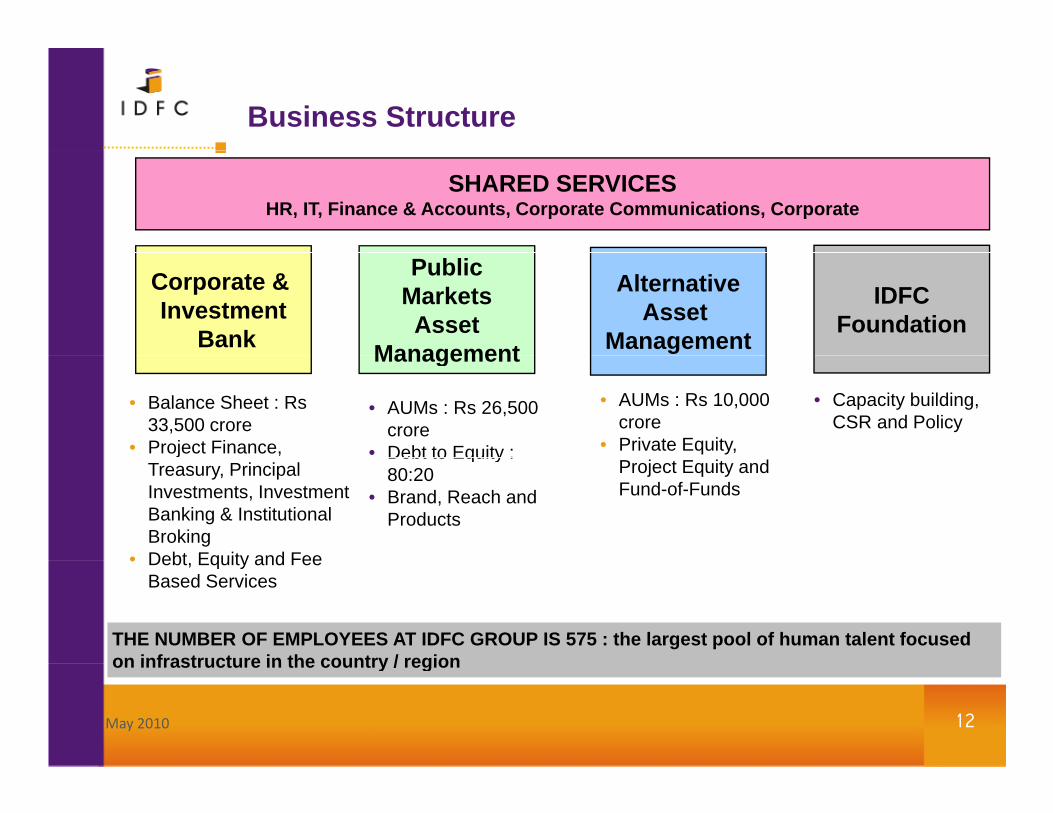
Business Structure
SHARED SERVICESHR, IT, Finance & Accounts, Corporate Communications, Corporate
Corporate & Investment
Bank
PublicMarketsAsset
Management
AlternativeAsset
Management
IDFCFoundation
Management
• Balance Sheet : Rs 33,500 crore
• Project Finance,
• AUMs : Rs 26,500 crore
• Debt to Equity :
• AUMs : Rs 10,000 crore
• Private Equity,
• Capacity building, CSR and Policy
Treasury, Principal Investments, Investment Banking & Institutional Broking
• Debt Equity and Fee
Debt to Equity : 80:20
• Brand, Reach and Products
Project Equity and Fund-of-Funds
• Debt, Equity and Fee Based Services
THE NUMBER OF EMPLOYEES AT IDFC GROUP IS 575 : the largest pool of human talent focused on infrastructure in the country / region
12May 2010
on infrastructure in the country / region

Core TeamCore TeamRajiv Lall Managing Director and Chief Executive Officer
Vikram Limaye Executive Director, member of the Board of Directors
L.K. Narayan Group Chief Financial Officer
Sadashiv Rao Group Chief Risk Officer
Animesh Kumar Group Head Human Resources, Corporate Communication
Rajeev Uberoi Group Head Legal and Compliance
Shared Services
Vinayak Mavinkurve Group Head Project Finance
Sanjay Grewal Group Head Project Finance
Tapasije Mishra Group CEO, Investment Banking
Naishadh Paleja CEO Broking
Corporate & Investment Bank
j g
Public Mkt AMC Naval Bir Kumar CEO of IDFC AMC
Luis Miranda President and CEO of IDFC Private Equity
M. K. Sinha President & CEO of IDFC Project EquityAlternative Asset
Veronica John President & CEO IDFC Capital, Singapore
Pradeep Singh VC & MD IDFC Projects
Cherian Thomas Group Head of PPP Initiatives
Ritu Anand Principal Advisor Chief Economist
Management
IDFC Foundation
13May 2010
Ritu Anand Principal Advisor, Chief Economist

IDFC and the IFC contextIDFC and the IFC context
What are IFCs*?
NBFCs with a minimum of 75% of assets deployed in infrastructureNet owned funds of Rs3bn or more
A minimum credit rating 'A'; and With a CRAR of 15 % and a minim m Tier I capital of 10 %
Norms
With a CRAR of 15 % and a minimum Tier I capital of 10 %*Infrastructure Financing Companies
Exposure limit on-lending to infra projects up by 500bp to 25% of owned funds for single Easier exposure
norms
Exposure limit on lending to infra projects up by 500bp to 25% of owned funds for single borrower and to 40% for a single group of borrowers
SCBs permitted exposure of 15% to a single borrower and 25% to a single group of borrowers
Improving access to bank funds &
ECBs
Banks’ cap on lending to infra finance companies raised from 15% of capital funds (Tier 1+2) to 20%
Risk weights of banks’ exposure to IFCs linked to credit rating assigned to such NBFCs
Possibility to raise tax free infrastructure bonds
IDFC could be one of the few primary players in the space
14May 2010
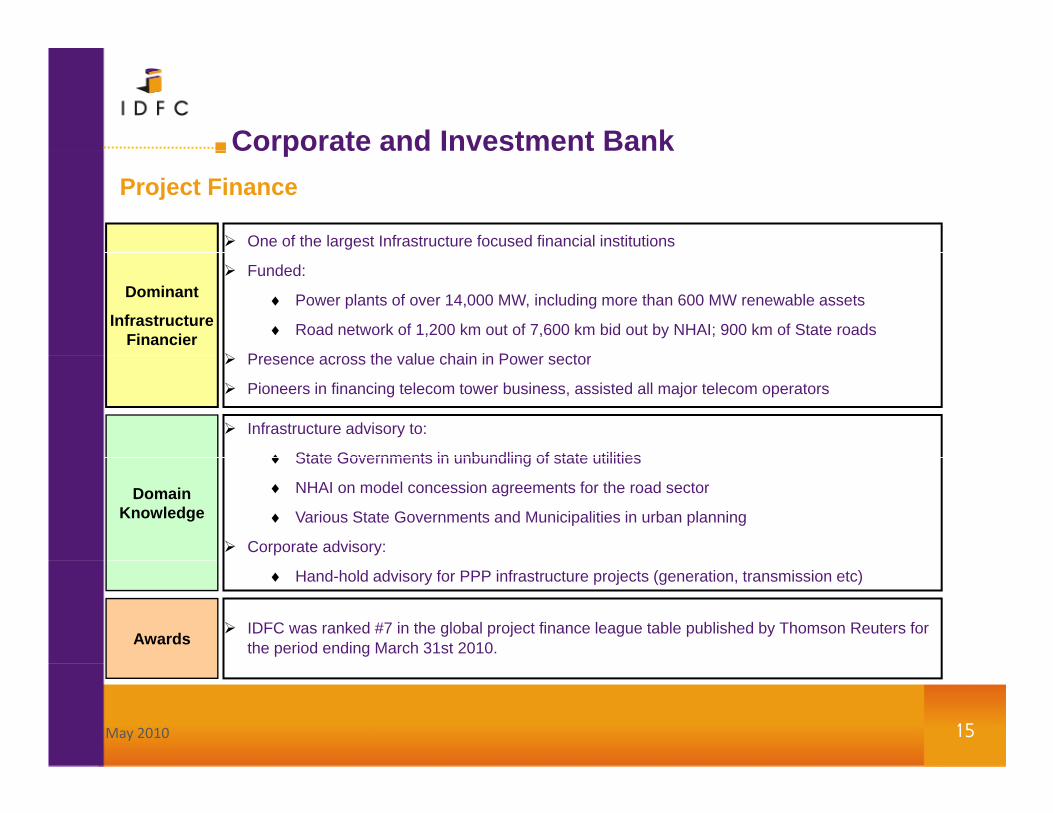
Corporate and Investment Bank
One of the largest Infrastructure focused financial institutions
Corporate and Investment BankProject Finance
Dominant
Infrastructure Financier
Funded:
♦ Power plants of over 14,000 MW, including more than 600 MW renewable assets
♦ Road network of 1,200 km out of 7,600 km bid out by NHAI; 900 km of State roads
P th l h i i P tPresence across the value chain in Power sector
Pioneers in financing telecom tower business, assisted all major telecom operators
Infrastructure advisory to:
♦ State Governments in unbundling of state utilities
Domain Knowledge
♦ State Governments in unbundling of state utilities
♦ NHAI on model concession agreements for the road sector
♦ Various State Governments and Municipalities in urban planning
Corporate advisory:
♦ Hand-hold advisory for PPP infrastructure projects (generation, transmission etc)
Awards IDFC was ranked #7 in the global project finance league table published by Thomson Reuters for the period ending March 31st 2010.
15May 2010

Corporate and Investment BankProject Finance : Exposure & Outstanding Disbursements – Sectors
Corporate and Investment Bank
Exposure Outstanding Disbursements
Rs crore % Rs crore % Rs crore % Rs crore %
Energy 12,499 41% 16,800 38% Energy 8,217 36% 10,342 37%Transportation 7,307 24% 8,676 20% Transportation 5,793 25% 5,548 20%Telecom 3,344 11% 10,705 24% Telecom 3,252 14% 5,725 21%
March 31, 2009 March 31, 2010Sector Sector
March 31, 2009 March 31, 2010
Telecom 3,344 11% 10,705 24% Telecom 3,252 14% 5,725 21%Industrial & Commercial 3,390 11% 3,573 8% Industrial & Commercial 2,977 13% 3,280 12%Tourism 1,672 5% 958 2% Tourism 1,217 5% 764 3%Other misc 2,552 8% 3,129 7% Other misc 1,653 7% 2,227 8%
Total 30,764 43,842 Total 23,109 27,885Growth (Y o Y) 43% Growth (Y o Y) 21%
20,364
30,442
20,000
25,000
30,000
35,000
Gross Approval Gross Disbursement
Growth (Y-o-Y) 43% Growth (Y-o-Y) 21%
6,411
10,632
13,203
10,317
3,719
6,0457,357
12,006
8,085
12,962
0
5,000
10,000
15,000
FY2005 FY2006 FY2007 FY2008 FY2009 FY2010
16May 2010

Corporate and Investment Bank
IDFC Capital & IDFC Securities
ResearchIDFC Securities among India’s leading domestic stock broking housesIDFC-Securities among India s leading domestic stock broking housesStrong and independent Research
Analysts rated across sectorsKnown for contrarian calls Wide coverage of around 200 companies across 22 sectors
Consistently ranked as one of the best domestic wholesale brokerages
“Starmine Best Broker” for India Mid and Small Caps (2008)
Wide coverage of around 200 companies across 22 sectorsTeam with extensive industry experienceResearch franchise across sectors like infrastructure, banking and consumer goods
Institutional Broking
Global reach with clients across geographies
Pronounced “Best Local Brokerage for the last 20 years” by Asiamoney in its ‘Poll of Polls 2004’, ‘Poll of Polls 2009’
Investment BankingAmong India’s largest infrastructure-focused investment bank (M&A, debt syndication, capital market offerings, private equity)Successful track record of international fund raisingProduct expertise and franchise with investors complemented by IDFC’s balance sheet, corporate & government
17
relationships and domain knowledge
May 2010
Corporate and Investment BankCorporate and Investment Bank
Shapoorji IPallonji
18May 2010
Punj Lloyd Ltd

Corporate and Investment BankPrincipal Investing
C i
Corporate and Investment Bank
Comprises
Venture Capital Funds : Investments in our funds and other funds
Project Finance : Unlisted equity investments in infrastructure
Proprietary Investments : Listed equity investments in infrastructure
Financial : Include investments like NSE, ARCIL and STCI
Treasury : Debt investments
Strategy is to consistently support IDFC sponsored funds and to make co-investments
alongside fundsalongside funds
19May 2010

Public Markets Asset ManagementPublic Markets Asset Management
IDFC AMCAcquired in 2008 from Standard Chartered The only fund house to be voted twice as the “Best Acquired in 2008 from Standard Chartered
AUM of USD 5.6 billion (debt equity mix of
82:18) and is currently ranked 10 amongst
37 Indian AMCs.
T k d f 8
yDebt Fund Manager” by Business Standard
IDFC MF has been rated as the “Best Performing Fund House” by the ET Quarterly MF Tracker for Q1 &Track record of 8 years
No. of employees : 147, direct reach to 38
cities with an indirect presence in over 140
towns
Fund House by the ET Quarterly MF Tracker for Q1 & Q2 of FY 09-10
Business World & Business Standard voted Kenneth Business to include mutual funds, offshore
fund management / advisory, PMS and other
hybrid alternative products
Andrade (Head – Investments) as the “Smartest Fund Manager of the Year” for the year 2009
20May 2010

Alternative Asset ManagementAlternative Asset ManagementPrivate Equity
Established in 2002 as a wholly owned subsidiary of IDFC
Manages a corpus of USD 1.3 billion and is India’s largest and most active private equity fund focussed onManages a corpus of USD 1.3 billion and is India s largest and most active private equity fund focussed on infrastructure
The three funds under management are India Development Fund (USD 190 million), IDFC Private Equity Fund II (USD 440 million) and IDFC Private Equity Fund III (USD 700 million)
IDFC PE has made 30 investments across 26 companies and has had 6 exits
Major Investments include GMR Infrastructure, Gujarat State Petronet, Delhi International Airport, L&T Infrastructure Development, Manipal Universal Learning, Quippo Infrastructure, PV Technologies and Goodearth Maritime.
Won an award by the Infrastructure Investor, for the Asia Infrastructure Fund Manager of the year and the Asian Infrastructure Deal of the Year
Project EquitySet-up in 2007 as a wholly owned subsidiary of IDFC
Manages the India Infrastructure Fund of US$ 927 million
Invests primarily for the long term in infrastructure equity opportunities in assets/projects in India
Portfolio is expected to comprise operational, brownfield and greenfield assets/projects in core infrastructure sectors including transport, energy and utilities, telecommunications infrastructure and social infrastructure
21May 2010

Alternative Asset ManagementAlternative Asset Management
IDFC Global AlternativesEstablished in 2008 in Singapore to develop a fund of funds business
First fund will be a global emerging markets private equity fund-of-funds
Will focus mainly on Asia and the Commonwealth of Independent States (CIS)
Will focus its manager selection on those that provide expansion and buyout capital to middle market companies
IDFC ProjectsEstablished in 2008 to intermediate risk capital and capture potential upside from investing in early stage
infrastructure development
To focus on leveraging third party funds
Focus on power and roads
Disciplined and calibrated approach – one project at a time
22May 2010

IDFC FoundationIDFC Foundation
Policy Advocacy and Advisory
Across sectors over the yearsIndia Infrastructure Report – thematic
PPP Initiatives
Government Advisory ServicesJoint Ventures – iDeCK, U-DeC and DIMTSProject Development Fund – Triple IC it B ildi I CCapacity Building – I-Cap
Corporate Social Responsibility
• Responsible business practices and inclusive developmentResponsible business practices and inclusive development
23May 2010

Indian Infrastructure
Brief History of IDFC
Structure, Shareholding and Board
Strategy Core Team and BusinessesStrategy, Core Team and Businesses
Performance
Conclusion
24May 2010

FinancialsFinancials(% of avg total assets)
Particulars FY 2005 FY 2006 FY 2007 FY 2008 FY 2009 FY 2010Net Interest Income 3.7% 3.0% 2.8% 2.9% 3.1% 3.6%
Infrastructure 3.7% 2.9% 2.6% 2.4% 2.6% 3.3%Treasury 0.0% 0.1% 0.2% 0.5% 0.6% 0.3%y
Non-Interest Income 2.4% 2.2% 1.7% 2.6% 2.1% 3.0%Principal Investment 1.7% 1.3% 0.9% 0.9% 0.6% 1.1%Asset management 0.1% 0.3% 0.3% 0.2% 0.7% 0.9%Investment Banking 0.0% 0.0% 0.0% 0.8% 0.4% 0.6%
Loan related & other fees 0.6% 0.7% 0.5% 0.7% 0.4% 0.5%Oth I 0 1% 0 0% 0 1% 0 1% 0 1% 0 1%Other Income 0.1% 0.0% 0.1% 0.1% 0.1% 0.1%
OPERATING INCOME 6.2% 5.2% 4.7% 5.6% 5.2% 6.7%OPERATING EXPENSES 0.5% 0.5% 0.5% 1.1% 1.2% 1.8%
PRE-PROVISIONING PROFITS 5.7% 4.7% 4.1% 4.5% 4.0% 5.0%Provisions 0.9% 0.4% 0.1% 0.3% 0.5% 0.4%
PBT 4.8% 4.3% 4.0% 4.2% 3.5% 4.6%Less : Provision for Tax, Profit in
associate co, Minority interest, etc 0.3% 0.5% 0.7% 1.1% 1.0% 1.2%
PAT 4.5% 3.8% 3.3% 3.1% 2.5% 3.4%
Particulars FY 2005 FY 2006 FY 2007 FY 2008 FY 2009 FY 2010O ll S d 2 4% 1 8% 1 9% 2 1% 2 4% 2 8%Overall Spread 2.4% 1.8% 1.9% 2.1% 2.4% 2.8%
Cost to Income # 8.1% 10.2% 11.5% 19.2% 23.6% 26.0%Effective Tax Rate 6.4% 11.7% 20.1% 26.3% 27.7% 25.7%
Loan Loss Reserve Ratio 0.0% 2.3% 1.6% 1.1% 1.8% 1.8%Leverage (Closing) 3.8 x 4.7 x 6.2 x 5.0 x 4.8 x 4.8 x
RoE 17.2% 17.0% 17.7% 15.6% 12.5% 15.9%
25May 2010
# Cost to Income : Operating Cost / Operating Income
Robust Balance Sheet Business
US$9.3bnRs 438 425 mn
500,000US$ 5.0bn US$ 4 9bn
US$ 5.9bnRs 278,850 mn300,000
Robust Balance Sheet BusinessOutstanding Disbursements Total Exposure
US$2 6bn
US$ 3.7bnRs 174,930 mn
US$4.8bnRs 224,110 mn
US$6.7.2bnRs 340,005 mn US$6.5bn
Rs 307,640 mn
Rs 438,425 mn
200,000
300,000
400,000
Rs.
milli
on
US$ 1.7bn
US$ 2.4bnRs 113,560 mn
US$ 3.3bnRs 157,810 mn
$Rs 233,920 mn
US$ 4.9bnRs 231,090 mn
100 000
150,000
200,000
250,000
Rs.
milli
on
US$2.6bnRs 124,137 mn
0
100,000
Mar 05 Mar 06 Mar 07 Mar 08 Mar 09 Mar 10
RRs 80,060 mn
0
50,000
100,000
Mar 05 Mar 06 Mar 07 Mar 08 Mar 09 Mar 10
Energy38.3%
Commercial, Industrial & Tourism
8.2%
Tourism2.2%
Others7.1%Energy
37.1%Commercial, Ind
ustrial & Tourism11 8%
Tourism2.7%
Others8.0%
Outstanding Disbursements (Mar 31, 2010) Total Exposure (Mar 31, 2010)
TransportationTelecom
24.4%
8.2%
Transportation
Telecom20.5%
11.8%
p19.8%
Transportation19.9%
26May 2010
1 USD = Rs .47.12

Strong Operating Track Record
225250
Strong Operating Track RecordLeverage & RoE Net profit (USD MM)
17.2% 17.0% 17.7%15.6% 15.9% 6.0x
7.0x20.0%
6683
107
157 159
100
150
200
US$
mn
12.5%
3.8x
4.7x
6.2x
5.0x 4.8x 4.8x
2.0x
3.0x
4.0x
5.0x
6.0x
4 0%
8.0%
12.0%
16.0%
450
0
50
Mar 05 Mar 06 Mar 07 Mar 08 Mar 09 Mar 10
Borrowing profile (Mar 31, 2010) Operating income break-up
0.0x
1.0x
0.0%
4.0%
Mar 05 Mar 06 Mar 07 Mar 08 Mar 09 Mar 10
39
71
10
43
61
48
24
39
27
23
30
200
250
300
350
400
450
US$ m
n
Bonds / Debentures
59%Forex Loans
8%
Sub debt3%
Short Term15%
54 65 91147
196237
2628
28
46
26
11 5
79
12
0
50
100
150
Mar 05 Mar 06 Mar 07 Mar 08 Mar 09 Mar 10
U
Rupee Loans15%
8%
Duration (Mar 31 2010) : Assets – 1 95 years Liabilities – 1 75 years NII Principal Investment Asset Management
27
Duration (Mar 31, 2010) : Assets – 1.95 years, Liabilities – 1.75 years
May 2010

Indian Infrastructure
Brief History of IDFC
Structure, Shareholding and Board
Strategy Core Team and BusinessesStrategy, Core Team and Businesses
Performance
Conclusion
28May 2010

Uniquely Positioned CompanyUniquely Positioned CompanyUnique platform combining benefits of Government sponsorship, internationally diversified shareholder base and professional management to pursue business opportunities in the infrastructure space
Well poised to capitalize on the strong momentum in infrastructure investments
High profile Board and experienced management team with 575 professionalsg p p g p
Deep domain knowledge in the core infrastructure sectors of energy, transportation, telecom & industrial and commercial infrastructure
Focus on high ROE businesses including Asset Management, Investment Banking and Principal Investments
Strong track record of performance, consistent growth and execution of strategyg p , g gyTotal Assets – March 31, 2010 US$ 7.1 bn with 5 year CAGR of 29%Net Operating Income – FY2010 US$ 447 mn with CAGR (2005 - 2010) of 37%PAT – FY2010 US$ 225 mn with CAGR (2005 - 2010) of 28%Gross NPA : 0.4%, Net NPAs : 0.2%AUM – March 31, 2010 US$ 8.1 bn with 5 year CAGR of 112%
29
AUM March 31, 2010 US$ 8.1 bn with 5 year CAGR of 112%
May 2010

Thank YouThank You
Corporate & Investment Bank
Project Finance
Investment Banking
Instit tional Broking
IDFC
2nd - 6th Floor, Naman Chambers,
C32, G-Block,
Bandra Kurla Complex,
Bandra (East),Institutional Broking
Principal Investment
Treasury
Equity
Public Markets Asset Management
Mumbai 400 051
Tel: + 91.22.4222.2000
Delhi
IDFCPublic Markets Asset Management
Mutual Fund
Alternative Asset Management
Private Equity
Project Equity
The Capital Court,
2nd Floor,
Olof Palme Marg,
Munirka,
New Delhi - 110 067
Tel: + 91.11.4600.6100Project Equity
Global Alternatives
Projects
Foundation
Website: www.idfc.com
May 21, 2010 3030Any unauthorized disclosure, copying or distribution of the contents of this information is prohibited.