Embed Size (px)
Citation preview
IDFC GREEN FINANCE MAPPING FOR 2014NOVEMBER 2015
supported by World Resources Institute and

TABLE OF CONTENTS
1| TOWARDS A LOW-CARBON AND CLIMATE-RESILIENT SOCIETY 2
2| METHODOLOGY 4
3| GREEN FINANCE MAPPING OUTCOMES FOR 2014 5 3.1 | GREEN FINANCE COMMITMENTS 53.2 | GREEN FINANCE COMMITMENTS FROM INSTITUTIONS BASED IN OECD AND NON-OECD COUNTRIES 63.3 | GREEN FINANCE COMMITMENTS BY INSTRUMENT TYPE 73.4 | GREEN FINANCE COMMITMENTS BY TARGET REGION 83.5 | GREEN FINANCE COMMITMENTS TO GREEN ENERGY AND MITIGATION 93.6 | GREEN FINANCE COMMITMENTS TO ADAPTATION TO CLIMATE CHANGE 103.7 | GREEN FINANCE COMMITMENTS TO OTHER ENVIRONMENTAL OBJECTIVES 11
4| CONCLUSIONS AND RECOMMENDATIONS 13
4.1 | CONCLUSIONS 134.2 | RECOMMENDATIONS 14
ANNEX A - LIST AND BRIEF DESCRIPTION OF IDFC MEMBER ORGANISATIONS 15
ANNEX B – METHODOLOGY GUIDANCE 16
ANNEX C - ELIGIBLE PROJECT CATEGORIES 19
ANNEX D - INDEX OF ACRONYMS 24
ANNEX E – DATA TABLES 25
1
2015 is a critical year for the transition towards a low-carbon and climate resilient society as the international community negotiates the shift from Millennium Development Goals (MDGs) to Sustainable Development Goals (SDGs), and meets in Paris to reach an international climate agreement. The latter will help the world address the urgency of limiting the global average temperature increase to 2 °C above the pre-industrial level. Investment needs for low carbon and climate-resilient infrastructure are immense, estimated at around USD 5 to 7 trillion per year1.
The International Development Finance Club (IDFC), formed in 2011 and consisting of 23 national, bilateral and regional development banks from Africa, Asia, Europe, and Central and South America (see Figure 1), firmly believes that the role of development banks is crucial to promote sustainable development and to catalyse the shift towards low carbon and climate-resilient development. The primary objective of the club is to address the major obstacles facing long-term development finance today by joining forces on the issues currently defining the global development agenda. With their significant financial capacities, IDFC members committed more than USD 630 billion in 2014 to finance a wide range of projects all over the world. Since 2013, IDFC members have focused their activity on sustainable development, organising working groups on sustainable infrastructure, renewable energy, energy efficiency, social and economic inclusion, sustainable urban development, climate finance, and triangular cooperation.
IDFC members share a common vision of the potential for development finance to promote and support a low-carbon and climate-resilient future. This IDFC Green Finance Mapping study supports this vision by demonstrating, and providing consistent information on IDFC’s contribution to green and climate finance. With the objective of identifying, measuring and categorising its financial flows to green energy and climate change mitigation, adaptation to climate change as well as other environmental objectives, the IDFC Green Finance Mapping report offers a transparent view on the activities and the total green finance commitments of IDFC members. Based on the results of IDFC’s previous Green Finance Mapping, the IDFC announced during the UN Climate Summit 2014 that it is on track to increase its direct annual green/climate financing to USD 100 billion by the end of 2015.
Due to the growing importance of climate finance tracking, IDFC has worked with a group of Multilateral Development Banks (MDBs)2 to harmonize respective approaches on climate finance tracking in 2015. These groups jointly published Common Principles for Climate Finance Tracking3, both for mitigation and adaptation. This year’s IDFC Green Finance Mapping report and related methodologies follow the MDBs-IDFC Common Principles for Climate Mitigation Finance Tracking. IDFC and the MDBs also agreed to continuously work on improving data transparency, collection processes and comparability of reporting to further enhance the credibility of climate finance reporting, based on their experience of the topic.
The key objective of the IDFC Green Finance Mapping exercise for 2014 is to collect and disclose first-hand data on new green finance commitments by IDFC members and to ensure data comparability and consistency across IDFC. In this year’s green finance mapping, more detail is provided on climate finance flows between OECD and non-OECD countries, finance flows by instrument type and – as a result of the MDBs-IDFC Common Principles for Climate Mitigation Finance Tracking – finance to green energy and mitigation.
The IDFC Green Finance Mapping report presents the applied finance tracking methodology and key outcomes for IDFC’s green finance commitments in 2014. The report is structured as follows:
• Section 2 provides an overview of the methodology used for this mapping exercise.
• Section 3 discusses the main outcomes of the mapping exercise.• Section 4 contains the conclusions and recommendations of
the mapping exercise.
• Annex A contains a list and brief description of IDFC member organisations.
• Annex B details the methodology guidance used for the mapping exercise.
• Annex C presents a list of core eligible project categories used to define green finance investments.
• Annex D is the index of acronyms.• Annex E provides data tables on green finance commitments.
1 ICESDF (2014): United Nations Report of the Intergovernmental Committee of Experts on Sustainable Development Financing.2 The African Development Bank (AfDB), the Asian Development Bank (ADB), the European Bank for Reconstruction and Development (EBRD), the European Investment
Bank (EIB), the Inter-American Development Bank (IDB), and the International Finance Corporation (IFC), World Bank (IDA/IBRD) from the World Bank Group (WBG). 3 https://www.idfc.org/Press-And-Publications/other-publications.aspx.
1 | TOWARDS A LOW-CARBON AND CLIMATE-RESILIENT SOCIETY
2
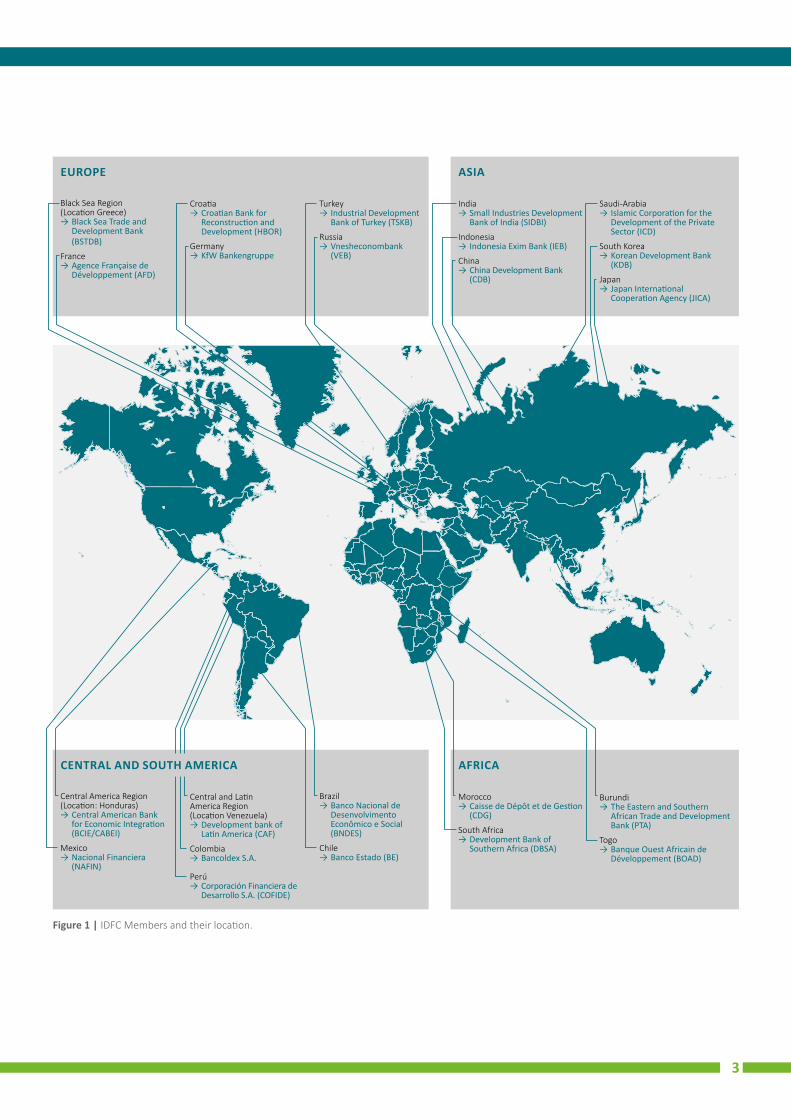
Figure 1 | IDFC Members and their location.
EUROPE
Black Sea Region (Location Greece)
→ Black Sea Trade and Development Bank (BSTDB)
France → Agence Française de Développement (AFD)
Croatia → Croatian Bank for Reconstruction and Development (HBOR)
Germany → KfW Bankengruppe
Turkey → Industrial Development Bank of Turkey (TSKB)
Russia → Vnesheconombank (VEB)
ASIA
India → Small Industries Development Bank of India (SIDBI)
Indonesia → Indonesia Exim Bank (IEB)
China → China Development Bank (CDB)
Saudi-Arabia → Islamic Corporation for the Development of the Private Sector (ICD)
South Korea → Korean Development Bank (KDB)
Japan → Japan International Cooperation Agency (JICA)
CENTRAL AND SOUTH AMERICA
Central America Region (Location: Honduras)
→ Central American Bank for Economic Integration (BCIE/CABEI)
Mexico → Nacional Financiera (NAFIN)
Central and Latin America Region (Location Venezuela)
→ Development bank of Latin America (CAF)
Colombia → Bancoldex S.A.
Perú → Corporación Financiera de Desarrollo S.A. (COFIDE)
Brazil → Banco Nacional de Desenvolvimento Econômico e Social (BNDES)
Chile → Banco Estado (BE)
AFRICA
Morocco → Caisse de Dépôt et de Gestion (CDG)
South Africa → Development Bank of Southern Africa (DBSA)
Burundi → The Eastern and Southern African Trade and Development Bank (PTA)
Togo → Banque Ouest Africain de Développement (BOAD)
CENTRAL AND SOUTH AMERICA
3
2 | METHODOLOGY
Since 2011, the IDFC has reported their green finance flows. This mapping exercise draws on first-hand data provided by 21 out of the 23 IDFC members.6
A desk-based data collection approach was carried out using a customised financial survey tool. Detailed guidelines were provided to IDFC members on the categorisation of projects (as listed in Annex C) and use of this tool. Additional data were also requested to capture a more detailed picture of mitigation, adaptation and other environment finance by geography and OECD-membership. During the data collection process, IDFC members were asked to use the definitions and eligibility criteria guidelines provided (defined in Annexes B and C), taking the MDBs-IDFC Common Principles for Climate Mitigation Finance Tracking from this Green Finance Mapping for 2014 into account. In comparison to the previous years’ methodology, these MDBs-IDFC Common Principles require a deeper disaggregation of green energy and mitigation of GHG projects. If there were any deviations from the guidelines, organisations were encouraged to note and report them. Institutions may also use a “miscellaneous and others” category for projects not referenced elsewhere. In this case members have to specify the project activity and justify their classification. In case banks could not specify any project activity for the “miscellaneous and others” category, these data were allocated to non-attributed data.
The institutions provided their data in USD. They were asked to use the average exchange rates from local currencies to USD from the World Bank for the year 20147.
IDFC is working towards consistently applying the MDBs-IDFC Common Principles for Climate Finance Tracking across its participating banks. While the IDFC’s own methodology was still applied to adaptation to climate change in 2014, in the next mapping exercise, IDFC will adopt the MDBs-IDFC Common Principles for Climate Adaptation Finance Tracking. Applying these jointly developed Common Principles will help to further improve consistency and comparability of global climate adaptation finance tracking activities.
The IDFC Green Finance Mapping exercise for 2014 has followed the MDBs-IDFC Common Principles for Climate Mitigation Finance Tracking, while the IDFC’s own methodology was still applied for assessing adaptation to climate change4. As in previous years, the mapping exercise continues to enhance the four key aspects of defining, tracking and reporting climate finance:
• Transparency: to adopt a standardised and publically available financial reporting format with common definitions and methodologies to quantify climate finance. The MDBs-IDFC Common Principles methodology is publicly available on the IDFC website: https://www.idfc.org/Press-And-Publications/other-publications.aspx
• Comparability: to encourage a universal methodology/approach which institutions can use to assess and compare mobilised climate finance.
• Consistency: to promote a yearly accounting requirement for financial institutions on climate finance.
• Flexibility: to allow for a practical, adaptable and coordinated universal reporting system to track climate finance.
Please refer to Annex B for further guidance on the applied methodology.
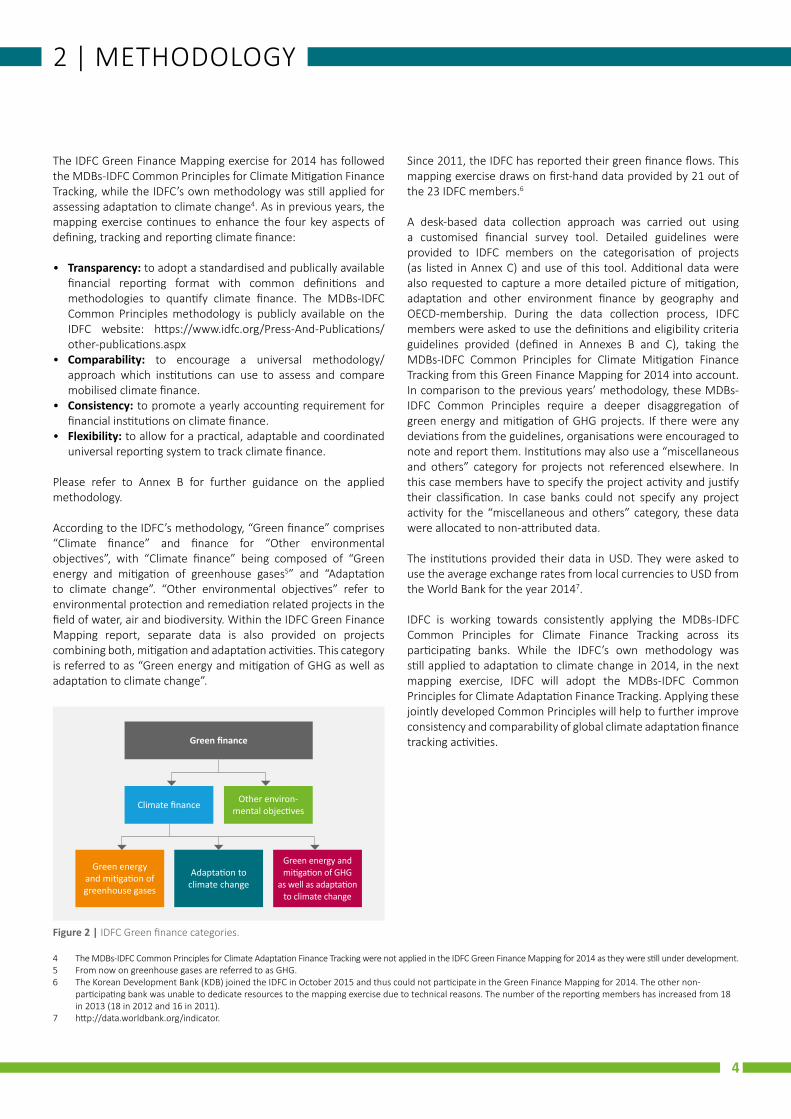
According to the IDFC’s methodology, “Green finance” comprises “Climate finance” and finance for “Other environmental objectives”, with “Climate finance” being composed of “Green energy and mitigation of greenhouse gases5” and “Adaptation to climate change”. “Other environmental objectives” refer to environmental protection and remediation related projects in the field of water, air and biodiversity. Within the IDFC Green Finance Mapping report, separate data is also provided on projects combining both, mitigation and adaptation activities. This category is referred to as “Green energy and mitigation of GHG as well as adaptation to climate change”.
4 The MDBs-IDFC Common Principles for Climate Adaptation Finance Tracking were not applied in the IDFC Green Finance Mapping for 2014 as they were still under development. 5 From now on greenhouse gases are referred to as GHG.6 The Korean Development Bank (KDB) joined the IDFC in October 2015 and thus could not participate in the Green Finance Mapping for 2014. The other non-
participating bank was unable to dedicate resources to the mapping exercise due to technical reasons. The number of the reporting members has increased from 18 in 2013 (18 in 2012 and 16 in 2011).
7 http://data.worldbank.org/indicator.
Figure 2 | IDFC Green finance categories.
Green finance
Climate finance Other environmental objectives
Green energy and mitigation of greenhouse gases
Adaptation to climate change
Green energy and mitigation of GHG
as well as adaptation to climate change
4
3 | GREEN FINANCE MAPPING OUTCOMES FOR 2014
This section presents the main results of the mapping of green finance committed by IDFC members in 2014.
3.1 | GREEN FINANCE COMMITMENTS
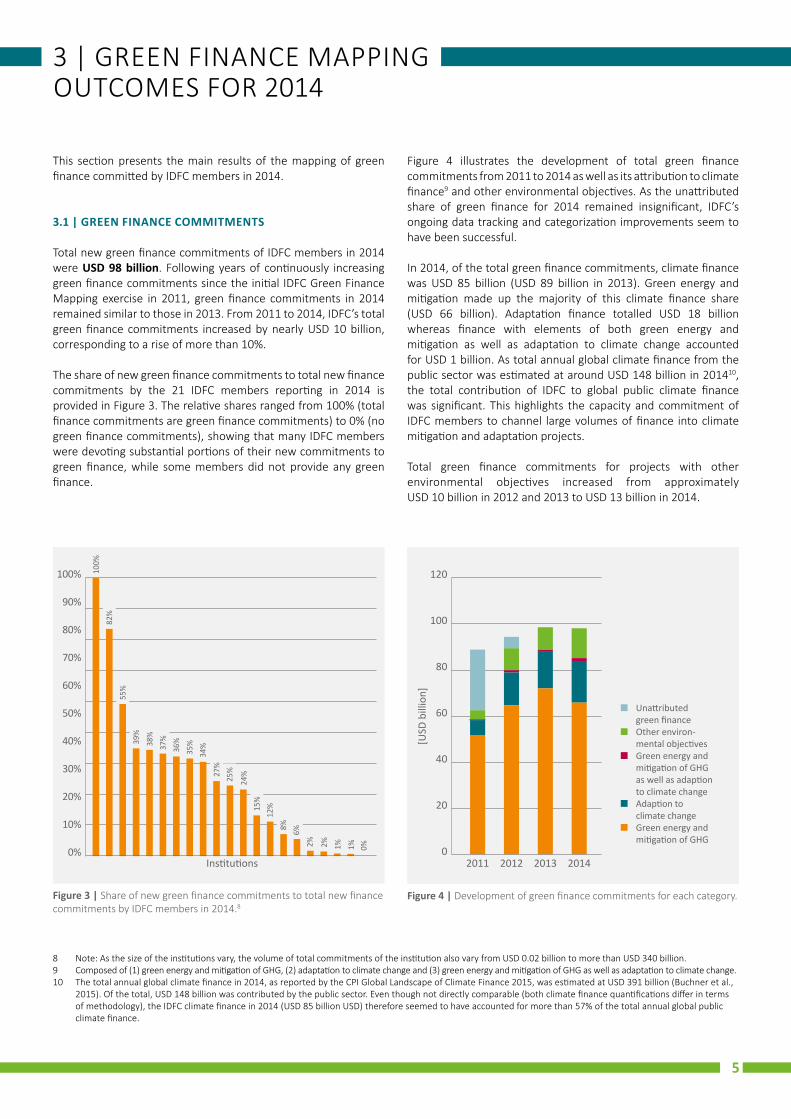
Total new green finance commitments of IDFC members in 2014 were USD 98 billion. Following years of continuously increasing green finance commitments since the initial IDFC Green Finance Mapping exercise in 2011, green finance commitments in 2014 remained similar to those in 2013. From 2011 to 2014, IDFC’s total green finance commitments increased by nearly USD 10 billion, corresponding to a rise of more than 10%.
The share of new green finance commitments to total new finance commitments by the 21 IDFC members reporting in 2014 is provided in Figure 3. The relative shares ranged from 100% (total finance commitments are green finance commitments) to 0% (no green finance commitments), showing that many IDFC members were devoting substantial portions of their new commitments to green finance, while some members did not provide any green finance.
Figure 4 illustrates the development of total green finance commitments from 2011 to 2014 as well as its attribution to climate finance9 and other environmental objectives. As the unattributed share of green finance for 2014 remained insignificant, IDFC’s ongoing data tracking and categorization improvements seem to have been successful.
In 2014, of the total green finance commitments, climate finance was USD 85 billion (USD 89 billion in 2013). Green energy and mitigation made up the majority of this climate finance share (USD 66 billion). Adaptation finance totalled USD 18 billion whereas finance with elements of both green energy and mitigation as well as adaptation to climate change accounted for USD 1 billion. As total annual global climate finance from the public sector was estimated at around USD 148 billion in 201410, the total contribution of IDFC to global public climate finance was significant. This highlights the capacity and commitment of IDFC members to channel large volumes of finance into climate mitigation and adaptation projects.
Total green finance commitments for projects with other environmental objectives increased from approximately USD 10 billion in 2012 and 2013 to USD 13 billion in 2014.
8 Note: As the size of the institutions vary, the volume of total commitments of the institution also vary from USD 0.02 billion to more than USD 340 billion.9 Composed of (1) green energy and mitigation of GHG, (2) adaptation to climate change and (3) green energy and mitigation of GHG as well as adaptation to climate change.10 The total annual global climate finance in 2014, as reported by the CPI Global Landscape of Climate Finance 2015, was estimated at USD 391 billion (Buchner et al.,
2015). Of the total, USD 148 billion was contributed by the public sector. Even though not directly comparable (both climate finance quantifications differ in terms of methodology), the IDFC climate finance in 2014 (USD 85 billion USD) therefore seemed to have accounted for more than 57% of the total annual global public climate finance.
Figure 3 | Share of new green finance commitments to total new finance commitments by IDFC members in 2014.8
100%
82%
55%
39%
38%
37%
36%
35%
34%
27%
25%
24%
15%
12%
8% 6%2% 2% 1% 1% 0%
100%
90%
80%
70%
60%
50%
40%
30%
20%
10%
0%Institutions
Figure 4 | Development of green finance commitments for each category.
120
100
80
60
40
20
02011 2012 2013 2014
[USD
bill
ion]
Unattributed green finance
Other environ mental objectives
Green energy and mitigation of GHG as well as adaption to climate change
Adaption to climate change
Green energy and mitigation of GHG
5
11 Note that the number of reporting non-OECD banks increased from 11 in 2013 to 14 in 2014.
3.2 | GREEN FINANCE COMMITMENTS FROM INSTITUTIONS BASED IN OECD AND NON-OECD COUNTRIES
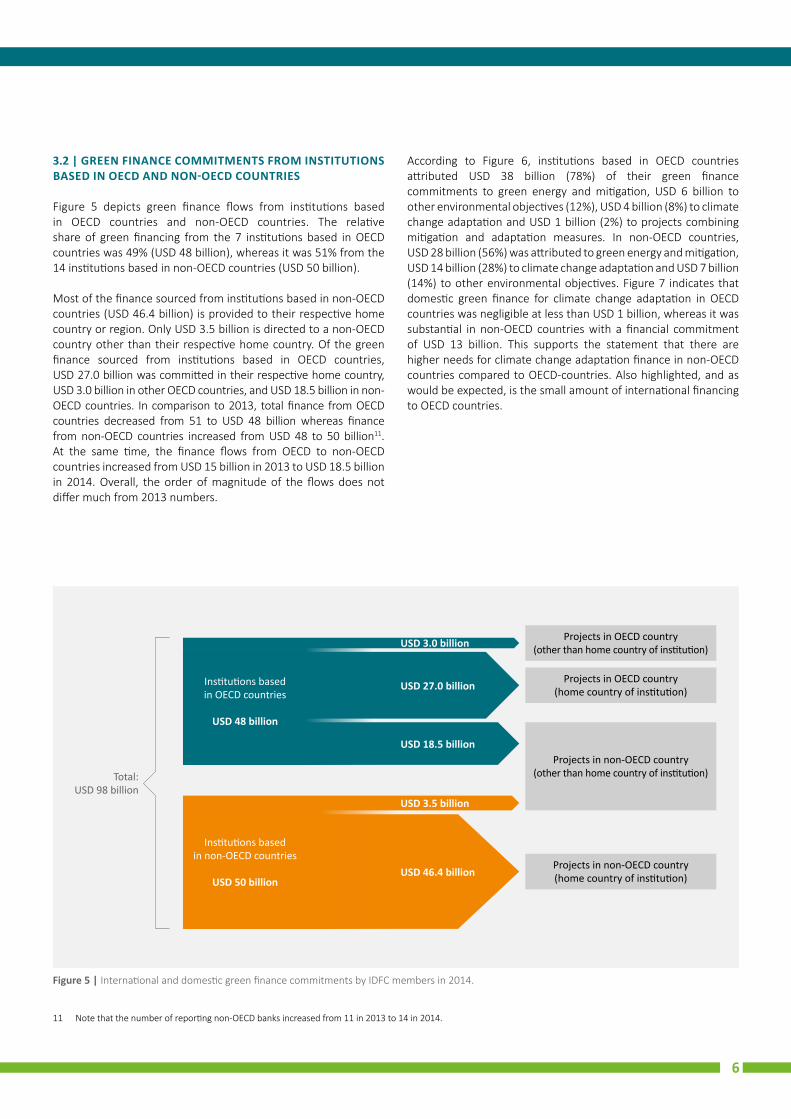
Figure 5 depicts green finance flows from institutions based in OECD countries and non-OECD countries. The relative share of green financing from the 7 institutions based in OECD countries was 49% (USD 48 billion), whereas it was 51% from the 14 institutions based in non-OECD countries (USD 50 billion).
Most of the finance sourced from institutions based in non-OECD countries (USD 46.4 billion) is provided to their respective home country or region. Only USD 3.5 billion is directed to a non-OECD country other than their respective home country. Of the green finance sourced from institutions based in OECD countries, USD 27.0 billion was committed in their respective home country, USD 3.0 billion in other OECD countries, and USD 18.5 billion in non-OECD countries. In comparison to 2013, total finance from OECD countries decreased from 51 to USD 48 billion whereas finance from non-OECD countries increased from USD 48 to 50 billion11. At the same time, the finance flows from OECD to non-OECD countries increased from USD 15 billion in 2013 to USD 18.5 billion in 2014. Overall, the order of magnitude of the flows does not differ much from 2013 numbers.
Figure 5 | International and domestic green finance commitments by IDFC members in 2014.
Projects in OECD country (other than home country of institution)
Projects in OECD country (home country of institution)
Projects in non-OECD country (other than home country of institution)
Projects in non-OECD country (home country of institution)
Total: USD 98 billion
USD 3.0 billion
USD 27.0 billion
USD 18.5 billion
USD 3.5 billion
USD 46.4 billion
Institutions based in OECD countries
USD 48 billion
Institutions based in non-OECD countries
USD 50 billion
According to Figure 6, institutions based in OECD countries attributed USD 38 billion (78%) of their green finance commitments to green energy and mitigation, USD 6 billion to other environmental objectives (12%), USD 4 billion (8%) to climate change adaptation and USD 1 billion (2%) to projects combining mitigation and adaptation measures. In non-OECD countries, USD 28 billion (56%) was attributed to green energy and mitigation, USD 14 billion (28%) to climate change adaptation and USD 7 billion (14%) to other environmental objectives. Figure 7 indicates that domestic green finance for climate change adaptation in OECD countries was negligible at less than USD 1 billion, whereas it was substantial in non-OECD countries with a financial commitment of USD 13 billion. This supports the statement that there are higher needs for climate change adaptation finance in non-OECD countries compared to OECD-countries. Also highlighted, and as would be expected, is the small amount of international financing to OECD countries.
6
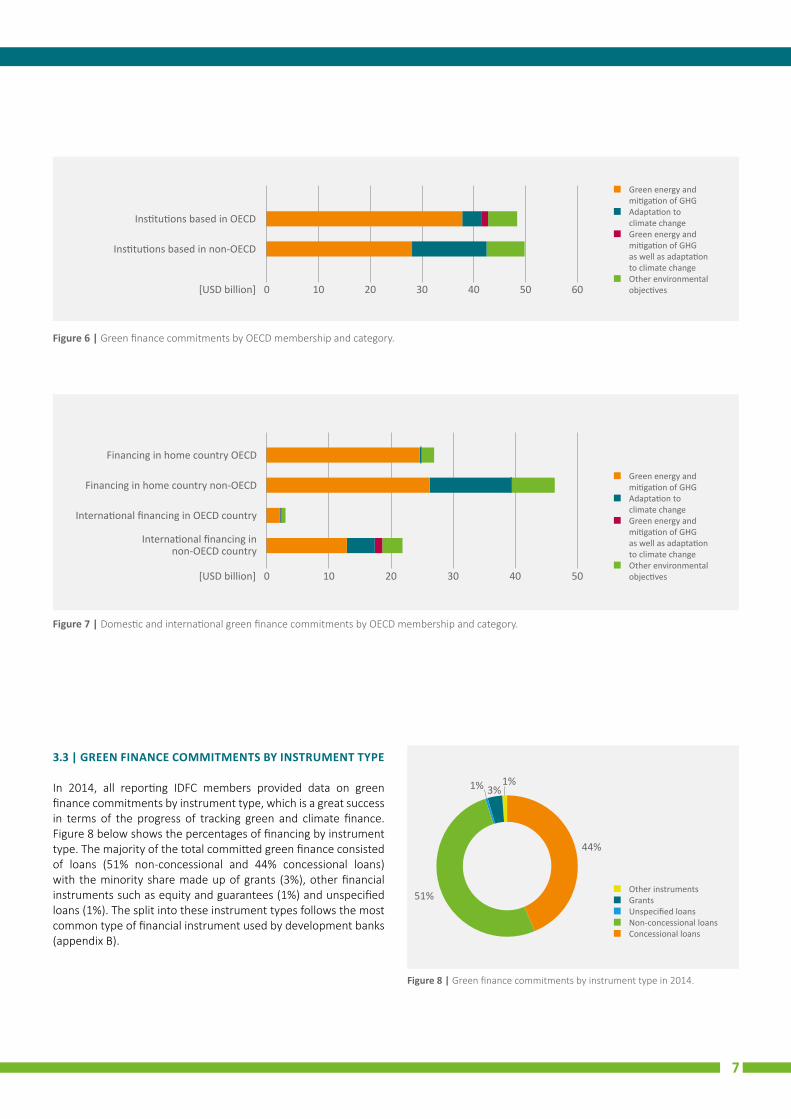
Figure 7 | Domestic and international green finance commitments by OECD membership and category.
Green energy and mitigation of GHG
Adaptation to climate change
Green energy and mitigation of GHG as well as adaptation to climate change
Other environmental objectives
Financing in home country OECD
Financing in home country non-OECD
International financing in non-OECD country
International financing in OECD country
0 10 20 30 40 50[USD billion]
Figure 6 | Green finance commitments by OECD membership and category.
Green energy and mitigation of GHG
Adaptation to climate change
Green energy and mitigation of GHG as well as adaptation to climate change
Other environmental objectives0 10 20 30 40 50 60[USD billion]
Institutions based in OECD
Institutions based in non-OECD
3.3 | GREEN FINANCE COMMITMENTS BY INSTRUMENT TYPE
In 2014, all reporting IDFC members provided data on green finance commitments by instrument type, which is a great success in terms of the progress of tracking green and climate finance. Figure 8 below shows the percentages of financing by instrument type. The majority of the total committed green finance consisted of loans (51% non-concessional and 44% concessional loans) with the minority share made up of grants (3%), other financial instruments such as equity and guarantees (1%) and unspecified loans (1%). The split into these instrument types follows the most common type of financial instrument used by development banks (appendix B).
Figure 8 | Green finance commitments by instrument type in 2014.
Other instruments Grants Unspecified loans Non-concessional loans Concessional loans
44%
51%
1%1% 3%
7
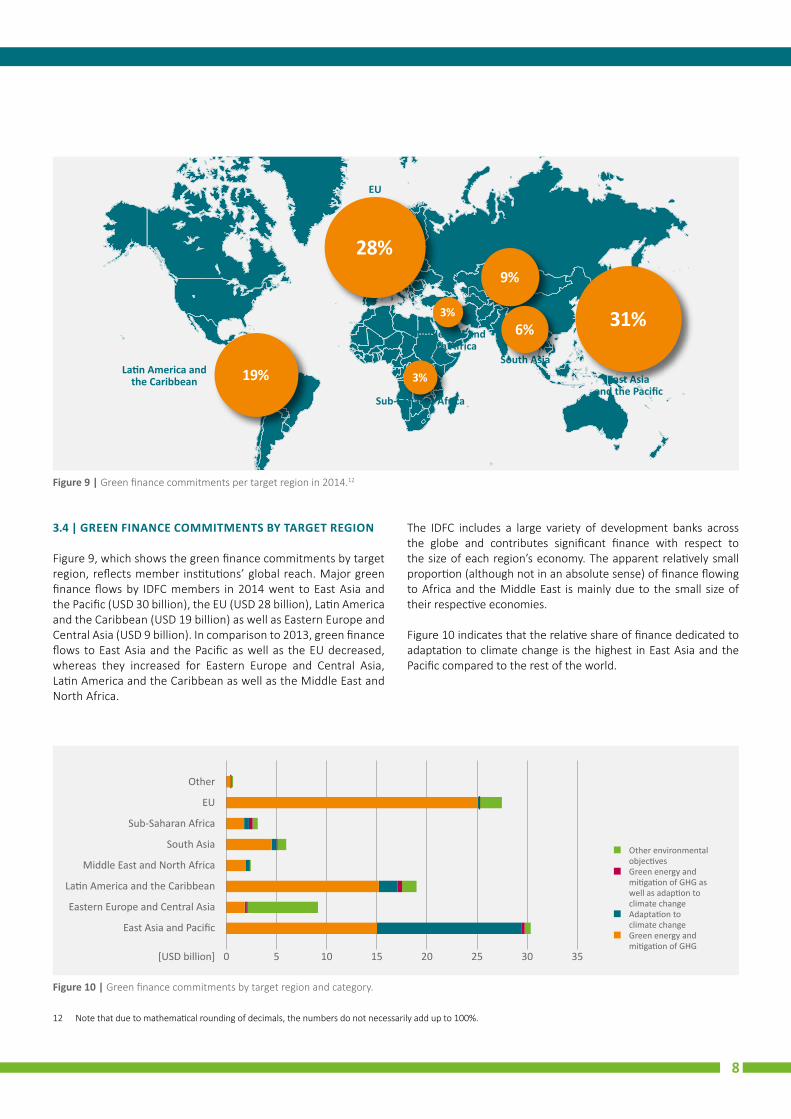
3.4 | GREEN FINANCE COMMITMENTS BY TARGET REGION
Figure 9, which shows the green finance commitments by target region, reflects member institutions’ global reach. Major green finance flows by IDFC members in 2014 went to East Asia and the Pacific (USD 30 billion), the EU (USD 28 billion), Latin America and the Caribbean (USD 19 billion) as well as Eastern Europe and Central Asia (USD 9 billion). In comparison to 2013, green finance flows to East Asia and the Pacific as well as the EU decreased, whereas they increased for Eastern Europe and Central Asia, Latin America and the Caribbean as well as the Middle East and North Africa.
East Asia and the Pacific
Sub-Saharan Africa
South Asia
Middle East and North Africa
Eastern Europe and Central Asia
EU
Latin America and the Caribbean
37%
32%
Figure 9 | Green finance commitments per target region in 2014.12
31%
9%
19%
6%
28%
3%
3%
12 Note that due to mathematical rounding of decimals, the numbers do not necessarily add up to 100%.
The IDFC includes a large variety of development banks across the globe and contributes significant finance with respect to the size of each region’s economy. The apparent relatively small proportion (although not in an absolute sense) of finance flowing to Africa and the Middle East is mainly due to the small size of their respective economies.
Figure 10 indicates that the relative share of finance dedicated to adaptation to climate change is the highest in East Asia and the Pacific compared to the rest of the world.
Figure 10 | Green finance commitments by target region and category.
Other environmental objectives
Green energy and mitigation of GHG as well as adaption to climate change
Adaptation to climate change
Green energy and mitigation of GHG
Other
EU
Sub-Saharan Africa
South Asia
Middle East and North Africa
Latin America and the Caribbean
Eastern Europe and Central Asia
East Asia and Pacific
[USD billion] 0 5 10 15 20 25 30 35
8
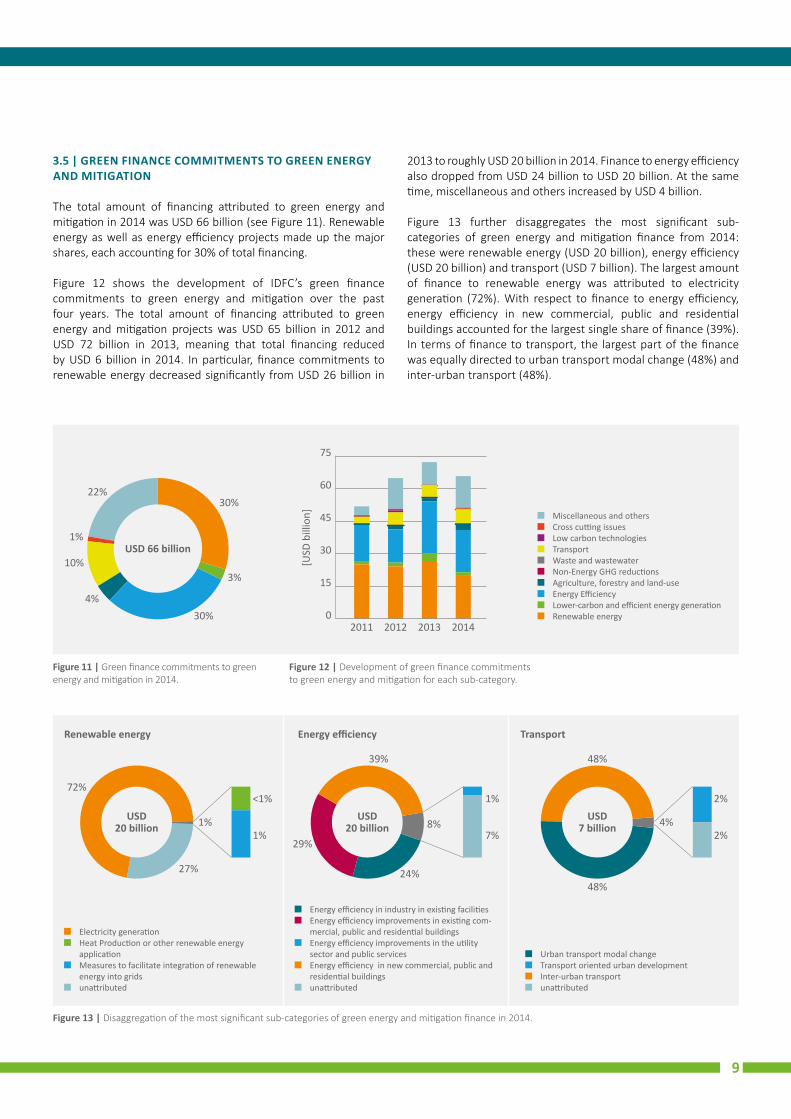
3.5 | GREEN FINANCE COMMITMENTS TO GREEN ENERGY AND MITIGATION
The total amount of financing attributed to green energy and mitigation in 2014 was USD 66 billion (see Figure 11). Renewable energy as well as energy efficiency projects made up the major shares, each accounting for 30% of total financing.
Figure 12 shows the development of IDFC’s green finance commitments to green energy and mitigation over the past four years. The total amount of financing attributed to green energy and mitigation projects was USD 65 billion in 2012 and USD 72 billion in 2013, meaning that total financing reduced by USD 6 billion in 2014. In particular, finance commitments to renewable energy decreased significantly from USD 26 billion in
Electricity generation Heat Production or other renewable energy
application Measures to facilitate integration of renewable
energy into grids unattributed
Energy efficiency in industry in existing facilities Energy efficiency improvements in existing com
mercial, public and residential buildings Energy efficiency improvements in the utility
sector and public services Energy efficiency in new commercial, public and
residential buildings unattributed
Urban transport modal change Transport oriented urban development Inter-urban transport unattributed
Renewable energy Energy efficiency Transport
USD 20 billion
USD 20 billion
USD 7 billion
72%
1% 4%8%
27%
<1% 2%1%
1% 2%7%
39% 48%
24%48%
29%
Figure 13 | Disaggregation of the most significant sub-categories of green energy and mitigation finance in 2014.
Figure 11 | Green finance commitments to green energy and mitigation in 2014.
Figure 12 | Development of green finance commitments to green energy and mitigation for each sub-category.
2013 to roughly USD 20 billion in 2014. Finance to energy efficiency also dropped from USD 24 billion to USD 20 billion. At the same time, miscellaneous and others increased by USD 4 billion.
Figure 13 further disaggregates the most significant sub-categories of green energy and mitigation finance from 2014: these were renewable energy (USD 20 billion), energy efficiency (USD 20 billion) and transport (USD 7 billion). The largest amount of finance to renewable energy was attributed to electricity generation (72%). With respect to finance to energy efficiency, energy efficiency in new commercial, public and residential buildings accounted for the largest single share of finance (39%). In terms of finance to transport, the largest part of the finance was equally directed to urban transport modal change (48%) and inter-urban transport (48%).
[USD
bill
ion]
75
60
45
30
15
02011 20132012 2014
30%
30%4%
10%
1%
22%
USD 66 billion
3%
Miscellaneous and others Cross cutting issues Low carbon technologies Transport Waste and wastewater Non-Energy GHG reductions Agriculture, forestry and land-use Energy Efficiency Lower-carbon and efficient energy generation Renewable energy
9
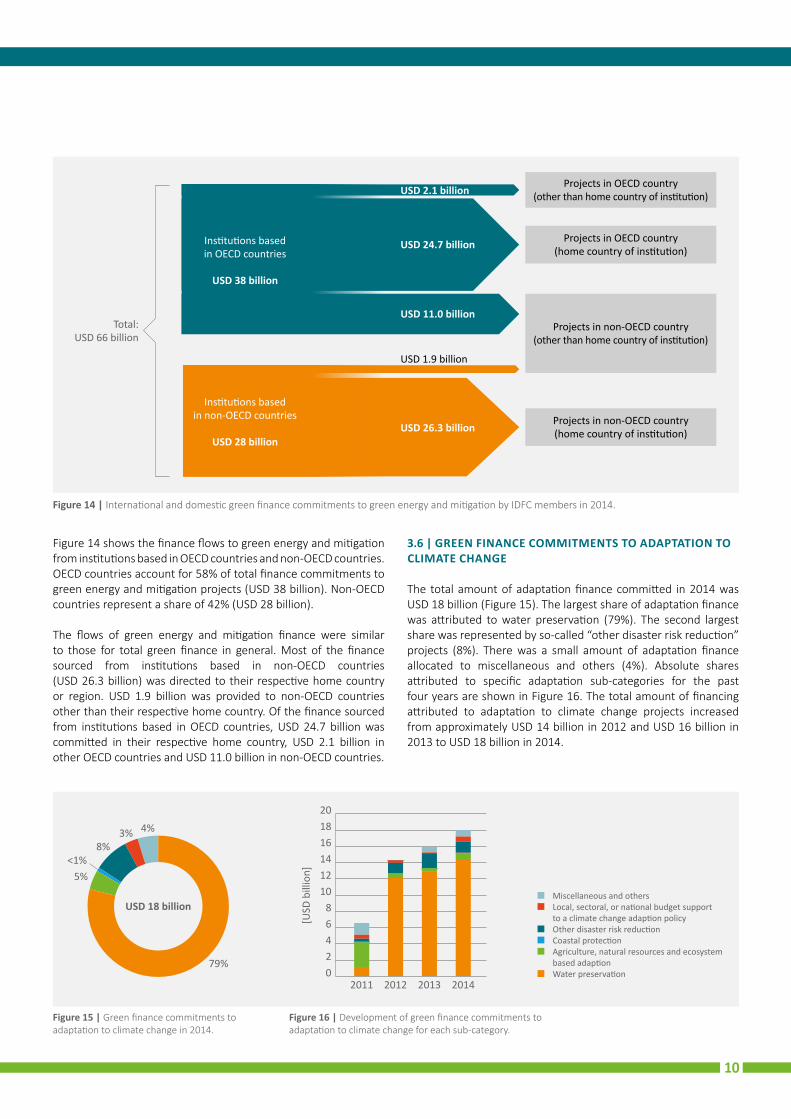
Figure 14 | International and domestic green finance commitments to green energy and mitigation by IDFC members in 2014.
Projects in OECD country (other than home country of institution)
Projects in OECD country (home country of institution)
Projects in non-OECD country (other than home country of institution)
Projects in non-OECD country (home country of institution)
Total: USD 66 billion
USD 24.7 billion
USD 11.0 billion
USD 1.9 billion
USD 2.1 billion
USD 26.3 billion
Institutions based in OECD countries
USD 38 billion
Institutions based in non-OECD countries
USD 28 billion
Figure 14 shows the finance flows to green energy and mitigation from institutions based in OECD countries and non-OECD countries. OECD countries account for 58% of total finance commitments to green energy and mitigation projects (USD 38 billion). Non-OECD countries represent a share of 42% (USD 28 billion).
The flows of green energy and mitigation finance were similar to those for total green finance in general. Most of the finance sourced from institutions based in non-OECD countries (USD 26.3 billion) was directed to their respective home country or region. USD 1.9 billion was provided to non-OECD countries other than their respective home country. Of the finance sourced from institutions based in OECD countries, USD 24.7 billion was committed in their respective home country, USD 2.1 billion in other OECD countries and USD 11.0 billion in non-OECD countries.
3.6 | GREEN FINANCE COMMITMENTS TO ADAPTATION TO CLIMATE CHANGE
The total amount of adaptation finance committed in 2014 was USD 18 billion (Figure 15). The largest share of adaptation finance was attributed to water preservation (79%). The second largest share was represented by so-called “other disaster risk reduction” projects (8%). There was a small amount of adaptation finance allocated to miscellaneous and others (4%). Absolute shares attributed to specific adaptation sub-categories for the past four years are shown in Figure 16. The total amount of financing attributed to adaptation to climate change projects increased from approximately USD 14 billion in 2012 and USD 16 billion in 2013 to USD 18 billion in 2014.
Figure 15 | Green finance commitments to adaptation to climate change in 2014.
Figure 16 | Development of green finance commitments to adaptation to climate change for each sub-category.
79%
5%
8%3%
USD 18 billion
4%
<1%
2011 20132012 2014
[USD
bill
ion]
201816141210
86420
Miscellaneous and others Local, sectoral, or national budget support
to a climate change adaption policy Other disaster risk reduction Coastal protection Agriculture, natural resources and ecosystem
based adaption Water preservation
10
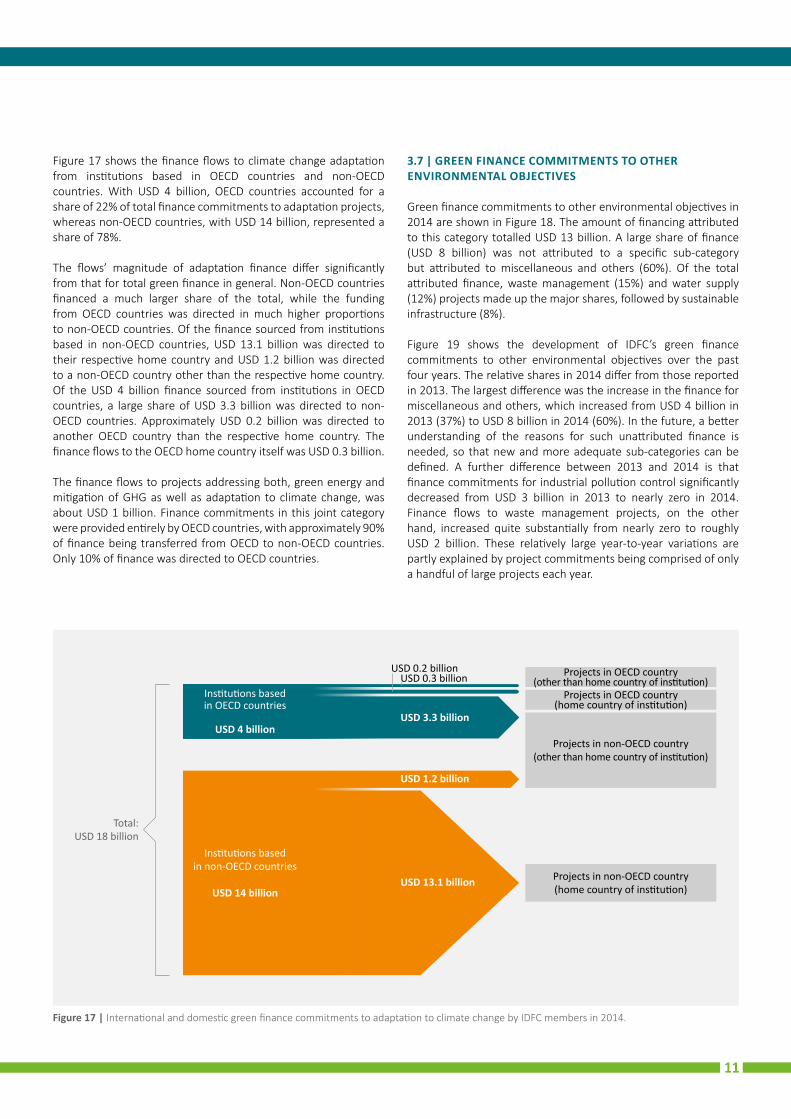
Figure 17 shows the finance flows to climate change adaptation from institutions based in OECD countries and non-OECD countries. With USD 4 billion, OECD countries accounted for a share of 22% of total finance commitments to adaptation projects, whereas non-OECD countries, with USD 14 billion, represented a share of 78%.
The flows’ magnitude of adaptation finance differ significantly from that for total green finance in general. Non-OECD countries financed a much larger share of the total, while the funding from OECD countries was directed in much higher proportions to non-OECD countries. Of the finance sourced from institutions based in non-OECD countries, USD 13.1 billion was directed to their respective home country and USD 1.2 billion was directed to a non-OECD country other than the respective home country. Of the USD 4 billion finance sourced from institutions in OECD countries, a large share of USD 3.3 billion was directed to non-OECD countries. Approximately USD 0.2 billion was directed to another OECD country than the respective home country. The finance flows to the OECD home country itself was USD 0.3 billion.
The finance flows to projects addressing both, green energy and mitigation of GHG as well as adaptation to climate change, was about USD 1 billion. Finance commitments in this joint category were provided entirely by OECD countries, with approximately 90% of finance being transferred from OECD to non-OECD countries. Only 10% of finance was directed to OECD countries.
3.7 | GREEN FINANCE COMMITMENTS TO OTHER ENVIRONMENTAL OBJECTIVES
Green finance commitments to other environmental objectives in 2014 are shown in Figure 18. The amount of financing attributed to this category totalled USD 13 billion. A large share of finance (USD 8 billion) was not attributed to a specific sub-category but attributed to miscellaneous and others (60%). Of the total attributed finance, waste management (15%) and water supply (12%) projects made up the major shares, followed by sustainable infrastructure (8%).
Figure 19 shows the development of IDFC’s green finance commitments to other environmental objectives over the past four years. The relative shares in 2014 differ from those reported in 2013. The largest difference was the increase in the finance for miscellaneous and others, which increased from USD 4 billion in 2013 (37%) to USD 8 billion in 2014 (60%). In the future, a better understanding of the reasons for such unattributed finance is needed, so that new and more adequate sub-categories can be defined. A further difference between 2013 and 2014 is that finance commitments for industrial pollution control significantly decreased from USD 3 billion in 2013 to nearly zero in 2014. Finance flows to waste management projects, on the other hand, increased quite substantially from nearly zero to roughly USD 2 billion. These relatively large year-to-year variations are partly explained by project commitments being comprised of only a handful of large projects each year.
Figure 17 | International and domestic green finance commitments to adaptation to climate change by IDFC members in 2014.
Projects in OECD country (other than home country of institution)
Projects in OECD country (home country of institution)
Projects in non-OECD country (other than home country of institution)
Projects in non-OECD country (home country of institution)
Total: USD 18 billion
USD 13.1 billion
Institutions based in non-OECD countries
USD 14 billion
USD 3.3 billion
USD 1.2 billion
Institutions based in OECD countries
USD 4 billion
USD 0.3 billionUSD 0.2 billion
11
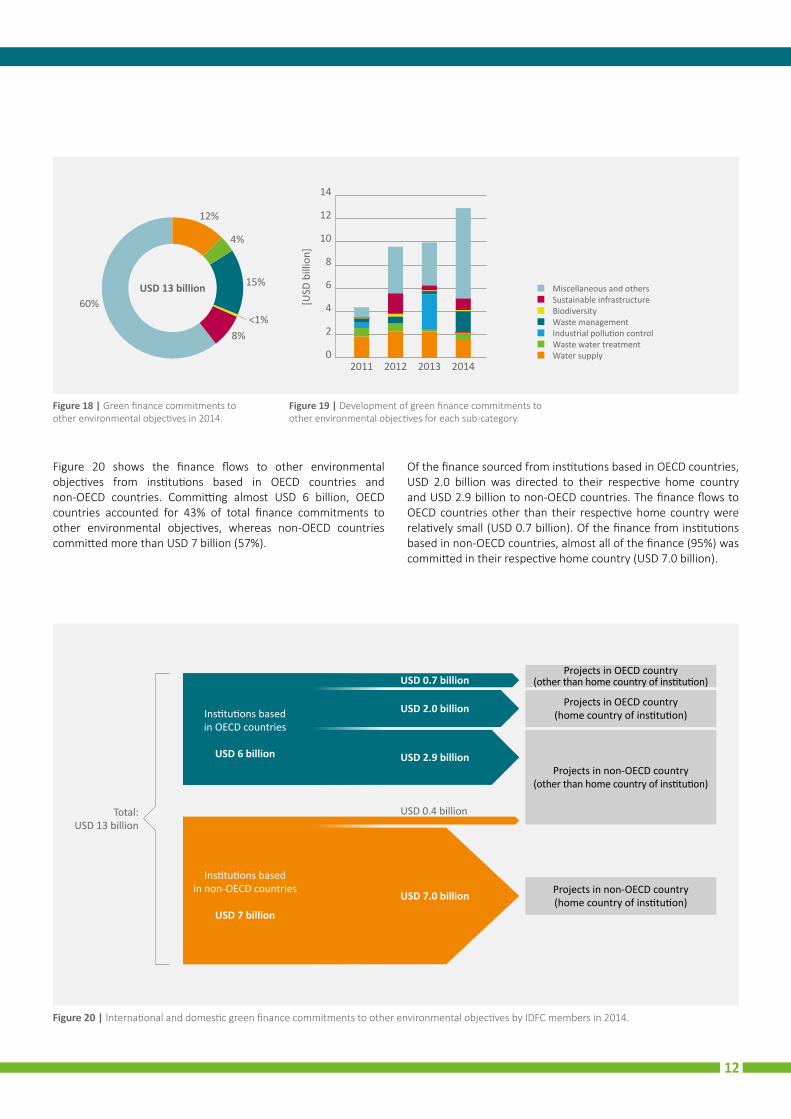
Figure 20 shows the finance flows to other environmental objectives from institutions based in OECD countries and non-OECD countries. Committing almost USD 6 billion, OECD countries accounted for 43% of total finance commitments to other environmental objectives, whereas non-OECD countries committed more than USD 7 billion (57%).
Of the finance sourced from institutions based in OECD countries, USD 2.0 billion was directed to their respective home country and USD 2.9 billion to non-OECD countries. The finance flows to OECD countries other than their respective home country were relatively small (USD 0.7 billion). Of the finance from institutions based in non-OECD countries, almost all of the finance (95%) was committed in their respective home country (USD 7.0 billion).
Figure 18 | Green finance commitments to other environmental objectives in 2014.
Figure 19 | Development of green finance commitments to other environmental objectives for each sub-category.
Figure 20 | International and domestic green finance commitments to other environmental objectives by IDFC members in 2014.
Projects in OECD country (home country of institution)
Projects in non-OECD country (other than home country of institution)
Projects in non-OECD country (home country of institution)
Total: USD 13 billion
USD 2.9 billion
USD 7.0 billion
USD 0.4 billion
Institutions based in non-OECD countries
USD 7 billion
USD 0.7 billion
USD 2.0 billionInstitutions based in OECD countries
USD 6 billion
Projects in OECD country (other than home country of institution)
12%
8%
15%USD 13 billion60%
4%
<1%
2011 2012 2013 2014
[USD
bill
ion]
14
12
10
8
6
4
2
0
Miscellaneous and others Sustainable infrastructure Biodiversity Waste management Industrial pollution control Waste water treatment Water supply
12
4 | CONCLUSIONS AND RECOMMENDATIONS
4.1 | CONCLUSIONS
Volumes of green and climate finance
IDFC committed USD 98 billion of new green finance in 2014.Following years of continuous increase since the initial IDFC Green Finance Mapping exercise in 2011, green finance commitments in 2014 were similar to those in 2013. From 2011 to 2014, total green finance commitments showed an increase of nearly USD 10 billion, corresponding to a total rise of more than 10%.
Total climate finance commitments reached USD 85 billion in 2014. IDFC members made total new commitments of USD 85 billion in climate finance during 2014. The share of the total new climate finance commitments for green energy and mitigation was USD 66 billion, whereas it was USD 18 billion for adaptation to climate change. The amount of finance committed to projects with both adaptation and mitigation objectives was USD 1 billion.
IDFC significantly contributed to the total annual global public climate finance in 2014.The total annual global climate finance in 2014, as reported by the CPI Global Landscape of Climate Finance 2015, was approximately USD 391 billion. Of the total, USD 148 billion was contributed by the public sector. Even though not directly comparable, IDFC’s climate finance in 2014, totalling USD 85 billion, seemed to have accounted for a significant share (>55%) of the total annual global public climate finance in 2014.
Total green finance commitments by IDFC members stabilized at a high level with increased finance being attributed to climate change adaptation in 2014. Although it is difficult to directly compare the finance commitments year-by-year due to variation in the number and composition of participating banks13 as well as methodology improvements to allow for more transparent and robust attribution of data, all categories of green finance, except for green finance commitments to green energy and mitigation continued to rise in 2014. As the decrease of finance to green energy and mitigation slightly outweighed the combined increase of the other categories, there was a decrease in total green finance commitments by USD 0.5 billion in comparison to 2013. At the same time, there was a significant scaling-up of finance to climate change adaptation from USD 15 billion to USD 18 billion, indicating the emphasis that the IDFC is placing on addressing adaptation to climate change.
Flows of green and climate finance
Green finance flows from institutions based in OECD and non-OECD countries remained at a similar level, with finance flows from OECD to non-OECD increasing in 2014. The share of green finance from the 7 institutions based in OECD countries and the 14 institutions based in non-OECD countries was 49% (approximately USD 48 billion) and 51% (approximately USD 50 billion) respectively. Non-OECD countries committed the large majority (92%) of their green finance to their respective home country or region. Although institutions based in OECD countries also committed a large share of green finance (56%) in their respective home country, a significant share of 38% was directed to non-OECD countries, up from 30% in 2013.
Financing for climate change adaptation was mainly provided by institutions based in non-OECD countries. With a total amount of USD 4 billion committed to adaptation projects, the 7 development banks in the OECD countries accounted for 22% of total finance commitments to adaptation projects, whereas the 14 banks in non-OECD countries accounted for USD 14 billion of adaptation finance (78%).
Methodological outcomes
High participation in the green finance mapping and no unattributed green finance commitments.IDFC has increased member participation in the green finance mapping exercise from 16 in 2011 (out of 19 IDFC members), 18 in 2012 (out of 19 IDFC members) and 2013 (out of 20 IDFC members) to 21 in 2014 (out of 23 IDFC members). The quality of reporting remained high with no unattributed green commitments.
Better characterisation and further disaggregation of the data reported by IDFC members.IDFC is continuing to work hard to achieve full implementation of a standardised tracking and reporting format. While the focus in 2012 and 2013 was on increasing the quality of data provided by IDFC members, this year the emphasis was to apply the MDBs-IDFC Common Principles for Climate Mitigation Finance Tracking and to further characterise and disaggregate the data provided. More detail was provided on climate finance flows, finance flows by instrument type and, based on the MDBs-IDFC Common Principles, finance to green energy and mitigation.
13 In 2013, 18 institutions reported data whereas in 2014 21 participated. Of the 21 institutions, four did not report over the years 2012, 2013 and 2014. Comparing the green finance flows of the 17 institutions, which reported in 2012, 2013 and 2014, one can see that green finance remained at a similar level over the last years, at USD 94 billion in 2012, USD 98 billion in 2013 and USD 96 billion in 2014.
13
More detail on green energy and mitigation of greenhouse gases.Green energy and mitigation projects in 2014 were further specified by disaggregating the sub-categories in place (i.e. renewable energy, energy efficiency etc.), thereby including additional dimensions of climate finance.14 This disaggregation supports the alignment with the MDBs-IDFC Common Principles and helps IDFC to become more transparent in their financial reporting and in better understanding their global green finance scope.
4.2 | RECOMMENDATIONS
Consider further improvements to the IDFC climate finance methodology to include additional and more disaggregated dimensions of climate finance.We recommend the following refinements for IDFC’s future mapping exercises:• Further specify and disaggregate the currently used sub-
categories on adaptation and other environmental objectives in collaboration with the MDBs.
• Encourage all IDFC members to provide input and feedback on the disaggregation of green and climate finance activities to ensure that members can provide data for each activity.
• Refine the definition of other environmental objectives, so that the sub-category on miscellaneous and others, which represented the largest share in 2014 (60%), can be better understood.
• Collect data on the regional green finance commitments by finance instrument type to illustrate what instrument types (i.e. grants, loans and other instruments) are adopted in each of the different world regions.
• Consider developing a methodology for tracking sub-national/regional/cities finance, building on work that Agence Française de Développement (AFD) has done in this area, and working in collaboration with the Cities Climate Finance Leadership Alliance and the MDBs15.
How IDFC can expand its climate finance tracking methodology.Green finance tracking initiatives are an essential step towards an improved understanding of the flows of climate finance, both with respect to volumes and strategic directions. We therefore recommend to expand the current assessment of climate finance to also track private finance mobilisation by IDFC’s green finance commitments. The IDFC could collaborate with initiatives such as the OECD’s Research Collaborative on Tracking Private Climate Finance16. Through such extensive and holistic climate finance tracking, the IDFC would be able to measure its entire global contributions to climate change mitigation and adaptation and thereby improve the management of its climate finance impact. Taking responsibility in the field of private climate finance tracking would also enhance IDFC’s pioneer role in climate finance tracking.
Further alignment of climate finance tracking initiatives on climate adaptation.In 2015, the MDBs and IDFC jointly developed and agreed upon Common Principles for Climate Mitigation Finance Tracking, setting out common definitions and guidelines, including a list of activities for tracking mitigation finance. For adaptation, there is still work to do in aligning the methodology of MDBs and IDFC, and to jointly agree upon clear definitions and guidelines, as is the case for climate mitigation. For the IDFC Green Finance Mapping 2015, it is desirable to adopt the MDBs-IDFC Common Principles for Climate Adaptation Finance Tracking to further improve the alignment of global climate finance tracking methodologies.
14 Renewable energy, for example, is further classified into (1) electricity production, (2) heat production and (3) measures facilitating grid integration.15 http://www.un.org/climatechange/summit/wp-content/uploads/sites/2/2014/09/CITIES-Cities-Climate-Finance-Leadership-Alliance.pdf.16 http://www.oecd.org/env/researchcollaborative/.
14
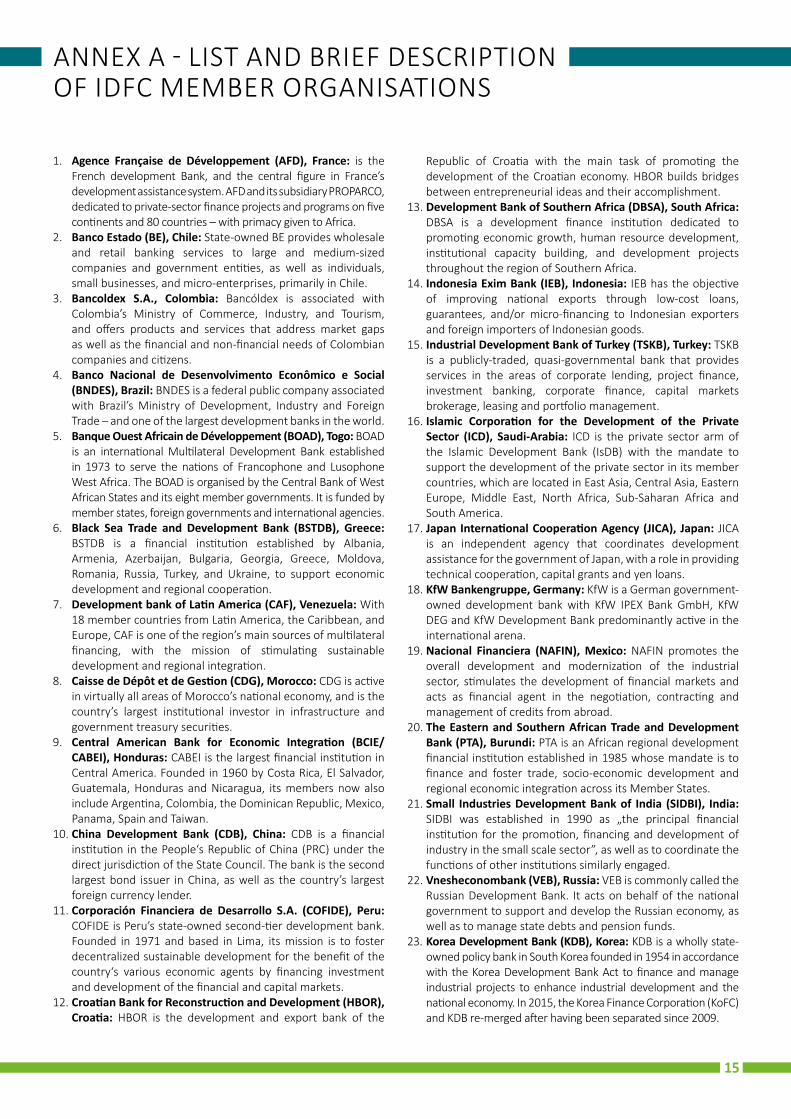
ANNEX A - LIST AND BRIEF DESCRIPTION OF IDFC MEMBER ORGANISATIONS
1. Agence Française de Développement (AFD), France: is the French development Bank, and the central figure in France’s development assistance system. AFD and its subsidiary PROPARCO, dedicated to private-sector finance projects and programs on five continents and 80 countries – with primacy given to Africa.
2. Banco Estado (BE), Chile: State-owned BE provides wholesale and retail banking services to large and medium-sized companies and government entities, as well as individuals, small businesses, and micro-enterprises, primarily in Chile.
3. Bancoldex S.A., Colombia: Bancóldex is associated with Colombia’s Ministry of Commerce, Industry, and Tourism, and offers products and services that address market gaps as well as the financial and non-financial needs of Colombian companies and citizens.
4. Banco Nacional de Desenvolvimento Econômico e Social (BNDES), Brazil: BNDES is a federal public company associated with Brazil’s Ministry of Development, Industry and Foreign Trade – and one of the largest development banks in the world.
5. Banque Ouest Africain de Développement (BOAD), Togo: BOAD is an international Multilateral Development Bank established in 1973 to serve the nations of Francophone and Lusophone West Africa. The BOAD is organised by the Central Bank of West African States and its eight member governments. It is funded by member states, foreign governments and international agencies.
6. Black Sea Trade and Development Bank (BSTDB), Greece: BSTDB is a financial institution established by Albania, Armenia, Azerbaijan, Bulgaria, Georgia, Greece, Moldova, Romania, Russia, Turkey, and Ukraine, to support economic development and regional cooperation.
7. Development bank of Latin America (CAF), Venezuela: With 18 member countries from Latin America, the Caribbean, and Europe, CAF is one of the region’s main sources of multilateral financing, with the mission of stimulating sustainable development and regional integration.
8. Caisse de Dépôt et de Gestion (CDG), Morocco: CDG is active in virtually all areas of Morocco’s national economy, and is the country’s largest institutional investor in infrastructure and government treasury securities.
9. Central American Bank for Economic Integration (BCIE/CABEI), Honduras: CABEI is the largest financial institution in Central America. Founded in 1960 by Costa Rica, El Salvador, Guatemala, Honduras and Nicaragua, its members now also include Argentina, Colombia, the Dominican Republic, Mexico, Panama, Spain and Taiwan.
10. China Development Bank (CDB), China: CDB is a financial institution in the People‘s Republic of China (PRC) under the direct jurisdiction of the State Council. The bank is the second largest bond issuer in China, as well as the country’s largest foreign currency lender.
11. Corporación Financiera de Desarrollo S.A. (COFIDE), Peru: COFIDE is Peru’s state-owned second-tier development bank. Founded in 1971 and based in Lima, its mission is to foster decentralized sustainable development for the benefit of the country‘s various economic agents by financing investment and development of the financial and capital markets.
12. Croatian Bank for Reconstruction and Development (HBOR), Croatia: HBOR is the development and export bank of the
Republic of Croatia with the main task of promoting the development of the Croatian economy. HBOR builds bridges between entrepreneurial ideas and their accomplishment.
13. Development Bank of Southern Africa (DBSA), South Africa: DBSA is a development finance institution dedicated to promoting economic growth, human resource development, institutional capacity building, and development projects throughout the region of Southern Africa.
14. Indonesia Exim Bank (IEB), Indonesia: IEB has the objective of improving national exports through low-cost loans, guarantees, and/or micro-financing to Indonesian exporters and foreign importers of Indonesian goods.
15. Industrial Development Bank of Turkey (TSKB), Turkey: TSKB is a publicly-traded, quasi-governmental bank that provides services in the areas of corporate lending, project finance, investment banking, corporate finance, capital markets brokerage, leasing and portfolio management.
16. Islamic Corporation for the Development of the Private Sector (ICD), Saudi-Arabia: ICD is the private sector arm of the Islamic Development Bank (IsDB) with the mandate to support the development of the private sector in its member countries, which are located in East Asia, Central Asia, Eastern Europe, Middle East, North Africa, Sub-Saharan Africa and South America.
17. Japan International Cooperation Agency (JICA), Japan: JICA is an independent agency that coordinates development assistance for the government of Japan, with a role in providing technical cooperation, capital grants and yen loans.
18. KfW Bankengruppe, Germany: KfW is a German government-owned development bank with KfW IPEX Bank GmbH, KfW DEG and KfW Development Bank predominantly active in the international arena.
19. Nacional Financiera (NAFIN), Mexico: NAFIN promotes the overall development and modernization of the industrial sector, stimulates the development of financial markets and acts as financial agent in the negotiation, contracting and management of credits from abroad.
20. The Eastern and Southern African Trade and Development Bank (PTA), Burundi: PTA is an African regional development financial institution established in 1985 whose mandate is to finance and foster trade, socio-economic development and regional economic integration across its Member States.
21. Small Industries Development Bank of India (SIDBI), India: SIDBI was established in 1990 as „the principal financial institution for the promotion, financing and development of industry in the small scale sector”, as well as to coordinate the functions of other institutions similarly engaged.
22. Vnesheconombank (VEB), Russia: VEB is commonly called the Russian Development Bank. It acts on behalf of the national government to support and develop the Russian economy, as well as to manage state debts and pension funds.
23. Korea Development Bank (KDB), Korea: KDB is a wholly state-owned policy bank in South Korea founded in 1954 in accordance with the Korea Development Bank Act to finance and manage industrial projects to enhance industrial development and the national economy. In 2015, the Korea Finance Corporation (KoFC) and KDB re-merged after having been separated since 2009.
15
ANNEX B – METHODOLOGY GUIDANCE
DEFINITIONS AND TERMINOLOGY
→ see also IDFC website: https://www.idfc.org/Press-And-Publications/press.aspx
As there are still no internationally-agreed definitions for green and climate finance17, this methodology provides working definitions for both terminologies. Green finance is a broad term that can refer to financial investments flowing into sustainable development projects and initiatives, environmental products, and policies that encourage the development of a more sustainable economy. Green finance includes climate finance, but is not limited to it. It also refers to a wider range of other environmental objectives; for example industrial pollution control, water sanitation and biodiversity protection. Mitigation and adaptation finance is specifically related to climate change-related activities: mitigation financial flows refer to investments in projects and programs that contribute to reducing or avoiding GHG emissions, whereas adaptation financial flows refer to investments that contribute to reducing the vulnerability of goods and persons to the effects of climate change. Thus for the purposes of the mapping exercise, green finance is split into three separate categories/themes.
• Green energy and mitigation of GHG• Adaptation to climate change impacts• Other environmental objectives
In order to provide accurate and comparable data for this mapping exercise, a consistent categorisation of mitigation and adaptation activities was agreed by IDFC members with the support of ECOFYS and WRI, taking the outcomes of the MDBs-IDFC Common Principles for Climate Finance Tracking into consideration. The mapping exercise adopted a two-step approach based on:
17 The jointly developed MDBs-IDFC Common Principles to Climate Finance Tracking are a first step to an internationally-agreed definition. However, further research, specifications and alignments are necessary.
18 Less than 1.2% of total green finance commitments for 2014.
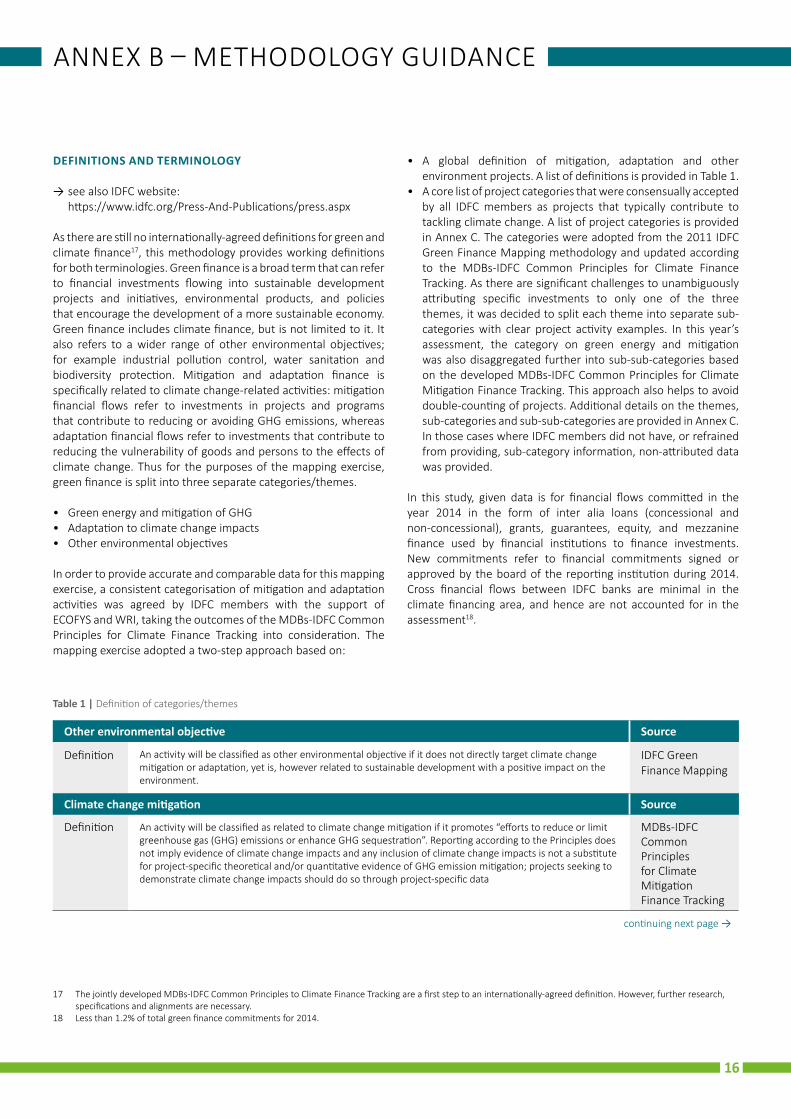
• A global definition of mitigation, adaptation and other environment projects. A list of definitions is provided in Table 1.
• A core list of project categories that were consensually accepted by all IDFC members as projects that typically contribute to tackling climate change. A list of project categories is provided in Annex C. The categories were adopted from the 2011 IDFC Green Finance Mapping methodology and updated according to the MDBs-IDFC Common Principles for Climate Finance Tracking. As there are significant challenges to unambiguously attributing specific investments to only one of the three themes, it was decided to split each theme into separate sub-categories with clear project activity examples. In this year’s assessment, the category on green energy and mitigation was also disaggregated further into sub-sub-categories based on the developed MDBs-IDFC Common Principles for Climate Mitigation Finance Tracking. This approach also helps to avoid double-counting of projects. Additional details on the themes, sub-categories and sub-sub-categories are provided in Annex C. In those cases where IDFC members did not have, or refrained from providing, sub-category information, non-attributed data was provided.
In this study, given data is for financial flows committed in the year 2014 in the form of inter alia loans (concessional and non-concessional), grants, guarantees, equity, and mezzanine finance used by financial institutions to finance investments. New commitments refer to financial commitments signed or approved by the board of the reporting institution during 2014. Cross financial flows between IDFC banks are minimal in the climate financing area, and hence are not accounted for in the assessment18.
Table 1 | Definition of categories/themes
Other environmental objective Source
Definition An activity will be classified as other environmental objective if it does not directly target climate change mitigation or adaptation, yet is, however related to sustainable development with a positive impact on the environment.
IDFC Green Finance Mapping
Climate change mitigation Source
Definition An activity will be classified as related to climate change mitigation if it promotes “efforts to reduce or limit greenhouse gas (GHG) emissions or enhance GHG sequestration”. Reporting according to the Principles does not imply evidence of climate change impacts and any inclusion of climate change impacts is not a substitute for project-specific theoretical and/or quantitative evidence of GHG emission mitigation; projects seeking to demonstrate climate change impacts should do so through project-specific data
MDBs-IDFC Common Principles for Climate Mitigation Finance Tracking
continuing next page →
16
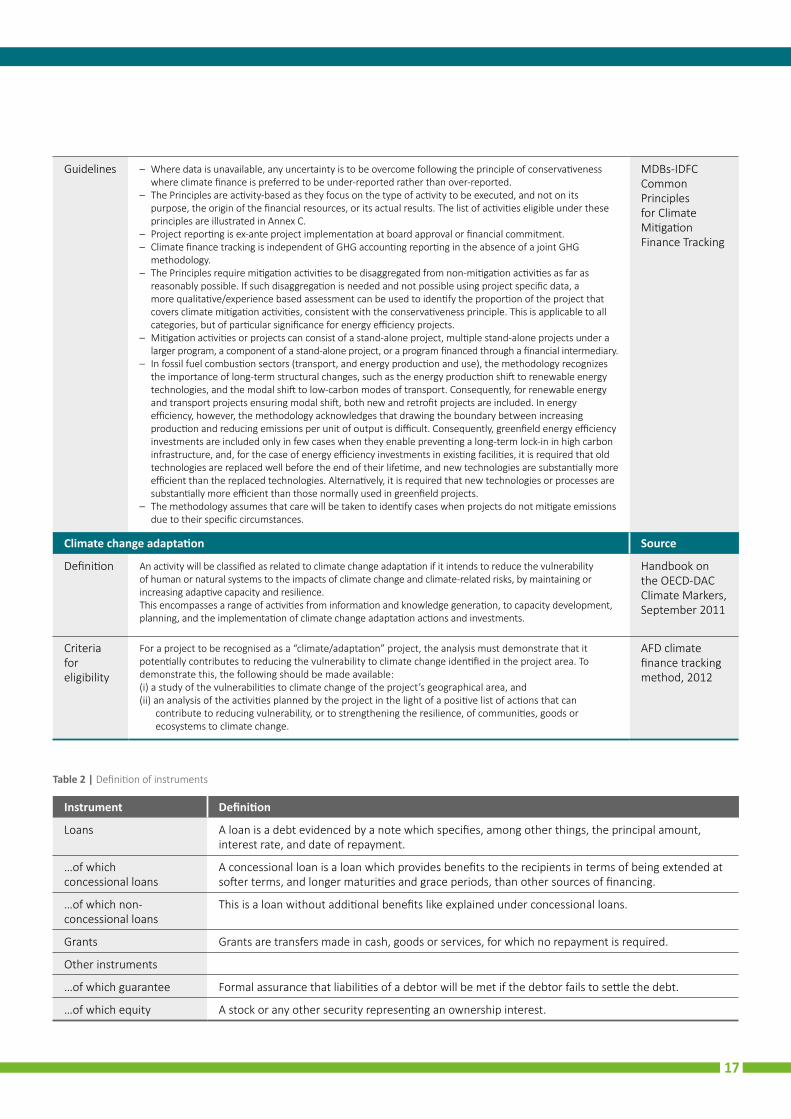
Guidelines – Where data is unavailable, any uncertainty is to be overcome following the principle of conservativeness where climate finance is preferred to be under-reported rather than over-reported.
– The Principles are activity-based as they focus on the type of activity to be executed, and not on its purpose, the origin of the financial resources, or its actual results. The list of activities eligible under these principles are illustrated in Annex C.
– Project reporting is ex-ante project implementation at board approval or financial commitment. – Climate finance tracking is independent of GHG accounting reporting in the absence of a joint GHG
methodology. – The Principles require mitigation activities to be disaggregated from non-mitigation activities as far as
reasonably possible. If such disaggregation is needed and not possible using project specific data, a more qualitative/experience based assessment can be used to identify the proportion of the project that covers climate mitigation activities, consistent with the conservativeness principle. This is applicable to all categories, but of particular significance for energy efficiency projects.
– Mitigation activities or projects can consist of a stand-alone project, multiple stand-alone projects under a larger program, a component of a stand-alone project, or a program financed through a financial intermediary.
– In fossil fuel combustion sectors (transport, and energy production and use), the methodology recognizes the importance of long-term structural changes, such as the energy production shift to renewable energy technologies, and the modal shift to low-carbon modes of transport. Consequently, for renewable energy and transport projects ensuring modal shift, both new and retrofit projects are included. In energy efficiency, however, the methodology acknowledges that drawing the boundary between increasing production and reducing emissions per unit of output is difficult. Consequently, greenfield energy efficiency investments are included only in few cases when they enable preventing a long-term lock-in in high carbon infrastructure, and, for the case of energy efficiency investments in existing facilities, it is required that old technologies are replaced well before the end of their lifetime, and new technologies are substantially more efficient than the replaced technologies. Alternatively, it is required that new technologies or processes are substantially more efficient than those normally used in greenfield projects.
– The methodology assumes that care will be taken to identify cases when projects do not mitigate emissions due to their specific circumstances.
MDBs-IDFC Common Principles for Climate Mitigation Finance Tracking
Climate change adaptation Source
Definition An activity will be classified as related to climate change adaptation if it intends to reduce the vulnerability of human or natural systems to the impacts of climate change and climate-related risks, by maintaining or increasing adaptive capacity and resilience.This encompasses a range of activities from information and know ledge generation, to capacity development, planning, and the implementation of climate change adaptation actions and investments.
Handbook on the OECD-DAC Climate Markers, September 2011
Criteria for eligibility
For a project to be recognised as a “climate/adaptation” project, the analysis must demonstrate that it potentially contributes to reducing the vulnerability to climate change identified in the project area. To demonstrate this, the following should be made available: (i) a study of the vulnerabilities to climate change of the project’s geographical area, and (ii) an analysis of the activities planned by the project in the light of a positive list of actions that can
contribute to reducing vulnerability, or to strengthening the resilience, of communities, goods or ecosystems to climate change.
AFD climate finance tracking method, 2012
Table 2 | Definition of instruments
Instrument Definition
Loans A loan is a debt evidenced by a note which specifies, among other things, the principal amount, interest rate, and date of repayment.
…of which concessional loans
A concessional loan is a loan which provides benefits to the recipients in terms of being extended at softer terms, and longer maturities and grace periods, than other sources of financing.
…of which non-concessional loans
This is a loan without additional benefits like explained under concessional loans.
Grants Grants are transfers made in cash, goods or services, for which no repayment is required.
Other instruments
…of which guarantee Formal assurance that liabilities of a debtor will be met if the debtor fails to settle the debt.
…of which equity A stock or any other security representing an ownership interest.
17
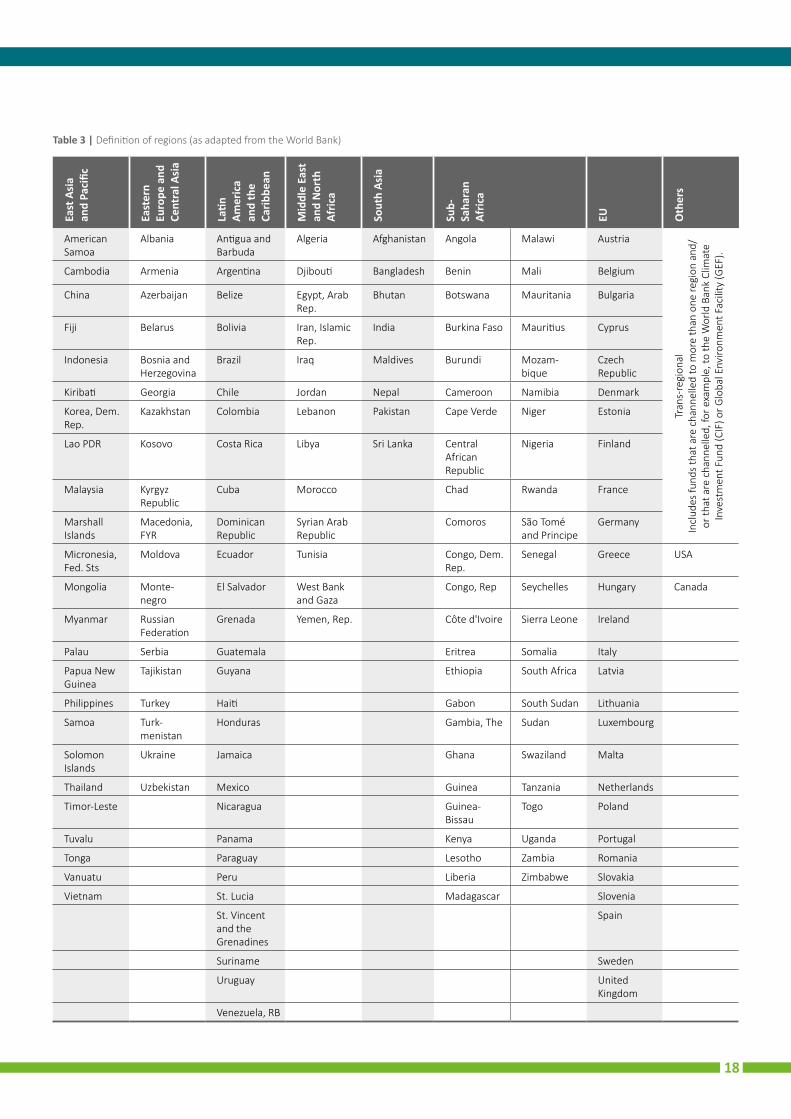
Table 3 | Definition of regions (as adapted from the World Bank)
East
Asi
a
and
Paci
fic
East
ern
Euro
pe a
nd
Cent
ral A
sia
Latin
Am
eric
a an
d th
e Ca
ribbe
an
Mid
dle
East
an
d N
orth
Af
rica
Sout
h As
ia
Sub-
Saha
ran
Afric
a
EU Oth
ers
American Samoa
Albania Antigua and Barbuda
Algeria Afghanistan Angola Malawi Austria
Tran
s-re
gion
alIn
clud
es fu
nds
that
are
cha
nnel
led
to m
ore
than
one
regi
on a
nd/
or th
at a
re c
hann
elle
d, fo
r exa
mpl
e, to
the
Wor
ld B
ank
Clim
ate
Inve
stm
ent F
und
(CIF
) or G
loba
l Env
ironm
ent F
acili
ty (G
EF).
Cambodia Armenia Argentina Djibouti Bangladesh Benin Mali Belgium
China Azerbaijan Belize Egypt, Arab Rep.
Bhutan Botswana Mauritania Bulgaria
Fiji Belarus Bolivia Iran, Islamic Rep.
India Burkina Faso Mauritius Cyprus
Indonesia Bosnia and Herzegovina
Brazil Iraq Maldives Burundi Mozam- bique
Czech Republic
Kiribati Georgia Chile Jordan Nepal Cameroon Namibia Denmark
Korea, Dem. Rep.
Kazakhstan Colombia Lebanon Pakistan Cape Verde Niger Estonia
Lao PDR Kosovo Costa Rica Libya Sri Lanka Central African Republic
Nigeria Finland
Malaysia Kyrgyz Republic
Cuba Morocco Chad Rwanda France
MarshallIslands
Macedonia, FYR
Dominican Republic
Syrian Arab Republic
Comoros São Tomé and Principe
Germany
Micronesia, Fed. Sts
Moldova Ecuador Tunisia Congo, Dem. Rep.
Senegal Greece USA
Mongolia Monte- negro
El Salvador West Bank and Gaza
Congo, Rep Seychelles Hungary Canada
Myanmar Russian Federation
Grenada Yemen, Rep. Côte d'Ivoire Sierra Leone Ireland
Palau Serbia Guatemala Eritrea Somalia Italy
Papua New Guinea
Tajikistan Guyana Ethiopia South Africa Latvia
Philippines Turkey Haiti Gabon South Sudan Lithuania
Samoa Turk- menistan
Honduras Gambia, The Sudan Luxembourg
Solomon Islands
Ukraine Jamaica Ghana Swaziland Malta
Thailand Uzbekistan Mexico Guinea Tanzania Netherlands
Timor-Leste Nicaragua Guinea-Bissau
Togo Poland
Tuvalu Panama Kenya Uganda Portugal
Tonga Paraguay Lesotho Zambia Romania
Vanuatu Peru Liberia Zimbabwe Slovakia
Vietnam St. Lucia Madagascar Slovenia
St. Vincent and the Grenadines
Spain
Suriname Sweden
Uruguay United Kingdom
Venezuela, RB
18
ANNEX C - ELIGIBLE PROJECT CATEGORIES
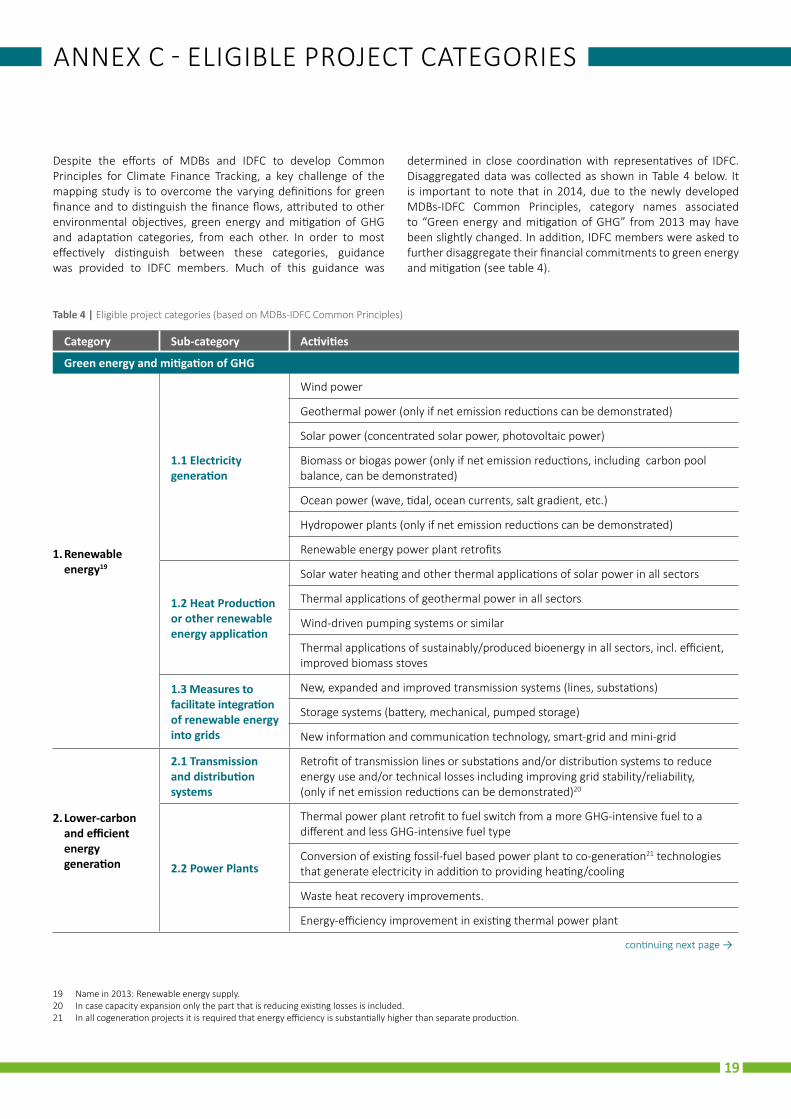
Despite the efforts of MDBs and IDFC to develop Common Principles for Climate Finance Tracking, a key challenge of the mapping study is to overcome the varying definitions for green finance and to distinguish the finance flows, attributed to other environmental objectives, green energy and mitigation of GHG and adaptation categories, from each other. In order to most effectively distinguish between these categories, guidance was provided to IDFC members. Much of this guidance was
determined in close coordination with representatives of IDFC. Disaggregated data was collected as shown in Table 4 below. It is important to note that in 2014, due to the newly developed MDBs-IDFC Common Principles, category names associated to “Green energy and mitigation of GHG” from 2013 may have been slightly changed. In addition, IDFC members were asked to further disaggregate their financial commitments to green energy and mitigation (see table 4).
Table 4 | Eligible project categories (based on MDBs-IDFC Common Principles)
Category Sub-category Activities
Green energy and mitigation of GHG
1. Renewable energy19
1.1 Electricity generation
Wind power
Geothermal power (only if net emission reductions can be demonstrated)
Solar power (concentrated solar power, photovoltaic power)
Biomass or biogas power (only if net emission reductions, including carbon pool balance, can be demonstrated)
Ocean power (wave, tidal, ocean currents, salt gradient, etc.)
Hydropower plants (only if net emission reductions can be demonstrated)
Renewable energy power plant retrofits
1.2 Heat Production or other renewable energy application
Solar water heating and other thermal applications of solar power in all sectors
Thermal applications of geothermal power in all sectors
Wind-driven pumping systems or similar
Thermal applications of sustainably/produced bioenergy in all sectors, incl. efficient, improved biomass stoves
1.3 Measures to facilitate integration of renewable energy into grids
New, expanded and improved transmission systems (lines, substations)
Storage systems (battery, mechanical, pumped storage)
New information and communication technology, smart-grid and mini-grid
2. Lower-carbon and efficient energy generation
2.1 Transmission and distribution systems
Retrofit of transmission lines or substations and/or distribution systems to reduce energy use and/or technical losses including improving grid stability/reliability, (only if net emission reductions can be demonstrated)20
2.2 Power Plants
Thermal power plant retrofit to fuel switch from a more GHG-intensive fuel to a different and less GHG-intensive fuel type
Conversion of existing fossil-fuel based power plant to co-generation21 technologies that generate electricity in addition to providing heating/cooling
Waste heat recovery improvements.
Energy-efficiency improvement in existing thermal power plant
continuing next page →
19 Name in 2013: Renewable energy supply.20 In case capacity expansion only the part that is reducing existing losses is included.21 In all cogeneration projects it is required that energy efficiency is substantially higher than separate production.
19
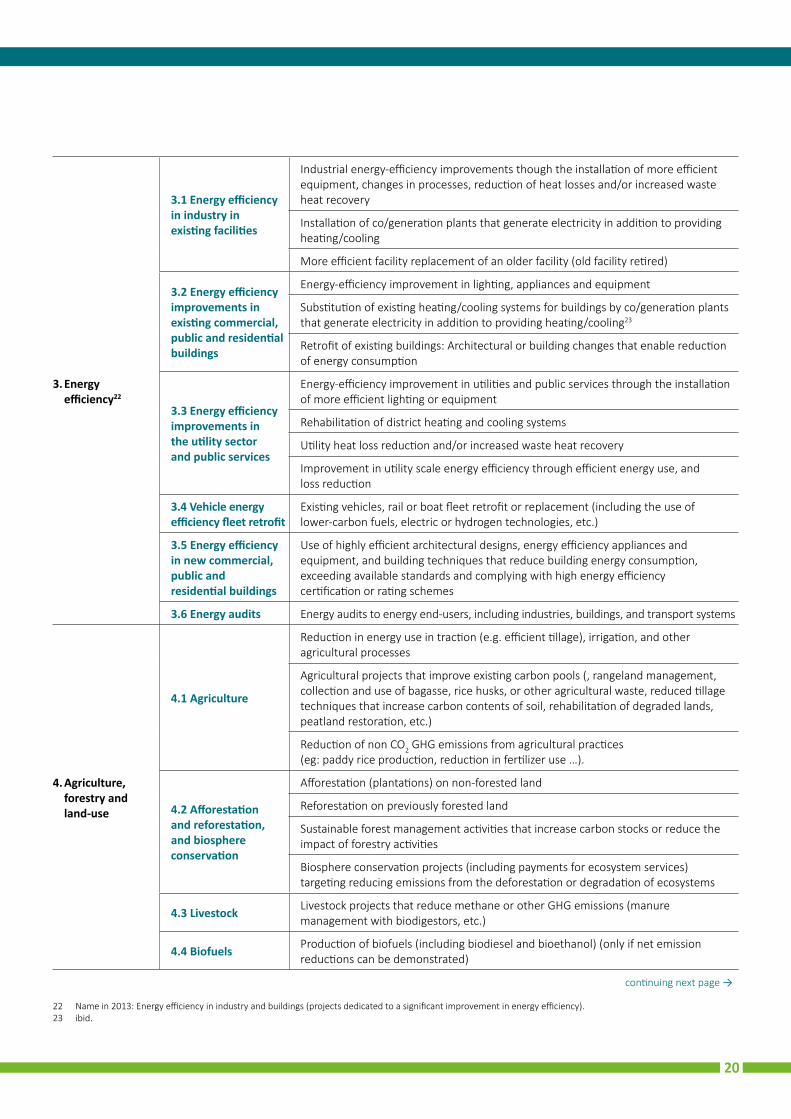
3. Energy efficiency22
3.1 Energy efficiency in industry in existing facilities
Industrial energy-efficiency improvements though the installation of more efficient equipment, changes in processes, reduction of heat losses and/or increased waste heat recovery
Installation of co/generation plants that generate electricity in addition to providing heating/cooling
More efficient facility replacement of an older facility (old facility retired)
3.2 Energy efficiency improvements in existing commercial, public and residential buildings
Energy-efficiency improvement in lighting, appliances and equipment
Substitution of existing heating/cooling systems for buildings by co/generation plants that generate electricity in addition to providing heating/cooling23
Retrofit of existing buildings: Architectural or building changes that enable reduction of energy consumption
3.3 Energy efficiency improvements in the utility sector and public services
Energy-efficiency improvement in utilities and public services through the installation of more efficient lighting or equipment
Rehabilitation of district heating and cooling systems
Utility heat loss reduction and/or increased waste heat recovery
Improvement in utility scale energy efficiency through efficient energy use, and loss reduction
3.4 Vehicle energy efficiency fleet retrofit
Existing vehicles, rail or boat fleet retrofit or replacement (including the use of lower-carbon fuels, electric or hydrogen technologies, etc.)
3.5 Energy efficiency in new commercial, public and residential buildings
Use of highly efficient architectural designs, energy efficiency appliances and equipment, and building techniques that reduce building energy consumption, exceeding available standards and complying with high energy efficiency certification or rating schemes
3.6 Energy audits Energy audits to energy end-users, including industries, buildings, and transport systems
4. Agriculture, forestry and land-use
4.1 Agriculture
Reduction in energy use in traction (e.g. efficient tillage), irrigation, and other agricultural processes
Agricultural projects that improve existing carbon pools (, rangeland management, collection and use of bagasse, rice husks, or other agricultural waste, reduced tillage techniques that increase carbon contents of soil, rehabilitation of degraded lands, peatland restoration, etc.)
Reduction of non CO2 GHG emissions from agricultural practices (eg: paddy rice production, reduction in fertilizer use …).
4.2 Afforestation and reforestation, and biosphere conservation
Afforestation (plantations) on non-forested land
Reforestation on previously forested land
Sustainable forest management activities that increase carbon stocks or reduce the impact of forestry activities
Biosphere conservation projects (including payments for ecosystem services) targeting reducing emissions from the deforestation or degradation of ecosystems
4.3 Livestock Livestock projects that reduce methane or other GHG emissions (manure management with biodigestors, etc.)
4.4 Biofuels Production of biofuels (including biodiesel and bioethanol) (only if net emission reductions can be demonstrated)
continuing next page →
22 Name in 2013: Energy efficiency in industry and buildings (projects dedicated to a significant improvement in energy efficiency).23 ibid.
20
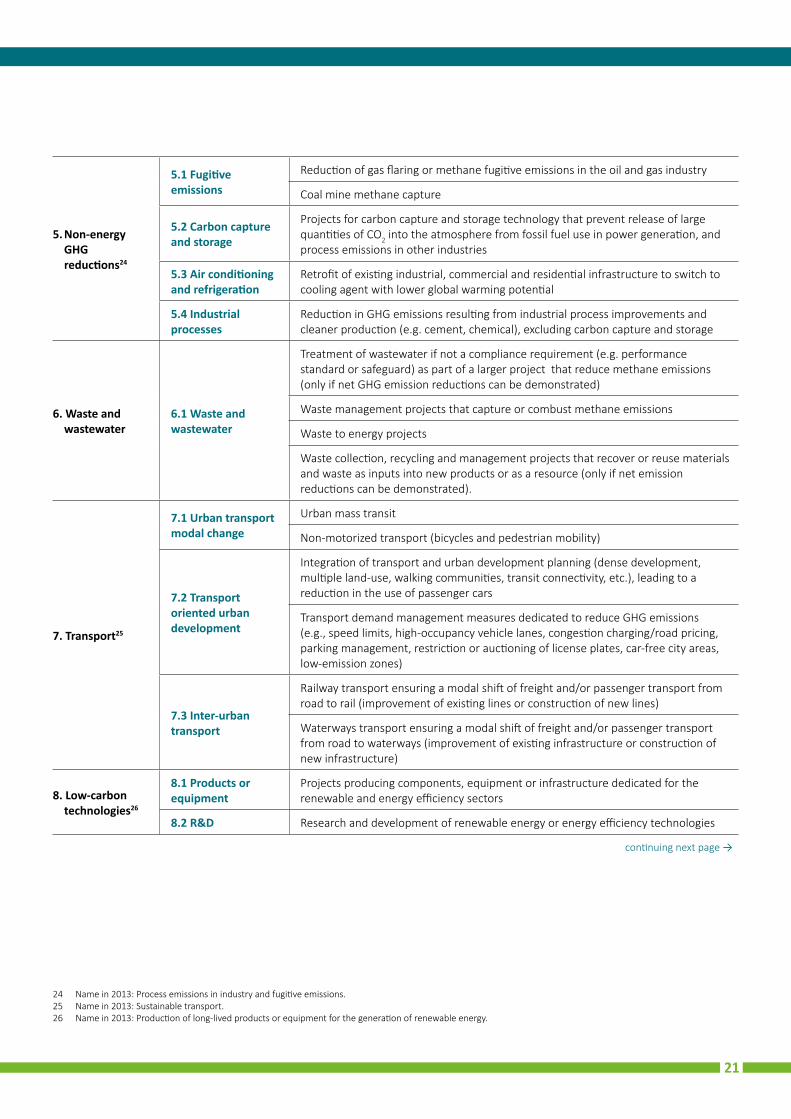
5. Non-energy GHG reductions24
5.1 Fugitive emissions
Reduction of gas flaring or methane fugitive emissions in the oil and gas industry
Coal mine methane capture
5.2 Carbon capture and storage
Projects for carbon capture and storage technology that prevent release of large quantities of CO2 into the atmosphere from fossil fuel use in power generation, and process emissions in other industries
5.3 Air conditioning and refrigeration
Retrofit of existing industrial, commercial and residential infrastructure to switch to cooling agent with lower global warming potential
5.4 Industrial processes
Reduction in GHG emissions resulting from industrial process improvements and cleaner production (e.g. cement, chemical), excluding carbon capture and storage
6. Waste and wastewater
6.1 Waste and wastewater
Treatment of wastewater if not a compliance requirement (e.g. performance standard or safeguard) as part of a larger project that reduce methane emissions (only if net GHG emission reductions can be demonstrated)
Waste management projects that capture or combust methane emissions
Waste to energy projects
Waste collection, recycling and management projects that recover or reuse materials and waste as inputs into new products or as a resource (only if net emission reductions can be demonstrated).
7. Transport25
7.1 Urban transport modal change
Urban mass transit
Non-motorized transport (bicycles and pedestrian mobility)
7.2 Transport oriented urban development
Integration of transport and urban development planning (dense development, multiple land-use, walking communities, transit connectivity, etc.), leading to a reduction in the use of passenger cars
Transport demand management measures dedicated to reduce GHG emissions (e.g., speed limits, high-occupancy vehicle lanes, congestion charging/road pricing, parking management, restriction or auctioning of license plates, car-free city areas, low-emission zones)
7.3 Inter-urban transport
Railway transport ensuring a modal shift of freight and/or passenger transport from road to rail (improvement of existing lines or construction of new lines)
Waterways transport ensuring a modal shift of freight and/or passenger transport from road to waterways (improvement of existing infrastructure or construction of new infrastructure)
8. Low-carbon technologies26
8.1 Products or equipment
Projects producing components, equipment or infrastructure dedicated for the renewable and energy efficiency sectors
8.2 R&D Research and development of renewable energy or energy efficiency technologies
continuing next page →
24 Name in 2013: Process emissions in industry and fugitive emissions.25 Name in 2013: Sustainable transport.26 Name in 2013: Production of long-lived products or equipment for the generation of renewable energy.
21
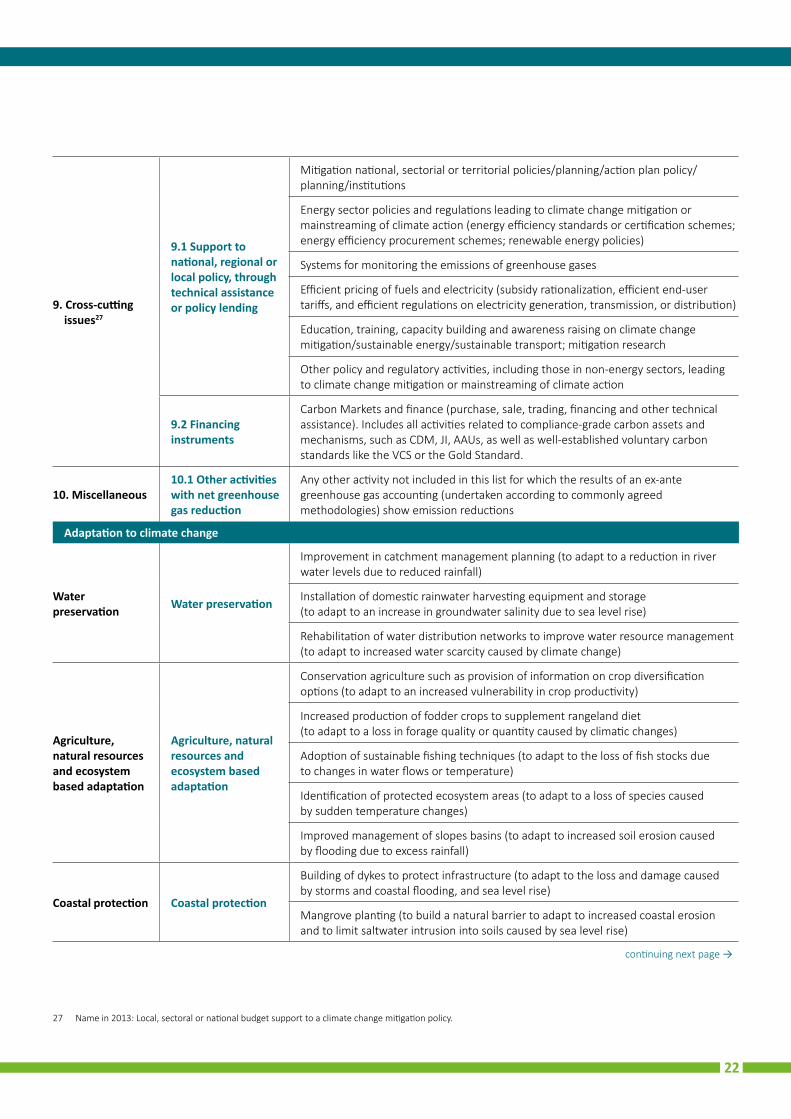
9. Cross-cutting issues27
9.1 Support to national, regional or local policy, through technical assistance or policy lending
Mitigation national, sectorial or territorial policies/planning/action plan policy/planning/institutions
Energy sector policies and regulations leading to climate change mitigation or mainstreaming of climate action (energy efficiency standards or certification schemes; energy efficiency procurement schemes; renewable energy policies)
Systems for monitoring the emissions of greenhouse gases
Efficient pricing of fuels and electricity (subsidy rationalization, efficient end-user tariffs, and efficient regulations on electricity generation, transmission, or distribution)
Education, training, capacity building and awareness raising on climate change mitigation/sustainable energy/sustainable transport; mitigation research
Other policy and regulatory activities, including those in non-energy sectors, leading to climate change mitigation or mainstreaming of climate action
9.2 Financing instruments
Carbon Markets and finance (purchase, sale, trading, financing and other technical assistance). Includes all activities related to compliance-grade carbon assets and mechanisms, such as CDM, JI, AAUs, as well as well-established voluntary carbon standards like the VCS or the Gold Standard.
10. Miscellaneous 10.1 Other activities with net greenhouse gas reduction
Any other activity not included in this list for which the results of an ex-ante greenhouse gas accounting (undertaken according to commonly agreed methodologies) show emission reductions
Adaptation to climate change
Water preservation Water preservation
Improvement in catchment management planning (to adapt to a reduction in river water levels due to reduced rainfall)
Installation of domestic rainwater harvesting equipment and storage (to adapt to an increase in groundwater salinity due to sea level rise)
Rehabilitation of water distribution networks to improve water resource management (to adapt to increased water scarcity caused by climate change)
Agriculture, natural resources and ecosystem based adaptation
Agriculture, natural resources and ecosystem based adaptation
Conservation agriculture such as provision of information on crop diversification options (to adapt to an increased vulnerability in crop productivity)
Increased production of fodder crops to supplement rangeland diet (to adapt to a loss in forage quality or quantity caused by climatic changes)
Adoption of sustainable fishing techniques (to adapt to the loss of fish stocks due to changes in water flows or temperature)
Identification of protected ecosystem areas (to adapt to a loss of species caused by sudden temperature changes)
Improved management of slopes basins (to adapt to increased soil erosion caused by flooding due to excess rainfall)
Coastal protection Coastal protection
Building of dykes to protect infrastructure (to adapt to the loss and damage caused by storms and coastal flooding, and sea level rise)
Mangrove planting (to build a natural barrier to adapt to increased coastal erosion and to limit saltwater intrusion into soils caused by sea level rise)
27 Name in 2013: Local, sectoral or national budget support to a climate change mitigation policy.
continuing next page →
22
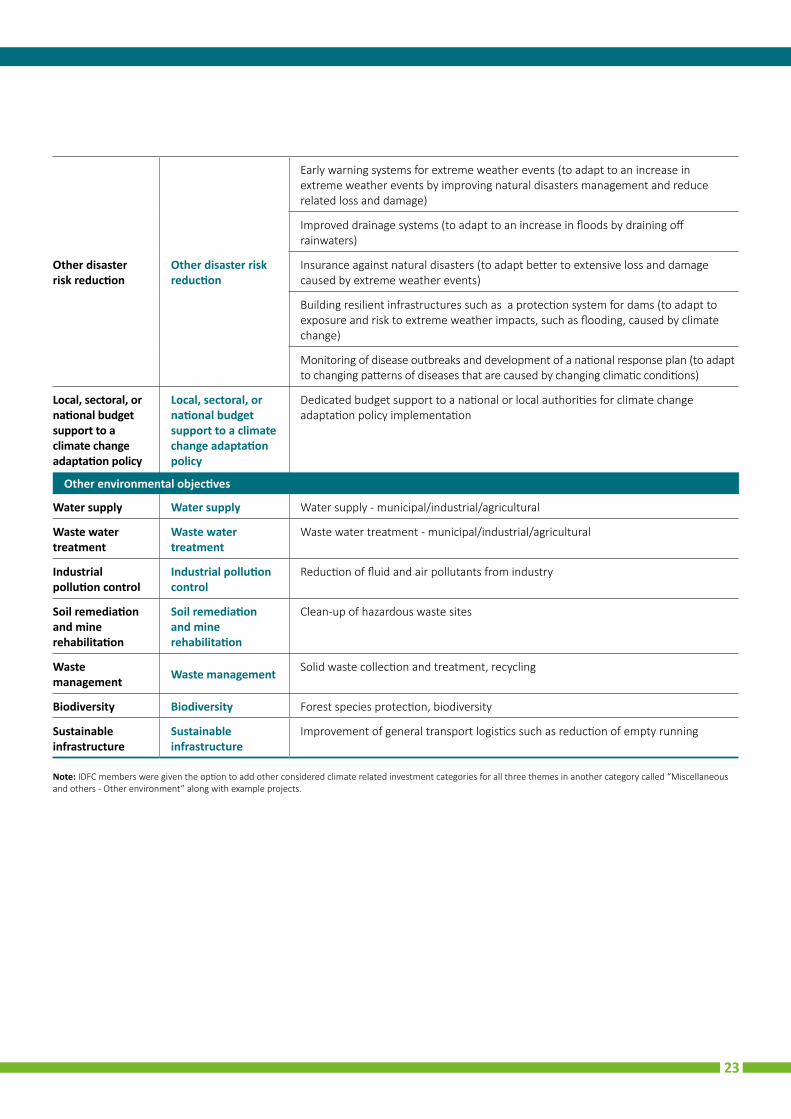
Note: IDFC members were given the option to add other considered climate related investment categories for all three themes in another category called “Miscellaneous and others - Other environment” along with example projects.
Other disaster risk reduction
Other disaster risk reduction
Early warning systems for extreme weather events (to adapt to an increase in extreme weather events by improving natural disasters management and reduce related loss and damage)
Improved drainage systems (to adapt to an increase in floods by draining off rainwaters)
Insurance against natural disasters (to adapt better to extensive loss and damage caused by extreme weather events)
Building resilient infrastructures such as a protection system for dams (to adapt to exposure and risk to extreme weather impacts, such as flooding, caused by climate change)
Monitoring of disease outbreaks and development of a national response plan (to adapt to changing patterns of diseases that are caused by changing climatic conditions)
Local, sectoral, or national budget support to a climate change adaptation policy
Local, sectoral, or national budget support to a climate change adaptation policy
Dedicated budget support to a national or local authorities for climate change adaptation policy implementation
Other environmental objectives
Water supply Water supply Water supply - municipal/industrial/agricultural
Waste water treatment
Waste water treatment
Waste water treatment - municipal/industrial/agricultural
Industrial pollution control
Industrial pollution control
Reduction of fluid and air pollutants from industry
Soil remediation and mine rehabilitation
Soil remediation and mine rehabilitation
Clean-up of hazardous waste sites
Waste management Waste management Solid waste collection and treatment, recycling
Biodiversity Biodiversity Forest species protection, biodiversity
Sustainable infrastructure
Sustainable infrastructure
Improvement of general transport logistics such as reduction of empty running
23
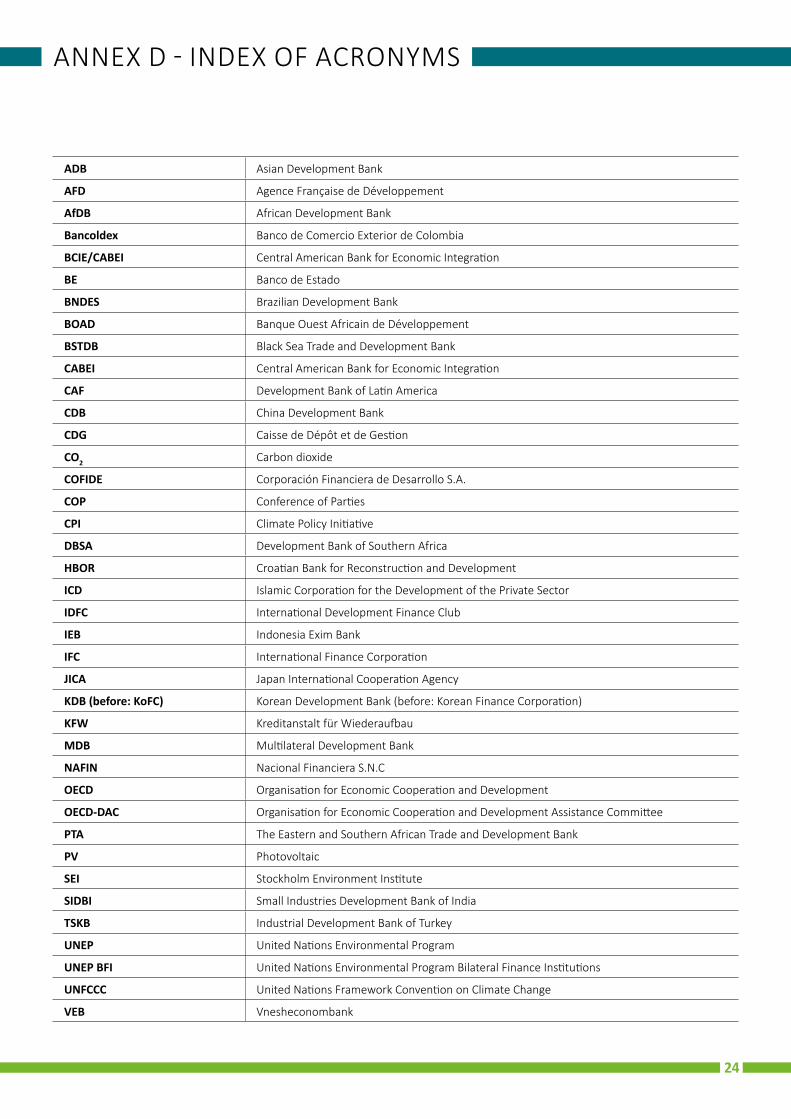
ANNEX D - INDEX OF ACRONYMS
ADB Asian Development Bank
AFD Agence Française de Développement
AfDB African Development Bank
Bancoldex Banco de Comercio Exterior de Colombia
BCIE/CABEI Central American Bank for Economic Integration
BE Banco de Estado
BNDES Brazilian Development Bank
BOAD Banque Ouest Africain de Développement
BSTDB Black Sea Trade and Development Bank
CABEI Central American Bank for Economic Integration
CAF Development Bank of Latin America
CDB China Development Bank
CDG Caisse de Dépôt et de Gestion
CO2 Carbon dioxide
COFIDE Corporación Financiera de Desarrollo S.A.
COP Conference of Parties
CPI Climate Policy Initiative
DBSA Development Bank of Southern Africa
HBOR Croatian Bank for Reconstruction and Development
ICD Islamic Corporation for the Development of the Private Sector
IDFC International Development Finance Club
IEB Indonesia Exim Bank
IFC International Finance Corporation
JICA Japan International Cooperation Agency
KDB (before: KoFC) Korean Development Bank (before: Korean Finance Corporation)
KFW Kreditanstalt für Wiederaufbau
MDB Multilateral Development Bank
NAFIN Nacional Financiera S.N.C
OECD Organisation for Economic Cooperation and Development
OECD-DAC Organisation for Economic Cooperation and Development Assistance Committee
PTA The Eastern and Southern African Trade and Development Bank
PV Photovoltaic
SEI Stockholm Environment Institute
SIDBI Small Industries Development Bank of India
TSKB Industrial Development Bank of Turkey
UNEP United Nations Environmental Program
UNEP BFI United Nations Environmental Program Bilateral Finance Institutions
UNFCCC United Nations Framework Convention on Climate Change
VEB Vnesheconombank
24
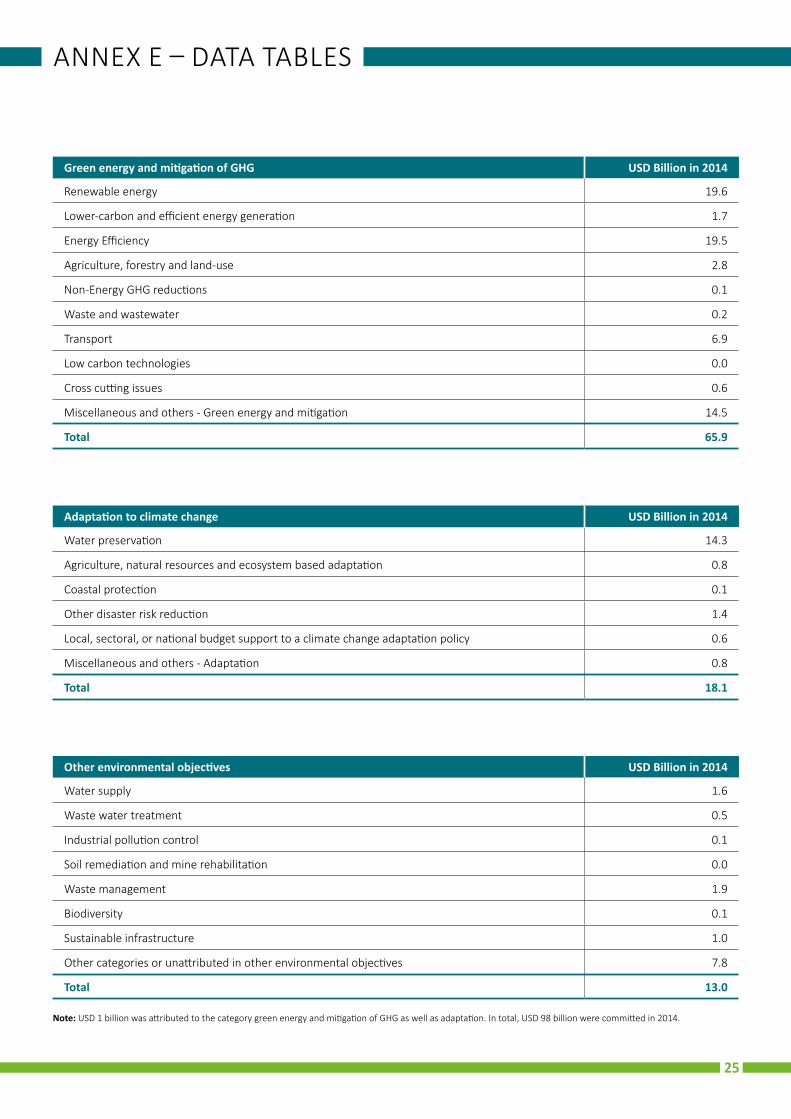
ANNEX E – DATA TABLES
Green energy and mitigation of GHG USD Billion in 2014
Renewable energy 19.6
Lower-carbon and efficient energy generation 1.7
Energy Efficiency 19.5
Agriculture, forestry and land-use 2.8
Non-Energy GHG reductions 0.1
Waste and wastewater 0.2
Transport 6.9
Low carbon technologies 0.0
Cross cutting issues 0.6
Miscellaneous and others - Green energy and mitigation 14.5
Total 65.9
Adaptation to climate change USD Billion in 2014
Water preservation 14.3
Agriculture, natural resources and ecosystem based adaptation 0.8
Coastal protection 0.1
Other disaster risk reduction 1.4
Local, sectoral, or national budget support to a climate change adaptation policy 0.6
Miscellaneous and others - Adaptation 0.8
Total 18.1
Other environmental objectives USD Billion in 2014
Water supply 1.6
Waste water treatment 0.5
Industrial pollution control 0.1
Soil remediation and mine rehabilitation 0.0
Waste management 1.9
Biodiversity 0.1
Sustainable infrastructure 1.0
Other categories or unattributed in other environmental objectives 7.8
Total 13.0
Note: USD 1 billion was attributed to the category green energy and mitigation of GHG as well as adaptation. In total, USD 98 billion were committed in 2014.
25
PREPARED BY WORLD RESOURCES INSTITUTE AND ECOFYS
For further information, please contact:Michael Westphal, WRI ([email protected]), Giel Linthorst, Ecofys ([email protected]), Esther Eggink, Ecofys ([email protected]) or Thomas Haehl, Ecofys ([email protected])