Embed Size (px)
Citation preview
WORLD ENERGY BALANCES 2017 EDITION
DATABASE DOCUMENTATION

2 - WORLD ENERGY BALANCES: DATABASE DOCUMENTATION (2017 edition)
INTERNATIONAL ENERGY AGENCY
This documentation provides support information for the IEA World Energy Balances database. This document can be found online at: http://www.iea.org/statistics/topics/energybalances/.
Please address your inquiries to [email protected].
Please note that all IEA data is subject to the following Terms and Conditions found on the IEA’s website: http://www.iea.org/t&c/termsandconditions/
WORLD ENERGY BALANCES: DATABASE DOCUMENTATION (2017 edition) - 3
INTERNATIONAL ENERGY AGENCY
TABLE OF CONTENTS
1. CHANGES FROM LAST EDITION ................................................................................. 4
2. DATABASE STRUCTURE ............................................................................................. 6
3. FLOW DEFINITIONS ...................................................................................................... 7
4. PRODUCT DEFINITIONS ............................................................................................. 28
5. GEOGRAPHICAL COVERAGE ................................................................................... 41
6. COUNTRY NOTES AND SOURCES ........................................................................... 56
7. METHODOLOGICAL NOTES .................................................................................... 183
8. NOTES ON DATA QUALITY ...................................................................................... 186
9. UNITS AND CONVERSIONS ..................................................................................... 190
10. ABBREVIATIONS ....................................................................................................... 194
4 - WORLD ENERGY BALANCES: DATABASE DOCUMENTATION (2017 edition)
INTERNATIONAL ENERGY AGENCY
1. CHANGES FROM LAST EDITION
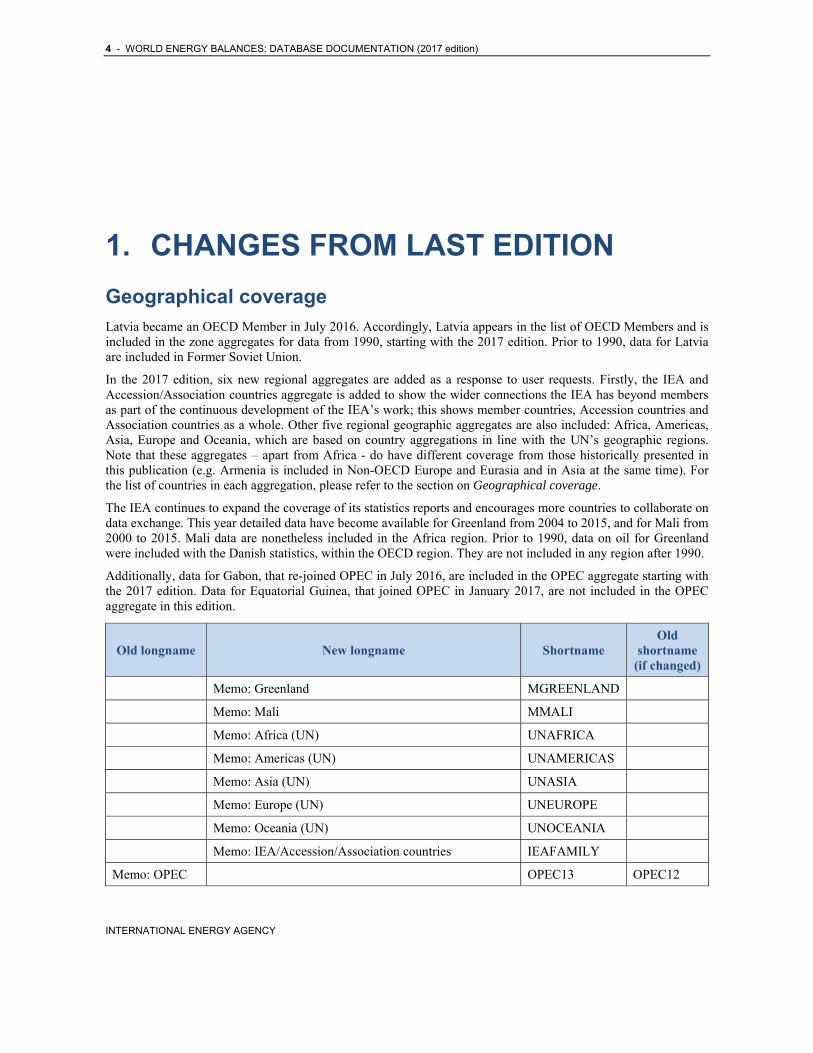
Geographical coverage Latvia became an OECD Member in July 2016. Accordingly, Latvia appears in the list of OECD Members and is included in the zone aggregates for data from 1990, starting with the 2017 edition. Prior to 1990, data for Latvia are included in Former Soviet Union.
In the 2017 edition, six new regional aggregates are added as a response to user requests. Firstly, the IEA and Accession/Association countries aggregate is added to show the wider connections the IEA has beyond members as part of the continuous development of the IEA’s work; this shows member countries, Accession countries and Association countries as a whole. Other five regional geographic aggregates are also included: Africa, Americas, Asia, Europe and Oceania, which are based on country aggregations in line with the UN’s geographic regions. Note that these aggregates – apart from Africa - do have different coverage from those historically presented in this publication (e.g. Armenia is included in Non-OECD Europe and Eurasia and in Asia at the same time). For the list of countries in each aggregation, please refer to the section on Geographical coverage.
The IEA continues to expand the coverage of its statistics reports and encourages more countries to collaborate on data exchange. This year detailed data have become available for Greenland from 2004 to 2015, and for Mali from 2000 to 2015. Mali data are nonetheless included in the Africa region. Prior to 1990, data on oil for Greenland were included with the Danish statistics, within the OECD region. They are not included in any region after 1990.
Additionally, data for Gabon, that re-joined OPEC in July 2016, are included in the OPEC aggregate starting with the 2017 edition. Data for Equatorial Guinea, that joined OPEC in January 2017, are not included in the OPEC aggregate in this edition.
Old longname New longname Shortname Old
shortname (if changed)
Memo: Greenland MGREENLAND
Memo: Mali MMALI
Memo: Africa (UN) UNAFRICA
Memo: Americas (UN) UNAMERICAS
Memo: Asia (UN) UNASIA
Memo: Europe (UN) UNEUROPE
Memo: Oceania (UN) UNOCEANIA
Memo: IEA/Accession/Association countries IEAFAMILY
Memo: OPEC OPEC13 OPEC12
WORLD ENERGY BALANCES: DATABASE DOCUMENTATION (2017 edition) - 5
INTERNATIONAL ENERGY AGENCY
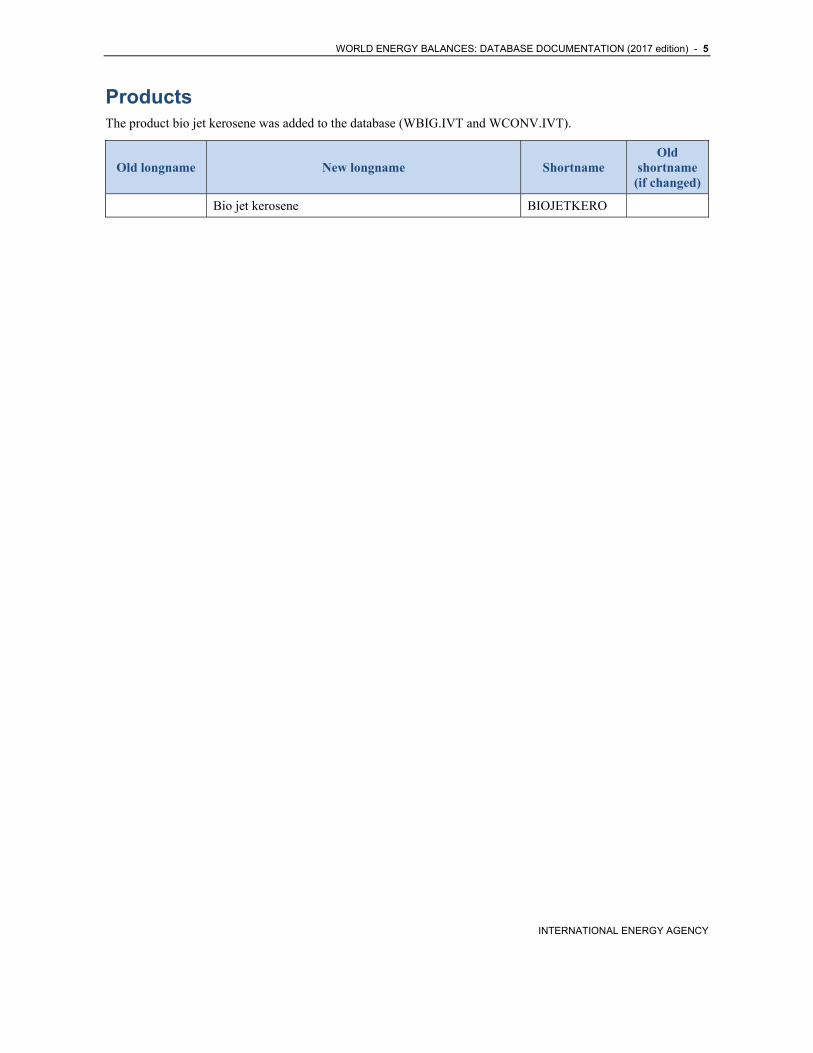
Products The product bio jet kerosene was added to the database (WBIG.IVT and WCONV.IVT).
Old longname New longname Shortname Old
shortname (if changed)
Bio jet kerosene BIOJETKERO
6 - WORLD ENERGY BALANCES: DATABASE DOCUMENTATION (2017 edition)
INTERNATIONAL ENERGY AGENCY
2. DATABASE STRUCTURE
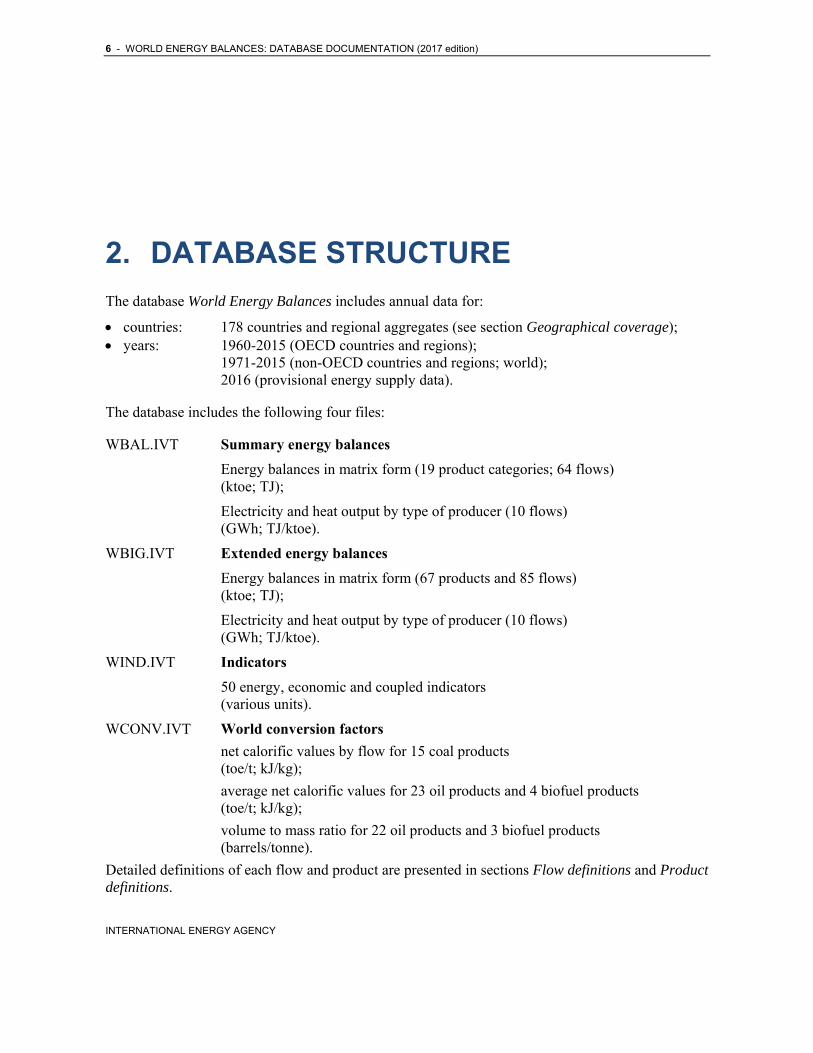
The database World Energy Balances includes annual data for:
countries: 178 countries and regional aggregates (see section Geographical coverage); years: 1960-2015 (OECD countries and regions);
1971-2015 (non-OECD countries and regions; world); 2016 (provisional energy supply data).
The database includes the following four files:
WBAL.IVT Summary energy balances
Energy balances in matrix form (19 product categories; 64 flows) (ktoe; TJ);
Electricity and heat output by type of producer (10 flows) (GWh; TJ/ktoe).
WBIG.IVT Extended energy balances
Energy balances in matrix form (67 products and 85 flows) (ktoe; TJ);
Electricity and heat output by type of producer (10 flows) (GWh; TJ/ktoe).
WIND.IVT Indicators
50 energy, economic and coupled indicators (various units).
WCONV.IVT World conversion factors
net calorific values by flow for 15 coal products (toe/t; kJ/kg);
average net calorific values for 23 oil products and 4 biofuel products (toe/t; kJ/kg);
volume to mass ratio for 22 oil products and 3 biofuel products (barrels/tonne).
Detailed definitions of each flow and product are presented in sections Flow definitions and Product definitions.
WORLD ENERGY BALANCES: DATABASE DOCUMENTATION (2017 edition) - 7
INTERNATIONAL ENERGY AGENCY
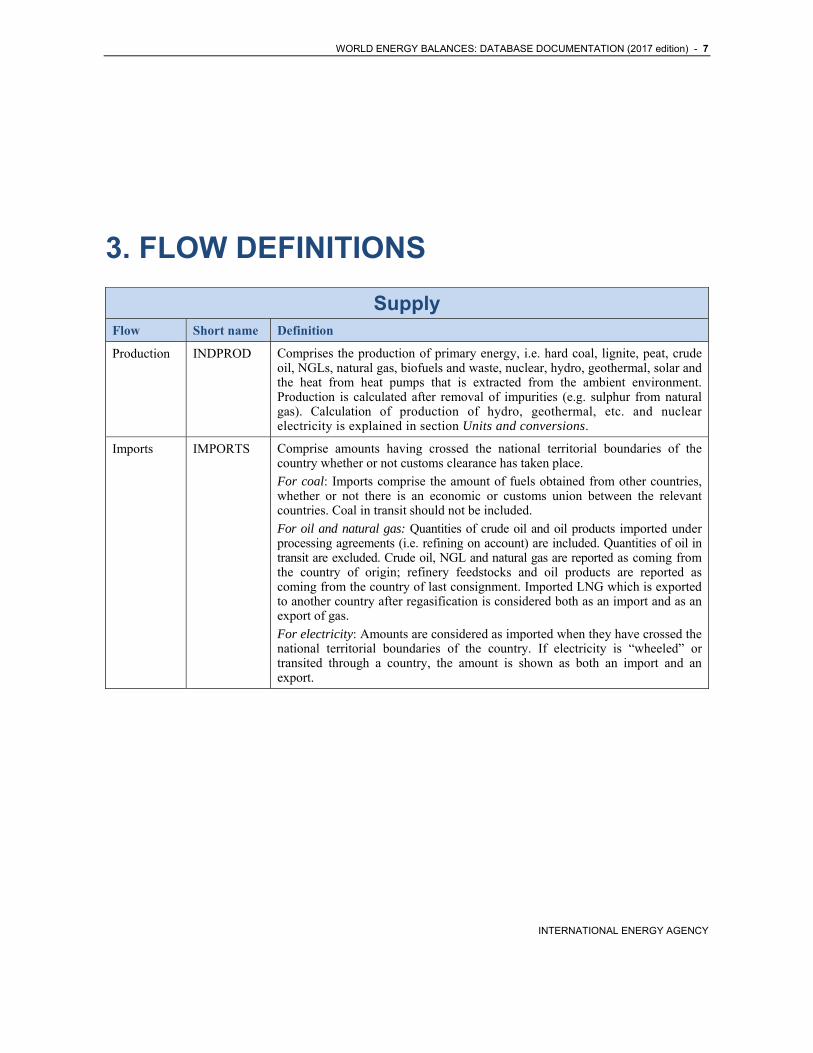
3. FLOW DEFINITIONS
Supply Flow Short name Definition
Production INDPROD Comprises the production of primary energy, i.e. hard coal, lignite, peat, crude oil, NGLs, natural gas, biofuels and waste, nuclear, hydro, geothermal, solar and the heat from heat pumps that is extracted from the ambient environment. Production is calculated after removal of impurities (e.g. sulphur from natural gas). Calculation of production of hydro, geothermal, etc. and nuclear electricity is explained in section Units and conversions.
Imports IMPORTS Comprise amounts having crossed the national territorial boundaries of the country whether or not customs clearance has taken place.
For coal: Imports comprise the amount of fuels obtained from other countries, whether or not there is an economic or customs union between the relevant countries. Coal in transit should not be included.
For oil and natural gas: Quantities of crude oil and oil products imported under processing agreements (i.e. refining on account) are included. Quantities of oil in transit are excluded. Crude oil, NGL and natural gas are reported as coming from the country of origin; refinery feedstocks and oil products are reported as coming from the country of last consignment. Imported LNG which is exported to another country after regasification is considered both as an import and as an export of gas.
For electricity: Amounts are considered as imported when they have crossed the national territorial boundaries of the country. If electricity is “wheeled” or transited through a country, the amount is shown as both an import and an export.
8 - WORLD ENERGY BALANCES: DATABASE DOCUMENTATION (2017 edition)
INTERNATIONAL ENERGY AGENCY
Supply Flow Short name Definition
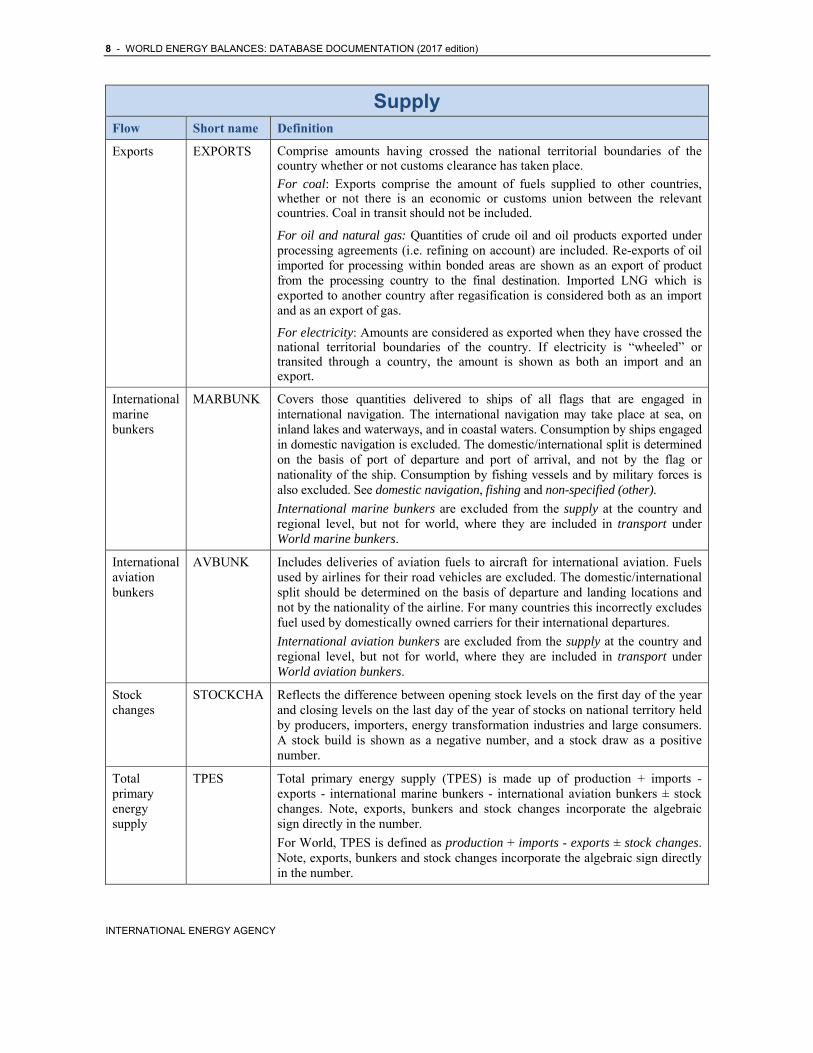
Exports EXPORTS Comprise amounts having crossed the national territorial boundaries of the country whether or not customs clearance has taken place.
For coal: Exports comprise the amount of fuels supplied to other countries, whether or not there is an economic or customs union between the relevant countries. Coal in transit should not be included.
For oil and natural gas: Quantities of crude oil and oil products exported under processing agreements (i.e. refining on account) are included. Re-exports of oil imported for processing within bonded areas are shown as an export of product from the processing country to the final destination. Imported LNG which is exported to another country after regasification is considered both as an import and as an export of gas.
For electricity: Amounts are considered as exported when they have crossed the national territorial boundaries of the country. If electricity is “wheeled” or transited through a country, the amount is shown as both an import and an export.
International marine bunkers
MARBUNK Covers those quantities delivered to ships of all flags that are engaged in international navigation. The international navigation may take place at sea, on inland lakes and waterways, and in coastal waters. Consumption by ships engaged in domestic navigation is excluded. The domestic/international split is determined on the basis of port of departure and port of arrival, and not by the flag or nationality of the ship. Consumption by fishing vessels and by military forces is also excluded. See domestic navigation, fishing and non-specified (other).
International marine bunkers are excluded from the supply at the country and regional level, but not for world, where they are included in transport under World marine bunkers.
International aviation bunkers
AVBUNK Includes deliveries of aviation fuels to aircraft for international aviation. Fuels used by airlines for their road vehicles are excluded. The domestic/international split should be determined on the basis of departure and landing locations and not by the nationality of the airline. For many countries this incorrectly excludes fuel used by domestically owned carriers for their international departures.
International aviation bunkers are excluded from the supply at the country and regional level, but not for world, where they are included in transport under World aviation bunkers.
Stock changes
STOCKCHA Reflects the difference between opening stock levels on the first day of the year and closing levels on the last day of the year of stocks on national territory held by producers, importers, energy transformation industries and large consumers. A stock build is shown as a negative number, and a stock draw as a positive number.
Total primary energy supply
TPES Total primary energy supply (TPES) is made up of production + imports - exports - international marine bunkers - international aviation bunkers ± stock changes. Note, exports, bunkers and stock changes incorporate the algebraic sign directly in the number.
For World, TPES is defined as production + imports - exports ± stock changes. Note, exports, bunkers and stock changes incorporate the algebraic sign directly in the number.
WORLD ENERGY BALANCES: DATABASE DOCUMENTATION (2017 edition) - 9
INTERNATIONAL ENERGY AGENCY
Supply Flow Short name Definition
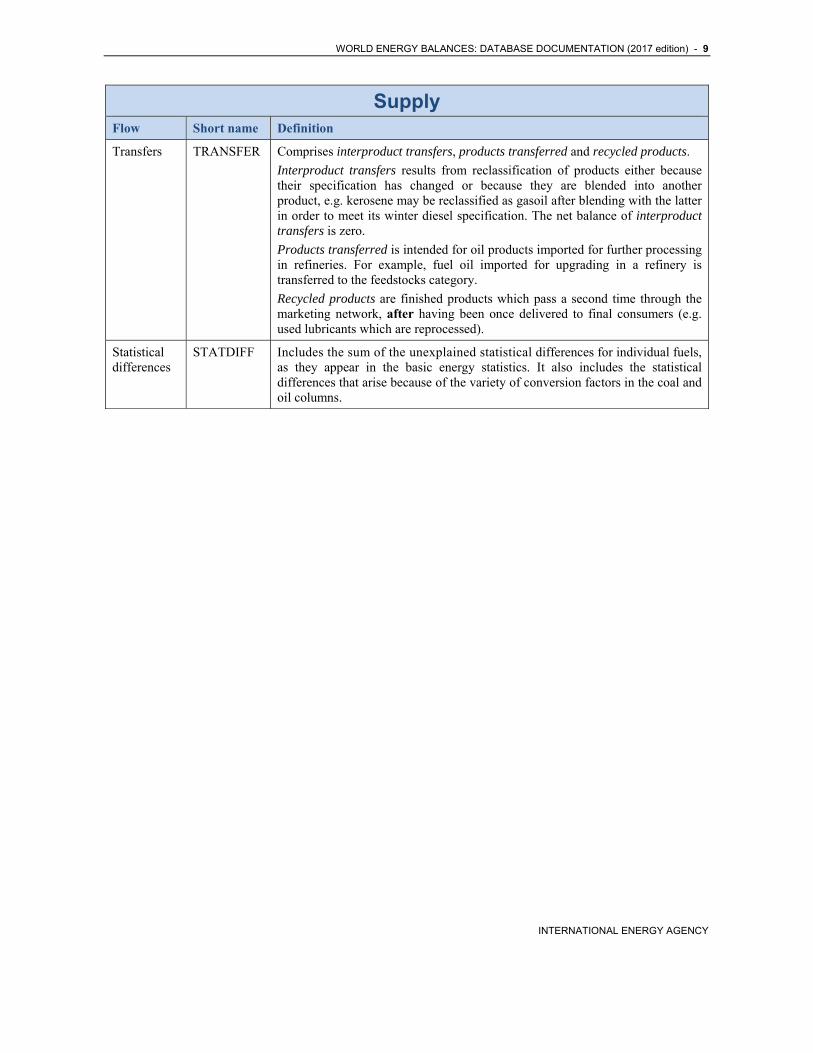
Transfers TRANSFER Comprises interproduct transfers, products transferred and recycled products.
Interproduct transfers results from reclassification of products either because their specification has changed or because they are blended into another product, e.g. kerosene may be reclassified as gasoil after blending with the latter in order to meet its winter diesel specification. The net balance of interproduct transfers is zero.
Products transferred is intended for oil products imported for further processing in refineries. For example, fuel oil imported for upgrading in a refinery is transferred to the feedstocks category.
Recycled products are finished products which pass a second time through the marketing network, after having been once delivered to final consumers (e.g. used lubricants which are reprocessed).
Statistical differences
STATDIFF Includes the sum of the unexplained statistical differences for individual fuels, as they appear in the basic energy statistics. It also includes the statistical differences that arise because of the variety of conversion factors in the coal and oil columns.
10 - WORLD ENERGY BALANCES: DATABASE DOCUMENTATION (2017 edition)
INTERNATIONAL ENERGY AGENCY
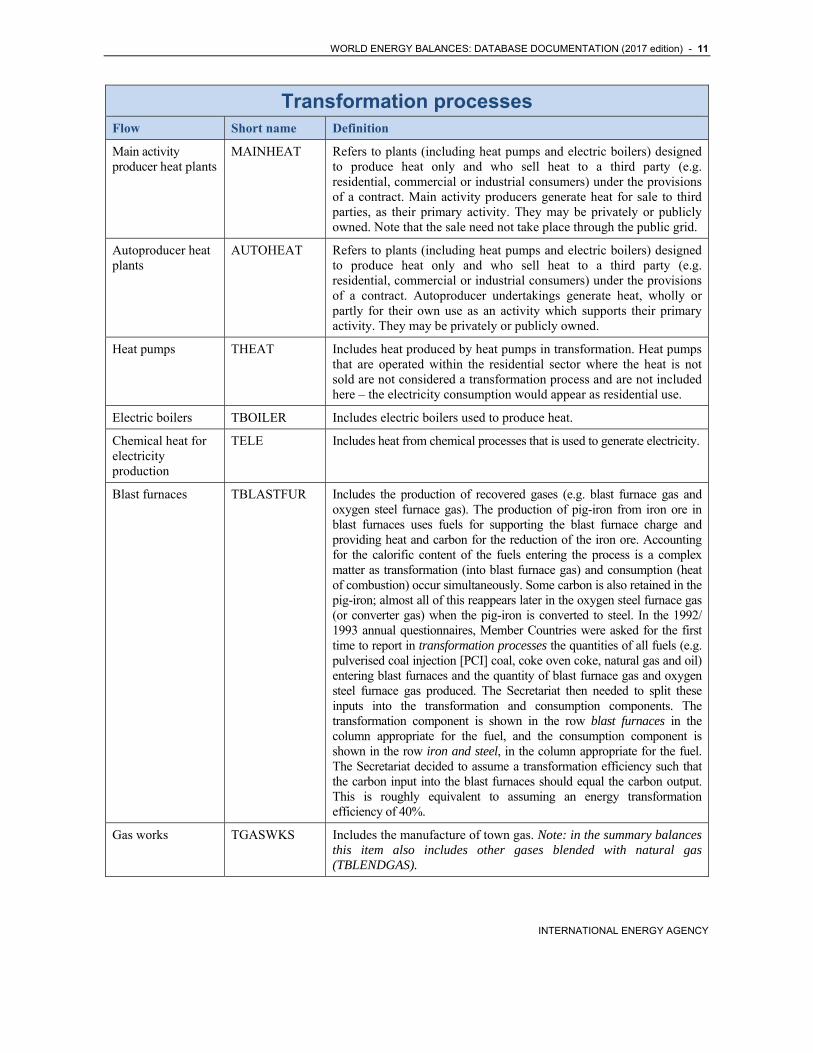
Transformation processes Flow Short name Definition
Transformation processes
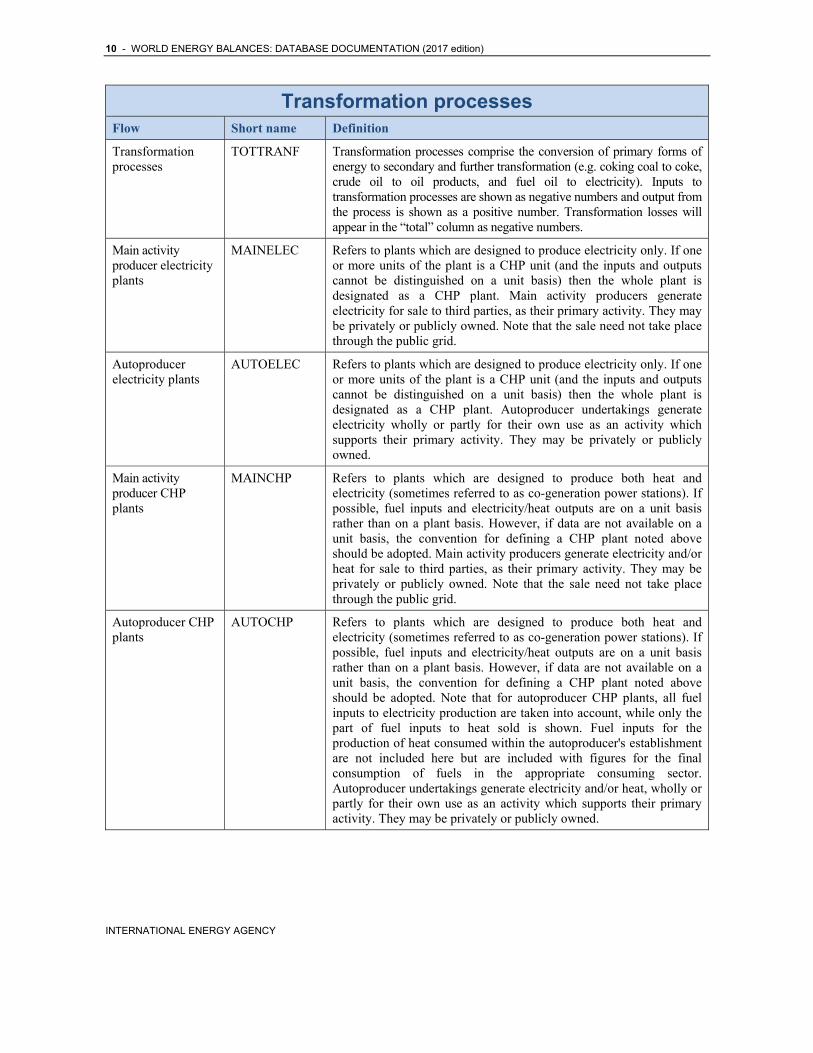
TOTTRANF Transformation processes comprise the conversion of primary forms of energy to secondary and further transformation (e.g. coking coal to coke, crude oil to oil products, and fuel oil to electricity). Inputs to transformation processes are shown as negative numbers and output from the process is shown as a positive number. Transformation losses will appear in the “total” column as negative numbers.
Main activity producer electricity plants
MAINELEC Refers to plants which are designed to produce electricity only. If one or more units of the plant is a CHP unit (and the inputs and outputs cannot be distinguished on a unit basis) then the whole plant is designated as a CHP plant. Main activity producers generate electricity for sale to third parties, as their primary activity. They may be privately or publicly owned. Note that the sale need not take place through the public grid.
Autoproducer electricity plants
AUTOELEC Refers to plants which are designed to produce electricity only. If one or more units of the plant is a CHP unit (and the inputs and outputs cannot be distinguished on a unit basis) then the whole plant is designated as a CHP plant. Autoproducer undertakings generate electricity wholly or partly for their own use as an activity which supports their primary activity. They may be privately or publicly owned.
Main activity producer CHP plants
MAINCHP Refers to plants which are designed to produce both heat and electricity (sometimes referred to as co-generation power stations). If possible, fuel inputs and electricity/heat outputs are on a unit basis rather than on a plant basis. However, if data are not available on a unit basis, the convention for defining a CHP plant noted above should be adopted. Main activity producers generate electricity and/or heat for sale to third parties, as their primary activity. They may be privately or publicly owned. Note that the sale need not take place through the public grid.
Autoproducer CHP plants
AUTOCHP Refers to plants which are designed to produce both heat and electricity (sometimes referred to as co-generation power stations). If possible, fuel inputs and electricity/heat outputs are on a unit basis rather than on a plant basis. However, if data are not available on a unit basis, the convention for defining a CHP plant noted above should be adopted. Note that for autoproducer CHP plants, all fuel inputs to electricity production are taken into account, while only the part of fuel inputs to heat sold is shown. Fuel inputs for the production of heat consumed within the autoproducer's establishment are not included here but are included with figures for the final consumption of fuels in the appropriate consuming sector. Autoproducer undertakings generate electricity and/or heat, wholly or partly for their own use as an activity which supports their primary activity. They may be privately or publicly owned.
WORLD ENERGY BALANCES: DATABASE DOCUMENTATION (2017 edition) - 11
INTERNATIONAL ENERGY AGENCY
Transformation processes Flow Short name Definition
Main activity producer heat plants
MAINHEAT Refers to plants (including heat pumps and electric boilers) designed to produce heat only and who sell heat to a third party (e.g. residential, commercial or industrial consumers) under the provisions of a contract. Main activity producers generate heat for sale to third parties, as their primary activity. They may be privately or publicly owned. Note that the sale need not take place through the public grid.
Autoproducer heat plants
AUTOHEAT Refers to plants (including heat pumps and electric boilers) designed to produce heat only and who sell heat to a third party (e.g. residential, commercial or industrial consumers) under the provisions of a contract. Autoproducer undertakings generate heat, wholly or partly for their own use as an activity which supports their primary activity. They may be privately or publicly owned.
Heat pumps THEAT Includes heat produced by heat pumps in transformation. Heat pumps that are operated within the residential sector where the heat is not sold are not considered a transformation process and are not included here – the electricity consumption would appear as residential use.
Electric boilers TBOILER Includes electric boilers used to produce heat.
Chemical heat for electricity production
TELE Includes heat from chemical processes that is used to generate electricity.
Blast furnaces TBLASTFUR Includes the production of recovered gases (e.g. blast furnace gas and oxygen steel furnace gas). The production of pig-iron from iron ore in blast furnaces uses fuels for supporting the blast furnace charge and providing heat and carbon for the reduction of the iron ore. Accounting for the calorific content of the fuels entering the process is a complex matter as transformation (into blast furnace gas) and consumption (heat of combustion) occur simultaneously. Some carbon is also retained in the pig-iron; almost all of this reappears later in the oxygen steel furnace gas (or converter gas) when the pig-iron is converted to steel. In the 1992/1993 annual questionnaires, Member Countries were asked for the first time to report in transformation processes the quantities of all fuels (e.g. pulverised coal injection [PCI] coal, coke oven coke, natural gas and oil) entering blast furnaces and the quantity of blast furnace gas and oxygen steel furnace gas produced. The Secretariat then needed to split these inputs into the transformation and consumption components. The transformation component is shown in the row blast furnaces in the column appropriate for the fuel, and the consumption component is shown in the row iron and steel, in the column appropriate for the fuel. The Secretariat decided to assume a transformation efficiency such that the carbon input into the blast furnaces should equal the carbon output. This is roughly equivalent to assuming an energy transformation efficiency of 40%.
Gas works TGASWKS Includes the manufacture of town gas. Note: in the summary balances this item also includes other gases blended with natural gas (TBLENDGAS).
12 - WORLD ENERGY BALANCES: DATABASE DOCUMENTATION (2017 edition)
INTERNATIONAL ENERGY AGENCY
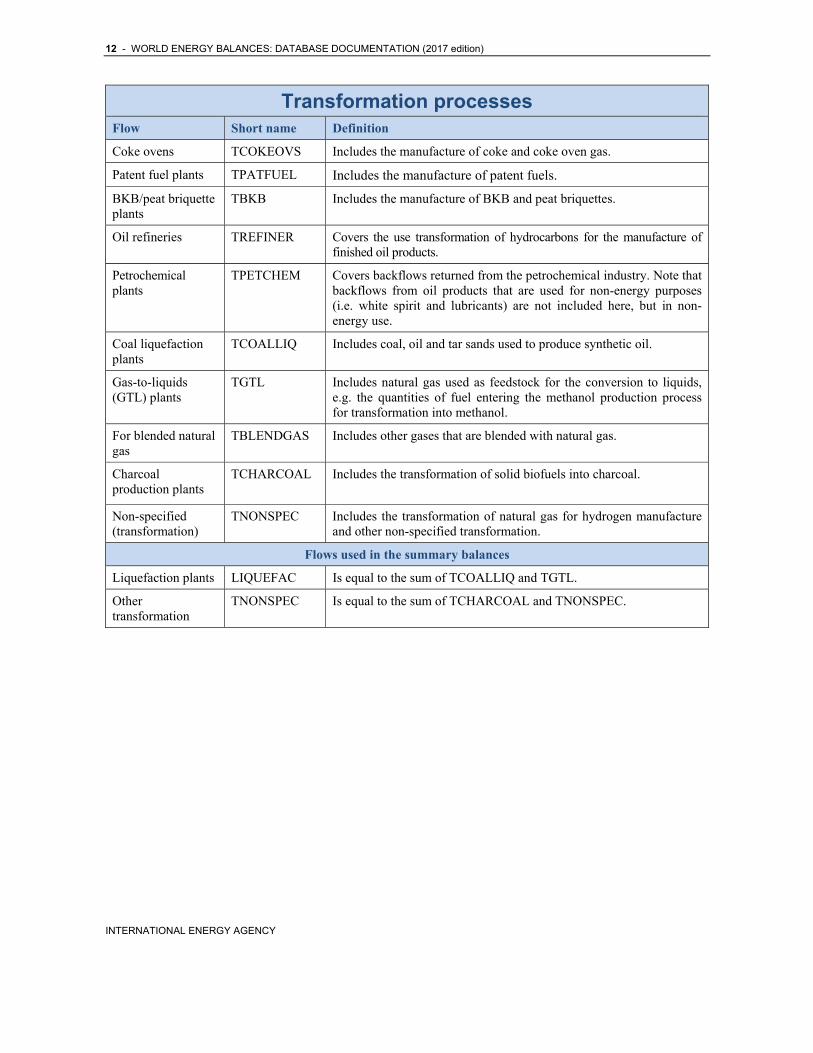
Transformation processes Flow Short name Definition
Coke ovens TCOKEOVS Includes the manufacture of coke and coke oven gas.
Patent fuel plants TPATFUEL Includes the manufacture of patent fuels.
BKB/peat briquette plants
TBKB Includes the manufacture of BKB and peat briquettes.
Oil refineries TREFINER Covers the use transformation of hydrocarbons for the manufacture of finished oil products.
Petrochemical plants
TPETCHEM Covers backflows returned from the petrochemical industry. Note that backflows from oil products that are used for non-energy purposes (i.e. white spirit and lubricants) are not included here, but in non-energy use.
Coal liquefaction plants
TCOALLIQ Includes coal, oil and tar sands used to produce synthetic oil.
Gas-to-liquids (GTL) plants
TGTL Includes natural gas used as feedstock for the conversion to liquids, e.g. the quantities of fuel entering the methanol production process for transformation into methanol.
For blended natural gas
TBLENDGAS Includes other gases that are blended with natural gas.
Charcoal production plants
TCHARCOAL Includes the transformation of solid biofuels into charcoal.
Non-specified (transformation)
TNONSPEC Includes the transformation of natural gas for hydrogen manufacture and other non-specified transformation.
Flows used in the summary balances
Liquefaction plants LIQUEFAC Is equal to the sum of TCOALLIQ and TGTL.
Other transformation
TNONSPEC Is equal to the sum of TCHARCOAL and TNONSPEC.
WORLD ENERGY BALANCES: DATABASE DOCUMENTATION (2017 edition) - 13
INTERNATIONAL ENERGY AGENCY
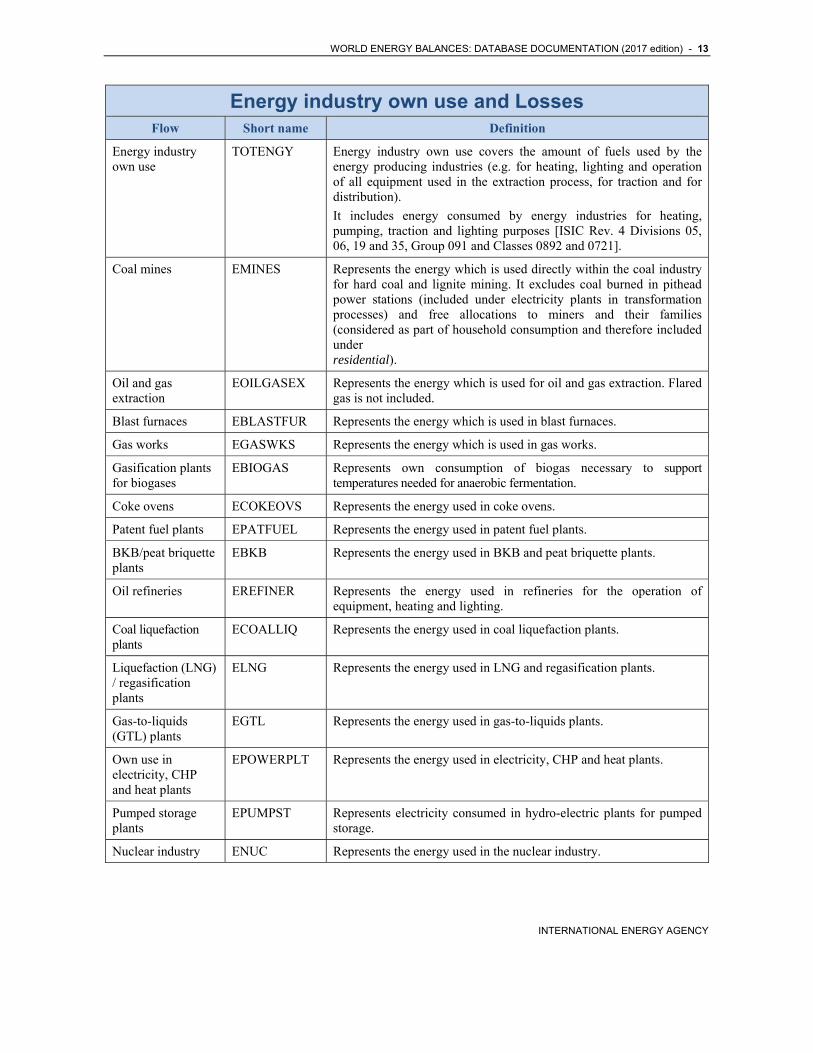
Energy industry own use and Losses Flow Short name Definition
Energy industry own use
TOTENGY Energy industry own use covers the amount of fuels used by the energy producing industries (e.g. for heating, lighting and operation of all equipment used in the extraction process, for traction and for distribution).
It includes energy consumed by energy industries for heating, pumping, traction and lighting purposes [ISIC Rev. 4 Divisions 05, 06, 19 and 35, Group 091 and Classes 0892 and 0721].
Coal mines EMINES Represents the energy which is used directly within the coal industry for hard coal and lignite mining. It excludes coal burned in pithead power stations (included under electricity plants in transformation processes) and free allocations to miners and their families (considered as part of household consumption and therefore included under residential).
Oil and gas extraction
EOILGASEX Represents the energy which is used for oil and gas extraction. Flared gas is not included.
Blast furnaces EBLASTFUR Represents the energy which is used in blast furnaces.
Gas works EGASWKS Represents the energy which is used in gas works.
Gasification plants for biogases
EBIOGAS Represents own consumption of biogas necessary to support temperatures needed for anaerobic fermentation.
Coke ovens ECOKEOVS Represents the energy used in coke ovens.
Patent fuel plants EPATFUEL Represents the energy used in patent fuel plants.
BKB/peat briquette plants
EBKB Represents the energy used in BKB and peat briquette plants.
Oil refineries EREFINER Represents the energy used in refineries for the operation of equipment, heating and lighting.
Coal liquefaction plants
ECOALLIQ Represents the energy used in coal liquefaction plants.
Liquefaction (LNG) / regasification plants
ELNG Represents the energy used in LNG and regasification plants.
Gas-to-liquids (GTL) plants
EGTL Represents the energy used in gas-to-liquids plants.
Own use in electricity, CHP and heat plants
EPOWERPLT Represents the energy used in electricity, CHP and heat plants.
Pumped storage plants
EPUMPST Represents electricity consumed in hydro-electric plants for pumped storage.
Nuclear industry ENUC Represents the energy used in the nuclear industry.
14 - WORLD ENERGY BALANCES: DATABASE DOCUMENTATION (2017 edition)
INTERNATIONAL ENERGY AGENCY
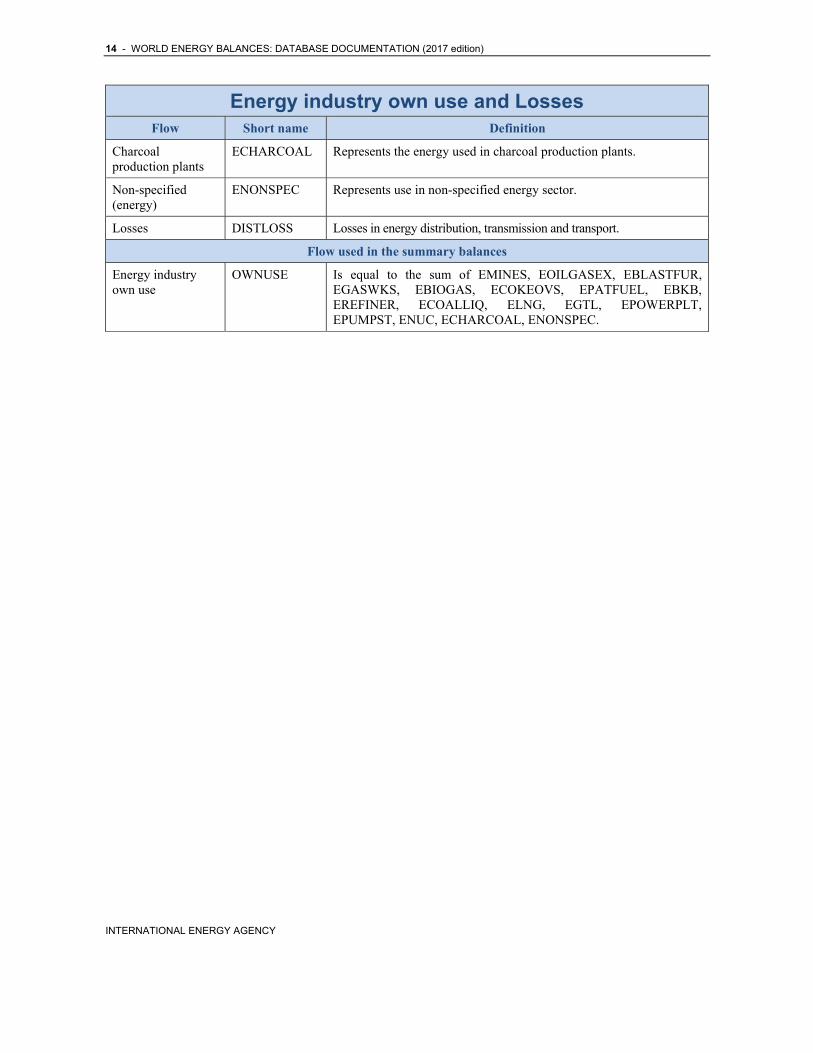
Energy industry own use and Losses Flow Short name Definition
Charcoal production plants
ECHARCOAL Represents the energy used in charcoal production plants.
Non-specified (energy)
ENONSPEC Represents use in non-specified energy sector.
Losses DISTLOSS Losses in energy distribution, transmission and transport.
Flow used in the summary balances
Energy industry own use
OWNUSE Is equal to the sum of EMINES, EOILGASEX, EBLASTFUR, EGASWKS, EBIOGAS, ECOKEOVS, EPATFUEL, EBKB, EREFINER, ECOALLIQ, ELNG, EGTL, EPOWERPLT, EPUMPST, ENUC, ECHARCOAL, ENONSPEC.
WORLD ENERGY BALANCES: DATABASE DOCUMENTATION (2017 edition) - 15
INTERNATIONAL ENERGY AGENCY
Final consumption Flow Short name Definition
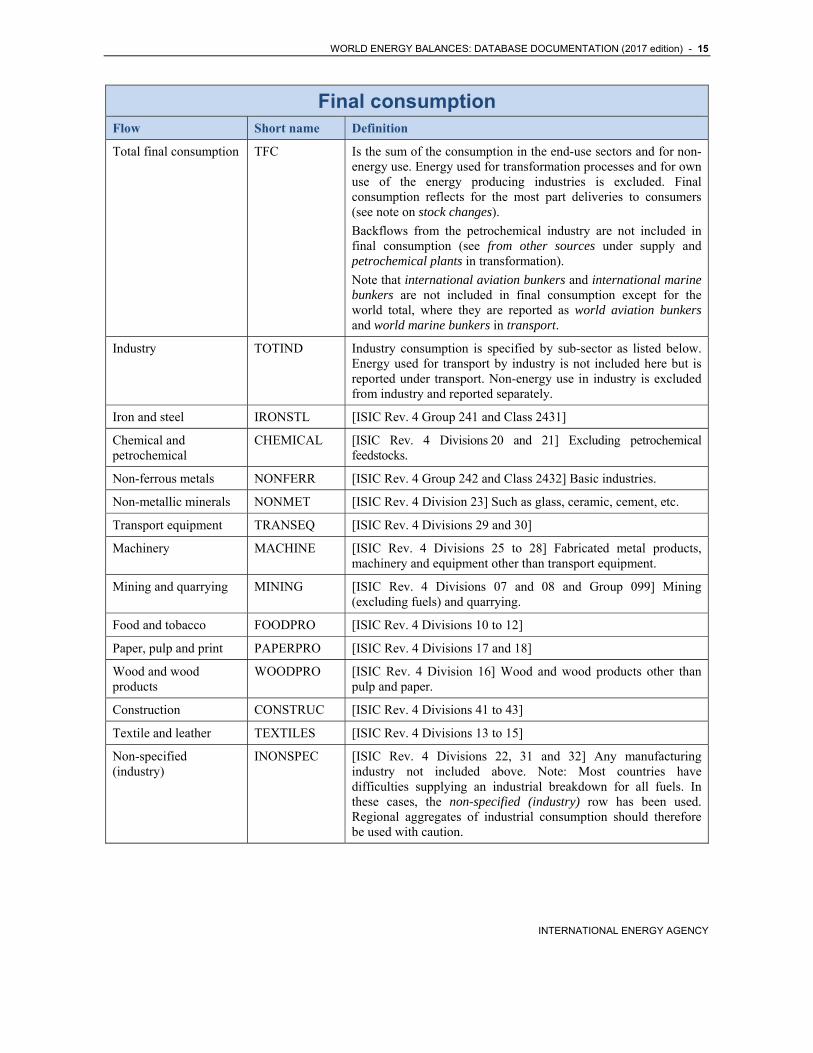
Total final consumption TFC Is the sum of the consumption in the end-use sectors and for non-energy use. Energy used for transformation processes and for own use of the energy producing industries is excluded. Final consumption reflects for the most part deliveries to consumers (see note on stock changes).
Backflows from the petrochemical industry are not included in final consumption (see from other sources under supply and petrochemical plants in transformation).
Note that international aviation bunkers and international marine bunkers are not included in final consumption except for the world total, where they are reported as world aviation bunkers and world marine bunkers in transport.
Industry TOTIND Industry consumption is specified by sub-sector as listed below. Energy used for transport by industry is not included here but is reported under transport. Non-energy use in industry is excluded from industry and reported separately.
Iron and steel IRONSTL [ISIC Rev. 4 Group 241 and Class 2431]
Chemical and petrochemical
CHEMICAL [ISIC Rev. 4 Divisions 20 and 21] Excluding petrochemical feedstocks.
Non-ferrous metals NONFERR [ISIC Rev. 4 Group 242 and Class 2432] Basic industries.
Non-metallic minerals NONMET [ISIC Rev. 4 Division 23] Such as glass, ceramic, cement, etc.
Transport equipment TRANSEQ [ISIC Rev. 4 Divisions 29 and 30]
Machinery MACHINE [ISIC Rev. 4 Divisions 25 to 28] Fabricated metal products, machinery and equipment other than transport equipment.
Mining and quarrying MINING [ISIC Rev. 4 Divisions 07 and 08 and Group 099] Mining (excluding fuels) and quarrying.
Food and tobacco FOODPRO [ISIC Rev. 4 Divisions 10 to 12]
Paper, pulp and print PAPERPRO [ISIC Rev. 4 Divisions 17 and 18]
Wood and wood products
WOODPRO [ISIC Rev. 4 Division 16] Wood and wood products other than pulp and paper.
Construction CONSTRUC [ISIC Rev. 4 Divisions 41 to 43]
Textile and leather TEXTILES [ISIC Rev. 4 Divisions 13 to 15]
Non-specified (industry)
INONSPEC [ISIC Rev. 4 Divisions 22, 31 and 32] Any manufacturing industry not included above. Note: Most countries have difficulties supplying an industrial breakdown for all fuels. In these cases, the non-specified (industry) row has been used. Regional aggregates of industrial consumption should therefore be used with caution.
16 - WORLD ENERGY BALANCES: DATABASE DOCUMENTATION (2017 edition)
INTERNATIONAL ENERGY AGENCY
Final consumption Flow Short name Definition
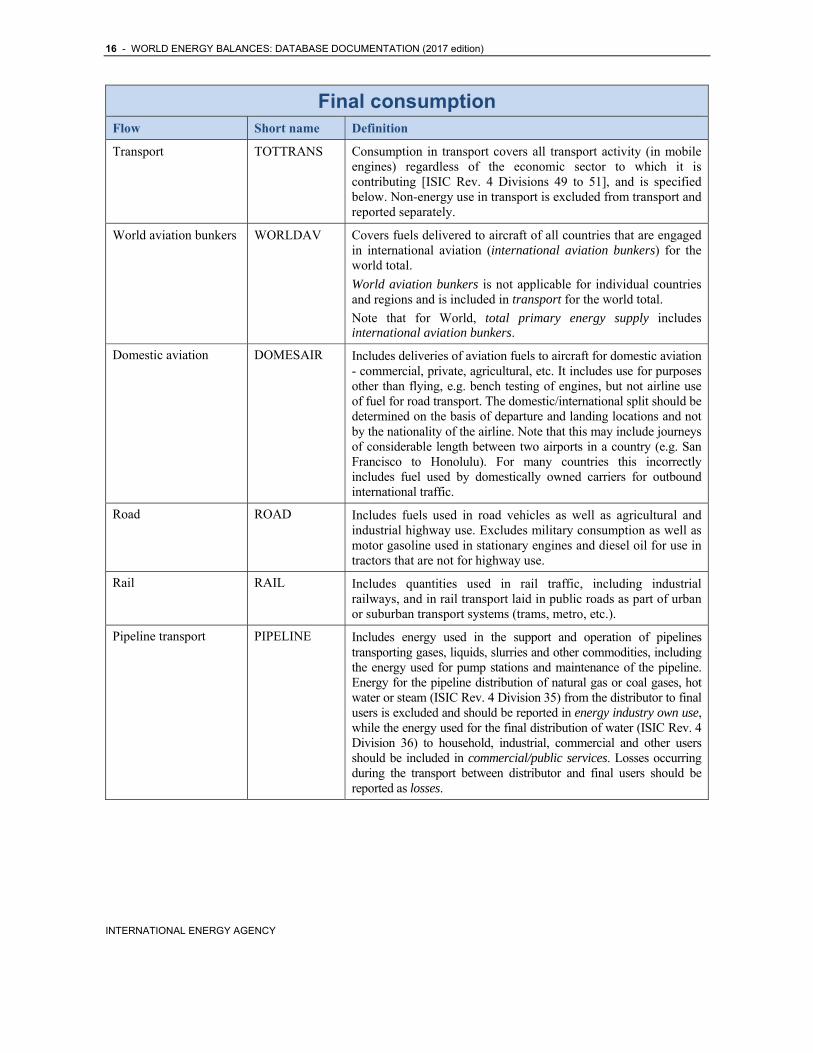
Transport TOTTRANS Consumption in transport covers all transport activity (in mobile engines) regardless of the economic sector to which it is contributing [ISIC Rev. 4 Divisions 49 to 51], and is specified below. Non-energy use in transport is excluded from transport and reported separately.
World aviation bunkers WORLDAV Covers fuels delivered to aircraft of all countries that are engaged in international aviation (international aviation bunkers) for the world total.
World aviation bunkers is not applicable for individual countries and regions and is included in transport for the world total.
Note that for World, total primary energy supply includes international aviation bunkers.
Domestic aviation DOMESAIR Includes deliveries of aviation fuels to aircraft for domestic aviation - commercial, private, agricultural, etc. It includes use for purposes other than flying, e.g. bench testing of engines, but not airline use of fuel for road transport. The domestic/international split should be determined on the basis of departure and landing locations and not by the nationality of the airline. Note that this may include journeys of considerable length between two airports in a country (e.g. San Francisco to Honolulu). For many countries this incorrectly includes fuel used by domestically owned carriers for outbound international traffic.
Road ROAD Includes fuels used in road vehicles as well as agricultural and industrial highway use. Excludes military consumption as well as motor gasoline used in stationary engines and diesel oil for use in tractors that are not for highway use.
Rail RAIL Includes quantities used in rail traffic, including industrial railways, and in rail transport laid in public roads as part of urban or suburban transport systems (trams, metro, etc.).
Pipeline transport PIPELINE Includes energy used in the support and operation of pipelines transporting gases, liquids, slurries and other commodities, including the energy used for pump stations and maintenance of the pipeline. Energy for the pipeline distribution of natural gas or coal gases, hot water or steam (ISIC Rev. 4 Division 35) from the distributor to final users is excluded and should be reported in energy industry own use, while the energy used for the final distribution of water (ISIC Rev. 4 Division 36) to household, industrial, commercial and other users should be included in commercial/public services. Losses occurring during the transport between distributor and final users should be reported as losses.
WORLD ENERGY BALANCES: DATABASE DOCUMENTATION (2017 edition) - 17
INTERNATIONAL ENERGY AGENCY
Final consumption Flow Short name Definition
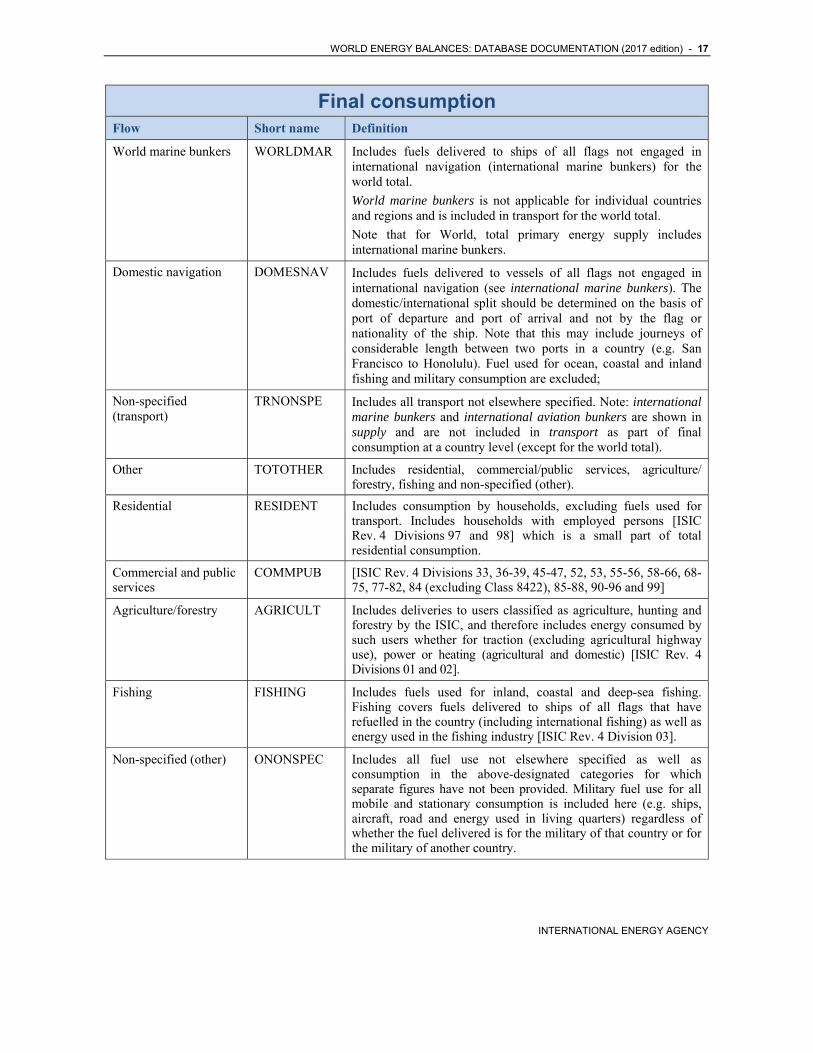
World marine bunkers WORLDMAR Includes fuels delivered to ships of all flags not engaged in international navigation (international marine bunkers) for the world total.
World marine bunkers is not applicable for individual countries and regions and is included in transport for the world total.
Note that for World, total primary energy supply includes international marine bunkers.
Domestic navigation DOMESNAV Includes fuels delivered to vessels of all flags not engaged in international navigation (see international marine bunkers). The domestic/international split should be determined on the basis of port of departure and port of arrival and not by the flag or nationality of the ship. Note that this may include journeys of considerable length between two ports in a country (e.g. San Francisco to Honolulu). Fuel used for ocean, coastal and inland fishing and military consumption are excluded;
Non-specified (transport)
TRNONSPE Includes all transport not elsewhere specified. Note: international marine bunkers and international aviation bunkers are shown in supply and are not included in transport as part of final consumption at a country level (except for the world total).
Other TOTOTHER Includes residential, commercial/public services, agriculture/forestry, fishing and non-specified (other).
Residential RESIDENT Includes consumption by households, excluding fuels used for transport. Includes households with employed persons [ISIC Rev. 4 Divisions 97 and 98] which is a small part of total residential consumption.
Commercial and public services
COMMPUB [ISIC Rev. 4 Divisions 33, 36-39, 45-47, 52, 53, 55-56, 58-66, 68-75, 77-82, 84 (excluding Class 8422), 85-88, 90-96 and 99]
Agriculture/forestry AGRICULT Includes deliveries to users classified as agriculture, hunting and forestry by the ISIC, and therefore includes energy consumed by such users whether for traction (excluding agricultural highway use), power or heating (agricultural and domestic) [ISIC Rev. 4 Divisions 01 and 02].
Fishing FISHING Includes fuels used for inland, coastal and deep-sea fishing. Fishing covers fuels delivered to ships of all flags that have refuelled in the country (including international fishing) as well as energy used in the fishing industry [ISIC Rev. 4 Division 03].
Non-specified (other) ONONSPEC Includes all fuel use not elsewhere specified as well as consumption in the above-designated categories for which separate figures have not been provided. Military fuel use for all mobile and stationary consumption is included here (e.g. ships, aircraft, road and energy used in living quarters) regardless of whether the fuel delivered is for the military of that country or for the military of another country.
18 - WORLD ENERGY BALANCES: DATABASE DOCUMENTATION (2017 edition)
INTERNATIONAL ENERGY AGENCY
Final consumption Flow Short name Definition
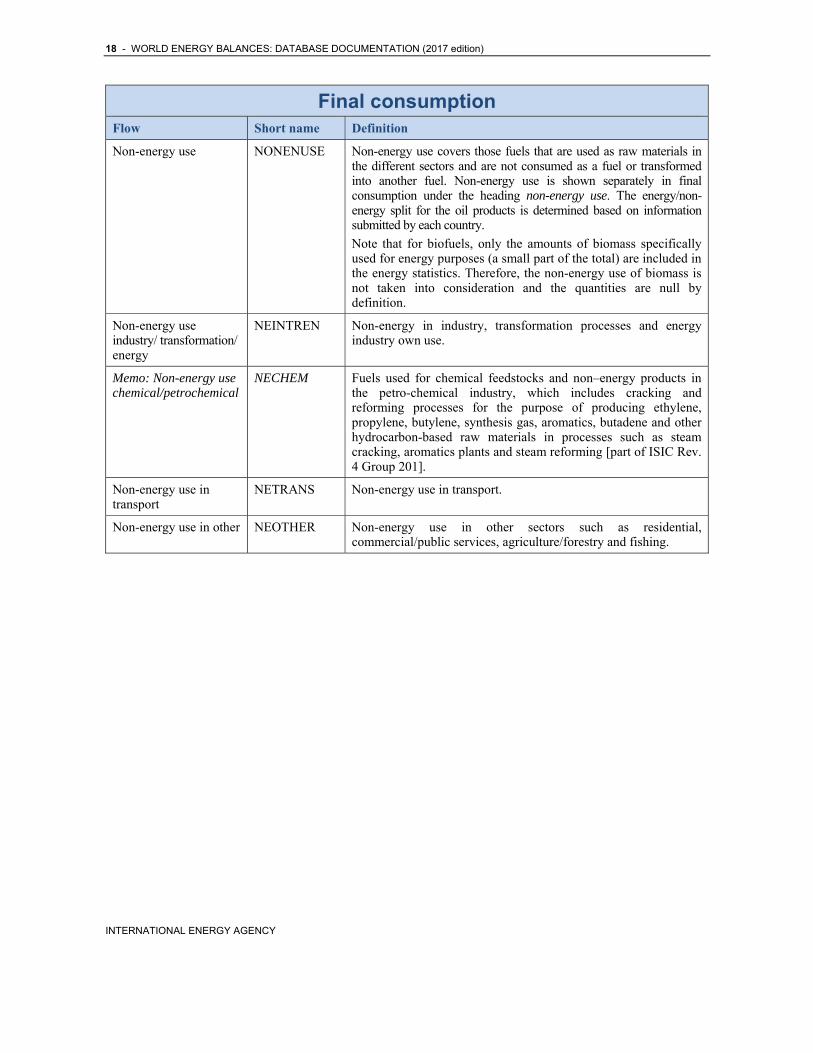
Non-energy use NONENUSE Non-energy use covers those fuels that are used as raw materials in the different sectors and are not consumed as a fuel or transformed into another fuel. Non-energy use is shown separately in final consumption under the heading non-energy use. The energy/non-energy split for the oil products is determined based on information submitted by each country.
Note that for biofuels, only the amounts of biomass specifically used for energy purposes (a small part of the total) are included in the energy statistics. Therefore, the non-energy use of biomass is not taken into consideration and the quantities are null by definition.
Non-energy use industry/ transformation/ energy
NEINTREN Non-energy in industry, transformation processes and energy industry own use.
Memo: Non-energy use chemical/petrochemical
NECHEM Fuels used for chemical feedstocks and non–energy products in the petro-chemical industry, which includes cracking and reforming processes for the purpose of producing ethylene, propylene, butylene, synthesis gas, aromatics, butadene and other hydrocarbon-based raw materials in processes such as steam cracking, aromatics plants and steam reforming [part of ISIC Rev. 4 Group 201].
Non-energy use in transport
NETRANS Non-energy use in transport.
Non-energy use in other NEOTHER Non-energy use in other sectors such as residential, commercial/public services, agriculture/forestry and fishing.
WORLD ENERGY BALANCES: DATABASE DOCUMENTATION (2017 edition) - 19
INTERNATIONAL ENERGY AGENCY
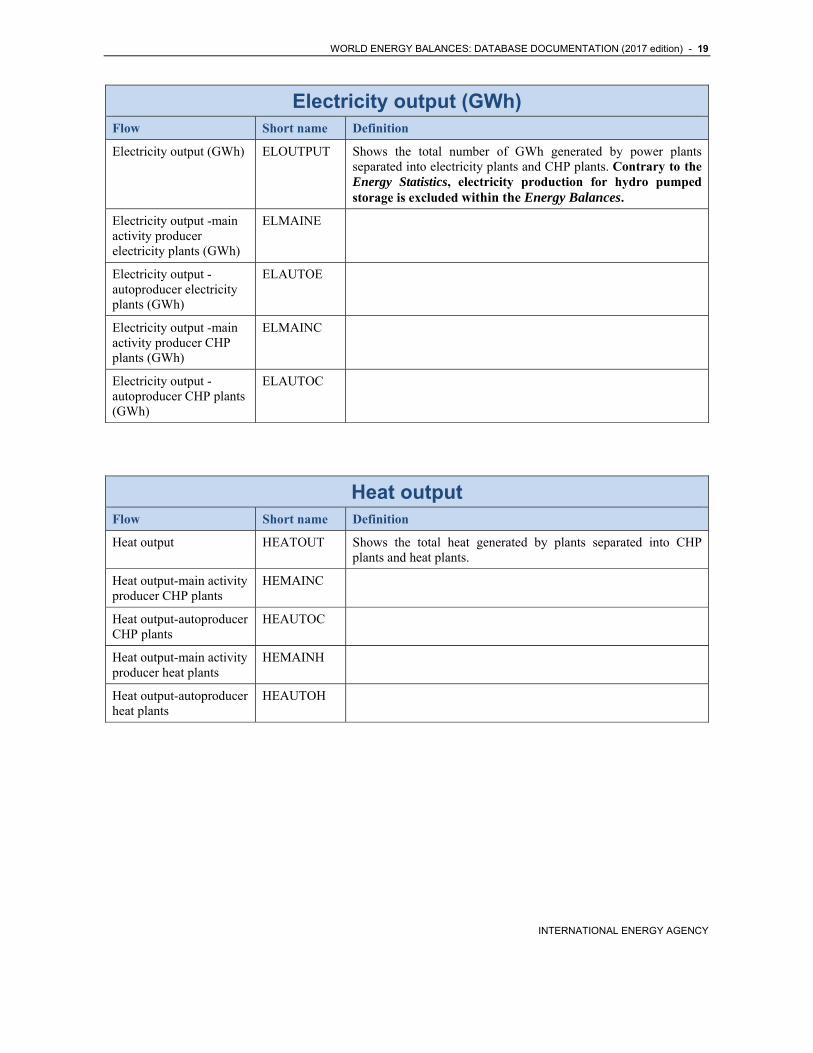
Electricity output (GWh) Flow Short name Definition
Electricity output (GWh) ELOUTPUT Shows the total number of GWh generated by power plants separated into electricity plants and CHP plants. Contrary to the Energy Statistics, electricity production for hydro pumped storage is excluded within the Energy Balances.
Electricity output -main activity producer electricity plants (GWh)
ELMAINE
Electricity output -autoproducer electricity plants (GWh)
ELAUTOE
Electricity output -main activity producer CHP plants (GWh)
ELMAINC
Electricity output -autoproducer CHP plants (GWh)
ELAUTOC
Heat output Flow Short name Definition
Heat output HEATOUT Shows the total heat generated by plants separated into CHP plants and heat plants.
Heat output-main activity producer CHP plants
HEMAINC
Heat output-autoproducer CHP plants
HEAUTOC
Heat output-main activity producer heat plants
HEMAINH
Heat output-autoproducer heat plants
HEAUTOH
20 - WORLD ENERGY BALANCES: DATABASE DOCUMENTATION (2017 edition)
INTERNATIONAL ENERGY AGENCY
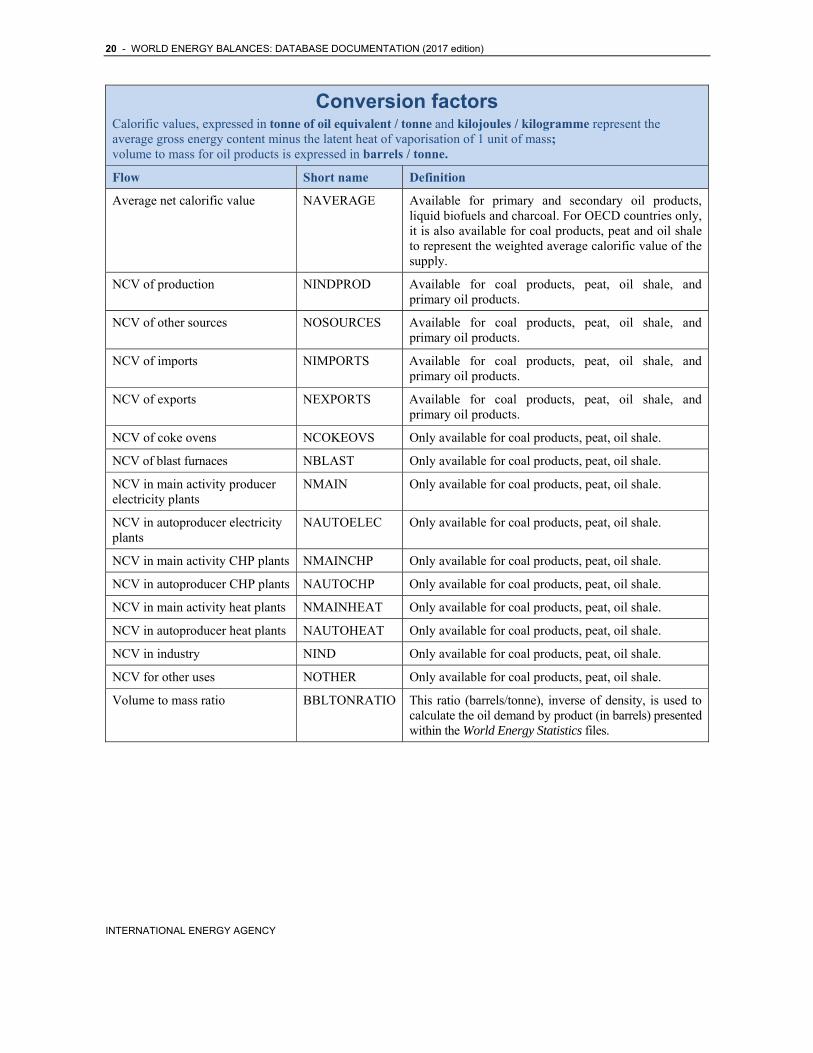
Conversion factors Calorific values, expressed in tonne of oil equivalent / tonne and kilojoules / kilogramme represent the average gross energy content minus the latent heat of vaporisation of 1 unit of mass; volume to mass for oil products is expressed in barrels / tonne. Flow Short name Definition
Average net calorific value NAVERAGE Available for primary and secondary oil products, liquid biofuels and charcoal. For OECD countries only, it is also available for coal products, peat and oil shale to represent the weighted average calorific value of the supply.
NCV of production NINDPROD Available for coal products, peat, oil shale, and primary oil products.
NCV of other sources NOSOURCES Available for coal products, peat, oil shale, and primary oil products.
NCV of imports NIMPORTS Available for coal products, peat, oil shale, and primary oil products.
NCV of exports NEXPORTS Available for coal products, peat, oil shale, and primary oil products.
NCV of coke ovens NCOKEOVS Only available for coal products, peat, oil shale.
NCV of blast furnaces NBLAST Only available for coal products, peat, oil shale.
NCV in main activity producer electricity plants
NMAIN Only available for coal products, peat, oil shale.
NCV in autoproducer electricity plants
NAUTOELEC Only available for coal products, peat, oil shale.
NCV in main activity CHP plants NMAINCHP Only available for coal products, peat, oil shale.
NCV in autoproducer CHP plants NAUTOCHP Only available for coal products, peat, oil shale.
NCV in main activity heat plants NMAINHEAT Only available for coal products, peat, oil shale.
NCV in autoproducer heat plants NAUTOHEAT Only available for coal products, peat, oil shale.
NCV in industry NIND Only available for coal products, peat, oil shale.
NCV for other uses NOTHER Only available for coal products, peat, oil shale.
Volume to mass ratio BBLTONRATIO This ratio (barrels/tonne), inverse of density, is used to calculate the oil demand by product (in barrels) presented within the World Energy Statistics files.
WORLD ENERGY BALANCES: DATABASE DOCUMENTATION (2017 edition) - 21
INTERNATIONAL ENERGY AGENCY
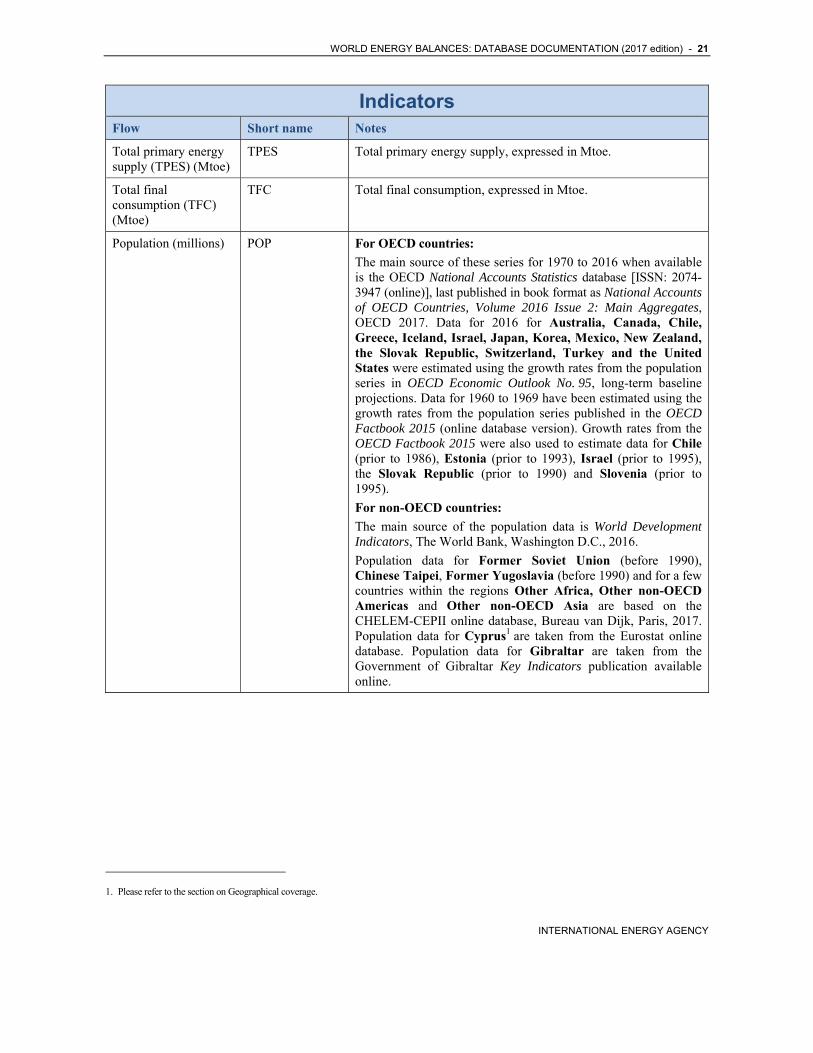
Indicators Flow Short name Notes
Total primary energy supply (TPES) (Mtoe)
TPES Total primary energy supply, expressed in Mtoe.
Total final consumption (TFC) (Mtoe)
TFC Total final consumption, expressed in Mtoe.
Population (millions) POP For OECD countries:
The main source of these series for 1970 to 2016 when available is the OECD National Accounts Statistics database [ISSN: 2074-3947 (online)], last published in book format as National Accounts of OECD Countries, Volume 2016 Issue 2: Main Aggregates, OECD 2017. Data for 2016 for Australia, Canada, Chile, Greece, Iceland, Israel, Japan, Korea, Mexico, New Zealand, the Slovak Republic, Switzerland, Turkey and the United States were estimated using the growth rates from the population series in OECD Economic Outlook No. 95, long-term baseline projections. Data for 1960 to 1969 have been estimated using the growth rates from the population series published in the OECD Factbook 2015 (online database version). Growth rates from the OECD Factbook 2015 were also used to estimate data for Chile (prior to 1986), Estonia (prior to 1993), Israel (prior to 1995), the Slovak Republic (prior to 1990) and Slovenia (prior to 1995).
For non-OECD countries:
The main source of the population data is World Development Indicators, The World Bank, Washington D.C., 2016.
Population data for Former Soviet Union (before 1990), Chinese Taipei, Former Yugoslavia (before 1990) and for a few countries within the regions Other Africa, Other non-OECD Americas and Other non-OECD Asia are based on the CHELEM-CEPII online database, Bureau van Dijk, Paris, 2017. Population data for Cyprus1 are taken from the Eurostat online database. Population data for Gibraltar are taken from the Government of Gibraltar Key Indicators publication available online.
1. Please refer to the section on Geographical coverage.
22 - WORLD ENERGY BALANCES: DATABASE DOCUMENTATION (2017 edition)
INTERNATIONAL ENERGY AGENCY
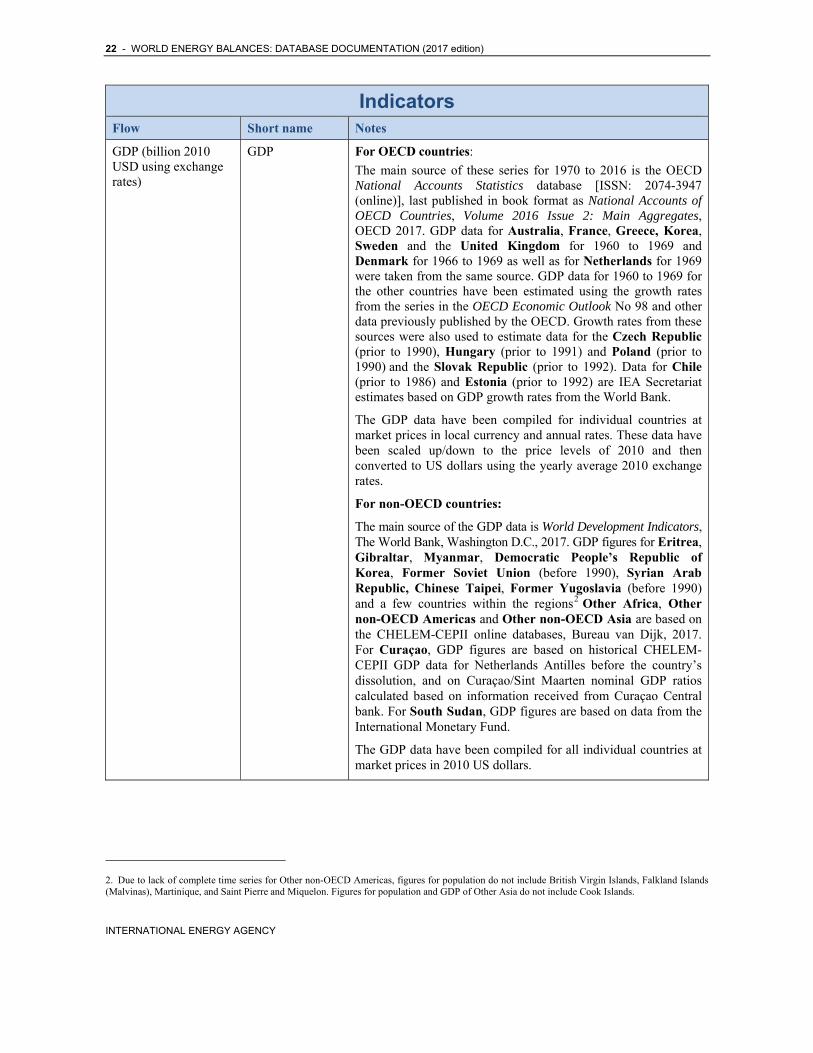
Indicators Flow Short name Notes
GDP (billion 2010 USD using exchange rates)
GDP For OECD countries:
The main source of these series for 1970 to 2016 is the OECD National Accounts Statistics database [ISSN: 2074-3947 (online)], last published in book format as National Accounts of OECD Countries, Volume 2016 Issue 2: Main Aggregates, OECD 2017. GDP data for Australia, France, Greece, Korea, Sweden and the United Kingdom for 1960 to 1969 and Denmark for 1966 to 1969 as well as for Netherlands for 1969 were taken from the same source. GDP data for 1960 to 1969 for the other countries have been estimated using the growth rates from the series in the OECD Economic Outlook No 98 and other data previously published by the OECD. Growth rates from these sources were also used to estimate data for the Czech Republic (prior to 1990), Hungary (prior to 1991) and Poland (prior to 1990) and the Slovak Republic (prior to 1992). Data for Chile (prior to 1986) and Estonia (prior to 1992) are IEA Secretariat estimates based on GDP growth rates from the World Bank.
The GDP data have been compiled for individual countries at market prices in local currency and annual rates. These data have been scaled up/down to the price levels of 2010 and then converted to US dollars using the yearly average 2010 exchange rates.
For non-OECD countries:
The main source of the GDP data is World Development Indicators, The World Bank, Washington D.C., 2017. GDP figures for Eritrea, Gibraltar, Myanmar, Democratic People’s Republic of Korea, Former Soviet Union (before 1990), Syrian Arab Republic, Chinese Taipei, Former Yugoslavia (before 1990) and a few countries within the regions2 Other Africa, Other non-OECD Americas and Other non-OECD Asia are based on the CHELEM-CEPII online databases, Bureau van Dijk, 2017. For Curaçao, GDP figures are based on historical CHELEM-CEPII GDP data for Netherlands Antilles before the country’s dissolution, and on Curaçao/Sint Maarten nominal GDP ratios calculated based on information received from Curaçao Central bank. For South Sudan, GDP figures are based on data from the International Monetary Fund.
The GDP data have been compiled for all individual countries at market prices in 2010 US dollars.
2. Due to lack of complete time series for Other non-OECD Americas, figures for population do not include British Virgin Islands, Falkland Islands (Malvinas), Martinique, and Saint Pierre and Miquelon. Figures for population and GDP of Other Asia do not include Cook Islands.
WORLD ENERGY BALANCES: DATABASE DOCUMENTATION (2017 edition) - 23
INTERNATIONAL ENERGY AGENCY
Indicators Flow Short name Notes
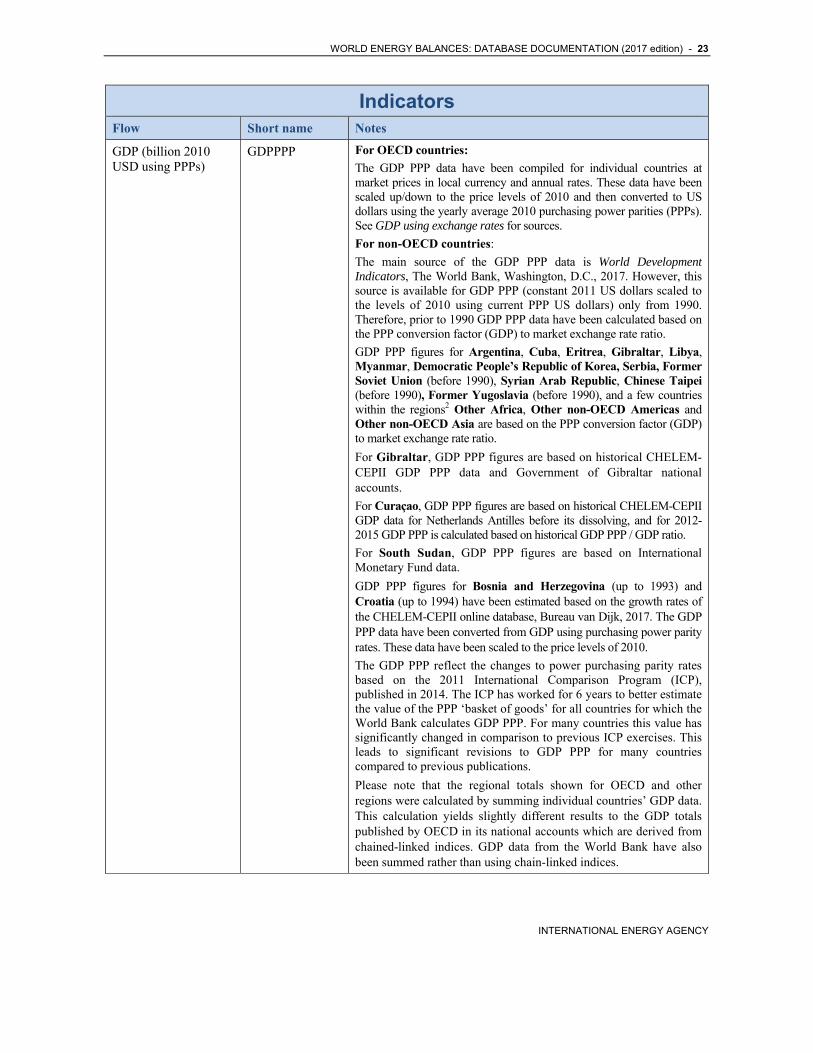
GDP (billion 2010 USD using PPPs)
GDPPPP For OECD countries:
The GDP PPP data have been compiled for individual countries at market prices in local currency and annual rates. These data have been scaled up/down to the price levels of 2010 and then converted to US dollars using the yearly average 2010 purchasing power parities (PPPs). See GDP using exchange rates for sources.
For non-OECD countries:
The main source of the GDP PPP data is World Development Indicators, The World Bank, Washington, D.C., 2017. However, this source is available for GDP PPP (constant 2011 US dollars scaled to the levels of 2010 using current PPP US dollars) only from 1990. Therefore, prior to 1990 GDP PPP data have been calculated based on the PPP conversion factor (GDP) to market exchange rate ratio.
GDP PPP figures for Argentina, Cuba, Eritrea, Gibraltar, Libya, Myanmar, Democratic People’s Republic of Korea, Serbia, Former Soviet Union (before 1990), Syrian Arab Republic, Chinese Taipei (before 1990), Former Yugoslavia (before 1990), and a few countries within the regions2 Other Africa, Other non-OECD Americas and Other non-OECD Asia are based on the PPP conversion factor (GDP) to market exchange rate ratio.
For Gibraltar, GDP PPP figures are based on historical CHELEM-CEPII GDP PPP data and Government of Gibraltar national accounts.
For Curaçao, GDP PPP figures are based on historical CHELEM-CEPII GDP data for Netherlands Antilles before its dissolving, and for 2012-2015 GDP PPP is calculated based on historical GDP PPP / GDP ratio.
For South Sudan, GDP PPP figures are based on International Monetary Fund data.
GDP PPP figures for Bosnia and Herzegovina (up to 1993) and Croatia (up to 1994) have been estimated based on the growth rates of the CHELEM-CEPII online database, Bureau van Dijk, 2017. The GDP PPP data have been converted from GDP using purchasing power parity rates. These data have been scaled to the price levels of 2010.
The GDP PPP reflect the changes to power purchasing parity rates based on the 2011 International Comparison Program (ICP), published in 2014. The ICP has worked for 6 years to better estimate the value of the PPP ‘basket of goods’ for all countries for which the World Bank calculates GDP PPP. For many countries this value has significantly changed in comparison to previous ICP exercises. This leads to significant revisions to GDP PPP for many countries compared to previous publications.
Please note that the regional totals shown for OECD and other regions were calculated by summing individual countries’ GDP data. This calculation yields slightly different results to the GDP totals published by OECD in its national accounts which are derived from chained-linked indices. GDP data from the World Bank have also been summed rather than using chain-linked indices.
24 - WORLD ENERGY BALANCES: DATABASE DOCUMENTATION (2017 edition)
INTERNATIONAL ENERGY AGENCY
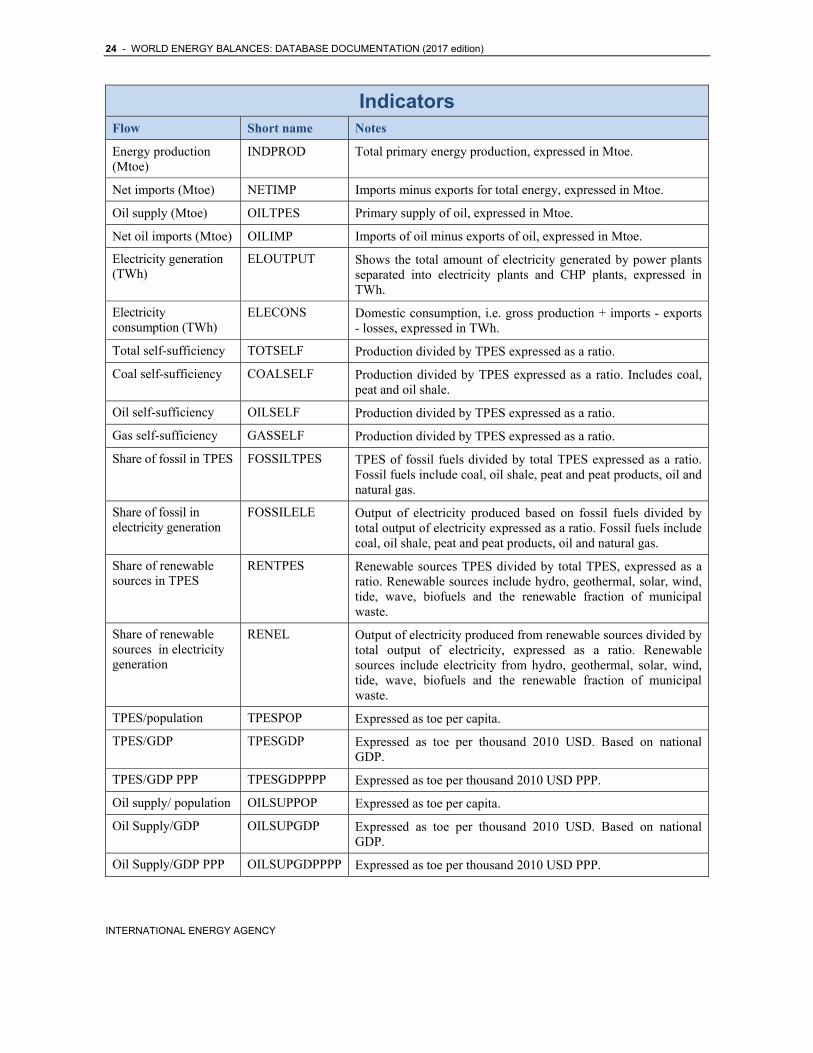
Indicators Flow Short name Notes
Energy production (Mtoe)
INDPROD Total primary energy production, expressed in Mtoe.
Net imports (Mtoe) NETIMP Imports minus exports for total energy, expressed in Mtoe.
Oil supply (Mtoe) OILTPES Primary supply of oil, expressed in Mtoe.
Net oil imports (Mtoe) OILIMP Imports of oil minus exports of oil, expressed in Mtoe.
Electricity generation (TWh)
ELOUTPUT Shows the total amount of electricity generated by power plants separated into electricity plants and CHP plants, expressed in TWh.
Electricity consumption (TWh)
ELECONS Domestic consumption, i.e. gross production + imports - exports - losses, expressed in TWh.
Total self-sufficiency TOTSELF Production divided by TPES expressed as a ratio.
Coal self-sufficiency COALSELF Production divided by TPES expressed as a ratio. Includes coal, peat and oil shale.
Oil self-sufficiency OILSELF Production divided by TPES expressed as a ratio.
Gas self-sufficiency GASSELF Production divided by TPES expressed as a ratio.
Share of fossil in TPES FOSSILTPES TPES of fossil fuels divided by total TPES expressed as a ratio. Fossil fuels include coal, oil shale, peat and peat products, oil and natural gas.
Share of fossil in electricity generation
FOSSILELE Output of electricity produced based on fossil fuels divided by total output of electricity expressed as a ratio. Fossil fuels include coal, oil shale, peat and peat products, oil and natural gas.
Share of renewable sources in TPES
RENTPES Renewable sources TPES divided by total TPES, expressed as a ratio. Renewable sources include hydro, geothermal, solar, wind, tide, wave, biofuels and the renewable fraction of municipal waste.
Share of renewable sources in electricity generation
RENEL Output of electricity produced from renewable sources divided by total output of electricity, expressed as a ratio. Renewable sources include electricity from hydro, geothermal, solar, wind, tide, wave, biofuels and the renewable fraction of municipal waste.
TPES/population TPESPOP Expressed as toe per capita.
TPES/GDP TPESGDP Expressed as toe per thousand 2010 USD. Based on national GDP.
TPES/GDP PPP TPESGDPPPP Expressed as toe per thousand 2010 USD PPP.
Oil supply/ population OILSUPPOP Expressed as toe per capita.
Oil Supply/GDP OILSUPGDP Expressed as toe per thousand 2010 USD. Based on national GDP.
Oil Supply/GDP PPP OILSUPGDPPPP Expressed as toe per thousand 2010 USD PPP.
WORLD ENERGY BALANCES: DATABASE DOCUMENTATION (2017 edition) - 25
INTERNATIONAL ENERGY AGENCY
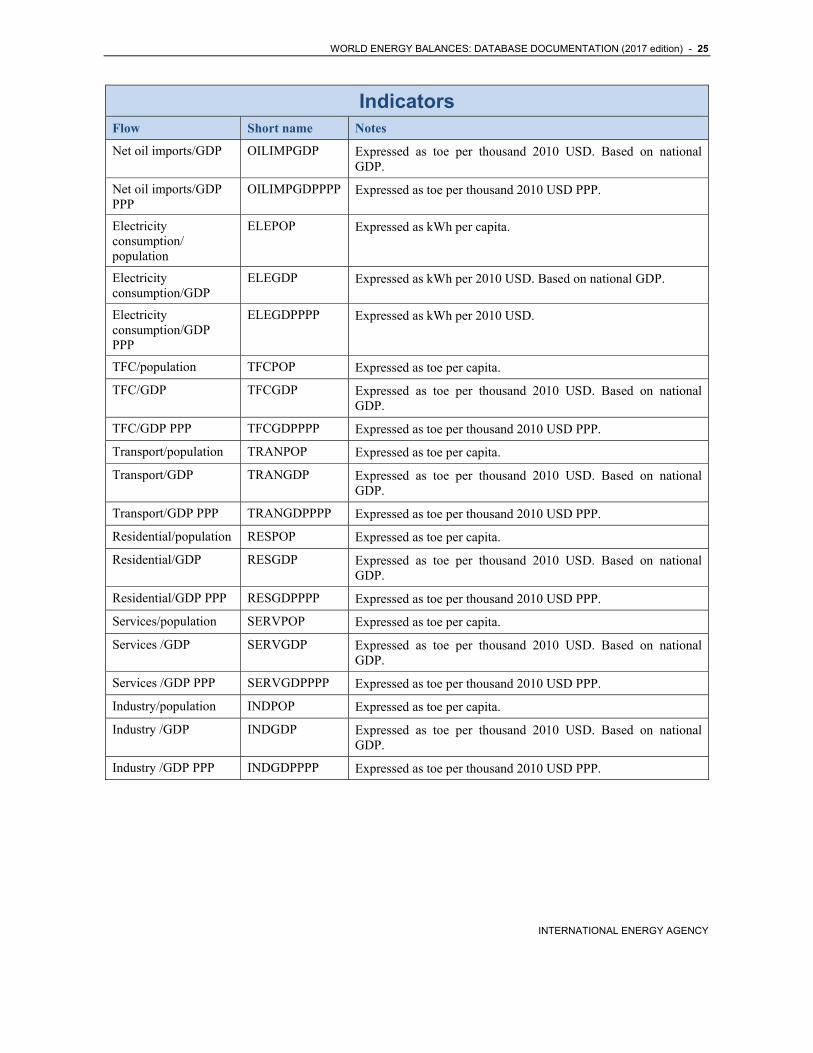
Indicators Flow Short name Notes
Net oil imports/GDP OILIMPGDP Expressed as toe per thousand 2010 USD. Based on national GDP.
Net oil imports/GDP PPP
OILIMPGDPPPP Expressed as toe per thousand 2010 USD PPP.
Electricity consumption/population
ELEPOP Expressed as kWh per capita.
Electricity consumption/GDP
ELEGDP Expressed as kWh per 2010 USD. Based on national GDP.
Electricity consumption/GDP PPP
ELEGDPPPP Expressed as kWh per 2010 USD.
TFC/population TFCPOP Expressed as toe per capita.
TFC/GDP TFCGDP Expressed as toe per thousand 2010 USD. Based on national GDP.
TFC/GDP PPP TFCGDPPPP Expressed as toe per thousand 2010 USD PPP.
Transport/population TRANPOP Expressed as toe per capita.
Transport/GDP TRANGDP Expressed as toe per thousand 2010 USD. Based on national GDP.
Transport/GDP PPP TRANGDPPPP Expressed as toe per thousand 2010 USD PPP.
Residential/population RESPOP Expressed as toe per capita.
Residential/GDP RESGDP Expressed as toe per thousand 2010 USD. Based on national GDP.
Residential/GDP PPP RESGDPPPP Expressed as toe per thousand 2010 USD PPP.
Services/population SERVPOP Expressed as toe per capita.
Services /GDP SERVGDP Expressed as toe per thousand 2010 USD. Based on national GDP.
Services /GDP PPP SERVGDPPPP Expressed as toe per thousand 2010 USD PPP.
Industry/population INDPOP Expressed as toe per capita.
Industry /GDP INDGDP Expressed as toe per thousand 2010 USD. Based on national GDP.
Industry /GDP PPP INDGDPPPP Expressed as toe per thousand 2010 USD PPP.
26 - WORLD ENERGY BALANCES: DATABASE DOCUMENTATION (2017 edition)
INTERNATIONAL ENERGY AGENCY
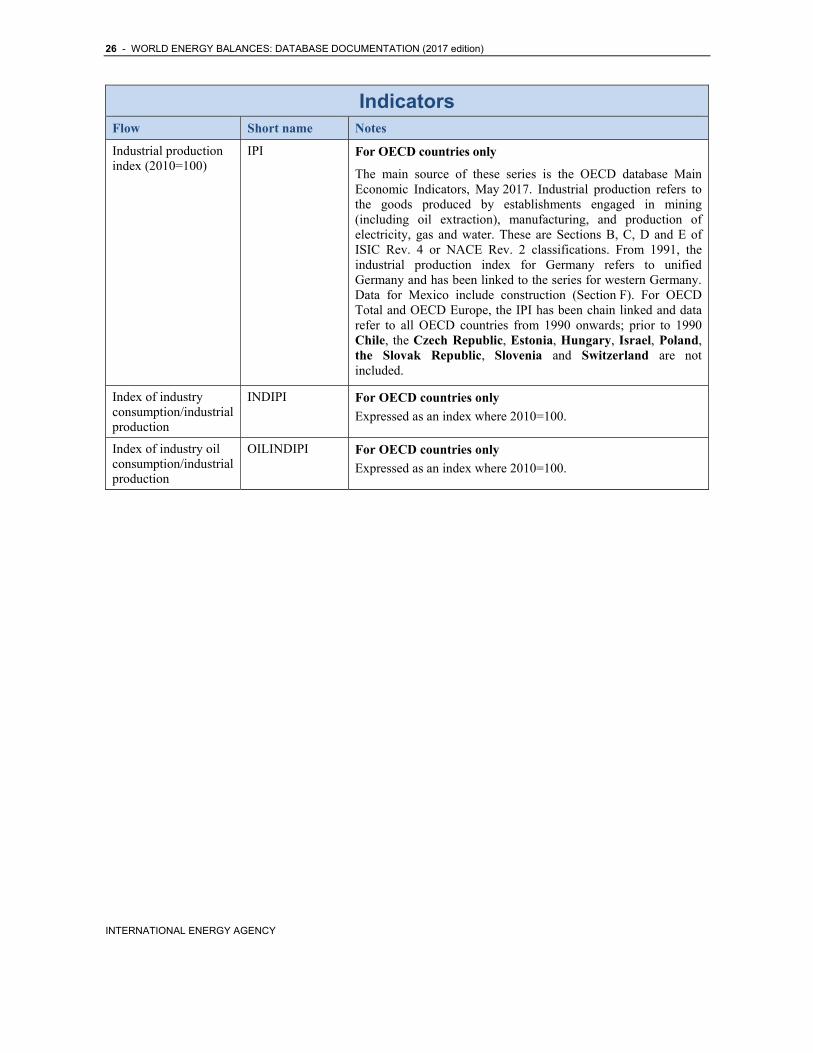
Indicators Flow Short name Notes
Industrial production index (2010=100)
IPI For OECD countries only
The main source of these series is the OECD database Main Economic Indicators, May 2017. Industrial production refers to the goods produced by establishments engaged in mining (including oil extraction), manufacturing, and production of electricity, gas and water. These are Sections B, C, D and E of ISIC Rev. 4 or NACE Rev. 2 classifications. From 1991, the industrial production index for Germany refers to unified Germany and has been linked to the series for western Germany. Data for Mexico include construction (Section F). For OECD Total and OECD Europe, the IPI has been chain linked and data refer to all OECD countries from 1990 onwards; prior to 1990 Chile, the Czech Republic, Estonia, Hungary, Israel, Poland, the Slovak Republic, Slovenia and Switzerland are not included.
Index of industry consumption/industrial production
INDIPI For OECD countries only
Expressed as an index where 2010=100.
Index of industry oil consumption/industrial production
OILINDIPI For OECD countries only
Expressed as an index where 2010=100.
WORLD ENERGY BALANCES: DATABASE DOCUMENTATION (2017 edition) - 27
INTERNATIONAL ENERGY AGENCY
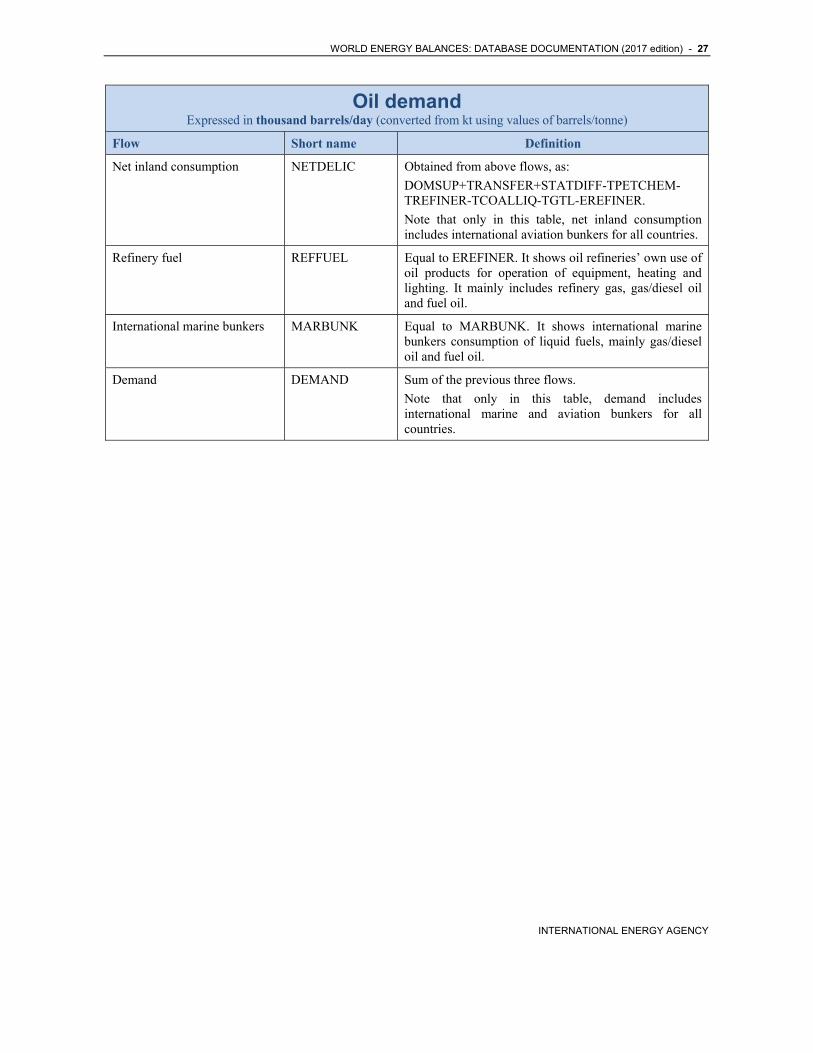
Oil demand Expressed in thousand barrels/day (converted from kt using values of barrels/tonne)
Flow Short name Definition
Net inland consumption NETDELIC Obtained from above flows, as:
DOMSUP+TRANSFER+STATDIFF-TPETCHEM-TREFINER-TCOALLIQ-TGTL-EREFINER.
Note that only in this table, net inland consumption includes international aviation bunkers for all countries.
Refinery fuel REFFUEL Equal to EREFINER. It shows oil refineries’ own use of oil products for operation of equipment, heating and lighting. It mainly includes refinery gas, gas/diesel oil and fuel oil.
International marine bunkers MARBUNK Equal to MARBUNK. It shows international marine bunkers consumption of liquid fuels, mainly gas/diesel oil and fuel oil.
Demand DEMAND Sum of the previous three flows.
Note that only in this table, demand includes international marine and aviation bunkers for all countries.
28 - WORLD ENERGY BALANCES: DATABASE DOCUMENTATION (2017 edition)
INTERNATIONAL ENERGY AGENCY
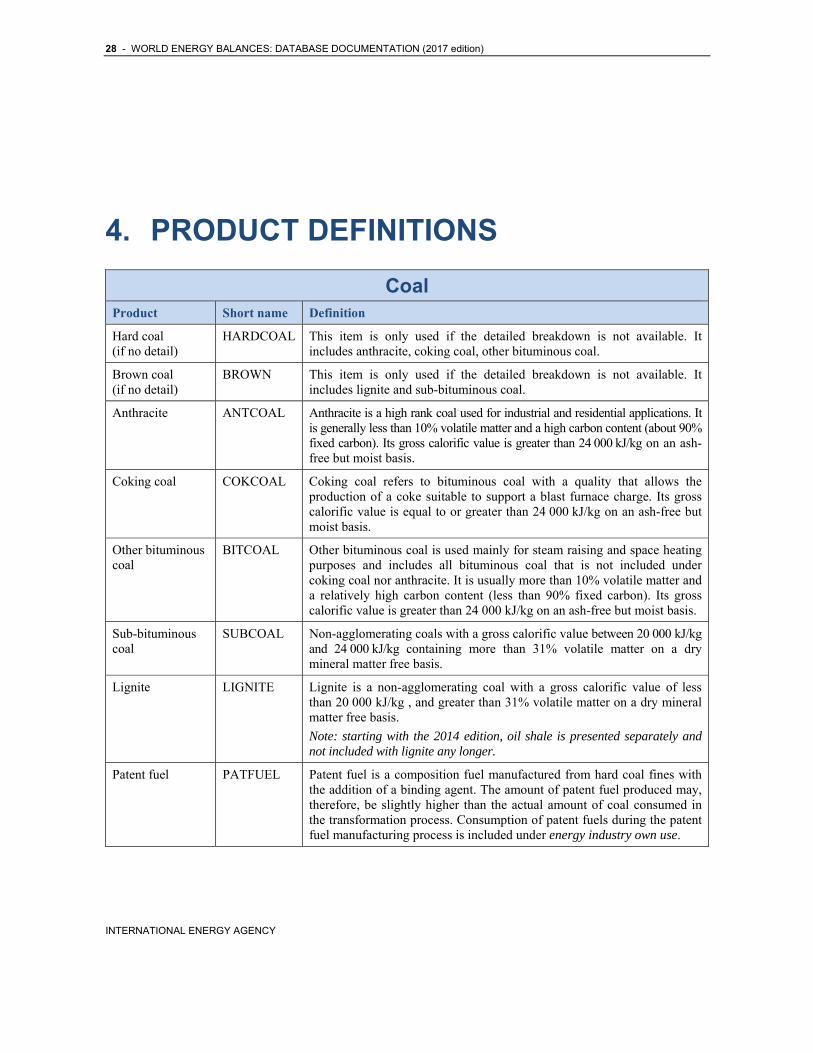
4. PRODUCT DEFINITIONS
Coal Product Short name Definition
Hard coal (if no detail)
HARDCOAL This item is only used if the detailed breakdown is not available. It includes anthracite, coking coal, other bituminous coal.
Brown coal (if no detail)
BROWN This item is only used if the detailed breakdown is not available. It includes lignite and sub-bituminous coal.
Anthracite ANTCOAL Anthracite is a high rank coal used for industrial and residential applications. It is generally less than 10% volatile matter and a high carbon content (about 90% fixed carbon). Its gross calorific value is greater than 24 000 kJ/kg on an ash-free but moist basis.
Coking coal COKCOAL Coking coal refers to bituminous coal with a quality that allows the production of a coke suitable to support a blast furnace charge. Its gross calorific value is equal to or greater than 24 000 kJ/kg on an ash-free but moist basis.
Other bituminous coal
BITCOAL Other bituminous coal is used mainly for steam raising and space heating purposes and includes all bituminous coal that is not included under coking coal nor anthracite. It is usually more than 10% volatile matter and a relatively high carbon content (less than 90% fixed carbon). Its gross calorific value is greater than 24 000 kJ/kg on an ash-free but moist basis.
Sub-bituminous coal
SUBCOAL Non-agglomerating coals with a gross calorific value between 20 000 kJ/kg and 24 000 kJ/kg containing more than 31% volatile matter on a dry mineral matter free basis.
Lignite LIGNITE Lignite is a non-agglomerating coal with a gross calorific value of less than 20 000 kJ/kg , and greater than 31% volatile matter on a dry mineral matter free basis.
Note: starting with the 2014 edition, oil shale is presented separately and not included with lignite any longer.
Patent fuel PATFUEL Patent fuel is a composition fuel manufactured from hard coal fines with the addition of a binding agent. The amount of patent fuel produced may, therefore, be slightly higher than the actual amount of coal consumed in the transformation process. Consumption of patent fuels during the patent fuel manufacturing process is included under energy industry own use.
WORLD ENERGY BALANCES: DATABASE DOCUMENTATION (2017 edition) - 29
INTERNATIONAL ENERGY AGENCY
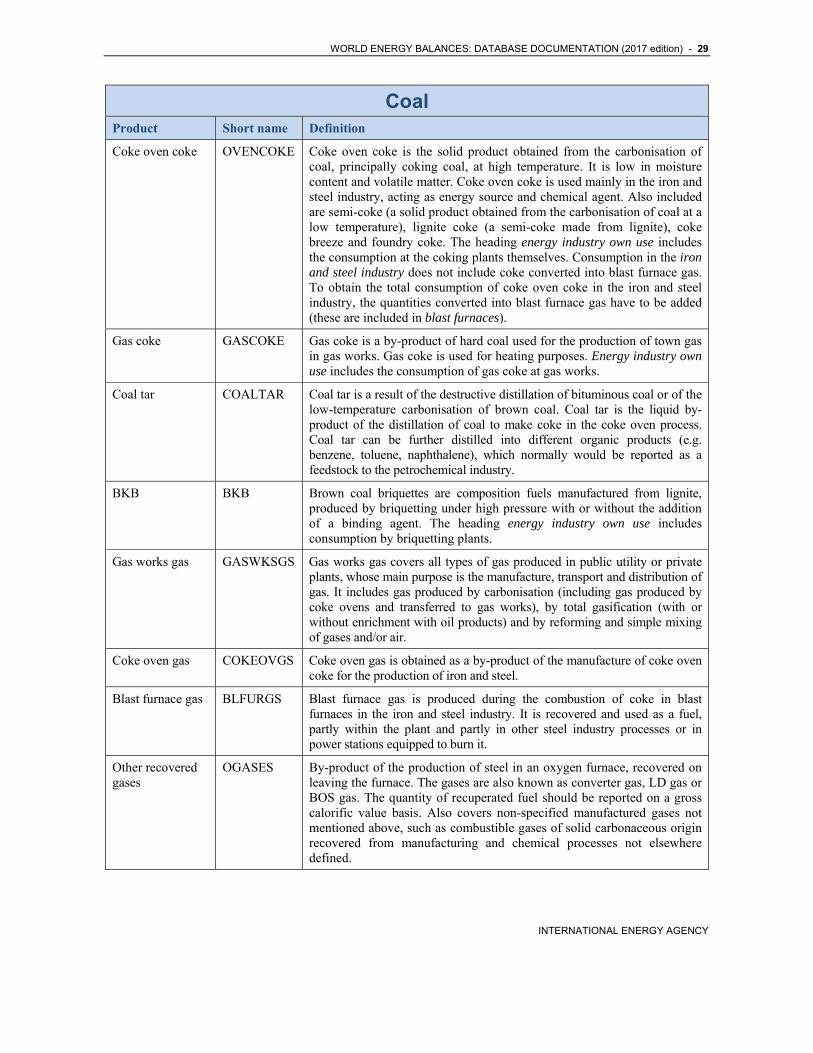
Coal Product Short name Definition
Coke oven coke OVENCOKE Coke oven coke is the solid product obtained from the carbonisation of coal, principally coking coal, at high temperature. It is low in moisture content and volatile matter. Coke oven coke is used mainly in the iron and steel industry, acting as energy source and chemical agent. Also included are semi-coke (a solid product obtained from the carbonisation of coal at a low temperature), lignite coke (a semi-coke made from lignite), coke breeze and foundry coke. The heading energy industry own use includes the consumption at the coking plants themselves. Consumption in the iron and steel industry does not include coke converted into blast furnace gas. To obtain the total consumption of coke oven coke in the iron and steel industry, the quantities converted into blast furnace gas have to be added (these are included in blast furnaces).
Gas coke GASCOKE Gas coke is a by-product of hard coal used for the production of town gas in gas works. Gas coke is used for heating purposes. Energy industry own use includes the consumption of gas coke at gas works.
Coal tar COALTAR Coal tar is a result of the destructive distillation of bituminous coal or of the low-temperature carbonisation of brown coal. Coal tar is the liquid by-product of the distillation of coal to make coke in the coke oven process. Coal tar can be further distilled into different organic products (e.g. benzene, toluene, naphthalene), which normally would be reported as a feedstock to the petrochemical industry.
BKB BKB Brown coal briquettes are composition fuels manufactured from lignite, produced by briquetting under high pressure with or without the addition of a binding agent. The heading energy industry own use includes consumption by briquetting plants.
Gas works gas GASWKSGS Gas works gas covers all types of gas produced in public utility or private plants, whose main purpose is the manufacture, transport and distribution of gas. It includes gas produced by carbonisation (including gas produced by coke ovens and transferred to gas works), by total gasification (with or without enrichment with oil products) and by reforming and simple mixing of gases and/or air.
Coke oven gas COKEOVGS Coke oven gas is obtained as a by-product of the manufacture of coke oven coke for the production of iron and steel.
Blast furnace gas BLFURGS Blast furnace gas is produced during the combustion of coke in blast furnaces in the iron and steel industry. It is recovered and used as a fuel, partly within the plant and partly in other steel industry processes or in power stations equipped to burn it.
Other recovered gases
OGASES By-product of the production of steel in an oxygen furnace, recovered on leaving the furnace. The gases are also known as converter gas, LD gas or BOS gas. The quantity of recuperated fuel should be reported on a gross calorific value basis. Also covers non-specified manufactured gases not mentioned above, such as combustible gases of solid carbonaceous origin recovered from manufacturing and chemical processes not elsewhere defined.
30 - WORLD ENERGY BALANCES: DATABASE DOCUMENTATION (2017 edition)
INTERNATIONAL ENERGY AGENCY
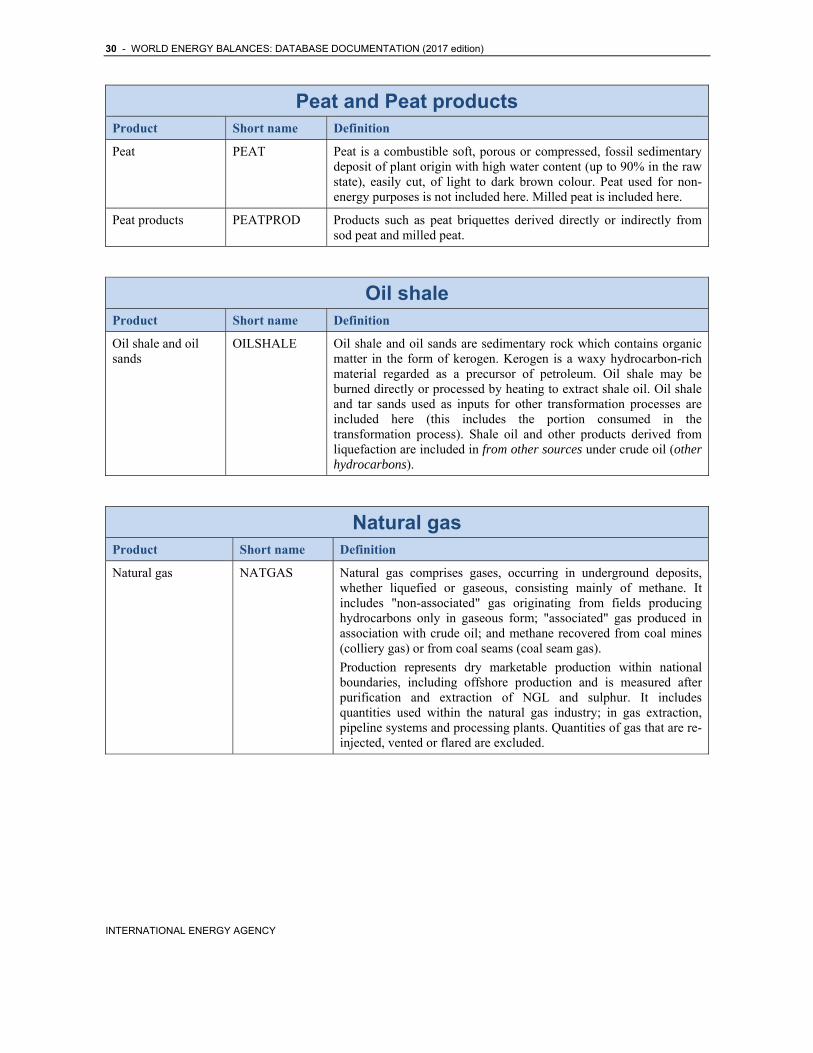
Peat and Peat products Product Short name Definition
Peat PEAT Peat is a combustible soft, porous or compressed, fossil sedimentary deposit of plant origin with high water content (up to 90% in the raw state), easily cut, of light to dark brown colour. Peat used for non-energy purposes is not included here. Milled peat is included here.
Peat products PEATPROD Products such as peat briquettes derived directly or indirectly from sod peat and milled peat.
Oil shale Product Short name Definition
Oil shale and oil sands
OILSHALE Oil shale and oil sands are sedimentary rock which contains organic matter in the form of kerogen. Kerogen is a waxy hydrocarbon-rich material regarded as a precursor of petroleum. Oil shale may be burned directly or processed by heating to extract shale oil. Oil shale and tar sands used as inputs for other transformation processes are included here (this includes the portion consumed in the transformation process). Shale oil and other products derived from liquefaction are included in from other sources under crude oil (other hydrocarbons).
Natural gas Product Short name Definition
Natural gas NATGAS Natural gas comprises gases, occurring in underground deposits, whether liquefied or gaseous, consisting mainly of methane. It includes "non-associated" gas originating from fields producing hydrocarbons only in gaseous form; "associated" gas produced in association with crude oil; and methane recovered from coal mines (colliery gas) or from coal seams (coal seam gas).
Production represents dry marketable production within national boundaries, including offshore production and is measured after purification and extraction of NGL and sulphur. It includes quantities used within the natural gas industry; in gas extraction, pipeline systems and processing plants. Quantities of gas that are re-injected, vented or flared are excluded.
WORLD ENERGY BALANCES: DATABASE DOCUMENTATION (2017 edition) - 31
INTERNATIONAL ENERGY AGENCY
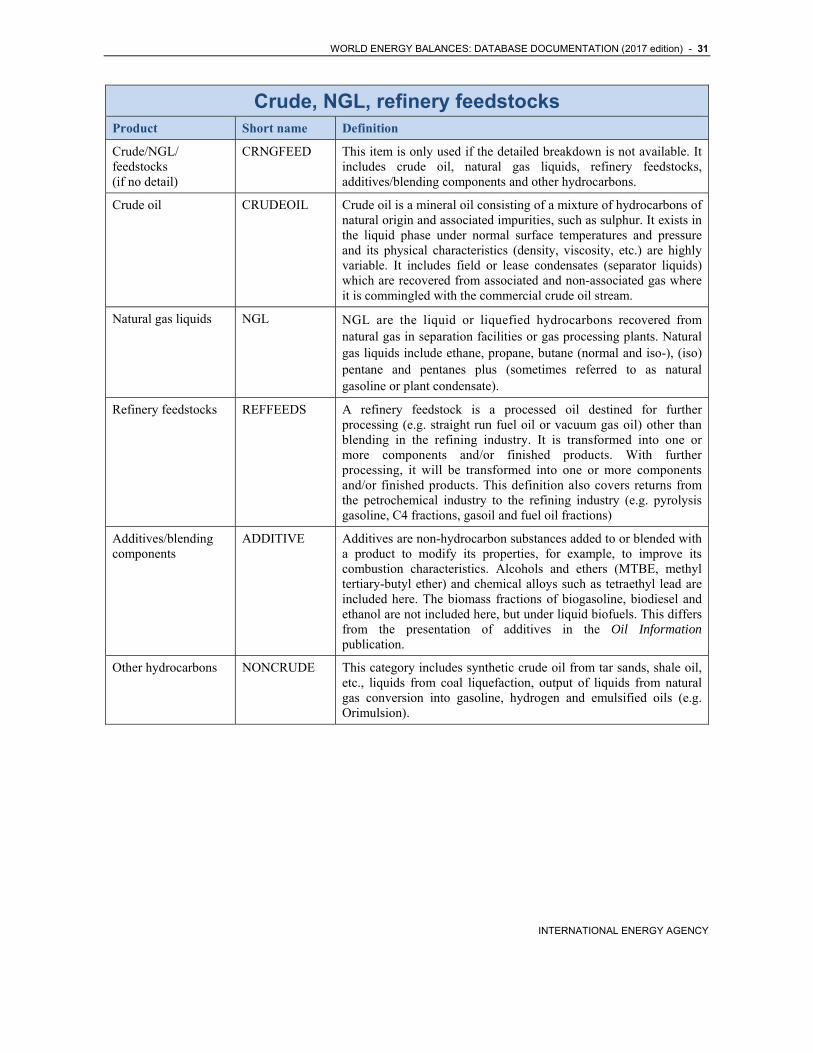
Crude, NGL, refinery feedstocks Product Short name Definition
Crude/NGL/ feedstocks (if no detail)
CRNGFEED This item is only used if the detailed breakdown is not available. It includes crude oil, natural gas liquids, refinery feedstocks, additives/blending components and other hydrocarbons.
Crude oil CRUDEOIL Crude oil is a mineral oil consisting of a mixture of hydrocarbons of natural origin and associated impurities, such as sulphur. It exists in the liquid phase under normal surface temperatures and pressure and its physical characteristics (density, viscosity, etc.) are highly variable. It includes field or lease condensates (separator liquids) which are recovered from associated and non-associated gas where it is commingled with the commercial crude oil stream.
Natural gas liquids NGL NGL are the liquid or liquefied hydrocarbons recovered from natural gas in separation facilities or gas processing plants. Natural gas liquids include ethane, propane, butane (normal and iso-), (iso) pentane and pentanes plus (sometimes referred to as natural gasoline or plant condensate).
Refinery feedstocks REFFEEDS A refinery feedstock is a processed oil destined for further processing (e.g. straight run fuel oil or vacuum gas oil) other than blending in the refining industry. It is transformed into one or more components and/or finished products. With further processing, it will be transformed into one or more components and/or finished products. This definition also covers returns from the petrochemical industry to the refining industry (e.g. pyrolysis gasoline, C4 fractions, gasoil and fuel oil fractions)
Additives/blending components
ADDITIVE Additives are non-hydrocarbon substances added to or blended with a product to modify its properties, for example, to improve its combustion characteristics. Alcohols and ethers (MTBE, methyl tertiary-butyl ether) and chemical alloys such as tetraethyl lead are included here. The biomass fractions of biogasoline, biodiesel and ethanol are not included here, but under liquid biofuels. This differs from the presentation of additives in the Oil Information publication.
Other hydrocarbons NONCRUDE This category includes synthetic crude oil from tar sands, shale oil, etc., liquids from coal liquefaction, output of liquids from natural gas conversion into gasoline, hydrogen and emulsified oils (e.g. Orimulsion).
32 - WORLD ENERGY BALANCES: DATABASE DOCUMENTATION (2017 edition)
INTERNATIONAL ENERGY AGENCY
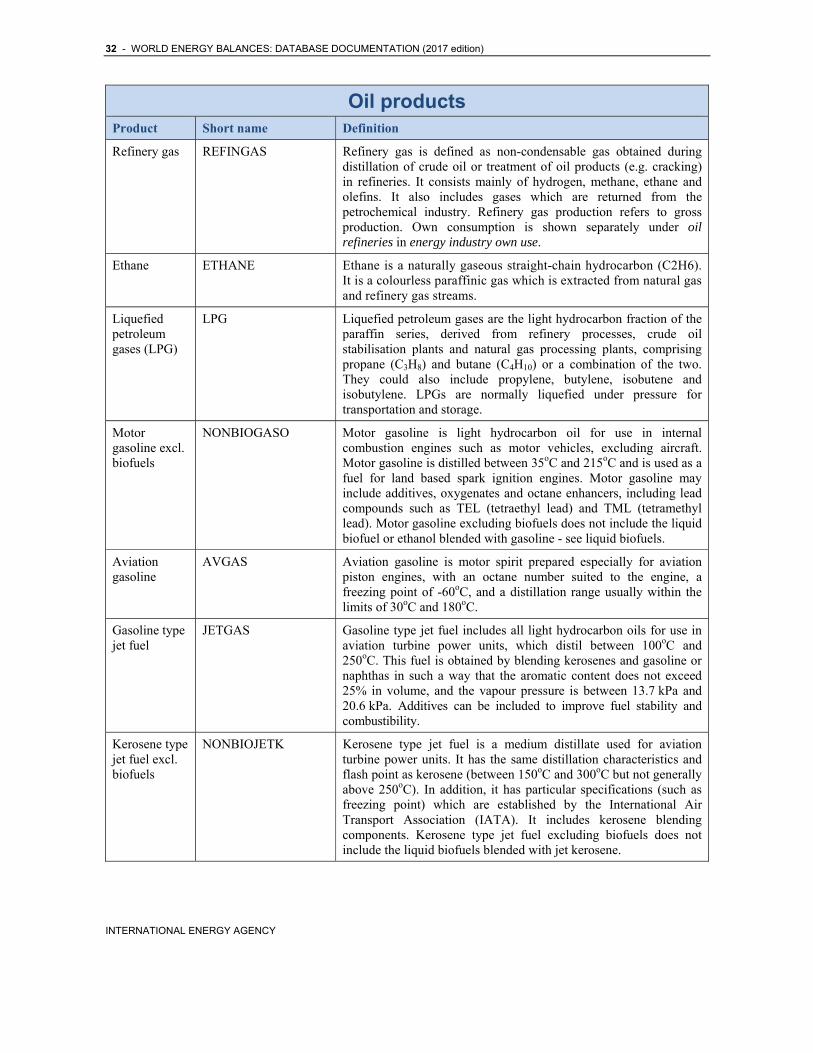
Oil products Product Short name Definition
Refinery gas REFINGAS Refinery gas is defined as non-condensable gas obtained during distillation of crude oil or treatment of oil products (e.g. cracking) in refineries. It consists mainly of hydrogen, methane, ethane and olefins. It also includes gases which are returned from the petrochemical industry. Refinery gas production refers to gross production. Own consumption is shown separately under oil refineries in energy industry own use.
Ethane ETHANE Ethane is a naturally gaseous straight-chain hydrocarbon (C2H6). It is a colourless paraffinic gas which is extracted from natural gas and refinery gas streams.
Liquefied petroleum gases (LPG)
LPG Liquefied petroleum gases are the light hydrocarbon fraction of the paraffin series, derived from refinery processes, crude oil stabilisation plants and natural gas processing plants, comprising propane (C3H8) and butane (C4H10) or a combination of the two. They could also include propylene, butylene, isobutene and isobutylene. LPGs are normally liquefied under pressure for transportation and storage.
Motor gasoline excl. biofuels
NONBIOGASO Motor gasoline is light hydrocarbon oil for use in internal combustion engines such as motor vehicles, excluding aircraft. Motor gasoline is distilled between 35oC and 215oC and is used as a fuel for land based spark ignition engines. Motor gasoline may include additives, oxygenates and octane enhancers, including lead compounds such as TEL (tetraethyl lead) and TML (tetramethyl lead). Motor gasoline excluding biofuels does not include the liquid biofuel or ethanol blended with gasoline - see liquid biofuels.
Aviation gasoline
AVGAS Aviation gasoline is motor spirit prepared especially for aviation piston engines, with an octane number suited to the engine, a freezing point of -60oC, and a distillation range usually within the limits of 30oC and 180oC.
Gasoline type jet fuel
JETGAS Gasoline type jet fuel includes all light hydrocarbon oils for use in aviation turbine power units, which distil between 100oC and 250oC. This fuel is obtained by blending kerosenes and gasoline or naphthas in such a way that the aromatic content does not exceed 25% in volume, and the vapour pressure is between 13.7 kPa and 20.6 kPa. Additives can be included to improve fuel stability and combustibility.
Kerosene type jet fuel excl. biofuels
NONBIOJETK Kerosene type jet fuel is a medium distillate used for aviation turbine power units. It has the same distillation characteristics and flash point as kerosene (between 150oC and 300oC but not generally above 250oC). In addition, it has particular specifications (such as freezing point) which are established by the International Air Transport Association (IATA). It includes kerosene blending components. Kerosene type jet fuel excluding biofuels does not include the liquid biofuels blended with jet kerosene.
WORLD ENERGY BALANCES: DATABASE DOCUMENTATION (2017 edition) - 33
INTERNATIONAL ENERGY AGENCY
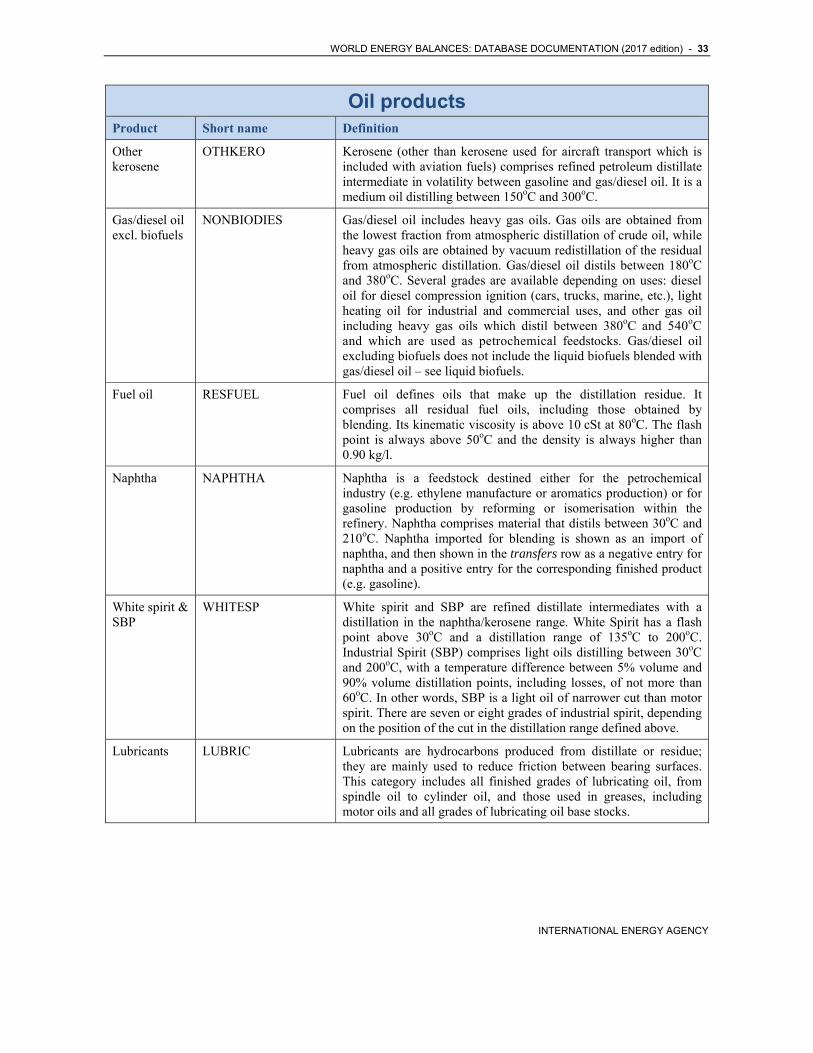
Oil products Product Short name Definition
Other kerosene
OTHKERO Kerosene (other than kerosene used for aircraft transport which is included with aviation fuels) comprises refined petroleum distillate intermediate in volatility between gasoline and gas/diesel oil. It is a medium oil distilling between 150oC and 300oC.
Gas/diesel oil excl. biofuels
NONBIODIES Gas/diesel oil includes heavy gas oils. Gas oils are obtained from the lowest fraction from atmospheric distillation of crude oil, while heavy gas oils are obtained by vacuum redistillation of the residual from atmospheric distillation. Gas/diesel oil distils between 180oC and 380oC. Several grades are available depending on uses: diesel oil for diesel compression ignition (cars, trucks, marine, etc.), light heating oil for industrial and commercial uses, and other gas oil including heavy gas oils which distil between 380oC and 540oC and which are used as petrochemical feedstocks. Gas/diesel oil excluding biofuels does not include the liquid biofuels blended with gas/diesel oil – see liquid biofuels.
Fuel oil RESFUEL Fuel oil defines oils that make up the distillation residue. It comprises all residual fuel oils, including those obtained by blending. Its kinematic viscosity is above 10 cSt at 80oC. The flash point is always above 50oC and the density is always higher than 0.90 kg/l.
Naphtha NAPHTHA Naphtha is a feedstock destined either for the petrochemical industry (e.g. ethylene manufacture or aromatics production) or for gasoline production by reforming or isomerisation within the refinery. Naphtha comprises material that distils between 30oC and 210oC. Naphtha imported for blending is shown as an import of naphtha, and then shown in the transfers row as a negative entry for naphtha and a positive entry for the corresponding finished product (e.g. gasoline).
White spirit & SBP
WHITESP White spirit and SBP are refined distillate intermediates with a distillation in the naphtha/kerosene range. White Spirit has a flash point above 30oC and a distillation range of 135oC to 200oC. Industrial Spirit (SBP) comprises light oils distilling between 30oC and 200oC, with a temperature difference between 5% volume and 90% volume distillation points, including losses, of not more than 60oC. In other words, SBP is a light oil of narrower cut than motor spirit. There are seven or eight grades of industrial spirit, depending on the position of the cut in the distillation range defined above.
Lubricants LUBRIC Lubricants are hydrocarbons produced from distillate or residue; they are mainly used to reduce friction between bearing surfaces. This category includes all finished grades of lubricating oil, from spindle oil to cylinder oil, and those used in greases, including motor oils and all grades of lubricating oil base stocks.
34 - WORLD ENERGY BALANCES: DATABASE DOCUMENTATION (2017 edition)
INTERNATIONAL ENERGY AGENCY
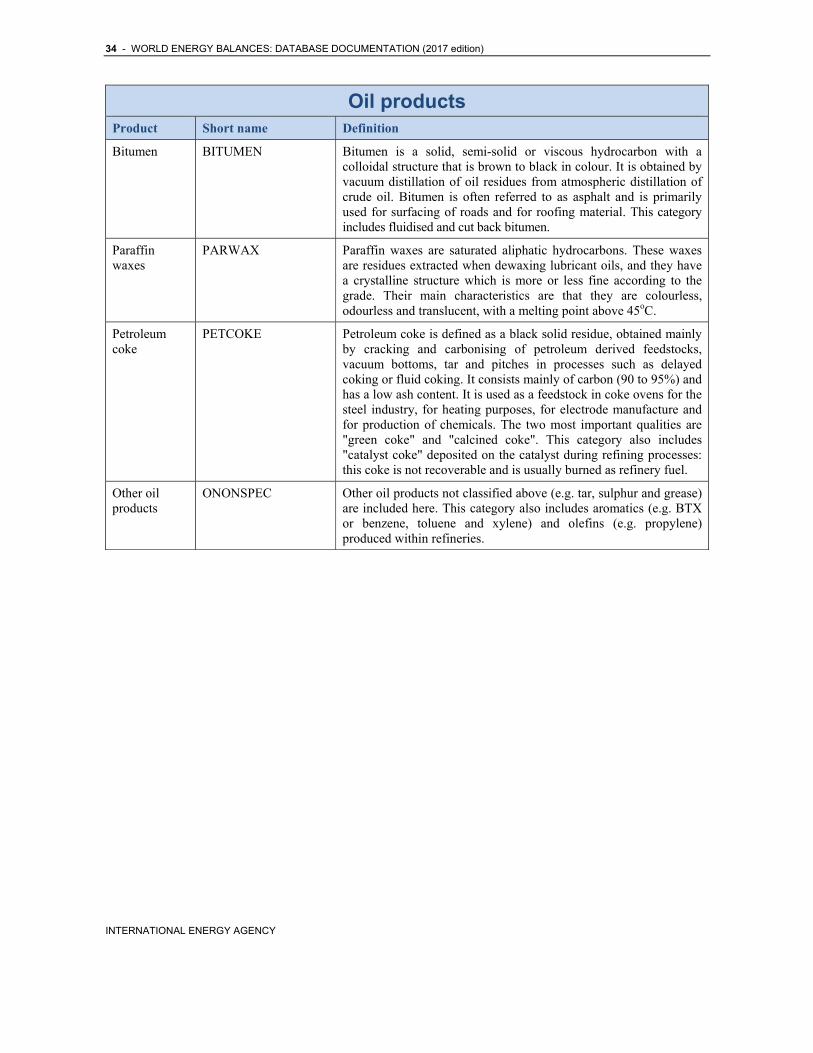
Oil products Product Short name Definition
Bitumen BITUMEN Bitumen is a solid, semi-solid or viscous hydrocarbon with a colloidal structure that is brown to black in colour. It is obtained by vacuum distillation of oil residues from atmospheric distillation of crude oil. Bitumen is often referred to as asphalt and is primarily used for surfacing of roads and for roofing material. This category includes fluidised and cut back bitumen.
Paraffin waxes
PARWAX Paraffin waxes are saturated aliphatic hydrocarbons. These waxes are residues extracted when dewaxing lubricant oils, and they have a crystalline structure which is more or less fine according to the grade. Their main characteristics are that they are colourless, odourless and translucent, with a melting point above 45oC.
Petroleum coke
PETCOKE Petroleum coke is defined as a black solid residue, obtained mainly by cracking and carbonising of petroleum derived feedstocks, vacuum bottoms, tar and pitches in processes such as delayed coking or fluid coking. It consists mainly of carbon (90 to 95%) and has a low ash content. It is used as a feedstock in coke ovens for the steel industry, for heating purposes, for electrode manufacture and for production of chemicals. The two most important qualities are "green coke" and "calcined coke". This category also includes "catalyst coke" deposited on the catalyst during refining processes: this coke is not recoverable and is usually burned as refinery fuel.
Other oil products
ONONSPEC Other oil products not classified above (e.g. tar, sulphur and grease) are included here. This category also includes aromatics (e.g. BTX or benzene, toluene and xylene) and olefins (e.g. propylene) produced within refineries.
WORLD ENERGY BALANCES: DATABASE DOCUMENTATION (2017 edition) - 35
INTERNATIONAL ENERGY AGENCY
Biofuels and Waste Product Short name Definition
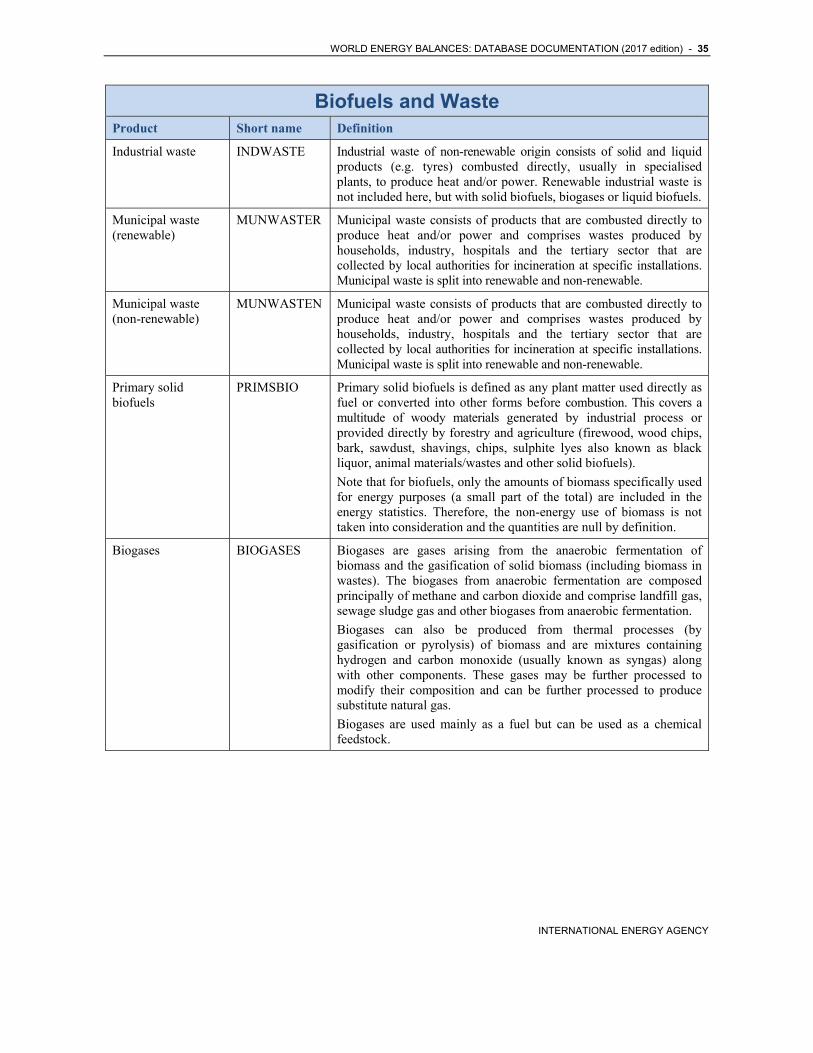
Industrial waste INDWASTE Industrial waste of non-renewable origin consists of solid and liquid products (e.g. tyres) combusted directly, usually in specialised plants, to produce heat and/or power. Renewable industrial waste is not included here, but with solid biofuels, biogases or liquid biofuels.
Municipal waste (renewable)
MUNWASTER Municipal waste consists of products that are combusted directly to produce heat and/or power and comprises wastes produced by households, industry, hospitals and the tertiary sector that are collected by local authorities for incineration at specific installations. Municipal waste is split into renewable and non-renewable.
Municipal waste (non-renewable)
MUNWASTEN Municipal waste consists of products that are combusted directly to produce heat and/or power and comprises wastes produced by households, industry, hospitals and the tertiary sector that are collected by local authorities for incineration at specific installations. Municipal waste is split into renewable and non-renewable.
Primary solid biofuels
PRIMSBIO Primary solid biofuels is defined as any plant matter used directly as fuel or converted into other forms before combustion. This covers a multitude of woody materials generated by industrial process or provided directly by forestry and agriculture (firewood, wood chips, bark, sawdust, shavings, chips, sulphite lyes also known as black liquor, animal materials/wastes and other solid biofuels).
Note that for biofuels, only the amounts of biomass specifically used for energy purposes (a small part of the total) are included in the energy statistics. Therefore, the non-energy use of biomass is not taken into consideration and the quantities are null by definition.
Biogases BIOGASES Biogases are gases arising from the anaerobic fermentation of biomass and the gasification of solid biomass (including biomass in wastes). The biogases from anaerobic fermentation are composed principally of methane and carbon dioxide and comprise landfill gas, sewage sludge gas and other biogases from anaerobic fermentation.
Biogases can also be produced from thermal processes (by gasification or pyrolysis) of biomass and are mixtures containing hydrogen and carbon monoxide (usually known as syngas) along with other components. These gases may be further processed to modify their composition and can be further processed to produce substitute natural gas.
Biogases are used mainly as a fuel but can be used as a chemical feedstock.
36 - WORLD ENERGY BALANCES: DATABASE DOCUMENTATION (2017 edition)
INTERNATIONAL ENERGY AGENCY
Biofuels and Waste Product Short name Definition
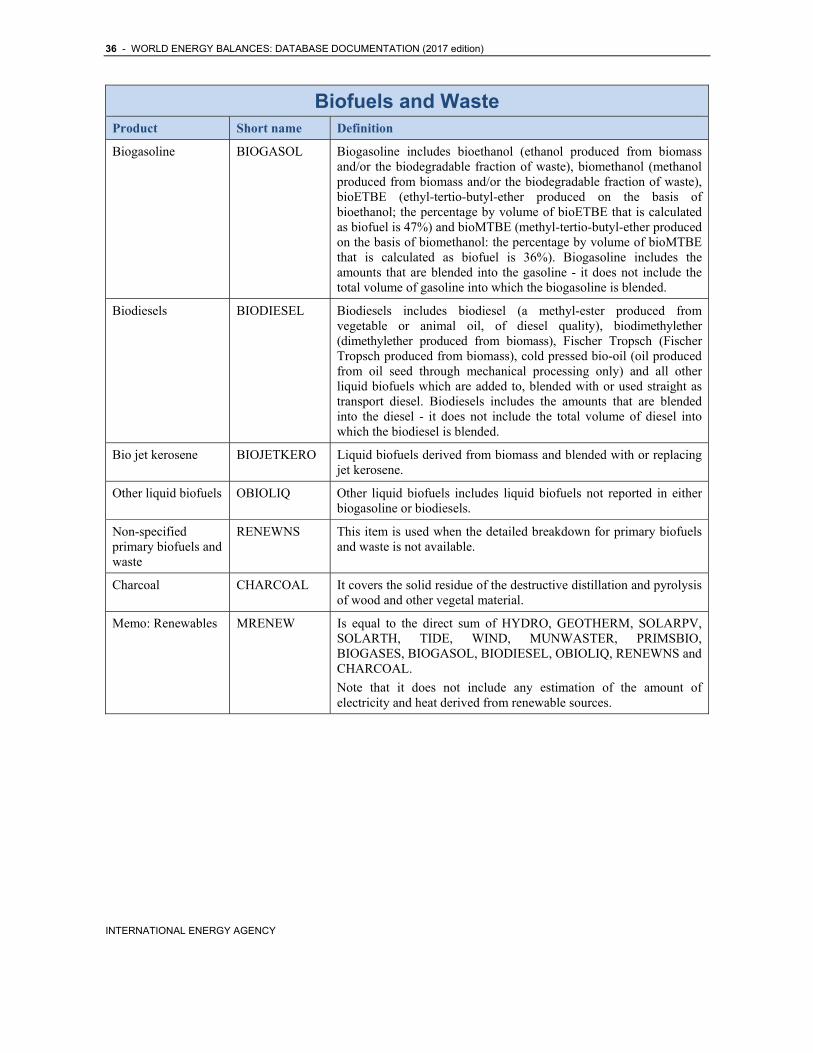
Biogasoline BIOGASOL Biogasoline includes bioethanol (ethanol produced from biomass and/or the biodegradable fraction of waste), biomethanol (methanol produced from biomass and/or the biodegradable fraction of waste), bioETBE (ethyl-tertio-butyl-ether produced on the basis of bioethanol; the percentage by volume of bioETBE that is calculated as biofuel is 47%) and bioMTBE (methyl-tertio-butyl-ether produced on the basis of biomethanol: the percentage by volume of bioMTBE that is calculated as biofuel is 36%). Biogasoline includes the amounts that are blended into the gasoline - it does not include the total volume of gasoline into which the biogasoline is blended.
Biodiesels BIODIESEL Biodiesels includes biodiesel (a methyl-ester produced from vegetable or animal oil, of diesel quality), biodimethylether (dimethylether produced from biomass), Fischer Tropsch (Fischer Tropsch produced from biomass), cold pressed bio-oil (oil produced from oil seed through mechanical processing only) and all other liquid biofuels which are added to, blended with or used straight as transport diesel. Biodiesels includes the amounts that are blended into the diesel - it does not include the total volume of diesel into which the biodiesel is blended.
Bio jet kerosene BIOJETKERO Liquid biofuels derived from biomass and blended with or replacing jet kerosene.
Other liquid biofuels OBIOLIQ Other liquid biofuels includes liquid biofuels not reported in either biogasoline or biodiesels.
Non-specified primary biofuels and waste
RENEWNS This item is used when the detailed breakdown for primary biofuels and waste is not available.
Charcoal CHARCOAL It covers the solid residue of the destructive distillation and pyrolysis of wood and other vegetal material.
Memo: Renewables MRENEW Is equal to the direct sum of HYDRO, GEOTHERM, SOLARPV, SOLARTH, TIDE, WIND, MUNWASTER, PRIMSBIO, BIOGASES, BIOGASOL, BIODIESEL, OBIOLIQ, RENEWNS and CHARCOAL.
Note that it does not include any estimation of the amount of electricity and heat derived from renewable sources.
WORLD ENERGY BALANCES: DATABASE DOCUMENTATION (2017 edition) - 37
INTERNATIONAL ENERGY AGENCY
Electricity and Heat Product Short name Definition
Elec/heat output from non-specified manufactured gases
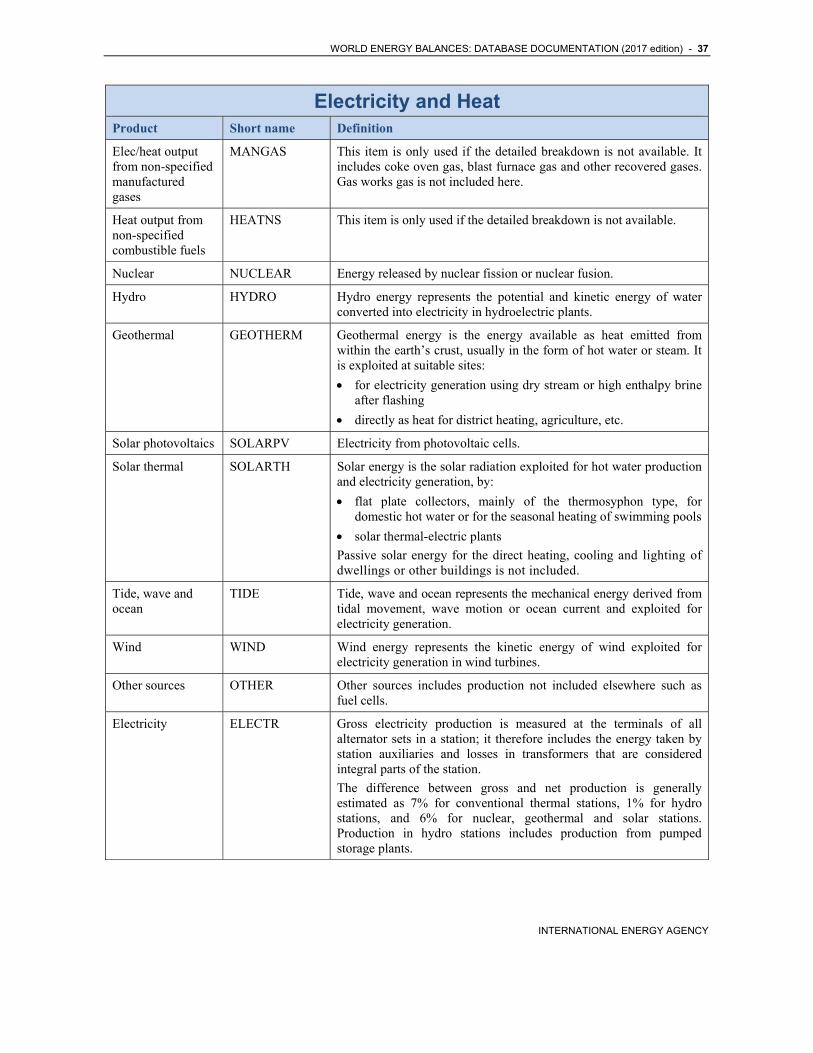
MANGAS This item is only used if the detailed breakdown is not available. It includes coke oven gas, blast furnace gas and other recovered gases. Gas works gas is not included here.
Heat output from non-specified combustible fuels
HEATNS This item is only used if the detailed breakdown is not available.
Nuclear NUCLEAR Energy released by nuclear fission or nuclear fusion.
Hydro HYDRO Hydro energy represents the potential and kinetic energy of water converted into electricity in hydroelectric plants.
Geothermal GEOTHERM Geothermal energy is the energy available as heat emitted from within the earth’s crust, usually in the form of hot water or steam. It is exploited at suitable sites:
for electricity generation using dry stream or high enthalpy brine after flashing
directly as heat for district heating, agriculture, etc.
Solar photovoltaics SOLARPV Electricity from photovoltaic cells.
Solar thermal SOLARTH Solar energy is the solar radiation exploited for hot water production and electricity generation, by:
flat plate collectors, mainly of the thermosyphon type, for domestic hot water or for the seasonal heating of swimming pools
solar thermal-electric plants
Passive solar energy for the direct heating, cooling and lighting of dwellings or other buildings is not included.
Tide, wave and ocean
TIDE Tide, wave and ocean represents the mechanical energy derived from tidal movement, wave motion or ocean current and exploited for electricity generation.
Wind WIND Wind energy represents the kinetic energy of wind exploited for electricity generation in wind turbines.
Other sources OTHER Other sources includes production not included elsewhere such as fuel cells.
Electricity ELECTR Gross electricity production is measured at the terminals of all alternator sets in a station; it therefore includes the energy taken by station auxiliaries and losses in transformers that are considered integral parts of the station.
The difference between gross and net production is generally estimated as 7% for conventional thermal stations, 1% for hydro stations, and 6% for nuclear, geothermal and solar stations. Production in hydro stations includes production from pumped storage plants.
38 - WORLD ENERGY BALANCES: DATABASE DOCUMENTATION (2017 edition)
INTERNATIONAL ENERGY AGENCY
Electricity and Heat Product Short name Definition
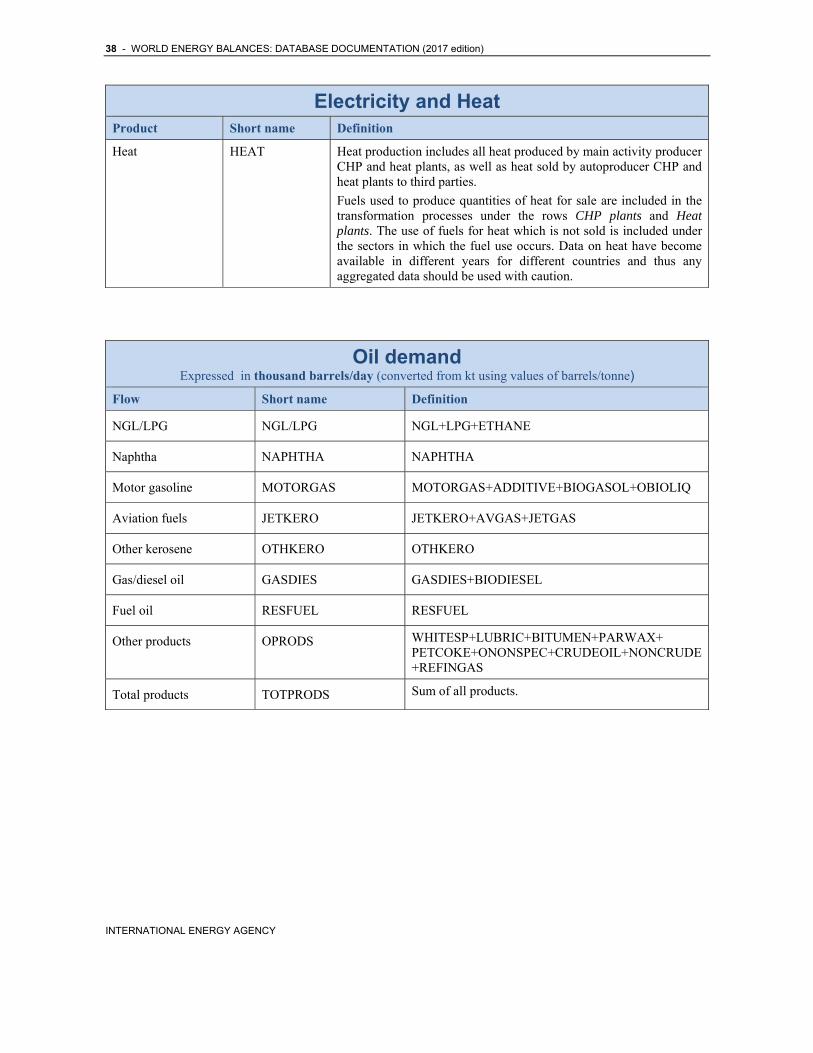
Heat HEAT Heat production includes all heat produced by main activity producer CHP and heat plants, as well as heat sold by autoproducer CHP and heat plants to third parties.
Fuels used to produce quantities of heat for sale are included in the transformation processes under the rows CHP plants and Heat plants. The use of fuels for heat which is not sold is included under the sectors in which the fuel use occurs. Data on heat have become available in different years for different countries and thus any aggregated data should be used with caution.
Oil demand Expressed in thousand barrels/day (converted from kt using values of barrels/tonne)
Flow Short name Definition
NGL/LPG NGL/LPG NGL+LPG+ETHANE
Naphtha NAPHTHA NAPHTHA
Motor gasoline MOTORGAS MOTORGAS+ADDITIVE+BIOGASOL+OBIOLIQ
Aviation fuels JETKERO JETKERO+AVGAS+JETGAS
Other kerosene OTHKERO OTHKERO
Gas/diesel oil GASDIES GASDIES+BIODIESEL
Fuel oil RESFUEL RESFUEL
Other products OPRODS WHITESP+LUBRIC+BITUMEN+PARWAX+ PETCOKE+ONONSPEC+CRUDEOIL+NONCRUDE+REFINGAS
Total products TOTPRODS Sum of all products.
WORLD ENERGY BALANCES: DATABASE DOCUMENTATION (2017 edition) - 39
INTERNATIONAL ENERGY AGENCY
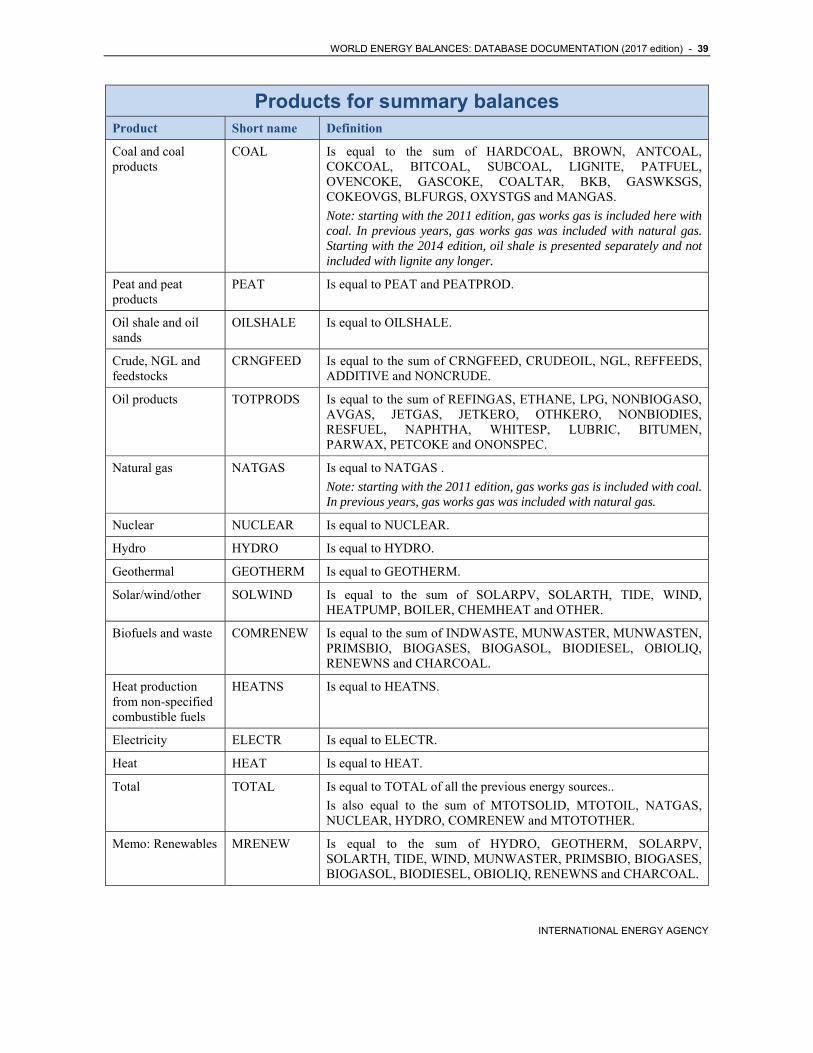
Products for summary balances Product Short name Definition
Coal and coal products
COAL Is equal to the sum of HARDCOAL, BROWN, ANTCOAL, COKCOAL, BITCOAL, SUBCOAL, LIGNITE, PATFUEL, OVENCOKE, GASCOKE, COALTAR, BKB, GASWKSGS, COKEOVGS, BLFURGS, OXYSTGS and MANGAS.
Note: starting with the 2011 edition, gas works gas is included here with coal. In previous years, gas works gas was included with natural gas. Starting with the 2014 edition, oil shale is presented separately and not included with lignite any longer.
Peat and peat products
PEAT Is equal to PEAT and PEATPROD.
Oil shale and oil sands
OILSHALE Is equal to OILSHALE.
Crude, NGL and feedstocks
CRNGFEED Is equal to the sum of CRNGFEED, CRUDEOIL, NGL, REFFEEDS, ADDITIVE and NONCRUDE.
Oil products TOTPRODS Is equal to the sum of REFINGAS, ETHANE, LPG, NONBIOGASO, AVGAS, JETGAS, JETKERO, OTHKERO, NONBIODIES, RESFUEL, NAPHTHA, WHITESP, LUBRIC, BITUMEN, PARWAX, PETCOKE and ONONSPEC.
Natural gas NATGAS Is equal to NATGAS .
Note: starting with the 2011 edition, gas works gas is included with coal. In previous years, gas works gas was included with natural gas.
Nuclear NUCLEAR Is equal to NUCLEAR.
Hydro HYDRO Is equal to HYDRO.
Geothermal GEOTHERM Is equal to GEOTHERM.
Solar/wind/other SOLWIND Is equal to the sum of SOLARPV, SOLARTH, TIDE, WIND, HEATPUMP, BOILER, CHEMHEAT and OTHER.
Biofuels and waste COMRENEW Is equal to the sum of INDWASTE, MUNWASTER, MUNWASTEN, PRIMSBIO, BIOGASES, BIOGASOL, BIODIESEL, OBIOLIQ, RENEWNS and CHARCOAL.
Heat production from non-specified combustible fuels
HEATNS Is equal to HEATNS.
Electricity ELECTR Is equal to ELECTR.
Heat HEAT Is equal to HEAT.
Total TOTAL Is equal to TOTAL of all the previous energy sources..
Is also equal to the sum of MTOTSOLID, MTOTOIL, NATGAS, NUCLEAR, HYDRO, COMRENEW and MTOTOTHER.
Memo: Renewables MRENEW Is equal to the sum of HYDRO, GEOTHERM, SOLARPV, SOLARTH, TIDE, WIND, MUNWASTER, PRIMSBIO, BIOGASES, BIOGASOL, BIODIESEL, OBIOLIQ, RENEWNS and CHARCOAL.
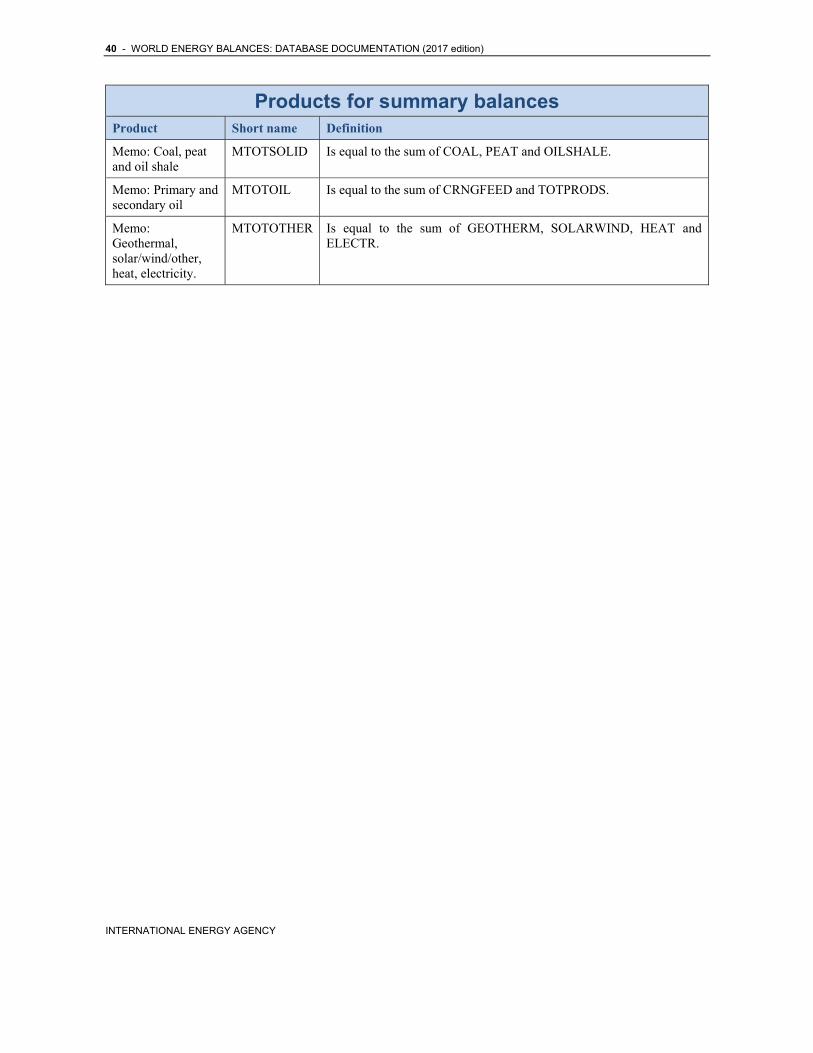
40 - WORLD ENERGY BALANCES: DATABASE DOCUMENTATION (2017 edition)
INTERNATIONAL ENERGY AGENCY
Products for summary balances Product Short name Definition
Memo: Coal, peat and oil shale
MTOTSOLID Is equal to the sum of COAL, PEAT and OILSHALE.
Memo: Primary and secondary oil
MTOTOIL Is equal to the sum of CRNGFEED and TOTPRODS.
Memo: Geothermal, solar/wind/other, heat, electricity.
MTOTOTHER Is equal to the sum of GEOTHERM, SOLARWIND, HEAT and ELECTR.
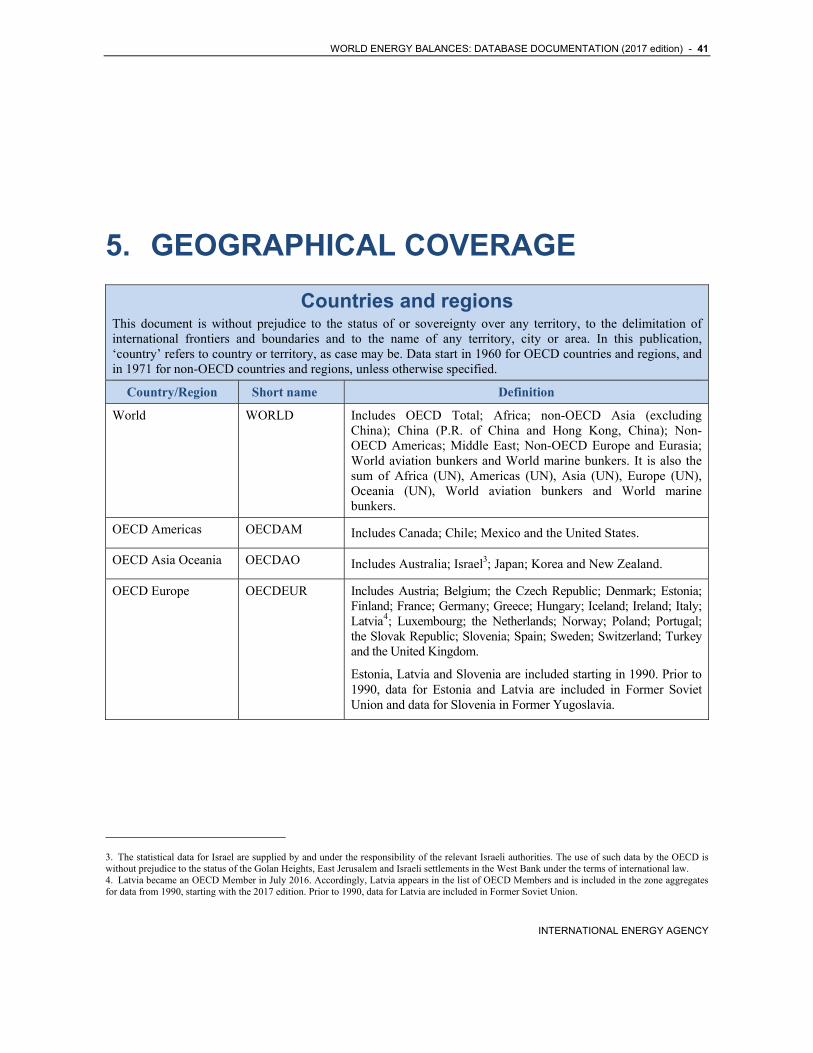
WORLD ENERGY BALANCES: DATABASE DOCUMENTATION (2017 edition) - 41
INTERNATIONAL ENERGY AGENCY
5. GEOGRAPHICAL COVERAGE
Countries and regions This document is without prejudice to the status of or sovereignty over any territory, to the delimitation of international frontiers and boundaries and to the name of any territory, city or area. In this publication, ‘country’ refers to country or territory, as case may be. Data start in 1960 for OECD countries and regions, and in 1971 for non-OECD countries and regions, unless otherwise specified.
Country/Region Short name Definition
World WORLD Includes OECD Total; Africa; non-OECD Asia (excluding China); China (P.R. of China and Hong Kong, China); Non-OECD Americas; Middle East; Non-OECD Europe and Eurasia; World aviation bunkers and World marine bunkers. It is also the sum of Africa (UN), Americas (UN), Asia (UN), Europe (UN), Oceania (UN), World aviation bunkers and World marine bunkers.
OECD Americas OECDAM Includes Canada; Chile; Mexico and the United States.
OECD Asia Oceania OECDAO Includes Australia; Israel3; Japan; Korea and New Zealand.
OECD Europe OECDEUR Includes Austria; Belgium; the Czech Republic; Denmark; Estonia; Finland; France; Germany; Greece; Hungary; Iceland; Ireland; Italy; Latvia4; Luxembourg; the Netherlands; Norway; Poland; Portugal; the Slovak Republic; Slovenia; Spain; Sweden; Switzerland; Turkey and the United Kingdom.
Estonia, Latvia and Slovenia are included starting in 1990. Prior to 1990, data for Estonia and Latvia are included in Former Soviet Union and data for Slovenia in Former Yugoslavia.
3. The statistical data for Israel are supplied by and under the responsibility of the relevant Israeli authorities. The use of such data by the OECD is without prejudice to the status of the Golan Heights, East Jerusalem and Israeli settlements in the West Bank under the terms of international law. 4. Latvia became an OECD Member in July 2016. Accordingly, Latvia appears in the list of OECD Members and is included in the zone aggregates for data from 1990, starting with the 2017 edition. Prior to 1990, data for Latvia are included in Former Soviet Union.
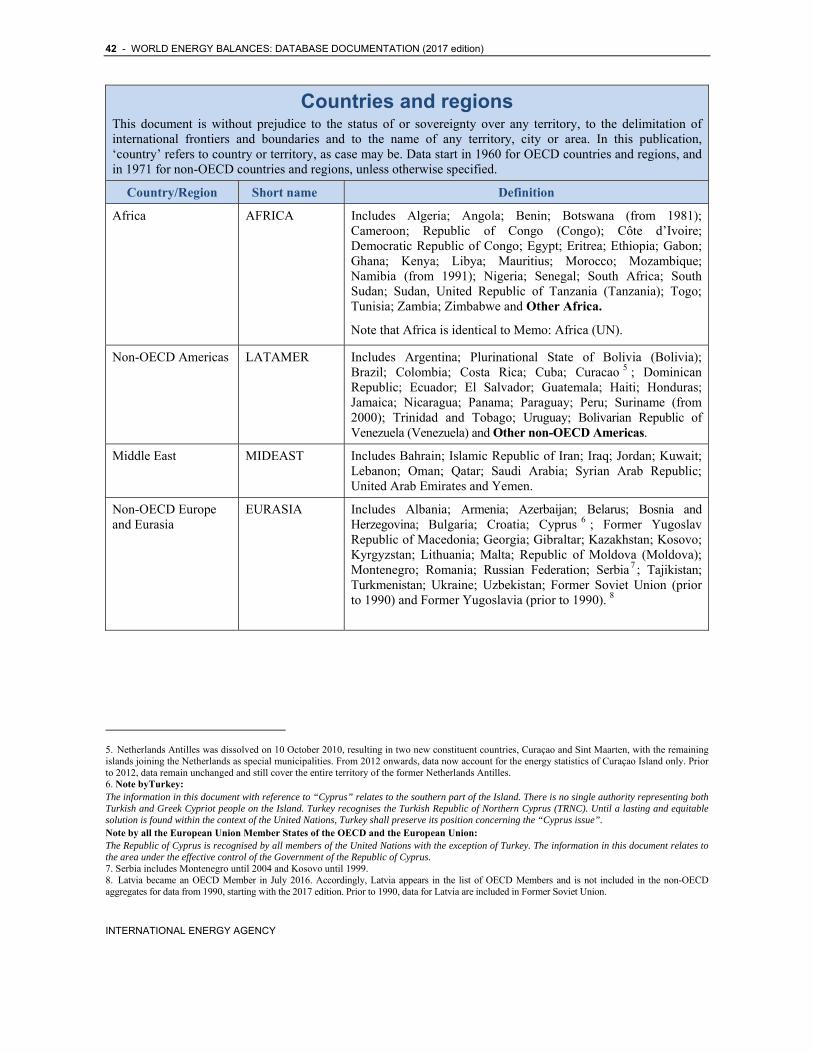
42 - WORLD ENERGY BALANCES: DATABASE DOCUMENTATION (2017 edition)
INTERNATIONAL ENERGY AGENCY
Countries and regions This document is without prejudice to the status of or sovereignty over any territory, to the delimitation of international frontiers and boundaries and to the name of any territory, city or area. In this publication, ‘country’ refers to country or territory, as case may be. Data start in 1960 for OECD countries and regions, and in 1971 for non-OECD countries and regions, unless otherwise specified.
Country/Region Short name Definition
Africa AFRICA Includes Algeria; Angola; Benin; Botswana (from 1981); Cameroon; Republic of Congo (Congo); Côte d’Ivoire; Democratic Republic of Congo; Egypt; Eritrea; Ethiopia; Gabon; Ghana; Kenya; Libya; Mauritius; Morocco; Mozambique; Namibia (from 1991); Nigeria; Senegal; South Africa; South Sudan; Sudan, United Republic of Tanzania (Tanzania); Togo; Tunisia; Zambia; Zimbabwe and Other Africa.
Note that Africa is identical to Memo: Africa (UN).
Non-OECD Americas LATAMER Includes Argentina; Plurinational State of Bolivia (Bolivia); Brazil; Colombia; Costa Rica; Cuba; Curacao 5 ; Dominican Republic; Ecuador; El Salvador; Guatemala; Haiti; Honduras; Jamaica; Nicaragua; Panama; Paraguay; Peru; Suriname (from 2000); Trinidad and Tobago; Uruguay; Bolivarian Republic of Venezuela (Venezuela) and Other non-OECD Americas.
Middle East MIDEAST Includes Bahrain; Islamic Republic of Iran; Iraq; Jordan; Kuwait; Lebanon; Oman; Qatar; Saudi Arabia; Syrian Arab Republic; United Arab Emirates and Yemen.
Non-OECD Europe and Eurasia
EURASIA Includes Albania; Armenia; Azerbaijan; Belarus; Bosnia and Herzegovina; Bulgaria; Croatia; Cyprus 6 ; Former Yugoslav Republic of Macedonia; Georgia; Gibraltar; Kazakhstan; Kosovo; Kyrgyzstan; Lithuania; Malta; Republic of Moldova (Moldova); Montenegro; Romania; Russian Federation; Serbia 7 ; Tajikistan; Turkmenistan; Ukraine; Uzbekistan; Former Soviet Union (prior to 1990) and Former Yugoslavia (prior to 1990). 8
5. Netherlands Antilles was dissolved on 10 October 2010, resulting in two new constituent countries, Curaçao and Sint Maarten, with the remaining islands joining the Netherlands as special municipalities. From 2012 onwards, data now account for the energy statistics of Curaçao Island only. Prior to 2012, data remain unchanged and still cover the entire territory of the former Netherlands Antilles. 6. Note byTurkey: The information in this document with reference to “Cyprus” relates to the southern part of the Island. There is no single authority representing both Turkish and Greek Cypriot people on the Island. Turkey recognises the Turkish Republic of Northern Cyprus (TRNC). Until a lasting and equitable solution is found within the context of the United Nations, Turkey shall preserve its position concerning the “Cyprus issue”. Note by all the European Union Member States of the OECD and the European Union: The Republic of Cyprus is recognised by all members of the United Nations with the exception of Turkey. The information in this document relates to the area under the effective control of the Government of the Republic of Cyprus. 7. Serbia includes Montenegro until 2004 and Kosovo until 1999. 8. Latvia became an OECD Member in July 2016. Accordingly, Latvia appears in the list of OECD Members and is not included in the non-OECD aggregates for data from 1990, starting with the 2017 edition. Prior to 1990, data for Latvia are included in Former Soviet Union.
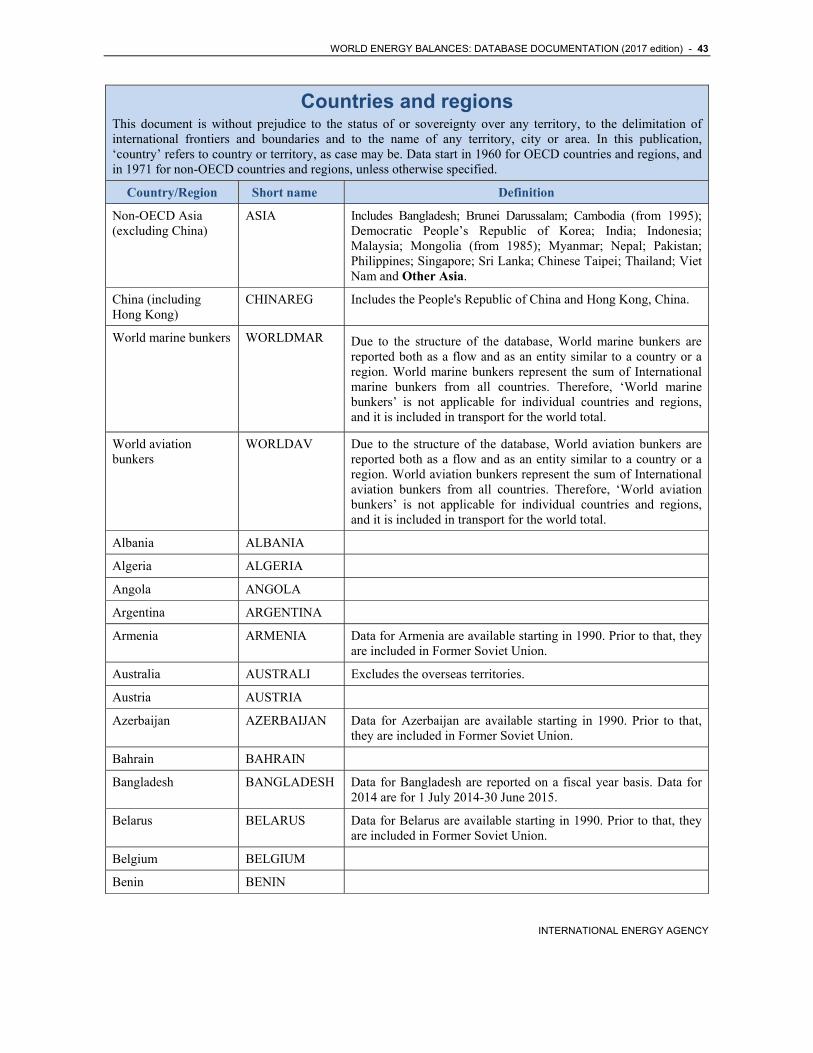
WORLD ENERGY BALANCES: DATABASE DOCUMENTATION (2017 edition) - 43
INTERNATIONAL ENERGY AGENCY
Countries and regions This document is without prejudice to the status of or sovereignty over any territory, to the delimitation of international frontiers and boundaries and to the name of any territory, city or area. In this publication, ‘country’ refers to country or territory, as case may be. Data start in 1960 for OECD countries and regions, and in 1971 for non-OECD countries and regions, unless otherwise specified.
Country/Region Short name Definition
Non-OECD Asia (excluding China)
ASIA Includes Bangladesh; Brunei Darussalam; Cambodia (from 1995); Democratic People’s Republic of Korea; India; Indonesia; Malaysia; Mongolia (from 1985); Myanmar; Nepal; Pakistan; Philippines; Singapore; Sri Lanka; Chinese Taipei; Thailand; Viet Nam and Other Asia.
China (including Hong Kong)
CHINAREG Includes the People's Republic of China and Hong Kong, China.
World marine bunkers WORLDMAR Due to the structure of the database, World marine bunkers are reported both as a flow and as an entity similar to a country or a region. World marine bunkers represent the sum of International marine bunkers from all countries. Therefore, ‘World marine bunkers’ is not applicable for individual countries and regions, and it is included in transport for the world total.
World aviation bunkers
WORLDAV Due to the structure of the database, World aviation bunkers are reported both as a flow and as an entity similar to a country or a region. World aviation bunkers represent the sum of International aviation bunkers from all countries. Therefore, ‘World aviation bunkers’ is not applicable for individual countries and regions, and it is included in transport for the world total.
Albania ALBANIA
Algeria ALGERIA
Angola ANGOLA
Argentina ARGENTINA
Armenia ARMENIA Data for Armenia are available starting in 1990. Prior to that, they are included in Former Soviet Union.
Australia AUSTRALI Excludes the overseas territories.
Austria AUSTRIA
Azerbaijan AZERBAIJAN Data for Azerbaijan are available starting in 1990. Prior to that, they are included in Former Soviet Union.
Bahrain BAHRAIN
Bangladesh BANGLADESH Data for Bangladesh are reported on a fiscal year basis. Data for 2014 are for 1 July 2014-30 June 2015.
Belarus BELARUS Data for Belarus are available starting in 1990. Prior to that, they are included in Former Soviet Union.
Belgium BELGIUM
Benin BENIN
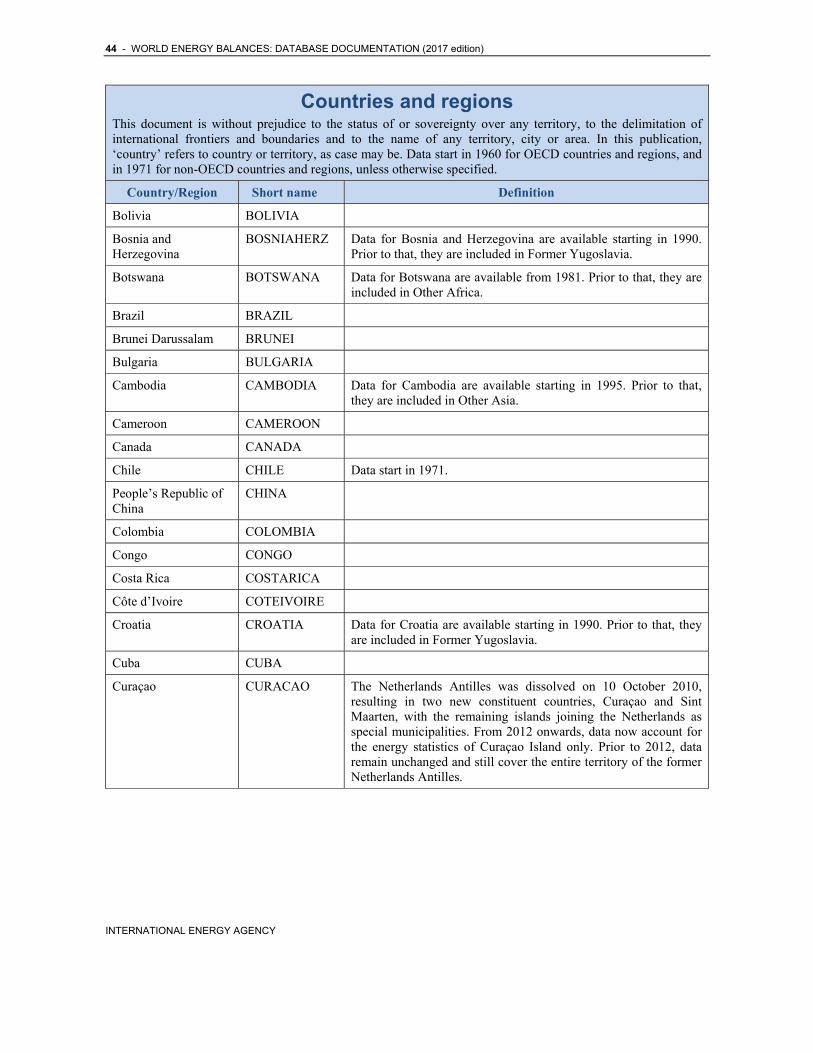
44 - WORLD ENERGY BALANCES: DATABASE DOCUMENTATION (2017 edition)
INTERNATIONAL ENERGY AGENCY
Countries and regions This document is without prejudice to the status of or sovereignty over any territory, to the delimitation of international frontiers and boundaries and to the name of any territory, city or area. In this publication, ‘country’ refers to country or territory, as case may be. Data start in 1960 for OECD countries and regions, and in 1971 for non-OECD countries and regions, unless otherwise specified.
Country/Region Short name Definition
Bolivia BOLIVIA
Bosnia and Herzegovina
BOSNIAHERZ Data for Bosnia and Herzegovina are available starting in 1990. Prior to that, they are included in Former Yugoslavia.
Botswana BOTSWANA Data for Botswana are available from 1981. Prior to that, they are included in Other Africa.
Brazil BRAZIL
Brunei Darussalam BRUNEI
Bulgaria BULGARIA
Cambodia CAMBODIA Data for Cambodia are available starting in 1995. Prior to that, they are included in Other Asia.
Cameroon CAMEROON
Canada CANADA
Chile CHILE Data start in 1971.
People’s Republic of China
CHINA
Colombia COLOMBIA
Congo CONGO
Costa Rica COSTARICA
Côte d’Ivoire COTEIVOIRE
Croatia CROATIA Data for Croatia are available starting in 1990. Prior to that, they are included in Former Yugoslavia.
Cuba CUBA
Curaçao CURACAO The Netherlands Antilles was dissolved on 10 October 2010, resulting in two new constituent countries, Curaçao and Sint Maarten, with the remaining islands joining the Netherlands as special municipalities. From 2012 onwards, data now account for the energy statistics of Curaçao Island only. Prior to 2012, data remain unchanged and still cover the entire territory of the former Netherlands Antilles.
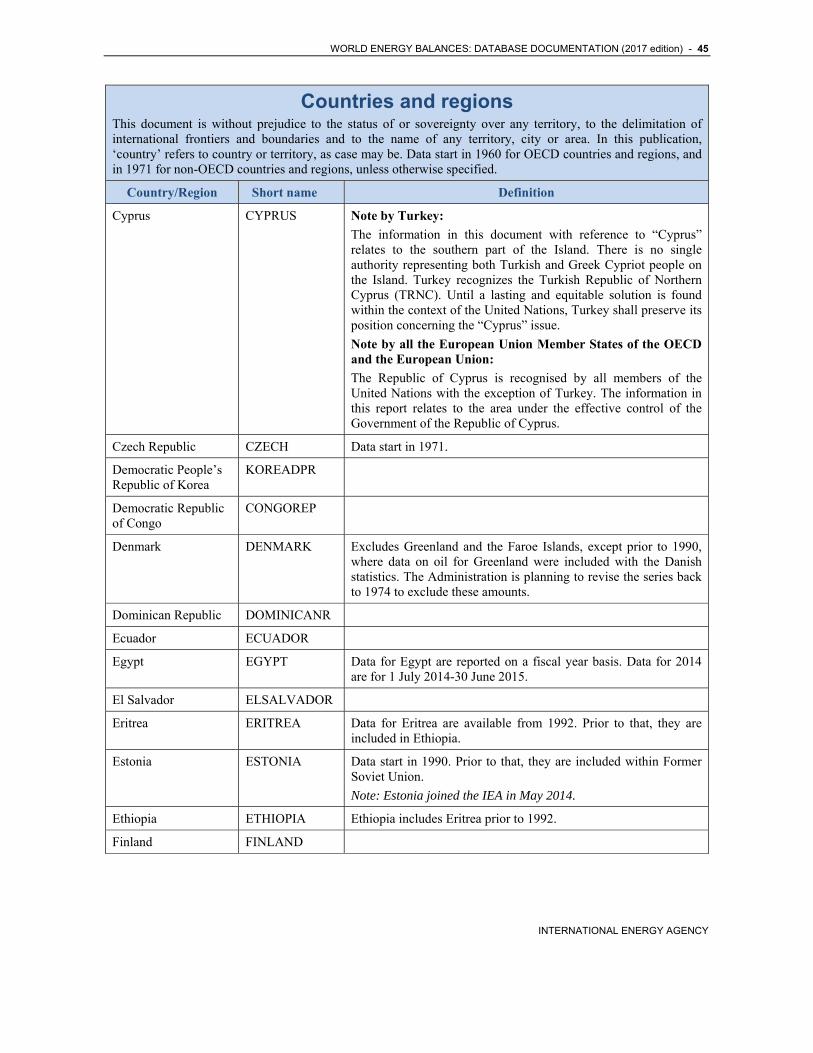
WORLD ENERGY BALANCES: DATABASE DOCUMENTATION (2017 edition) - 45
INTERNATIONAL ENERGY AGENCY
Countries and regions This document is without prejudice to the status of or sovereignty over any territory, to the delimitation of international frontiers and boundaries and to the name of any territory, city or area. In this publication, ‘country’ refers to country or territory, as case may be. Data start in 1960 for OECD countries and regions, and in 1971 for non-OECD countries and regions, unless otherwise specified.
Country/Region Short name Definition
Cyprus CYPRUS Note by Turkey:
The information in this document with reference to “Cyprus” relates to the southern part of the Island. There is no single authority representing both Turkish and Greek Cypriot people on the Island. Turkey recognizes the Turkish Republic of Northern Cyprus (TRNC). Until a lasting and equitable solution is found within the context of the United Nations, Turkey shall preserve its position concerning the “Cyprus” issue.
Note by all the European Union Member States of the OECD and the European Union:
The Republic of Cyprus is recognised by all members of the United Nations with the exception of Turkey. The information in this report relates to the area under the effective control of the Government of the Republic of Cyprus.
Czech Republic CZECH Data start in 1971.
Democratic People’s Republic of Korea
KOREADPR
Democratic Republic of Congo
CONGOREP
Denmark DENMARK Excludes Greenland and the Faroe Islands, except prior to 1990, where data on oil for Greenland were included with the Danish statistics. The Administration is planning to revise the series back to 1974 to exclude these amounts.
Dominican Republic DOMINICANR
Ecuador ECUADOR
Egypt EGYPT Data for Egypt are reported on a fiscal year basis. Data for 2014 are for 1 July 2014-30 June 2015.
El Salvador ELSALVADOR
Eritrea ERITREA Data for Eritrea are available from 1992. Prior to that, they are included in Ethiopia.
Estonia ESTONIA Data start in 1990. Prior to that, they are included within Former Soviet Union.
Note: Estonia joined the IEA in May 2014.
Ethiopia ETHIOPIA Ethiopia includes Eritrea prior to 1992.
Finland FINLAND
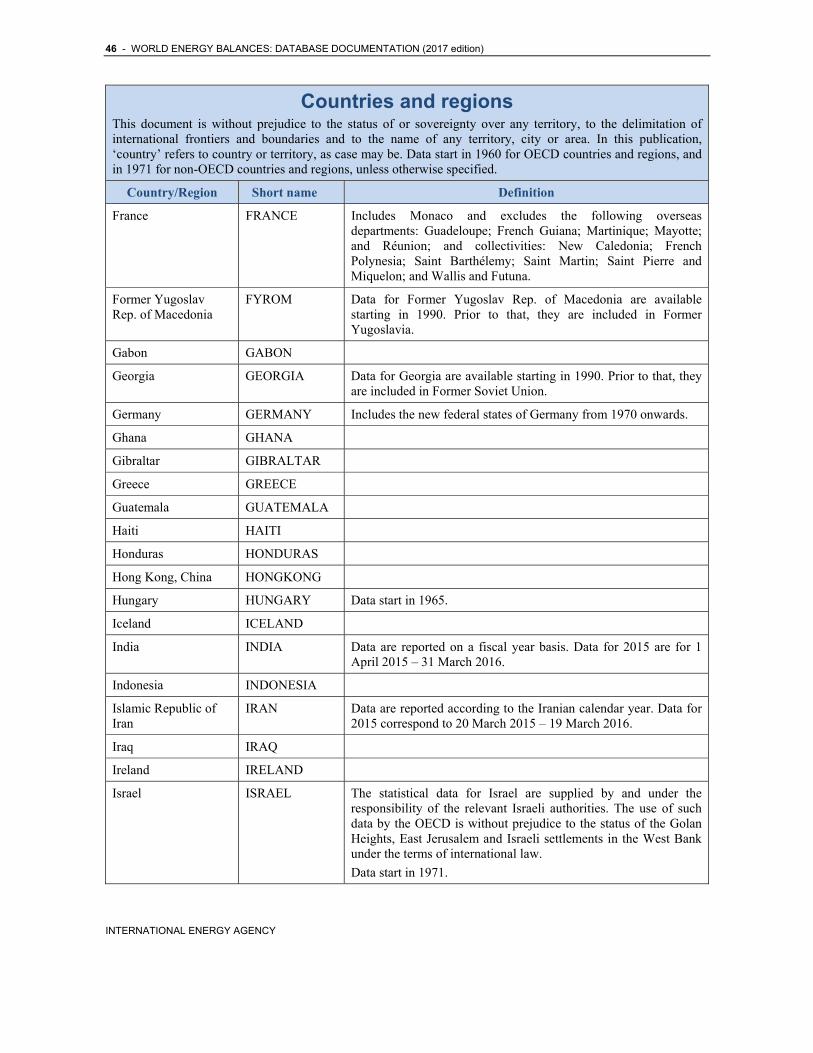
46 - WORLD ENERGY BALANCES: DATABASE DOCUMENTATION (2017 edition)
INTERNATIONAL ENERGY AGENCY
Countries and regions This document is without prejudice to the status of or sovereignty over any territory, to the delimitation of international frontiers and boundaries and to the name of any territory, city or area. In this publication, ‘country’ refers to country or territory, as case may be. Data start in 1960 for OECD countries and regions, and in 1971 for non-OECD countries and regions, unless otherwise specified.
Country/Region Short name Definition
France FRANCE Includes Monaco and excludes the following overseas departments: Guadeloupe; French Guiana; Martinique; Mayotte; and Réunion; and collectivities: New Caledonia; French Polynesia; Saint Barthélemy; Saint Martin; Saint Pierre and Miquelon; and Wallis and Futuna.
Former Yugoslav Rep. of Macedonia
FYROM Data for Former Yugoslav Rep. of Macedonia are available starting in 1990. Prior to that, they are included in Former Yugoslavia.
Gabon GABON
Georgia GEORGIA Data for Georgia are available starting in 1990. Prior to that, they are included in Former Soviet Union.
Germany GERMANY Includes the new federal states of Germany from 1970 onwards.
Ghana GHANA
Gibraltar GIBRALTAR
Greece GREECE
Guatemala GUATEMALA
Haiti HAITI
Honduras HONDURAS
Hong Kong, China HONGKONG
Hungary HUNGARY Data start in 1965.
Iceland ICELAND
India INDIA Data are reported on a fiscal year basis. Data for 2015 are for 1 April 2015 – 31 March 2016.
Indonesia INDONESIA
Islamic Republic of Iran
IRAN Data are reported according to the Iranian calendar year. Data for 2015 correspond to 20 March 2015 – 19 March 2016.
Iraq IRAQ
Ireland IRELAND
Israel ISRAEL The statistical data for Israel are supplied by and under the responsibility of the relevant Israeli authorities. The use of such data by the OECD is without prejudice to the status of the Golan Heights, East Jerusalem and Israeli settlements in the West Bank under the terms of international law.
Data start in 1971.
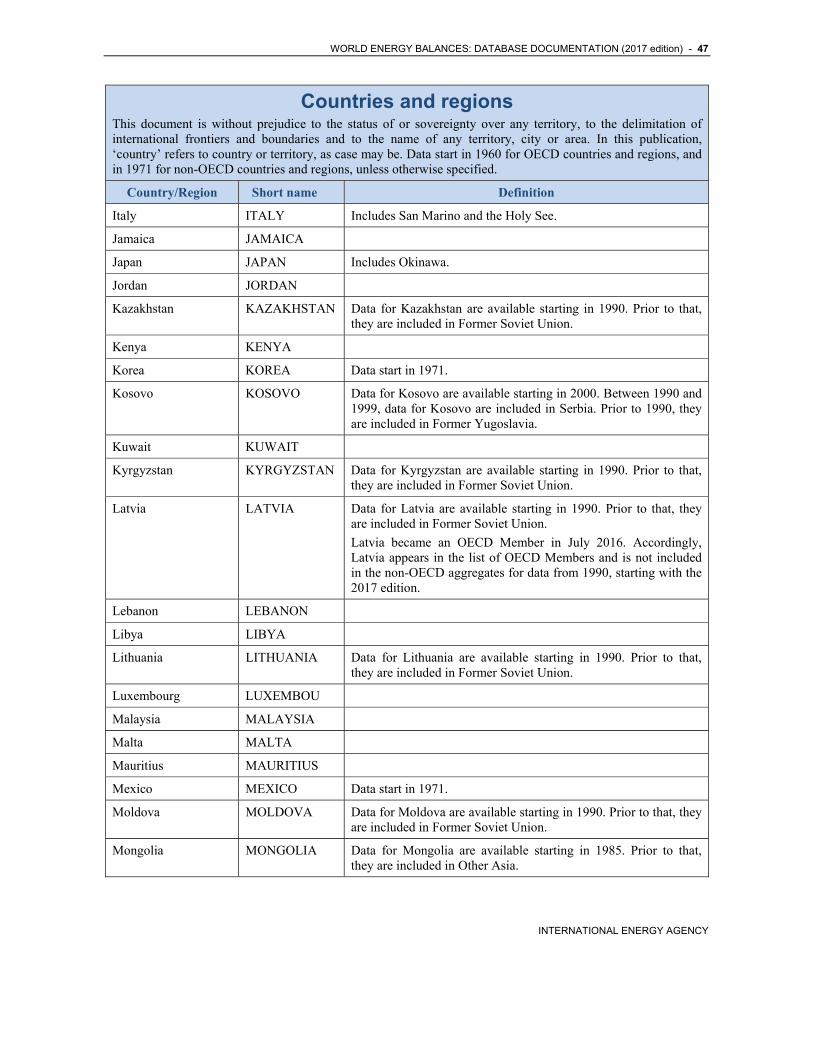
WORLD ENERGY BALANCES: DATABASE DOCUMENTATION (2017 edition) - 47
INTERNATIONAL ENERGY AGENCY
Countries and regions This document is without prejudice to the status of or sovereignty over any territory, to the delimitation of international frontiers and boundaries and to the name of any territory, city or area. In this publication, ‘country’ refers to country or territory, as case may be. Data start in 1960 for OECD countries and regions, and in 1971 for non-OECD countries and regions, unless otherwise specified.
Country/Region Short name Definition
Italy ITALY Includes San Marino and the Holy See.
Jamaica JAMAICA
Japan JAPAN Includes Okinawa.
Jordan JORDAN
Kazakhstan KAZAKHSTAN Data for Kazakhstan are available starting in 1990. Prior to that, they are included in Former Soviet Union.
Kenya KENYA
Korea KOREA Data start in 1971.
Kosovo KOSOVO Data for Kosovo are available starting in 2000. Between 1990 and 1999, data for Kosovo are included in Serbia. Prior to 1990, they are included in Former Yugoslavia.
Kuwait KUWAIT
Kyrgyzstan KYRGYZSTAN Data for Kyrgyzstan are available starting in 1990. Prior to that, they are included in Former Soviet Union.
Latvia LATVIA Data for Latvia are available starting in 1990. Prior to that, they are included in Former Soviet Union.
Latvia became an OECD Member in July 2016. Accordingly, Latvia appears in the list of OECD Members and is not included in the non-OECD aggregates for data from 1990, starting with the 2017 edition.
Lebanon LEBANON
Libya LIBYA
Lithuania LITHUANIA Data for Lithuania are available starting in 1990. Prior to that, they are included in Former Soviet Union.
Luxembourg LUXEMBOU
Malaysia MALAYSIA
Malta MALTA
Mauritius MAURITIUS
Mexico MEXICO Data start in 1971.
Moldova MOLDOVA Data for Moldova are available starting in 1990. Prior to that, they are included in Former Soviet Union.
Mongolia MONGOLIA Data for Mongolia are available starting in 1985. Prior to that, they are included in Other Asia.
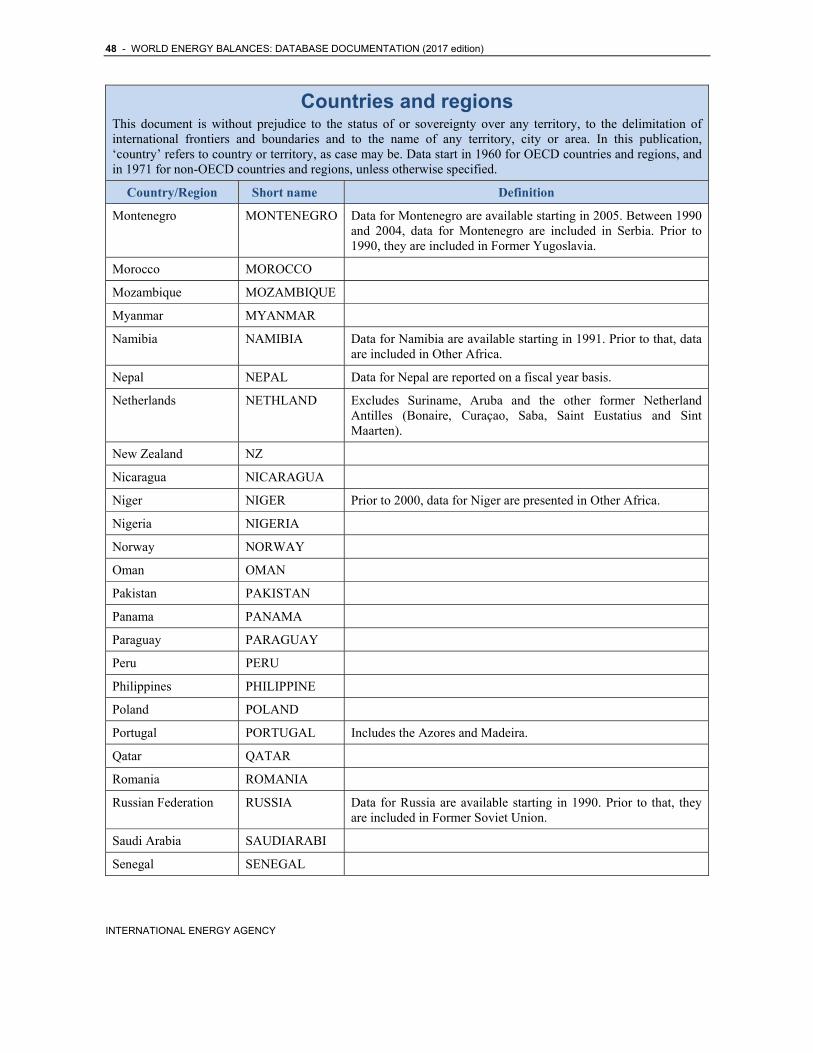
48 - WORLD ENERGY BALANCES: DATABASE DOCUMENTATION (2017 edition)
INTERNATIONAL ENERGY AGENCY
Countries and regions This document is without prejudice to the status of or sovereignty over any territory, to the delimitation of international frontiers and boundaries and to the name of any territory, city or area. In this publication, ‘country’ refers to country or territory, as case may be. Data start in 1960 for OECD countries and regions, and in 1971 for non-OECD countries and regions, unless otherwise specified.
Country/Region Short name Definition
Montenegro MONTENEGRO Data for Montenegro are available starting in 2005. Between 1990 and 2004, data for Montenegro are included in Serbia. Prior to 1990, they are included in Former Yugoslavia.
Morocco MOROCCO
Mozambique MOZAMBIQUE
Myanmar MYANMAR
Namibia NAMIBIA Data for Namibia are available starting in 1991. Prior to that, data are included in Other Africa.
Nepal NEPAL Data for Nepal are reported on a fiscal year basis.
Netherlands NETHLAND Excludes Suriname, Aruba and the other former Netherland Antilles (Bonaire, Curaçao, Saba, Saint Eustatius and Sint Maarten).
New Zealand NZ
Nicaragua NICARAGUA
Niger NIGER Prior to 2000, data for Niger are presented in Other Africa.
Nigeria NIGERIA
Norway NORWAY
Oman OMAN
Pakistan PAKISTAN
Panama PANAMA
Paraguay PARAGUAY
Peru PERU
Philippines PHILIPPINE
Poland POLAND
Portugal PORTUGAL Includes the Azores and Madeira.
Qatar QATAR
Romania ROMANIA
Russian Federation RUSSIA Data for Russia are available starting in 1990. Prior to that, they are included in Former Soviet Union.
Saudi Arabia SAUDIARABI
Senegal SENEGAL
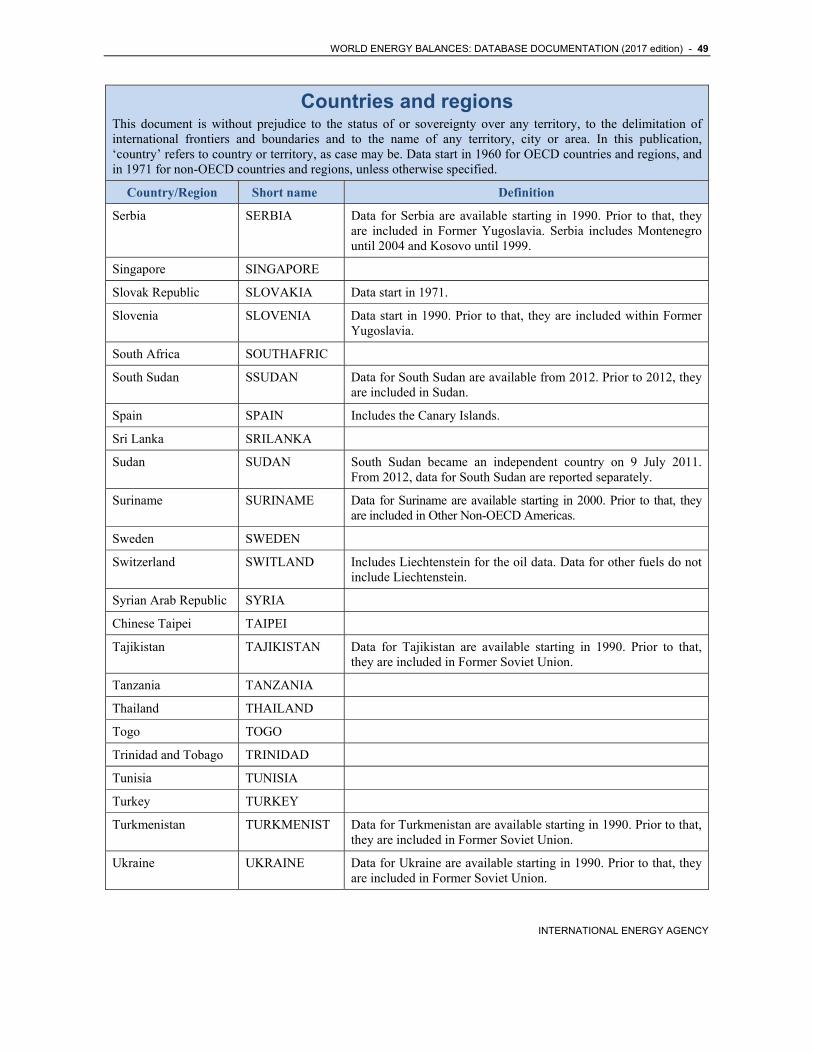
WORLD ENERGY BALANCES: DATABASE DOCUMENTATION (2017 edition) - 49
INTERNATIONAL ENERGY AGENCY
Countries and regions This document is without prejudice to the status of or sovereignty over any territory, to the delimitation of international frontiers and boundaries and to the name of any territory, city or area. In this publication, ‘country’ refers to country or territory, as case may be. Data start in 1960 for OECD countries and regions, and in 1971 for non-OECD countries and regions, unless otherwise specified.
Country/Region Short name Definition
Serbia SERBIA Data for Serbia are available starting in 1990. Prior to that, they are included in Former Yugoslavia. Serbia includes Montenegro until 2004 and Kosovo until 1999.
Singapore SINGAPORE
Slovak Republic SLOVAKIA Data start in 1971.
Slovenia SLOVENIA Data start in 1990. Prior to that, they are included within Former Yugoslavia.
South Africa SOUTHAFRIC
South Sudan SSUDAN Data for South Sudan are available from 2012. Prior to 2012, they are included in Sudan.
Spain SPAIN Includes the Canary Islands.
Sri Lanka SRILANKA
Sudan SUDAN South Sudan became an independent country on 9 July 2011. From 2012, data for South Sudan are reported separately.
Suriname SURINAME Data for Suriname are available starting in 2000. Prior to that, they are included in Other Non-OECD Americas.
Sweden SWEDEN
Switzerland SWITLAND Includes Liechtenstein for the oil data. Data for other fuels do not include Liechtenstein.
Syrian Arab Republic SYRIA
Chinese Taipei TAIPEI
Tajikistan TAJIKISTAN Data for Tajikistan are available starting in 1990. Prior to that, they are included in Former Soviet Union.
Tanzania TANZANIA
Thailand THAILAND
Togo TOGO
Trinidad and Tobago TRINIDAD
Tunisia TUNISIA
Turkey TURKEY
Turkmenistan TURKMENIST Data for Turkmenistan are available starting in 1990. Prior to that, they are included in Former Soviet Union.
Ukraine UKRAINE Data for Ukraine are available starting in 1990. Prior to that, they are included in Former Soviet Union.
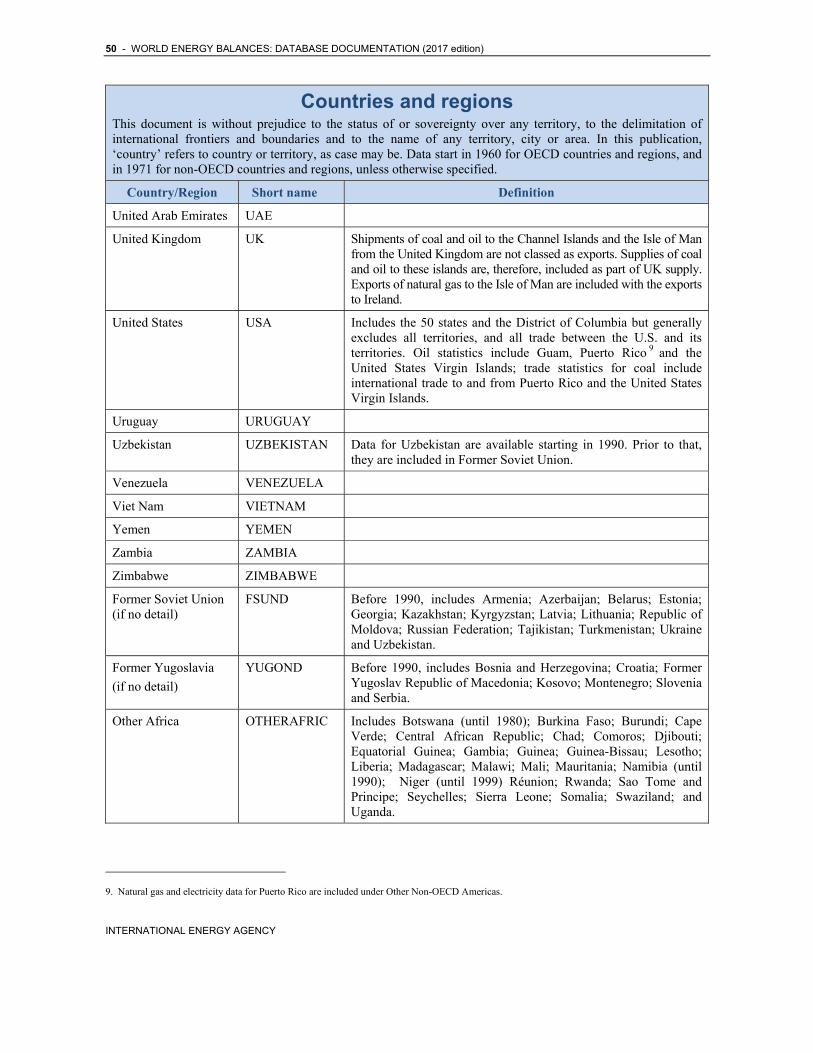
50 - WORLD ENERGY BALANCES: DATABASE DOCUMENTATION (2017 edition)
INTERNATIONAL ENERGY AGENCY
Countries and regions This document is without prejudice to the status of or sovereignty over any territory, to the delimitation of international frontiers and boundaries and to the name of any territory, city or area. In this publication, ‘country’ refers to country or territory, as case may be. Data start in 1960 for OECD countries and regions, and in 1971 for non-OECD countries and regions, unless otherwise specified.
Country/Region Short name Definition
United Arab Emirates UAE
United Kingdom UK Shipments of coal and oil to the Channel Islands and the Isle of Man from the United Kingdom are not classed as exports. Supplies of coal and oil to these islands are, therefore, included as part of UK supply. Exports of natural gas to the Isle of Man are included with the exports to Ireland.
United States USA Includes the 50 states and the District of Columbia but generally excludes all territories, and all trade between the U.S. and its territories. Oil statistics include Guam, Puerto Rico 9 and the United States Virgin Islands; trade statistics for coal include international trade to and from Puerto Rico and the United States Virgin Islands.
Uruguay URUGUAY
Uzbekistan UZBEKISTAN Data for Uzbekistan are available starting in 1990. Prior to that, they are included in Former Soviet Union.
Venezuela VENEZUELA
Viet Nam VIETNAM
Yemen YEMEN
Zambia ZAMBIA
Zimbabwe ZIMBABWE
Former Soviet Union (if no detail)
FSUND Before 1990, includes Armenia; Azerbaijan; Belarus; Estonia; Georgia; Kazakhstan; Kyrgyzstan; Latvia; Lithuania; Republic of Moldova; Russian Federation; Tajikistan; Turkmenistan; Ukraine and Uzbekistan.
Former Yugoslavia
(if no detail)
YUGOND Before 1990, includes Bosnia and Herzegovina; Croatia; Former Yugoslav Republic of Macedonia; Kosovo; Montenegro; Slovenia and Serbia.
Other Africa OTHERAFRIC
Includes Botswana (until 1980); Burkina Faso; Burundi; Cape Verde; Central African Republic; Chad; Comoros; Djibouti; Equatorial Guinea; Gambia; Guinea; Guinea-Bissau; Lesotho; Liberia; Madagascar; Malawi; Mali; Mauritania; Namibia (until 1990); Niger (until 1999) Réunion; Rwanda; Sao Tome and Principe; Seychelles; Sierra Leone; Somalia; Swaziland; and Uganda.
9. Natural gas and electricity data for Puerto Rico are included under Other Non-OECD Americas.
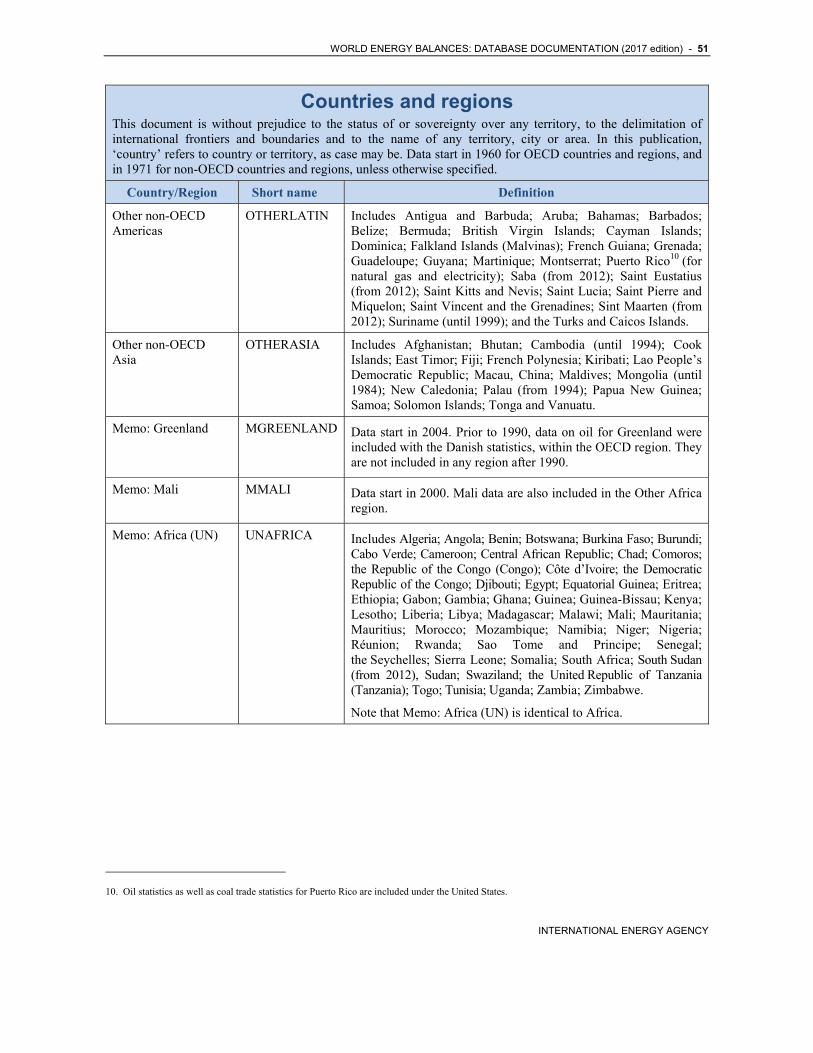
WORLD ENERGY BALANCES: DATABASE DOCUMENTATION (2017 edition) - 51
INTERNATIONAL ENERGY AGENCY
Countries and regions This document is without prejudice to the status of or sovereignty over any territory, to the delimitation of international frontiers and boundaries and to the name of any territory, city or area. In this publication, ‘country’ refers to country or territory, as case may be. Data start in 1960 for OECD countries and regions, and in 1971 for non-OECD countries and regions, unless otherwise specified.
Country/Region Short name Definition
Other non-OECD Americas
OTHERLATIN
Includes Antigua and Barbuda; Aruba; Bahamas; Barbados; Belize; Bermuda; British Virgin Islands; Cayman Islands; Dominica; Falkland Islands (Malvinas); French Guiana; Grenada; Guadeloupe; Guyana; Martinique; Montserrat; Puerto Rico10 (for natural gas and electricity); Saba (from 2012); Saint Eustatius (from 2012); Saint Kitts and Nevis; Saint Lucia; Saint Pierre and Miquelon; Saint Vincent and the Grenadines; Sint Maarten (from 2012); Suriname (until 1999); and the Turks and Caicos Islands.
Other non-OECD Asia
OTHERASIA
Includes Afghanistan; Bhutan; Cambodia (until 1994); Cook Islands; East Timor; Fiji; French Polynesia; Kiribati; Lao People’s Democratic Republic; Macau, China; Maldives; Mongolia (until 1984); New Caledonia; Palau (from 1994); Papua New Guinea; Samoa; Solomon Islands; Tonga and Vanuatu.
Memo: Greenland MGREENLAND Data start in 2004. Prior to 1990, data on oil for Greenland were included with the Danish statistics, within the OECD region. They are not included in any region after 1990.
Memo: Mali MMALI Data start in 2000. Mali data are also included in the Other Africa region.
Memo: Africa (UN) UNAFRICA Includes Algeria; Angola; Benin; Botswana; Burkina Faso; Burundi; Cabo Verde; Cameroon; Central African Republic; Chad; Comoros; the Republic of the Congo (Congo); Côte d’Ivoire; the Democratic Republic of the Congo; Djibouti; Egypt; Equatorial Guinea; Eritrea; Ethiopia; Gabon; Gambia; Ghana; Guinea; Guinea-Bissau; Kenya; Lesotho; Liberia; Libya; Madagascar; Malawi; Mali; Mauritania; Mauritius; Morocco; Mozambique; Namibia; Niger; Nigeria; Réunion; Rwanda; Sao Tome and Principe; Senegal; the Seychelles; Sierra Leone; Somalia; South Africa; South Sudan (from 2012), Sudan; Swaziland; the United Republic of Tanzania (Tanzania); Togo; Tunisia; Uganda; Zambia; Zimbabwe.
Note that Memo: Africa (UN) is identical to Africa.
10. Oil statistics as well as coal trade statistics for Puerto Rico are included under the United States.
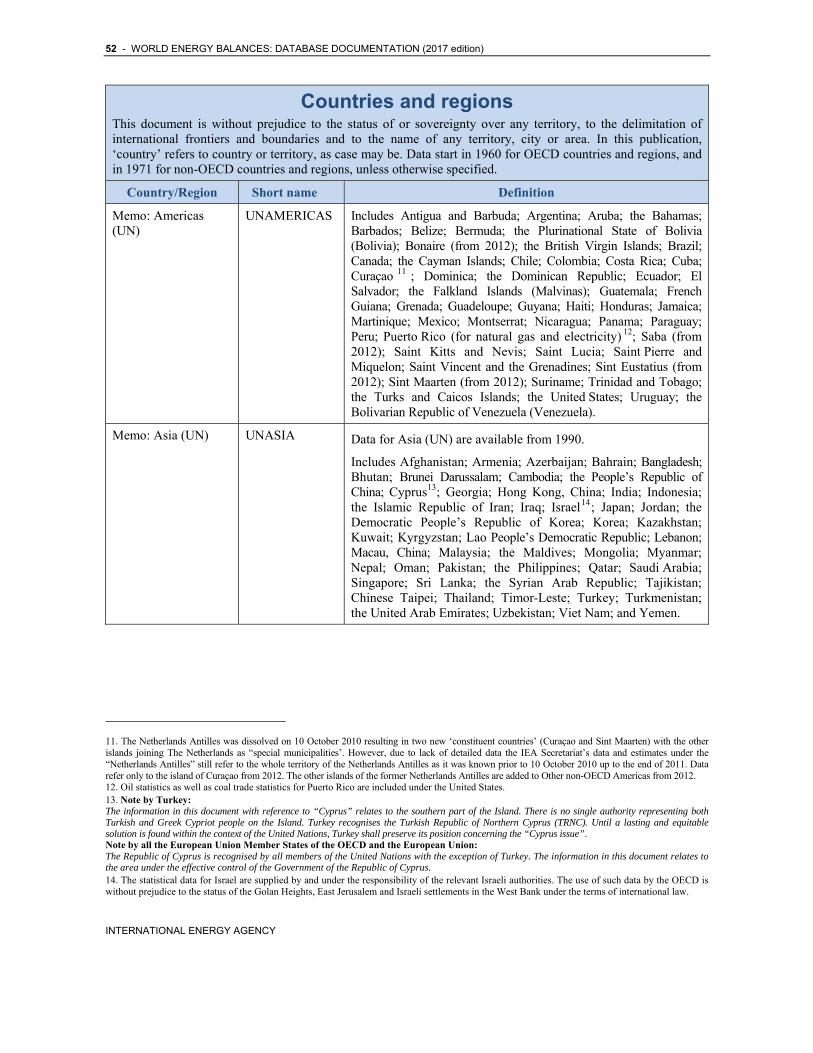
52 - WORLD ENERGY BALANCES: DATABASE DOCUMENTATION (2017 edition)
INTERNATIONAL ENERGY AGENCY
Countries and regions This document is without prejudice to the status of or sovereignty over any territory, to the delimitation of international frontiers and boundaries and to the name of any territory, city or area. In this publication, ‘country’ refers to country or territory, as case may be. Data start in 1960 for OECD countries and regions, and in 1971 for non-OECD countries and regions, unless otherwise specified.
Country/Region Short name Definition
Memo: Americas (UN)
UNAMERICAS Includes Antigua and Barbuda; Argentina; Aruba; the Bahamas; Barbados; Belize; Bermuda; the Plurinational State of Bolivia (Bolivia); Bonaire (from 2012); the British Virgin Islands; Brazil; Canada; the Cayman Islands; Chile; Colombia; Costa Rica; Cuba; Curaçao 11 ; Dominica; the Dominican Republic; Ecuador; El Salvador; the Falkland Islands (Malvinas); Guatemala; French Guiana; Grenada; Guadeloupe; Guyana; Haiti; Honduras; Jamaica; Martinique; Mexico; Montserrat; Nicaragua; Panama; Paraguay; Peru; Puerto Rico (for natural gas and electricity) 12; Saba (from 2012); Saint Kitts and Nevis; Saint Lucia; Saint Pierre and Miquelon; Saint Vincent and the Grenadines; Sint Eustatius (from 2012); Sint Maarten (from 2012); Suriname; Trinidad and Tobago; the Turks and Caicos Islands; the United States; Uruguay; the Bolivarian Republic of Venezuela (Venezuela).
Memo: Asia (UN) UNASIA Data for Asia (UN) are available from 1990.
Includes Afghanistan; Armenia; Azerbaijan; Bahrain; Bangladesh; Bhutan; Brunei Darussalam; Cambodia; the People’s Republic of China; Cyprus13; Georgia; Hong Kong, China; India; Indonesia; the Islamic Republic of Iran; Iraq; Israel14; Japan; Jordan; the Democratic People’s Republic of Korea; Korea; Kazakhstan; Kuwait; Kyrgyzstan; Lao People’s Democratic Republic; Lebanon; Macau, China; Malaysia; the Maldives; Mongolia; Myanmar; Nepal; Oman; Pakistan; the Philippines; Qatar; Saudi Arabia; Singapore; Sri Lanka; the Syrian Arab Republic; Tajikistan; Chinese Taipei; Thailand; Timor-Leste; Turkey; Turkmenistan; the United Arab Emirates; Uzbekistan; Viet Nam; and Yemen.
11. The Netherlands Antilles was dissolved on 10 October 2010 resulting in two new ‘constituent countries’ (Curaçao and Sint Maarten) with the other islands joining The Netherlands as “special municipalities’. However, due to lack of detailed data the IEA Secretariat’s data and estimates under the “Netherlands Antilles” still refer to the whole territory of the Netherlands Antilles as it was known prior to 10 October 2010 up to the end of 2011. Data refer only to the island of Curaçao from 2012. The other islands of the former Netherlands Antilles are added to Other non-OECD Americas from 2012. 12. Oil statistics as well as coal trade statistics for Puerto Rico are included under the United States. 13. Note by Turkey: The information in this document with reference to “Cyprus” relates to the southern part of the Island. There is no single authority representing both Turkish and Greek Cypriot people on the Island. Turkey recognises the Turkish Republic of Northern Cyprus (TRNC). Until a lasting and equitable solution is found within the context of the United Nations, Turkey shall preserve its position concerning the “Cyprus issue”. Note by all the European Union Member States of the OECD and the European Union: The Republic of Cyprus is recognised by all members of the United Nations with the exception of Turkey. The information in this document relates to the area under the effective control of the Government of the Republic of Cyprus. 14. The statistical data for Israel are supplied by and under the responsibility of the relevant Israeli authorities. The use of such data by the OECD is without prejudice to the status of the Golan Heights, East Jerusalem and Israeli settlements in the West Bank under the terms of international law.
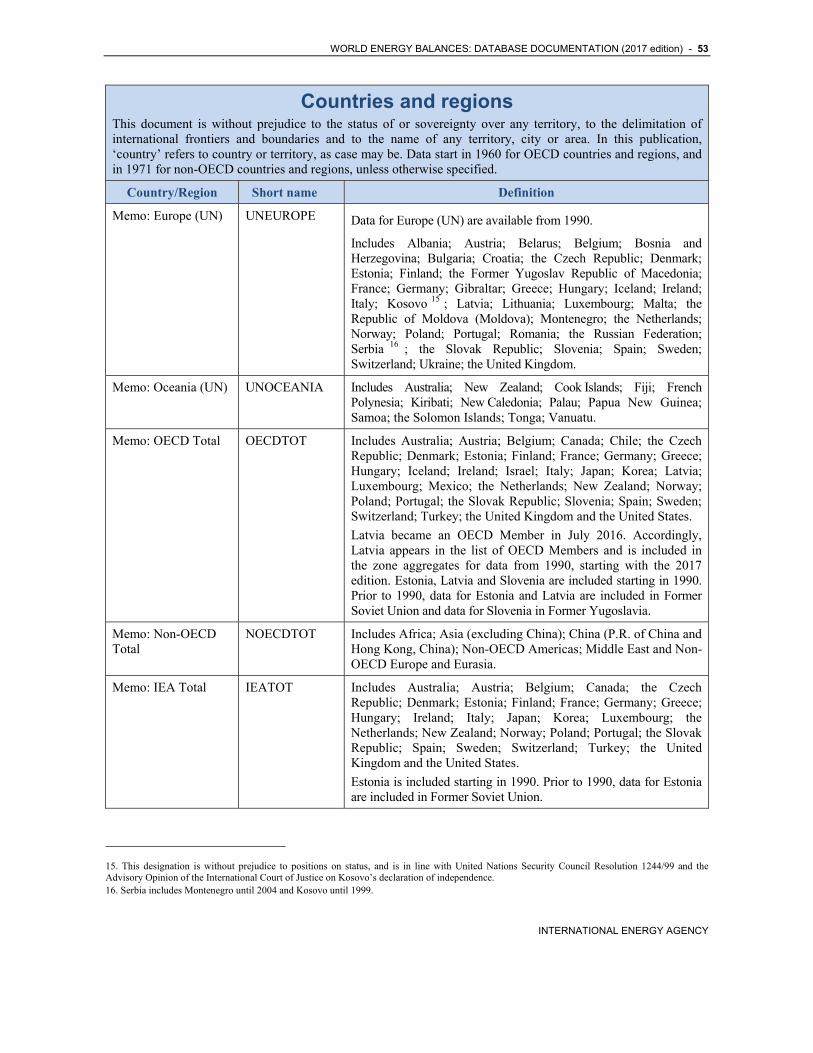
WORLD ENERGY BALANCES: DATABASE DOCUMENTATION (2017 edition) - 53
INTERNATIONAL ENERGY AGENCY
Countries and regions This document is without prejudice to the status of or sovereignty over any territory, to the delimitation of international frontiers and boundaries and to the name of any territory, city or area. In this publication, ‘country’ refers to country or territory, as case may be. Data start in 1960 for OECD countries and regions, and in 1971 for non-OECD countries and regions, unless otherwise specified.
Country/Region Short name Definition
Memo: Europe (UN) UNEUROPE Data for Europe (UN) are available from 1990.
Includes Albania; Austria; Belarus; Belgium; Bosnia and Herzegovina; Bulgaria; Croatia; the Czech Republic; Denmark; Estonia; Finland; the Former Yugoslav Republic of Macedonia; France; Germany; Gibraltar; Greece; Hungary; Iceland; Ireland; Italy; Kosovo 15 ; Latvia; Lithuania; Luxembourg; Malta; the Republic of Moldova (Moldova); Montenegro; the Netherlands; Norway; Poland; Portugal; Romania; the Russian Federation; Serbia 16 ; the Slovak Republic; Slovenia; Spain; Sweden; Switzerland; Ukraine; the United Kingdom.
Memo: Oceania (UN) UNOCEANIA Includes Australia; New Zealand; Cook Islands; Fiji; French Polynesia; Kiribati; New Caledonia; Palau; Papua New Guinea; Samoa; the Solomon Islands; Tonga; Vanuatu.
Memo: OECD Total OECDTOT Includes Australia; Austria; Belgium; Canada; Chile; the Czech Republic; Denmark; Estonia; Finland; France; Germany; Greece; Hungary; Iceland; Ireland; Israel; Italy; Japan; Korea; Latvia; Luxembourg; Mexico; the Netherlands; New Zealand; Norway; Poland; Portugal; the Slovak Republic; Slovenia; Spain; Sweden; Switzerland; Turkey; the United Kingdom and the United States.
Latvia became an OECD Member in July 2016. Accordingly, Latvia appears in the list of OECD Members and is included in the zone aggregates for data from 1990, starting with the 2017 edition. Estonia, Latvia and Slovenia are included starting in 1990. Prior to 1990, data for Estonia and Latvia are included in Former Soviet Union and data for Slovenia in Former Yugoslavia.
Memo: Non-OECD Total
NOECDTOT Includes Africa; Asia (excluding China); China (P.R. of China and Hong Kong, China); Non-OECD Americas; Middle East and Non-OECD Europe and Eurasia.
Memo: IEA Total IEATOT Includes Australia; Austria; Belgium; Canada; the Czech Republic; Denmark; Estonia; Finland; France; Germany; Greece; Hungary; Ireland; Italy; Japan; Korea; Luxembourg; the Netherlands; New Zealand; Norway; Poland; Portugal; the Slovak Republic; Spain; Sweden; Switzerland; Turkey; the United Kingdom and the United States.
Estonia is included starting in 1990. Prior to 1990, data for Estonia are included in Former Soviet Union.
15. This designation is without prejudice to positions on status, and is in line with United Nations Security Council Resolution 1244/99 and the Advisory Opinion of the International Court of Justice on Kosovo’s declaration of independence. 16. Serbia includes Montenegro until 2004 and Kosovo until 1999.
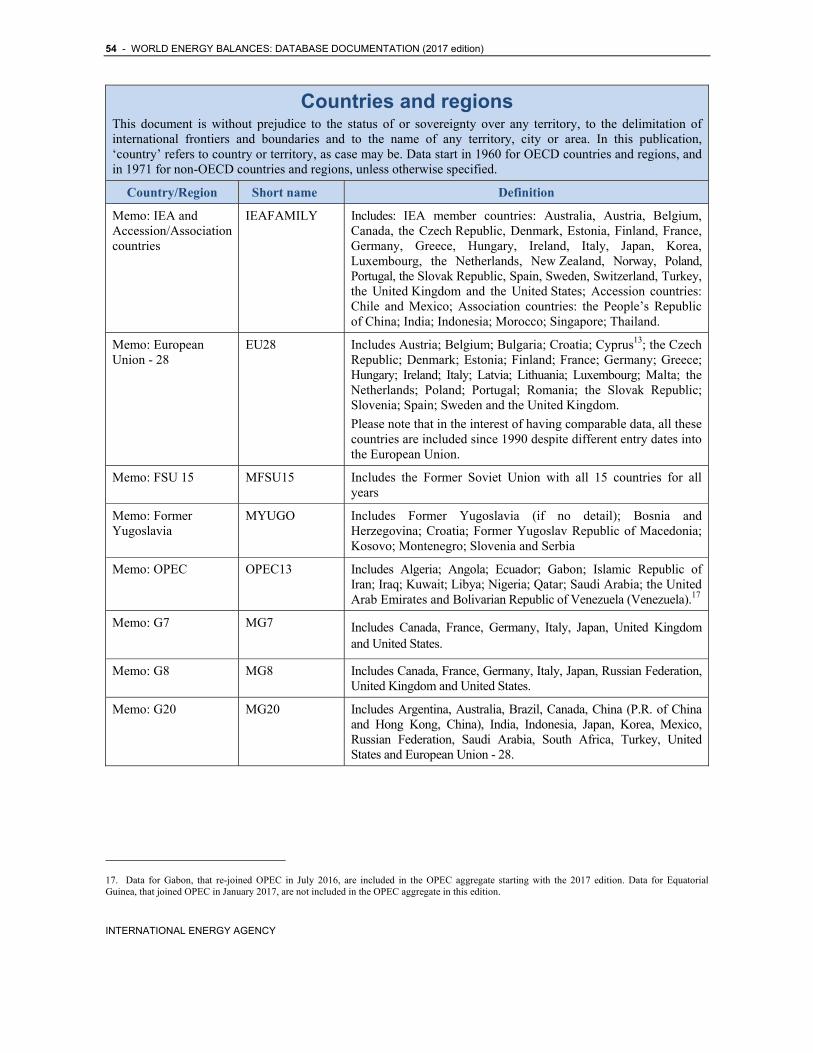
54 - WORLD ENERGY BALANCES: DATABASE DOCUMENTATION (2017 edition)
INTERNATIONAL ENERGY AGENCY
Countries and regions This document is without prejudice to the status of or sovereignty over any territory, to the delimitation of international frontiers and boundaries and to the name of any territory, city or area. In this publication, ‘country’ refers to country or territory, as case may be. Data start in 1960 for OECD countries and regions, and in 1971 for non-OECD countries and regions, unless otherwise specified.
Country/Region Short name Definition
Memo: IEA and Accession/Association countries
IEAFAMILY Includes: IEA member countries: Australia, Austria, Belgium, Canada, the Czech Republic, Denmark, Estonia, Finland, France, Germany, Greece, Hungary, Ireland, Italy, Japan, Korea, Luxembourg, the Netherlands, New Zealand, Norway, Poland, Portugal, the Slovak Republic, Spain, Sweden, Switzerland, Turkey, the United Kingdom and the United States; Accession countries: Chile and Mexico; Association countries: the People’s Republic of China; India; Indonesia; Morocco; Singapore; Thailand.
Memo: European Union - 28
EU28 Includes Austria; Belgium; Bulgaria; Croatia; Cyprus13; the Czech Republic; Denmark; Estonia; Finland; France; Germany; Greece; Hungary; Ireland; Italy; Latvia; Lithuania; Luxembourg; Malta; the Netherlands; Poland; Portugal; Romania; the Slovak Republic; Slovenia; Spain; Sweden and the United Kingdom.
Please note that in the interest of having comparable data, all these countries are included since 1990 despite different entry dates into the European Union.
Memo: FSU 15 MFSU15 Includes the Former Soviet Union with all 15 countries for all years
Memo: Former Yugoslavia
MYUGO Includes Former Yugoslavia (if no detail); Bosnia and Herzegovina; Croatia; Former Yugoslav Republic of Macedonia; Kosovo; Montenegro; Slovenia and Serbia
Memo: OPEC OPEC13 Includes Algeria; Angola; Ecuador; Gabon; Islamic Republic of Iran; Iraq; Kuwait; Libya; Nigeria; Qatar; Saudi Arabia; the United Arab Emirates and Bolivarian Republic of Venezuela (Venezuela).17
Memo: G7 MG7 Includes Canada, France, Germany, Italy, Japan, United Kingdom and United States.
Memo: G8 MG8 Includes Canada, France, Germany, Italy, Japan, Russian Federation, United Kingdom and United States.
Memo: G20 MG20 Includes Argentina, Australia, Brazil, Canada, China (P.R. of China and Hong Kong, China), India, Indonesia, Japan, Korea, Mexico, Russian Federation, Saudi Arabia, South Africa, Turkey, United States and European Union - 28.
17. Data for Gabon, that re-joined OPEC in July 2016, are included in the OPEC aggregate starting with the 2017 edition. Data for Equatorial Guinea, that joined OPEC in January 2017, are not included in the OPEC aggregate in this edition.
WORLD ENERGY BALANCES: DATABASE DOCUMENTATION (2017 edition) - 55
INTERNATIONAL ENERGY AGENCY
Countries and regions This document is without prejudice to the status of or sovereignty over any territory, to the delimitation of international frontiers and boundaries and to the name of any territory, city or area. In this publication, ‘country’ refers to country or territory, as case may be. Data start in 1960 for OECD countries and regions, and in 1971 for non-OECD countries and regions, unless otherwise specified.
Country/Region Short name Definition
Please note that the following countries have not been considered:
Non-OECD Europe and Eurasia: Andorra; Faroe Islands (after 1990); Liechtenstein18 (except for oil data); the Palestinian Authority; Svalbard; Jan Mayen Islands;
Africa: British Indian Ocean Territory; French Southern and Antarctic Lands; Mayotte; Saint Helena; Western Sahara;
Non-OECD Americas: Anguilla; Bouvet Island; Saint Barthélemy; Greenland (after 1990); Saint Martin (French Part); South Georgia and the South Sandwich Islands;
Antarctica;
Non-OECD Asia excluding China: American Samoa; Cocos (Keeling) Islands; Christmas Island; Heard Island and McDonald Islands; Marshall Islands; Micronesia (Federated States of); Nauru; Niue; Norfolk Island; Northern Mariana Islands; Pitcairn; Tokelau; Tuvalu; United States Minor Outlying Islands; Wallis and Futuna Islands.
18. Oil data for Liechtenstein are included under Switzerland.
56 - WORLD ENERGY BALANCES: DATABASE DOCUMENTATION (2017 edition)
INTERNATIONAL ENERGY AGENCY
6. COUNTRY NOTES AND SOURCES
OECD COUNTRIES
General notes
The notes given in this document refer to data for the years 1960 to 2015 published in the book, as well as on CD-ROM and in the on-line data service. In general, more detailed notes are available for data starting in 1990.
Data are obtained through annual submission of five fuel questionnaires from mational administrations, as indicated for each country in the section on sources.
In some instances it has been necessary for the IEA Secretariat to estimate some data; explanations of the estimates are provided in the country notes. For more information on fuel-specific methodologies, please refer to the various IEA information books. Energy data reported for 2016 (shown as 2016p) in the final release are provisional supply data based on submissions received in early 2017 and on monthly submissions to the IEA from member countries.
This section lists a few specific notes that apply to all countries, and it is followed by a time series of comprehensive country-specific notes by fuel and flow.
Prior to 1974, most fuel inputs and electricity and heat outputs for autoproducers are included in main activity producers. The figures for the quantities of fuels used for the generation of electricity and heat and the corresponding outputs in CHP and heat plants should be used with caution. Despite estimates introduced by the IEA Secretariat, inputs and outputs are not always consistent. Please refer to notes below under Electricity and heat.
Data for anthracite, coking coal, other bituminous coal, sub-bituminous coal and lignite are available sep-arately from 1978. Prior to 1978, only data for hard
coal and brown coal (lignite/sub-bituminous coal) are available.
In 1996, the IEA Secretariat extensively revised data on coal and coke use in blast furnaces, and in the iron and steel industry (for those countries with blast furnaces), based on data provided to the OECD Steel Committee and other sources. The quantities of fuels transformed into blast furnace gas have been estimated by the IEA Secretariat based on its blast furnace model.
For biofuels and waste (i.e. solid biofuels, biogases, liquid biofuels, industrial waste and municipal waste), there may be breaks in time series between 1988 and 1989, as in 1997 the IEA Secretariat extensively revised these data based on data from Eurostat (for the EU-15 member countries) and on other national sources for other OECD member countries, and data from Eurostat were generally available from 1989. Generally, data on biofuels and waste are reported in non-specified prior to 1989.
Australia
Source
Department of Environment and Energy, Canberra.
General notes
All data refer to the fiscal year (e.g. July 2014 to June 2015 for 2015).
Starting with the 2013 edition and following, data for Australia were revised back to 2003 due to the adoption of the National Greenhouse and Energy Reporting (NGER) as the main energy consumption data source for the Australian Energy Statistics. As a result, there are breaks in the time series for many data between 2002 and 2003. The revisions have also introduced some methodological issues, including
WORLD ENERGY BALANCES: DATABASE DOCUMENTATION (2017 edition) - 57
INTERNATIONAL ENERGY AGENCY
identifying inputs and outputs to certain trans-formation processes such as gas works plants, elec-tricity plants and CHP plants. Energy industry own use and inputs to the transformation processes are sometimes not reported separately in the correct categories. More detail is given in the notes below.
Coal
General notes
In the 2017 edition, the Australian administration revised data on coal tar back to 2010 resulting in breaks in time series between 2009 and 2010.
In the 2016 edition, extensive revisions were made to 2010 to 2013 data for many primary and manu-factured products causing breaks in production, trade and consumption between 2009 and 2010. Time series which begin in 2010 may be reported in other flows until 2009. 2014 data were reported on the same basis as 2010 to 2013.
In the 2015 edition, increases of production and consumption of other bituminous coal for 2013 are due to both new mine capacity and improved classification data. In the 2016 edition, these revisions were extended back to 2010. Apparent switching between sub-bituminous coal and other bituminous coal between 2009 and 2010 suggests that some other bituminous coal was reported as sub-bituminous coal prior to this, across several flows.
In the 2013 edition, production data for all manu-factured gases were revised downwards as part of the new national methodology, leading to sig-nificant statistical differences.
Reclassification of some coal types in the 2013 edition were calculated on an energy basis and resulted in a net increase of quantities of primary coal from 2003 to 2011.
Breaks in the time series for gas works gas between 2008 and 2009 are due to a change of survey, while reduced production and consumption between 2006 and 2008 are due to the removal of some natural gas inputs.
Data on blast furnace gas for electricity production by autoproducers begins in 1986.
Hard coal data prior to 1978 may include sub-bituminous coal.
Supply
Only anthracite exports are reported separately; the remainder that is consumed domestically is included with other bituminous coal.
Export trade in coke oven coke between 2005 and 2011 exists, but data are unavailable for reasons of confidentiality.
Transformation
In 2015, a new plant within the mining sector started its operations increasing the consumption of coke oven coke.
The one company producing BKB closed its operation during 2015. As such, production and consumption declined significantly.
For 2003 to 2012, coke oven gas reported as energy industry own-use in electricity or CHP plants is used for generation purposes, while natural gas used for own-use plant support is reported in the transformation sector.
Natural gas consumed to fuel the distribution of natural gas in natural gas networks is reported as transformation for gas works gas production until 2005.
The drop in BKB production in 2004 was due to a fire in the main production plant.
Consumption
In the 2016 edition, revisions for 2010 onwards have increased the quantities of sub-bituminous coal and decreased the quantities of other bituminous coal being used in the non-metallic minerals industry as more accurate information has become available.
Consumption in wood and wood products is included in paper, pulp and print from 2001 onwards.
Oil
General notes
In the 2016 edition, the Australian administration revised oil supply/demand data from 2010, resulting in breaks in time series between 2009 and 2010. In particular, crude oil production for selected companies, previously estimated, was replaced by actual data. Transport consumption data (gas/diesel, motor gasoline, LPG) were revised to better align with data from the Australian Petroleum Statistics and the Bureau of Infrastructure, Transport and Regional Economics. A new method was adopted to split gas/diesel inputs between main-activity and autoproducer plants. Finally, data for production from other sources (natural gas) of other hydrocarbons
58 - WORLD ENERGY BALANCES: DATABASE DOCUMENTATION (2017 edition)
INTERNATIONAL ENERGY AGENCY
corresponding to hydrogen used in refineries are now reported. They are also represented as the output of non-specified transformation processes in the balances format.
An in-depth review of Australian oil statistics, in particular investigation of amounts currently re-ported under recycled products as well as statistical differences for motor gasoline and bitumen, is on-going and may result in further improvements in the next editions.
Supply
Crude oil production and imports continued to de-cline in 2015 in line with the closure of domestic refining capacity in New South Wales (Kurnell Refinery) and Queensland (Bulwer Island Re-finery). Refinery outputs also fell as a result. These two sites have been converted to import terminals helping Australia expanding its import capacity. Refined products imports increased considerably in 2015 with non-bio gasoline accounting for most of the increase.
Imports of fuel oil have been estimated by the Australian administration.
In the 2015 data, fuel oil imports dropped significantly due to the closure of the two large consumers of this product, the Gove alumina re-finery and the Point Henry aluminium smelter
There is a break in the time series for crude oil and NGL between 2001 and 2002.
The drop in the production of crude oil in 1999 is due to a gas explosion at the Longford plant.
Prior to 1992, part of the NGL production is in-cluded in crude oil.
Natural gas
General notes
In the 2016 edition, the Australian administration revised natural gas demand data for some flows back to 2010, resulting in breaks in time series be-tween 2009 and 2010.
In 2015, the Australian administration revised production and certain consumption data back to 2006. The production figures now include pre-viously uncaptured flows.
Prior to 1991 natural gas data include ethane.
Supply
2016 is the first year when Australia reported stock changes. The stock change includes volumes
stored for the domestic market and in LNG terminals for exports.
Around 30% of the production (mainly coal seam gas) is estimated by the Australian administration.
Transformation
Until 2005, natural gas consumed to fuel the dis-tribution of natural gas in natural gas networks was re-ported as transformation for gas works gas production.
Consumption
Consumption in the residential and agriculture sectors is estimated by the Australian administration based on models.
Between 2009 and 2010 some breaks in time series may occur due to changes in methodologies and to improved data sources. Revisions to the con-sumption data include changes to energy use in liquefaction plants, and a shift of gas works gas (transformation) to non-specified energy from 2006 onwards. Revisions to previous years are pending.
Between 2001 and 2002 there are breaks in time series for consumption data due to an industry structural shift and changes in methodology.
Data for 1999 and 2000 end-use consumption are estimated by the Australian administration.
Biofuels and waste
General notes
The data for biogasoline and biodiesel are not available before 2003 and 2004 respectively.
From 1996, a different industry consumption break-down for biofuels and waste is available and leads to breaks in time series.
Supply
Biogas production data at sewage treatment works are not available.
Indigenous production of biodiesel decreased a lot in 2016 because one of major biodiesel producers ceased production in January 2016.
Consumption
In the 2017 edition of this publication, there has been a revision to the time series of solid biofuels consumption in “Paper, pulp and printing” sector. This time series has been revised back to 2010 resulting in break in time series between 2009 and 2010.
WORLD ENERGY BALANCES: DATABASE DOCUMENTATION (2017 edition) - 59
INTERNATIONAL ENERGY AGENCY
In the 2016 edition of this publication, the Australian administration revised primary solid biofuels back to 2010 which impact mostly final consumption in Food and Tobacco. This created breaks in time series.
The consumption data of biogases in industry is not available before 2003.
Electricity and heat
General notes
In the 2016 edition, several combustible fuel elec-tricity production time series as well as some electricity consumption time series were revised by the Australian administration back to 2010 in order to limit the use of estimated data and are causing some breaks.
From 1992 onwards, heat data are not available.
Supply
Data for production of electricity from wind are available from 1994.
Data for electricity production from solar photo-voltaic start in 1992 and from solar thermal in 2003.
Transformation
Fuels used for generation by autoproducers repre-sent single fuel-fired units only. The use of fuel in multi-fired units operated by autoproducers is in-cluded in industry consumption.
In the 2017 edition, following an extended review of past data, the Australian administration revised electricity outputs of blast furnace gas auto-producer electricity plants for the period 2003-2004 and of autoproducer CHP plants fuelled by other oil products for 2009, resulting in more realistic efficiency rates for these plants.
In 2002, the Australian administration started to use a new survey methodology and reclassified the types of plants between main activity producers and autoproducers.
Prior to 1995, electricity production from biogases is included in natural gas.
Prior to 1986, inputs and outputs from autoproducer CHP plants are not available.
Consumption
Prior to 2006, electricity consumption in mining and quarrying includes consumption in liquefaction/regasification plants.
From 1990 to 2008, electricity consumption in wood and wood products is included together with paper, pulp and printing.
The direct use of solar heat (mostly domestic solar panels) is available from 1974.
Electricity consumption in coke ovens has been estimated by the Australian administration from 1974 to 1999.
Prior to 1974, the breakdown of electricity consumption in industry and energy sub-sectors is not available and energy industry consumption is included in industry.
Electricity consumption in the non-specified transport sector represents support services for transport for mining operations.
Prior to 1971 electricity consumption in the commercial and public services sector is included in industry.
Reported electricity consumption in the oil and gas extraction section may include some con-sumption in LNG/regasification plants.
Austria
Source
Bundesanstalt Statistik Österreich, Vienna.
General notes
In the 2016 and 2017 edition, widespread data revisions were received due to enhanced reporting from 2005 onwards as a consequence of the Austrian Energy Efficiency Act (Bundes-Energie-effizienzgesetz). For some time series, these revisions were extrapolated back to 1990. As a consequence, there may be breaks between 2004 and 2005, and 1989 and 1990.
Coal
General notes
In the 2017 edition, revisions concerning the iron and steel industry were received for data since 2005. The revisions impacted the energy sector for coke oven gas and blast furnace gas.
In the 2016 edition, revisions concerning the iron and steel industry were received for data since 1990. The following flows were impacted by these revisions: inputs to blast furnaces, the breakdown between transformation and own-use energy support, and calorific values.
60 - WORLD ENERGY BALANCES: DATABASE DOCUMENTATION (2017 edition)
INTERNATIONAL ENERGY AGENCY
The last lignite mine closed in the second quarter of 2004 and lignite use for power generation ceased in 2006.
Since 1996, gas works gas data are reported with natural gas because it is distributed in the same network. The amount of gas works gas is negligible and it is mostly consumed by households.
“Trockenkohle” is included with BKB because of its high calorific value.
LD gas, which should normally be reported as other recovered gases, is reported with blast furnace gas.
Oil
Supply
Exports of naphtha are no longer reported from 2014, past values may refer to exports of petro-chemical raw material.
Deliveries of gas/diesel to international marine bunkers were revised back to 1990 after imp-lementation of a new study results.
Prior to 1990, a portion of naphtha is included with other oil products.
Natural gas
General notes
In the 2017 edition of this publication, the Austrian administration revised data back to 1999 to reflect improvements in their data collection. Supply data were revised between 2002 and 2008. Transformation sector data were revised from 2014 back to 2002, energy own-use sector data back to 1999 and consumption data back to 2005.
Supply
Export amounts are calculated by the national administration by subtracting stock changes and domestic consumption from import figures.
Transformation
Between 1995 and 1996 there is a break in time series for autoproducer electricity and CHP plants due to the availability of more detailed data.
Consumption
There are inconsistencies in the time series for commercial/public services as this sub-sector is computed as a residual.
The increase in pipeline transport consumption for 2013 is due to a new methodology of data collection. Historical revisions are pending. Prior to 2000, differences due to measurement are included with distribution losses.
Biofuels and waste
General notes
Data for 1986 to 1989 for solid biofuels, ind-ustrial waste, biogases and liquid biofuels are IEA Secretariat estimates based on information published by OSTAT in Energieversongung Österreichs Endgültige Energiebilanz.
Consumption
In the 2016 edition, improvement in the iron and steel industry data have allowed more precision in the consumption, among other for industrial waste in blast furnaces.
In the 2016 edition, the consumption of solid biofuels in the residential sector was revised down from 2005 data.
Electricity and heat
Supply
Amounts for both net electricity production and plant own use are calculated by the Austrian administration by applying a fixed percentage multiplier to the gross production of all plants in the public grid, regardless of plant type or fuel.
Transformation
Electricity plants data may include some CHP plants operating in electricity only mode.
A large autoproducer electricity plant was re-classified as an autoproducer CHP plant and there-fore creates a break in time series for municipal waste in 2011.
In 2009, inputs of other oil products to auto-producer CHP plants were reclassified as refinery gas and natural gas.
Due to a change in the survey methodology, the heat produced in small plants (capacity inferior to 1 MW) is not reported starting in 2002.
Heat from chemical processes used for electricity production is available from 2004.
Electricity generation from geothermal started in 2002.
Prior to 2002, data for biogases only include plants of 1 MW or larger.
WORLD ENERGY BALANCES: DATABASE DOCUMENTATION (2017 edition) - 61
INTERNATIONAL ENERGY AGENCY
Prior to 1981, inputs to main activity producer electricity plants include inputs to CHP plants. All electricity production by CHP plants is included in electricity plants, and only production from com-bustible fuel sources is taken into account. Auto-producer CHP heat production is included in main activity producer CHP plants. For heat, own use is included in distribution losses.
Consumption
Electricity consumption in oil refineries includes consumption in gas works plants prior to 1991.
From 1990 to 2009, small amounts of electricity used in heat pumps have been included in the residential sector.
Starting in 1990, consumption of electricity in the field of electricity supply, district heating and water supply are included in other energy industry own use, prior to that it was included in commercial/public services.
Also prior to 1991, electricity consumption in the iron and steel industry includes consumption in coke ovens and blast furnaces.
Belgium
Source
Observatoire de l'Energie, Brussels.
Coal
General notes
In the 2016 edition, improved data collection has led to some breaks in time series. These revisions include hard coal classifications, products and pro-cesses in integrated iron and steel manufacture and may be extended further back in future editions.
Data for anthracite prior to 2014 may include a small portion of other bituminous coal.
Hard coal data prior to 1978 may include sub-bituminous coal.
Other bituminous coal and sub-bituminous coal data reported in from other sources refer to coal recuperated from coal dumps.
Supply
Supply-side data are obtained through surveying questionnaires instead of customs data.
Conventional production of other bituminous coal ceased on 31 August 1992.
Transformation
In 2015, the decrease of coke oven gas inputs to autoproducer CHP plants is due to a power plant closure in 2015.
In 2014 and 2015, coking coal inputs to coke ovens decreased due to a coke oven closure in June 2014.
In 2014, the decrease of other bituminous coal inputs to main activity producer electricity plants is due to a power plant closure in 2014.
Consumption
The decrease of other bituminous coal and coke oven coke in the iron and steel industry in 2002 is due to the closure of several plants.
The use of coke oven gas in chemical and petro-chemical activities ceased in 1996.
Oil
General notes
In the 2016 edition, the Belgian administration re-viewed and improved the methodology for reporting petrochemical consumption. Energy use of naphtha and LPG in the petrochemical sector, correspond-ing to recovered gases from the petrochemical process used for heating the installations, is now reported. Previously these amounts were allocated by default to non-energy use. Quantities reported under transformation in petrochemical plants have also been increased as it appeared that the petro-chemical sector was returning more oil products to the market either for domestic consumption or exports. Revisions were applied back to 2009.
Data on biofuels are not available before 2009.
Supply
The drop in international marine bunker con-sumption in 2014 can be at least partly explained by the bankruptcy of one of the major players in the bunkering market in the last quarter of 2014.
Starting from 2013, a new data source was intro-duced for petroleum coke trade.
Transformation
In 2002, patent fuel plants used fuel oil to increase the calorific value of patent fuel.
62 - WORLD ENERGY BALANCES: DATABASE DOCUMENTATION (2017 edition)
INTERNATIONAL ENERGY AGENCY
Consumption
The decrease of fuel oil in industry consumption since 1993 is due to the introduction of an excise tax as well as increased use of natural gas.
Natural gas
General notes
In the 2017 edition, the Belgian administration re-vised consumption in the energy sector and the chemical industry since 1995; and consumption in the transport, industry and other sectors since 2010, to incorporate a new methodology.
Supply
Since 2009 gas trade in Belgium includes imported LNG which is regasified and subsequently ex-ported to other countries.
Transformation
The Belgian administration is in the process of re-vising 2011 and 2010 transformation sector data. As such, an unusually high quantity of natural gas is re-ported under not elsewhere specified (transformation).
Between 2008 and 2009, there is a break in efficiency of natural gas autoproducer CHP plants due to a change in methodology regarding the re-porting of unsold heat.
Consumption
Consumption in the transport equipment sector decreased in 2015 due to the closure of a big industry of this sector in December 2014.
In 2003, the large decrease in non-specified indus-try consumption is due to improvements in data collection.
Since 2000, natural gas began to replace blast furnace gas in the iron and steel industry.
Biofuels and waste
General notes
Renewable municipal waste includes a share of renewable industrial waste.
Data for biodiesels and biogasoline are available starting in 2009.
Supply
Data on pure biogasoline and biodiesels trade are not available for 2009 and 2010.
Consumption
Industrial waste consumption in the chemical sector started in 2013.
Other liquid biofuels consumed in power plants reported before 2011 can include biodiesel.
New data on consumption cause breaks in time series for primary solid biofuels between 2011 and 2012.
Electricity and heat
Supply
The electricity production under other sources represents mainly production at a gas expansion station with heat recovery and at a hydraulic turbine in a waste water treatment plant.
In 2013, reported heat distribution losses decreased due to a more precise estimation method.
The production of electricity from wind is avail-able from 1987.
Transformation
In 2012, heat production from chemical sources has been estimated by the IEA Secretariat.
Prior to 2009 some unsold heat was reported in natural gas autoproducer CHP plants, together with the associated natural gas input. This causes the drop in efficiency in 2009.
In 2007 data, no information was available on heat production in main activity CHP plants for industrial waste.
Heat from chemical processes used for electricity production is available from 2005.
In 2003, combustion of municipal waste for elec-tricity and heat generation purposes increased sig-nificantly. However, because a large portion of the heat produced is not used (sold), plant efficiencies dropped significantly between 2002 and 2003.
In 2000, most autoproducer electricity plants using combustible fuels were reclassified as auto-producer CHP plants; the heat production from these plants was used for internal industrial processes and not sold to third parties until 2005.
For 1998 and 1999, electricity production at main activity producer CHP plants with annual heat output below 0.5 TJ is reported with main activity producer electricity only plants.
Prior to 1982, electricity production in main activity producer CHP plants is included in production from
WORLD ENERGY BALANCES: DATABASE DOCUMENTATION (2017 edition) - 63
INTERNATIONAL ENERGY AGENCY
electricity plants. Also, inputs of fuels for electricity generation in main activity producer electricity plants include inputs for heat production in CHP plants.
Consumption
For 2012, electricity consumption in the mining and quarrying sector has been estimated by the IEA Secretariat.
For 2012, oil refineries electricity consumption has been estimated by the IEA Secretariat based on refinery activity data. Part of the estimated amount has been removed from consumption in the chemical and petrochemical sector.
Breaks in time series may exist between 2007 and 2008 due to revisions of NACE classifications.
There is no heat consumption starting in 2007 in the iron and steel industry because the installation concerned became an autoproducer in July 2006 and the heat is no longer sold.
Breaks in time series exist between 1991 and 1992 for heat consumption in chemical and non-specified industry.
Canada
Source
Natural Resources Canada, Ottawa.
General notes
From the 2014 edition, the Canadian administration revised time series back to 2005, using additional data from the Annual Industrial Consumption of Energy, the Annual Survey of Secondary Dis-tributors, the Report on Energy Supply and Demand and the Natural Resources Canada Office of Energy Efficiency. Breaks in time series also between appear 1989 and 1990, due to changes in meth-odology, incorporated in 2002.
Coal
General notes
Due to confidentiality constraints, the breakdown of coal by type has been estimated by Natural Resources Canada for 2016p.
In the 2016 and 2017 edition, extensive revisions for the period 2005 to 2015 were received as more data became available due to improvements in data collection.
In the 2014 and 2015 editions, some revisions to the 2004 to 2006 data were received in addition to some time series and products for 2007 to 2011.
Due to a Canadian confidentiality law, it is not possible for the Canadian administration to submit disaggregated time series for all of the coal types. Between 2002 and 2006, the IEA Secretariat has estimated some of the missing time series. The data for 2007 onwards are given directly as re-ported, however data may be present in non-representative products, and additionally these ad hoc reclassification methodologies contribute sig-nificantly to larger than normal statistical diff-erences across products.
At this point in time, oil shale and oil sands data are not submitted, and this energy source is deemed to enter the supply stream as shale oil (other hydrocarbons).
Supply
Due to confidentiality constraints, from 2014 the breakdown of production by type of coal is estim-ated by the Canadian administration, while stock changes and statistical differences are estimated since 2001.
Transformation
Injection of pulverized coal into blast furnaces (PCI) occurs, but is not available for con-fidentiality reasons. Coals consumed in this manner are reported in the iron and steel industry along with other consumption.
Before 1978, lignite inputs to main activity pro-ducer heat plants are included in final con-sumption. Starting in 1979, these inputs are in-cluded in main activity producer electricity plants.
Consumption
Since 2001, consumption of anthracite in non-energy use is estimated by the Canadian administration. Statistical differences include consumption in iron and steel.
Due to the unavailability of data, non-energy use of coke oven coke and hard coal is included with final consumption sectors prior to 1978 and 1980, respectively.
Oil
General notes
In the 2016 edition, the Canadian administration was able to reconcile some historical inconsistencies
64 - WORLD ENERGY BALANCES: DATABASE DOCUMENTATION (2017 edition)
INTERNATIONAL ENERGY AGENCY
by reporting inputs and outputs to upgraders. In the supply side, these quantities are reported under Other Hydrocarbons. In the demand side, they are reported under the respective output products (Refinery Gas, Road Diesel, and Petroleum Coke).
The Canadian administration is currently unable to provide a figure for the domestic production of additives, but is working on solutions which will make this possible. Meanwhile, significant statis-tical differences can be observed for several secondary oil products.
Supply
In the 2016 edition, the Canadian administration started using customs based trade data to report crude oil imports. In the 2017 edition, crude oil imports data have been revised back to 2005 following this methodology. Some revisions to imports of secondary products have already been made and further revisions are expected.
In the 2015 edition, the Canadian administration revised the allocation of primary oil products back to 2005. Condensates and pentanes plus are in-cluded in crude oil from 2005, in NGL 1990 to 2004 and in LPG prior to 1990. Historical re-visions are pending.
In the 2017 edition, primary oil products imports have been revised back to 2005 to include direct imports of condensates by crude oil producers.
Production of other hydrocarbons represents synthetic crude oil produced from tar sands.
From 2005, other hydrocarbons from other sources natural gas corresponds to natural gas used for the upgrading of synthetic crude oil (reported under GTL transformation in the natural gas con-sumption data) and natural gas used to upgrade petroleum products (reported under non-specified transformation in the natural gas consumption data). From 1990 to 2005, these quantities are reported in indigenous production of other hydro-carbons. Prior to 1990, they are included in the natural gas supply.
Imports of other hydrocarbons from 1994 to 2000 correspond to orimulsion imports from Venezuela.
Refinery output from gas/diesel oil and petroleum coke includes output from oil sands and upgraders.
Time series for other non-specified oil products may fluctuate as they have been computed as residuals.
International marine bunkers are included with inland waterways prior to 1978.
Consumption
Due to confidentiality issues, consumption data for selected products and flows, such as fuel oil and gas/diesel consumption in iron and steel from 2009, are not available. For the same reason, selected products may include estimates provided by the Canadian administration, such as Fuel Oil and Bitumen data for 2014.
Natural gas
General notes
For the 2015 edition, revisions back to 2005 were submitted by the Canadian administration, creating a break in time series between 2004 and 2005. Amounts reported as transport equipment; machin-ery; food, beverages and tobacco; wood and wood products; textiles and leather were reported as non-specified industry prior to 2005. Further historical revisions are pending.
Supply
Non-associated gas production data include colliery gas as well as associated gas produced in Alberta.
Transformation
For 2000, the increase in main activity producer electricity is due to new generation plants in Alberta and Ontario.
Gas-to-liquids (transformation) represents quantities of natural gas consumed in the production of syn-thetic crude oil.
Non-specified transformation represents quantities of natural gas used for the upgrading of refined oil products.
Consumption
Starting with 2014 data, natural gas distribution losses will no longer be reported by Canada as this flow was historically computed as a balancing variable.
Due to confidentiality reasons, the Canadian administration estimated natural gas consumption in the following sectors: iron and steel manufact-uring between 2011 and 2014; aluminum and non-ferrous metal manufacturing between 2011 and 2015; and refined petroleum products manufact-uring for 2014-2015.
Non-specified transport corresponds to retail pump sales of natural gas.
WORLD ENERGY BALANCES: DATABASE DOCUMENTATION (2017 edition) - 65
INTERNATIONAL ENERGY AGENCY
For 2012, the increase consumption by non-metallic mineral production is due to switching from coal to natural gas in cement manufacturing.
Prior to 1990 data for consumption of natural gas for construction are not available.
Prior to 1978, consumption in non-specified industry includes gas used as fuel in oil refineries.
Prior to 1978, agriculture is included in industry, and no detailed industry sub-sector data are available.
Biofuels and waste
General notes
The split of municipal waste reported assumes 65% renewable and 35% non-renewable.
The IEA Secretariat has estimated the data for biogases, industrial and municipal waste from 1990 to 2004, biogasoline (ethanol) from 1998 to 2004 based on information supplied by Natural Resources Canada.
Supply
Canadian biodiesel production increased sig-nificantly in 2014 because a large producer came online at the end of 2013. In 2016 again, there was big increase in production of biodiesel due to a large plant coming online in Alberta. This is also the reason for the increase in export, as Canada exports most of its biodiesel to the US.
There were no exports of biogasoline since 2013.
Consumption
The solid biofuels consumption for the residential sector in 2015 equal to 2014 data because firewood data lag one year behind.
Electricity and heat
General notes
The Canadian administration is currently under-taking revisions of the electricity time series back to 2005, based on the results of the Report on Energy Supply and Demand in Canada (RESD). In par-ticular, revisions were made on the inputs and out-puts of power plants fuelled by combustible fuels and on the breakdown of final electricity con-sumption, resulting in possible breaks in time series.
Supply
In the 2017 edition, the production of electricity in the from other sources category, which refers to
electricity produced from waste heat and steam, was expanded, resulting in their metrics to rise based on reported data from a number of large respondents.
Starting in 2009, a new source has been used for electricity production from solar, wind, and tide. This new source covers production from solar and wind only from plants with capacity higher than 500 kW.
Heat production includes heat produced by nuclear power stations for distribution to other consumers up to 1997.
Transformation
The breakdown of electricity and heat generation from combustible fuels for 2016p was estimated by the IEA Secretariat.
In the 2016 edition of this publication, there was a reclassification from autoproducer to main activity producer for plants fuelled by biogases and municipal waste.
For autoproducers generating electricity with pro-cess steam produced from biofuels and waste, the energy required to produce the initial steam is not taken into account by the Canadian administration and as a result the efficiencies are overstated.
Secretariat estimates have been made for certain inputs to CHP production based on output. How-ever, incompatibility of data for inputs to and output from thermal production of autoproducers may result in variable efficiency rates.
The breakdown of electricity and heat generation between natural gas and oil products in main activity producer CHP plants has been estimated by the Canadian administration starting in 1990. This may cause breaks in the time series between 1989 and 1990.
Net electricity production by autoproducers prior to 1990 includes production from combustible fuel sources only.
Inputs of fuels to heat plants are not available for 1979 to 1987.
Consumption
Electricity transmission and distribution losses could include statistical difference for certain years.
Starting from 2012, heat consumption in the chemical and petrochemical sector became con-fidential and is included under the “not elsewhere specified industry” sector.
66 - WORLD ENERGY BALANCES: DATABASE DOCUMENTATION (2017 edition)
INTERNATIONAL ENERGY AGENCY
The Canadian administration revised the elect-ricity consumption for the commercial and public services sector from 2012 according to a new methodology. This causes a break in the time series between 2011 and 2012.
Consumption of electricity in oil and gas extraction is not available prior to 1987.
Consumption of electricity in coal mines is not available between 1982 and 1986.
Breaks in the time series occur between 1973 and 1974 in agriculture, and between 1987 and 1988 in the industry sector.
Chile
Source
Energía Abierta, Comisión Nacional de Energía, Ministerio de Energía, Santiago.
General notes
Data are available starting in 1971.
In the 2017 edition, data for 2014 and 2015 were revised to replace figures previously estimated by the Secretariat.
From 1990, consumption in paper and pulp in-cludes forestry and consumption in agriculture is included in non-specified industry. In general, a new methodology has been applied for data since 1990, leading to other breaks in time series be-tween 1989 and 1990.
Coal
General notes
Other bituminous coal data includes sub-bituminous coal for all years, if present.
Oil
General notes
There are breaks in time series between 2008 and 2009 due to a change in methodology by the Chilean administration.
Natural gas
General notes
In the 2017 edition, data for 2014 and 2015 were revised to replace figures previously estimated by the IEA Secretariat.
Supply
Data representing LPG injected into the natural gas distribution network are available starting in 2009. They are reported in from other sources - oil. This process ended in 2015.
Transformation
For 2009 and 2010, inputs of natural gas to auto-producer CHP plants were estimated by the Chilean administration. For other years, these inputs are included in autoproducer electricity consumption
Natural gas used for oil and gas extraction is included in gas consumption for energy use in refineries.
Non-specified transport corresponds to marine transport.
Biofuels and waste
Supply
Production of landfill gas ceased in 2001 as land-fill sites stopped producing adequate gas to con-tinue collection.
Transformation
A new survey on primary solid biofuels causes breaks in production and input to autoproducer CHP between 2011 and 2012.
Consumption
Charcoal production and consumption have been estimated by the IEA Secretariat until 2013. From 2014 data, only solid biofuels input to charcoal production plant is estimated.
The Chilean administration applied a new revised methodology for final consumption of primary solid biofuels. This may lead to data breaks in time series between 2013 and 2014.
Electricity and heat
General notes
Data for net electricity production for all plant types is estimated by the Chilean administration on the assumption that plant efficiencies remain constant from the previous year.
Supply
In 2014, the Chilean administration applied a new methodology in the reporting of electricity gener-ation from solar PV and wind, resulting in breaks

WORLD ENERGY BALANCES: DATABASE DOCUMENTATION (2017 edition) - 67
INTERNATIONAL ENERGY AGENCY
in time series between 2013 and 2014. Revisions for previous years are pending.
The majority of electricity generation from other sources is from a conveyor belt transporting crushed rock from high altitude to lower altitude in a mine. A small amount from waste heat is also included.
Solar thermal heat production has been estimated by the IEA Secretariat using data published by Chilean ministry of energy.
Transformation
In 2014 data, input to transformation was taken from the published energy balance, and the output was estimated based on the efficiency reported in previous years.
Electricity production from other bituminous coal includes sub-bituminous coal.
Production of chemical heat used for electricity generation started in 2013. Besides chemical heat data for heat production in CHP and heat plants are not available.
Increases in electricity from natural gas in 2010 are due to the openings of new LNG terminals.
The split of electricity generation by main activity and autoproducer by fuel was estimated by the Chilean administration for the period 1990 to 2003.
Consumption
Solar thermal consumption data are not available so all consumption data are allocated to the non-specified other sector.
Prior to 2009, statistical differences are included in distribution losses.
Czech Republic
Source
Czech Statistical Office, Prague.
Ministry of Industry and Trade, Prague.
General notes
Due to ongoing review of energy data for 2010-2014, revisions have been made in the 2017 edition. Full details are given under each fuel.
Data are available starting in 1971.
Coal
General notes
Other bituminous coal data includes sub-bituminous coal for all years, if present.
In the 2017 edition, data for the Czech Republic were revised back to 2010 based on administrative data causing breaks in time series between 2009 and 2010. Additionally, due to the new survey in households made by Czech Statistical Office, coal consumption in the residential sector has been revised back to 2010 creating breaks in time series between 2009 and 2010.
Increased production and consumption of other recovered gases in 2014 is due to improved track-ing of by-products from various transformation processes. Tail gases from the production of carbon black from coal tar are reported here, as are off gases from the manufacture and cleaning of syngas from lignite for an IGCC plant.
Coal which had been previously classified as sub-bituminous coal until the 2008 edition is now reported under lignite for all years.
Revisions by the Czech administration have resulted in some breaks in time series between 2001 and 2002.
Data for 1990 to 1995 were estimated based on the Czech publication Energy Economy Year Book.
In 1995, town gas production (included in gas works gas) ceased.
Supply
Other recovered gases are combustible gases obtained during the production of gas works gas and as a result of chemical processes.
Production from other sources of other bituminous coal is from coal slurries, and these data are not available for 2016p.
A portion of other bituminous coal reported under from other sources for the period 2010-2015 correspond to reclassified coking coal.
Statistical differences for coking coal for the period 2010-2015 are partly due to the reclassific-ation of coking coal to other bituminous coal.
Consumption
In the 2015 edition, improved reporting enabled revisions to be made for certain primary coal con-sumption flows between 2010 and 2012.
68 - WORLD ENERGY BALANCES: DATABASE DOCUMENTATION (2017 edition)
INTERNATIONAL ENERGY AGENCY
In the 2014 edition, residential consumption for the period 1990 through 2011 was revised for other bituminous coal, lignite, coke oven coke and BKB, as more accurate consumption data became available.
Due to economic restructuring in consumption in the late 1990s (big state enterprises subdividing and/or privatising and the utilisation of new tech-nologies by businesses), there may be breaks in time series in these sectors.
Oil
General notes
Data prior to 1994 are estimated by the IEA Secretariat.
In the 2017 edition, revisions have been made to the transformation and industry sectors for LPG, fuel oil and other oil products. In addition, there are revisions to other sectors and non-energy use in industry for LPG. In most cases revisions cover the period 2010 to 2014. For LPG some revisions start from 2008 and further revisions are expected in the 2018 edition.
Supply
In 2016 temporary closures of both Czech refineries led to a large decrease in imports of crude oil offset by increased imports of finished products.
Transformation
From 2002 data onwards, some amounts of fuel oil have been reclassified under other products. This change mainly affects the transformation sector.
Consumption
Between 1998 and 1999, breaks in gas/diesel final consumption time series are due to a new data management system implemented by the Czech administration.
Natural gas
General notes
Between 1993 and 1994 there are some breaks in time series due to a change in the energy balance methodology between former Czechoslovakia and the Czech Republic. Since 1993, data have been officially submitted by the Czech Statistical Office.
Supply
From 2013 all non-associated gas production was reclassified as colliery gas production.
Starting with 2008 data, hydrogen production is re-ported in petrochemical feedstocks as non-energy use.
Transformation
In 1996 natural gas inputs into gas works ended.
Consumption
Prior to 1994 data in transport are for former Czechoslovakia.
In the 2017 edition, new data from distribution companies were included, creating a break in time series in the industry and transformation sectors between 2009 and 2010.
Biofuels and waste
General notes
The restructuring of the Czech electricity market leads to breaks in the time series in all sectors be-tween 1998 and 1999.
Data for municipal waste and solid biofuels are not available prior to 1990 and liquid biofuels data are not available prior to 1992.
Consumption
In the 2017 edition, due to a new survey in house-holds made by the Czech Statistical Office in 2015 (ENERGO 2015), solid biofuels consumption in residential sector has been considerably revised upwards since 1990.
Hospital waste previously reported as municipal waste is reported under industrial waste since 2008.
New survey systems cause breaks in final con-sumption in 1999 and in 2002. Breaks in both supply and consumption of biofuels and waste occur again in 2003.
Electricity and heat
General notes
In the 2017 edition, data for the Czech Republic were revised back to 2010 due to the acquisition of new administrative data, allowing access to more accurate and detailed data sources. As a result, there are breaks in several time series between 2009 and 2010.
Data from 1990 onwards have been officially submitted by the Czech administration. This may lead to breaks in time series between 1989 and 1990.
WORLD ENERGY BALANCES: DATABASE DOCUMENTATION (2017 edition) - 69
INTERNATIONAL ENERGY AGENCY
Electricity statistics from 1971 to 1989 have been estimated by the IEA Secretariat except for final consumption and trade which were submitted by the Czech administration.
Supply
The amount of heat reported under other sources is waste heat from the glass industry.
From 1999 onwards, small amounts of heat have been exported to Slovak Republic.
Transformation
Electricity generated from waste heat in CHP plants is included with the total production from combustible fuels.
In the 2017 edition, a revision of the methodology for reporting the production of autoproducer plants running on combustible fuels causes multiple breaks in time series between 2009 and 2010 for CHP and electricity only plants.
Data on heat own use and heat imports start in 2010 and 2009 respectively, following extensive revisions by the Czech administration in the 2017 edition due to the acquisition of new admin-istrative data. Prior to this period, data are not available due to lack of sources.
The production of electricity reported in the category other fuel sources refers to electricity produced from turbines driven by the mixture of air, ammonia and other non-coal gases derived from the petrochemical industry.
From 2014, some autoproducer heat plants pro-duction figures became too small to appear in data collected.
From 2012 data, new autoproducer heat plants were added to the data collection, causing a break in time series.
In 2012, a main activity producer electricity plant using solid biofuels started to produce also heat and was reclassified as main activity CHP plant.
A different reporting methodology used by the Czech administration for biofuels and waste causes some breaks in time series between 2002 and 2003.
In 1999 and 2000, various big enterprises have been divided, sold and merged. This causes breaks in the time series of all types of plants.
Industrial waste use in main activity producer electricity plants is included with solid biofuels from 1996.
Data on biogases and waste used in main activity producer CHP and autoproducer heat plants start in 1993.
Prior to 1990, electricity production in main activity producer CHP and autoproducer CHP plants is included in main activity producer elec-tricity plants.
Prior to 1990, heat production excludes heat sold by industry. In addition, heat production prior to 1990 is reported under main activity heat plants because the breakdown by producer and plant type is not available before then.
The breakdown of net electricity production by source is not available prior to 1990.
Data on heat production, and the corresponding fuel inputs, have been estimated from 1980 to 1989 based on consumption in residential and commercial/public services. Prior to that, inputs are included in industry.
Consumption
Data for direct use of solar energy are available from 2003.
Prior to 2000, the split of rail transport and non-specified transport is not available.
Denmark
Source
Danish Energy Agency, Copenhagen.
General notes
In the 2004 edition, major revisions were made by the Danish administration for the 1990 to 2001 data, which may cause breaks in time series be-tween 1989 and 1990.
Coal
Supply
A large increase of steam coal imports in 2003 was related to a drought in Scandinavia. Thermal power plants were operated more intensively to replace hydro-generated electricity that was consumed in the country. Additionally, more coal-generated elec-tricity was exported to other countries in the region. Significant fluctuations in demand are also evident for other years for similar reasons, including 2006 and 2013, but exist to a lesser extent.
70 - WORLD ENERGY BALANCES: DATABASE DOCUMENTATION (2017 edition)
INTERNATIONAL ENERGY AGENCY
Declines in stocks of steam coal stem from ex-tensive deployment of renewable generation tech-nologies and policy to further reduce Denmark’s utilisation of coal-fired power and implement co-firing with renewable fuels as a part of their Energy Strategy 2050.
Oil
General notes
In the 2015 data the Danish administration has reported products transferred to refinery feed-stocks. In previous years refinery output is reported net of product transfers. This change in methodology is responsible for the large increase in refinery throughput in 2015. Revisions to 2013 and 2014 data are expected in the 2018 edition.
From 1990 onwards, Greenland and the Danish Faroes are not included in the oil data.
From 2012, due to confidentiality issues, all liquid biofuels are reported under biodiesel
Between 1995 and 2004, other hydrocarbon imports and inputs to main activity producer CHP plants represent orimulsion.
Information on waste oil recycling and final consumption begins in 1989 and is reported in other oil products.
In 1988, consumption of gasoline type jet fuel ceased.
As of 1987, separate data for paraffin waxes are no longer available.
Prior to 1975, refinery gas is reported net of consumption in refineries.
Transformation
Due to improved survey methods, inputs to elec-tricity and heat generation have been reclassified, causing a break in time series between 1993 and 1994. The oil inputs used in industrial sub-sectors for producing surplus heat, which is delivered to district heating networks, are allocated to these industrial sub-sectors.
In 1994, the marked increase in inputs to CHP pro-duction is due to increased electricity exports to Norway.
From 1974 to 1979, consumption of fuel oil for the CHP production by autoproducers has been estimated.
Consumption
Consumption data are based on a detailed survey sent to companies in Denmark every other year.
For non-survey years, the consumption figures are estimated by the Danish Energy Agency
White spirit and lubricants deliveries are estim-ated by Denmark.
For 1994 and 1995, industry detail is based on a new survey.
Prior to 1990, gas/diesel oil and fuel oil con-sumption for fishing are included in domestic navigation
Natural gas
Consumption
The breakdown for industrial consumption for the latest year is estimated by the Danish admin-istration using the previous year’s industry sector sub-sectoral shares and updated the following year.
Biofuels and waste
Transformation
From 2012, biogasoline trade designated to be blended with motor gasoline is included under bio-diesels, for confidentiality reasons.
From 2012, biodiesel production was confidential and gathered with imports.
Consumption
In the 2017 edition of this publication, the Danish administration used the 2014 figures of municipal waste consumption in industrial sector for the 2015 figures. These figures will be revised in the 2018 edition.
In the 2016 edition, the Danish statistics have re-vised energy consumption in industry sectors causing some breaks in solid biofuels con-sumption between 2010 and 2011.
Electricity and heat
General notes
Heat data are not available prior to 1976.
Supply
The amount of heat reported under other sources is heat recovered from industrial processes and sold for district heating.
Heat produced for sale by heat pumps starts in 1994.
WORLD ENERGY BALANCES: DATABASE DOCUMENTATION (2017 edition) - 71
INTERNATIONAL ENERGY AGENCY
Geothermal and solar heat production for sale is available from 1989.
From 1984 onwards, small amounts of heat have been imported from Germany.
The production of electricity from wind is avail-able from 1978.
Transformation
Fish oil used in main activity producer heat plants is included with solid biofuels.
Due to the high number of heating companies burning wood chips that are equipped with boilers with flue-gas condensation, the solid biofuels heat plants show a high efficiency.
For some years heat plants for natural gas and biogases show efficiencies larger than 100%, on a net calorific value basis, due to the use of con-densing boilers that recover the latent heat of vaporisation.
Biodiesels and biogasoline consumption for electricity and heat production are reported under other liquid biofuels, for confidentiality reasons.
Data for other liquid biofuels main activity heat plants are available back to 1994.
Consumption
In the 2016 edition, the Danish administration has revised electricity and heat consumption in the industry sector from 1990.
For 2015 data, the breakdown of electricity and heat total final consumption is estimated by the Danish administration and will be revised in the following reporting cycle.
The direct use of solar thermal energy is available from 1978.
Electricity consumption in non-specified industry includes consumption in district heating plants and for the distribution of electricity.
Estonia
Source
Statistics Estonia, Tallinn.
General notes
Data for Estonia are available starting in 1990. Prior to that, they are included in Former Soviet.
Coal
General notes
Fuels reported as coke oven coke and gas works gas are the solid and gaseous by-products of oil shale liquefaction. Inputs of oil shale to “gas works”, “coke ovens” and for coal liquefaction plants, while reported separately, combined, are the inputs for retorting in liquefaction plants.
In the 2013 edition, data for oil shale production for the period 1991 to 1997 were revised to match Estonian GHG National Inventory values. Con-sumption data remained unchanged.
Oil
General notes
In 2012 data, breaks in time series occur for trade figures, now including re-exports, and for inter-national bunkers.
For 1990 to 2007, oil data are based on direct communication with Statistics Estonia and UNECE.
Natural gas
Consumption
There are inconsistencies in the time series for residential consumption as this sector is computed as a residual.
In 2014 Estonia’s main company in the chemical and petrochemical sector ceased activity, resulting in no non-energy use of natural gas.
In 2009 Estonia’s main producer of fertilisers ceased activity, resulting in a sharp decrease in the non-energy use of natural gas. The plant reopened in 2012.
Biofuels and waste
General notes
Data for biogases include landfill gas starting in 2005.
Electricity and heat
Transformation
Inputs of fuel oil and gas works gas to trans-formation processes include shale oil.
From 1990 to 1999, some of the electricity and heat production are reported under other oil products while the inputs are reported under the individual fuels.
72 - WORLD ENERGY BALANCES: DATABASE DOCUMENTATION (2017 edition)
INTERNATIONAL ENERGY AGENCY
Finland
Source
Statistics Finland, Helsinki.
General notes
In 2014, a new survey system and a reclass-ification of the data lead to breaks in the time series between 1999 and 2000 for most products and sectors. The new survey system is more de-tailed and has better product coverage, especially in electricity, CHP and heat production, as well as in industry.
Coal
General notes
Coal tar used for non-energy purposes or exported is not reported in either production or consumption.
In the 2015 edition, revisions were received for some consumption flows of other bituminous coal and coke oven coke, while other recovered gases (from ferrochromium manufacture) were re-ported separately for the first time, with revisions back to 2000. Prior to 2000, off-gases from ferro-chromium manufacture are included in blast furnace gas, and inputs of coke oven coke for ferrochromium manufacture in inputs to blast furnaces instead of non-specified transformation.
Prior to 2008, peat products are included with peat data.
A large increase of steam coal imports in 2003 is related to a drought in Scandinavia. Thermal power plants were operated more intensively to replace hydro-generated electricity that is con-sumed in the country. Additionally, more coal-generated electricity was exported to other countries in the region.
The increase of other bituminous coal inputs into main activity producer electricity plants from 1993 to 1994 was due to coal replacing imported elec-tricity and hydro power.
Production of gas works gas ceased in April 1994.
Hard coal data prior to 1978 may include sub-bituminous coal.
Transformation
In the 2017 edition, fuel inputs and heat pro-duction from peat main activity heat plants have
been revised from 2000 as a result of new data access for smaller peat heat plant units.
The significant increases and decreases of other bituminous coal inputs into main activity producer electricity plants from year to year are due to coal replacing imported electricity and hydro power.
Likewise, peat production is highly dependent upon favourable weather conditions and the pricing of other fuels. The decrease in peat and other bituminous coal usage in main activity electricity plants in 2008 was due to record electricity generation from hydro plants. A similar circumstance occurred in 2012.
The first coking plant started operation in 1987, hence imports of coking coal and production of coke oven coke and coke oven gas started in that year.
Oil
General notes
In spring 2015, the Porvoo refinery had the largest shut down in its history for maintenance works. This is the reason for the large decrease in refinery throughput in 2015.
In 2014, the Finnish administration revised the time series for refinery gas from 2000 and in-cluded flaring of petrochemical gases under dis-tribution losses.
Prior to 2002, petroleum coke used as refinery fuel was included with refinery gas.
In 1995, there is a break in time series for oil products trade due to the aligning of the National Board of Customs trade data collection system with the European Union’s Intrastat system.
Other hydrocarbons reported under from other sources natural gas correspond to hydrogen used in refineries, also represented as the output of non-specified transformation in the balances format.
Consumption
Due to a new calculation model, there is a break in fuel oil other consumption between 1998 and 1999.
Natural gas
General notes
Between 1999 and 2000 there are some breaks in the time series due to a new survey system and a reclassification of the data.
WORLD ENERGY BALANCES: DATABASE DOCUMENTATION (2017 edition) - 73
INTERNATIONAL ENERGY AGENCY
Transformation
Non-specified transformation data represent nat-ural gas used for hydrogen manufacture. This hydrogen is used for hydrodesulphurization and hydrocracking in oil refineries
Consumption
In the 2017 edition, the Finnish administration revised consumption data back to 2007 to include new information based on a sample data survey, and to harmonised with the national figures.
Since 1995 data, the breakdown between resident-ial and commercial/public services is available due to a new system of data collection.
Prior to 1989, natural gas consumption in res-idential and agriculture/forestry has been estimated by the Finnish administration.
Biofuels and waste
General notes
Prior to 2004, industrial waste also included other energy forms such as hydrogen, heat from chemical processes, natural gas and blast furnace gas.
Data for biogases and industrial waste are avail-able from 1996.
Supply
Due to confidentiality, the biodiesel production includes trade figures and stock changes for 2015. Regarding biogasoline, import covers production, exports and stock changes.
Electricity and heat
Supply
Electricity production in Finland is affected by the connection to the Nord Pool. In period of high waterfalls, importing electricity from other Nordic countries is more economic than producing it. This can cause breaks in the time series.
Other sources include hydrogen and purchased steam.
The increasing heat production from heat pumps in 2007 and 2008 is from the new Katri Vala district heating and cooling plant.
Heat from chemical processes and associated electricity generation are available from 2000.
Transformation
Electricity plants data may include some CHP plants operating in electricity only mode. Like-wise, heat plants data may include some CHP plants operating in heat only mode.
In the 2017 edition, fuel inputs and heat pro-duction from peat main activity heat plants have been revised since 2000 as new data became available for small peat heat plant units.
In the 2016 edition, the allocation of solar photo-voltaic between main activity and autoproducer plants was revised.
From 2014 data, an autoproducer in the field of iron and steel industry running on coke oven gases and blast furnace gases was sold and is now reported as main-activity producer.
The increase in heat production from municipal waste in 2014 is due to the opening of a new plant.
In 2014, the new consumption of other liquid bio-fuels in main activity electricity plant corresponds to biopyrolisis oil made from wood chips.
Data on peat products electricity and heat generation are available since 2008. Prior to that, they are included in peat.
Heat output from autoproducer CHP plants is available starting in 1996 and from autoproducer heat plants starting in 2000; corresponding inputs may be under-reported.
Before 1999, all electricity production from auto-producers running on fuelwood is allocated to CHP plants.
Electricity and heat production from biogases are available from 1996.
Prior to 1992, outputs from the use of combustible renewables and waste to generate electricity and/or heat were included in peat. Therefore, the IEA Secretariat estimated the breakdown of out-puts from municipal waste and solid biofuels based on reported inputs.
Inputs of liquid fuels and natural gas to CHP plants are included with the inputs of these fuels to main activity producer electricity only and heat only plants prior to 1978.
Electricity production from biofuels and waste is not available between 1974 and 1976.
Consumption
In the 2017 edition, an extended review of NACE sector encoding by the Finnish administration
74 - WORLD ENERGY BALANCES: DATABASE DOCUMENTATION (2017 edition)
INTERNATIONAL ENERGY AGENCY
resulted in the revision of the sectoral heat consumption time series back to 2007, leading to breaks in time series between 2006 and 2007 in some heat consumption sectors.
A new survey of the agriculture and forestry sector leads to breaks in the electricity consumption between 2007 and 2008.
The split of heat consumption in the different ind-ustry sectors is available starting from 2007. Prior to that, it is aggregated in non-specified industry.
Prior to 2000, consumption of heat in residential includes consumption in agriculture/forestry and commercial/public services.
Consumption of electricity in the industry sub-sector machinery includes consumption in trans-port equipment prior to 1995.
France
Source
Ministère de la Transition Écologique et Solidaire, Paris.
General notes
From 2012, the energy consumption is more de-tailed due to a more precise national survey.
Coal
General notes
In the 2017 edition, the French administration undertook comprehensive revisions on sectoral coal consumption back to 2011. Starting this edition, new information became available for anthracite, BKB and other recovered gases. Breaks in time series for coke oven gas and blast furnace gas consumption between 2010 and 2011 are due to a change in the methodology, impacting significantly consumption in the iron and steel sector.
From 2012, the energy consumption is more detailed due to a more precise national survey.
Prior to 2011, other manufactured gases (oxygen steel furnace gas) are included in blast furnace gas.
For 1989 to 1998, the IEA Secretariat has estim-ated industry consumption based on Consomm-ations d’Energie dans l‘Industrie, SESSI.
Prior to 1985, consumption of colliery gas is included with the use of coke oven gas by autoproducers.
Hard coal data prior to 1978 may include sub-bituminous coal.
Consumption
Blast furnace gas and coke oven gas used for energy purposes in blast furnaces prior to 2011 are reported under the iron and steel industry.
Final consumption in industry is estimated by the Secretariat from 1986 to 2001 for some products.
Oil
General notes
Statistical differences observed for motor gasoline and naphtha are partly due to the absence of a specific naphtha category in the customs classification.
Statistical differences appear for other products as a result of different definitions used for this residual category between the customs, refineries, power plants and petrochemical industry.
From 2013, information is available for imports of condensates used by the petrochemical sector. These are reported under imports of NGL, inter-product transfers of NGL to other oil products, and consumption of other products.
From 1991, additives and oxygenates data are available.
Supply
From 2009, transfers of kerosene type jet fuel to white spirit correspond to kerosene used as a base for making white spirit.
From 2008 data, refinery intake of refinery feed-stock and refinery output of refinery gas output figures exclude natural gas used in the steam re-former of the Gonfreville refinery.
From 2008 data, ethane refinery output is reported
From 2002 data onwards, ethylene produced in Lacq is not included in NGL.
From 1998 data, a different treatment of transfers was adopted. Imported oil products needing further refinery processing are no longer reported as refinery feedstock imports but as oil product imports and products transferred. Fuel oil includes part of the amounts previously reported in other oil products from 1999 and various other products from 2001.
WORLD ENERGY BALANCES: DATABASE DOCUMENTATION (2017 edition) - 75
INTERNATIONAL ENERGY AGENCY
Transformation
Starting in 2012, separate data on main activity heat plants inputs are available.
Consumption
The breakdown between international and do-mestic marine bunkers is estimated by the French administration.
Between 2005 and 2006, a break is visible in LPG time series, as consumption from one chemical company was re-classified from energy use to non-energy use. Breaks in LPG time series also appear in 2001 due to improved data collection.
From 2000 data, petroleum coke consumption in the non-ferrous metals industry is no longer available separately. Prior to 1982, no breakdown between energy and non-energy use is available for this product.
From 1998 data, military consumption of kero-sene type jet fuel is reported separately from domestic aviation.
Prior to 1988, LPG includes ethane consumption.
Prior to 1985, the residential sector consumption of gas/diesel oil is reported under the commerce/public services sector, as no separate data were available.
Natural gas
General notes
Between 2008 and 2009, there are some breaks in time series due to improvements in the data collection.
Until 2007, some statistical differences reported by the French utilities were included in distribution losses. Since 2008, these amounts are included under statistical differences.
Between 1999 and 2000, there are some breaks in time series due to a new methodology for pre-paring the natural gas balances.
Supply
The total imports and exports data include transit amounts.
From 1990 to 1998, statistical difference includes gas consumption which is not broken down by sector.
Consumption
The increase in natural gas consumption in 2016 is mainly driven by the transformation sector. Gas
fired power plants compensated the decrease in nuclear generation due to maintenance operations.
In 2017 edition, the non-energy use gas con-sumption was revised back to 2005, to include the results of a Citepa study on the non-energy uses of natural gas.
Between 2013 and 2014 there are breaks in the time series in some consumption sub-sectors due to a change in the methodology. Revisions back to 2011 are expected in the 2018 edition.
Gas for pipelines is included in distribution losses.
Between 2005 and 2006, there is a break in the time series of the industry sub-sectors.
Biofuels and waste
Transformation
Plants using municipal waste were reclassified as autoproducer CHP plants from 1995, which leads to a break in time series. Breaks in time series in 2005 for municipal waste and solid biofuels are caused by sectoral reclassifications.
Consumption
In 2014, a new survey on solid biofuels and bio-gases causes breaks in time series between 2013 and 2014. biogas was previously reported under solid biofuels.
Production and consumption of industrial waste are reported from 2013. Prior to that, they were included in municipal waste.
A revision of the solid biofuels and biogases time series created breaks in the direct use time series between 2004 and 2005.
The breakdown of the final energy consumption of biogases was estimated by the French admin-istration from 1970 to 2003.
Electricity and heat
Supply
All photovoltaic plants with capacity above 100 kWp are considered as main activity pro-ducers, while all plants with capacity below that value are considered autoproducers.
Heat production from heat pumps is available starting from 2013.
Electricity production from other sources is available starting in 2012, representing production of electricity from purchased steam. The input is shown under non-specified transformation.
76 - WORLD ENERGY BALANCES: DATABASE DOCUMENTATION (2017 edition)
INTERNATIONAL ENERGY AGENCY
Data on electricity production from wind is avail-able from 1990.
Transformation
Data for heat produced from combustible fuels in heat only plants are available starting from 2012.
Electricity production from geothermal started in 2011 and stopped in 2012 due to the maintenance of the only plant.
The amount of heat not sold in autoproducer plants is included in total heat production up to 2010.
In 2005, autoproducer CHP efficiencies for bio-gases drop due to the opening of a larger, less efficient plant.
From 2000 several plants have been reclassified from electricity only to CHP plants. This causes breaks in the time series between 1999 and 2000.
Prior to 2000, inputs and outputs of oil products are not available separately and are reported together under other oil products. From 2000 to 2008, there are further classification problems for inputs and outputs of electricity and heat from oil products. The French administration is working to reconcile their data collection methods for the inputs and the outputs for electricity generation.
A new method of survey and a reclassification between main activity producer electricity plants and autoproducer electricity plants may cause breaks in the time series for other bituminous coal between 1998 and 1999.
There was re-classification on auto producer plants using municipal waste in 1995, which leads to a break in the time series.
Net electricity production by autoproducer CHP plants is available from 1989.
Net electricity production by autoproducers prior to 1983 includes production from combustible fuel sources only.
Consumption
In the 2017 edition, the French administration undertook comprehensive revisions on sectoral electricity consumption time series, for some sectors revising back to 1990. Electricity con-sumption at railway and bus stations, shipping piers and airports is no longer included in the transport sector but in the commercial and public services sector. Road electricity consumption has also been revised back to 1990, following an extended review of NACE sector encoding by the administration. These revisions created breaks in
time series for several sectors, which the admin-istration anticipates to address in subsequent reporting cycles.
For the 2014 edition of this publication, the French administration revised electricity consumption data in the agriculture sector back to 2004, re-sulting in breaks in time series.
Prior to 2014, electricity consumption in the iron and steel sector includes consumption in blast furnaces. Consumption in blast furnaces has since been decoupled in subsequent years.
Until 2013, a large part of energy industry elec-tricity consumption in not elsewhere specified is consumption in uranium treatment plants; this elec-tricity consumption is not available prior to 1980.
Data on heat distribution losses are available only starting from 2012. Prior to that, they were in-cluded in final consumption.
Prior to 2005, all the geothermal heat con-sumption was reported as direct use. From 2005 data, some quantities are reported as output of heat plants, resulting in breaks in time series for pro-duction, transformation and consumption.
Consumption of electricity for oil and gas extraction includes that used in oil refineries from 1988 to 2000.
Non-specified other consumption includes exports to Monaco prior to 1992 and defence-related activities, among others.
The industry classifications used by the French administration were changed in 1986.
There are major breaks in the time series in 1965 when more detailed breakdown of data on elec-tricity consumption became available.
Germany
Source
Federal Ministry for Economic Affairs and Energy, Berlin.
General notes
Data starts in 1960. German data include the new federal states of Germany from 1970 onwards.
The German administration has changed the methodology for reporting heat over time:
Starting in 2007, more information is available on main activity heat plants and additional inputs
WORLD ENERGY BALANCES: DATABASE DOCUMENTATION (2017 edition) - 77
INTERNATIONAL ENERGY AGENCY
started to be reported for this category. This causes breaks in time series between 2006 and 2007.
Between 2003 and 2006, autoproducer heat output was provided, but no inputs.
Between 2002 and 2003 and between 2003 and 2004, breaks in time series occur, due to the imp-lementation of the Energy Statistics Act, collection concerning heat produced in heat plants and district heating plants became more efficient and more complete.
Coal
General notes
Comprehensive official data are only collected for the aggregate of hard coal. Due to the unavaila-bility of detailed data, the split into anthracite, coking coal and other bituminous coal is partly estimated by the national administration.
Due to the unavailability of detailed information, imports of other bituminous coal and coking coal have been estimated by the IEA Secretariat for 2016p.
In the 2014 edition, significant revisions were submitted for all primary coal types, derived products and manufactured gases for the period 2003 to 2011 as previous estimations were updated with more accurate information. Revisions primarily affected consumption, including industry and other sectors; but also supply, statistical differences and weighted calorific values.
Up to 2002, other bituminous coal includes anthracite.
Between 1998 and 2005, breaks in time series may occur for coke oven gas and blast furnace gas.
Between 1990 and 1992, breaks in time series may occur due to earlier reclassification of several sectors by the German administration; this par-ticularly affects BKB, lignite and coke oven coke.
Transformation
Breaks in time series between 2014 and 2015 for coke oven gas and blast furnace gas are due to a reclassification of main activity producers and autoproducers.
In 1997, BKB inputs to gas works plants stopped.
Consumption
Consumption of non-renewable municipal waste and other solid biofuels as a reductant occurs in
German blast furnaces, but is not currently quantified. Likewise, coal tar is a by-product of coke ovens, but not currently reported.
Oil
General notes
From 2000 data, part of the product Andere Rückstände (other residues) is included with fuel oil instead of other oil products.
Starting from 1994 data, there has been a reclass-ification of jet gasoline to kerosene type jet fuel.
Prior to 1979 data, other products include par-
affin waxes, bitumen, white spirit & SBP and lubricants for eastern Germany.
The methodology to determine net calorific values has been changed for 2015 data. The values for crude oil and refinery feedstocks were revised back to 2003.
Consumption
The data for the sectors of construction, agriculture/forestry and fishing is subsumed within the commercial and public services sector.
Between 2002 and 2003, breaks in time series in consumption data are due to structural changes in energy statistics following the newly introduced Energy Statistics Act.
In 1995 data, a break in gas/diesel oil consumption occurs as a result of an alignment with the Classification of the Economic Activities in the European Community (NACE).
Beginning in 1994, final consumption by individual sector has been improved due to new survey methods instituted by the Minerölwirts-chaftsverband.
In 1989, end-use consumption of gas/diesel oil decreased due to an exceptionally warm winter and a lowering of consumer stocks.
Prior to 1980 data, consumption of fuel oil in blast furnaces was included in the iron and steel sector
Prior to 1970 data, consumption of refinery gas in the chemical industry is included with refineries' own consumption.
Natural gas
General notes
Between 2009 and 2010, there is a break in time series due to a new, more comprehensive legal
78 - WORLD ENERGY BALANCES: DATABASE DOCUMENTATION (2017 edition)
INTERNATIONAL ENERGY AGENCY
framework that resulted in methodological changes for production and new calorific values for natural gas.
Supply
Imports include all the gas purchased by German companies, whether it is finally consumed in Germany or not.
Exports include all the gas sold by German companies (these are mainly re-exports).
Transformation
In 2003, there is a break in time series for input to electricity and CHP plants (both autoproducers and main activity producers).
Prior to 1995, inputs of natural gas for main activity producer heat plants are included with main activity producer CHP plants.
Consumption
Since 2003, there are no official data for the construction sector.
Since 2003, consumption in agriculture and non-specified other, which were previously estimated, are no longer shown, and losses data have been included in statistical differences.
Since 2003, gas consumption in coke ovens was negligible.
Between 2002 and 2003, there are breaks in time series for some sectors due to modifications in reporting methodology.
Between 1994 and 1995, there are some breaks in time series due to the fact that the industry sub-sector breakdown is based on the 1995 NACE classification.
Also, prior to 1995, end-use consumption data are based on Arbeitsgemeinschaft Energiebilanzen.
Before 1970 there is no detailed breakdown avail-able for the industry sector with the exception of iron and steel and chemical industries.
Biofuels and waste
General notes
In 2011, numerous changes to methodology and classifications have caused many breaks in time series.
Starting in 2008, municipal waste and industrial waste data were collected separately. This leads to breaks in the time series between 2007 and 2008.
Between 1996 and 1997, a new survey for re-newables causes breaks in the time series.
Supply
Trade data for biogasoline are available from 2004 and for biodiesels from 2003.
Consumption
For solid biofuels consumption in the commercial and public services sector, new data were derived in cooperation with the Federal Research Institute for Rural Areas, Forestry and Fisheries by apply-ing a different calculation approach based on the total demand for material and energy use of the resource wood in Germany. This had resulted in break in time series between 2013 and 2014.
Electricity and heat
General notes
In the 2014 edition, the German administration performed some major revisions back to 2003. This led to breaks in the time series between 2002 and 2003.
Prior to 1970, heat production and consumption have been estimated by the Secretariat based on Energie-bilanz der Bundesrepublic für das Jahr 1990 provided by the German Institute for Economic Research.
Supply
In some instances, electricity generation from nuclear, hydro, solar, wind and biogases in auto-producer electricity plants is confidential or not available and therefore is included in main activity producer electricity plants.
Since 2011, due to a reclassification of wind energy and solar photovoltaic in the official data of the German Federal Statistical Office, the pro-duction is now only reported under main activity producer plants.
Electricity production from other sources is avail-able starting in 2003. This refers to the production of electricity from turbines which are located at pressure drops in fluid transport and from pur-chased waste heat.
Prior to 1991, electricity trade data includes only trade of the Former Federal Republic of Germany.
Data on electricity production from wind and solar are available from 1986 and 1990, respectively.
WORLD ENERGY BALANCES: DATABASE DOCUMENTATION (2017 edition) - 79
INTERNATIONAL ENERGY AGENCY
Starting in 1984, small amounts of heat have been exported to Denmark.
Transformation
Detailed data by fuel are not available for total heat production. The non-allocated part is reported as heat production from non-specified com-bustible fuels.
In 2015, a reclassification of some main activity producer electricity and CHP plants to autoproducer CHP plants powered by coke oven gas results in a break in time series for this period. Similarly, a reclassification of blast furnace gas main activity electricity plants into autoproducer plants results in a break in time series for the same period.
From 2003 onwards, all heat production in auto-producers is considered as non-sold (i.e. for self-use) and, therefore, not reported. Inputs for this heat production are no longer reported in the transformation sector.
For 2002 and 2003, the German administration did not submit the breakdown of electricity and heat production from combustible fuels. The data were estimated as follows: renewables and waste were taken from the Renewables and Waste Questionnaire and the other combustible fuels were estimated pro rata based on 2001 estimates.
Prior to 2003, electricity production in electricity plants includes production from CHP plants and heat production in CHP plants includes production from heat plants.
Due to the implementation of the Energy Statistics Act, collection concerning heat produced in heat plants and district heating plants became more efficient and more complete. This leads to breaks in time series between 2002 and 2003 and between 2003 and 2004.
A new survey for the renewable products can cause breaks in the time series between 1998 and 1999.
Prior to 1993, all heat production from BKB/peat briquettes is included in main activity producer CHP plants.
Consumption
More information on district heat became avail-able, causing breaks in the time series between 2006 and 2007.
Data on geothermal heat production and direct consumption are only available starting in 2003.
From 2002, electricity consumption in the commercial and public sector includes the con-struction sector, and the fishing, agriculture and forestry sectors for the whole time series.
In 2000, revisions from the German administration to the electricity consumption data may cause breaks in the time series.
In 1995, the German Federal Statistics Office re-classified some industrial branches which may cause a break in time series in industry sub-sectors.
Between 1971 and 1980 electricity consumption in coal mines includes consumption in coke ovens and BKB plants.
Greece
Source
Ministry for Environment and Energy, Athens.
Oil
General notes
In the 2016 edition, the Greek administration reclassified gasoline-type jet fuel as aviation gasoline starting from 2009 data.
Between 2012 and 2013, breaks time in time series for biodiesel, lubricants and stocks appear due to the introduction of a new reporting system.
Supply
Crude oil production stopped on 30 November 1998 and started again in December 1999.
From 1986 data onwards, information on refinery feedstocks is available
Transformation
From 1990 onwards, there has been an increased use of refinery gas in electricity generation, re-placing fuel oil.
Consumption
In 2013 data, the drop of gas/diesel oil residential consumption is linked with changes in the taxation of heating oil.
From 1993 data onwards, more information is available on the allocation of fuel oil to specific industrial sub-sectors. Fuel oil consumption in the agriculture and residential sectors has been re-placed by gas/diesel oil starting in 1993.
80 - WORLD ENERGY BALANCES: DATABASE DOCUMENTATION (2017 edition)
INTERNATIONAL ENERGY AGENCY
Prior to 1987 data, consumption in the commerce/public services sector is included with residential. Peaks in residential sector consumption in 1978 and 1982 are due to unusually cold winters.
Natural gas
General notes
Natural gas produced in Greece has a higher than average gross calorific value due to a high content of C2/C4 hydrocarbons.
Supply
In November 1998 the production of natural gas stopped in and started again in December 1999.
In 1997, Greece started importing natural gas as a result of a new operational pipeline between Russia and Greece.
Consumption
In 2011 there is a break in time series for the non-ferrous metals due to a new methodology for measuring gas consumption in this sub-sector.
In 1998, consumption in the residential sector is included with commercial/public services.
Biofuels and waste
General notes
New information on solid biofuels is available from 1996 and leads to breaks between 1995 and 1996.
Data for biogases are available from 1990 and data for industrial waste from 1992.
Transformation
The big increase in delivery of industrial waste to autoproducer CHP plant in 2010 is mainly due to the opening of a new plant.
Inputs of solid biofuels to charcoal production are estimated for 2007 to 2010 by the IEA Secretariat assuming an efficiency of 40%.
Industrial waste used in autoproducer CHP plants decreased substantially in 2006 because a plant closed.
Consumption
Solid biofuels consumption in commercial/public services is included in residential until 2011.
The consumption of solid biofuels in the paper, pulp and printing industry is not available from 2003 to 2012.
Electricity and heat
Supply
No production of solar heat is reported.
Transformation
In 2008 a new plant using refinery gas started operating in an experimental phase, causing a low efficiency.
Production and consumption of distributed heat (heat sold) that is produced from lignite is available from 1997.
Data for biofuels and waste input and output to transformation are available from 1992.
Consumption
Electricity consumption in road is available from 2013.
A break in time series exists between 1991 and 1992 for electricity consumption in transport.
Direct use of geothermal heat in residential is available starting in 2004.
Electricity consumption in iron and steel and in the non-ferrous metals industry prior to 1971 has been estimated by the Secretariat.
Hungary
Source
Hungarian Energy and Public Utility Regulatory Authority, Budapest.
General notes
Data are available starting in 1965.
The Hungarian administration submitted ques-tionnaires to the IEA Secretariat for the first time with 1993 data.
Coal
General notes
From 1992, the production of sub-bituminous coal has been included with lignite due to the low quality of the coal. For 1990 to 1999, the use of this domestic coal in main activity producer electricity
WORLD ENERGY BALANCES: DATABASE DOCUMENTATION (2017 edition) - 81
INTERNATIONAL ENERGY AGENCY
and CHP plants has also been reclassified to lignite.
Transformation
Autoproducer heat and power plants using coke oven gas and blast furnace gas were reclassified in 1998 as main activity power plants.
Oil
General notes
From 2010, from other sources - natural gas of other hydrocarbons correspond to hydrogen used in refineries, also represented as the output of non-specified transformation in the balances format.
Starting from 1998, data for additives and aviation gasoline are available.
From 1994 onwards, other products include aromatics and other products that were previously included mainly under white spirit. Prior to 1993, white spirit is included in motor gasoline. Data for refinery gas, paraffin waxes and lubricants are partly estimated by the Secretariat.
Supply
In 2016 the closure of the Val d’Agri oil centre between April and August led to a decrease in production of crude oil.
Consumption
In the 2016 and 2017 editions, revisions to con-sumption data back to 2010 were provided by the Hungarian administration following a survey introduced in 2014. This results in breaks in time series between 2009 and 2010.
Natural gas
General notes
Between 2012 and 2013 there are some breaks in time series for energy sector, transport and industry consumption due to a new methodology. Historical revisions are pending.
Between 1996 and 1997 some breaks in time series exist due to a new methodology applied by the Hungarian administration.
Transformation
Since 2010, data reported for non-specified transformation represent natural gas used for hydrogen manufacture used in refineries for
hydrodesulphurization. Prior to this year, these quantities are reported under oil refineries.
Since 1997 two autoproducer heat plants have been reclassified to main activity producer heat plants.
Consumption
Prior to 2004 iron and steel consumption includes transformation of natural gas in blast furnaces.
Biofuels and waste
General notes
Data for biogases are available from 2000; for industrial waste from 2003; for biodiesel pro-duction from 2007.
Supply
A 2012 change in biogasoline reporting meth-odology results in break in time series between 2011 and 2012.
Consumption
In the 2017 edition, the Hungarian administration has revised solid biofuels consumption in other sectors back to 2010 based on the new survey from Hungarian Central Statistical Office (HCSO). This resulted in break in time series between 2009 and 2010.
A new reporting methodology for the direct use of geothermal energy was applied from 2014 resulting in break in time series between 2013 and 2014.
Electricity and heat
Supply
Other sources electricity and heat production is available from 2013 and represents generation from residual tail gases from the manufacturing of soot as well as from hydrogen.
Geothermal heat production from main activity producer heat plants is available from 1995.
Nuclear electricity production in main activity producer electricity plants is available from 1983.
Transformation
From 2014 data, more data suppliers were involved in the process, causing new autoproducer time series to appear for geothermal and indus-trial waste plants.
82 - WORLD ENERGY BALANCES: DATABASE DOCUMENTATION (2017 edition)
INTERNATIONAL ENERGY AGENCY
In 2014 data, some CHP plants running on solid biofuels produced only heat and were reclassified to heat plants.
The Hungarian administration reclassified some of their plants between 1996 and 2000, which may lead to breaks in the time series.
Prior to 2000, electricity output from sub-bituminous coal is included with lignite.
Data on electricity and heat production from solid biofuels in autoproducer CHP plants are available from 1995.
Autoproducer electricity, CHP, and heat plants using coke oven gas and blast furnace gas were reclassified as main activity power plants in 1998.
Consumption
Data for direct use of solar thermal heat are avail-able from 2001 and from 1990 for geothermal heat.
Iceland
Source
National Energy Authority, Reyjkavik.
General notes
Prior to 1970, final consumption includes inputs and outputs to heat production.
The industrial classifications used by the Icelandic administration were changed in 1987.
Coal
General notes
Hard coal data prior to 1978 may include sub-bituminous coal.
Consumption:
Final consumption increased in 2000 as a new iron and steel plant came on-line.
Oil
General notes
In 2014, the Icelandic administration revised petroleum coke data from 1990 to exclude imports of anodes for the aluminium industry.
Oil supply and consumption data for 2008 and 2009 are estimated by the IEA Secretariat.
Biofuels and waste
Consumption
Biodiesel consumption data for 2014 are estimated by the Icelandic administration based on 2013.
Biogases used for transport purposes were reported for the first time in 2007.
Revisions in direct use of geothermal heat starting in 2013 create breaks in time series between 2012 and 2013.
Electricity and heat
Supply
The increase in hydro and geothermal electricity production from 2007 is due to the expansion of the aluminium industry.
Transformation
For 2016, access to improved data revealed con-siderably better heat plant efficiencies than pre-viously inferred, with increases in heat production seen during this period. The Icelandic admin-istration plans to revise previous years’ figures in succeeding editions.
From 2013 data, the Hellisheidi geothermal power plant, previously reported under main activity electricity plant, was categorised as main activity CHP plant.
Heat production from municipal waste is available from 1993 and stops in 2010.
In 1998, 60 MW of generating capacity was in-stalled in the geothermal CHP plant at Nesjavellir. Since the plant was inoperable for four months, production of geothermal heat decreased com-pared to 1997. The extra electricity capacity caused electricity production from geothermal to almost double over the same period.
Electricity production from geothermal sources in main activity producer CHP plants is available from 1992.
Consumption
In the 2017 edition, the heat consumption breakdown by sector for the years 1990 to 2013 has become available following reviews by the Icelandic administration.
WORLD ENERGY BALANCES: DATABASE DOCUMENTATION (2017 edition) - 83
INTERNATIONAL ENERGY AGENCY
The geothermal consumption in the industrial sector is reported under non-specified industry, as the Icelandic administration decided not to estimate the allocation amongst the sub-sectors of industry.
There were reclassifications in the direct use of geothermal heat in 2014 which create breaks in time series between 2013 and 2014.
Electricity consumption in non-specified transport includes consumption for ferries and cruise lines.
Energy industry consumption of electricity refers mainly to the use of electricity by the geothermal industry to pump hot water from underground sources.
The increase of electricity consumption in the construction sector from 2004 to 2007 is due to the drilling of tunnels for the Kárahnjúkar power plant.
The consumption of electricity reported in non-specified other corresponds to a NATO base at Keflavik airport which closed in 2005.
From 1991, energy industry consumption includes electricity used for the transport by pipeline of hot water from Nesjavellir to Reykjavik.
Prior to 1990, all heat for space heating was re-ported in residential.
The industrial classifications used by the Icelandic administration changed in 1987.
Residential sector includes agriculture prior to 1983.
Prior to 1970, total final consumption includes inputs to and outputs from heat production and non-energy use. After 1970, data on inputs and outputs in CHP plants and in main activity producer heat plants (district heat plants) and for non-energy use are separately specified.
Ireland
Sources
Department of Communications, Energy and Natural Resources, Dublin.
Sustainable Energy Authority of Ireland, Cork.
Coal
General notes
Due to confidentiality reasons, inputs of anthra-cite, other bituminous coal and peat briquettes
for patent fuel transformation are reported with residential consumption, while production and consumption of patent fuel is not reported.
Prior to 1990, any imports of BKB were included with imports of peat products, as is the case for consumption.
Supply
Rainfall in 2012 led to the lowest peat harvest since IEA records began in 1960, requiring large stock drawdown and increased use of biofuels for electricity generation. In 2013, production targets were met before the end of the year however production continued in order to further build stocks to alleviate the potential impacts of future weather events.
Low production of peat in 1985 was due to a poor “harvest”, due to an unusually wet summer.
Production data for peat products (briquettes) are available from 1975.
Transformation
A reclassification caused a break in the time series for peat consumption in the energy industry own use in BKB/peat product plants from 1989 to 1990.
The production of gas works gas ceased in 1987 due to fuel switching to natural gas.
Other bituminous coal inputs to main activity pro-ducer electricity plants increased from 1986 due to three new generating units at Moneypoint coming on-line.
Oil
General notes
From other sources - natural gas of other hydro-carbons correspond to natural gas blended with refinery gas.
For confidentiality reasons, inputs of petroleum coke into patent fuel transformation are reported with residential consumption.
Consumption
In 2014, the drop of fuel oil consumption in non-metallic minerals sector is linked with the replacement of HFO boilers by natural gas boilers as the primary source of steam for alumina production.
In 2013 and 2014, bitumen consumption data are not available and calculated as residual.
84 - WORLD ENERGY BALANCES: DATABASE DOCUMENTATION (2017 edition)
INTERNATIONAL ENERGY AGENCY
Between 2008 and 2009, there is a break in time series for gas/diesel oil, LPG, kerosene-type jet fuel and petroleum coke due to a new meth-odology being applied to sectoral demand by Sust-ainable Energy Ireland (SEI). This change also ex-plains breaks between 2006 and 2007 for bitumen, lubricants, white spirit, and paraffin waxes.
Between 1989 and 1990, breaks in time series appear for consumption of gas/diesel oil, LPG, other kerosene and fuel oil as a result of a detailed consumption survey done for 1993. Data for historical years back to 1990 were revised by the national administration based on the results of this survey.
From 1986, gas/diesel oil consumption in the agricultural sector is available.
From 1970 to 1977, the split between commercial and public services and agricultural use of other kerosene has been estimated by the Secretariat. Consumption in commercial/public services in-cludes quantities used by state-owned agricultural companies.
Natural gas
Supply
Natural gas production increased in 2016 since the Corrib Gas field began production at the end of 2015 and continued through 2016.
Since 1996, the increase in imports is due to the depletion of the Kinsale gas field and the availability of a new pipeline system to the United Kingdom.
Transformation
Since 2006, a different methodology for allocating unsold steam from autoproducer CHP is used.
Non specified transformation corresponds to nat-ural gas blended with refinery gas.
Consumption
In 2011 the increase in non-ferrous metals consumption is due to a fuel switch to natural gas.
Since 2009, the disaggregation of consumption into all the industry sub sectors excluding non-ferrous metals is done according to data from the Census of Industrial Production (CIP). The last energy consumption data available from the CIP are from 2009 and therefore the 2009-2015 sub-sector breakdown is the same every year.
In 2007 the increase in machinery consumption is due to changes in industry sub-sector structure and fuel usage.
In 2004, there is a break in the time series in food, beverages and tobacco consumption due to a change in methodology.
In 2003, feedstock use in the petrochemical industry stopped due to the shutdown of a fertiliser plant.
In 2001, natural gas consumption in the iron and steel industry stopped due to the shutdown of Ireland’s main steel plant.
Prior to 1986, detailed consumption figures for the use of natural gas in industry and other sectors are not available.
Biofuels and waste
General notes
Data for municipal waste are available from 2009.
Data for solid biofuels and biogases are available from 1990.
Supply
Prior to 2011, production and trade of biogasoline and biodiesels cannot be distinguished due to confidentiality issues.
Transformation
In 2012 and 2013, the renewable fraction of tyre-derived fuel (12%) used by a cement plant was re-ported by the administration under renewable municipal waste; the non-renewable fraction (88%) was reported under industrial waste.
Consumption
The consumption of pure biodiesel in the industry sector and in road transport refers to one site, which is no longer in operation since 2014.
Electricity and heat
Supply
Electricity production from wind begins in 1992 and from biogases in 1996.
Transformation
In the 2016 edition, revisions were introduced in the electricity generation by fuel from 2010 due to improved data available from the transmission system operator.
WORLD ENERGY BALANCES: DATABASE DOCUMENTATION (2017 edition) - 85
INTERNATIONAL ENERGY AGENCY
In 2015, a new combined cycle gas turbine plant began commercial operations at Great Island power station, replacing the existing heavy fuel oil power plant.
In 2012, a new main activity electricity plant burning municipal waste (the Meath plant) started operation.
In 2011, very little electricity was produced from pumped hydro following Turlough Hill, Ireland’s pumped storage station, being taken offline in late 2010 up until February 2012. The 2011 values appear as zero due to rounding.
From 1984 to 1989, inputs of hard coal in auto-producer CHP plants have been estimated by the Secretariat.
Consumption
In 2004, the increase of electricity consumption is due to the new light rail transit system in Dublin.
The decrease of electricity consumption in the iron and steel industry from 2001 onwards is due to Ireland’s main steel plant ceasing production.
Prior to 1990, electricity consumption in agri-culture is included with residential.
Electricity consumption in the iron and steel industry includes consumption in the non-ferrous metals industry prior to 1990.
Data for direct use of geothermal heat and solar thermal heat are available from 1989 and 1990, respectively.
Israel
Source
Israel Central Bureau of Statistics, Jerusalem.
General notes
Data are available starting in 1971.
The statistical data for Israel are supplied by and under the responsibility of the relevant Israeli ad-ministration. The use of such data by the OECD and/or the IEA is without prejudice to the status of the Golan Heights, East Jerusalem and Israeli settlements in the West Bank under the terms of international law.
Due to the unavailability of data for certain fuels, IEA estimations are also present in Israel data. In particular this is valid for oil data in 2014 and
2015, natural gas data from 2012 onwards, re-newables and waste data in 2013.
Coal
Supply
Due to confidentiality constraints, imports of other bituminous coal have been estimated by the IEA Secretariat for 2016p.
Oil
General notes
Oil data for 2015 are estimated by the IEA Secre-tariat based on Israel’s energy balance and the fuel consumption report from the Ministry of National Infrastructures, Energy and Water Resources.
In 2014 the detailed breakdown of consumption is estimated by the IEA Secretariat based on the fuel consumption report from the Ministry of National Infrastructures, Energy and Water Resources.
Due to a change in the methodology used to calc-ulate the Israeli energy balance, there are breaks in time series between 2013 and 2014. Revisions to 2013 are pending.
Supply and consumption of kerosene type jet fuel for 2011 and 2012 have been estimated by the IEA Secretariat.
From 2007 to 2009, oil data are estimated by the IEA Secretariat based on information from the Ministry of National Infrastructures.
Supply
From 2010 onwards, white spirit is included in other products.
Consumption
From 2013, consumption data are based on a new and detailed classification system and on estim-ations made by the Israeli administration.
Natural gas
General note
From 2012, all natural gas data, except inputs to electricity production, were estimated by the IEA Secretariat.
Supply
Imports of natural gas began in 2008.
86 - WORLD ENERGY BALANCES: DATABASE DOCUMENTATION (2017 edition)
INTERNATIONAL ENERGY AGENCY
Transformation
In the 2017 edition, the Israeli administration re-vised transformation data back to 2013.
Biofuels and waste
Consumption
Data on imports and consumption of charcoal were estimated since 2012 based on figures for 2011.
Electricity and heat
Supply
Electricity production from wind begins in 2001.
Transformation
For 2013 and 2014, other oil products inputs to autoproducer electricity plants were estimated by the IEA Secretariat.
Biogas input to transformation sector was estim-ated by the IEA Secretariat from 2013 data point.
Consumption
In the 2017 edition, solar thermal production and direct consumption were revised and are now estimated by the IEA Secretariat from 2012 onwards, using data published in the IEA-Solar Heating and Cooling Programme Annual Report. These estimations may create breaks in time series between 2011 and 2012.
For 2013, the split of electricity consumption in industry is estimated by the IEA Secretariat.
Electricity own use, as well as transmission and distribution losses were estimated by the IEA Secretariat from 2010 to 2012.
Italy
Source
Ministry of Economic Development, Rome.
Terna, Rome.
General notes
A change in methodology lead to breaks in time series for industry and transformation between 2003 and 2004.
Coal
General notes
The increase in production of coke oven gas in 2012 was the consequence of improvements in scope of reporting. As such, coke oven gas data in prior years should be viewed as under-representing production and consumption, and coke oven efficiencies will likewise appear lower than actual.
Due to a change in the survey system, breaks in time series may occur between 1997 and 1998 for final consumption.
From 1986 onwards, figures from lignite are given using the same methodology as in the Bilancio Energetico Nazionale.
Transformation
Reported production of blast furnace gas and other recovered gases are inputs for electricity generation or CHP. Production of blast furnace gas and other recovered gases used elsewhere in the iron and steel industry are not reported. As such, reported pro-duction and consumption data are lower than actual. Normalisation of blast furnace efficiencies will result in inputs of coke oven coke and other bituminous coal (PCI) to blast furnaces being lower than re-ported, with these relocated portions reported along-side generic consumption in the iron and steel industry instead.
Breaks in the time series between 2014 and 2015 for coke oven gas, blast furnace gas and other recovered gases are due to a reclassification of main activity producers and autoproducers.
Prior to 2009, sub-bituminous coal used in main activity electricity plants was included with other bituminous coal consumption.
For data since 2001, calorific values for imports of other bituminous coal and sub-bituminous coal are derived from inputs to main activity electricity generation.
Consumption
In 1991, all industrial activities were reclassified on the basis of ISTAT/NACE 91. This has implied some transfers of activities which may result in some anomalies between 1991 and earlier years.
Oil
General notes
For crude oil, statistical difference may arise as trade corresponding to stock held for Austria and Germany in the Port of Trieste are not included.
WORLD ENERGY BALANCES: DATABASE DOCUMENTATION (2017 edition) - 87
INTERNATIONAL ENERGY AGENCY
Inputs to electricity and heat generation have been estimated by the IEA Secretariat for the years 1984 to 1997 based on submissions of the Electricity and heat Questionnaire. All other data for the years 1992 to 1997 and the detailed consumption break-down for other years have been estimated by the IEA Secretariat based on Bilancio Energetico Nazionale.
Supply
From 2009 onwards, transfers of lubricants could not be disaggregated from refinery output data.
From 2004 onwards, increased production of non-specified oil products is due to methodological changes.
A new survey to determine the split between international marine bunkers and domestic navigation caused a break in time series for gas/diesel oil in 1999 and fuel oil in 1996.
Consumption
For gas/diesel oil, non-specified use is included in commercial/public services.
Between 1998 and 1999, due to new surveys, breaks appear in the consumption time series.
Natural gas
Transformation
Prior to 2008, inputs of natural gas to all heat production in industry were reported in final consumption.
Between 2003 and 2004 there are breaks in time series in industry and transformation due to a new data reporting methodology
From 2000 to 2002, for confidentiality reasons, autoproducers are included in main activity pro-ducer plants.
In 1996 the production of gas works gas from nat-ural gas ceased.
Consumption
Since 2007, a more detailed breakdown of consumption for energy industry own use is available.
Biofuels and waste
Supply
Biogasoline includes bio-ETBE.
From 2014, a distinction between trade and pro-duction became available for other liquid biofuels.
Transformation
In 2008, data for biofuels and waste were re-classified, which results in several breaks in the time series for transformation.
Consumption
The final consumption of biogas has been constant from 2013 to 2015, as these figures are the result of a survey which is not carried out annually. Figures are expected to be revised after the next survey.
In the 2016 edition, the methodology used to cal-culate solid biofuels consumption in the res-idential sector for 2002 to 2014 was updated and this created a break in time series between 2001 and 2002. This also affects the indigenous pro-duction of solid biofuels. The revisions were limit-ed backwards to 2002 because of reliability issues.
Electricity and heat
Supply
The production of electricity reported in the category other fuel sources refers to electricity produced from turbines which are located at pressure drops in fluid transport.
The methodology of data collection for photo-voltaic electricity production changed in 2009 and the distinction between main activity and auto-producer plants could not be determined, causing a break in the time series.
Electricity trade with Malta commenced in 2015, following the opening of the Malta-Sicily inter-connector submarine power cable in the same year.
Transformation
The methodology of data collection for the geo-thermal sector changed in 2010, causing a break in time series between 2009 and 2010.
Prior to 2009, sub-bituminous coal used in main activity electricity plants was included under other bituminous coal.
With the introduction of a new survey in 2008, amounts of naphtha and other kerosene that were previously included in other oil products have been reported separately in autoproducer CHP plants.
88 - WORLD ENERGY BALANCES: DATABASE DOCUMENTATION (2017 edition)
INTERNATIONAL ENERGY AGENCY
Prior to 2004, electricity production from ori-mulsion is confidential and is included with fuel oil.
Heat production is reported starting in 2004 and includes self-generation in industry.
From 2000 onwards, the Italian administration defines electricity and heat production from auto-producers as generation from producers that con-sume more than 70% of their own electricity pro-duction. However, for the 2000 to 2002 period, all electricity production from autoproducers is re-ported with main activity producers.
The breakdown of renewables and waste inputs into electricity, heat and CHP plants is available from 1989 only. Prior to that year, the total of the different fuels involved is reported as non-specified renewables.
Prior to 1984, net electricity production by auto-producers includes production from combustible fuel sources only.
Consumption
Non specified energy industry own use includes electricity consumption for blast furnaces. From 2000, it also includes consumption for the dis-tribution of gas and prior to 1989 consumption for uranium extraction.
The breakdown of heat consumption by sector is estimated by the Italian administration.
Revisions of the final consumption of heat by the Italian administration led to breaks between 2010 and 2011.
From 1981, consumption of electricity in transport includes electricity used for pumping in oil pipelines.
Japan
Source
The Institute of Energy Economics Japan, Tokyo.
General notes
From 1990, data are reported on a fiscal year basis (e.g. April 2015 to March 2016 for 2015).
Between 2004 and 2007, a time series of revisions were received from the Japanese administration. These changes were mainly due to the government of Japan's efforts to improve the input-output balances in the production of oil products and coal
products in response to inquiries from the UNFCCC Secretariat. To cope with this issue, the Japanese administration established a working group in March 2004. The working group completed its work in April 2006. Many of its conclusions were incorporated in the 2006 edition, but some further revisions to the time series (especially in industry and other) were submitted for the 2007 edition.
Consumption data for commercial/public services may include consumption in small and medium-sized industries. The Japanese administration ex-pects that this shortcoming will be corrected in the near future.
Coal
General notes
Other bituminous coal includes sub-bituminous coal.
The net calorific values for coal and coal products have been recalculated by the IEA Secretariat based upon gross values submitted by Japan.
In the past three editions, imports of other bituminous coal and coking coal – total and by partner country - have been estimated by the IEA Secretariat for data from 1990 to the provisional year, based on customs data and total imports by coal type.
In the 2014 edition, further supply-side revisions to data from 1990 through 2011 were received, primarily to imports of other bituminous coal, in order to reconcile differences between submissions to the IEA and UNFCCC.
Hard coal data prior to 1978 may include sub-bituminous coal.
Supply
Statistical differences for hard coal include stock changes since 2001. Large positive differences for several years since 2004 are partly due to stock build by final consumers.
Transformation
The inputs of coke oven coke to blast furnaces as well as the final consumption of coke oven coke in the iron and steel industry have been estimated by the IEA Secretariat since 1990.
From 1998, inputs of coke oven gas, blast furnace gas and other recovered gases into auto-producer electricity plants include the amount used to produce electricity with TRT technology (Top
WORLD ENERGY BALANCES: DATABASE DOCUMENTATION (2017 edition) - 89
INTERNATIONAL ENERGY AGENCY
pressure Recovery Turbines) which was pre-viously included in industry.
Inputs of manufactured gases (coke oven gas, blast furnace gas and other recovered gases) to main activity electricity and heat plants are cal-culated based on outputs and using efficiencies of main activity producers from other fuels. For auto-producers, the specific inputs are known, however the specific electricity production by each gas is estimated based on a pro-rata of the total elec-tricity generation from all gas types.
Coal injected in blast furnaces (PCI) is classified as coking coal in order to be consistent with Japanese trade statistics.
Oil
General notes
In the 2016 edition, the Japanese administration revised several NCVs of both primary and secondary oil products back to 1990. The Japanese administration reviews calorific values every five years, with the other most recent re-visions occurring in 2005 and in 2013.
In the 2016 edition, the Japanese administration revised several consumption flows. Based on publicly available information, final consumption data in the Energy Balance Table are now based on a new annual survey. From 2005, consumption data are derived from this new survey, while prior to 2005 data are estimated based on the 2005 data.
Supply
The high statistical difference for crude oil in 2013 and 2014 is explained by large amount of stocks held on board incoming vessels in port or at mooring in March 2014 (end of Japan’s 2013 financial year). These amounts are included in the stock change but not in the imports in 2013 annual data.
Orimulsion was imported for electricity generation between 1991 and 2006.
Transformation
Other hydrocarbons in non-specified transformation represents orimulsion burnt for power generation. Historical revisions are pending.
Consumption
In the 2016 edition, the Japanese administration revised road consumption, which is now based on
the “Automobile fuel consumption survey” from the Ministry of Land, Infrastructure, Transport and Tourism (MLIT). In the past, the "Statistical report on motor vehicle transport" (from the same Min-istry) was used.
Lubricants consumption is estimated by the Japanese administration since 2000.
Natural gas
General notes
In the 2017 edition, there are breaks in the time series for LNG imports between 2012 and 2013 due to a change in the methodology of the Japanese administration to calculate the gross cal-orific values.
Since 1990 most of the gas works gas production and consumption has been included with natural gas.
Supply
In the 2017 edition, import data were revised back to 2013.
Transformation
In 2017 edition, the Japanese administration revised transformation data for the period 1990-1999.
Consumption
Some consumption data for the latest year are estimated by the Japanese administration based on previous year’s information until final data be-come available. Revisions are expected in the following year.
Due to a change in the methodology, there are breaks in time series for industrial sub-sectoral consumption between 2013 and 2014. Revisions of historical data are expected in the coming years.
Biofuels and waste
General notes
Due to the lack of data, some parts of solid biofuels data for 2016 are missing. Revision is expected in the 2018 edition.
There was a large revision in municipal waste data in the 2016 edition of this publication. This revision has removed data for municipal waste for the entire time series up to 2010, which create breaks in time series between 2009 and 2010.
90 - WORLD ENERGY BALANCES: DATABASE DOCUMENTATION (2017 edition)
INTERNATIONAL ENERGY AGENCY
For municipal waste data, the breakdown between renewable and non-renewable municipal waste is estimated by the IEA Secretariat.
Transformation
Input data of solid biofuels to charcoal production are estimated by the IEA Secretariat assuming an efficiency of 40%.
The industrial waste consumption in the non-specified transformation sector surged in 2013, because of the increase in use of waste plastics for coke production.
Electricity and heat
Supply
Due to the events related to the March 2011 tsunami, the Japanese administration decided to scale back the level of their nuclear programme. As a consequence, there was no nuclear electricity generation in 2014. The nuclear electricity gen-eration started again in 2015.
Other sources electricity represents electricity gen-erated with purchased steam. Other sources heat represents heat derived from waste heat.
Production of electricity from solar photovoltaic and wind in autoproducer electricity plants is understated as it covers only plants with capacity higher than 1000 kW.
The Japanese administration estimate the elec-tricity input of electric boilers based on 100% efficiency.
The IEA Secretariat estimated the photovoltaic (PV) electricity generation from autoproducers from 1992 to 2016p based on an average capacity factor of 12% and capacity data for autoproducers. Autoproducer PV capacity is derived from data from the Japanese administration as well as the IEA Photovoltaic Power Systems Programme (IEA-PVPS) report, “Trends in Photovoltaic Applications” published in 2016. The capacity factor was based on the report “National survey report of PV Power Applications in Japan”, published by IEA-PVPS. The corresponding elec-tricity consumption has been included with non-specified other consumption.
Data on electricity production from wind began in 1993.
Heat produced for sale in main activity producer heat plants from waste heat and from electric boilers is available from 1977 and 1983, respectively.
Transformation
Electricity production from pumped storage includes production from both mixed hydro and pure pumped storage.
Data on heat produced for sale by autoproducer heat plants are not available.
Fuels used and corresponding electricity and heat produced in CHP plants are not included in the CHP data time series, but instead are reported as separate electricity or heat components, leading to some plant efficiency figures not to be accurately calculated.
Heat production from geothermal and solar thermal sources in Japan is not reported by the Japanese administration.
Prior to 1998, the electricity produced using TRT technology (Top pressure Recovery Turbines) was included with electricity generated from solid bio-fuels. Starting in 1998, it is included with elec-tricity generated from coal gases.
Inputs of biofuels and waste for electricity pro-duction and related outputs are available from 1982.
Net electricity production by autoproducers prior to 1982 includes production from combustible fuel sources only.
Between 1972 and 1976, the use of combustible fuels in main activity producer heat plants is included in non-specified.
Consumption
In the 2017 edition, the consumption of electricity in the wood and wood products sector was entirely reviewed from 1990 due to the revision of the “General Energy Statistics (Energy Balance Table)” published by the Ministry of Economy, Trade and Industry, which replaced the previous method using statistical surveys. As a result of this review, some of the consumption amounts listed under wood and wood products sector were re-classified to the non-specified industry sector, representing consumption related to the manu-facture of rubber products.
The electricity consumption in the non-specified industry sector is estimated by the Japanese administration as residual item to include the non-assigned industry consumption. For this reason, the trend in this category could behave erratically.
The consumption data of electricity prior to 2005 in the industry and other sectors was estimated by the Japanese administration based on 2005 figures.
WORLD ENERGY BALANCES: DATABASE DOCUMENTATION (2017 edition) - 91
INTERNATIONAL ENERGY AGENCY
Consumption of electricity in non-specified ind-ustry includes wood and wood products and con-struction prior to 1982.
Korea
Sources
Korea Energy Economics Institute, Ulsan.
Korea National Oil Corporation, Ulsan.
General notes
Data are available starting in 1971.
Data for 2002 onwards have been reported on a different basis, causing breaks in time series between 2001 and 2002, especially for inputs and outputs to electricity generation and consumption in the iron and steel industry. The Korean administration is planning to revise the historical time series as time and resources allow.
Coal
General notes
Data for coal and coal products from 1971 to 2001 are based on information provided by the Korean administration, as well as information from the Yearbook of Energy Statistics 2002, the Yearbook of Coal Statistics 2001 (both from the Ministry of Commerce, Industry and Energy), and Statistics of Electric Power in Korea 2001 (from the Korea Electric Power Corporation). During this period, import data by coal type were estimated by the IEA Secretariat, based on statistics of the exporting countries.
Hard coal data prior to 1978 may include sub-bituminous coal.
Transformation
For 2015, coking coal inputs to coke ovens decreased while coke oven coke production increased, impacting efficiency trends. To cope with this issue, the Korean administration is working to improve data collection. Revisions on these data are expected in future editions.
Statistical differences for manufactured gases for 2012 are partly the result of classification issues. The Korean administration is working to improve reporting of coal-derived gases production and consumption.
Consumption
Data on blast furnace gas used for energy purposes in blast furnaces prior to 2007 are re-ported in the iron and steel industry.
Consumption of imported coke oven coke starting in 2002 is reported under non-specified industry.
Consumption of manufactured gases in the iron and steel industry starting in 2002 includes the consumption in blast furnaces, oxygen steel furnaces and other iron and steel processing plants.
Oil
Consumption
Inputs of fuel oil to autoproducer electricity and auto-producer CHP are included with final consumption.
Natural gas
Supply
Korea reports production of natural gas since 2005. The production is decreasing and the reservoir is expected to be depleted by the end of 2017.
Consumption
Energy industry own use in liquefaction plants in-cludes losses and measuring errors.
Prior to 2007, consumption of natural gas in machinery was included with transport equipment.
From 1987 to 1991, the breakdown of final con-sumption has been estimated by the IEA Secre-tariat, as well as the residential subsector for 1992.
Biofuels and waste
General notes
Due to the change of reporting methodology, breaks in time series may occur between 2013-2014 and 2014-2015.
Electricity statistics from 1971 to 1993 have been estimated by the IEA Secretariat based on the Korean National Statistics. Data from 1994 have been sub-mitted by the Korean administration. This leads to breaks in time series between 1993 and 1994.
Heat data are available starting in 1993.
Transformation
Inputs to autoproducer heat plants have been estim-ated by the IEA Secretariat because of efficiency
92 - WORLD ENERGY BALANCES: DATABASE DOCUMENTATION (2017 edition)
INTERNATIONAL ENERGY AGENCY
issues for municipal waste prior to 2011 and in 2012 and for biogas in 2008, 2011 and 2012.
New plants were included in the Korean survey creating breaks in time series in 2011.
In 2007, some main activity heat plants and auto-producers in the commercial/public services sector were reclassified as main activity CHP plants, resulting in a break in the time series between 2006 and 2007 for biogases.
Electricity and heat
Supply
The own use of heat in heat plants is very irregular due to a lack of data.
Electricity generation reported under other sources is from fuel cells.
Production of electricity from tides began in 2013.
Data for heat from chemical processes that is sold is available from 2008.
Data for electricity production using heat from chemical processes in copper and zinc plants is available from 2005. The corresponding heat inputs were estimated until 2013 data. In 2014 the corresponding company switched to diesel oil for electricity generation.
Transformation
Prior to 2009, autoproducer heat production in-cludes amounts of unsold heat.
Data for electricity and heat production by auto-producers using natural gas and liquid fuels are available from 2000.
In 2000, the Korean administration started to re-port heat statistics for some heat plants which were not reported before.
Between 1993 and 1999, the breakdown of heat output by type of fuel was estimated by the IEA Secretariat.
Before 1994, electricity production from main activity producer CHP plants is included with main activity producer electricity only plants.
Consumption
Data for direct use of geothermal heat are avail-able from 2002. Geothermal direct use data are overstated as it refers to heat production by geo-thermal heat pumps, which include inputs of elec-tricity and/or gas in the transformation process.
Heat consumption by subsector was reclassified in 2010 due to new information available on heat sales from autoproducers to end-users by sector.
Prior to 2008, sales of electricity by Korea’s main electricity distributor, KEPCO, to the non-ferrous metals sector are included in iron and steel consumption.
Data on production and consumption of electricity and heat in oil refineries and LNG liquefaction/regasification plants are included in the industry sector. From 2007, oil refinery electricity and heat production and consumption started to be reported under the correct energy sector.
Data for heat consumption by sector are available from 2000.
Data for electricity consumption in the transport equipment sector are included in machinery from 1994 to 1999.
Latvia
Source
Central Statistical Bureau, Riga.
General notes
Data for Latvia are available starting in 1990. Prior to that, they are included in Former Soviet Union in the publication of World Energy Statistics.
Coal
Supply
The increase of distribution losses for peat in 2003 is due to a fire in one of the warehouses.
Consumption
The drop in the iron and steel industry in 2014 is due to the bankruptcy of the major company in the market.
Oil
Supply
Other hydrocarbons data represent shale oil.
Natural gas
Consumption
The fall in the iron and steel industry in 2014 can be explained by the bankruptcy of the major company
WORLD ENERGY BALANCES: DATABASE DOCUMENTATION (2017 edition) - 93
INTERNATIONAL ENERGY AGENCY
in the market, which resumed its activities in 2015 and declare insolvency again in 2016.
Biofuels and waste
Transformation
Due to a reclassification in 2004, there was break in time series of electricity production from autoproducer electricity plant fuelled by biogas between 2003 and 2004.
Electricity and heat
Transformation
From 2012 onwards, the increase in electricity production from solid biofuels is due to the deployment of six new main activity producer CHP plants running on wood chips.
Consumption
For 2012, the increase in electricity consumption in the iron and steel sector is due to switching from open earth furnace to electricity furnace of a factory.
Luxembourg
Source
STATEC, Institut national de la statistique et des études économiques du Grand-Duché du Luxembourg, Luxembourg.
Coal
General notes
For the 2011 edition, the Luxembourgian administration revised the time series from 2000 for most coal and coal products. Time series for BKB consumption were revised from 1990.
Prior to 1978, some sub-bituminous coal may be included in hard coal.
Steel production from blast furnaces ceased at the end of 1997.
Oil
Consumption
In the late 1970s, the reduction in consumption of fuel oil in the iron and steel industry was due to substitution by coal.
Natural gas
General notes
In 1982 there is a break in the time series in trans-formation and industry due to a change in methodology.
Transformation
In the 2017 edition a main CHP plant was re-classified as one main electricity plant and one main heat plant. Data were revised back to 2014.
Since 2002, the increase in the transformation sect-or is due to a new 350-MW combined cycle power plant.
Consumption
In 2015, Luxembourg integrated supplementary data from ETS companies and industrial con-sumption was revised back to the year 2000.
The breakdown of total final consumption for the latest year is preliminary and will be finalised in the 2018 edition of the book.
Since 2012, the methodology to determine final consumption was changed in order to integrate basic data from National Accounts.
Since 2000, a more detailed breakdown of final consumption data is available due to a change in methodology.
Since 2000, consumption in the non-ferrous metals sub-sector is included in iron and steel for reasons of confidentiality.
Since 2000 consumption in not elsewhere spe-cified (Industry) includes activity of companies re-classified to preserve the confidentiality.
Prior to 2000, residential consumption includes consumption in commercial/public services and agriculture/forestry.
Biofuels and waste
General notes
The Luxembourgian administration started in-cluding trade figure of wood chips in trade figure of solid biofuels from 2015 data. This creates breaks in time series between 2014 and 2015.
Data on solid biofuels are available from 1992.
Transformation
In 2011, the blending of biogases with natural gas started.
94 - WORLD ENERGY BALANCES: DATABASE DOCUMENTATION (2017 edition)
INTERNATIONAL ENERGY AGENCY
Electricity and heat
General notes
Data for solar thermal are available starting in 2001 and for solar PV starting in 2000.
A revision in the classification of power plants by type and the production and consumption data for both electricity and heat back to 2000 causes breaks in the time series.
Supply
Most of the hydro production shown for Luxembourg is from the Vianden pumped storage plant and is exported directly to Germany.
Starting in 2005, data for electricity transmission and distribution losses were obtained from the net-work operator. Prior to that, they were estimated by the Luxembourgian administration.
In the 2017 edition, following plant reclassific-ation, heat production by main activity plants were revised from 2011 onwards.
Transformation
The production of electricity from solid biofuels from 2013 corresponds to the opening of a new plant burning wood wastes.
Data on electricity production from biogases are available from 1998 and heat production from 2010.
In 2002, the increase in electricity production is due to a new natural gas combined cycle power plant.
At the end of 1997, the iron and steel industry stopped production of electricity.
Electricity data for natural gas autoproducer CHP plants are available starting in 1995, and for main activity CHP plants starting in 1996.
Prior to 1990, net electricity production by auto-producers includes production from combustible fuel sources only.
Consumption
In 2015, the observed declines in the heat used in the textiles and leather sector and the chemical and petrochemical sector lead to the closure of two industrial main CHP plants. The heating needs of these sectors were met through direct purchase of natural gas, due in part to attractive pricing during this period.
In 2015, following the procurement of new in-formation, data for heat distribution losses and heat consumption in industry and energy sectors were revised from 2000 onwards.
A change in the data source caused some breaks in the industry electricity consumption time series between 2010 and 2011.
The breakdown of electricity consumption in in-dustry is not available from 1990 to 1999.
Mexico
Source
Secretaría de Energía, Mexico City.
General notes
Data are available starting in 1971.
The Mexican administration submitted data di-rectly by questionnaire for the first time with 1992 data. As a result, some breaks in time series may occur between 1991 and 1992. For prior years, data are partly estimated based on the publication Balance Nacional - Energía.
In the 2016 edition, the Mexican administration completed a major work on revisions of the time series back to 1990. More revisions to historical data are pending.
Coal
General notes
The Mexican administration is currently under-taking major work on revisions of the time series back to 1990. For several products, only revisions back to 2003 have been provided. Some of these revisions could not be implemented in the 2016 edition. Further revisions to historical data are pending. Revisions for some products include reporting of new consumption flows, increased quantities of coal and higher calorific values, re-sulting in increases of total primary energy supply.
The time series for blast furnace gas and inputs of coke oven coke to blast furnaces start in 1991.
Hard coal data prior to 1978 may include sub-bituminous coal.
Consumption
Use of pulverised coal injection in blast furnaces occurs in Mexico, but is not currently reported.
WORLD ENERGY BALANCES: DATABASE DOCUMENTATION (2017 edition) - 95
INTERNATIONAL ENERGY AGENCY
Oxygen steel furnace gas production and produc-tion of other other recovered gases occur as by-products of heavy industry, but are not reported.
IEA estimations
Trade of coking coal and other bituminous coal were estimated by the IEA Secretariat based on partner data for 2016p. Consumption data were also estimated for these coal types.
For coking coal, amounts reported for con-sumption in main activity electricity generation and associated imports for the years 2003 to 2015 have been reallocated to other bituminous coal by the IEA Secretariat.
Blast furnace gas production and consumption have been estimated by the IEA for 1990 to 2015 based on inputs of coke oven coke to blast fur-naces in a ratio provided by Mexico, as are the proportions of blast furnace gas consumed in autoproducer electricity production, energy support for blast furnaces and consumption elsewhere in the iron and steel industry.
Coke oven coke production was estimated by the IEA for some years between 1999 and 2012 based off historical and commodities data, as were inputs of coking coal to coke ovens between 1990 and 2012.
The methodology currently used by Mexico to estimate production of coal tar and coke oven gas for recent years uses coke oven coke production as a guide. This was extended to the time series from 1990 to 2001, and to the years where coke oven coke production was estimated by the IEA.
Oil
General notes
In the 2016 edition, major revisions were carried by the Ministry of Energy on the time series back to 1990 based on updated information available from PEMEX, the Mexican Institute of Petroleum and the Federal Electricity Commission (CFE). Revisions include notably crude production, re-finery output, gas separation plant production, autoproducer generation and road consumption.
New data reported in additives from 1990 corr-esponds to methyl tertiary butyl ether.
From 1993 data, production from other sources (natural gas) of other hydrocarbons correspond to hydrogen used at the Minatitlan refinery, also represented as the output of non-specified trans-formation in the balances format.
The split between domestic and international avia-tion consumption of kerosene-type jet fuel is not available. By default, all kerosene-type jet fuel consumption is reported under international aviation.
Supply
In the 2017 edition, refinery output of gas/diesel oil was revised downwards from 2005 onwards. These revisions result in large increases to refinery losses from 2005 onwards.
NGL production reported in the IEA publications may be different from what is reported in the Mexican energy publications as the IEA includes in its oil data liquids produced in conjunction with natural gas.
In the 2016 edition, crude oil production was revised from 2000 to 2004 based on updated in-formation from PEMEX.
In the 2016 edition, main revisions were carried to NGL, LPG, naphtha, ethane supply. New data became available on input of NGL to refineries prior to 2011. Data on ethane production from gas separation plants (positive transfers from NGL) was revised upwards for 1990 to 1998. LPG gas separation plant production was revised down. Naphtha refinery output was revised upwards from 1990.
Transformation
In the 2016 edition, data for crude oil refinery input and refinery output of gas/diesel, naphtha, re-finery gas, bitumen, paraffin wax and other pro-ducts were revised back to 1990 (see general note).
Data for fuel oil and gas/diesel inputs to auto-producer CHP generation are available from 1999.
In 2003, a new facility was added to a refinery to produce petroleum coke.
Consumption
In the 2016 edition, naphtha non-energy use consumption in the chemical/industry was revised significantly revised down from 1990 to 2008 based on PEMEX information.
In the 2016 edition, gas/diesel and motor gasoline road consumption data were revised back to 1990 based on updated information from the Mexican Institute of Petroleum and PEMEX.
Consumption of lubricants, bitumen and par-affin waxes are available from 1990 and petrol-eum coke from 1993.
96 - WORLD ENERGY BALANCES: DATABASE DOCUMENTATION (2017 edition)
INTERNATIONAL ENERGY AGENCY
Prior to 1987, the split of LPG consumption be-tween residential and commercial/public services has been estimated by the IEA Secretariat.
Natural gas
General note
Natural gas reported in the IEA publications may be different from what is reported in the Mexican energy publications, as IEA includes only dry gas and excludes natural gas liquids, which are con-sidered as part of oil.
Transformation
The split of natural gas used for hydrogen manu-facture and used in refineries is not currently avail-able and it will be provided in the 2018 edition of this publication.
Consumption
Losses and pipeline transport have been included in oil and gas extraction.
From 1993 to 1999, part of energy industry own use and non-specified industry data were estimated.
Since 1993, the breakdown of the energy sector and of other sectors is available.
Biofuels and waste
Supply
Data for bagasse production are available from 2008.
Consumption
Data for solid biofuels used in autoproducer electricity plants from 1991 to 2005 have been estimated by the Mexican administration.
Data on biogases consumption are available from 1997.
Electricity and heat
General notes
The Mexican administration is currently under-taking revisions of the electricity time series back to 1996. Revisions include changes on inputs and outputs on power plants fuelled mainly by com-bustible fuels and the reclassification of main electricity plants previously reporting sub-bituminous coal as fuel to other bituminous coal for the period 2003-2015.
Supply
Production of main activity producer electricity plants from wind is available from 1994.
Electricity production from wind and solar photo-voltaic is available from 1990.
Transformation
New autoproducer electricity plants fuelled with coke oven gases were put on-line in 1999.
Electricity production from solid biofuels and biogases data are available respectively from 1991 and 1997.
Consumption
Some electricity consumption in energy industry is included in the industry sub-sector where it was generated (e.g. the chemical industry, as well as in non-specified industry).
Direct use of solar thermal heat is available from 1990.
Netherlands
Source
The Netherlands Central Bureau of Statistics, The Hague.
General notes
The Netherlands Central Bureau of Statistics has conducted reviews and revisions of their energy balance three times; in 2005, 2011 and 2015. The 2005 revisions were to improve basic energy statistics, particularly with respect to carbon and CO2 reporting, while the 2011 revisions were part of a harmonization program with international energy statistics. The 2015 revisions were the result of increased data collection, availability of new source information, and further alignment with international energy definitions. More details are available here: www.cbs.nl.
Coal
General notes
International trade into and through the hub ports of Amsterdam and Rotterdam is complicated by the capacity to purchase coal directly at these points. The majority of coal passing through these ports is intended for consumption in European
WORLD ENERGY BALANCES: DATABASE DOCUMENTATION (2017 edition) - 97
INTERNATIONAL ENERGY AGENCY
countries other than the Netherlands, which is neither the country of origin or destination, there-fore these data have been removed where possible.
Following revisions made in the previous edition to data for 1995 onwards, this edition includes further revisions made by the Dutch administration for the period 1990 to 1994. These revisions are the result of increased data collection, availability of new source information, and further alignment with international energy standards.
Supply
From 2013 onwards, trade reported by the Central Bureau of Statistics includes coal in transit, to align more closely with gross trade data.
In the 2013 edition, non-specified exports for 2011 were estimated by the Central Bureau of Statistics due to a lack of information from key market players.
For data prior to 2011, stock changes for primary coal types were estimated by the Dutch admin-istration based on trade and consumption data.
For 1984 to 1986, production from other sources of other bituminous coal represents a stock of “smalls” washed for re-use.
Consumption
Prior to 1989, non-energy use is included with industry consumption.
Oil
General notes
Data for gas/diesel road consumption become more difficult to collect in 2013, as the distinction in taxation between road diesel and gasoil was abolished.
Following revisions made in the previous edition to data for 1995 onwards, this edition includes further revisions made by the Dutch administration for the period 1990 to 1994. These revisions are the result of increased data collection, availability of new source information, and further alignment with international energy definitions
Motor gasoline includes other light oils until 1990.
Some breaks in time series occur in 1990 when the Dutch administration started to report the petro-chemical industry according to IEA methodology.
From 1990 onwards, naphtha includes aromatics, naphtha and other light oils.
Consumption
Refinery gas includes chemical gas and is included in chemical industry consumption.
Natural gas
General notes
The Netherlands Central Bureau of Statistics con-ducted revisions of natural gas data in the 2017 edition for years 1990-1994. These revisions were the result of increased data collection, availability of new source information, and further alignment with international energy definitions.
Between 1981 and 1982, and between 1983 and 1984 there are breaks in time series due to the introduction of more comprehensive surveys on end-use consumption.
Supply
Natural gas production in 2015 decreased due to a production cap set by the government.
Dutch trade figures include transit volumes.
In the past, the amounts reported under production also included quantities coming from stock changes. The reason was that the Dutch admin-istration could not distinguish between quantities of natural gas falling under marketable pro-duction and amounts being moved from offshore fields to onshore fields without undergoing any purification and/or other necessary production pro-cesses. From 2015, the data reported distinguish between amounts to be reported as production and amounts that should be classified as stock changes.
Transformation
The 2009 increase in input to main activity elec-tricity consumption is due to the opening of a new plant in the second half of 2008.
The 2008 increase in input to autoproducer CHP plant is due to a new autoproducer CHP plant which came on-stream.
Biofuels and waste
Supply
From 2009 to 2012, and again from 2014 the pro-duction and trade of pure biogasoline were con-fidential; net imports were estimated by the Dutch administration based on consumption.
98 - WORLD ENERGY BALANCES: DATABASE DOCUMENTATION (2017 edition)
INTERNATIONAL ENERGY AGENCY
Transformation
Trade data for municipal waste are available from 2011.
Consumption
From 2014, a better allocation of heat own use was available for biogas digester prewarming, and in municipal waste burning plants for flue gas cleaning.
The final consumption of solid biofuels in the residential and agriculture sector increased in 2014 due to the results of new surveys and parameters.
Electricity and heat
General notes
In the 2017 edition, following an extended review of old national publications, data for the Netherlands were revised for the years 1990-1994 to follow on the revisions entered in the previous edition, covering period 1995-2013. This revision endeavours to maintain data comparability throughout the entire time series. As part of these revisions, most of the time series for the con-sumption sectors in both electricity and heat were revised using newly obtained data from grid operators’ client files by the Dutch administration.
Supply
The decrease of electricity produced from nuclear in 2013 data is due to a maintenance period of two and a half months of one nuclear power plant in this year.
Heat used for electricity production represents waste heat bought from other industries that was generated from combustible fuels.
Electricity from other sources represents gen-eration from expansion gases and chemical waste gases (the latter up to 2007).
The large increase in electricity trade in 1999 is due to the liberalisation of the Dutch electricity market. Until 2003, trade data are based on con-tracted quantities instead of physical flows.
The decrease of electricity produced from nuclear in 1997 is due to the closure for five months of one nuclear power plant.
The increase of heat produced in main heat plants in 1995 is due to a change in ownership of one large installation, resulting in its reclassification from being an autoproducer to a main activity plant.
Electricity production from solar photovoltaic is available from 1990.
Transformation
Heat in non-specified transformation represents waste heat bought from other industries that was generated from combustible fuels. The corres-ponding electricity output is included with that of natural gas.
Autoproducer heat plants using refinery gases are included with autoproducer CHP plants because data are considered confidential.
Heat production in commercial and public services includes production in agriculture.
All municipal waste autoproducer electricity and heat only plants have been reclassified by Statistics Netherlands as autoproducer CHP from 2012, causing breaks in the time series.
Prior to 2008, a few small autoproducer electricity plants using solid biofuels were included with main activity plants for reasons of confidentiality.
In 2006, some municipal waste plants changed ownership and were reclassified from electricity only to CHP plants as they started heat projects.
A new main activity producer CHP plant fuelled by refinery gas started up in 1999 and there was a fuel reclassification in 2000.
For natural gas, all electricity production prior to 1998 and all heat production prior to 1995 is included in CHP plants.
For biofuels and waste, all electricity and heat produced prior to 1995 is included in CHP plants.
Data for net electricity production by auto-producers in the energy industry are not available prior to 1993.
Data for heat produced from biofuels and waste are available from 1990.
Prior to 1990, all electricity and heat produced from coal is included in CHP plants.
Inputs of hard coal for electricity production from 1981 to 1989 in terajoules (TJ) are estimated by the Secretariat based on data submitted in kilotonnes (kt) by the Dutch administration.
Net electricity production by autoproducers prior to 1988 includes production from combustible fuel sources only.
Data for heat production by fuel in heat plants prior to 1987 are estimated by the Secretariat based on fuel inputs submitted by the Dutch administration.
WORLD ENERGY BALANCES: DATABASE DOCUMENTATION (2017 edition) - 99
INTERNATIONAL ENERGY AGENCY
Data for heat production from main activity producer CHP plants and heat plants are available from 1982.
Prior to 1982, electricity production from and inputs to main activity producer CHP plants are included with main activity producer electricity plants.
For 1970 to 1973, electricity output from auto-producer CHP plants has been included with main activity producer CHP plants.
Consumption
Increasing electricity consumption in agriculture/forestry is due to expansion of greenhouse farming.
Direct use of geothermal heat in agriculture/forestry starting in 2008 is due to a new project ex-tracting deep geothermal heat.
A new reporting methodology starting in 2005 causes breaks in the heat consumption time series.
Prior to 1979, electricity consumption in agri-culture is included in commercial and public services.
New Zealand
Source
Ministry of Business, Innovation and Employment, Wellington.
General notes
Prior to 1994, data refer to fiscal year (April 1993 to March 1994 for 1993). From 1994, data refer to calendar year.
Coal
General notes
Peat, although produced in New Zealand, is not used as a fuel, and is used for agricultural purposes only.
In the 2014 edition, the definition of hard coal was aligned with the International Recommend-ations for Energy Statistics. Prior to this, hard coal for New Zealand from 1960 to 1977 had con-tained sub-bituminous coal. The portion of sub-bituminous coal production and residential con-sumption has been estimated by the IEA Secre-tariat for this period and moved to brown coal.
In the 2011 edition, the New Zealand administration has revised some of the coal, natural gas, oil, renewable and electricity time series back to 1990.
Supply
Breakdown of exports of coking coal by country of destination for 2016p has been estimated by the IEA Secretariat, based on partner data.
The decrease of other bituminous coal production in 2015 is due to a temporary shutdown in one of the coal mines at the beginning of 2015 and another one at the end of 2015.
A detailed breakdown of exports of coking coal by country of destination between 2001 and 2011 is estimated by the IEA, based on secondary sources and partner data.
Transformation
Sub-bituminous coal inputs into coke ovens refers to coal that is merged with iron sands and limestone to form the inputs for the multi-hearth-furnaces, kilns and melters that produce direct reduced iron (Glenbrook Steel Site), with off-gases and supplemental and natural gas driving CHP plants. This method, while not the typical iron and steel process, produces similar by-products. The sub-bituminous coal inputs are reported under coke oven coke transformation and the resulting off-gases are reported as production of coke oven gas and blast furnace gas.
Blast furnace gas production and distribution losses prior to 1998 are IEA Secretariat estimates. Portions of this gas will have been used for energy purposes in the multi-hearth furnaces or elsewhere in the plant. Some transformation efficiencies will appear higher than normal due to non-reporting of certain inputs, including some confidential data.
Consumption
In final consumption, some industry data are re-ported in non-specified industry for confidentiality reasons.
In 2014, the increase in consumption of sub-bituminous coal in mines included the com-bustion of some unsold coal fines for safety reasons.
Prior to 2010, the construction sector is included with commercial/public services.
Prior to 2009, mining and quarrying is included in agriculture.
100 - WORLD ENERGY BALANCES: DATABASE DOCUMENTATION (2017 edition)
INTERNATIONAL ENERGY AGENCY
Oil
General notes
In 2015, the following data were estimated by the IEA Secretariat: stock changes and consumption of lubricants; consumption of bitumen, and all figures for petroleum coke and other oil products.
From 1998, gas/diesel oil includes light fuel oil. Until 1997, light fuel oil is under fuel oil.
Until 1997, other hydrocarbons from natural gas sources correspond to synthetic gasoline pro-duction (ceased in February 1997).
For reasons of confidentiality, beginning in 1994, the New Zealand administration no longer reports data on the production of methanol.
Supply
Between 2013 and 2014, the jump in imports of kerosene-type jet fuel can be explained by an anticipated strike at the refineries.
Consumption
Between 2009 and 2010, a break in time series appears for demand of gas/diesel as the admin-istration changed its methodology for commercial/public services
For 1960 to 1973, Consumption data have been estimated by the Secretariat.
Natural gas
Transformation
The large 1998 increase in input to autoproducer CHP plants is due to two new autoproducer CHP plants.
In February 1997, production of synthetic gasoline from natural gas ended.
Consumption
In 2014, non-energy consumption in the Chemical sector ran at full production for the first time in several years (mainly methanol production). This increase approximately matches the increase in natural gas production.
Between 2012 and 2013 there are breaks in time series for the final consumption breakdown due to the introduction of a new survey.
In 2005, the decline in chemical industry con-sumption was due to the closure of the Motunui
methanol production plant, which was then re-opened in late 2008.
Prior to 2003, gas consumed in industry includes some gas for energy industry own-use. Since 1990, detailed consumption breakdown for industry is available. From 1977 to 1979 and from 1986 to 1989, losses are included in statistical differences.
Electricity and heat
General notes
There are several breaks in the time series between 1987 and 1988 due to a reorganisation of govern-ment departments during 1987.
Supply
Heat outputs from main activity and autoproducer CHP plants are not available.
Transformation
Electricity and heat production from other sources represents waste heat recovered and used for electricity production.
For 2002 and 2003, natural gas autoproducer electricity includes generation of electricity from on-site heat/steam recovery during the combustion of carbon monoxide (CO) gas from the iron making reduction and melting process.
In 1999, a reclassification of autoproducer plants causes some breaks in the time series.
Data for geothermal electricity production by autoproducers are available from 1990.
The New Zealand administration has updated efficiencies for electricity production from geo-thermal heat from 10% to 15% from 1990 on-wards; this causes a break in the time series between 1989 and 1990.
Data for heat from chemical processes used for electricity production are available from 1990 and corresponds to acid plants in the fertiliser industry where sulphur is the main input.
Electricity production by autoproducers from natural gas and from oil has been estimated by the Secretariat from 1970 to 1973.
Consumption
A new survey starting from the 2013 data can cause breaks in data for final consumption of electricity.
WORLD ENERGY BALANCES: DATABASE DOCUMENTATION (2017 edition) - 101
INTERNATIONAL ENERGY AGENCY
Data on direct use of geothermal heat are avail-able from 1990 and direct use of solar thermal heat from 2002.
From 1974 to 1993 distribution losses include the statistical differences.
The classifications used by the administration of New Zealand were changed in 1991.
Electricity consumption in paper, pulp and printing is included in wood and wood products prior to 1990.
Norway
Source
Statistics Norway, Oslo.
Coal
General notes
Other bituminous coal includes lignite.
Production of coking coal, coke oven coke and coke oven gas ceased in the late 1980s.
Supply
The decrease of other bituminous coal production in 2015 is due to a temporary shutdown in one of the coal mines.
The decrease of other bituminous coal production in 2005 is due to a fire in one of the coal mines; this entailed a break in the production for a large part of the year.
Oil
General notes
A major project is being carried by Statistics Norway in order to reduce the statistical diff-erences observed between calculated supply and demand of oil in Norway. Starting with 2014 data, new methodologies have been introduced for reporting crude oil, NGL and naphtha (see de-tails below). Balances for motor gasoline, gas/diesel oil, kerosene-type jet fuel and fuel oil are also under investigation. Further improvements are expected in future editions.
The IEA Secretariat estimates the net calorific value for Norwegian crude oil based on the oil product outputs of the oil refineries.
Prior to 1990, ethane is included with LPG.
Supply
Crude oil production includes condensates.
Starting with 2014 data, Statistics Norway has changed the source for annual crude oil exports to include shipping information collected by the National Petroleum Directorate. Due to data un-availability, monthly export data remain based ex-clusively on Customs Statistics are significantly lower for 2014.
Starting from 2014 data, there is a break in naph-tha supply time series due to a change in reporting methodology adopted by Statistics Norway.
Prior to 2002 data, part of LPG exports was reported as NGL exports.
Since 1986, imports of refinery feedstocks are re-ported under the relevant oil product imports.
Transformation
In 2014, the strong decrease in crude oil refinery intake is linked to heavy maintenance work carried in the refineries in fall 2014.
Starting with 1990 data, gas/diesel oil used for autoproduced electricity on oil and gas platforms are reported under energy industry own use.
From 1970 to 1975, gas/diesel oil for electricity generation has been estimated by the Secretariat.
Consumption
Data on naphtha consumption in Norway are currently unavailable.
Consumption of lubricants is reported within ind-ustry, as no further breakdown is available.
In 2005 data, breaks in petroleum coke consumption time series appear due to reallocation in the industry sector. Refinery fuel is reported from 2001 data.
In 2003 and 1993 data, breaks in time series appear for consumption in the chemical/petrochemical industry due to newly available information.
Prior to 2000, gas/diesel oil used in fishing is in-cluded in agriculture/forestry.
Natural gas
General notes
For Norway, the supply of natural gas is the residual of two very large and opposite amounts: production and exports. As a result, large statistical differences in some years may lead to discrepancies in the growth rates of supply and demand of natural gas.
102 - WORLD ENERGY BALANCES: DATABASE DOCUMENTATION (2017 edition)
INTERNATIONAL ENERGY AGENCY
Supply
Since 2008 data on stocks are available.
Transformation
Since 2007, gas inputs to all electricity and CHP plants are included in autoproducer electricity plants for confidentiality reasons.
Consumption
In the 2017 edition, consumption figures for the industry sector and other sectors were revised back to 2010.
Prior to 2008, natural gas amounts used in gas extraction by offshore platforms were not included in production data.
Since 2002 domestic navigation is included under non-specified transport.
The 2007 increase in non-specified transport is due to the wider use of gas-powered sea vessels.
Before 2000, energy use in oil and gas extraction also included some final consumption amounts.
In 1992 the increase in oil and gas extraction is due to the start-up of new fields.
Consumption for pipeline transport is included in energy industry own use.
Biofuels and waste
General notes
Prior to 2007, equal shares of renewable and non-renewable municipal waste were estimated because the actual split was not known.
Data for industrial waste and biogases are available from 1991.
Supply
In 2014, the biodiesel production facility closed.
Data for liquid biofuels imports are available starting in 2006.
Consumption
Distribution losses for biogases are included in commercial/public services prior to 2003.
Electricity and heat
Supply
No data on electricity production from solar energy are submitted separately to the IEA by the Norwegian administration. They were estimated
until 2008 based on IEA PVPS implementing agreement.
The electricity generated from other sources represents electricity from waste heat.
Distribution losses includes statistical differences.
Heat produced by autoproducer heat plants from chemical processes and from other sources and used for electricity production has been estimated by the IEA Secretariat for the period 1990 to 2006.
Electricity production from wind is available from 1993.
Data for heat production from heat pumps and electric boilers (including the electricity used for this production) are available from 1989.
Data for heat production are not available prior to 1983.
Transformation
In the 2016 edition, Norway corrected the industrial waste consumption in heat plants, and reclassified some the corresponding heat output under other sources.
In 2014, the large increase in heat produced by autoproducer heat plants from chemical processes is due to the opening of a new plant.
Starting in 2007, data for natural gas electricity and CHP plants are aggregated in autoproducer electricity plants for confidentiality reasons.
Breaks in the time series between 1996 and 1997 and between 2001 and 2002 are due to a re-classification of main activity producers and autoproducers.
Data for heat production from biogases are available from 1995.
Prior to 1991, net electricity production by auto-producers by industry sub-sector was estimated by the Secretariat based on data submitted by the Norwegian administration.
Data on inputs and outputs in heat plants are not available prior to 1983 for main activity heat plants and prior to 1988 for autoproducer heat plants.
Consumption
Consumption of electricity for pipeline transport is included in oil and gas extraction.
The breakdown of heat consumption by industry sub-sector was expanded in 1992, reclassified in 1994 and collected by a new reporting system in 1997.
WORLD ENERGY BALANCES: DATABASE DOCUMENTATION (2017 edition) - 103
INTERNATIONAL ENERGY AGENCY
Poland
Source
Central Statistical Office, Warsaw.
Coal
General notes
Other recovered gases which appear in the balances as output from blast furnaces include off-gases from zinc and copper smelting, ceramics kilns and steel production.
Transformation
In the past two editions, the Central Statistical Office has revised their methodology which accounts for sold heat produced from autoproducer heat plants using coking coal and other bit-uminous coal, resulting in lower, but more accurate data for 2007 onwards.
Consumption
Consumption in agriculture/forestry for BKB, and own use in power stations for lignite are residual flows, so may contain statistical differences and other consumption not reported elsewhere. As a consequence, changes in these time series may not be wholly representative of the activities shown.
Prior to 2010, own use in coal mines included workers’ take home allowance, which should be included in residential consumption.
Oil
General notes
From 1997, production from other sources (natural gas) of other hydrocarbons corresponds to hydrogen used in refineries, also represented as the output of non-specified transformation in the balances format.
Consumption
In 2015, a new flue-gas desulphurisation unit was installed. As this unit facilitates high sulphur fuel oil burning in place of natural gas, this explains the increase in fuel oil consumption in oil refineries.
Natural gas
Supply
Exports include all the gas sold by companies operating in Poland (these are mainly re-exports).
Transformation
Non-specified transformation data represent natural gas used for hydrogen manufacture. This hydrogen is used for hydrodesulphurization in oil refineries.
In 2013 and 2014 some CHP plants were used as backup reserve plants, resulting in a decrease in con-sumption under main activity producers CHP plants.
In 2004 and 2005 small amounts of gas were used to start up main activity electricity plants.
Consumption
Natural gas reported in associated production contains some heavier hydrocarbons. This results in a high gross calorific value for production.
Distribution losses may include some statistical differences. Non-specified energy includes gas used for heating and pumping operations in the distribution network.
Biofuels and waste
General notes
Several breaks in the industrial waste time series are caused by difficulties in the classification of wastes.
Data on biodiesels are available from 2005; bio-gasoline data from 2003; and other liquid bio-fuels data from 2009.
In 2008, a new questionnaire was launched which increased the coverage of renewable and waste data.
Supply
Under current Polish law, only producers and importers of biodiesel are obliged to fulfil the National Indicative Target of share of biofuels in the total usage of transportation fuels. Since the regulation is currently not applied to retail dis-tributors they, for economic reason, rather export the biodiesel than sell it domestically. This results in low domestic consumption and increase of ex-ports in 2016.
Production of other liquid biofuels increased in 2015 because new companies started to report their biofuels production to the Polish administration.
Transformation
Before 2000, industrial waste was used inter-changeably with light fuel oil in some plants, which might result in breaks in the time series.
104 - WORLD ENERGY BALANCES: DATABASE DOCUMENTATION (2017 edition)
INTERNATIONAL ENERGY AGENCY
Consumption
Data for biogases refer only to the gas from fermentation of biomass.
Until 1998, data for industrial waste include other recovered gases which have to be reported in Coal questionnaire, causing a break between 1997 and 1998.
Between 1992 and 1993, due to data availability, there is a large increase in solid biofuels for res-idential, commercial/public services and agriculture/forestry.
Electricity and heat
General notes
Prior to 2010, heat supply and consumption can in-clude autoproducers unsold heat. Previous attempts to address such issue may have caused breaks for heat production and fuel in autoproducer heat plants (1993) and in autoproducer CHP plants, and for heat consumption in industry sub-sectors.
Supply
Electricity and heat from chemical heat and other sources are available from 2011. Prior to that, these amounts could be included under different categories.
Heat distribution losses are available from 2010 and prior to that they are included in consumption.
Heat production from heat pumps is available from 2009.
Transformation
In the 2017 edition, the Polish administration re-vised electricity production data from power plants run by combustible fuels, reclassifying those that were previously reported as main activity CHP as main activity electricity plants. These revisions mainly affected coal-fired power plants and created breaks in time series from 2004 onwards.
State support for biomass co-firing was reduced in 2016, resulting in electricity production from solid biofuels falling during this period (2016p).
Due to a reclassification of plant types, there is a break in time series in 2015 for the generation of heat in autoproducer CHP plants in the iron and steel sector.
In 2008 and 2014, a number of CHP plants were reclassified from autoproducer to main activity producer due to an industry re-organisation.
Data for electricity production in autoproducer electricity plants are available from 1986.
Consumption
Heat consumption in energy industry own use includes process heat not sold before 1995.
Data for direct use of geothermal heat are available from 2000 and direct use of solar thermal heat in commercial/public services from 2002 and in residential from 2009.
In the 2017 edition, the Polish administration re-classified some amounts of electricity con-sumption from the chemical and petrochemical sector to oil refineries, following access to im-
proved survey methods.
Portugal
Source
Direcção-Geral de Energia e Geologia, Lisbon.
Coal
General notes
Hard coal data prior to 1978 may include sub-bituminous coal.
Consumption
Between 1997 and 2001 gas works gas was grad-ually replaced by natural gas in the commercial/public service and residential sectors.
The production of pig iron ceased in the first quarter of 2001, leading to decreases in supply and consumption of coking coal, coke oven coke, coke oven gas and blast furnace gas in 2001.
Oil
General notes
The increase in refinery throughput in 2015 is a result of increased refinery capacity linked to the expansion of the Sines refinery.
A new hydrocracking unit started operations in Sines Refinery in April 2013. This explains the 2013 increase in refinery feedstock imports, as well as middle distillate production.
Supply
Production from other sources (natural gas) of other hydrocarbons correspond to hydrogen used in refineries, also represented as the output of non-specified transformation in the balances format.
WORLD ENERGY BALANCES: DATABASE DOCUMENTATION (2017 edition) - 105
INTERNATIONAL ENERGY AGENCY
Consumption
Consumption of gas/diesel oil in industry and commercial/public services represents diesel use in mobile fleets.
Natural gas
Supply
In February 1997, Portugal started to import nat-ural gas.
Transformation
Since 2012, data reported for non-specified trans-formation represent natural gas used for hydrogen manufacture. Prior to this year, these quantities are reported under oil refineries.
The 2002 decrease in natural gas used for gas works is due to the closing of the Lisbon gas works plant in May 2001.
Biofuels and waste
General notes
Data for solid biofuels were revised by the National administration from 1990 to 2001, which may result in breaks in time series between 1989 and 1990.
Data are available from 1994 for biogases, from 1999 for municipal waste and from 2003 for industrial waste.
Consumption
Data for solid biofuels were further revised based on a new survey on industry, resulting in breaks in sub-sectoral consumption for 2012.
Between 2009 and 2010 a new survey on energy consumption in households creates a break in time series in the solid biofuels consumption in residential time series.
Electricity and heat
Supply
Data for production of electricity from solar photovoltaic and wind are available from 1989.
Transformation
Electricity production from other oil products refers to methanol.
In the 2017 edition, the data for production of electricity by autoproducer hydro plants were re-vised between 1990 and 1999, according to a new national methodology.
In 2007, some power plants that were previously reported as main activity CHP have been reclassified as autoproducer CHP.
In 2007, the power station that burns industrial waste started to work as a CHP plant, whereas pre-viously it was only producing electricity.
New plants fuelled by solid biofuels and by municipal waste started in 1999.
Prior to 1992, data for net electricity production by autoproducers include production from com-bustible fuel sources only.
Data for production of electricity in main activity producer CHP plants and the associated fuel inputs are not available prior to 1980.
Consumption
In the 2017 edition, the Portuguese administration reclassified some amounts of heat consumption from the residential to the commercial and public services sector for the period 1998 to 2014 follow-ing a new national methodology.
Data for direct use of solar thermal heat is avail-able from 1989 and direct use of geothermal heat from 1994.
Slovak Republic
Source
Statistical Office of the Slovak Republic, Bratislava.
General notes
Data are available starting in 1971.
The Slovak Republic became a separate state in 1993 and harmonised its statistics to EU standards in 2000. These two facts lead to several breaks in time series between 1992 and 1993, and between 2000 and 2001.
Coal
General notes
Data for anthracite, patent fuel and coal tar all begin in 2005. Prior to this, anthracite was in-cluded with other hard coals, and patent fuel and coal tar data were not reported.
106 - WORLD ENERGY BALANCES: DATABASE DOCUMENTATION (2017 edition)
INTERNATIONAL ENERGY AGENCY
Since 2005, data for coal tar and patent fuel are based solely on trade receipts. Production of coal tar which is consumed within the national boundary is not reported. Consumption of patent fuel adopts the residual methodology for statistical differences described above.
Breaks in time series may exist between 2000 and 2001 as the result of the implementation of a new survey system.
Commercial/public services also includes statistical differences for other bituminous coal, lignite, patent fuel and coke oven coke from 1980 onwards and BKB from 1989 onwards.
Oil
General notes
From 2001 onwards, kerosene type jet fuel includes small amounts of other kerosene.
Transformation
Between 2008 and 2009, one of the companies changed its status from autoproducer CHP plant to main activity producer CHP plant, resulting in a decrease in fuel oil consumption for autoproducer CHP.
Consumption
For gas/diesel oil, road data include rail use.
Small quantities of kerosene-type jet fuel used for domestic aviation are included in international aviation bunkers data.
Data for energy use of white spirit are not available.
Natural gas
General notes
Data for losses were not available between 2009 and 2013.
Between 1970 and 1971 and between 1978 and 1979, there are breaks in time series due to a revision of data for 1968-1969 and 1979-92 made in 2003. Data for 1970 were estimated by the Secretariat.
Supply
In 2002 the gross calorific value (GCV) of production increased significantly as extraction from a field with a low GCV ended.
Imports include gas used for pipeline compressor stations.
Transformation
In 2014, the decrease in autoproducer CHP plants consumption was due to a plant closure.
Amounts in non-specified transformation mainly represent natural gas used for hydrogen manu-facture. This hydrogen is used for hydrodesulphur-ization and for hydrocracking in oil refineries.
Consumption
In 2001, there is a break in time series for energy use in oil and gas extraction due to the application of the IEA’s definition starting that year.
There are inconsistencies in the time series of commerce/public services as this sub-sector was computed as a residual.
Biofuels and waste
General notes
Prior to 2001, the data reported as industrial waste include biogases and municipal waste.
Electricity and heat
General note
Data for solar photovoltaic are available from 2010.
Transformation
Electricity and heat production from combustible fuels from 1990 to 2003 have been estimated based on the data on fuel used for electricity and heat plants reported in the annual fuel questionnaires.
Prior to 2001, electricity generation from primary solid biofuels, municipal waste and biogases are included with industrial waste.
Consumption
The low electricity consumption in oil refineries in 2003 and 2004 is due to a change in ownership and work carried out on a refinery.
Data for direct use of geothermal heat are avail-able from 2001 and direct use of solar thermal heat from 2005.
WORLD ENERGY BALANCES: DATABASE DOCUMENTATION (2017 edition) - 107
INTERNATIONAL ENERGY AGENCY
Slovenia
Source
Statistical Office of the Republic of Slovenia, Ljubljana.
General notes
A new energy data collection system was imp-lemented in January 2001, causing some breaks in time series between 1999 and 2000.
Data for Slovenia are available starting in 1990. Prior to that, they are included in Former Yugoslavia.
Coal
Transformation
In 2015, one of the main activity electricity plants burning lignite ceased its operations.
Oil
Supply
Between 2013 and 2014, a break in imports and exports time series for kerosene-type jet fuel and fuel oil appears due to improvements in reporting methodology. New trade corresponds to imports that are first stocked on Slovenian territory and later re-exported.
Consumption
Time series for motor gasoline and gas/diesel consumption in road fluctuate as they are com-puted by the Slovenian administration as residual between the supply and the total consumption of all other categories.
Natural gas
Transformation
In 2014, improvements in a CHP plant resulted in a substantial reduction of natural gas consumption in this sector.
Consumption
In 2011 the decrease in the chemical sector con-sumption is due to minimal use of gas for production of methanol.
There are inconsistencies in the time series for commercial/public services as this sub-sector is com-puted by the Slovenian administration as a residual.
Biofuels and waste
Consumption
The break in time series between 2008 and 2009 for solid biofuels is due to revisions based on a new household survey which is to be carried out on an annual basis.
Breaks in total final consumption for industrial waste prior to 2008 are a result of a sectoral reclassification.
Electricity and heat
Consumption
Direct use of solar thermal and geothermal heat is available from 2009.
Surveys for data on heat consumption are available from 2003 onwards for the residential, industry and energy sectors. Prior to 2003, the data have been estimated by the Slovenian administration.
Spain
Source
Ministerio de Energía, Turismo y Agenda Digital, Madrid.
General notes
Spain is currently working on improving its data collection system. Therefore breaks in time series are present in the data and historical revisions are expected in the 2018 edition.
Coal
General notes
The calorific values for sub-bituminous coal are correct on an as received basis, and comply with definitions of sub-bituminous coal on a moist, but ash free basis.
Supply
Lignite mining ceased in 2008.
Transformation
Data associated with the coke oven coke trans-formation process are under review by Spain and revised data are pending.
108 - WORLD ENERGY BALANCES: DATABASE DOCUMENTATION (2017 edition)
INTERNATIONAL ENERGY AGENCY
Oil
General notes
A change in the reporting system occurred mid-1996 resulting in some breaks in time series.
Supply
The rise in crude production in 2013 is linked with the development of the Montanazo-Lubina deep off shore field.
Consumption
A more detailed breakdown in some consumption time series appears between 2012 and 2013 due to an update and improvement in the reporting methodology.
Natural gas
Transformation
Due to the implementation of an updated tool for gathering information on electricity generation plants in 2013 many autoproducer electricity plants were reclassified as autoproducer CHP plants.
In 1997, the increase in input to main activity pro-ducer electricity is due to two main activity pro-ducer electricity producers running on natural gas.
Between 1993 and 1994 there is a break in time series in autoproducer CHP plants consumption, since a new survey revealed a large number of CHP autoproducers that were previously included in industry consumption.
Since 1990 the decrease of natural gas inputs into gas works gas production is due to the substitution of natural gas by manufactured gas.
Consumption
Since 2001, the final consumption breakdown is estimated by the Spanish administration.
Between 2005 and 2006 there are some breaks in time series for the energy industry own use and for final consumption due to a change in the estim-ation methodology.
Since 1988 the increase of natural gas used as feedstock is due to a substitution of naphtha for the production of fertilisers.
Prior to 1982 natural gas consumption in textiles and leather, transportation equipment and machinery has been included in non-specified industry.
Biofuels and waste
General notes
The Spanish administration verifies that pro-duction and consumption of industrial waste do exist but data are not available after 2001.
Transformation
From 2013 data, a revision of the industry sector of some companies causes breaks in time series for solid biofuels, municipal waste and biogases.
Consumption
Prior to 2006, inputs of biogases used to generate process heat were erroneously included as inputs to transformation when they should have been reported in the appropriate industry in final consumption.
The breakdown of solid biofuels direct use in the industry sector prior to 1999 is not available.
Electricity and heat
Supply
Electricity reported under other sources is from waste heat.
Transmission and distribution losses are estimated by the Spanish administration.
Data for electricity from solar thermal plants are available from 2007.
Starting in 2006, a new method was used to estim-ate the losses from final consumption, resulting in a break in time series between 2005 and 2006.
From 2005, residential rooftop solar photovoltaic electricity production data, previously reported under autoproducer, are included in main activity electricity plants according to the Spanish administration classification.
Electricity production from wind and solar are reported from 1989 when data became available.
Transformation
In the 2017 edition, a change in reporting meth-odology resulting in reclassification of plants from autoproducer electricity to autoproducer CHP has led to breaks in electricity production in auto-electricity plants between 2012 and 2013 and 2014 and 2015. The administration anticipates further revisions to the time series in subsequent cycles.
WORLD ENERGY BALANCES: DATABASE DOCUMENTATION (2017 edition) - 109
INTERNATIONAL ENERGY AGENCY
In 2008, a reclassification of plants from main activity to autoproducer has led to breaks in elec-tricity production between 2008 and 2009.
The National Energy Commission reclassified plants that consume biogases, leading to breaks in time series between 2007 and 2008.
In 2000 and 2006, many plants were reclassified from main activity producer to autoproducer or vice versa.
For 2004 and 2005, electricity production from gas/diesel oil is included with fuel oil.
The large increase in electricity output from main activity producer electricity plants fuelled by natural gas in 1997 is due to the opening of a new plant.
Prior to 1989 inputs and outputs from the use of biofuels and waste to generate electricity and/or heat (i.e. comprising solid and liquid biofuels, industrial waste, municipal waste and biogases) are reported under non-specified biofuels and waste.
Prior to 1987 electricity production in main activity producer CHP plants is included with pro-duction from main activity producer electricity plants.
From 1983, net electricity production by auto-producers has been estimated by the Spanish administration, and includes production from com-bustible fuel sources only and net electricity pro-duction by autoproducer CHP plants is included in electricity plants.
Consumption
For 2012, the electricity consumption data are estimated by the Spanish administration.
Data for direct use of solar thermal heat are available from 1994.
Data for direct use of geothermal heat are avail-able from 1990.
Electricity consumption under the non-specified industry category includes the consumption for the manufacture of rubber and plastic products, furniture, repair and installation of machinery and equipment (except repair and maintenance of ships and boats) and other manufacturing. This aligns with the Classification of the Economic Activities in the European Community (NACE) group code 22 and 31 to 33 (excluding class 33.15).
Sweden
Sources
Statistics Sweden, Örebro.
Swedish Energy Agency (Energimyndigheten), Eskilstuna.
Coal
General notes
Peat products data may be reported under the category of peat, particularly for imports.
Autoproducer inputs to waste heat production that are sold are reported in the respective final con-sumption sectors and not in transformation.
Some mixture of LNG with air to form a lower calorie product is reported as gas works gas production replacing traditional gas works gas manufacture.
Supply
Other bituminous coal production until 1992 is coal recovered during the quarrying of clay.
Oil
General notes
Swedish stock data include peacetime crisis stocks. Since these stocks may be held in crude oil instead of oil products, there may be occurrences of negative stock levels for products.
Data are available from 2003 for refinery gas and from 2000 for additives and ethane.
Beginning in 2002, Sweden has changed some of the conversion factors for some products. That explains the small breaks in time series between 2001 and 2002.
Transformation
In 2014, gas/diesel oil inputs to main activity CHP electricity plants are confidential and aggregated with fuel oil.
In 2013 data, the drop in crude oil refinery intake is related with maintenance in August and September 2013 at the Swedish refineries.
From 2011, the country’s gas works plants stopped using naphtha.
110 - WORLD ENERGY BALANCES: DATABASE DOCUMENTATION (2017 edition)
INTERNATIONAL ENERGY AGENCY
Consumption
Starting from 1995 data, Sweden has changed its standard classification of industry sub-sectors
Between 1985 and 1986, there are breaks in consumption time series of fuel oil due to more detailed reporting.
In 1984 data, consumption of other kerosene in the road sector is discontinued due to product re-classification.
Natural gas
Transformation
Since 2005, the natural gas inputs to gas works has been estimated by the IEA Secretariat.
Autoproducer inputs to waste-heat production that are sold are reported in the respective end-use sectors and not in the transformation sector.
Consumption
For 2013, data for the energy use of gas by oil re-fineries have been estimated by the IEA Secretariat.
For 2008, data for total final consumption and its breakdown have been estimated by the IEA Secretariat based on other Statistics Sweden publications.
For years prior to 1993, road transport is included in commercial/public services.
Biofuels and waste
General notes
There are some breaks in time series between 2015 and 2016 in pumped hydro, industrial waste and other liquid biofuels figures due to the lack of data. The figures are expected to be modified in the 2018 edition.
From 1990 to 2006, municipal waste was reported as 60% non-renewable and 40% renewable. In 2007, reanalysis of the waste revealed the content was 40% non-renewable and 60% renewable. This results in breaks in the time series between 2006 and 2007 for both renewable and non-renewable municipal waste.
Supply
For 2015, data for primary solid biofuels were revised downwards because estimated figures in the last edition came from quarterly surveys
whereas in this 2017 edition, final statistics for 2015 are published.
Consumption
Due to confidentiality issues, solid biofuels con-sumption in food, beverages and tobacco is re-ported with paper, pulp and printing for 2014 data.
Consumption data by sector for biogases are available from 2011.
In 2011 data, there was a change in the reporting methodology for consumption of solid biofuels and waste in the residential sector, which is responsible for breaks in time series between 2010 and 2011.
Electricity and heat
Supply
Inputs to heat pumps include heat recovered from industry and from ambient sources (including sewage and seawater).
Ambient heat is shown as the indigenous pro-duction of heat.
Information on heat for sale produced in heat pumps and electric boilers is available starting in 1992.
Transformation
In Sweden, heat produced in heat pumps is sold to third parties (as district heat) and is therefore included in transformation.
The electricity used to drive heat pumps is considered to be transformed and appears as output in transformation rather than as electricity used in energy industry own use.
Heat production from solid biofuels in auto-producer CHP includes waste heat and chemical heat.
For 2012 and 2013, small quantities of bio-methanol used to produce electricity are included in other liquid biofuels, under production, as well as input and output of autoproducer CHP.
For 1997 and 1998, heat production from liquid fuels in main activity producer CHP plants in-cludes heat recovered from flue-gas condensing.
Prior to 1992, data on electricity production from biogases is included with solid biofuels.
Heat produced for sale by autoproducer CHP plants is reported starting in 1992.
WORLD ENERGY BALANCES: DATABASE DOCUMENTATION (2017 edition) - 111
INTERNATIONAL ENERGY AGENCY
From 1987, the breakdown of net electricity pro-duction by industry for autoproducer electricity plants is available.
Prior to 1987 net electricity production by auto-producer plants includes data for CHP plants only.
Prior to 1980, heat produced in main activity producer heat plants is not available.
Prior to 1974, heat produced in main activity producer CHP plants is not available.
Consumption
Consumption of electricity for distribution of district heat is included with other energy industry own use.
Fuel inputs to the heat that is recovered by the heat pump are reported in the appropriate industry sub-sector (i.e. chemical and paper, pulp and printing).
In 2014, consumption of electricity in the mining and quarrying and the pulp, paper and printing sectors are confidential and were incorporated under the non-specified industry sector.
Data on direct use of solar thermal are available from 1989.
Consumption of heat in industry and other sectors is available from 1984.
Switzerland
Sources
Swiss Federal Office of Energy (SFOE), Ittigen.
Carbura – Swiss Organisation for the Compulsory Stockpiling of Oil Products, Zurich.
General notes
From 1999, data on consumption result from a new survey and are not comparable with data for previous years.
Coal
General notes
Calorific values for anthracite, other bituminous coal and coke oven coke are taken from a common default figure. Calorific values for lignite are also default, but are based on dried lignite fines which have a higher calorific value.
Consumption
From 1985, industrial consumption of gas works gas is reported in non-specified industry to prevent the disclosure of commercially confidential data.
The allocation of consumption between certain coal types is estimated by the Swiss administration.
Oil
General notes
The statistical differences for gas/diesel oil are partly due to changes in consumer stocks.
In 2004, petroleum coke production started due to the installation of a cracking unit in a refinery
As of 1993, the Swiss administration has reported figures for naphtha that are net of quantities used for blending into motor gasoline. For 1994, 1995, 1997, 1999, 2001 and 2002 this reporting has led to negative production numbers for naphtha. For these years, the IEA Secretariat has moved the data into transfers and reduced the production of motor gasoline by corresponding amounts.
Supply
In 2015, low refinery throughput is due to maintenance in May and June and to an unplanned outage in October due to a leak in a heat ex-changer, both at the Cressier refinery. This also led to increased imports of many oil products in 2015.
In 2015, the drop in refinery output of petroleum coke was due to the temporary closure of the Collombey refinery.
Transformation
Gas/diesel oil non-specified transformation repre-sents inputs to mobile and stationary power gen-erators, of which the electricity output is unknown at this stage.
In 2012, low refinery intake is due to the temp-orary shutdown of the refinery in Cressier in the first semester of 2012 and maintenance at Collombey refinery.
In 1988, the reduction in refinery intake of refinery feedstocks in 1988 is partly due to a switch to crude oil and partly to a shutdown for maintenance of a refinery.
Consumption
In 1994, the increase in consumption of gas/diesel oil is due to consumer stock-building prior to the introduction of a value-added excise tax on heating fuels as of 1 January 1995.
112 - WORLD ENERGY BALANCES: DATABASE DOCUMENTATION (2017 edition)
INTERNATIONAL ENERGY AGENCY
Natural gas
General notes
The statistical difference is reported under Agriculture/Forestry, and it is not possible to differentiate between the two.
Transformation
Since 2013 there are fluctuations in gas consumption of main activity producers CHP plants due to the fuel flexibility of a plant.
In 1996, the increase of gas input to main activity CHP plants is due to more complete accounting for all producing entities.
Consumption
Between 1977 and 1978, there are breaks in time series due to the introduction of a new survey by industry type.
Biofuels and waste
Supply
Due to a new program launched in September 2014 in which CO2 emissions due to traffic can be compensated by substituting fossil gasoline and diesel by biofuels, the imports and road con-sumption of biodiesels and biogasoline increased sharply in 2015.
Consumption
Consumption data for biogases in the transport sector are available from 1996 to 2012 as a biogas fuel station had stopped selling biogas in 2013.
Electricity and heat
Supply
Heat production includes heat produced by nu-clear power stations and distributed to other consumers.
Data for electricity production from wind are available from 1996.
Data for solar electricity production by auto-producers are available from 1990.
Transformation
For 2015, the large decline in electricity and heat production from industrial waste is due to one large main activity CHP plant significantly reduces their activity.
From 2012, the municipal waste autoproducer plant previously reported as electricity plant met the CHP requirements and was reclassified as such.
Biogas is no longer being used for heat production as of 2011.
The decrease in the use of natural gas in main activity CHP plants in 2007 is caused by the reduced operation of one plant after the start-up of a new waste-incineration plant and the shutting down of another plant. Use increases again in 2008 due to the re-starting of a district heating plant.
The autoproducer heat plant that produced heat for sale using municipal waste was closed in 2006.
The breakdown of electricity and heat generation from autoproducers by sector is not available after 1990.
Prior to 1978, data for heat output from CHP plants are not available.
The allocation of electricity production in main activity producer electricity only and CHP plants between 1967 and 1973, and in main activity producer CHP and autoproducer CHP plants in 1974 are Secretariat estimates.
All hydro electricity production is reported under large scale hydro (> 10 MW) due to the fact that production data are not being collected by different size capacity categories.
Consumption
Electricity consumption in the transport equip-ment industry is included with machinery.
Geothermal direct use is overstated as it refers to heat production by geothermal heat pumps, which include inputs from electricity and/or gas in the transformation process.
The breakdown of final consumption of electricity in the industry sector from 2000 to 2001 was estimated by the Secretariat.
Data for direct use of geothermal heat and solar thermal heat are available from 1990.
Turkey
Sources
Ministry of Energy and Natural Resources (Enerji ve Tabii Kaynaklar Bakanlığı), Ankara.
Petrol İşleri Genel Müdürlüğü, Ankara.
WORLD ENERGY BALANCES: DATABASE DOCUMENTATION (2017 edition) - 113
INTERNATIONAL ENERGY AGENCY
Coal
General notes
In the 2017 edition, historical revisions on coal tar data were conducted by the Turkish administration due to new available information.
In the middle of 2014, most autoproducer elec-tricity, heat and CHP plants in Turkey were re-classified as main activity producer due to a change in the legislation. This has resulted in electricity and heat amounts for autoproducer plants to record sharp generation changes from 2014 onwards.
Data from 2012 onwards utilised the latest census data, causing breaks in time series between 2011 and 2012.
Data from 2008 are provided from the results of an improved questionnaire. Significant changes occur in consumption patterns within the iron and steel industry, coal mining as well as across industry, residential and commercial/public services for other bituminous coal.
Calorific values for fuels used for electricity, CHP and heat plants are obtained from data submitted to the Ministry of Energy and Natural Resources (MENR) by the Turkish Electricity Transmission Company, and these values may differ signific-antly from production and import values provided by MENR, causing imbalances for some years.
Production of gas works gas declined in 1989 due to plant closures; the last plant closed in 1994. Use of gas coke and gas works gas ceased in 1994.
Due to government regulations in industry and residential, in particular, there has been a shift from the use of domestically produced coal to imported coal and natural gas.
Transformation
In the middle of 2014, most autoproducer plants in Turkey were reclassified as main activity producer due to a change in the legislation. Amongst other things, this brought the reporting of unsold heat and prorated inputs in line with IEA methodology.
Consumption
Privatisation of state owned coke ovens in recent years results in incomplete information on coke oven gas distribution.
In 2017 edition, consumption of sub-bituminous coal in construction has been reclassified by the
Turkish administration as consumption in the non-metallic minerals industry.
In 2015, a new survey was introduced by the Turkish administration to collect more detailed industrial consumption data, resulting in breaks in time series between 2014 and 2015.
Oil
General notes
A project to upgrade the İzmit refinery was com-pleted in 2015. This resulted in considerably higher refinery throughout in 2015, compared to previous years. The project included a new unit to convert high sulphur fuel oil into higher grade products, such as gas/diesel oil and motor gasoline, and producing petroleum coke as a by-product.
In the 2016 edition, the Ministry of Energy revised time series for kerosene-type jet fuel from 2013. Sales to foreign airlines, previously accounted for under exports, are now reported under inter-national aviation according to the IEA methodology. Data could not be revised for prior years. Exports of jet kerosene up to 2012 years may include international aviation consumption.
In the 2016 edition, the Ministry of Energy revised crude oil net calorific values from 2010 due to a new methodology for calculating them.
Production from other sources (natural gas) of other hydrocarbons corresponds to hydrogen used in refineries, also represented as the output of non-specified transformation in the balances format.
From 2013, marine fuels are reported under fuel oil instead of gas/diesel oil.
From 2012, petroleum coke data are reported.
Supply
In 2014, the drop in lubricants imports and consumption is related to a legislation change effective 1st of January 2014 regarding base oil imports.
From 2012, new information on additives imports (MTBE) data became available.
From 2012, no exports breakdown is available for white spirit, lubricants, bitumen and other products.
From 2010 more accurate NCVs for Crude Oil are available due to the implementation of a new survey.
114 - WORLD ENERGY BALANCES: DATABASE DOCUMENTATION (2017 edition)
INTERNATIONAL ENERGY AGENCY
In 1984, 1983, 1981, 1980 and 1978, international marine bunkers are included in exports.
Transformation
Gas/diesel oil and fuel oil consumed to produce electricity are used in both oil and coal-fired plants.
Consumption
For the 2015 data, new surveys were used to create a more detailed breakdown of the industry and other sectors. This led to breaks in time series between 2014 and 2015.
From 2014, information on gas/diesel consumption in fishing is available.
From 2013, additional information on petroleum coke cement consumption is available.
Prior to 2012, consumption of other oil products in the chemical sector was included under non-specified industry.
Between 2010 and 2011, breaks in consumption time series for LPG, motor gasoline and gas/diesel oil appear due to improved survey methods.
Between 1977 and 1978, the end-use classification of gas/diesel oil and fuel oil were changed in the Turkish national statistics resulting in breaks in time series.
Natural gas
Supply
Exports reported by the Turkish administration represent transit gas.
In 2008, there is a break in time series for stock change due to a revision of storage capacity.
Transformation
Non-specified transformation of natural gas represents amounts used to produce hydrogen for hydrocracking in refineries.
Consumption
In 2015, a new survey was introduced by the Turkish administration to collect industrial con-sumption data, resulting in a substantial decrease of consumption reported under non-specified industry.
In 2013, energy use of natural gas in blast furnaces was zero, as gas was replaced by coal and coke.
From 2009, there are some breaks in time series across all sectors, as consumption data started
being collected by a different institution, the Turkish Energy Market Regulatory Authority.
In 2006, there is a break in time series for non-energy use in chemical industry due to improve-ments in the classification.
Prior to 2000, data for commercial/public services were included in the residential sector.
Between 1999 and 2001, the decrease in natural gas petrochemical feedstocks is linked to the activity of the fertiliser industry.
Since 1988, data for natural gas consumption in the chemical industry (for fertilisers) and in non-specified industry (dye industry) are available.
Non-specified industry includes the natural gas distributed by OIZ (Organised Industrial Zones).
Biofuels and waste
General note
The Turkish administration only intermittently surveys renewables and waste used for power and heat. Due to this fact, some breaks may appear in the biofuels and waste time series.
Consumption
Prior to 1998, consumption in the wood and wood products sector includes that of the paper, pulp and printing industry.
Electricity and heat
Supply
Other sources electricity and heat production is available from 2013 and represents purchased steam (waste heat) from the industry.
Electricity production from wind is available starting in 1998.
Transformation
In the 2006 edition, the Turkish Statistical Office started providing electricity and heat output on the basis of a new survey that revised time series back to 2000. This causes breaks in the time series between 1999 and 2000. Not all of the input time series have been revised.
A new gas-fired main activity producer CHP plant was put into operation in 1999 and a new auto-producer electricity plant fuelled with coking coal started in 2000.

WORLD ENERGY BALANCES: DATABASE DOCUMENTATION (2017 edition) - 115
INTERNATIONAL ENERGY AGENCY
In 1995, the Turkish administration reclassified autoproducer plants by type and source to be consistent with IEA definitions. This caused breaks between 1994 and 1995 for electricity production.
Data for blast furnace gas for electricity and heat generation are available from 1995.
Data on electricity generated from biofuels are available from 1991.
Consumption
Consumption data in the machinery sector includes transport equipment.
Comprehensive data on electricity consumption are available from 1973. This causes a break in the time series between 1972 and 1973.
United Kingdom
Source
Department for Business, Energy and Industrial Strategy (BEIS), London.
Coal
General notes
Oxygen steel furnace gas data are reported with blast furnace gas rather than as other recovered gases.
In the 2017 edition, calorific values of other bituminous coal were revised for the period 2002-2015 due to a change in the methodology, im-pacting all flows.
Prior to 1994, the consumption of substitute nat-ural gas is included with natural gas while its production is included with gas works gas.
Transformation
The consumption of solid biofuels increased in 2015, as the largest power station in the UK con-verted a further unit from coal to biomass mid-year, and the previously converted unit had a full year of operation in 2015 rather than just the last few months of 2014.
The market decline in use of other bituminous coal from 2013 onwards for autoproducer elec-tricity generation was due to a plant being sold to a dedicated main-activity electricity producer.
Consumption
Consumption shown for the commercial/public services includes consumption of some of non-specified other.
Oil
General notes
In the 2016 edition, data for consumption of gas/diesel oil were revised back to 2012 inclusive, following the UK administration’s improved access to customs trade data, in particular duty figures for demand in agriculture. Additional information on the destination of some upstream NGL was obtained from 2008. Previously classified as exports, these amounts now appear as transfers, mainly to LPG, then as consumption in the petro-chemical sector. In the 2016 edition, naphtha refinery output was revised from 2008 to better reflect the blending of naphtha in motor gasoline.
In the 2016 edition, LPG data were revised from 2008. Revisions were made to refinery output and additional consumption in petrochemical sector was recorded. As a result, new breaks in time series may appear from 2008.
For international marine bunkers and domestic navigation, a different bunkers methodology is applied from 2008, in line with UK’s National Atmospheric Emissions Inventory. From 2013 on-wards, improved data are available for inter-national marine bunkers. Deliveries to inte-rnational marine bunkers may be underestimated in previous years.
For consumption of oil products, the UK administration revised its methodology from 2008 to better track consumption of imported oil pro-ducts and domestically refined oil products sold through third parties to final consumers.
Breaks in time series appear in 2013 for ethane, naphtha, white spirit, lubricants, bitumen, petroleum coke and other oil products, as new information became available on the energy use of these products.
From 2002 to 2004, products transfers data include backflows and interproduct transfers. From 2005 onwards, backflows were estimated by the UK administration.
Supply
Condensates are reported in NGL from 1980 and in crude oil until 1979.
116 - WORLD ENERGY BALANCES: DATABASE DOCUMENTATION (2017 edition)
INTERNATIONAL ENERGY AGENCY
LPG includes ethane until 1980.
Other hydrocarbons, reported until 1994, corres-pond to bitumen production from coal.
Natural gas
General notes
Since 1992, distribution losses include metering differences and losses due to pipeline leakage.
Supply
In 2002, the increase in imports is due to increased supplies from the Norwegian sector of the North Sea through the Vesterled pipeline, which was commissioned in the 4th quarter of 2001.
Transformation
The natural gas reported in coke oven transform-ation is used to form synthetic coke oven gas rather than undergoing a coking process.
The natural gas consumed to fuel the distribution of natural gas in natural gas networks is reported under non-specified energy.
Consumption
Before 2008, the commercial sector consumption is included in non-specified other, while that of public services is shown separately.
Between 2007 and 2008 there are some breaks in time series in sectoral consumption due to a new methodology of data estimation.
Natural gas consumption includes substitute nat-ural gas made at gas works and piped into the nat-ural gas distribution system.
Non-specified industry represent to sales by independent gas suppliers unallocated by category.
Consumption by the mining and quarrying and the wood and wood products sectors is included in non-specified industry.
Non-specified energy includes gas used for heating and pumping operations in the distribution network.
Biofuels and waste
General notes
In the 2017 edition, the UK government revised the data time series for municipal waste and solid biofuels back to 2001. As a result, breaks in time series may occur between 2000 and 2001.
Transformation
From 2015, the UK administration started collect-ing data from the main-activity solar PV comp-anies. Prior to this, all data were included under autoproducers.
The consumption of solid biofuels has increased in 2015, as the largest power station in the UK halfway through the year converted a further unit from coal to biomass, plus the previously con-verted unit had a full year of operation in 2015 rather than just the last few months of 2014.
Prior to 2013, due to data confidentiality reasons, one or two main-activity municipal waste plants had to be included within the autoproducer plant category. Since 2013, as there have been at least three main-activity companies, these plants have been reclassified from autoproducer plant to main activity electricity plant, with some CHP plants in-cluded under main electricity due to confidentiality reasons.
Consumption
The UK administration undertook a survey of domestic wood consumption in 2015 and revised figures back to 2008. This resulted in breaks in time series for solid biofuels consumption in residential between 2007 and 2008.
Electricity and heat
General notes
For the United Kingdom, it is necessary to com-bine figures for main activity producers and auto-producers in order to prevent the disclosure of in-formation relating to less than three electricity generating companies, since this information is considered confidential. For this reason, data for main activity producer CHP plants have been in-cluded with autoproducer CHP plants from 1988. Prior to 1988, electricity output from CHP plants was included with autoproducer electricity plants.
The re-organisation and subsequent privatisation of the electricity supply industry in 1990 has re-sulted in some breaks in time series.
Supply
Electricity production data for solar PV are avail-able from 1999.
The launch of a feed-in-tariff scheme in April 2010 resulted in a rapid increase of capacity and corresponding electricity production growth from solar PV in the following years.
WORLD ENERGY BALANCES: DATABASE DOCUMENTATION (2017 edition) - 117
INTERNATIONAL ENERGY AGENCY
In 1996, the break in electricity production from nuclear is due to a reclassification of plants from autoproducer to main activity producer plants.
Data on electricity production from wind is avail-able from 1989.
Transformation
In 2007, outputs of electricity from petroleum coke are included in fuel oil.
Prior to 2003, all outputs of electricity and heat from oil products are reported in the other oil products category.
Heat production from autoproducers is available starting in 1999.
Inputs and output from natural gas for main activity producer electricity production are included in autoproducer electricity for 1990 (for reasons of confidentiality).
Consumption
Consumption in gas works includes electricity use in the transmission/distribution of public supply gas.
Consumption in the non-metallic mineral products sector includes mining and quarrying.
Electricity consumption in coal mines includes consumption in patent fuel plants.
Data for electricity consumption in transport was classified by sub-sector only starting from 2004 resulting in a break in time series between 2003 and 2004. Prior to 2004, non-specified transport includes consumption for traction by urban rails and road vehicles, and consumption for non-traction by railways and bus stations and airports. From 2004 onwards, road vehicles consumption is included under road transport. Prior to 2004, electricity consumption in rail refers to industrial rail only. From 2004 onwards it includes both industrial and urban rail.
Consumption in the machinery sub-sector includes that of the transport equipment industry before 1996.
Starting in 1990, small amounts of electricity used in heat pumps have been included in residential.
From 1984 onwards, the electricity consumption in the non-specified industry sector includes that of the wood and wood products sub-sector and unallocated consumption.
United States
Source
U.S. Energy Information administration, Washington D.C.
General notes
End-use energy consumption data for the United States present a break in time series with historical data due to a change in methodology in 2014. The break in time series occurs between 2011 and 2012 for oil; and between 2001 and 2002 for electricity and natural gas. The new methodology is based on the last historical year of the most recent Annual Energy Outlook (AEO) publication. Changes occur primarily in reported end-use energy con-sumption in the industrial sector and its subsectors, including the non-manufacturing industries of mining, construction and agriculture. Historical re-visions are pending. Due to other changes in re-porting methodologies, there are numerous breaks in time series for the US data, particularly in 1992, 1999, 2001, 2002 and 2013. Care should be taken when evaluating consumption by sector since inputs of fuel to autoproducers are included in final consumption for some years. No data are available for most energy products in the con-struction and mining and quarrying industries.
Coal
General notes
Since the Energy Information administration (EIA) and the US Department of Commerce do not collect separate data on patent fuel exports by country, total exports data of patent fuel are in-cluded in the exports of other bituminous coal.
Coal tar as a by-product of coke ovens is not currently reported.
In 2002, the United States reported “synfuel” pro-duction as patent fuel for the first time. Prior to 2002, the consumption of this fuel was reported with other bituminous coal. Production ceased in 2007 for economic reasons.
Hard coal data prior to 1978 may include sub-bituminous coal.
Supply
Other sources coal production represents coal production that does not have a Mine Health and Safety Administration (MSHA) identifier.
118 - WORLD ENERGY BALANCES: DATABASE DOCUMENTATION (2017 edition)
INTERNATIONAL ENERGY AGENCY
Oil
General notes
In the 2017 edition, the US administration revised the methodology for reporting NGL and LPG, resulting in breaks in time series for these products between 2014 and 2015. Revisions to historical data are pending.
In the 2017 edition, data for biofuels is estimated in 2013 and 2014 based on the figures submitted to the IEA in the Renewables and Waste questionnaire.
In the 2015 edition, the US administration made the following reclassifications: olefins are reported in other oil products instead of LPG, special naphtha exports are classified under refinery feed-stock instead of white spirit. Road use lubricants have been moved to industry Sector in transport Equipment, machinery, and wood and wood products. As a result, breaks in time series appear for LPG, other oil products, refinery feedstocks, white spirit, lubricants between 2012 and 2013. Historical revisions are pending.
Breaks in time series due methodology improve-ments and newly available information to the US administration also appear in historical data: in 1990 for fuel oil (new methodology for marine bunkers); in 1992 for LPG/NGL (specific densities); in 1993 for oxygenates (new collection system to accommodate the revised Clean Air Act); in 1994 for motor gasoline (new model from the US Department of Transportation);in 1999-2000 for industry consumption (new available data from the 2002 MECS survey); in 2001 for fuel oil (changes in methodology for classifying imports of unfinished oils) and in 2012 for refinery gas (new density).
Supply
High statistical differences for crude oil represent “unaccounted for crude oil”, the difference between the supply and disposition of crude oil.
Stocks changes for gas/diesel oil, fuel oil and petroleum coke were estimated by the IEA Sec-retariat from 1996 onwards to include stock changes at utilities.
Transformation
From 2002 onwards, the IEA Secretariat has estimated the amounts of refinery gas used for autoproducer electricity production.
Consumption
In the 2017 edition, the following flows have been estimated by the IEA Secretariat for 2015: energy-use of LPG in residential, commercial and public services and road sectors; non-energy use of LPG; energy use of fuel oil in commercial and public services; and energy use of gas/diesel oil in commercial and public services. Revisions to consumption data are pending.
Between 2011 and 2012, end-use energy consumption data for the United States present a break in time series due to a change in meth-odology. Data for 2012 onwards are based on the last historical year of the most recent Annual Energy Outlook (AEO) publication while 2011 data are based on projections derived from the Manu-facturing Energy Consumption Survey (MECS) of 2010. Changes occur primarily in reported end-use energy consumption in the industrial sector and its subsectors, including the non-manufacturing industries of mining, construction and agriculture. Historical revisions are pending.
From 1995 onwards, LPG inputs to gas works are included in industry.
Natural gas
Supply
In the 2017 edition of this publication, the in-digenous production data for 2014 was revised by the US administration creating a break in the time series between 2013 and 2014 due to a change in the methodology. In addition, this increased the statistical difference that remained high in 2015.
From 1990 to 2002, the amounts of gas works gas that are blended with natural gas have been estimated on the basis of the output efficiency of the process.
Transformation
Since 2012, data reported under non-specified trans-formation represent natural gas used for hydrogen manufacture. Prior to 2012, these quantities are reported under the petrochemical sector.
Between 1999 and 2000, there are some breaks in time series for the transformation subsectors due to a new data reporting method.
Between 1990 and 2002, the amounts of gas works gas that are blended with natural gas have been estimated on the basis of the output efficiency of the process.
WORLD ENERGY BALANCES: DATABASE DOCUMENTATION (2017 edition) - 119
INTERNATIONAL ENERGY AGENCY
Since 1989, consumption by autoproducer CHP plants is available, while consumption by auto-producer electricity and main activity producer CHP plants is available since 1991. Prior to these years, these consumptions are included with ind-ustry and commerce/public services.
Consumption
The administration of the United States is curr-ently making significant revisions to the iron and steel model. For this reason, there is a break in the time series between 2014 and 2015 for the con-sumption in blast furnaces (Energy).
Until 2001, agriculture and forestry consumption is included under industry.
From 1995 to 2001, the detailed breakdown of in-dustry consumption is estimated by the Energy Information administration using the Manu-facturing Energy Consumption Survey (MECS), which is conducted quadrennially.
Prior to 1995 a detailed breakdown of industry consumption is not available (between 1990 and 1994, chemical consumption is estimated by the American administration).
In 1991 data on natural gas use in the road sector were collected for the first time, and are not available for previous years.
Non-specified energy industry own use represents gas consumed for the production of ethanol.
Consumption in fisheries is included under industry.
Biofuels and waste
General notes
Due to the change in reporting methodology for liquid biofuels, breaks in time series occur be-tween 2012 and 2013. This is especially noticeable in biodiesel time series. Potential revisions to historical data could occur in the 2018 edition.
Geothermal supply and transformation data are estimated by the IEA Secretariat starting in 2009 because of efficiency discrepancies.
Transformation
The EIA collects generation and consumption data from all plants 1 MW or more in capacity.
Consumption
Due to an improved estimation, there are some breaks in time series of industrial sector and other
sector between 2009 and 2010 for many fuels types: For the industrial sector, this can be found in geothermal, biogases and industrial waste (paper, pulp and printing). For other sectors, breaks can be shown in geothermal and solar thermal.
Electricity and heat
General notes
Between 2001 and 2002, there are breaks in time series concerning the total production of electricity and heat in the United States. Comprehensive data on electricity and heat production and con-sumption in main activity producer electricity, CHP and heat plants and autoproducer electricity and CHP plants are not available for all years.
Supply
The IEA Secretariat estimated US solar PV electricity generation from autoproducers starting in 1999 by multiplying the dispersed and dis-tributed PV capacity estimated by the US admin-istration by an average capacity factor of 12%. The capacity factor was based on a report published in 2007 by the IEA Photovoltaic Power Systems Programme, Cost and Performance Trends in Grid-Connected Photovoltaic Systems and Case Studies. The corresponding consumption of electricity has been included under non-specified other.
Data for electricity absorbed by pumping and elec-tricity production from pumped storage plants be-came available starting in 1987.
Transformation
Accurate accounting of coke oven gas and refinery gas inputs is not always possible, which can lead to efficiencies over 100% in main activity producer CHP plants.
Other sources electricity production represents purchased steam and waste heat from industries.
Two geothermal plants were reclassified as CHP in 2014, causing new time series to appear.
The low efficiencies from 2011 for other bit-uminous coal autoproducer electricity plants are due to the fact that one unit; the Albany Brewery Power Plant only produces unsold heat.
From 2007 to 2009, heat from industrial waste includes recovered heat from industrial processes. From 2010, the electricity produced from re-covered heat is reported under other sources.
120 - WORLD ENERGY BALANCES: DATABASE DOCUMENTATION (2017 edition)
INTERNATIONAL ENERGY AGENCY
The decline in patent fuel used for electricity production in 2008 and subsequent cessation of the time series in 2009 is a result of the termination of the patent fuel tax credit in 2008 which had previously made the fuel economical for electricity production.
The US administration changed its methodology for calculating heat production in CHP plants, and revised data back to 2006. This leads to breaks in the time series between 2005 and 2006.
From 2004 onwards, the EIA has reported electricity and heat production from anthracite under sub-bituminous coal. The Secretariat estimated the split of output by fuel type based on the assumption that the plant efficiencies of the aggregate are equal to that of each part.
Starting in 2002, autoproducer electricity output for oil includes generation from refinery gases with a low average calorific value. Prior to 2002, this output was not accounted for.
Prior to 2001, data on plants consuming other bituminous coal, sub-bituminous coal and lignite have been estimated by the Secretariat using information provided in the EIA’s Annual Electricity Generator Report – Utility.
Data for peat are confidential between 1994 and 1998 and from 2000 are not reported.
Prior to 2000, autoproducers include small and independent power producers which under IEA definitions are considered as main activity pro-ducers. Production from these small and independ-ent power producers accounts for about 25% of reported production of electricity by autoproducers in the United States. This reclassification causes breaks between 1999 and 2000.
In the 2003 edition, the US administration re-classified some plants to autoproducers. This re-classification causes more breaks between 1998 and 1999.
Data for heat produced in main activity producer heat and autoproducer CHP plants are available from 1992 to 1999.
From 1999 onwards, the fuel used in heat pro-duction by autoproducers is included in final con-sumption because the US administration cannot distinguish between the heat used directly on-site
and the heat sold. Therefore, this may under-estimate the heat sold to third parties.
Prior to 1999, solar thermal electricity production includes generation from natural gas because some natural gas units are attached to solar thermal plants and their production could not be separated.
The breakdown of fuel used and production of heat in main activity producer heat plants have been estimated by the Secretariat for 1992 and 1993.
Prior to 1991 some of the fuel inputs to electricity and heat production reported for autoproducer plants are reported as final consumption in the par-ticular economic sector in which the autoproducer is operating.
Prior to 1989, there are no data available for autoproducers.
Sub-bituminous coal inputs for electricity and heat production are included in hard coal before 1983.
Consumption
For the 2017 edition, the breakdown of final electricity consumption for 2015 was based on the results of the Annual Energy Outlook (AEO) of 2016. Breaks in time series appear in the mining and agricultural electricity consumption sectors as a result of introduction of individual industry benchmarking for 2015 results. Large changes in iron and steel and pulp and paper model results from 2014 to 2015 are the result of fundamental revisions of the iron and steel and pulp and paper models between AEO2014 and AEO2016 as well as the use of individual industry benchmarking for AEO2016.Prior to 1991, total consumption of heat sold referred to consumption in commercial/public services. No data are available for heat sold that is consumed in residential and agriculture/forestry.
Data for direct use of solar thermal heat in residential are available from 1999.
Since 1995, heat consumption data are no longer collected and have been estimated, resulting in breaks in the time series between 1994 and 1995.
Data for consumption of heat sold in industry are available from 1991 and in energy industry own use from 1992.
WORLD ENERGY BALANCES: DATABASE DOCUMENTATION (2017 edition) - 121
INTERNATIONAL ENERGY AGENCY
NON-OECD COUNTRIES
Before 2016, the IEA Secretariat published separately “Energy balances of non-OECD countries” and “Energy balances of OECD countries”. The two were combined into “World energy balances” in 2016.
When making references to “this publication”, it includes “Energy balances for non OECD countries” produced until 2016.
In the references below, both the statistical year (2015) for which data are being published in this edition, as well as publication dates of the many documents which have been consulted during the development of this publication are mentioned. As a general rule, where specific documents or personal communications have been used, the date that is referenced is the date of publication of the document or the date of the communication, whereas, where data received through the completion of question-naires are mentioned, the date that is referenced is the statistical year for which data are being published in this edition, namely 2015.
Data may not include all informal and/or illegal trade, production or consumption of energy products, although the IEA Secretariat makes efforts to estimate these where reliable information is available.
General references
Annual Bulletin of Coal Statistics for Europe, Economic Commission for Europe (ECE), New York, 1994.
Annual Bulletin of Electric Energy Statistics for Europe, Economic Commission for Europe (ECE), New York, 1994.
Annual Bulletin of Gas Statistics for Europe, Economic Commission for Europe (ECE), New York, 1994.
Annual Bulletin of General Energy Statistics for Europe, Economic Commission for Europe (ECE), New York, 1994.
Annual Crude Steel production, World Steel Association, www.worldsteel.org.
Annual Report July 1991-June 1992, South African Development Community (SADC), Gaborone, 1993.
Annual Statistical Bulletin, Organization of Petroleum Exporting Countries (OPEC), Vienna, various editions up to 2016.
Annual Statistical Report, Organization of Arab Petroleum Exporting Countries (OAPEC), Kuwait, various editions up to 2016.
APEC Energy Database, Tokyo, 2016.
Arab Oil and Gas Directory, Arab Petroleum Research Centre, Paris, various editions up to 2016.
ASEAN Energy Review 1995 Edition, ASEAN-EC Energy Management Training and Research Centre (AEEMTRC), Jakarta, 1996.
Asia Pacific Databook, FACTS Global Energy, Singapore, various editions up to 2016.
Banque de données Enerdata, Fiches d’expertise des données, Enerdata, Grenoble, September 2016.
Base CHELEM-PIB, Centre d’Etudes Prospectives et d’Informations Internationales (CEPII), Bureau van Dijk, Paris, 2008 to 2017.
Centroamérica: Estadísticas de Hidrocarburos, Comisión Económica para América y el Caribe (CEPAL), United Nations, Mexico, various editions up to 2016.
CIS and East European Energy Databook, Eastern Bloc Research Ltd, Tolsta Chaolais, various editions up to 2016.
Eastern Bloc Energy, Tadcaster, various issues up to May 1999.
Energy Indicators of Developing Member Countries, Asian Development Bank (ADB), Manila, 1994.
Energy-Economic Information System (SIEE), Latin American Energy Organization (OLADE), Quito: http://sier.olade.org/.
Energy Statistics Yearbook 1990, South African Development Community (SADC), Luanda, 1992.
Energy Statistics Yearbook 2008, United Nations, New York, 2011.
External Trade of the CIS countries, The Interstate Statistical Committee of the Commonwealth of Independent States, Moscow, 2005.
Forestry Data, Food and Agriculture Organisation of the United Nations, Rome, 2000.
Foreign Scouting Service, Commonwealth of Independent States, IHS Energy Group – IEDS Petroconsultants, Geneva.
Forests and Biomass Sub-sector in Africa, African Energy Programme of the African Development Bank, Abidjan, 1996.
122 - WORLD ENERGY BALANCES: DATABASE DOCUMENTATION (2017 edition)
INTERNATIONAL ENERGY AGENCY
Global E&P Service, Commonwealth of Independent States, IHS Energy Group – IEDS Petroconsultants, Geneva.
International Energy Annual, Energy Information Administration (EIA), Washington, D.C., 1991 to 1994.
International Energy Data Report 1992, World Energy Council, London, 1993.
Les Centrales Nucléaires dans le Monde, Commissariat à l’Énergie Atomique, Paris, various editions up to 2016.
Lund et. al, Direct Utilization of Geothermal Energy 2010 Worldwide Review, World Geothermal Congress, Bali, 2010.
Middle East Economic Survey (MEES), Nicosia, various issues to June 1999.
Middle East Petroleum Databook, FACTS Global Energy Group, Singapore, various editions up to 2016.
Natural Gas in the World, Cedigaz, Paris, various editions up to 2016.
Natural Gas Vehicles Statistics, International Association for Natural Gas Vehicles, online data-base: www.iangv.org.
Notes d'Information et Statistiques, Banque Centrale des Etats de l'Afrique de l'Ouest, Dakar, 1995.
Pétrole 1994, Comité Professionnel du Pétrole (CPDP), Paris, 1995.
Pirani et al, Russian and CIS Gas Markets and Their Impact on Europe, Oxford University Press, Oxford, 2009.
PIW’s Global Oil Stocks & Balances, New York, various issues to June 1995.
PlanEcon Energy Outlook for Eastern Europe and the Former Soviet Republics, Washington, 2003.
PlanEcon Energy Outlook for the Former Soviet Republics, Washington, June 1995 and 1996.
Prospects of Arab Petroleum Refining Industry, Organization of Arab Petroleum Exporting Countries (OAPEC), Kuwait, 1990.
Review of Wood Energy Data in RWEDP Member Countries, Regional Wood Energy Development Programme in Asia, Food and Agriculture Organisation of the United Nations, Bangkok, 1997.
SIE-Afrique (Systèmes d’Information Énergétique – Afrique), projet promu par ECONOTEC et Institut de l’Energie et de l’Environnement de la Francophonie (IEPF), organe subsidiaire de
l’Organisation Internationale de la Francophonie (OIF) up to 2009.
Solar Heat Worldwide, AEE - Institute for Sus-tainable Technologies, Gleisdorf, various editions up to 2017.
Statistical Bulletin, Arab Union of Producers, Transporters and Distributors of Electricity (AUPTDE), Amman, various editions up to 2015.
Statistical Bulletin, The InterState Statistical Committee of the Commonwealth of Independent States, Moscow, 1993 and 1994.
Statistiques économiques, Banque des Etats de l’Afrique Centrale (BEAC), online database 2011.
Statistical Handbook 1993 - States of the Former USSR, The World Bank, Washington, 1993.
Statistical Yearbook, The Interstate Statistical Committee of the Commonwealth of Independent States, Moscow, various editions up to 2011.
Statistical Yearbook of the Member States of the CMEA, Council of Mutual Economic Assistance (CMEA), Moscow, 1985 and 1990.
The LNG Industry, International Group of Lique-fied Natural Gas Importers (GIIGNL), Levallois, various editions up to 2016.
The United Nations Energy Statistics Database, United Nations Statistical Office, New York, various editions up to 2017.
World Development Indicators, The World Bank, Washington, various editions up to 2016.
Note:
EU4Energy is a 4-year (2016-2020) EU-funded programme working to support evidence-based energy policy and decision making in the areas of energy security, energy markets and sustainable development in 11 focus countries - Armenia, Azerbaijan, Belarus, Georgia, Kazakhstan, Kyrgyzstan, Moldova, Tajikistan, Turkmenistan, Uzbekistan and Ukraine. The IEA is responsible for the programme’s energy-data management and data use in policy design.
The OLADE database was used for several Non-OECD Americas countries.
The UN database was the only source of inform-ation for time series of the countries not listed individually and included in the regions Other Africa, Other non-OECD Americas and Other non-OECD Asia. It was also used in a number of other countries as a complementary data source.
WORLD ENERGY BALANCES: DATABASE DOCUMENTATION (2017 edition) - 123
INTERNATIONAL ENERGY AGENCY
Albania
General notes
For 1993, large quantities of oil, widely reported to have moved through Albania into Former Yugoslavia, may not be included in oil trade. Although estimated to represent up to 100 per cent of domestic consumption levels, no reliable figures for this trade were available.
Starting from 2011, motor gasoline consumption is re-ported in the residential sector. This consumption corr-esponds to motor gasoline used in electricity generators.
Sources 2011 to 2015:
Direct communication with the National Agency of Natural Resources, Tirana.
Joint IEA/Eurostat/UNECE annual energy questionnaires.
Sources 2005 to 2010:
Energy Balances 2005-2010, Energy Department of the National Agency of Natural Resources of Albania, Tirana.
IEA Secretariat estimates.
Sources up to 2004:
Joint IEA/Eurostat/UNECE annual energy questionnaires 1994, 1995, 1998.
Energy Balances, National Agency of Energy of Albania, 1999 to 2004.
The UN Energy Statistics Database.
Aide Memoire of World Bank Mission to Albania May/June 1991.
IEA Secretariat estimates.
Sources for biofuels and waste:
The UN Energy Statistics Database.
Joint IEA/Eurostat/UNECE annual energy questionnaires.
IEA Secretariat estimates.
Algeria
General notes
Crude oil production and export data do not include field condensate. Field condensate quantities are included with natural gas liquids.
Revisions were made to the energy balances in 2009 and 2010 which add more detail for certain products and flows. This may result in breaks in time series between 2008 and 2009.
Sources
Sources 1990 to 2015:
Direct communication with the Ministry of Energy and Mining, Algiers.
Additional sources 2008:
SONELGAZ, Société nationale de l’électricité et du gaz, online statistics on electricity production, Algiers.
Sources up to 1989:
Annuaire Statistique de l'Algérie 1980-1984, Office National des Statistiques, Algiers, 1985.
Bilan Energétique National, Gouvernement Algérien, Algiers, 1984.
Algérie Energie, No 6, Ministère de l'Energie et des Industries Chimiques et Pétrochimiques, Algiers, 1979 to 1983.
Sources for biofuels and waste:
The UN Energy Statistics Database.
Ministry of Energy and Mining.
IEA Secretariat estimates.
Angola
General notes
Crude oil production and export data do not include field condensate. Field condensate quantities are included with natural gas liquids.
The natural gas export terminal, Soyo, was in operation between 2013-2014. Breaks in time series in natural gas export, supply, and consumption can be observed in 2013 and 2014.
Sources
Sources 2003 to 2015:
Direct communication with the Ministério da Energia e Águas (Ministry of Energy and Water), Luanda.
Relatório de Gestão e Contas, Sonangol E.P, Luanda, various editions up to 2015.
124 - WORLD ENERGY BALANCES: DATABASE DOCUMENTATION (2017 edition)
INTERNATIONAL ENERGY AGENCY
Balanço da Produção & Informação sobre o Sector de Petróleo e Gás & Balanço da Refinaria de Luanda, Ministério dos petróleos, Luanda, 2013.
Relatório de Actividades do Sector Petrolífero, Ministério dos petróleos, Luanda, 2007 and 2008 editions.
Annual Report, Southern African Power Pool, Harare, various editions up to 2012.
IEA Secretariat estimates.
Sources 1992 to 2002:
Direct communication with oil industry sources.
IEA Secretariat estimates.
Eskom Annual Statistical Yearbook, 1993, 1994, 1995 citing Empresa Nacional de Electricidade as a source, Johannesburg, 1994-1996.
The UN Energy Statistics Database.
Sources up to 1991:
Le Pétrole et l'Industrie Pétrolière en Angola en 1985, Ambassade de France, Poste d'Expansion Economique de Luanda, Luanda, 1985.
Sources for biofuels and waste:
IEA Secretariat estimates based on 1991 data from African Energy Programme of the African Develop-ment Bank, Forests and Biomass Sub-sector in Africa, Abidjan, 1996.
Argentina
General notes
Since 2010 a different methodology was adopted by Argentina for reporting refinery flows leading to more detailed information (e.g. reprocessing of some oil products). This may result in breaks in time series between 2009 and 2010.
Sources
Sources up to 2015:
Direct communication with the Ministry of Economy, Secretariat of Energy, Buenos Aires.
Balance Energético Nacional, Ministerio de Economía, Secretaria de Energía, Buenos Aires, various editions up to 2016.
Informe del sector eléctrico, Ministerio de Planifi-cación Federal, Inversión Pública y Servicios,
Secretaria de Energía, Dirección Nacional de Pros-pectiva, Buenos Aires, various editions up to 2016.
Información del mercado de hidrocarburos, Ministerio de Planificación Federal, Inversión Pública y Servicios, Secretaria de Energía, Dirección Nacional de Prospectiva, Buenos Aires, various editions up to 2016.
Informe Enargas, Enargas, Buenos Aires, various editions up to 2016.
Camara Argentina de Biocombustibles, online statistics.
Informe del sector eléctrico, Ministerio de Economía, Secretaria de Energía, Buenos Aires, 1986 to 2003.
Anuario de Combustibles, Ministerio de Economía, Secretaria de Energía, Buenos Aires, 1980 to 2003.
Anuario Estadístico del sector energético Argentino, Instituto Argentino de la Energía “General Mosconi”, Buenos Aires, 2000.
Anuario Estadístico de la República Argentina, Instituto Nacional de Estadística y Censos, Buenos Aires, September 1997.
Boletín Mensual de Combustibles, Ministerio de Obras y Servicios Públicos, Secretaria de Energía, Buenos Aires, various editions.
Natural Gas Projection up to 2000, Gas del Estado Argentina, Buenos Aires, 1970, 1984 to 1986.
Anuario Estadístico de la República Argentina 1970-1981, Instituto Nacional de Estadística y Censos, Secretaria de Planificación, Buenos Aires, 1982.
Plan Energético Nacional 1986-2000, Ministerio de Economía, Secretaría de Energía, Subsecretaría de Planificación Energética, Buenos Aires, 1985.
Anuario Estadístico, Yacimientos Petrolíferos Fiscales, Buenos Aires, 1984 to 1987.
Memoria y Balance General, Yacimientos Petro-líferos Fiscales, Buenos Aires, 1984 to 1986.
Armenia
General notes
Data for Armenia are available starting in 1990. Prior to that, they are included in Former Soviet Union.
Armenia is one of the 11 EU4Energy focus countries.
From 2015, survey data are available on the con-sumption of energy products in Armenia. Partial data
WORLD ENERGY BALANCES: DATABASE DOCUMENTATION (2017 edition) - 125
INTERNATIONAL ENERGY AGENCY
were already available for 2014 for some products (pilot survey). Prior to 2014, consumption data were not available have been estimated by the IEA Secretariat based on supply. Therefore breaks in time series occur between 2013 and 2014 and 2014 and 2015. 2015 should be used as reference year. Data for 2014 and prior estimates may be revised after a few years of survey results.
No information is available about the source of peat exports.
Sources
Sources 2014-2015:
Direct communication with National Statistical Service, Yerevan.
Joint IEA/Eurostat/UNECE annual energy questionnaires.
IEA Secretariat estimates.
Sources 1992 to 2013:
Direct communication with National Statistical Service, Yerevan.
Joint IEA/Eurostat/UNECE annual energy ques-tionnaires on Coal, Electricity and heat, Natural gas, Oil.
IEA Secretariat estimates.
Sources 1990 to 1991:
IEA Secretariat estimates.
Sources for biofuels and waste:
From 2014: Joint IEA/Eurostat/UNECE annual energy questionnaires on Renewables
Prior to 2014: Forestry Statistics, FAO, Rome., IEA Secretariat estimates.
Azerbaijan
General notes
Data for Azerbaijan are available starting in 1990. Prior to that, they are included in Former Soviet Union.
Azerbaijan is one of the 11 EU4Energy focus countries.
Production of natural gas may differ from the Azerbaijan national energy balance because natural gas used for production of electricity by the oil and gas extraction industry is included by the IEA Secretariat in the definition of natural gas production.
Breaks in time series appear for inputs and outputs of electricity, CHP and heat plants in Azerbaijan between 2006 and 2007 due to an improved data collection methodology in the country from 2007 onwards.
For the purpose of calculating CO2 emissions, an allocation between domestic and international aviation consumption of jet kerosene was estimated by the IEA Secretariat for 1990-2006 based on total aviation consumption reported by Azerbaijan and the 2007 allocation.
Sources
Sources 1990 to 2015:
Direct communication with the State Committee of Statistics and the Ministry of Economics of Azerbaijan, Baku.
Joint IEA/Eurostat/UNECE annual energy ques-tionnaires, 1992 to 2015.
Sources for biofuels and waste:
Joint IEA/Eurostat/UNECE annual energy ques-tionnaires, 2000-2015.
Before 2000: IEA Secretariat estimates.
Bahrain
General notes
Crude oil production includes production from the Abu Sa’fah field, which is shared with Saudi Arabia.
Consumption of natural gas for autoproducer power generation may include quantities used for non-power generation purposes.
Estimations of the use of petroleum coke in the manufacture of aluminium have been made to track this consumption from 2000 onwards. This may lead to breaks in time series between 1999 and 2000.
Historical revisions in LPG, Naphtha and Refinery Gas data from 2011 are consistent with official report from Bahrain National Gas Company. Breaks in time series are observed in 2011 for LPG exports.
Sources
Sources 1992 to 2015:
Direct communication with National Oil and Gas Authority of Bahrain, Manama.
126 - WORLD ENERGY BALANCES: DATABASE DOCUMENTATION (2017 edition)
INTERNATIONAL ENERGY AGENCY
Statistics 2005-2015, National Oil and Gas Authority of Bahrain, Manama.
Annual Pamphlet 2013-2015, Bahrain National Gas Company, Riffa.
Online statistics 2000-2015, Central Informatics Organization (CIO), Manama, Kingdom of Bahrain.
Statistical Bulletin, Arab Union of Producers, Transporters and Distributors of Electricity (AUPTDE), Amman, various editions up to 2015.
Statistics 2007 and 2008, Electricity & Water Authority, Manama.
Statistical Abstract, 1994, 1998, 1999, 2000, 2001, 2002 and 2003, Council of Ministers, Control Statistics Organisation, Bahrain.
The UN Energy Statistics Database.
IEA Secretariat estimates.
Sources up to 1991:
Statistical Abstract 1990, Council of Ministers, Central Statistics Organisation, Manama, 1991.
1986 Annual Report, Bahrain Monetary Agency, Manama, 1987.
B.S.C. Annual Report, Bahrain Petroleum Company, Manama, 1982-1984.
Foreign Trade Statistics, Council of Ministers, Central Statistics Organisation, Manama, 1985.
Bahrain in Figures, Council of Ministers, Central Statistics Organisation, Manama, 1983-1985.
Bangladesh
General notes
Data are reported on a fiscal year basis, beginning on 1 July and ending on 30 June of the subsequent year.
In 2013, time series were revised from 2008 to 2011 based on data retrieved from the Bangladesh Power Development Board. This may result in breaks in time series between 2007 and 2008 for electricity.
In 2014, time series were revised from 2004 to 2012 based on new data on petroleum products retrieved from the Bangladesh Petroleum Corporation and the Eastern Refinery Limited. This may result in breaks in time series between 2004 and 2005 for primary and secondary oil products.
Sources
Sources 2008 to 2015:
Annual Report, PetroBangla - Bangladesh Oil, Gas and Mineral Corporation, Dhaka, various editions up to 2015.
Annual Report, Bangladesh Power Development Board (BPDB), Dhaka, various editions from 2007 to 2015.
Annual Report, Dhaka Electric Supply Company Limited (DESCO), Dhaka, various editions from 2008 to 2015.
Bangladesh Economic Review, Ministry of Finance, Dhaka, various editions from 2008 to 2015.
Coal Recent Mine Activities, Barapukuria Coal Mining Company Limited (BCMCL), Dhaka, 2015.
Statement of total coal production, sale, delivery and stock position, Barapukuria Coal Mining Company Limited (BCMCL), Dhaka, 2015
Production Activities, Eastern Refinery Limited, online statistics: erl.com.bd, 2015.
Commercial & Operation – Petroleum products, Bangladesh Petroleum Corporation (BPC), online statistics: www.bpc.gov.bd.
IEA Secretariat estimates.
Sources 1996 to 2007:
U.S. Agency for International Development, Dhaka, 2003 to 2008.
IEA Secretariat estimates.
Statistical Yearbook of Bangladesh 1996 to 1999, Ministry of Planning, Bangladesh Bureau of Statistics, Dhaka, 1997 to 2000.
Sources 1992 to 1995:
Statistical Pocket Book of Bangladesh, Ministry of Planning, Bangladesh Bureau of Statistics, Dhaka, 1986 to 1996.
The UN Energy Statistics Database.
Sources up to 1991:
Bangladesh Energy Balances 1976-1981, Gov-ernment of Bangladesh, Dhaka, 1982.
Statistical Yearbook of Bangladesh 1991, Govern-ment of Bangladesh, Dhaka, 1976 to 1991.
Monthly Statistical Bulletin of Bangladesh, Ministry of Planning, Bangladesh Bureau of Statistics, Statistics Division, Dhaka, June 1986 and October 1989.
WORLD ENERGY BALANCES: DATABASE DOCUMENTATION (2017 edition) - 127
INTERNATIONAL ENERGY AGENCY
Sources for biofuels and waste:
Forestry Statistics, FAO, Rome, 2014.
IEA Secretariat estimates.
Belarus
General notes
Data for Belarus are available starting in 1990. Prior to that, they are included in Former Soviet Union.
Belarus is one of the 11 EU4Energy focus countries.
Imports of refinery feedstocks were recorded for the first time in 2015.
In 2016 edition methane produced as a by-product during the petrochemical transformation of naphtha was re-classified by Belarus for the period 1998-2011 from industrial waste to refinery gas. This may lead to breaks in time series between 1997 and 1998.
Jet kerosene was reported under “other products” until 2012. Breaks in time series appear in gas/diesel and fuel oil between 2011 and 2012 as a result of a new classification of industrial products (heating oil re-classified under high sulphur fuel oil).
Oil trade in 2010 shows a significant drop due to higher customs fee of imported quantities of crude oil from Russian Federation.
Since January 2010, Belarus became a member of a Customs Union with Russia and Kazakhstan. Breaks in trade time series and statistical differences appear from 2009 to 2011 as the Customs progressively shift-ed from one accounting system to another. Belarus reports all inputs and outputs to CHP and heat auto-producer plants including those corresponding to own use of heat.
Sources
Sources 1990 to 2015:
Direct communication with the National Statistical Committee of Belarus, Minsk.
Joint IEA/Eurostat/UNECE annual energy questionnaires.
Sources for biofuels and waste:
Joint IEA/Eurostat/UNECE annual energy ques-tionnaires for Renewables.
IEA Secretariat estimates.
Benin
General notes
In this edition, times series were revised from 2011 to 2014 based on new data received from the Ministry of Energy, Water, and Mines. Breaks in time series may occur between 2010 and 2011.
Sources
Sources 1999 to 2015:
Système d’Information Energétique du Bénin (SIE-Bénin) 2015, Direction Générale de l’Energie, Ministère de l’Energie, de l’Eau et des Mines.
Direct communication with the Ministère des Mines, de l’Energie et de l’Hydraulique, Cotonou, through the WEC-IEA Joint Energy Reporting Format for Africa, 1999 to 2002, 2004, 2006, 2007, 2011, 2012.
IEA Secretariat estimates.
Sources up to 1998:
Direct communication with the Secretariat, Direction de l'Energie, Cotonou, 1999, 2000.
Direct communication with the electricity utility, Cotonou, 1998 to 1999.
The UN Energy Statistics Database.
Rapport sur l’Etat de l’Economie Nationale, Minis-tère de l’Economie, Cotonou, September 1993.
IEA Secretariat estimates.
Sources for biofuels and waste up to 1995:
IEA Secretariat estimates based on 1991 data from Forests and Biomass Sub-sector in Africa, African Energy Programme of the African Development Bank, Abidjan, 1996.
Bolivia
General notes
Data for international aviation bunkers are estimated by the IEA Secretariat based on passenger data.
Breaks in time series for solid biofuels occur between 2009 and 2010. This is due to differences in definitions between Bolivia and IEA. Solid biofuels may include other sources of renewable energy (e.g. wind, solar, etc.).
128 - WORLD ENERGY BALANCES: DATABASE DOCUMENTATION (2017 edition)
INTERNATIONAL ENERGY AGENCY
Sources
Sources 1992 to 2015:
Energy-Economic Information System (SIEE), Latin American Energy Organization (OLADE), Quito, accessed May 2017: http://sier.olade.org/.
Boletín Estadístico, Yacimientios Petroliferos Fiscales Bolivianos, La Paz, 2008 to 2015.
Anuarío Estadístico, Autoridad de Fiscalización y Control Social de Electricidad, La Paz, 2015.Balance Energético Nacional 2000-2014 Ministerio de Hidrocarburos y Energía, La Paz, 2014.
Anuario Estadístico, Agencia nacional de hidro-carburos, various editions from 2013 to 2014.
Anuario Estadístico, Ministerio de Hidrocarburos y Energía, La Paz, 2012.
Memoria Anual, Comité Nacional de Despacho de Carga, 2011.
Informe Estadístico, Yacimientos Petrolíferos Fiscales Bolivianos, La Paz, various editions from 1992 to 1998.
Anuarío Estadístico, Superintendencia de Elec-tricidad, La Paz, various editions from 1996 to 2007.
IEA Secretariat estimates.
Sources up to 1991:
Boletín Estadístico 1973-1985, Banco Central de Bolivia, División de Estudios Económicos, La Paz, 1986.
Diez Anos de Estadística Petrolera en Bolivia 1976-1986, Dirección de Planeamiento, Division de Estadística, La Paz, 1987.
Empresa Nacional de Electricidad S.A. 1986 Ende Memoria, Empresa Nacional de Electricidad, La Paz, 1987.
Bosnia and Herzegovina
General notes
Data for Bosnia and Herzegovina are available starting in 1990. Prior to that, they are included in Former Yugoslavia.
Energy statistics are available from the Agency for Statistics of Bosnia and Herzegovina (BHAS) from 2008 for electricity and heat and from 2009 for coal and natural gas. As a consequence, breaks in time
series may occur between 2007 and 2008 for electricity and heat and 2008 and 2009 for other products.
In 2015, BHAS conducted their first household survey on biomass consumption. Due to this newly available data breaks in time series may occur between 2013 and 2014. Also, due to the ongoing work of BHAS to further improve the biomass data quality, future revisions may be expected.
In 2014, BHAS conducted their first survey on oil product consumption. Due to this newly available data breaks in time series may occur between 2012 and 2013.
Until 2012, the source for crude oil and secondary oil products data is the publication “Industrial Production Bosnia and Herzegovina 2012” and “Oil Trade Data” both produced by the Agency for Statistics of Bosnia and Herzegovina.
Sources
Sources 2009 to 2015:
Direct communication with the Agency for Statistics of Bosnia and Herzegovina, Sarajevo.
Joint IEA/Eurostat/UNECE annual energy questionnaires.
Energy Statistics: Oil products, Issue 1, Agency for Statistics of Bosnia and Herzegovina, Sarajevo.
PRODCOM Survey - Industrial Production, Bosnia and Herzegovina, 2009 to 2012.
IEA Secretariat estimates.
Sources 2006 to 2008:
European Network of Transmission System Operators for Electricity, online statistics, 2010.
Union for the Co-ordination of Transmission of Electricity, online statistics, 2009.
IEA Secretariat estimates.
Sources 2000 to 2005:
Energy Sector Study BiH, Third Electric Power Reconstruction Project, consortium led by Energy Institute Hrvoje Pozar, Sarajevo, 2008.
Direct communication with the Joint Power Co-ordination Centre (JPCC).
Statistical Yearbook of BiH, Federation of Bosnia and Herzegovina Federal Office of Statistics, Sarajevo, 2008.
WORLD ENERGY BALANCES: DATABASE DOCUMENTATION (2017 edition) - 129
INTERNATIONAL ENERGY AGENCY
Power Generation and Transmission System in Bosnia Herzegovina, International Management Group, European Commission, Sarajevo, November 2000.
Energy Outlook, Federal Ministry of Energy, Mining and Industry, Sarajevo, December 2001.
The UN Energy Statistics Database.
Botswana
General notes
Data for Botswana are available from 1981. Prior to that, they are included in Other Africa.
Sources
Sources 1981 to 2015:
Direct communication with the Department of Energy, Ministry of Minerals, Energy and Water Resources, Gaborone.
Annual Report, Botswana Power Corporation (BPC), Gaborone. Various editions up to 2015. Note: BPC data are published on a fiscal year basis (April to March).
Environment Statistics 2012, Botswana Central Statistics Office, Gaborone.
Indices of the physical volume of mining production 3Q 2014, Botswana Central Statistics Office, Gaborone.
Botswana in Figures 2011, Botswana Central Statistics Office, Gaborone.
Statistical Yearbook 2010, Botswana Central Statistics Office, Gaborone.
Annual Report 2009, Department of Mines, Gaborone.
Energy Statistics, Central Statistics Office, Gaborone.
IEA Secretariat Estimates.
Brazil
General notes
New information became available in 2015 which explains the types of product transfers within Brazilian refineries. The IEA has attempted to reflect these trans-fers as accurately as possible in the 2015 publication.
In the IEA balance for Brazil, “Biogasoline” refers to anhydrous ethanol while “Other liquid biofuels” refers to hydrated ethanol.19
Although IEA’s balance is based on Brazil’s national statistics, differences with the national energy balance can be observed due to the different methodologies adopted for reporting nuclear, chemical heat, natural gas, renewables, blast furnaces and coke ovens.
Brazil produces a large share of its pig iron in blast furnaces that are fuelled and fed with charcoal. The blast furnace gases produced when charcoal is used as a reagent in the blast furnaces are renewable products and they have been reported in this publication under the product “Biogases from thermal processes”. Add-itionally, only the part of these gases consumed for power generation (i.e. energy purposes) has been accounted for in the transformation sector. The remaining charcoal consumed in or used to heat the blast furnaces is reported in final consumption under the iron and steel industry with no distinction between transformation and final consumption.
Prior to the year 2000 blast furnace gases data availability is limited to the input to auto producer electricity plants. Therefore, from 1971 to 1999, the other flows (e.g. production, consumption etc.) are IEA Secretariat estimates.
The Itaipu hydroelectric plant, operating since 1984 and located on the Paraná River (which forms the border of Brazil and Paraguay) was formed as a joint venture between Eletrobrás and the Paraguayan government. Production is shared equally between Brazil and Paraguay.
Sources
Sources 1971 to 2015:
Direct communication with the Ministério de Minas e Energia, Brasilia.
Mauthner, F. and Weiss W., Solar Heat World-wide - Markets and contribution to the energy supply, various editions up to 2015, IEA Solar Heating and Cooling Programme.
19. The national energy balance of Brazil shows bioethanol as two separate products: anhydrous ethanol ("álcool anidro", i.e. nearly pure ethanol, containing less than 1% of water) and hydrated ethanol (“álcool hidratado”, i.e. a blend of ethanol and water, in the proportion of about 95% to 5%, generally obtained from conventional distillation). While anhydrous ethanol is blended with gasoline (the blend sold at the pump generally contains 20-25% of ethanol), hydrated ethanol is sold at separate pumps as a product by itself (álcool) to be used in flex fuel cars, i.e. vehicles that can run on any mix of gasoline and ethanol.
130 - WORLD ENERGY BALANCES: DATABASE DOCUMENTATION (2017 edition)
INTERNATIONAL ENERGY AGENCY
Brunei Darussalam
Sources
Sources 2006 to 2015:
APEC Energy Database, Tokyo, 2016.
Direct communication with the Prime Minister's Office, Strategic Planning Division, Bandar Seri Begawan.
Direct communication with the Prime Minister's Office, Department of Electrical Services, Bandar Seri Begawan.
IEA Secretariat estimates.
Sources 1992 to 2005:
APEC Energy Database, Tokyo, 2007.
Direct communication with the UN Statistics Division.
Direct communication with the Office of the Prime Minister, Petroleum Unit
Direct communication with the Asia Pacific Energy Research Centre.
Direct communication with the Ministry of Development, Electrical Services Department.
Brunei Statistical Yearbook, 1992 to 1994, Ministry of Finance, Statistics Section, Bandar Seri Begawan, 1993, 1995.
Sources up to 1991:
Fifth National Development Plan 1986-1990, Min-istry of Finance, Economic Planning Unit, Bandar Seri Begawan, 1985.
Sources for biofuels and waste:
The UN Energy Statistics Database.
Bulgaria
General notes
Non-specified transformation of natural gas to other hydrocarbons corresponds to hydrogen used in refineries.
Bulgaria has re-classified black liquor from industrial waste to solid biofuels and the renewable portion of tyres from industrial waste to municipal waste – renewables from 2008. Breaks in time series may occur between 2007 and 2008.
A break in the time series for natural gas stock changes may occur between 2003 and 2004 as cushion gas is excluded starting in 2004.
Sources
Sources 1990 to 2015:
Direct communication with the National Statistical Institute, Sofia.
Joint IEA/Eurostat/UNECE annual energy questionnaires.
Energy Balances, National Statistical Institute, Sofia, 1995.
Sources up to 1991:
Energy Development of Bulgaria, Government of Bulgaria, Sofia, 1980 and 1984.
Energy in Bulgaria, Government of Bulgaria, Sofia, 1980 to 1983.
General Statistics in the Republic of Bulgaria 1989/1990, Government of Bulgaria, Sofia, 1991.
Sources for biofuels and waste:
The UN Energy Statistics Database and Joint IEA/Eurostat/UNECE annual energy questionnaires.
Cambodia
General notes
Data for Cambodia are available starting in 1995. Prior to that, they are included in Other Asia.
In 2015, new information regarding the imports of petroleum products in Cambodia from 2007 onwards became available. Data for these products were revised accordingly and as a result breaks in time series may occur for different products between 2007 and 2013.
Sources
Sources 1995 to 2015:
Cambodia National Energy Statistics 2016, Eco-nomic Research Institute for ASEAN and East Asia.
Report on Power Sector of the Kingdom of Cambodia, Electricity Authority of Cambodia, Phnom Penh, various editions up to 2016.
WORLD ENERGY BALANCES: DATABASE DOCUMENTATION (2017 edition) - 131
INTERNATIONAL ENERGY AGENCY
Petroleum Products Imports Data from the Customs Office, General Department of Petroleum of Cambodia, Phnom Penh, 2014.
APEC annual energy questionnaires, 2010-2011.
Direct communication with the Department of Energy, Ministry of Industry, Mines and Energy, Phnom Penh through the APEC annual energy statistics questionnaire, 1995-2011.
Direct communication with the Department of Corporate Planning and Projects, Ministry of Industry, Mines and Energy, Phnom Penh through the APEC annual energy statistics questionnaire, 1995-2011.
Direct communication with the Electricity Authority of Cambodia, Phnom Penh through the APEC annual energy statistics questionnaire, 1995-2011.
Direct communication with Electricité du Cambodge, Phnom Penh through the APEC annual energy statistics questionnaire, 1995-2011.
IEA Secretariat estimates.
Cameroon
General notes
In 2015, new information regarding Cameroon became available. Data points were revised accordingly which may lead to breaks in times series between 2011 and 2012 for electricity own use and losses and between 2011 and 2011 for crude oil trade and production.
Sources
Sources 1971 to 2015:
Direct communication with Ministère de l'Energie et de l'Eau, Yaoundé.
Annuaire Statistique sur le Commerce, CELSTAT, 2015.
Annual Report, Eneo, 2014.
Statistiques Annuelles, Société Nationale des Hydrocarbures (SNH), 2013, 2014, 2015.
Statistiques économiques, Banque des Etats de l’Afrique Centrale (BEAC), online database, 2011.
Direct communication with Société Nationale de Raffinage (SONARA).
Direct communication with Société Nationale d'Electricité du Cameroun (AES – SONEL), Douala.
The UN Energy Statistics Database
IEA Secretariat estimates.
Sources for biofuels and waste:
IEA Secretariat estimates based on 1991 data from Forests and Biomass Sub-sector in Africa, African Energy Programme of the African Development Bank, Abidjan, 1996.
People’s Republic of China
General notes
The People’s Republic of China (China) joined the IEA as an Association country in November 2015.
Revisions of China’s 2000 - 2010 energy data
In early 2016, the National Bureau of Statistics (NBS) of the People’s Republic of China (China) supplied the IEA with detailed energy balances for 2000 to 2010 and the IEA revised its data accordingly.
In September 2015, the NBS published China’s energy statistics for 2013, as well as revised statistics for the years 2011 and 2012. These have already been taken into account by the IEA in the “Special data release with revisions for the People's Republic of China” in November 2015.
All revisions show significant changes both on the supply and demand side for a number of energy products, resulting in breaks in time series between 1999 and 2000. Most importantly, the previously significant statistical difference for coal has now been allocated in industrial consumption based on findings from a national economic census.
Coal
Net calorific values (NCV) for coal inputs to power generation from 2000 are estimated by applying assumptions used by China on the average thermal efficiency of coal-fired power stations in these years. NCVs are also estimated for bituminous coal pro-duction from 2000 as well as for inputs to main activity heat plants from 2008.
A collaborative effort between NBS and IEA con-tinues, with the objective of providing additional detail on energy production, transformation and con-sumption of all five different types of coal
132 - WORLD ENERGY BALANCES: DATABASE DOCUMENTATION (2017 edition)
INTERNATIONAL ENERGY AGENCY
(e.g. anthracite, coking coal, other bituminous, sub-bituminous and lignite). At the moment NBS only provides quantities of raw coal and washed coal in their energy balances and the IEA Secretariat has attributed these quantities to coking coal and other bituminous coal. It is expected that the continuing work to provide disaggregated data on the five different coals will result in greater detail in future editions.
Since 2000, imports and exports of cleaned coal are no longer reported in the national energy balance of China. The IEA Secretariat has used secondary sources of information to report this coking coal trade and corresponding quantities have been removed from bituminous coal trade. Consumption of this coking coal is assumed to be in coke ovens.
The IEA data of coal stocks for the years 1985 and 1990 as well as coal production for the years 1997-1999 are estimates and do not represent official data released by the Chinese government. Those estimates were based on the assumption that coal consumption statistics are more reliable than coal production statistics and that the production-consumption relationship should maintain a balance over time.In recent years, China has reported large increases in stocks for different types of coal. These stock increases are seen as consistent with trends in economic growth and development in China; however, information is currently lacking on the scale of the infrastructure available for this magnitude of stock increases.
Data for coal trade in this publication may not match data from secondary sources of information.
Oil
Starting with 2010 data, NBS increased the level of detail of the national energy balance regarding oil products and coal gases. Breaks in time series may occur between 2009 and 2010.
In 2012, new information became available on how NBS accounts for international aviation and marine bunkers in the China’s national energy balance. Previously international flights by Chinese airlines and ships had been excluded. A revised methodology was implemented that now includes fuel use for international airplanes and ships, regardless of whether they are foreign- or China-owned.
Coal to liquids output was estimated based on projected production slate of operational coal-to-liquid plants.
In recent years, China has reported large increases in stocks for crude oil and oil products. These stock increases are seen as consistent with trends in economic growth and development in China; however, information is currently lacking on the scale of the infrastructure available for this magnitude of stock increases.
Natural gas
In the 2012 edition, information became available on natural gas consumption in public transportation in China. This consumption was added to the natural gas time series to ensure proper coverage of the transport sector.
Coal to gas output is estimated based on operational capacity of coal-to-gas plants.
Biofuels and waste
Since 2016, the IEA has been working with the Institute of Built Environment of Tsinghua University, Beijing, to improve its data on biomass consumption in the residential sector in China. Biomass figures have therefore been revised in this edition back to 1997 to reflect the results of their study and of IEA analysis. Information also became available in 2012 from NBS on the production and consumption of gangue, a mining waste product that has been classified as industrial waste in the IEA energy balances. This quantity of industrial waste is not likely to represent the only combustion of industrial waste in China, however, information is not available to provide more complete data on this activity.
Time series for liquid biofuels and biogases are based on tertiary sources of information and IEA Secretariat estimates. None of these time series are reported in the national energy balance of China.
Electricity and heat
Estimates on the electricity consumption in road transportation have been added in this edition, starting with 2001 data.
Electricity production from pumped storage hydro is reported from 2010.
Time series for wind (prior to 2010), geothermal, solar photovoltaic and solar thermal generation are based on tertiary sources of information and IEA Secretariat estimates. None of these time series are reported in the national energy balance of China.
WORLD ENERGY BALANCES: DATABASE DOCUMENTATION (2017 edition) - 133
INTERNATIONAL ENERGY AGENCY
Sources
Sources 1990 to 2015:
China Energy Statistical Yearbook, National Bureau of Statistics, Beijing, various editions up to 2016.
Direct communication with the China National Renewable Energy Centre (CNREC), National Energy Administration (NEA), Beijing.
Direct communication with the Institute of Built Environment of Tsinghua University, Beijing.
Solar Heat Worldwide, AEE - Institute for Sus-tainable Technologies, Gleisdorf, various editions up to 2017.
China Electricity Council, online statistics, various editions up to 2014.
Trends in Photovoltaic Applications, International Energy Agency Photovoltaic Power Systems Pro-gramme, 2013 edition.
European Photovoltaic Industry Association, Global Market Outlook for Photovoltaics 2013-2017, Figure 1: Evolution of global cumulative installed capacity 2000-2021, May 2014.
Zhang G., Report on China’s Energy Development 2010, China’s National Energy Administration, Beijing, editions 2009 to 2011.
Zheng et. al, Steady Industrialized Development of Geothermal Energy in China: Country Update Report, Beijing, 2005-2009.
Lund et. al, Direct Utilization of Geothermal Energy 2010 Worldwide Review, World Geothermal Congress, Bali, 2010.
The Global Biodiesel Balance for 2012 and 2013, World Ethanol and Biofuels Report, F.O. Lichts, London, Vol. 11 No. 16, Apr. 23, 2013.
IEA Secretariat estimates.
Sources up to 1990:
Electric Industry in China in 1987, Ministry of Water Resources and Electric Power, Department of Planning, Beijing, 1988.
Outline of Rational Utilization and Conservation of Energy in China, Bureau of Energy Conservation State Planning Commission, Beijing, June 1987.
China Coal Industry Yearbook, Ministry of Coal Industry, People's Republic of China, Beijing, 1983, 1984, 1985 and 2000.
Energy in China 1989, Ministry of Energy, People's Republic of China, Beijing, 1990.
China: A Statistics Survey 1975-1984, State Statistical Bureau, Beijing, 1985.
China Petro-Chemical Corporation (SINOPEC) Annual Report, SINOPEC, Beijing, 1987.
Almanac of China's Foreign Economic Relations and Trade, The Editorial Board of the Almanac, Beijing, 1986.
Sources for biofuels and waste:
IEA Secretariat estimates.
Colombia
Sources
Sources 1992 to 2015:
Energy-Economic Information System (SIEE), Latin American Energy Organization (OLADE), Quito, accessed April 2017: http://sier.olade.org/.
Unidad de Planeación Minero Energética (UPME) Online statistics, Ministerio de Minas y Energía, various editions up to 2015.
Direct communication with the Ministry of Mines and Energy, Energy Information Department, Bogotá.
Statistics 1996-2015, Sistema de Información Eléctrico Colombiano, Ministry of Mines and Energy, online statistics, various editions up to 2015.
IEA Secretariat estimates.
Sources up to 1991:
Boletin Minero-Energético, Ministerio de Minas y Energía, Bogotá, December 1991.
Estadísticas Minero-Energéticas 1940-1990, Ministerio de Minas y Energía, Bogotá, 1990.
Estadísticas Básicas del Sector Carbón, Carbocol, Oficina de Planeación, Bogotá, various editions from 1980 to 1988.
Colombia Estadística 1985, DANE, Bogotá, 1970 to 1983 and 1987.
Empresa Colombiana de Petróleos, Informe Anual, Empresa Colombiana de Petróleos, Bogotá, 1979, 1980, 1981 and 1985.
Estadísticas de la Industria Petrolera Colombiana Bogota 1979-1984, Empresa Colombiana de Petróleos, Bogotá, 1985.
134 - WORLD ENERGY BALANCES: DATABASE DOCUMENTATION (2017 edition)
INTERNATIONAL ENERGY AGENCY
Informe Estadístico Sector Eléctrico Colombiano, Government of Colombia, Bogotá, 1987 and 1988.
La Electrificacion en Colombia 1984-1985, Instituto Colombiano de Energía Electrica, Bogotá, 1986.
Balances Energéticos 1975-1986, Ministerio de Minas y Energía, Bogotá, 1987.
Energía y Minas Para el Progreso Social 1982-1986, Ministerio de Minas y Energía, Bogotá, 1987.
Sources for Biofuels and waste:
Ministry of Mines and Energy, Energy Infor-mation Department, Bogotá.
Congo
General notes
In 2017 edition, no official data were available therefore figures are based on secondary sources and IEA estimates.
In 2016, time series for the period 2000-2012 were revised based on new energy balances received from the Ministry of Energy. Breaks in time series may occur between 1999 and 2000.
The Imboulou Hydro Plant (120MW) began operating in May 2011.
Sources
Sources 1971 to 2015:
Direct communication with the Ministère de l'Energie et de l'Hydraulique, Brazzaville.
Rapport annuel SIE-Congo 2014
Direct communication with the Agence de Régulation de l’Aval Pétrolier, Brazzaville.
Les chiffres caractéristiques de la Société Nationale d’Électricité 2005-2011, SNE, Brazzaville.
IEA Secretariat estimates.
Sources for biofuels and waste:
Rapport annuel SIE-Congo 2014.
IEA Secretariat estimates based on 1991 data from Forests and Biomass Sub-sector in Africa, African Energy Programme of the African Development Bank, Abidjan, 1996.
Costa Rica
Sources
Sources up to 2015:
Direct communication with the Ministerio del Ambiente y Energía, San José.
Energy-Economic Information System (SIEE), Latin American Energy Organization (OLADE), Quito, accessed April 2017: http://sier.olade.org/.
IEA Secretariat estimates.
Côte d’Ivoire
General notes
In the 2014 edition, new information regarding the classification of kerosene type jet fuel and other kerosene produced in Cote d’Ivoire since 1971 became available. Time series for these products were revised accordingly.
Sources
Sources 2013 to 2015:
AFREC Energy questionnaire, African Energy Commission, 2017 submitted by Direction de l’Energie, Abidjan.
Direct communication with Direction de l’Energie, Abidjan.
IEA Secretariat estimates.
Sources 2009 to 2012:
Direct communication with Direction de l’Energie, Abidjan.
IEA Secretariat estimates.
Sources 2005 to 2008:
WEC-IEA Joint Energy Reporting Format for Africa, questionnaire submitted by Direction de l’Energie, Abidjan.
Direct communication with Direction de l’Energie, Abidjan.
IEA Secretariat estimates.
WORLD ENERGY BALANCES: DATABASE DOCUMENTATION (2017 edition) - 135
INTERNATIONAL ENERGY AGENCY
Sources 2002 to 2004:
Direct communication with the Ministry of Mines and Energy, Abidjan, 2005-2006, and IEA Secre-tariat estimates.
Sources 1992 to 2001:
Direct communication with oil industry and the Ministry of Energy, Abidjan, July 2003.
Direct communication with Société Ivoirienne de Raffinage, 2004.
La Côte d'Ivoire en chiffres, Ministère de l'Economie et des Finances, Abidjan, 1996-97 edition.
L'Energie en Afrique, IEPE/ENDA, Paris, 1995, in turn sourced from Ministère des Mines et de l'Energie, Abidjan.
The UN Energy Statistics Database.
Sources up to 1991:
Etudes & Conjoncture 1982-1986, Ministère de l'Economie et des Finances, Direction de la Planification et de la Prévision, Abidjan, 1987.
Sources for biofuels and waste:
IEA Secretariat estimates based on 1991 data from Forests and Biomass Sub-sector in Africa, African Energy Programme of the African Development Bank, Abidjan, 1996.
Croatia
General notes
Data for Croatia are available starting in 1990. Prior to that, they are included in Former Yugoslavia.
Non-specified transformation of natural gas reported from 2007 refers to natural gas used by refineries for hydrogen production.
Breaks in time series may appear between 2007 and 2008 as transit data of electricity trade are not available for years prior to 2008.
Sources
Sources 1990 to 2015:
Direct communication with the Energy Institute “Hrvoje Požar”, Zagreb.
Direct communication with the Central Bureau of Statistics, Zagreb.
Joint IEA/Eurostat/UNECE annual energy questionnaires.
IEA Secretariat estimates.
Cuba
General notes
Breaks in time series in the early 90s are assumed to be due to the codification into law of the embargo imposed on Cuba in 1992.
Figures for crude oil include additives added to reduce viscosity.
Sources
Sources up to 2015:
Energy-Economic Information System (SIEE), Latin American Energy Organization (OLADE), Quito, accessed May 2017: http://sier.olade.org/.
Anuario Estadístico de Cuba, Oficina Nacional de Estadísticas, Havana, various editions from 1998 to 2016.
Estadísticas Energéticas en la Revolución, Oficina National de Estadísticas, Havana, September 2009 edition.
Compendio estadístico de energía de Cuba 1989, Comité Estatal de Estadísticas, Havana, 1989.
Anuario Estadístico de Cuba, Comité Estatal de Estadísticas, Havana, various editions from 1978 to 1987.
Anuario Estadístico de Cuba, Oficina Nacional de Estadísticas, Havana, various editions from 1998 to 2015.
IEA Secretariat estimates.
Curaçao
General notes
The Netherlands Antilles was dissolved on 10 October 2010, resulting in two new constituent countries, Curaçao and Sint Maarten, with the remaining islands joining the Netherlands as special municipalities. In this edition, the methodology for accounting for the energy statistics of the Netherland Antilles has been revised in order to follow the above-mentioned geo-graphical changes. From 2012 onwards, data now
136 - WORLD ENERGY BALANCES: DATABASE DOCUMENTATION (2017 edition)
INTERNATIONAL ENERGY AGENCY
account for the energy statistics of Curaçao Island only. Prior to 2012, data remain unchanged and still cover the entire territory of the former Netherland Antilles.
As the Isla Refinery in Curaçao did not operate to its maximum capacity in 2010, a break in time series might occur in that year for crude oil and oil products.
Sources
Sources 1997 to 2015:
Informe de Gestión Anual, PDVSA - Petróleos de Venezuela, S.A., various editions up to 2016.
The Economy of Curaçao and Sint Maarten in Data and Charts, Yearly Overview 2004-2016, Centrale Bank van Curaçao en Sint Maarten, Willemstad.
Statistical indicators 1998-2010, Central Bank of Netherlands Antilles, Willemstad.
Direct communication with the Isla Refinery, Emmastad, Curaçao, up to 2008.
Statistical Information, Central Bureau of Statistics, Fort Amsterdam, up to 2008.
IEA Secretariat estimates.
Cyprus
General notes
Note by Turkey:
The information in this document with reference to “Cyprus” relates to the southern part of the Island. There is no single authority representing both Turkish and Greek Cypriot people on the Island. Turkey recognizes the Turkish Republic of Northern Cyprus (TRNC). Until a lasting and equitable solution is found within the context of the United Nations, Turkey shall preserve its position concerning the “Cyprus issue”.
Note by all the European Union member states of the OECD and the European Union:
The Republic of Cyprus is recognized by all members of the United Nations with the exception of Turkey. The information in this document relates to the area under the effective control of the government of the Republic of Cyprus.
Time series data from 2009-2010 for primary solid biofuels were revised based on newly available
information. Breaks in time series may occur between 2008 and 2009 for these products.
Sources
Sources 1994 to 2015:
Direct communication with the statistical service of Cyprus, Nicosia.
Joint IEA/Eurostat/UNECE annual energy questionnaires.
Electricity Authority of Cyprus Annual Report 1996, Electricity Authority of Cyprus, Nicosia, 1997.
Sources up to 1993:
Electricity Authority of Cyprus Annual Report 1988, 1992, Electricity Authority of Cyprus, Nicosia, 1989 and 1993.
Industrial Statistics 1988, Ministry of Finance, Department of Statistics, Nicosia, 1989.
Sources for biofuels and waste:
Joint IEA/Eurostat/UNECE annual energy ques-tionnaires and IEA Secretariat estimates.
Note: Data on electricity generation from solar thermal and heat production from municipal waste and wood were submitted for the first time from the year 2004.
Democratic People’s Republic of Korea
General notes
2011 data for primary coals were revised based on new information in the 2014 edition. This may lead to breaks in the time series between 2010 and 2011 and differences in trends compared to previous editions for some products.
Sources
Sources 1971 to 2015:
Direct communication with Korea’s National Statistical Office and Korea’s Energy Economics Institute.
North Korea Statistics, Korean Statistical Infor-mation Service website, www.kosis.kr, Seoul.
WORLD ENERGY BALANCES: DATABASE DOCUMENTATION (2017 edition) - 137
INTERNATIONAL ENERGY AGENCY
The UN Energy Statistics Database.
IEA Secretariat estimates.
Sources for biofuels and waste:
The UN Energy Statistics Database.
Forestry Statistics, FAO, Rome, 2017.
IEA Secretariat estimates.
Democratic Republic of the Congo
General notes
In the 2015 edition, new information and metho-dologies regarding biomass and charcoal became available. Breaks in time-series may occur between 2013 and 2014.
New estimations were made for biomass production in 2014. This may result in break in time series.
Sources
Sources up to 2015:
AFREC Energy questionnaire, African Energy Commission, 2014 and 2015.
IEA Secretariat estimates.
Sources up to 2013:
Direct communication with the Ministère de l’Energie, Kinshasa Gombe.
Commission Nationale de l’Energie, Ministère de l’Energie, Kinshasa Gombe, 2005.
WEC-IEA Joint Energy Reporting Format for Africa, 1999 to 2000.
The UN Energy Statistics Database.
L'Energie en Afrique, IEPE/ENDA, Paris, 1995, in turn sourced from the Annuaire Statistique Energétique 1990, Communauté Economique des Pays des Grands Lacs, Bujumbura, 1990.
IEA Secretariat estimates.
Sources for biofuels and waste:
IEA Secretariat estimates based on 1991 data from Forests and Biomass Sub-sector in Africa, African Energy Programme of the African Development Bank, Abidjan, 1996.
Dominican Republic
General notes
In 2014 the national energy balance was adopted as the primary data source. This could lead to breaks in time series between 1997 and 1998 for some flows. In 2017 the breakdown of consumption data was integrated to IEA balance starting from year of 1998.
Sources
Sources 1971 to 2015:
Energy-Economic Information System (SIEE), Latin American Energy Organization (OLADE), Quito, accessed Jan 2017: http://sier.olade.org/.
Balance energia neta, Comisión nacional de energía, Santo Domingo various editions up to 2015.
Importación de petróleo y derivados, Ministre de Industria y Comercio (MIC), Santo Domingo, various editions up to 2012.
Capacidad instalada y generación del SENI por año, según tecnología, 2000-2010, Oficina Nacional de Estadística, Santo Domingo.
IEA Secretariat estimates.
Ecuador
General notes
Crude oil production and export data do not include field condensate. Field condensate quantities are included with natural gas liquids.
Ecuador has revised historical data since 2004. This may lead to different trends compared to previous editions of this publication.
In the 2015 edition new information became available regarding production and consumption of refinery fuel. This may lead to breaks in time series between 2012 and 2013 (2011 and 2012) for some oil products.
A new hydro plant opened in northern Ecuador in 2015.
Sources
Sources 1999 to 2015:
Direct communication with the Ministerio Coordinador de Sectores Estratégicos, Quito.
138 - WORLD ENERGY BALANCES: DATABASE DOCUMENTATION (2017 edition)
INTERNATIONAL ENERGY AGENCY
Energy-Economic Information System (SIEE), Latin American Energy Organization (OLADE), Quito, accessed April 2017: http://sier.olade.org/.
Direct communication with the Ministerio de Recursos Naturales No Renovables, Quito, up to 2014.
Direct communication with the Ministerio de Minas y Petróleos, Quito, up to 2011.Balance Energético Nacional – Resumen, Ministerio Coordinador de Sectores Estratégicos, Quito, various editions up to 2014.
Estadística del Sector Eléctrico Ecuatoriano, Agencia de Regulación y Control de Electricidad Arconel, Quito.
Informe Estadístico, & Informe Cifras Petroleras, Petroecuador, Empresa Estatal Petróleos del Ecuador, Quito.
Reporte del Sector Petrolero, Banco Central del Ecuador, Quito.
IEA Secretariat estimates.
Sources 1990 to 1998:
Energy-Economic Information System (SIEE), Latin American Energy Organization (OLADE), Quito: http://sier.olade.org/.
Sources up to 1989:
Ministerio de Energía y Minas.
Cuentas Nacionales, Banco Central del Ecuador, Quito, various editions from 1982 to 1987.
Memoria 1980-1984, Banco Central del Ecuador, Quito, 1985.
Ecuadorian Energy Balances 1974-1986, Instituto Nacional de Energía, Quito, 1987.
Informacion Estadística Mensual, No. 1610, Instituto Nacional de Energía, Quito, 1988.
Plan Maestro de Electrificación de Ecuador, Ministerio de Energía y Minas, Quito, 1989.
Egypt
General notes
Data are reported on a fiscal year basis. Data for 2015 correspond to 1 July 2015-30 June 2016.
Stock changes may include informal trade.
The IEA Secretariat has revised marine bunkers back to 2004. Data from 2004 are now based on data
received from the Egyptian Authorities. Electricity data for 2015 are estimated by the Secretariat.
Sources
Sources 1992 to 2015:
Direct communication with the Central Agency for Public Mobilization and Statistics, Cairo, CAPMAS.
Direct communication with the Organisation for Energy Planning, Cairo.
WEC-IEA Joint Energy Reporting Format for Africa, 2000 to 2012.
Direct submission to the IEA Secretariat from the Ministry of Petroleum, Cairo.
Annual Report 1995, 1997, 1998, 1999, Ministry of Petroleum, Egyptian General Petroleum Corp-oration, Cairo, 1996, 1998 to 2000.
Annual Report of Electricity Statistics 1996/1997 to 2010/2011, Ministry of Electricity and Energy, Egyptian Electricity Holding Company, Cairo, 1998 to 2012.
Arab Oil and Gas, The Arab Petroleum Research Center, Paris, October 1997.
Middle East Economic Survey, Middle East Petroleum and Economic Publications, Nicosia, February 1994, June 1996, March 1998.
A Survey of the Egyptian Oil Industry 1993, Embassy of the United States of America in Cairo, Cairo, 1994.
IEA Secretariat estimates.
Sources up to 1991:
Annual Report of Electricity Statistics 1990/1991, Ministry of Electricity and Energy, Egyptian Electricity Authority, Cairo, 1992.
Statistical Yearbook of the Arab Republic of Egypt, Central Agency for Public Mobilisation and Statistics, Cairo, 1977 to 1986.
L'Electricité, l'Energie, et le Pétrole, République Arabe d'Egypte, Organisme Général de l'Infor-mation, Cairo, 1990.
Annual Report, The Egyptian General Petroleum Corporation, Cairo, 1985.
Sources for biofuels and waste:
The UN Energy Statistics Database
IEA Secretariat estimates.
WORLD ENERGY BALANCES: DATABASE DOCUMENTATION (2017 edition) - 139
INTERNATIONAL ENERGY AGENCY
El Salvador
General notes
El Salvador shut down its only refinery in 2012.
Sources
Sources up to 2015:
Energy-Economic Information System (SIEE), Latin American Energy Organization (OLADE), Quito, accessed May 2017: http://sier.olade.org/.
Balances Energeticos, Consejo Nacional de Energia (CNE), San Salvador, various editions from 2007 to 2015.
Boletín de Estadísticas, Superintendencia General de Electricidad y Telecomunicaciones (SIGET), San Salvador, various editions from 1998 to 2015.
Centroamérica: estadísticas de hidrocarburos, 2014. Comisión Económica para América Latina y el Caribe (CEPAL), various editions from 2009-2015.
Direct communication with the Ministerio de Economía, Dirección de Hidrocarburos y Minas, San Salvador.
Direct communication with the Consejo Nacional de Energia El Salvador (CNE), San Salvador.
IEA Secretariat estimates.
Eritrea
General notes
Data for Eritrea are available from 1992. Prior to 1992, data are included in Ethiopia.
Solid biofuels consumption data have been periodically re-estimated by Eritrea. This may result in breaks in time series for this product.
Sources
Sources 1992 to 2015:
Direct Communication with the Ministry of Energy and Mines, Asmara.
IEA Secretariat estimates.
Ethiopia
General notes
Ethiopia energy data include Eritrea from 1971 to 1991. From 1992, the two countries are reported separately.
Data are reported according to the Ethiopian financial year, which runs from 1 July to 30 June of the next year.
Electricity data are revised based on ministry re-porting split between wind and geothermal production since 2011.
The Aluto Langano pilot geothermal power plant began an expansion project in 2010. Breaks in geothermal time series can be seen in 2010 due to the plant being out of commission.
Sources
Sources 2012to 2015:
Direct communication with the Ministry of Water, Irrigation, and Energy, Addis Ababa.
Existing Power Plants, Ethiopian Electric Power Corporation, online database, 2014.
Biomass Energy Strategy Formulation for Ethiopia, European Union Energy initiative, in co-operation with the Ethiopian Ministry for Water and Energy, Germany, 2013
IEA Secretariat estimates.
Sources 1992 to 2012:
Direct communication with the Ministry of Mines and Energy, Addis Ababa.
Direct communication with the Energy Develop-ment Follow-up and Expansion Department of the Ministry of Infrastructure, Addis Ababa, 2004 and 2005.
Direct communication with the Ministry of Finance and Economic Development, Addis Ababa, 1998 to 2003.
The UN Energy Statistics Database.
IEA Secretariat estimates.
Sources up to 1991:
Ten Years of Petroleum Imports, Refinery Pro-ducts, and Exports, Ministry of Mines & Energy, Addis Ababa, 1989.
140 - WORLD ENERGY BALANCES: DATABASE DOCUMENTATION (2017 edition)
INTERNATIONAL ENERGY AGENCY
Energy Balance for the Year 1984, Ministry of Mines & Energy, Addis Ababa, 1985.
1983 Annual Report, National Bank of Ethiopia, Addis Ababa, 1984.
Quarterly Bulletin, National Bank of Ethiopia, Addis Ababa, various editions from 1980 to 1985.
Sources for biofuels and waste:
Biomass Data 2007-2012, Ministry of Water and Energy, Addis Ababa, 2012.
IEA Secretariat estimates up to 2006 based on 1992 data from Eshetu and Bogale, Power Re-structuring in Ethiopia, AFREPREN, Nairobi, 1996.
Former Yugoslav Republic of Macedonia
General notes
Data for FYR of Macedonia are available starting in 1990. Prior to that, they are included in Former Yugoslavia.
The FYR of Macedonia has changed the methodology for reporting autoproducer heat consumption for own use in 2010, which can lead to breaks in time series between 2009 and 2010.
The refinery OKTA in the FYR of Macedonia was shut down in 2014. This may lead to breaks in time series from 2013-2014.
The State Statistical Office revised the energy balances from 2005 to 2014 in accordance with the survey conducted on household energy consumption.
Sources
Sources 1990 to 2015:
Direct communication with the State Statistical Office of Macedonia, Department for Environ-ment, Energy and Transport, Skopje.
Joint IEA/Eurostat/UNECE annual energy questionnaires.
IEA Secretariat estimates.
Sources for biofuels and waste:
UN Energy Statistics Database and Forestry Statistics, FAO, Rome, 2000.
Gabon
General notes
Revisions were made to the residential fuel con-sumption from the time period of 2010 to 2014 to take into account newly available data. This may results in break in time series between 2009 and 2010. Re-visions were made for crude oil production for the whole time series.
Sources
Sources 1992 to 2015:
AFREC Energy questionnaire, African Energy Commission, 2015.
Rapport annuel de la SEEG, Société d’Énergie et d’Eau du Gabon, Libreville, various editions from 2000 to 2015.
Tableau historique de production de 1957 à nos jours, Total Gabon, online database, 2015.
Statistiques économiques, Banque des Etats de l’Afrique Centrale (BEAC), online database, 2011.
Annuaire Statistique du Gabon, Ministère de l’économie, du commerce, de l’industrie et du tourisme, Libreville, 2001 to 2007 and 2004 to 2008, 2011.
Direct communication with Direction Générale de L'Energie, Libreville, 2003 to 2008.
Direct communication with Société Gabonaise de Raffinage, Port Gentil, 1997, 2000 to 2006, 2008 to 2009.
Tableau de Bord de l'Economie, Situation 1997, Perspectives 1998-1999, Direction Générale de l'Economie, Ministère des Finance, de l'Economie, du Budget et des participations, chargé de la privatisation, May 1998.
Rapport d'Activité, Banque Gabonaise de Développement, Libreville, 1985, 1990, 1992 and 1993.
The UN Energy Statistics Database.
IEA Secretariat estimates.
Sources up to 1991:
Tableau de Bord de l'Economie, Situation 1983 Perspective 1984-85, Ministère de l'Economie et des Finances, Direction Générale de l'Economie, Libreville, 1984.
WORLD ENERGY BALANCES: DATABASE DOCUMENTATION (2017 edition) - 141
INTERNATIONAL ENERGY AGENCY
Sources for biofuels and waste:
IEA Secretariat estimates based on 1991 data from Forests and Biomass Sub-sector in Africa, African Energy Programme of the African Development Bank, Abidjan, 1996.
Georgia
General notes
Data for Georgia are available starting in 1990. Prior to that, they are included in Former Soviet Union.
Georgia is one of the 11 EU4Energy focus countries.
Energy data for Georgia do not include Abkhazia and South Ossetia.
Data on international marine bunkers for Georgia are not currently available; however upcoming local surveys are planned and should make this information available in future years.
In the 2016 edition, population figures, collected from the World Bank, have been revised down compared to previous editions. This explains an increase in energy consumption per capita compared to previous editions. Georgia conducted a general population census in 2014 and revised population figures accordingly.
In 2015, a refinery started operating in Georgia.
In 2015, trade of crude oil includes a share of crude oil blended with fuel oil. This explains breaks in time series from 2014.
In 2015, trade of natural gas for the year might in-clude re-export.
Between 2014 and 2015, a break in stock level time series appears for some oil products as the National Statistical Office (GEOSTAT) received more detailed information on stocks of oil products.
Between 2012 and 2013, breaks in time series may appear for some products, as data collection and submission to the IEA became the responsibility of the National Statistical Office (GEOSTAT), whereas it used to be done by the Energy Efficiency Centre.
Since 2011, heat production has stopped due to the shutdown of combined heat and power plants.
Sources
Sources 2015:
Direct communication with GEOSTAT.
Joint IEA/Eurostat/UNECE annual energy questionnaires.
Sources 2013 to 2014:
Direct communication with GEOSTAT. The National Statistical Office started submitting Joint IEA/Eurostat/UNECE questionnaires in 2015 (2013 data).
IEA Secretariat estimates.
Sources 2008 to 2012:
Direct communication with the Energy Efficiency Centre Georgia, Tbilisi.
IEA Secretariat estimates.
Sources 1990 to 2008:
Official Energy Balance of Georgia 1990-1999, 2000-2008, Ministry of Economy and Ministry of Energy, Tbilisi.
IEA Secretariat estimates.
Ghana
General notes
In 2014, Ghana started to exploit gas that was pre-viously flared.
Primary solid biomass figures for 2000-2012 were re-vised in the 2015 edition, as new information became available. Breaks in time series might occur between 1999 and 2000.
In 2011, Ghana began oil production from the Jubilee fields, resulting in a change in crude production and exports between 2010 and 2011.
Data were revised for electricity, oil products and biofuels until 2000 and from 2009 to 2012 based on new information received from the Energy Comm-ission. Breaks in time series may occur for these products.
Sources
Sources up to 2015:
National Energy Statistics 2000-2015, Energy Commission, Accra, 2015.
142 - WORLD ENERGY BALANCES: DATABASE DOCUMENTATION (2017 edition)
INTERNATIONAL ENERGY AGENCY
AFREC Energy questionnaire, African Energy Commission, 2015.
Direct communication with the Energy Comm-ission, Accra.
Detailed Statistics of Petroleum Products Consumption 1999-2008, National Petroleum Authority, Accra, 2009.
National Energy Statistics, Ministry of Energy and Mines, Accra, 2000.
Quarterly Digest of Statistics, Government of Ghana, Statistical Services, Accra, March 1990, March 1991, March 1992, March 1995.
Energy Balances, Volta River Authority, Accra, various editions from 1970 to 1985.
IEA Secretariat estimates.
Sources for biofuels and waste:
Ministry of Mines and Energy, the UN Energy Statistics Database.
IEA Secretariat estimates.
Gibraltar
General notes
In the 2015 edition, the time series for residual fuel oil and gas/diesel oil consumed as international marine bunkers were revised based on newly available information.
Sources
Sources up to 2015:
Abstract of Statistics, Government of Gibraltar, Gibraltar, various editions up to 2015.
Gibraltar Port Authority, Gibraltar, 2015. Gibraltar Electricity Authority, Gibraltar, 2008.
IEA Secretariat estimates.
Guatemala
General notes
The Texaco refinery in Escuintla ceased operations in 2002.
Orimulsion was imported between 2004 and 2006 for electricity generation and is reported under Other Hydrocarbons.
Sources
Sources up to 2015:
Direct communication with the Dirección Nacional de Energía, Ministerio de Energía, Guatemala City.
Energy-Economic Information System (SIEE), Latin American Energy Organization (OLADE), Quito, accessed April 2017: http://sier.olade.org/.
Informe Balance Energético, 2010, 2011, 2012, 2013, 2014 and 2015 Ministry of Energy and Mines, Guatemala City.
Estadísticas Energéticas – Subsector Eléctrico, 2010 to 2014 editions, Ministry of Energy and Mines, Guatemala City.
Production, consumption, Exports and Imports of Oil products Ministry of Energy and Mines, Guatemala City, 2015.
IEA Secretariat estimates.
Haiti
General notes
In 2015 edition, data for solid biofuels and waste products were revised from 2005 to 2011 based on revisions made by OLADE. Breaks in time series may occur during this period for some products.
Sources
Sources 2009 to 2015:
Energy-Economic Information System (SIEE), Latin American Energy Organization (OLADE), Quito, accessed April 2017: http://sier.olade.org/.
Direct communication with Bureau des Mines et de l’Energie, Port-au-Prince. Tableau de suivi du secteur électricité, Ministère de l’Economie et des Finances de la République d’Haïti.
IEA Secretariat estimates.
Sources 2008:
Direct communication with Table Sectorielle Énergie Électrique, Ministère des Travaux Publics, Transports et Communications, Haiti.
IEA Secretariat estimates.
Sources 2005 to 2007:
Energy-Economic Information System (SIEE), Latin American Energy Organization (OLADE), Quito: http://sier.olade.org/.
WORLD ENERGY BALANCES: DATABASE DOCUMENTATION (2017 edition) - 143
INTERNATIONAL ENERGY AGENCY
Sources up to 2004:
Direct communication with Bureau des Mines et de l’Energie.
Honduras
General notes
In 2016 edition, time series data were revised for the period 2009-2013. These revisions made in OLADE data might create breaks in time series in 2010 and 2011 for biofuels and waste used in autoproducers’ electricity plants.
Sources
Sources 2007 to 2015:
Energy-Economic Information System (SIEE), Latin American Energy Organization (OLADE), Quito, accessed May 2017: http://sier.olade.org/.
Anuario Estadístico, Empresa Nacional de Energía Eléctrica (ENEE), Tegucigalpa, several editions up to 2015
Centroamérica: Estadísticas de Hidrocarburos, Comisión Económica para América y el Caribe (CEPAL), United Nations, Mexico, several editions up to 2013.
Centroamérica: Estadísticas de Producción del Subsector Eléctrico, Comisión Económica para América y el Caribe (CEPAL), United Nations, Mexico, several editions up to 2013.
IEA Secretariat estimates.
Sources up to 2006:
Direct communication with Empresa Nacional de Energía Eléctrica, Comayagüela.
Direct Communication with the Secretariat de Recursos Naturales y del Ambiente, Tegucigalpa.
Energy-Economic Information System (SIEE), Latin American Energy Organization (OLADE), Quito: http://sier.olade.org/.
Hong Kong, China
General notes
In the 2016 edition, trade data for various other petroleum products were revised based on newly
available information. Breaks in time series may occur between 2000 and 2001.
Sources
Sources up to 2015:
Hong Kong Energy Statistics - Annual Report, Census and Statistics Department, Hong Kong Special Administrative Region, various editions up to 2016.
Hong Kong Merchandise Trade Statistics – Do-mestic Exports and Re-exports/ Imports, Census and Statistics Department, Hong Kong Special Administrative Region, various editions up to December 2015.
Direct communication with The Hongkong Electric Company, Ltd, Hong Kong.
China Light & Power - Annual Report, China Light & Power Group, Hong Kong, several editions up to 2016.
China Light & Power – Facility Performance Statistics, China Light & Power Group, Hong Kong, several editions up to 2016.
Hong Kong Monthly Digest of Statistics, Census and Statistics Department, Hong Kong, various editions to 1994.
Towngas - Annual Report, The Hong Kong and China Gas Company Ltd., Hong Kong, several editions up to 2013.
Sources for biofuels and waste:
Hong Kong Energy End-use Data, EMSD, The Electrical & Mechanical Services Department, Government of Hong Kong, several editions up to 2016.
The UN Energy Statistics Database.
Hong Kong Energy Statistics - Annual Report 2003.
IEA Secretariat estimates.
India
General notes
India joined the IEA as an Association country in March 2017.
Data are reported on a fiscal year basis. Data for 2015 correspond to 1 April 2015 – 30 March 2016.
144 - WORLD ENERGY BALANCES: DATABASE DOCUMENTATION (2017 edition)
INTERNATIONAL ENERGY AGENCY
Coal
In 2015, significant revisions of the net calorific values of the different types of coal were made for the whole time series, based on official data as well as IEA and other expert estimates. As a result, there have been significant changes for the coal data when presented in energy units, as well as in the calculated efficiency of coal fired power generation. Data on the production and consumption of secondary coal products may have also been revised as a result.
From 2008, due to a notable discrepancy between official coal imports from India and coal exports to India as reported by trade partners, imports of coking coal and non-coking coal are estimated by the IEA Secretariat, based on trade partners’ data. The breakdown of non-coking coal imports between bituminous coal and sub-bituminous coal is estimated from 2008. This could lead to breaks in time series between 2007 and 2008.
Coking coal figures for India do not align with IEA definitions as they include production of non-metallurgical coking coal reported by India. Figures may be revised in future editions to include only washed coking coal.
Due to data limitations, IEA Secretariat estimates are used for some products and flows, including supply and demand of coke oven gas and blast furnace gas. Coke oven coke production is estimated from 2006 based on growth of blast furnace iron production, as official production data do not include production from small private producers.
Oil
Information on stock changes of crude oil and oil products, available from the JODI database from April 2011, was added to the 2014 edition. Breaks in time series may appear in stock changes between 2010 and 2011. Based on data available by the Ministry of Petroleum and Gas, refinery intake is split between crude oil and refinery feedstocks from 1999. The refinery feedstocks reported by the IEA Secretariat correspond to the quantities officially reported as “other inputs” to Reliance Refineries. They do not include additives and refinery feedstocks to other Indian refineries. These missing inputs could reach up to 2.5 million tonnes.
Data for diesel consumption from 2008 are partially based on an official survey on the end use of diesel retail sales. The IEA Secretariat classifies the diesel used in mobile phone towers and non-industry power generators as input to autoproducer electricity generation. A corresponding electricity output is estimated.
No NGL production is officially reported by India. The NGL production estimated by the IEA Secretariat corresponds to the production of oil products from gas separation plants, known in India as “fractionators”. In the IEA methodology, the output of oil products from gas separation plants comes from an input of NGL and the separation process is shown in the transfer row. Prior to 2005-06, the split of fractionator output between petroleum products is estimated by the IEA Secretariat.
No breakdown of refinery fuel by products is currently officially available. In this edition, refinery gas production has been estimated based on expected refinery output for the years 2009-2015. In addition, refinery gas may also include other oil products used, such as residual fuel oil. Due to notable breaks in official data for fuel oil, consumption of fuel oil in international marine bunkers is estimated from 1990 based on industry sources, and final consumption of fuel oil is estimated from 2004 based on 2003 data.
Natural gas
Natural gas imports for India from 2008 are based on Indian Customs data, in order to include all LNG importers.
No data are officially available on the sectoral con-sumption of re-gasified LNG and city gas. The break-down is estimated by the IEA Secretariat.
Biofuels and waste
Due to data limitations, use of biogas produced in family biogas plants for cooking is currently not estimated by the IEA Secretariat. Data for biofuels production are based on USDA-estimates for the calendar year.
In 2015, estimates of the production and consumption of charcoal have been added for the whole time series, as well as the respective inputs of fuelwood to char-coal production plants.
Electricity and heat
Data for total electricity generation include estimates for electricity generation from diesel by non-industrial autoproducers as well as off-grid electricity gen-eration from renewable energy. In 2017, data on the electricity consumption by industrial sub-sector have been added for the year 2014. 2015 data have been estimated by the IEA Secretariat.
Only information on total on-grid generation from renewables is officially available. The breakdown between sources was estimated by the IEA Secretariat
WORLD ENERGY BALANCES: DATABASE DOCUMENTATION (2017 edition) - 145
INTERNATIONAL ENERGY AGENCY
from 2007 using official data on capacities from MNRE. Total off-grid generation and split by sources are estimated based on capacities from 2007 onward.
According to newly available information, estimates of solar thermal output up to 2012 may include systems that were out of operation. For this reason, a break in time series might occur between 2012 and 2013.
Sources
Sources 1992 to 2015:
Direct communication with the Central Statistical Office, Ministry of Statistics and Programme Implementation, Government of India, New Delhi.
Energy Statistics, Central Statistical Office, Min-istry of Statistics and Programme Implementation, New Delhi, various editions up to 2015-16.
Monthly Abstract of Statistics, Ministry of Planning, Central Statistics Organisation, Depart-ment of Statistics, New Delhi, various editions from 1984 to 2000.
Coal
Direct communication with the Coal Controller’s Office, Ministry of Coal, Government of India, Kolkata.
Coal Directory of India, Coal Controller's Office, Ministry of Coal, Kolkata, various editions up to 2015-2016.
Annual Review of Coal Statistics, Coal Controller's Office, Ministry of Coal, Kolkata, various editions from 1993-1994 to 1998-1999.
Oil and natural gas
Direct communication with the Economic Division and Petroleum Planning and Analysis Cell, Min-istry of Petroleum and Natural Gas, Government of India, New Delhi.
Indian Petroleum and Natural Gas Statistics, Ministry of Petroleum and Natural Gas, New Delhi, various editions from 2000-01 to 2015-16.
Petroleum and Natural Gas data, website of Petrol-eum Planning and Analysis Cell, Ministry of Petrol-eum and Natural Gas, New Delhi, www.ppac.org.
Annual Report 1993-1994, 1998-1999, Ministry of Petroleum and Natural Gas, New Delhi, 1995, 2000.
All India Study on Sectoral Demand of Diesel and Petrol, Petroleum Planning and Analysis Cell,
Ministry of Petroleum and Gas, New Delhi, January 2014.
Report of the Working Group on Fertilizer Industry for the Twelfth Plan (2012-12 to 2016-17), Department of Fertilizers, Ministry of Chemical & Fertilizers, Government of India, New Delhi, 2012.
“Vision 2030”, Natural Gas Infrastructure in India, Report by Industry Group for Petroleum & Natural Gas Regulatory Board, Petroleum & Natural Gas Regulatory Board, New Delhi, May 2013.
Report of the Inter-Ministerial Committee on Policy for Pooling of Natural Gas Prices and Pool Operating Guidelines, Planning Commission, Government of India, New Delhi, August 2011.
LNG imports, website of the Department of Commerce, Ministry of Commerce and Industry, New Delhi, http://commerce.nic.in/.
Commodity-wise traffic handled at major ports 2002-03 to 2012-13 (p), website of the Ministry of Shipping, New Delhi, shipping.nic.in.
Joint Oil Data Initiative (JODI) online database.
India – On the Move, World Bunkering, The Inter-national Bunker Industry Association, London, Spring 2012.
Biofuels and waste
Direct communication with the Ministry of New and Renewable Energy, Government of India, New Delhi.
Physical Targets and Achievements During the 11th Plan, Ministry of New and Renewable Energy, Open Government Data Platform India, data.gov.in, accessed 8.4.2014
Renewable Energy in India: Progress, Vision and Strategy, Ministry of New and Renewable Energy, 2010.
Annual Report 1994-1996, 1998-1999, Ministry of Energy, Department of Non-Conventional Energy, New Delhi, 1996 and 1999.
India – Biofuels Annual 2015, Gain Report, USDA Foreign Agriculture Service, New Delhi, January 2014.
Energy Data Directory, Yearbook "TEDDY", and Annual Report, The Energy and Resources Institute "TERI", New Delhi, 1994-2000, 2014-15.
India’s Energy Sector, July 1995, Center for Moni-toring Indian Economy PVT Ltd., Bombay, 1995.
146 - WORLD ENERGY BALANCES: DATABASE DOCUMENTATION (2017 edition)
INTERNATIONAL ENERGY AGENCY
Monthly Review of the Indian Economy, Center for Monitoring Indian Economy PVT Ltd., New Delhi, various issues from 1994 to June 1999.
The UN Energy Statistics Database.
Forestry Statistics, FAO,Rome, 2017.
IEA Secretariat estimates, based on a per capita average consumption from various surveys and direct communication with the former Ministry of Non-conventional Energy Sources.
Electricity and heat
Direct communication with the Central Electricity Authority, Ministry of Power, Government of India, New Delhi.
Growth of Electricity Sector in India from 1947-2016, Central Electricity Authority, Ministry of Power, New Delhi, May 2016.
All India Electricity Statistics General Review 19999, to 2016, Central Electricity Authority, Ministry of Power, New Delhi.
Monthly Generation Review, March 2016, Central Electricity Authority, Ministry of Power, New Delhi, 2016.
Annual Survey of Industries Volume-I 2008-2009 to 2014-15. Ministry of Statistics and Programme Implementation, Central Statistics Office, Kolkata.
Direct communication with the Ministry of New and Renewable Energy, Government of India, New Delhi.
Physical Targets and Achievements During the 11th Plan, Ministry of New and Renewable Energy, Open Government Data Platform India, data.gov.in, accessed 8.4.2014.
Renewable Energy in India: Progress, Vision and Strategy, Ministry of New and Renewable Energy, 2010.
Solar Water Heaters in India: Market Assessment studies and surveys for different sectors and de-mand segments, report by GreenTech Knowledge Solutions, submitted to Project Management Unit, Global Solar Water Heating Project, Ministry of New and Renewable Energy, January 2010.
Solar Heat Worldwide, AEE - Institute for Sus-tainable Technologies, Gleisdorf, various editions up to 2017.
Sources up to 1991:
Indian Oil Corporation Limited 1987-88 Annual Report, Indian Oil Corporation Limited, New Delhi, 1989-1992.
Report 1986-87, Ministry of Energy, Department of Coal, New Delhi, 1981 to 1987.
Annual Report 1986-1987, Ministry of Energy, Department of Non-Conventional Energy, New Delhi, 1987.
Economic Survey, Ministry of Finance, New Delhi, various editions from 1975 to 1986.
Statistical Outline of India, Ministry of Finance, New Delhi, 1983, 1984, 1986, 1987.
Monthly Coal Bulletin, vol xxxvi no.2., Ministry of Labour, Directorate General of Mines Safety, New Delhi, February 1986.
General Review, Public Electricity Supply, India Statistics, Central Electricity Authority, New Delhi, 1982 to 1985.
Energy Data Directory, Yearbook “TEDDY”, and Annual Report, The Energy and Resources Institute “TERI”, New Delhi, 1986-1988, 1990.
Indonesia
General notes
Indonesia joined the IEA as an Association country in November 2015.
For 2012-2015 coal exports data from BPS are used. This results in breaks in time series for 2011-2012.
Non-specified industry consumption is re-estimated by the IEA Secretariat.
The production and allocation of coal among the various coal types and products between 2000 and 2015 are estimated by the IEA Secretariat due to data collection limitations.
In 2015, data reported for coal consumption in pulp and paper industry might also include coal consumed in the textile and fertilizers sectors. This may create breaks in time series.
Electricity consumption for the agricultural sector is estimated by the IEA Secretariat for 2000-2015. This may lead to breaks in time series between 1999-2000.
Sources
Sources 2008 to 2015:
Direct communication with the Data Centre and Information Technology (PUSDATIN), Ministry of Energy and Mineral Resources, Jakarta.
Handbook of Energy & Economic Statistics of Indonesia, PUSDATIN, Ministry of Energy and
WORLD ENERGY BALANCES: DATABASE DOCUMENTATION (2017 edition) - 147
INTERNATIONAL ENERGY AGENCY
Mineral Resources (ESDM), Jakarta, various editions up to 2016.
Statistik, Minyak & Gas Bumi, Directorate General of Oil and Gas, Ministry of Energy and Mineral Resources (ESDM), Jakarta, various editions up to 2016.
Trade data on coal, charcoal for 1999-2015, website of the Central Bureau of Statistics of the Republic of Indonesia (BPS).
Irrigation management to increase agriculture production. Ministry of Agriculture Republic of Indonesia, Jakarta, 2012.
PLN Statistics, PT.PLN (Persero), Jakarta, various editions up to 2016.
Direct communication with PT PLN (Persero), Jakarta.
Direct communication with the Indonesia Coal Mining Association, Jakarta.
IEA Secretariat estimates.
Sources 1992 to 2007:
Indonesia Mineral and Coal Statistics, Directorate of Coal and Mineral Resources, Jakarta, 1998 to 2007.
Statistics on Electricity and Energy, 1998 to 2004, Directorate General of Electricity and Energy Utilisation, Jakarta, 1999 to 2005.
Oil and Gas Statistics of Indonesia, Directorate General Oil and Gas, Jakarta, various editions 1981 to 2007.
The Petroleum Report Indonesia, various editions, U.S. Embassy in Jakarta, Jakarta, 1986 to 2008.
Oil and Gas Data Information, 6th Edition, Directorate General Oil and Gas, Jakarta, 2002.
Statistik Perminyakan Indonesia 1995 to 1999, Indonesia Oil and Gas Statistics, Directorate General of Oil and Gas, Jakarta, 2001.
Neraca energy 2000, Energy Balance of Indonesia 2000, Asean Center for Energy.
Mining and Energy Yearbook, 1998, Ministry of Mines and Energy, Jakarta, 1998.
APEC annual energy statistics questionnaires.
Direct communication with Directorate General of Coal and Mineral Resources, Directorate General Oil and Gas, and Directorate General of Electricity and Energy Utilisation of the Ministry of Energy and Mineral Resources.
Direct communication with the Indonesian Institute for Energy Economics, 2004 and 2005.
Direct communication with the ASEAN Centre for Energy, 2005.
Sources up to 1991:
Indonesian Financial Statistics, Bank of Indonesia, Jakarta, 1982.
Indikator Ekonomi 1980-1985, Biro Pusat Statistik, Jakarta, 1986.
Statistical Yearbook of Indonesia, Biro Pusat Statistik, Jakarta, 1978 to 1984 and 1992.
Statistik Pertambangan Umum, 1973-1985, Biro Pusat Statistik, Jakarta, 1986.
Energy Planning for Development in Indonesia, Directorate General for Power, Ministry of Mines and Energy, Jakarta, 1981.
Commercial Information, Electric Power Corpor-ation, Perusahaan Umum Listrik Negara, Jakarta, 1984, 1985.
Sources for Biofuels and waste:
GAIN Report - Indonesia biofuels Annual, United States Department of Agriculture, various editions up to 2015.
The UN Energy Statistics Database and IEA Sec-retariat estimates.
Direct communication with Indonesian Biofuel Producer Association (APROBI), Jakarta.
Islamic Republic of Iran
General notes
Data are reported according to the Iranian calendar year. Data for 2015 correspond to 20 March 2015 – 19 March 2016, which is Iranian year 1394.
Crude oil production and export data do not include field condensate. Field condensate quantities are included with natural gas liquids.
Statistical differences in the Islamic Republic of Iran statistics and balances can include stock change for some coal and oil products.
More detailed information for the consumption of coke oven coke became available for 2009-2012. Breaks in time series may occur between 2008 and 2009.
Sources
Sources 1999 to 2015:
Direct communication with the Ministry of Energy, Teheran.
148 - WORLD ENERGY BALANCES: DATABASE DOCUMENTATION (2017 edition)
INTERNATIONAL ENERGY AGENCY
Energy Balance of Iran, Department of Energy, Teheran, various editions up to the Iranian year 1393, Teheran.
Statistical Report on 49 Years of Activities of Iran Electric Power Industry (1967-2015), Tavanir Holding Company, Tehran, 2016.
Annual Statistical Bulletin, Organization of Petrol-eum Exporting Countries (OPEC), Vienna, various editions up to 2016.
Natural Gas in the World, Cedigaz, Paris, various editions up to 2016.
World Development Indicators, The World Bank, Washington, various editions up to 2015.
IEA Secretariat estimates.
Sources 1992 to 1998:
Direct communication with the Ministry of Energy, Office of Deputy Minister for Energy, Teheran, 1998.
Direct communication with the Ministry of Petrol-eum, Teheran, 1999.
Electric Power in Iran, Ministry of Energy, Power Planning Bureau, Statistics Section, Teheran, 1992.
Sources up to 1991:
Electric Power in Iran, Ministry of Energy, Power Planning Bureau, Statistics Section, Teheran, 1967 to 1977, 1988, 1990, 1991.
Ministry of Energy, Office of Deputy Minister for Energy, Teheran, 1971 to 1991.
Sources for biofuels and waste:
The UN Energy Statistics Database; Forestry Statistics, FAO, Rome, 2000.
IEA Secretariat estimates.
Direct communication with the Ministry of Energy, Teheran.
Iraq
General notes
New data for electricity generation became available for 2010-2013. Breaks in time series may occur between 2009 and 2010.
Destruction of Iraq’s largest refinery occurred in 2015, resulting in large decreases in oil products output in 2015.
Crude oil production and export data do not include field condensate. Field condensate quantities are included with natural gas liquids.
Crude oil export data include back-blending of fuel oil.
Sources
Sources 1998 to 2015:
Direct communication with the Ministry of Electricity.
Reconciliation Report, Extractive Industries Transparency Initiative (EITI) for Iraq, various editions up to 2015.
Direct communication with the Ministry of Oil..
Direct communication with the Ministry of Planning and Development Cooperation and with the Central Organization for Statistics and Infor-mation Technology.
Online Statistics, Iraq Ministry of Oil.
Annual Statistical Bulletin, Organization of Petroleum Exporting Countries (OPEC), Vienna, various editions up to 2016.
Annual Statistical Report, Organization of Arab Petroleum Exporting Countries (OAPEC), Kuwait, various editions up to 2016.
Joint Oil Data Initiative (JODI) online database.
Statistical Bulletin, Arab Union of Producers, Transporters and Distributors of Electricity (AUPTDE), Amman, various editions up to 2015.
Oil Production, Export, and Consumption Report, Ministry of Natural Resources Kurdistan Regional Government, various editions up to 2015.
Iraq Weekly Status Report, US Department of State, 2003 to 2004.
IEA Secretariat estimates.
Sources up to 1997:
The UN Energy Statistics Database.
IEA Secretariat estimates.
Jamaica
General notes
In 2016 edition new information became available on industrial consumption of oil products and electricity. This may lead to breaks in time series between 2007 and 2008 data as well as differences with previous editions.
WORLD ENERGY BALANCES: DATABASE DOCUMENTATION (2017 edition) - 149
INTERNATIONAL ENERGY AGENCY
Sources
Sources 2007 to 2015:
Energy-Economic Information System (SIEE), Latin American Energy Organization (OLADE), Quito, accessed May 2017: http://sier.olade.org/.
National energy balance & various statistics, Ministry of Science, Technology, Energy and Mining of Jamaica, Kingston, 2012-2015.
Annual report, Jamaica Public Service Company, Kingston, 2012-2015.
Petroleum Industry Consumption Statistics Jamaica 2003-2008, Petroleum Corporation of Jamaica, Kingston.
Import Statistics 2006-2007, Petrojam limited, Kingston
Direct communication with the Office of Utilities Regulation, Kingston, 2008.
IEA Secretariat estimates.
Sources 1991 to 2006:
Energy-Economic Information System (SIEE), Latin American Energy Organization (OLADE), Quito, http://sier.olade.org/.
IEA Secretariat estimates.
Sources up to 1990:
National Energy Outlook 1985-1989, Petroleum Corporation of Jamaica, Economics and Planning Division, Kingston, 1985.
Energy and Economic Review, Petroleum Corp-oration of Jamaica, Energy Economics Department, Kingston, September 1986, December 1986 and March 1987.
Production Statistics 1988, Planning Institute of Jamaica, Kingston, 1989.
Statistical Digest, Research and Development Division, Bank of Jamaica, Kingston, 1984, 1985, 1986, 1989, 1990.
Jordan
General notes
Due to an attack on a major natural gas pipeline between Egypt and Jordan during the 2011 revolution in Egypt, Jordan relied much more on fuel oil and diesel for power generation between 2011 and 2014.
Jordan started importing coal products in 2012.
Sources
Sources 2005 to 2015:
Direct communication with the Ministry of Energy and Mineral Resources, Amman.
Annual Report, National Electric Power Company, Amman, various editions up to 2016.
IEA Secretariat estimates.
Sources 1992 to 2004:
Direct communication with the National Electric Power Company, Amman.
Annual Report, National Electric Power Company, Amman, 1996, 1997, 1999 to 2004.
Annual Report 1992, 1993, Jordan Electricity Authority, Amman, 1993, 1994.
Energy and Electricity in Jordan 1992, 1993, 1994, 1995, Jordan Electricity Authority, Amman, 1993 to 1996.
Statistical Yearbook, 1994, Department of Statistics, Amman, 1995.
44th Annual Report for the year ending 31 December 1999, Jordan Petroleum Refinery Company, Amman, 2000.
IEA Secretariat estimates.
Sources up to 1991:
Monthly Statistical Bulletin, Central Bank of Jordan, Department of Research Studies, Amman, various issues.
Statistical Yearbook, Department of Statistics, Amman, 1985, 1986 and 1988.
1986 Annual Report, Ministry of Energy and Mineral Resources, Amman, 1987.
1989 Annual Report, Ministry of Energy and Mineral Resources, Amman, 1990.
Sources for biofuels and waste:
Forestry Statistics, FAO, Rome, 2000.
IEA Secretariat estimates.
Kazakhstan
General notes
Data for Kazakhstan are available starting in 1990. Prior to that, they are included in Former Soviet Union.
Kazakhstan is one of the 11 EU4Energy focus countries.
150 - WORLD ENERGY BALANCES: DATABASE DOCUMENTATION (2017 edition)
INTERNATIONAL ENERGY AGENCY
In 2016, the Committee on Statistics of Kazakhstan introduced changes in the forms used to collect energy data to align more closely with the International Recommendations for Energy Statistics. In order to reduce burden on enterprises, questions on supply were removed and supply data are now taken from administrative sources. As a consequence, breaks in the time series appear for many product and flows, both for supply and demand between 2014 and 2015 data. Revisions are to be expected as data for additional years become available in the new format.
From 2012 onwards, as a result of important work carried out jointly by the Committee on Statistics and the Ministry of National Economy of the Republic of Kazakhstan, the IEA Secretariat was able to switch to the Joint IEA/Eurostat/UNECE questionnaires as a primary source for Kazakhstan’s data. Breaks in time series appear between 2011 and 2012 as a result of this change.
In 2010, Kazakhstan became a member of a Customs Union with Russia and Belarus. Breaks in trade time series appear from 2009 to 2012 as the Customs shifted from one accounting system to another.
Kazakhstan’s coal data are normally not disaggre-gated by coal type. The disaggregation presented in the IEA energy balances is achieved by considering the typical end uses for different types of coals. This may lead to large statistical differences for some types of coal.
Natural gas production excludes re-injection but, due to data limitations, may include gas vented or flared. As a consequence, the data for natural gas use in oil and gas extraction may also include these amounts.
In order to be consistent with the Customs Union agreements between Russia and Kazakhstan, natural gas production and exports data include raw gas pro-duction from the Karachaganak field (not marketable gas as per IEA definition).
Natural gas trade data have been revised by Kazakhstan leading to large statistical differences for 2012 and 2013.
Sources
Sources 2012 to 2015:
Direct communication with the Committee on Statistics of the Ministry of National Economy (formerly: Agency on Statistics) of the Republic of Kazakhstan, Astana.
Joint IEA/Eurostat/UNECE annual energy questionnaires.
IEA Secretariat estimates.
Sources 1993 to 2011:
Direct communication with the Agency on Statistics of the Republic of Kazakhstan, Astana.
Fuel and Energy Balance of Kazakhstan Republic, Agency on Statistics of the Republic of Kazakhstan, Astana, various editions up to 2010.
Joint IEA/Eurostat/UNECE annual energy ques-tionnaires, 1993, 1995, 1997 to 2009.
Statistical Yearbook “Kazakhstan in 2009”, Agency on Statistics of the Republic of Kazakhstan, Astana, 2010.
IEA Secretariat estimates.
Sources 1990 to 1992:
IEA Secretariat estimates.
Sources for biofuels and waste:
Fuel and Energy Balance of Kazakhstan Republic, Agency on Statistics of the Republic of Kazakhstan, Astana, various editions up to 2010.
Forestry Statistics, FAO, Rome, 2000.
IEA Secretariat estimates.
Kenya
General notes
As of 2001, electricity data are reported on a fiscal year basis, beginning on 1 July and ending on 30 June of the subsequent year.
In 2014, the Olkaria geothermal plant came online, significantly increasing the country’s geothermal elec-tricity production capacity. Breaks in time series can be observed between 2013-2014 in electricity output from geothermal energy.
Stock changes for lubricants may include informal trade.
Sources
Sources 2005 to 2015:
Economic Survey, Central Bureau of Statistics, Nairobi, various editions up to 2016.
Annual Report and Financial Statements, Kenya Power, various editions up to 2016.
WORLD ENERGY BALANCES: DATABASE DOCUMENTATION (2017 edition) - 151
INTERNATIONAL ENERGY AGENCY
Direct communication with AFREPREN and Petroleum Institute of East Africa, Nairobi, up to 2008.
Kenya, Facts and figures, 2006 Edition, Central Bureau of Statistics, Nairobi.
Annual Report and Accounts, 2006/07 to 2013/14 the Kenya Power & Lighting Company Limited, Nairobi.
IEA Secretariat estimates.
Sources 1992 to 2004:
Direct communication with the Ministry of Energy, Nairobi.
Economic Survey, 1995 to 2004, Central Bureau of Statistics, Nairobi.
Annual Report and Accounts, 2001/02, 2002/03, 2003/2004, 2004, 2005, the Kenya Power & Lighting Company Limited, Nairobi.
The UN Energy Statistics Database.
Sources up to 1991:
Economic Survey, Government of Kenya, Nairobi, 1989.
Economic Survey 1991, Ministry of Planning and National Development, Central Bureau of Statis-tics, Nairobi, 1992.
Kenya Statistical Digest, Ministry of Planning and National Development, Central Bureau of Statis-tics, Nairobi, 1988.
Sources for biofuels and waste:
Data for 2000 are based on research carried out by the Ministry of Energy on consumption of solid biofuels. The results of this research were published as part of a National Energy Policy initiative.
IEA Secretariat estimates based on 1991 data from Forests and Biomass Sub-sector in Africa, African Energy Programme of the African Development Bank, Abidjan, 1996.
Kosovo
General notes
Data for Kosovo are available starting in 2000. Prior to that, they are included in Serbia.
2011 is the first year when electricity transit trade data are available. As a result, a break in time series occurs between 2010 and 2011.
In 2011, a desulphurization unit operated in Kosovo for a few months only. As a result, breaks in time series occur between 2010-2011 and 2011-2012.
Sources
Sources 2011to 2015:
Direct communication with the Kosovo Agency of Statistics, Pristina, Kosovo.
Direct communication with the Ministry of Energy and Mining, Pristina, Kosovo.
Joint IEA/Eurostat/UNECE annual energy questionnaires.
Sources 2003 to 2010:
Kosovo National Energy Balances, Ministry of Energy and Mining Department of Strategy, Standards and Statistics from 2003 to 2010.
IEA Secretariat estimates
Sources 2000 to 2002:
IEA Secretariat estimates.
Kuwait
General notes
Crude oil production and export data do not include field condensate. Field condensate quantities are included with natural gas liquids.
Data for crude oil production include 50 per cent of the output of the Neutral Zone shared with Saudi Arabia.
Information for the use of ethane in the petrochemical sector is available from 2008 onward. This may lead to breaks in time series for ethane and naphtha production and consumption between 2007 and 2008.
Sources
Sources 1992 to 2015:
Statistical Bulletin, Arab Union of Producers, Transporters and Distributors of Electricity (AUPTDE), Amman, 2011 to 2016.
Direct communication with the Ministry of Oil, Economic Affairs, Energy Research, Safat.
Direct communication with Central Statistical Bureau, Kuwait City.
152 - WORLD ENERGY BALANCES: DATABASE DOCUMENTATION (2017 edition)
INTERNATIONAL ENERGY AGENCY
Electrical Energy Statistical Year Book, Ministry of Electricity and Water, edition 2016.
Annual Report, Kuwait National Petroleum Company, 2015-2016
Annual Electrical Statistics, Ministry of Electricity and Water, Safat, various editions up to 2009.
Annual Statistical Abstract, Central Statistical Bureau, State of Kuwait various editions up to 2014.
Annual Statistical Bulletin, Organization of Petrol-eum Exporting Countries (OPEC), Vienna, various editions up to 2016.
Annual Statistical Report, Organization of Arab Petroleum Exporting Countries (OAPEC), Kuwait, various editions up to 2016.
Direct communication with the Ministry of Planning and the Ministry of Electricity & Water, Kuwait City.
Monthly Digest of Statistics, Ministry of Planning, Central Statistical Office, Kuwait, 1999.
A Survey of the Kuwait Oil Industry, Embassy of the United States of America in Kuwait City, Kuwait, 1993.
Twelfth Annual Report 1991-1992, Kuwait Petrol-eum Corporation, Kuwait, 1993.
The UN Energy Statistics Database.
IEA Secretariat estimates.
Sources up to 1991:
Quarterly Statistical Bulletin, Central Bank of Kuwait, Kuwait, various editions from 1986 and 1987.
The Kuwaiti Economy, Central Bank of Kuwait, Kuwait, various editions from 1980 to 1985.
Annual Statistical Abstract, Ministry of Planning, Central Statistical Office, Kuwait, 1986 and 1989.
Monthly Digest of Statistics, Ministry of Planning, Central Statistical Office, Kuwait, various editions from 1986 to 1990.
Economic and Financial Bulletin Monthly, Central Bank of Kuwait, Kuwait, various editions from 1983 to 1986.
Kuwait in Figures, The National Bank of Kuwait, Kuwait, 1986, 1987.
Sources for Biofuels and waste:
Forestry Statistics, FAO, Rome, 2001.
IEA Secretariat estimates.
Kyrgyzstan
General notes
Data for Kyrgyzstan are available starting in 1990. Prior to that, they are included in Former Soviet Union.
Kyrgyzstan is one of the 11 EU4Energy focus countries.
From the year 2013, the main data sources for Kyrgyzstan are the set of annual IEA/Eurostat/UNECE joint questionnaires sent by the National Statistical Committee of Kyrgyzstan.
The following data are not available and estimated by the IEA Secretariat: biofuels and waste, and output of electricity and heat by product.
For the year 2015, new information became available on the consumption of motorgasoline and gas/diesel by product. All motorgasoline use was allocated by the IEA to road transport. Gas/diesel consumption reported in other sector than road might include road transport.
In the 2014 edition, time series data for electricity, oil products, and coal products for 2005 to 2011 were revised based on newly available information. This may lead to breaks in the time for some products.
Sources
Sources 2013 to 2015:
Direct communication with the National Statistical Committee of Kyrgyzstan, Bishkek.
Joint IEA/Eurostat/UNECE annual energy ques-tionnaires, excluding renewables.
Fuel & Energy Balances, National Statistical Committee of Kyrgyzstan, Bishkek.
IEA Secretariat estimates.
Sources 2007 to 2012:
Direct communication with the National Statistical Committee of Kyrgyzstan, Bishkek.
Direct communication with the Interstate Statis-tical Committee of the Commonwealth of Independent States, Moscow.
Joint IEA/Eurostat/UNECE annual energy ques-tionnaires for 2012 and 2013.
Fuel & Energy Balances, National Statistical Committee of Kyrgyzstan, Bishkek.
CIS and East European Energy Databook, Eastern Bloc Research Ltd, Tolsta Chaolais, 2008 to 2014.
WORLD ENERGY BALANCES: DATABASE DOCUMENTATION (2017 edition) - 153
INTERNATIONAL ENERGY AGENCY
Natural Gas Vehicles Statistics, International Association for Natural Gas Vehicles, online data-base: www.iangv.org.
The UN Energy Statistics Database.
IEA Secretariat estimates.
Sources 1993 to 2006:
Joint IEA/Eurostat/UNECE annual energy ques-tionnaires, 1993 to 2006.
CIS and East European Energy Databook, Eastern Bloc Research Ltd, Tolsta Chaolais, various editions up to 2007.
Asian Development Bank.
IEA Secretariat estimates.
Sources 1990 to 1992:
IEA Secretariat estimates.
Sources for biofuels and waste:
The UN Energy Statistics Database.
IEA Secretariat estimates.
Latvia
General notes
Data for Latvia are available starting in 1990. Prior to that, they are included in Former Soviet Union.
On 1 July 2016, Latvia became a full member of the OECD.
Sources
Sources 1990 to 2015:
Direct communication with Statistics Latvia, Riga.
Joint IEA/Eurostat/UNECE annual energy questionnaires.
Balance of Latvian Energy, EC PHARE Project Implementation Unit, Ministry of Economics, Department of Energy, Riga, 1994.
IEA Secretariat estimates.
Lebanon
General notes
In 2015, no official data were available for Lebanon. Data in this year’s edition are primarily based on secondary sources, media reports and IEA Secretariat estimates.
A significant share of electricity generated in Lebanon is produced using private generators. The corres-ponding electricity outputs and inputs were estimated by the IEA Secretariat based on ALMEE-figures (Association Libanaise pour la Maîtrise de l’Energie et l’Environnement) until 2014.
Customs data for trade of oil products may be misleading due to the existence of informal trade with neighbouring countries.
Sources
Sources up to 2015:
Direct communication with Association Libanaise pour la Maîtrise de l’Energie et l’Environnement, (ALMEE), Beirut.
Direct communication with Lebanese Center for Energy Conservation, Beirut.
Les bilans énergétiques au Liban, Association Libanaise pour la Maîtrise de l’Energie et de l’En-vironnement, Beirut, 2007 to 2015.
L’Energie au Liban, Association Libanaise pour la Maîtrise de l’Energie et de l’Environnement, Beirut, 1994 to 2006.
L’Energie au Liban, le Défi, Association Libanaise pour la Maîtrise de l’Energie, Beirut, December 1996.
Mauthner, F. and Weiss W., Solar Heat World-wide - Markets and contribution to the energy supply, various editions up to 2014, IEA Solar Heating and Cooling Programme.
IEA Secretariat estimates.
Sources for biofuels and waste:
Le marché du solaire thermique au Liban, Associ-ation Libanaise pour la Maîtrise de l’Energie et de l’Environnement, Beirut, 2010.
Forestry Statistics, FAO, Rome, 2016.
IEA Secretariat estimates.
Libya
General notes
Crude oil production and export data do not include field condensate. Field condensate quantities are included with natural gas liquids.
New information on oil and electricity is available from 2006. Breaks in time series may occur between 2005 and 2006.
154 - WORLD ENERGY BALANCES: DATABASE DOCUMENTATION (2017 edition)
INTERNATIONAL ENERGY AGENCY
Non-technical losses and data uncertainty result in break in time series for electricity losses between 2011 and 2012.
Sources
Sources 1971 to 2015:
Bulletin Statistique Annuel, Comite Maghrebin d’élec-tricité (COMELEC), various editions up to 2014.
Statistical Bulletin, Central Bank of Libya,Tripoli, various editions up to 2016.
Direct communication with the Ministry of Electricity and Renewable Energy, Tripoli.
Annual Statistical Bulletin, Organization of Petroleum Exporting Countries (OPEC), Vienna, various editions up to 2015.
Annual Statistical Report, Organization of Arab Petroleum Exporting Countries (OAPEC), Kuwait, various editions up to 2015.
Natural Gas in the World, Cedigaz, Paris, various editions up to 2016.
Statistical Bulletin, Arab Union of Producers, Transporters and Distributors of Electricity (AUPTDE), Amman, various editions up to 2015.
Annual Report, 2008, General Electricity Company (GECOL), Tripoli.
Statistical Abstract of Libya, 19th vol., Govern-ment of Libya, Tripoli, 1983.
IEA Secretariat estimates.
Sources for biofuels and waste:
The UN Energy Statistics Database.
IEA Secretariat estimates.
Lithuania
General notes
Data for Lithuania are available starting in 1990. Prior to that, they are included in Former Soviet Union.
Lithuania shut down its only nuclear power plant in 2009 (Ignalina nuclear power plant).
In 2013 Lithuania started an industrial and municipal waste incinerator, which may lead to breaks in time series for these products.
Since December 2014, Lithuania has a new floating LNG terminal. LNG is imported, re-gasified and exported as pipeline gas.
Sources up to 2015:
Direct communication with Statistics Lithuania, Vilnius.
Joint IEA/Eurostat/UNECE annual energy questionnaires.
Malaysia
General notes
For natural gas production from the Joint-Develo-pment Areas (JDA) with Thailand and with Indonesia, Malaysia reports only the production that corresponds to Malaysia. The rest is being reported as imports. For the JDA with Viet Nam, the production reported includes all the gas produced.
Detailed information on the non-energy use by oil product is only available from 2007 to 2009. From 2010, these quantities are only presented in aggregate form under the category other non-specified oil products.
From 2009, electricity generation from co-generators, small renewable power producers and self-generators is available. As a consequence, breaks in time series may appear for electricity between 2008 and 2009.
LPG data may include ethane.
Sources
Sources 2000 to 2015:
Direct communication with the Energy Comm-ission, Putrajaya.
National Energy Balance, Malaysia, Energy Commission, Putrajaya, 2009 to 2015.
Electricity Supply Industry in Malaysia, Perfor-mance and Statistical Information, Malaysia Energy Commission, Putrajaya, 2009 to 2015.
Electricity Supply Statistics, Malaysia Energy Information Hub, website: meih.st.gov.my, 2017.
Monthly exports of oil palm products, Malaysia Palm Oil Board, Kuala Lumpur.
APEC annual energy questionnaires, 2009, 2011.
National Energy Balance Malaysia, Ministry of Energy, Water and Communication, Kuala Lumpur, 2002 to 2008.
Sources up to 2000:
Direct communication with Petroliam Nacional Berhad, Kuala Lumpur, April 2001.
WORLD ENERGY BALANCES: DATABASE DOCUMENTATION (2017 edition) - 155
INTERNATIONAL ENERGY AGENCY
Sources for biofuels and waste:
Monthly exports of oil palm products, Malaysia Palm Oil Board, Kuala Lumpur.
The UN Energy Statistics Database.
Forestry Statistics, FAO, Rome, 2016.
IEA Secretariat estimates.
Malta
General notes
2015 saw a sharp decrease in electricity production, and fuel oil and gas diesel consumption coming from the transformation sector (main activity electricity producers). This decrease is attributed to a main power station being switched off. The oil output decrease is mirrored in a reduction in electricity generated in Malta, and an increase in imports, mainly from Italy via an interconnector.
In 2011, a new power generation station fuelled by biogas became operational in Malta. This may lead to breaks in time series for some products and flows.
Sources
Sources 1971 to 2015:
Direct communication with the Central Office of Statistics, Valletta.
Joint IEA/Eurostat/UNECE annual energy ques-tionnaire on Oil, 1995 to 1998, 2000, 2001, 2005 to 2015.
Joint IEA/Eurostat/UNECE annual energy ques-tionnaire on Electricity and heat, 1994 to 1998, 2000, 2001, 2003, and 2005 to 2015.
Joint IEA/Eurostat/UNECE annual energy ques-tionnaire on Renewables, 2011 to 2015.
Joint IEA/Eurostat/UNECE annual questionnaire on Coal, 1994, 1995.
Solar Heat Worldwide, AEE - Institute for Sus-tainable Technologies, Gleisdorf, various editions up to 2010.
IEA Secretariat estimates.
Mauritius
Sources
Sources 1971 to 2015:
Direct communication with the Ministry of Public Utilities, Statistics Unit, Port Louis.
Website of the Statistics Mauritius under the Ministry of Public Utilities, statsmauritius.gov.mu.
Energy and Water Statistics, various editions up to 2015, Statistics Mauritius, Port Louis.
Moldova
General notes
Data for Moldova are available starting in 1990. Prior to that, they are included in Former Soviet Union.
Moldova is one of the 11 EU4Energy focus countries.
Official figures on natural gas imports, natural gas inputs to power plants, electricity production and consumption are modified by the IEA Secretariat to include estimates for supply and demand for the autonomous region of Stînga Nistrului (also known as the Pridnestrovian Moldavian Republic or Transnistria). Other energy production or consumption from this region is not included in the Moldovan data. This may lead to breaks in the time series for some products.
Due to the inclusion of estimated data in the Moldova energy balance, indicators for per capita energy con-sumption or energy intensity may appear inconsistent with expected trends.
The National Bureau of Statistics is constantly improving its data set. In the recent years, a great effort has been put to follow the International Recommendations for Energy Statistics and revise time series when possible. As a consequence, breaks in time series in 1993 for heat, in 2012 for aviation bunkers and in 2005 for other products. More survey data on solid biomass, including wood, animal waste and other plant residues are available since 2010.
Sources
Sources 2008 to 2015:
For Moldova, excluding Transnistria:
Direct communication with the National Bureau of Statistics of the Republic of Moldova, Chisinau.
Joint IEA/Eurostat/UNECE annual energy questionnaires.
For natural gas imports:
Direct communication with State Statistics Service of Ukraine.
156 - WORLD ENERGY BALANCES: DATABASE DOCUMENTATION (2017 edition)
INTERNATIONAL ENERGY AGENCY
For Transnistria electricity production:
Website of Ministry of Economic Development of Transnistrian Moldovian Republic, www.mepmr.org.
IEA Secretariat estimates.
Sources 1992 to 2008:
Joint IEA/Eurostat/UNECE annual energy ques-tionnaire on Electricity and heat, 1991 to 2008.
Joint IEA/Eurostat/UNECE annual energy ques-tionnaire on Natural gas, 1991 to 2008.
Joint IEA/Eurostat/UNECE annual energy ques-tionnaire on Coal, 1992 to 2008.
Joint IEA/Eurostat/UNECE annual energy ques-tionnaire on Oil, 1993 to 1998, 2001 to 2008.
Direct communication with the Ministry of Industry and Energy, July 1992.
CIS and East European Energy Databook, Eastern Bloc Research Ltd, Tolsta Chaolais, various editions up to 2011.
IEA Secretariat estimates.
Sources 1990 to 1991:
IEA Secretariat estimates.
Sources for biofuels and waste:
Joint IEA/Eurostat/UNECE Renewables questionnaire.
The UN Energy Statistics Database.
IEA Secretariat estimates.
Mongolia
General notes
Data for Mongolia are available starting in 1985. Prior to that, they are included in Other Asia.
Data allowing a disaggregation of coal by type became available in 2015. In addition time series were revised from 2005 forward. Breaks in time series between 2004 and 2005 may result as well as differences in trends from previous editions.
Sources
Sources 1985 to 2015:
Mongolian Statistical Yearbook, National Statistical Office, Ulaanbaatar, various editions up to 2016.
Balance of Coal & Coal Exports, Mongolian Statis-tical Information Service, National Statistical Office, Ulaanbaatar, online statistical service: www.1212.mn.
Mongolian Statistical Bulletin, December 2009, National Statistical Office, Ulaanbaatar, 2009.
Asian Development Bank online database.
IEA Secretariat estimates.
Sources for biofuels and waste:
FAO, Forestry Statistics, online database.
IEA Secretariat estimates.
Montenegro
General notes
Data for Montenegro are available starting in 2005. Between 1990 and 2004, they are included in Serbia. Prior to 1990, they are included in Former Yugoslavia.
Breaks in time series appearing in solid biofuels between 2010 and 2011 can be explained by a new survey carried out by Montenegro in 2013.
A new survey on energy consumption in industry was conducted by Montenegro in 2014. Due to this newly available data some breaks in time series may occur between 2004 and 2005.
Sources
Sources 2005 to 2015:
Direct communication with the Statistical Office of Montenegro (MONSTAT), Podgorica.
Joint IEA/Eurostat/UNECE annual energy questionnaires.
Morocco
General notes
Morocco joined the IEA as an Association country in November 2016.
In this edition, Morocco started filling the five Joint IEA/Eurostat/UNECE questionnaires. This may lead to breaks in time series between 2014 and 2015.
In the previous edition, revisions were made in the energy balances for the period 2004-2014. This may lead to breaks in time series between 2003 and 2004.
The Samir-Mohammedia refinery expansion was completed in 2009, accommodating new feedstocks and additives. This may lead to breaks in time series between 2009 and 2010.
WORLD ENERGY BALANCES: DATABASE DOCUMENTATION (2017 edition) - 157
INTERNATIONAL ENERGY AGENCY
In August 2015, refinery activity stopped, causing significant decreases in refined oil products production and breaks in time series between 2014 and 2015.
Sources
Sources for 2015 :
Joint IEA/Eurostat/UNECE annual energy questionnaires.
Sources 1992 to 2014:
Direct communication with Ministère de l'Energie et des Mines, Direction des Mines, Rabat.
Annuaire Statistique du Maroc, Haut-Comm-issariat au Plan, Direction de la Statistique, Rabat, 1980, 1984, 1986 to 2011.
Electricity consumption by economic sector from direct communication with Office National de l’Electricité, Casablanca.
Sources up to 1991:
Rapport d'Activité 1992, Office National de l'Elec-tricité, Casablanca, 1993.
Le Maroc en Chiffres 1986, Ministère du Plan, Direction de la Statistique, Rabat, 1987.
Rapport Annuel, Office National de Recherches et d'Exploitations Pétrolières, Maroc, 1984.
Rapport d'Activité du Secteur Pétrolier 1983, Ministère de l'Energie et des Mines, Direction de l'Energie, Rabat, 1984.
Rapport sur les Données Energétiques Nationales 1979-1981, Ministère de l'Energie et des Mines, Rabat, 1982.
Sources for biofuels and waste:
Direct communication with Ministère de l'Energie et des Mines, Direction des Mines, Rabat.
The UN Energy Statistics Database.
IEA Secretariat estimates.
Mozambique
Sources
Sources 1992 to 2015:
Direct communication with Ministério da Energia, Maputo and the National Petroleum Institute.
Annual Statistical Yearbook 1993, 1994, 1995, Eskom, Johannesburg, 1994, 1995, 1996, citing Electricidade de Mozambique, Maputo, as source.
The UN Energy Statistics Database.
IEA Secretariat estimates.
Sources up to 1991:
IEA Secretariat estimates.
Sources for biofuels and waste:
Direct communication with Ministério da Energia, Maputo.
IEA Secretariat estimates.
Myanmar
General notes
Some data are reported on a fiscal year basis, beginning on 1 April and ending on 31 March of the subsequent year.
Sources
Sources 1992 to 2015:
Direct communication with the Institute of Energy Economics, Japan (IEEJ), Tokyo, 2010-2014.
Selected Indicators, Myanmar Central Statistical Organisation website: www.csostat.gov.mm.
Joint Oil Data Initiative (JODI) online database.
Oil and Thailand, Ministry of Energy, Department of Alternative Energy Development and Efficiency, Bangkok, 2007 to 2013.
Direct communication with the Ministry of Energy, Planning Department, Rangoon, 2006-2007.
Review of the Financial Economic and Social Conditions, Ministry of National Planning and Economic Development, Central Statistical Organ-ization, Rangoon, 1995, 1996.
Statistical Yearbook, Ministry of National Plann-ing and Economic Development, Central Statist-ical Organization, Rangoon, 1995, 1996.
The UN Energy Statistics Database.
The ASEAN Energy Statistics Database.
Asian Development Bank online database.
158 - WORLD ENERGY BALANCES: DATABASE DOCUMENTATION (2017 edition)
INTERNATIONAL ENERGY AGENCY
Natural Gas in the World, Cedigaz, Paris, various editions up to 2016.
IEA Secretariat estimates.
Sources up to 1991:
Sectoral Energy Demand in Myanmar, UNDP Economic and Social Commission for Asia and the Pacific, Bangkok, 1992.
Selected Monthly Economic Indicators, paper no. 3, Ministry of Planning and Finance, Central Statis-tical Organization, Rangoon, 1989.
Sources for biofuels and waste:
Wood data have been submitted by the Ministry of Energy, from 1985 to 2003.
IEA Secretariat estimates based on 1990 data from UNDP Sixth Country Programme Union of Myanmar, World Bank, Programme Sectoral Review of Energy, by Sousing et. al., Washington, D.C., 1991.
Namibia
General notes
Data for Namibia are available starting in 1991. Prior to that, data are included in Other Africa.
Sources
Sources 1991 to 2015:
Namibia Energy Balance 2000-2014. Electricity Control Board, Windhoek.
Direct communication with the Ministry of Mines and Energy, Windhoek.
NamPower Annual Report, Namibia Power Corporation, Windhoek, various editions up to 2016. Note: NamPower data are published on a fiscal year basis (July to June)
Mauthner, F. and Weiss W., Solar Heat World-wide - Markets and contribution to the energy supply, various editions up to 2017, IEA Solar Heating and Cooling Programme.
IEA Secretariat estimates.
Sources for biofuels and waste:
IEA Secretariat estimates.
Nepal
General notes
Data are reported on a fiscal year basis, beginning on 1 July and ending on 30 June of the subsequent year 2015/16 is treated as 2015.
Sources
Sources up to 2015:
Direct communication with the Water and Energy Commission Secretariat (WECS), Ministry of Water Resources, Kathmandu.
A Year in Review, Nepal Electricity Authority, Durbar Marg, Kathmandu, various editions up to fiscal year 2015/16.
Imports and Sales of Petroleum Products, Nepal Oil Corporation Limited, Kathmandu, various editions up to 2013.
Energy Sector Synopsis Report, Water and Energy Commission Secretariat (WECS), Kathmandu, July 2010.
IEA Secretariat estimates.
Sources up to 1996:
The UN Energy Statistics Database.
IEA Secretariat estimates.
Sources for biofuels and waste:
Water and Energy Commission Secretariat (WECS), Ministry of Water Resources, Kathmandu.
IEA Secretariat estimates.
Nicaragua
Sources
Sources up to 2015:
Energy-Economic Information System (SIEE), Latin American Energy Organization (OLADE), Quito, accessed Feb 2017: http://sier.olade.org/.
Estadísticas de los Hidrocarburos, Ministerio de Energía y Minas, Managua, 2008 to 2014.
Generación Bruta por Tipo de Planta, Instituto Nicaragüense de Energía, Managua, 2016.
WORLD ENERGY BALANCES: DATABASE DOCUMENTATION (2017 edition) - 159
INTERNATIONAL ENERGY AGENCY
Consumo de Combustible por Tipo de Planta, Instituto Nicaragüense de Energía, Managua, 2016.
Balance Energético Nacional, Ministerio de Energía y Minas, Managua, 1999 to 2007.
Balance Energético Nacional, Comisión Nacional de Energía (CNE), Dirección de Políticas Energéticas, Managua, 2000 to 2005.
Estadísticas de Suministro de los Hidrocarburos, Instituto Nicaragüense de Energía, Managua, 1999 to 2004.
Informe Anual 1996: Datos Estadísticos del Sector Electrico, INE, Managua, 1999.
Balance Energetico Nacional, Comision Nacional de Energia (CNE), Managua, 1999 to 2007.
Niger
General notes
Data for Niger are available starting in 2000. Prior to 2000, data for Niger are presented in Other Africa.
Stock change may include statistical difference for Crude Oil.
Sources
Sources up to 2015:
Direct communication with the Ministry of Energy and Oil.
IEA Secretariat estimates
Sources for biofuels and waste:
Ministry of Energy and Oil
IEA Secretariat estimates
Nigeria
General notes
Crude oil production and export data may include field condensate.
Statistical differences may include oil products smuggled to or from neighbouring countries.
Inputs of motor gasoline and gas/diesel to back-up electricity generation, as well as the associated electricity outputs, which may be substantial in Nigeria, may not be captured.
In the 2015 edition, new information became available indicating that on-grid power generation has been fuelled by natural gas for many years. This may lead to breaks in time series between 1996 and 1997 as well as differences in trends compared to previous editions for some oil products.
In the 2017 edition, new information became avail-able through the Nigerian National Petroleum Cor-poration for Natural Gas Liquids. Break in time series can be observed between 2012 and 2013.
In the 2017 edition, naphtha data are added. Breaks in time series can be observed in Other Oil Products and Naphtha in 2003 and 2015.
Sources
Sources 1992 to 2015:
Direct communication with the Energy Comm-ission of Nigeria, Abuja.
Direct communication with the African Energy Commission, Algiers, Algeria.
Natural Gas in the World, Cedigaz, Paris, various editions up to 2016.
Annual Statistical Bulletin, Organization of Petroleum Exporting Countries (OPEC), Vienna, various editions up to 2016.
Annual Petroleum Bulletin, Nigerian National Petroleum Corporation (NNPC), Abuja, various editions from 1998 to 2015.
Statistical Bulletin, Central Bank of Nigeria, Abuja, various editions from 2003 to 2015.
Monthly Petroleum Bulletin for 2000, Nigerian National Petroleum Corporation (NNPC), Abuja.
Annual Report and Statement of Accounts 1995, Central Bank of Nigeria, Lagos, 1996.
Nigerian Petroleum News, Energy Publications, monthly reports, various issues up to May 1998.
IEA Secretariat estimates.
Sources up to 1991:
Annual Report and Statement of Accounts, Central Bank of Nigeria, Lagos, various editions from 1981 to 1987.
Basic Energy Statistics for Nigeria, Nigerian National Petroleum Corporation, Lagos, 1984.
NNPC Annual Statistical Bulletin, Nigerian National Petroleum Corporation, Lagos, 1983 to 1987.
The Economic and Financial Review, Central Bank of Nigeria, Lagos, various editions.
160 - WORLD ENERGY BALANCES: DATABASE DOCUMENTATION (2017 edition)
INTERNATIONAL ENERGY AGENCY
Sources for biofuels and waste:
IEA Secretariat estimates based on 1991 data from Forests and Biomass Sub-sector in Africa, African Energy Programme of the African Development Bank, Abidjan, 1996.
Oman
General notes
The interconnected nature of the Mina-Al-Fahal and Suhar oil refineries is reflected in the fuel oil data leading to breaks in time series for some products between 2007 and 2008.
Natural gas shows a break in time series for some flows between 2006 and 2007 due to a new methodology applied in both supply and demand.
Electricity output shows a break in time series between 2004 and 2005 as a national data source became available.
In 2006, the Suhar Refinery came online with 166 kbd capacity. Breaks in time series can be observed in oil products between 2005 and 2006.
Sources
Sources 2005 to 2015:
Statistical Yearbook, National Centre for Statistics and Information (NSCI), various editions from 1999 to 2016 (Formerly Ministry of National Economy).
Online statistics, Sultanate of Oman, Ministry of Oil and Gas.
Annual report, Authority for Electricity Regul-ation, Oman, various editions from 2005 to 2015.
Annual report, Oman LNG Company, various editions from 2009 to 2015.
Annual Report, Central Bank of Oman, Muscat, various editions up to 2015.
Natural Gas in the World, Cedigaz, Paris, various editions up to 2016.
Annual Statistical Report, Organization of Arab Petroleum Exporting Countries (OAPEC), Kuwait, various editions up to 2015.
The LNG Industry, International Group of Lique-fied Natural Gas Importers (GIIGNL), Levallois, 2005-2015.
IEA Secretariat estimates.
Sources 1992 to2004:
Direct communication with the Ministry of National Economy, Muscat.
Direct communication with the Ministry of Oil and Gas, Muscat.
Direct communication with the Ministry of Petrol-eum and Minerals, Muscat, 1997, 1998, and 1999.
Direct communication with the Ministry of Electricity & Water, Office of the Under Secretary, Ruwi, 1998 to 2001.
Quarterly Bulletin December 1994, Central Bank of Oman, Muscat, 1995.
Annual Report, Central Bank of Oman, Muscat, 1993.
Statistical Yearbook, 1994, 1995, 1996, 1997, Ministry of Development, Muscat, 1995 to 1998.
IEA Secretariat estimates.
Sources up to 1991:
Quarterly Bulletin, Central Bank of Oman, Muscat, 1986, 1987, 1989 and 1995.
Annual Report to His Majesty the Sultan of Oman, Department of Information and Public Affairs, Petroleum Development, Muscat, 1981, 1982, and 1984.
Oman Facts and Figures 1986, Directorate General of National Statistics, Development Council, Technical Secretariat, Muscat, 1987.
Quarterly Bulletin on Main Economic Indicators, Directorate General of National Statistics, Muscat, 1989.
Statistical Yearbook, Directorate General of National Statistics, Development Council, Muscat, 1985, 1986, 1988 and 1992.
Pakistan
General notes
The IEA Secretariat could not obtain data for 2015 from Pakistan in time. As a consequence, most data points for 2015 have been estimated based on developments in population and GDP in Pakistan. Specific information on new installed capacity has been incorporated into these estimations.
Time series data for natural gas for the years 2004-2007 were revised in 2009 due to the inclusion of the North-West Frontier Province data (now called KPK)
WORLD ENERGY BALANCES: DATABASE DOCUMENTATION (2017 edition) - 161
INTERNATIONAL ENERGY AGENCY
and Pakistan Steel Mills. Breaks in time series may occur between 2003 and 2004.
Own use of electricity by industries with autoproducer electricity plants may not be captured.
For bitumen and lubricants, data for stock variations may include unreported trade or consumption.
Sources
Sources 1992 to 2015:
Energy Yearbook, Hydrocarbon Development Institute of Pakistan, Ministry of Petroleum and Natural Resources, Islamabad, various editions from 1979 to 2015.
Pakistan Economic Survey 1994-1995, 1996, 1997, Government of Pakistan, Finance Division, Islamabad, 1995, 1997, 1998.
Statistical Supplement 1993/1994, Finance Division, Economic Adviser's Wing, Government of Pakistan, Islamabad, 1995.
Natural Gas in the World, Cedigaz, Paris, various editions up to 2016.
IEA Secretariat estimates.
Sources up to 1991:
Monthly Statistical Bulletin, no. 12, Federal Bureau of Statistics, Islamabad, December 1989.
1986 Bulletin, The State Bank of Pakistan, Islamabad, 1987.
Sources for biofuels and waste:
IEA Secretariat estimates based on 1991 data from Household Energy Strategy Study (HESS) of 1991.
Panama
General notes
International aviation bunkers figures for jet kerosene may include exports.
From 2003 onwards there has been no output of oil products due to refinery closure.
Sources
Sources up to 2015:
Energy-Economic Information System (SIEE), Latin American Energy Organization (OLADE), Quito, accessed May 2017: http://sier.olade.org/.
Compendio Estadístico Energético 1970-2015, Ministerio de Economía y Finanzas, Comisión de Política Energética, Panama.
Boletín Estadístico Marítimo Portuario, Autoridad Maritima de Panama (AMP), Panama, 2007 to 2015, www.amp.gob.pa.
Annual Report, Canal de Panamá, Panama, 2012.
U.S. Energy Information Administration (EIA), website, marine bunkers data from 2001 to 2006.
Paraguay
General notes
The Itaipu hydroelectric plant, operating since 1984 and located on the Paraná River (which forms the border of Brazil and Paraguay) was formed as a joint venture between Eletrobrás and the Paraguayan government.
From 2006 onwards, there has been no output of oil products, due to refinery closure.
Sources
Sources up to 2015:
Balance Energético Nacional, 1971-2014, Vice-ministerio de Energía y Minas, Ministerio de Obras Públicas y Comunicaciones, San Lorenzo.
Direct communication with Ministerio de Obras Públicas y Comunicaciones, San Lorenzo.
Peru
General notes
Liquid biofuels are included in the energy balances from 2010 onwards.
Sources
Sources up to 2015:
Direct communication with Ministerio de Energía y Minas, Oficina Técnica de Energía, Lima.
Energy-Economic Information System (SIEE), Latin American Energy Organization (OLADE), Quito, accessed May 2017: http://sier.olade.org/.
Balance Nacional de Energía, Ministerio de Energía y Minas, Lima, various editions up to 2016.
162 - WORLD ENERGY BALANCES: DATABASE DOCUMENTATION (2017 edition)
INTERNATIONAL ENERGY AGENCY
Organismo Supervisor de la Inversión en Energía y Minería, Hidrocarburos Estadisticas 2012.
IEA Secretariat estimates.
Philippines
Sources
Sources 1990 to 2015:
Direct communication with the Department of Energy, Manila.
Energy Commodity Account (ECA) and Overall Energy Balance (OEB), 1990-2008, 2010-2015 submitted by the Department of Energy, Manila.
APEC annual energy statistics questionnaires.
Annual Report, Semirara Mining Corporation, 2006-2016.
Annual steel production 1980-2016, World Steel Association, www.worldsteel.org/statistics/.
Philippines Energy Bulletin 1996, 1997, 1998, 1999.
IEA Secretariat estimates.
Sources up to 1989:
Direct communication with the Office of Energy Affairs, Manila.
APEC Energy Statistics 1994, Tokyo, October 1996.
1990 Power Development Program (1990-2005), National Power Corporation, Manila, 1990.
Philippine Medium-term Energy Plan 1988-1992, Office of Energy Affairs, Manila, 1989.
Philippine Statistical Yearbook 1977-1983, National Economic and Development Authority, Manila.
1985 and 1989 Annual Report, National Power Corporation, Manila, 1986, 1990.
Philippine Economic Indicators, National Eco-nomic and Development Authority, Manila, various editions of 1985.
Accomplishment Report: Energy Self-Reliance 1973-1983, Ministry of Energy, Manila, 1984.
Industrial Energy Profiles 1972-1979, vol. 1-4, Ministry of Energy, Manila, 1980.
National Energy Program, Ministry of Energy, Manila, 1982-1987 and 1986-1990.
Philippine Statistics 1974-1981, Ministry of Energy, Manila, 1982.
Energy Statistics, National Economic and Develop-ment Authority, Manila, 1983.
Quarterly Review, Office of Energy Affairs, Manila, various editions.
UN Energy Statistics Database.
IEA Secretariat estimates.
Qatar
General notes
Crude oil production and export data do not include field condensate.
Natural gas liquids (NGL) include field condensates, propane, butane and ethane production from natural gas processing plants. NGL produced from liquefied natural gas production plants and gas-to-liquids plants may be excluded.
Propane and butane from natural gas processing plants are transferred to LPG. Ethane from natural gas processing plants is transferred to ethane.
Information on the use of LPG and ethane in the petrochemical sector is from 2005 onward. This may lead to breaks in time series for these products be-tween 2004 and 2005.
Electricity production from autoproducers includes generation by desalination plants since 1988. Own use of electricity includes use by desalination plants since a breakdown is not available. Electricity consumption in industry includes electricity consumption by the energy sector.
Three satellite power stations located outside of Doha are included as main electricity producers up to 2014. In 2015, these power stations are not reported and are likely included as part of RAF-A station as auto production.
Revisions were made in 2014 for refinery intake of crude oil production based on Qatar Petroleum reports.
Sources
Sources 1992 to 2015:
Direct communication with Qatar Statistical Authority, Doha.
WORLD ENERGY BALANCES: DATABASE DOCUMENTATION (2017 edition) - 163
INTERNATIONAL ENERGY AGENCY
Direct communication with Qatar Petroleum, Doha.
Direct communication with Kahramaa, Qatar General Electricity and Water Coorporation, Doha.
Direct communication with National Minerals Information Center, U.S Geological Survey.
Statistics Report, Kahramaa, Qatar General Elec-tricity and Water Corporation, Doha, editions 2005 to 2008, 2010 to 2015.
Qatar in Figures, Qatar Statistics Authority. Doha, 2011-2015 editions.
2015 Integrated Report, Qatar Petrochemical Company, Doha.
Annual Report 2015, Qatar Fertilizer Company, Doha.
JODI extended database, www.jodi.org.
Statistical Bulletin, Arab Union of Electricity, 2011-2015.
Annual Report 2004-2015, Qatar Petroleum, Doha.
Natural Gas in the World, Cedigaz, Paris, various editions up to 2016.
The LNG Industry, International Group of Lique-fied Natural Gas Importers (GIIGNL), various editions up to 2016.
Statistics Archives, World Steel Association, www.worldsteel.org.
Annual Statistical Abstract, Qatar Statistics Authority, 1994 to 2012.
The UN Energy Statistics Database.
IEA Secretariat estimates.
Sources up to 1991:
Qatar General Petroleum Corporation 1981-1985, General Petroleum Corporation, Doha, 1986.
Economic Survey of Qatar 1990, Ministry of Economy and Commerce, Department of Economic Affairs, Doha, 1991.
Statistical Report 1987 Electricity & Water, Ministry of Electricity, Doha, 1988.
State of Qatar Seventh Annual Report 1983, Qatar Monetary Agency, Department of Research and Statistics, Doha, 1984.
Sources for biofuels and waste:
Forestry Statistics, FAO, Rome, 2000.
IEA Secretariat estimates.
Romania
General notes
Romania’s methodology for estimating indigenous production of geothermal energy differs from the one that IEA has adopted. Therefore, data comparisons between Romania and other countries might be misleading.
Data on quantities of coke oven coke used in blast furnaces do not correspond to the official submission of the national administration, as they have been estimated by the IEA Secretariat to ensure a carbon balance in the blast furnace transformation.
Sources
Sources 1992 to 2015:
Direct communication with the National Institute of Statistics, Bucharest.
Joint IEA/Eurostat/UNECE annual energy questionnaires.
Buletin Statistic de Informare Publica, Comisia Nationala Pentru Statistica, Bucharest, various editions up to June 1995.
Renel Information Bulletin, Romanian Electricity Authority, Bucharest, 1990, 1991, 1992, 1993, 1994. Anuarul Statistic al Republicii Socialiste Romania, Comisia Nationala Pentru Statistica, Bucharest, 1984, 1985, 1986, 1990, 1991.
IEA Secretariat estimates.
Russian Federation
General notes
Data for the Russian Federation are available starting in 1990. Prior to that, they are included in Former Soviet Union.
Annual statistics are based on annual joint IEA/Eurostat/UNECE questionnaires submissions received from Rosstat, the official data provider to the IEA. Data may differ from secondary sources, and discrepancies are being investigated.
In 2007, the Federal State Statistics Service introduced a new classification, the Russian Classification of Economic Activities (OKVED), oriented towards harmonization with the Statistical
164 - WORLD ENERGY BALANCES: DATABASE DOCUMENTATION (2017 edition)
INTERNATIONAL ENERGY AGENCY
Classification of Economic Activities in the European Community (NACE Rev.1). Data for the years prior to 2005 were submitted to the IEA Secretariat according to the Russian Classification of the Industries of the Economy (OKONKH). Therefore, breaks in time series for final consumption sectors may occur between 2004 and 2005.
Coal
Coal statistics provided by Rosstat may differ from those collected by Rosinformugol. Blast furnace gas values since 2012 utilise a different methodology to that of prior years (where heat from other sources than blast furnace gas had been attributed to blast furnace gas). Some coal trade from partners of the Customs Union has been estimated by the IEA Secretariat and additionally removed from indigenous production where it may be reported in data of other organisations.
Oil
2015 data were estimated by the IEA Secretariat for refinery output and observed deliveries of jet kerosene, exports of fuel oil and gas-diesel, residential consumption of LPG, and all consumption flows of fuel oil.
Condensate data provided by Rosstat are published separately from Crude Oil under NGL.
Jet kerosene output is confidential and estimated based on historical refinery throughput growth rate. No information on Vacuum Gas Oil is available.
LPG refinery output may include output from gas separation plants.
Naphtha exports are reported by Rosstat from 2011, and are significantly lower than in secondary sources. As a consequence domestic consumption of naphtha calculated as residual in the Russian balance is likely to be overestimated.
Information on international marine bunker con-sumption is submitted from 2010 with high fluct-uation in time series.
Jet kerosene consumption split between international and domestic aviation is unknown so consumption is equally split between the two flows.
Natural gas
In the 2017 edition, the Russian Federation revised natural gas data back to 2013.
From 2009, all data concerning LNG trade and LNG production have been estimated by the Secretariat.
Oil and gas extraction includes natural gas consumed by oil refineries.
Biofuels and waste
Charcoal data are reported with solid biofuels since 2010. The time series of charcoal is expected to be reported in the 2018 edition.
The geothermal input to main activity electricity plant was estimated by IEA Secretariat for 2013 and 2014.
Electricity and heat
The 2015 data for electricity and Heat show a sub-stantial drop in heat production on autoproducer plants fuelled by natural gas. These figures have been confirmed by the Russian authorities.
The 2013 data for electricity and heat show a substantial drop in the efficiency of autoproducer heat plants fuelled by natural gas as well as a decrease in production and consumption of heat. These figures have been confirmed by the Russian authorities.
Heat from other sources is produced from recovered waste heat.
Sources
Sources 1990 to 2015:
Direct communication with the Department of Foreign Statistics and International Cooperation from the Federal State Statistics Service (Rosstat), Moscow, Russian Federation.
Joint IEA/Eurostat/UNECE annual energy questionnaires.
Energy trade: direct communication with the Federal State Statistics Service, July 1994.
Statistical Yearbook of Russia 1994. The State Committee of Statistics, Moscow, 1994.
The Russian Federation in 1992, Statistical Year-book, The Federal State Statistics Service, Moscow, 1993.
Russian Federation External Trade, annual and quarterly various editions, the Federal State Statis-tics Service, Moscow.
Statistical Bulletin, various editions, The State Committee of Statistics of the CIS, Moscow, 1993, 1994.
Statistical Bulletin N° 3, The Federal State Statis-tics Service, Moscow, 1992.
Fuel and Energy Balance of Russia 1990, The Federal State Statistics Service, Moscow, 1991.
WORLD ENERGY BALANCES: DATABASE DOCUMENTATION (2017 edition) - 165
INTERNATIONAL ENERGY AGENCY
Energetika, Energo-Atomisdat, Moscow, 1981 to 1987.
IEA Secretariat estimates.
Sources for biofuels and waste:
The Federal State Statistics Service.
IEA Secretariat estimates.
Saudi Arabia
General notes
Crude oil production and export data do not include field condensate. Field condensate quantities are included with natural gas liquids.
Data for crude oil production include 50 per cent of the output of the Neutral Zone, shared with Kuwait. Similarly, crude oil production includes 50% of the output of the Abu Safa field shared with Bahrain.
Natural gas consumption for oil and gas extraction may include quantities used in oil refineries.
New data became available in 2015 allowing the estimation of natural gas consumption as a feedstock in ammonia and methanol manufacture from 1990 to 2013. The remaining natural gas consumption has been allocated to the non-specified Industry sector. Breaks in time series may occur between 1989 and 1990 for this reason.
Electricity production from autoproducers includes generation by desalination plants since 1979.
Electricity end use specific to Agriculture/forestry not reported in 2015.
New Yasref refinery in Yanbu came online in 2015 with 400kbd refining capacity. This is reflected in increase in oil industry consumption of oil products as feedstock. Similarly, an increase in diesel output is also perceived.
Diesel transportation end use and export figures revised from 2011.
Sources
Sources 1992 to 2015:
Annual Reports, Saudi ARAMCO, Dhahran, various editions up to 2015.
Annual Report, Saudi Arabian Monetary Agency, Research and Statistics Department, Riyadh, various editions up to 2016.
Joint Oil Data Initiative (JODI) online database.
Annual Statistical Booklet, Electricity and Co-generation Regulatory Authority, 2015.
Ministry of Petroleum and Mineral Resources, 2009.
Middle East Petroleum Databook, FACTS Global Energy Group, Singapore, 2009 and 2010.
Electricity Growth and Development in the Kingdom of Saudi Arabia up to the year from 1416H. (1996G.), 1420 H (1999/2000G) and 1423/1424 H (2003G), Ministry of Industry and Electricity, Riyadh, 1997, 1998, 1999, 2004.
Annual Statistical Report, Organization of Arab Petroleum Exporting Countries (OAPEC), Kuwait, various editions up to 2016.
Annual Statistical Bulletin, Organization of Petrol-eum Exporting Countries (OPEC), Vienna, various editions up to 2016.
Nitrogen statistics and information, U.S. Geo-logical Survey, www.usgs.gov.
Direct communication from the Central Depart-ment of Statistics of the Ministry of Planning and oil industry sources.
A Survey of the Saudi Arabian Oil Industry 1993, Embassy of the United States of America in Riyadh, Riyadh, January 1994.
IEA Secretariat estimates.
Sources up to 1991:
Annual Reports, Saudi ARAMCO, various editions.
Petroleum Statistical Bulletin 1983, Ministry of Petroleum and Mineral Resources, Riyadh, 1984.
Achievement of the Development Plans 1970-1984, Ministry of Planning, Riyadh, 1985.
The 1st, 2nd, 3rd and 4th Development Plans, Ministry of Planning, Riyadh, 1970, 1975, 1980 and 1985.
Annual Report, Saudi Arabian Monetary Agency, Research and Statistics Department, Riyadh, 1984, 1985, 1986, 1988, 1989.
Statistical Summary, Saudi Arabian Monetary Agency, Research and Statistics Department, Riyadh, 1986.
Sources for biofuels and waste:
Forestry Statistics, FAO, Rome, 2000.
IEA Secretariat estimates.
166 - WORLD ENERGY BALANCES: DATABASE DOCUMENTATION (2017 edition)
INTERNATIONAL ENERGY AGENCY
Senegal
General notes
The IEA Secretariat could not obtain data for 2014 and 2015 from Senegal. As a consequence, most data points for 2014 and 2015 have been estimated based on developments in population and GDP.
In the 2014 edition, the time series for solid biofuels were revised from 2009 based on newly available information. Breaks in time series may occur between 2008 and 2009.
Sources
Sources 2009 to 2015:
Direct communication with Ministère de l’Energie, des Mines, Dakar.
Bilans énergétiques du Sénégal 2009 to 2013, Direction de l’Energie, Dakar.
IEA Secretariat estimates.
Sources 2008:
Bulletin mensuel des statistiques économiques, Agence national de la Statistique et de la Démographie (ANSD), Dakar, March 2009.
Direct communication with Ministère de l’Energie, Dakar.
Sources 2000 to 2007:
Bilans énergétiques du Sénégal 2003, 2004, 2005, 2006, Direction de l’Energie, Dakar.
IEA Secretariat estimates.
Sources 1992 to 1999:
Direct communication with Ministère de l’Energie, des Mines et de l’Industrie, Direction de l’Energie, Dakar, 1997 to 2002.
Direct communication with Ministère de l’Energie, des Mines et de l’Hydraulique, Comité National des Hydrocarbures, Dakar, 2002.
Direct communication from oil industry sources, Société Africaine de raffinage.
Direct communication from electricity industry sources, SENELEC.
Report of Senegal on the Inventory of Greenhouse Gases Sources, Ministère de l'Environnement et de la Protection de la Nature, Dakar, 1994.
Direct communication to the IEA Secretariat from ENDA - Energy Program, Dakar, 1997.
The UN Energy Statistics Database.
Sources up to 1991:
Situation Economique 1985, Ministère de l'Eco-nomie et des Finances, Direction de la Statistique, Senegal, 1986.
Sources for biofuels and waste:
IEA Secretariat estimates based on 1994 data from Forests and Biomass Sub-sector in Africa, African Energy Programme of the African Development Bank, Abidjan, 1996, and from direct commun-ication with ENDA, Senegal.
Serbia
General notes
Data for Serbia are available starting in 1990. Prior to that, they are included in Former Yugoslavia.
Serbia energy data include Montenegro until 2004 and The United Nations Interim Administration Mission in Kosovo until 1999.
The Ministry of Mining and Energy of Republic of Serbia is currently in the process of revising time series for energy statistics. Important revisions were made in the past two years, in particular for renewables.
Breaks in time series for oil products and natural gas may appear between 2006 and 2007 due to newly available data for 2007 (see Sources).
Sources
Sources 1990 to 2015:
Direct communication with the Ministry of Mining and Energy, Belgrade.
Direct communication with the Statistical Office of the Republic of Serbia, Belgrade.
Joint IEA/Eurostat/UNECE annual energy questionnaires.
Pilot study: Energy Balances (2007 and 2008) - Oil and Derivates of Oil, Natural Gas, Geothermal Energy and Energy Balance of the Republic of Serbia, Statistical Office of the Republic of Serbia, Belgrade, 2009.
Direct communication with the Federal Ministry of Economy, Belgrade.
IEA Secretariat estimates.
WORLD ENERGY BALANCES: DATABASE DOCUMENTATION (2017 edition) - 167
INTERNATIONAL ENERGY AGENCY
Sources for biofuels and waste:
Direct communication with the Ministry of Mining and Energy, Belgrade.
IEA Secretariat estimates.
Singapore
General notes
Singapore joined the IEA as an Association country in October 2016.
Some key oil products and flows are aggregated by Singapore, to avoid breach of confidentiality. Detailed breakdown is then estimated by the IEA Secretariat.
At the time of publication, refinery input and output figures for 2015 were not available and they have been therefore estimated by IEA Secretariat. These values may differ significantly from actual figures published later in Singapore’s official sources.”
The IEA Secretariat, the Energy Market Authority and the National Climate Change Secretariat (NCCS) are working closely together on improving data quality for Singapore. Therefore, breaks in time series between 2008 and 2009 and differences in trends when compared to previous publications may occur for some products.
From 2009, Singapore publishes splits of refinery output between light, middle and heavy distillates and residuum only. Further breakdown between products is estimated by the IEA Secretariat. Singapore aggre-gates petrochemical and refinery consumption. The split between refining and petrochemical consumption is estimated by the IEA Secretariat.
Refinery input is broken down between crude oil and feedstocks. Splits of feedstock by product are not provided by Singapore. By default, IEA estimates that feedstocks come from naphtha, gas/diesel and fuel oil in equal proportions.
Other data remain aggregated due to lack of data availability. Electricity consumption in the industry sector from 2005 includes electricity consumption by refineries. Electricity consumption in transport in-cludes all electricity consumption at airport terminals. Municipal waste production and consumption may include biogas.
Refinery gas production and consumption may include syngas produced by the petrochemical sector.
Due to Singapore’s large trade volume in comparison to its final consumption, slight misalignment of trade
figures can have a significant impact on the energy balance of Singapore. The IEA Secretariat has adjust-ed total imports of crude oil, gas/diesel and fuel oil from 2009 to match demand.
A coal-fired power plant started operations in 2013. This might lead to breaks in time series between 2012 and 2013.
Sources
Sources 1992 to 2015:
Direct communication with the Energy Market Authority, Singapore.
Direct communication with the National Climate Change Secretariat (NCCS), Singapore, from 2013.
Direct communication with the Solar Energy Research Institute of Singapore, 2011.
Singapore Energy Statistics, Energy Market Authority, Singapore, various editions up to 2016.
Monthly oil statistics, IE Singapore, 2011-2015.
Yearbook of Statistics Singapore, Department of Statistics, Singapore, various editions up to 2016.
Bunker sales, website of The Maritime and Port Authority of Singapore: www.mpa.gov.sg.
Motor Vehicle Population by Type of Fuel Used, web-site of the Land Transport Authority: www.lta.gov.sg.
Solid Waste Management Statistics, website of The Ministry of the Environment and Water Resources: http://app.mewr.gov.sg/.
Singapore Trade Statistics, International Enter-prise Singapore, Singapore, various CD-ROM editions up to 2011.
Argus Fundamentals, Argus Media, various editions up to 2012.
Asia Pacific Databook, FACTS Global Energy, Singapore, various editions up to 2013.
The Strategist Oil Report, Singapore, various issues up to March 1999.
Petroleum in Singapore 1993/1994, Petroleum Intelligence Weekly, Singapore, 1994.
AEEMTRC, 1996.
Direct submissions from oil industry sources up to 1996.
The UN Energy Statistics Database.
IEA Secretariat estimates.
Sources up to 1991:
Monthly Digest of Statistics, Department of Statis-tics, Singapore, various editions from 1987 to 1989.
168 - WORLD ENERGY BALANCES: DATABASE DOCUMENTATION (2017 edition)
INTERNATIONAL ENERGY AGENCY
Yearbook of Statistics Singapore 1975/1985, Department of Statistics, Singapore, 1986.
ASEAN Oil Movements and Factors Affecting Intra-ASEAN Oil Trade, Institute of Southeast Asian Studies, Singapore, 1988.
The Changing Structure of the Oil Market and Its Implications for Singapore's Oil Industry, Institute of Southeast Asian Studies, Singapore, 1988.
Public Utilities Board Annual Report (1986 and 1989), Public Utilities Board, Singapore, 1987 and 1990.
Sources for biofuels and waste:
Singapore Energy Statistics, Energy Market Authority, Singapore, various editions up to 2016.
The UN Energy Statistics Database.
IEA Secretariat estimates.
South Africa
General notes
Coal
Outputs from gas-to-liquids and coal-to-liquids plants are presented in the “Transfers” flow.
New information became available in 2015 which allowed the separation of non-energy use of coal in Coal to Liquids (CTL) plants from the coal used for energy purposes in these same plants. Non-energy conversion efficiencies for CTL plants in South Africa are assumed to be 60%. This new methodology may lead to breaks in time series between 2010 and 2011 for these products and flows.
Breaks in time series may occur for anthracite and coking coal between 2009 and 2010 as new information became available. Prior to 2010, coking coal data may include anthracite.
Coking coal, coke oven coke, coke oven gas, gas works gas and blast furnace gas production and consumption have been estimated using reported crude steel production figures.
Oil
New information became available in 2015 on re-finery output of lubricants. Data have been revised from 1998. This may lead to breaks in time series be-tween 1997 and 1998.Reported quantities of synthetic fuels output may not include quantities from PetroSA.
Natural gas
Breaks in time series may occur for consumption of natural gas in industrial sectors between 2009 and 2010 as new information became available.
Sources
Sources 2010 to 2015:
Direct communication with the Department of Energy, Pretoria, South Africa.
Energy statistics: Supply and demand of petroleum products, Department of Energy, Pretoria, South Africa.
Statistical release on electricity generated and available for distribution, Statistics South Africa, Pretoria.
South African Statistics, Statistics South Africa, Pretoria, various editions up to 2016.
Joint Oil Data Initiative (JODI) online database.
Annual Reports, South Africa Petroleum Industry Association (SAPIA), Sandton.
Integrated Annual Reports, Electricity Supply Commission (ESKOM), South Africa.
Analyst Book, SASOL Limited Group, Johannesburg, various editions up to 20165.
Integrated Annual Reports, PetroSA, Parow, various editions up to 2016.
World Steel Association online statistics database.
Natural Gas in the World, Cedigaz, Paris, various editions up to 2016.Mauthner, F. and Weiss W., Solar Heat Worldwide - Markets and contribution to the energy supply, various editions up to 2015, IEA Solar Heating and Cooling Programme.
IEA Secretariat estimates.
Sources 1992 to 2009:
Energy balances submitted to the IEA Secretariat from the Department of Minerals and Energy, 2003 to 2009.
Electricity generated and available for distri-bution, Statistics South Africa, Pretoria, various editions up to 2009.
Direct submission from the Institute for Energy Studies, Rand Afrikaans University, Pretoria, 1998 to 2001.
Digest of South African Energy Statistics 1998.
Direct submissions from the Energy Research Institute, University of Cape Town.
WORLD ENERGY BALANCES: DATABASE DOCUMENTATION (2017 edition) - 169
INTERNATIONAL ENERGY AGENCY
ESKOM Annual Report, Electricity Supply Comm-ission (ESKOM), South Africa, 1992 to 1994.
Statistical Yearbook, Electricity Supply Comm-ission (ESKOM), South Africa, 1992 to 1994.
South Africa’s Mineral Industry, Department of Mineral and Energy Affairs, Braamfontein, 1995.
South African Energy Statistics, 1950-1993, De-partment of Mineral and Energy Affairs, Pretoria, 1995.
Wholesale Trade Sales of Petroleum Products, Central Statistical Service, Pretoria, 1995.
South African Coal Statistics 1994, South African Coal Report, Randburg, 1995.
Energy Balances in South Africa 1970-1993, Energy Research Institute, Plumstead, 1995.
Sources up to 1991:
ESKOM Annual Report, Electricity Supply Commission (ESKOM), South Africa, 1989 to 1991.
Statistical Yearbook, Electricity Supply Comm-ission (ESKOM), South Africa, 1983 to 1991.
Statistical News Release 1981-1985, Central Statistical Service, South Africa, various editions from 1986 to 1989.
Annual Report Energy Affairs 1985, Department of Mineral and Energy Affairs, Pretoria, 1986.
Energy Projections for South Africa (1985 Balance), Institute for Energy Studies, Rand Afrikaans University, South Africa, 1986.
Sources for biofuels and waste:
South African Energy Statistics 1950-1989, No. 1, National Energy Council, Pretoria, 1989.
IEA Secretariat estimates.
South Sudan
General notes
The IEA Secretariat could not obtain data for 2015 from South Sudan in time. As a consequence, most data points for 2015 have been estimated based on developments in population and GDP in South Sudan.
Data for South Sudan are available from 2012. Prior to 2012, they are included in Sudan.
Crude oil production and exports were halted for most of 2012, and only continued in April 2013. Both production and exports have been estimated by the IEA Secretariat for the years 2012 to 2015.
Sources
Sources 2012 to 2015:
AFREC Energy questionnaire, African Energy Commission, 2015.
IEA Secretariat estimates.
Former Soviet Union
General notes
Data for individual countries of the Former Soviet Union are available starting in 1990, and most of the information on 1990 and 1991 was estimated by the IEA Secretariat. Because of large breaks in reporting occurring in the early 1990’s, breaks in time series may occur in 1990 for all regional totals.
Coal production statistics refer to unwashed and unscreened coal up to 1990. IEA coal statistics normally refer to coal after washing and screening for the removal of inorganic matter. Also, see notes under “Classification of Fuel Uses” and “Heat”, in section on Notes on data quality.
The commodity balances presented for the Former Soviet Union include IEA Secretariat estimates of fuel consumption in the main categories of transformation. These estimates are based on secondary sources and on isolated references in FSU literature.
In older editions of this publication, intra-FSU trade was excluded.
Sources
Sources up to 1989:
Statistical Yearbook, The State Committee for Statistics of the USSR, Moscow, various editions from 1980 to 1989.
External Trade of the Independent Republics and the Baltic States, 1990 and 1991, the State Committee of Statistics of the CIS, Moscow, 1992.
External Trade of the USSR, annual and quarterly, various editions, The State Committee of Statistics of the USSR, Moscow, 1986 to 1990.
170 - WORLD ENERGY BALANCES: DATABASE DOCUMENTATION (2017 edition)
INTERNATIONAL ENERGY AGENCY
CIR Staff Paper no. 14, 28, 29, 30, 32 and 36, Center for International Research, U.S. Bureau of the Census, Washington, 1986, 1987 and 1988.
Yearbook on Foreign Trade, The Ministry of Foreign Trade, Moscow, 1986.
Sri Lanka
General notes
Breaks in time series may occur between 1999 and 2000 due to newly available energy balances provided by the Sri Lanka Sustainable Energy Authority in 2009.
Stock change may include statistical difference for certain secondary oil products.
Refinery losses may include own use of refinery fuel.
Sources
Sources 1992 to 2015:
Direct communication with the Sri Lanka Sus-tainable Energy Authority, Colombo.
Sri Lanka Energy Balances 2000-2015, Sri Lanka Sustainable Energy Authority, Colombo.
Economic and Social Statistics of Sri Lanka 2011-2015, Central Bank of Sri Lanka, Colombo.
Statistical Digest 2014, Ceylon Electricity Board, Colombo.
Direct communication with the Department of Census and Statistics, 2003 to 2006.
Annual Report 1993, Central Bank of Sri Lanka, Colombo, July 1994.
Direct communication with the Ceylon Electricity Board, Sri Lanka Energy Balances, 1994.
The UN Energy Statistics Database.
IEA Secretariat estimates.
Sources up to 1991:
Energy Balance Sheet 1991, 1992, Energy Unit, Ceylon Electricity Board, Colombo, 1992, 1993.
Bulletin 1989, Central Bank of Sri Lanka, Colombo, July 1989.
Bulletin (monthly), Central Bank of Sri Lanka, Colombo, May 1992.
Sectoral Energy Demand in Sri Lanka, UNDP Economic and Social Commission for Asia and the Pacific, Bangkok, 1992.
External Trade Statistics 1992, Government of Sri Lanka, Colombo, 1993.
Sources for biofuels and waste:
Energy Conservation Fund and Ceylon Electricity Board.
IEA Secretariat estimates.
Sudan
General notes
South Sudan became an independent country on 9 July 2011. From 2012 data for South Sudan are reported separately and therefore, breaks in the time series may occur between 2011 and 2012 for Sudan data.
The IEA Secretariat could not obtain data for 2014 or 2015 from Sudan. As a consequence, some data points for 2014 and 2015 have been estimated based on macroeconomic indicators.
In 2015, the Kosti power plant began operation in Sudan, with 500 MW capacity. The plant uses crude oil for fuel, and break in time series can be seen for crude oil imports and input into main activity power plants in 2015.
Sources
Sources 1992 to 2015:
Direct communication with the Ministry of Petrol-eum, Khartoum.
Annual Statistical Report, Organization of Arab Petroleum Exporting Countries (OAPEC), Kuwait, various editions up to 2016.
Statistical Bulletin, Arab Union of Producers, Transporters and Distributors of Electricity (AUPTDE), Amman, various editions up to 2015.
Sudanese Petroleum Corporation Statistics, Ministry of Petroleum, Khartoum, May 2012.
AFREC energy questionnaire, African Energy Commission, 2013.
Sudan Energy Handbook 2006, Ministry of Energy and Mines, Khartoum.
IEA Secretariat estimates.
Sources up to 1991:
Foreign Trade Statistical Digest 1990, Government of Sudan, Khartoum, 1991.
WORLD ENERGY BALANCES: DATABASE DOCUMENTATION (2017 edition) - 171
INTERNATIONAL ENERGY AGENCY
Sources for biofuels and waste:
IEA Secretariat estimates based on 1990 data from Bhagavan (ed.) Energy Utilities and Institutions in Africa, AFREPREN, Nairobi, 1996.
Suriname
General notes
The data are available from 2000 to 2015. Prior to 2000, data for Suriname are presented in Other Non-OECD Americas.
Sources
Sources up to 2015:
Energy-Economic Information System (SIEE), Latin American Energy Organization (OLADE), Quito, accessed May 2017, http://sier.olade.org/.
IEA Secretariat estimates
Syrian Arab Republic
General notes
Due to the on-going conflict in Syria, no official government data sources were available for 2012 to 2015. Data in this year’s edition are primarily based on secondary sources, media reports and IEA Sec-retariat estimates.
Imports of crude oil and secondary oil products may include informal imports.
In this edition, revised figures were edited from OAPEC for oil production. This might create break in time series.
Sources
Sources 1992 to 2015:
Annual Statistical Report, Organization of Arab Petroleum Exporting Countries (OAPEC), Kuwait, various editions up to 2016.
Natural Gas in the World, Cedigaz, Paris, various editions up to 2016.
Direct Communication with the Ministry of Petroleum and Mineral Resources, 2012.
Statistical Abstract, Office of the Prime Minister, Central Bureau of Statistics, Damascus, various editions up to 2011.
Statistical Bulletin, Arab Union of Producers, Transporters and Distributors of Electricity (AUPTDE), Amman, various editions up to 2015.
The UN Energy Statistics Database (until 2007).
Quarterly Bulletin, Central Bank of Syria, Research Department, Damascus, 2001.
IEA Secretariat estimates.
Sources up to 1991:
Quarterly Bulletin, Central Bank of Syria, Research Department, Damascus, 1984.
Sources for biofuels and waste:
Forestry Statistics, FAO, Rome, 2000.
IEA Secretariat estimates.
Chinese Taipei
General notes
Data for the period 1982-2009 were revised in 2012 based on new balances submitted by the Bureau of Energy. Breaks in time series may occur between 1981 and 1982.
Breaks in time series may also occur between 2010 and 2011 as more detailed information became avail-able for refinery feedstocks and oil products.
Sources
Sources 1982 to 2015:
Energy Balances in Taiwan, Bureau of Energy, Ministry of Economic Affairs, Taipei, various editions up to 2016.
Direct communication with the electricity utilities.
Yearbook of Energy Statistics, Ministry of Trade, Industry and Energy, Taipei, 1996.
Sources up to 1981:
The Energy Situation in Taiwan, Ministry of Economic Affairs, Energy Committee, Taipei, 1986, 1987, 1988 and 1992.
Industry of Free China 1975-1985, Council for Economic Planning and Development, Taipei, 1986.
Taiwan Statistical Data Book 1954-1985, Council for Economic Planning and Development, Taipei, 1986.
172 - WORLD ENERGY BALANCES: DATABASE DOCUMENTATION (2017 edition)
INTERNATIONAL ENERGY AGENCY
Energy Policy for the Taiwan Area, Ministry of Economic Affairs, Energy Committee, Taipei, 1984.
Energy Balances in Taiwan, Ministry of Economic Affairs, Taipei, 1980 to 1981.
Sources for biofuels and waste:
Energy Balances in Taiwan, Bureau of Energy, Ministry of Economic Affairs, Taipei.
The UN Energy Statistics Database.
IEA Secretariat estimates.
Tajikistan
General notes
Data for Tajikistan are available starting in 1990. Prior to that, they are included in Former Soviet Union.
Tajikistan is one of the 11 EU4Energy focus countries.
Breaks in time series occur between 2011 and 2012 and between 2013 and 2014, as new information became available in 2016 to the statistics office.
Sources
Sources 2015:
Direct communication with the Statistical Agency under President of the Republic of Tajikistan, Dushanbe.
IEA Secretariat estimates
Sources 1990 to 2014:
Direct communication with the Statistical Agency under President of the Republic of Tajikistan, Dushanbe.
Joint IEA/Eurostat/UNECE annual energy ques-tionnaires, 1991 to 2007 and 2014.
Online statistics, Statistical Agency under the President of the Republic of Tajikistan.
Tajikistan in Figures, Statistical Agency under the President of Tajikistan, various editions up to 2014.
Energy and Communal Services in Kyrgyzstan and Tajikistan: A Poverty and Social Impact Assessment. UNDP Bratislava Regional Centre 2011
CIS and East European Energy Databook, Eastern Bloc Research Ltd, Tolsta Chaolais, various editions up to 2013.
Asian Development Bank Statistics, various editions up to 2014.
Direct communication with the State Committee on Statistics, Republic of Tajikistan, Dushanbe.
Natural Gas Vehicles Statistics, International Association for Natural Gas Vehicles, online data-base: www.iangv.org.
Industry of Tajikistan, Statistics, the State Comm-ittee on Statistics of the Republic of Tajikistan, 2004.
IEA Secretariat estimates.
Tanzania
General notes
Some of oil data (EWURA) are reported on a fiscal year basis. Data for 2015 correspond to 1 July 2015 – 30 June 2016.
Sources
Sources up to 2015:
Annual Report, Bank of Tanzania, Dar es Salaam, various editions up to 2016.
EWURA Annual Report, Energy and Water Utilities Regulatory Authority of the United Republic of Tanzania, Dar es Salaam, various editions up to 2016.
Annual Report, Orca Exploration Group Inc., various editions up to 2016.
The Economic Survey, the Ministry of Finance, Dar Es Salaam, various editions up to 2015.
SAPP Annual Report 2008, Southern African Power Pool, online statistics, 2010-2011.
The Economic Survey, The President’s Office – Plann-ing and Privatization, Dar es Salaam, 2003-2007.
Direct communication with the Ministry of Energy and Minerals and the electricity utility.
Tanzanian Economic Trends, Economic Research Bureau, University of Dar es Salaam, 1991.
IEA Secretariat estimates.
Sources for biofuels and waste:
IEA Secretariat estimates based on 1990 data from Energy Statistics Yearbook 1990, Southern Africa Development Community (SADC), Luanda, 1992.
WORLD ENERGY BALANCES: DATABASE DOCUMENTATION (2017 edition) - 173
INTERNATIONAL ENERGY AGENCY
Thailand
General notes
Thailand joined the IEA as an Association country in November 2015.
Data for lubricants, refinery gas and non-specified oil products are not published by the Ministry of Energy and are estimated by the IEA Secretariat. Up to 2014, IEA Secretariat also estimated naphtha.
Data for production, own use and non-energy use of natural gas may include propane, butane and ethane produced in gas separation plants.
Stock changes may include statistical difference for certain products.
In the 2014 edition, new information became available for the consumption of anthracite and lignite coal in industry. Breaks in time series may occur between 2011 and 2012.
Sources
Sources 2012 to 2015:
Direct communication with the Ministry of Energy, Thailand, Bangkok.
Direct communication with the Petroleum Institute of Thailand, Bangkok.
Thailand Energy Statistics, Ministry of Energy, Department of Alternative Energy Development and Efficiency, Bangkok, various editions up to 2016.
Thailand Energy Balance Table, Ministry of Energy, Department of Alternative Energy Development and Efficiency, Bangkok, various editions up to 2016.
Thailand Alternative Energy Situation, Ministry of Energy, Department of Alternative Energy De-velopment and Efficiency, Bangkok, various editions up to 2016.
Thailand Energy Efficiency Situation, Ministry of Energy, Department of Alternative Energy Development and Efficiency, Bangkok, various editions up to 2014.
Energy Statistics of Thailand, Ministry of Energy, Energy Policy & Planning Office, Bangkok, various editions up to 2016.
Key Statistical Data, Electricity Generation Author-ity of Thailand, online database: www.egat.co.th.
Thailand’s Petroleum & Petrochemical Statistics, Petroleum Institute of Thailand, Bangkok, various editions up to 2016.
IEA Secretariat estimates.
Sources 2002 to 2012:
Direct communication with the Petroleum Institute of Thailand, Bangkok, 2008 to 2012.
Thailand Energy Situation, Ministry of Energy, Department of Alternative Energy Development and Efficiency, various editions up to 2012.
Key Statistical Data, Electricity Generation Author-ity of Thailand, online database: www.egat.co.th.
Thailand Alternative Energy Situation, Ministry of Energy, Department of Alternative Energy Develop-ment and Efficiency, various editions up to 2012.
Electric Power in Thailand, Ministry of Energy, Department of Alternative Energy Development and Efficiency, various editions up to 2012.
Oil in Thailand, Ministry of Energy, Department of Alternative Energy Development and Efficiency, various editions up to 2012.
IEA Secretariat estimates.
Sources up to 2001:
Electric Power in Thailand, Ministry of Science, Technology and Energy, National Energy Administration, Bangkok, 1985, 1986, 1988 to 2001.
Oil in Thailand, Ministry of Science, Technology and Energy, National Energy Administration, Bangkok, 1979 to 2001.
Thailand Energy Situation, Ministry of Science, Technology and Energy, National Energy Admin-istration, Bangkok, 1978 to 2001.
Sources for biofuels and waste:
Thailand Energy Situation, Ministry of Energy, Department of Alternative Energy Development and Efficiency, 2002 to 2010.
Thailand Alternative Energy Situation, Ministry of Energy, Department of Alternative Energy De-velopment and Efficiency, 2009-2010.
IEA Secretariat estimates.
Togo
General notes
The IEA Secretariat could not obtain data from 2013 to 2015 from Togo in time. As a consequence, data for these years have been estimated based on population
174 - WORLD ENERGY BALANCES: DATABASE DOCUMENTATION (2017 edition)
INTERNATIONAL ENERGY AGENCY
growth for biomass and household consumption, and GDP growth for other products than hydro.
Official data were submitted by Togo in 2014 for the years 2009-2012. Breaks in time series between 2008 and 2009 or differences in trends compared to previous publications may occur for this reason.
Sources
Sources 1999 to 2015:
Direct communication with Ministère de l'Equipe-ment, des Mines, de l’Energie et des Postes et Télécommunications, Lomé.
Bilans Energétiques du Togo, 1999 to 2012.
Autorité de Réglementation du Secteur de l’Elec-tricité (ARSE), 2015 and 2016.
IEA Secretariat estimates.
Sources up to 1998:
IEA Secretariat estimates.
Trinidad and Tobago
General notes
In the 2014 edition, natural gas time series from 2000 were revised based on newly available information on the definition of production of natural gas used by Trinidad and Tobago (gross versus marketed production).
Sources
Sources 1992 to 2015:
Direct communication with the Ministry of Energy and Energy Affairs, Port of Spain.
Energy-Economic Information System (SIEE), Latin American Energy Organization (OLADE), Quito, accessed April 2017: http://sier.olade.org/.
Energy Industry Consolidated Monthly Bulletins, Ministry of Energy and Energy Affairs, Govern-ment of the Republic of Trinidad and Tobago, Port of Spain, various editions up to 2015.
Downstream Gas Industry Annual Report, Ministry of Energy and Energy Affairs, Govern-ment of the Republic of Trinidad and Tobago, Port of Spain, various editions up to 2015.
Annual Economic Survey, Central Bank of Trinidad and Tobago, Port of Spain, 1995 to 2015.
Natural Gas in the World, Cedigaz, Paris, various editions up to 2015.
The LNG Industry, GIIGNL – International Group of Liquefied Natural Gas Importers, Paris, various editions up to 2014.
Petroleum Industry Monthly Bulletin, Ministry of Energy and Natural Resources, Port of Spain, various issues up to 1999.
Sources up to 1991:
Annual Statistical Digest, Central Statistical Office, Port of Spain, 1983, 1984.
History and Forecast, Electricity Commission, Port of Spain, 1987.
Annual Report, Ministry of Energy and Natural Resources, Port of Spain, 1985, 1986.
The National Energy Balances 1979-1983, Min-istry of Energy and Natural Resources, Port of Spain, 1984.
Trinidad and Tobago Electricity Commission Annual Report, Trinidad and Tobago Electricity Commission, Port of Spain, 1984, 1985.
Sources for biofuels and waste:
Energy-Economic Information System (SIEE), Latin American Energy Organization (OLADE), Quito, accessed April 2017: http://sier.olade.org/.
Forestry Statistics, FAO, Rome.
Tunisia
General notes
New information for lubricants and bitumen became available in 2015. Breaks in the time series may occur between 2009 and 2010 because of this.
A significant increase in crude oil production was reported for 2007 due to the start-up of several new development wells and the beginning of production of the Oudna field.
A shutdown of the Bizerte refinery occurred between March 2010 and June 2011, resulting in breaks in time series for crude oil and oil products for the years 2009 to 2011.
Sources
Sources 1992 to 2015:
Direct communication with the Observatoire National de l'Energie, Agence Nationale pour la Maîtrise de l'Energie, Tunis.
Joint IEA/Eurostat/UNECE annual energy questionnaires.
WORLD ENERGY BALANCES: DATABASE DOCUMENTATION (2017 edition) - 175
INTERNATIONAL ENERGY AGENCY
Rapport Annuel 2011, Société Tunisienne de l’Electricité et du Gaz, Tunis.
Société Tunisienne des Industries de Raffinage, 2009 online statistics, 2008 to 2009.
Statistiques d’Electricité du COMELEC, 2006, 2007, Comité Maghrébin de l’Electricité.
Sources up to 1991:
Bilan Energétique de l'Année 1991, Banque Centrale de Tunisie, Tunis, September 1992.
Rapport d'Activité 1990, Observatoire National de l'Energie, Agence pour la Maîtrise de l'Energie, Tunis, 1991.
Rapport Annuel 1990, Banque Centrale de Tunisie, Tunis, 1991.
Activités du Secteur Pétrolier en Tunisie, Banque Centrale de Tunisie, Tunis, 1987.
Statistiques Financières, Banque Centrale de Tunisie, Tunis, 1986.
Entreprise Tunisienne d'Activités Pétrolières (ETAP), Tunis, 1987.
Annuaire Statistique de la Tunisie, Institut National de la Statistique, Ministère du Plan, Tunis, 1985, 1986.
L'Economie de la Tunisie en Chiffres, Institut National de la Statistique, Tunis, 1984, 1985.
Activités et Comptes de Gestion, Société Tunisienne de l'Electricité et du Gaz, Tunis, 1987.
Sources for biofuels and waste:
IEA Secretariat estimates based on 1991 data from Analyse du Bilan de Bois d’Energie et Identification d’un Plan d’Action, Ministry of Agriculture, Tunis, 1998.
Turkmenistan
General notes
Data for Turkmenistan are available starting in 1990. Prior to that, they are included in Former Soviet Union.
Turkmenistan is one of the 11 EU4Energy focus countries.
Very little data for Turkmenistan are currently available. Supply data are available from secondary sources and consumption is estimated. To indicate the lack of data, certain figures for 2015 have deliberately been kept equal to 2014.
Sources
Sources 2015:
Turkmenistan Country Report, Turkmenenergo, 2016.
Natural Gas in the World, Cedigaz, Paris, various editions up to 2016.
IEA Secretariat estimates.
Sources up to 2014:
CIS and East European Energy Databook, Eastern Bloc Research Ltd, David Cameron Wilson, vari-ous editions up to 2015.
Asian Development Bank online database.
Natural Gas in the World, Cedigaz, Paris, various editions up to 2015.
Direct communication with the National Institute on Statistics and Forecasting of Turkmenistan, November 1999 and January 2001.
IEA Secretariat estimates.
Ukraine
General notes
Data for Ukraine are available starting in 1990. Prior to that, they are included in Former Soviet Union.
Ukraine is one of the 11 EU4Energy focus countries.
Due to limited information being available to the State Statistics Service of Ukraine from part of the Donetsk and Luhansk regions of Ukraine and from the Autonomous Republic of Crimea, breaks in the time series may occur after 2013.
The IEA Secretariat and State Statistics Service of Ukraine are working closely on the improvement of data quality, and in particular revision of historical data. Therefore, breaks in time series may occur be-tween 2006 and 2007.
For the period 2007 to 2015 the transparency of data may be reduced because of confidentiality issues. For instance: peat includes lignite; other kerosene includes aviation fuels (aviation gasoline, gasoline-type jet fuel and kerosene-type jet fuel); other products include petroleum coke.
Coal
Official Ukrainian coal statistics refer to unwashed and unscreened coal prior to 1995. IEA statistics normally refer to coal after washing and screening for the removal of inorganic matter. Therefore, the IEA Secretariat has
176 - WORLD ENERGY BALANCES: DATABASE DOCUMENTATION (2017 edition)
INTERNATIONAL ENERGY AGENCY
revised Ukrainian coal supply and demand statistics downward to reflect levels of washed coal.
The breakdown of coal by type for 2016p has been estimated by the IEA Secretariat.
Bituminous coal “From other sources” refers to coal mined in informal sector.
Due to a plant closure in 2008, a stock of lignite/peat became available, without details about its consump-tion. This may lead to breaks in time series and high statistical difference for 2008.
In 2015, some inputs to oven coke production may be missing leading to high efficiency.
Oil
Large statistical differences still exist for some oil products such as transport fuels and LPG. These are due to identified reporting issues in Ukraine. The State Statistics Service of Ukraine continues to work with data reporters to try and resolve these issues.
Due to limited information being available from one of the refining companies, data for motor gasoline, gas/diesel oil, fuel oil, bitumen and other hydrocarbons are estimated by the State Statistics Service of Ukraine. Breaks in the time series may occur between 2014 and 2015.
Natural gas
The data for the stock draw and statistical difference of natural gas in 2010 are a consequence of the accounting method chosen by the Ukrainian admi-nistration to reflect the ruling of the Stockholm Arbitration Tribunal of 30 March 2010.
Gas stocks include stocks supplied to the Autonomous republic of Crimea.
Biofuels and waste
Charcoal production includes pyrolysis and calculated amounts of traditional production from 2008.
Electricity and heat
Statistical difference for electricity includes electricity supplied to the Autonomous Republic of Crimea and the Donetsk and Luhansk regions of Ukraine.
Information on electricity used for pumped hydro is available from 2012 only.
Sources
Sources 2007 to 2015:
Direct communication with the State Statistics Service of Ukraine, Kiev.
Joint IEA/Eurostat/UNECE annual energy questionnaires.
Sources 1992 to 2006:
Joint IEA/Eurostat/UNECE annual energy questionnaires.
Direct communication with the Ministry of Statistics, the Coal Ministry, the National Dis-patching Company, 1995.
Coal: Direct communication with the State Mining University of Ukraine, 1995, 1996.
Natural gas: Direct communication with Ukrgazprom, February 1995.
Direct communication with the Ministry of Statistics of the Ukraine, July 1994.
Ukraine in 1992, Statistical Handbook, Ministry of Statistics of the Ukraine, Kiev, 1993.
Ukraine Power Demand and Supply Options, The World Bank, Washington, 1993.
Power Industry in Ukraine, Ministry of Power and Electrification, Kiev, 1994.
Energy Issues Paper, Ministry of Economy, March 1995.
Ukraine Energy Sector Statistical Review 1993, 1994, 1995, 1996, 1997, The World Bank Regional Office, Kiev, 1994, 1995, 1996, 1997, 1998.
Global Energy Saving Strategy for Ukraine, Comm-ission of the European Communities, TACIS, Madrid, July 1995.
IEA Secretariat estimates.
Sources 1990 to 1991:
IEA Secretariat estimates.
Sources for biofuels and waste:
Statistical Office in Kiev, The World Bank and IEA Secretariat estimates.
United Arab Emirates
General notes
Crude oil production and export data do not include field condensate. Field condensate quantities are included with natural gas liquids.
In 2013, time series on electricity imports and exports were revised due to new information available on international trade at the interconnectors for the
WORLD ENERGY BALANCES: DATABASE DOCUMENTATION (2017 edition) - 177
INTERNATIONAL ENERGY AGENCY
United Arab Emirates. This may lead to revisions to these time series from 2007.
Time series revisions in NGL production were advised by the Federal Competitiveness and Statistical Authority. Breaks in time series can be observed in 2011 for NGLs.
In 2015, time series for oil and gas data were revised according to data from Federal Competitiveness and Statistical Authority. Time series breaks can be ob-served in 2009 for crude oil production and trade.
In 2015, Ruwais refining complex expansion was completed, significantly increasing refined oil product production and oil industry own use for refinery inputs.
In 2015, time series for coal data were revised according to data from the Federal Competitiveness and Statistical Authority. Break in time series can be observed in 2009.
Sources
Sources 1993 to 2015:
Direct communication with Federal Competitive-ness and Statistics Authority, Dubai.
Direct communication with United Arab Emirates Ministry of Energy, Dubai.
Annual Statistical Report, Organization of Arab Petroleum Exporting Countries (OAPEC), Kuwait, various editions up to 2016.
Natural Gas in the World, Cedigaz, Paris, various editions up to 2016.
Statistical Bulletin, Arab Union of Producers, Transporters and Distributors of Electricity (AUPTDE), Amman, various editions up to 2016
Annual Statistical Bulletin, Organization of Petrol-eum Exporting Countries (OPEC), Vienna, various editions up to 2015.
Statistical Data for Electricity and Water 2015-2014, United Arab Emirates Ministry of Energy, Dubai.
Statistical Report 1999-2015, Abu Dhabi Water & Electric Company (ADWEC), Abu Dhabi, 2015.
Annual Report, Regulation & Supervision Bureau of Abu Dhabi, Abu Dhabi, various editions up to 2012.
Statistical Yearbook 1995, 1996, 1998, Depart-ment of Planning, Abu Dhabi, 1998, 2001.
Direct communication with the National Bureau of Statistics of the United Arab Emirates, Abu Dhabi.
Direct communication with the Ministry of Electricity and Water, Abu Dhabi, March 2001.
The UN Energy Statistics Database.
IEA Secretariat estimates.
Sources up to 1992:
Annual Report 1998, Ministry of Electricity & Water, Dubai.
Abu Dhabi National Oil Company, 1985 Annual Report, Abu Dhabi National Oil Company, Abu Dhabi, 1986.
United Arab Emirates Statistical Review 1981, Ministry of Petroleum and Mineral Resources, Abu Dhabi, 1982.
Annual Statistical Abstract, Ministry of Planning, Central Statistical Department, Abu Dhabi, various editions from 1980 to 1993.
Sources for biofuels and waste:
Forestry Statistics, FAO, Rome, 2001.
IEA Secretariat estimates.
Initial National Communication to the United Nations Framework Convention on Climate Change, Ministry of Energy, United Arab Emirates, 2006.
Uruguay
General notes
The pronounced growth in production of biofuels and waste from 2007 to 2010 is a result of the develop-ment of the pulp and paper industry.
The power produced from the Salto Grande hydro-electric plant, located on the Uruguay River between Concordia in Argentina and Salto in Uruguay is equally shared between the two countries. Exports include power produced in Salto Grande and exported to Argentina.
The refinery was shut down for maintenance in 1993-1994. This explains the low refinery output observed in 1993 and the absence of output in 1994..
Sources
Sources 1990 to 2015:
Direct communication with Dirección Nacional de Energía, Ministerio de Industria, Energía y Minería, Montevideo
178 - WORLD ENERGY BALANCES: DATABASE DOCUMENTATION (2017 edition)
INTERNATIONAL ENERGY AGENCY
Balance Energético Nacional, Ministerio de Industria, Energía y Minería, Dirección Nacional de Energía, Montevideo, 1971 to 2015.
Energy-Economic Information System (SIEE), Latin American Energy Organization (OLADE), Quito, accessed April 2017: http://sier.olade.org/.
IEA Secretariat estimates.
Uzbekistan
General notes
Data for Uzbekistan are available starting in 1990. Prior to that, they are included in Former Soviet Union.
Uzbekistan is one of the 11 EU4Energy focus countries.
Very little data for Uzbekistan are currently available. Supply data are available from secondary sources and consumption is estimated. To indicate the lack of data certain figures for 2015 have deliberately been kept equal to 2014.
Sources
Sources 2015:
Asian Development Bank online database.
IEA Secretariat estimates.
Sources 1990 to 2014:
Asian Development Bank online database.
CIS and East European Energy Databook, Eastern Bloc Research Ltd, Tolsta Chaolais, various editions up to 2014.
Direct communication with the Interstate Statist-ical Committee of the Commonwealth of Independent States.
Direct communications to the IEA Secretariat from the Institute of Power Engineering and Automation, Academy of Sciences of Uzbekistan 1994, 1996, 1998 to 2003.
Joint IEA/Eurostat/UNECE annual energy ques-tionnaires, 1995 to 1997.
IEA Secretariat estimates.
Venezuela
General notes
In 2015, new information on the production and con-sumption of refinery gas since 2007 became available.
For this reason, breaks in time series may occur be-tween 2006 and 2007.
Data for crude oil production are obtained from Petróleos de Venezuela S.A. (PDVSA) with an estimate of lease condensate removed. Crude oil production data are comparable to data reported by the Organization of the Petroleum Exporting Countries (OPEC) and the Organización Latino Americana de Energia (OLADE); however, some other sources of information report lower crude oil production, noting other components may be included in the crude oil production data reported in the above sources.
Lease condensate quantities are included in the product NGL from 2000. This may lead to breaks in time series for some products between 1999 and 2000.
Revised data for the years 2005-2011 were provided by OLADE for Venezuela. These revisions may lead to breaks in time series between 2004 and 2005 and differences in trends in comparison to previous editions.
Sources
Sources up to 2015:
Energy-Economic Information System (SIEE), Latin American Energy Organization (OLADE), Quito, accessed May 2017: http://sier.olade.org/.
Natural Gas in the World, Cedigaz, Paris, various editions up to 2016.
Petróleos de Venezuela S.A. (PDVSA) 2015 Annual Report, Petróleos de Venezuela, Caracas.
Estadísticas consolidadas, Cámara Venezolana de la Industria Eléctrica, 1996 to 2007.
Oficina de operatión de sistemas interconectados Venezuela, 2008.
Petróleo y Otros Datos Estadísticos, Dirección General Sectorial de Hidrocarburos, Caracas, 1983 to 1991, 1993 to 2004, 2007 to 2008.
Balance Energético de Venezuela, Dirección de Planificación Energética, Ministerio de Energía y Minas, Caracas, 1971 to 2005.
Transformando la energía en desarrollo social, CVG EDELCA Informe Anual 2006.
Compendio Estadístico del Sector Eléctrico, Ministerio de Energía y Minas, Dirección de Electricidad, Carbón y Otras Energías, Caracas, 1984, 1989, 1990, 1991.
Memoria y Cuenta, Ministerio de Energía y Minas, Caracas, 1991.
WORLD ENERGY BALANCES: DATABASE DOCUMENTATION (2017 edition) - 179
INTERNATIONAL ENERGY AGENCY
IEA Secretariat estimates.
Sources for biofuels and waste:
The UN Energy Statistics Database.
Viet Nam
General notes
Data for stock changes may contain statistical differences for some energy products.
Sources
Sources 1992 to 2015:
Direct communication with the Institute of Energy and the Ministry of Industry and Trade, Hanoi.
Vietnam Energy Balance Tables, General Direct-orate of Energy, Ministry of Industry and Trade, Hanoi, various editions up to 2015.
Statistical Yearbook of Vietnam & Statistical Handbook, General Statistics Office of Vietnam (GSO), Hanoi, various editions up to 2015.
Yearbook, Vietnam Energy (Năng Lượng Việt Nam), Hanoi, 2012.
Annual Report 2006, Petrovietnam, Vietnam national Oil and Gas Group.
Direct communications with the Center for Energy-Environment Research and Development, Pathumthami, 1997 to 1999.
Sectoral Energy Demand in Vietnam, UNDP Economic and Social Commission for Asia and the Pacific, Bangkok, 1992.
Energy Commodity Account of Vietnam 1992, Asian Development Bank, Manila, 1994.
World Economic Problems (20), National Centre for Social Sciences of the S.R. Vietnam, Institute of World Economy, Hanoi, 1993.
Vietnam Energy Review, Institute of Energy, Hanoi, 1995, 1997, 1998.
APEC annual energy statistics questionnaires.
IEA Secretariat estimates.
Sources for biofuels and waste:
IEA Secretariat estimates based on 1992 data from Vietnam Rural and Household Energy Issues and Options: Report No. 161/94, The World Bank, ESMAP, Washington, D.C., 1994.
Yemen
General notes
Oil and gas pipeline sabotage was reported in 2012 due to unrest in Yemen. Breaks in time series between 2011 and 2012 as well as between 2012 and 2013 may be observed because of this.
Oil and gas activity was halted in 2015 due to military conflict, affecting 2015 oil and oil products data.
Some revisions to 2014 oil data are due to receipt of Ministry of Planning reports.
Sources
Sources 2011 to 2015:
Direct communication with the Ministry of Planning and International Cooperation, Sana’a.
Direct communication with Aden Refinery, Aden.
Statistical Bulletin, Arab Union of Producers, Transporters and Distributors of Electricity (AUPTDE), Amman, various editions up to 2015.
Natural Gas in the World, Cedigaz, Paris, various editions up to 2016.
Statistical Yearbook, Central Statistical Organiz-ation, Sana’a, various editions up to 2013.
Household Budget Survey 2005/2006, Central Statistical Organization, Sana’a.
Petroleum Subsidies in Yemen, IFPRI, 2011.
Sources 1991 to 2010:
Yemen Petroleum Company, online statistics, 2010.
Oil & Gas in Figures 2001 – 2007, Ministry of Oil & Minerals, Statistics Technical Committee, Yemen, 2008.
Oil, Gas and Minerals Statistics, Annual Bulletin 2001, 2002, 2003, 2004, 2005 and 2006, Ministry of Oil & Minerals, Statistics Technical Committee, Yemen, 2001 to 2007.
Direct communications with the Yemen General Oil and Gas Corporation, the Public Electricity Corporation, and the National Information Center, Sana’a, 2001.
Statistical Indicators in the Electricity Sector, Ministry of Planning and Development, Central Statistical Organization, Yemen, 1993.
IEA Secretariat estimates.
180 - WORLD ENERGY BALANCES: DATABASE DOCUMENTATION (2017 edition)
INTERNATIONAL ENERGY AGENCY
Sources up to 1991:
Statistical Yearbook, Government of Yemen Arab Republic, Yemen, 1988.
Sources for biofuels and waste:
The UN Energy Statistics Database.
Forestry Statistics, FAO, Rome, 2000.
IEA Secretariat estimates.
Former Yugoslavia
General notes
Data for individual countries of the Former Yugoslavia are available starting in 1990, and most of the information on 1990 and 1991 was estimated by the IEA Secretariat. Because of large breaks in reporting which occurred in the early 1990’s, breaks in time series may occur in 1990 for all regional totals.
Sources
Sources up to 1989:
Statisticki Godisnjak Yugoslavije, Socijalisticka Federativna Rebublika Jugoslavija, Savezni Zavod Za Statistiku, Beograd, 1985 to 1991.
Indeks, Socijalisticka Federativna Rebublika Jugoslavija, Beograd, 1990, 1991, 1992.
Zambia
General notes
Crude oil imports reported by Zambia’s Energy Regul-ation Board include petroleum feedstocks comprised of crude oil, naphtha, condensate, and gasoil.
A fire damaged the sole oil refinery (Indeni) in Zambia in 2000. Therefore, breaks in time series may occur between 1999 and 2000, as well as between 2000 and 2001.
In 2015, information on refinery yields was obtained and applied to the refinery production from 2001. Therefore, breaks in time series may occur between 2000 and 2001.
Sources
Sources 1971 to 2015:
Statistical Bulletin. Energy Regulation Board, Lusaka, 2016.
Energy Sector Report. Energy Regulation Board, Lusaka, various editions up to 2015.
Petroleum Industry Statistics, Energy Regulation Board, Lusaka. Various editions up to 2015.
Institutional Framework and Storage and Trans-portation Infrastructure of the Zambian Petroleum Supply Chain (DRAFT), Government of the Republic of Zambia, 2007.
Economic Report 2003, Ministry of Finance, Lusaka.
Energy Statistics Bulletin 1980-1999, The Depart-ment of Energy, Lusaka, 2000.
AFREPREN, 2002.
Annual Statistical Yearbook 1993, 1994, 1995 (Consumption in Zambia 1978-1983), Eskom, Lusaka, 1984.
IEA Secretariat estimates.
Sources for biofuels and waste:
IEA Secretariat estimates based on 1991 data from Forests and Biomass Sub-sector in Africa, African Energy Programme of the African Development Bank, Abidjan, 1996.
Zimbabwe
General notes
A new mining company was commissioned in 2011, leading to a rapid increase in coal production. Due to limited availability of coal consumption data, the IEA Secretariat has estimated coal stocks for Zimbabwe. Breaks in time series may occur between 2013 and 2014 because of this.
More detailed data on energy consumption is available from the Census of Industrial Production (ZimStat) since 2009. Breaks in time series may occur between 2008 and 2009 because of this.
More detailed data on road fuel imports is available since 2011. Breaks in time series may occur between 2010 and 2011 because of this.
Sources
Sources 2006 to 2015:
Direct communication with the Ministry of Energy and Power Development, Harare.
Census of Industrial Production (CIP), Zimbabwe National Statistics Agency (ZimStat), Harare, Various editions up to 2015.
WORLD ENERGY BALANCES: DATABASE DOCUMENTATION (2017 edition) - 181
INTERNATIONAL ENERGY AGENCY
Direct communication with the Zimbabwe National Statistical Agency (ZimStat), Harare.
Annual Report, Zimbabwe Power Company (ZPC), Harare, various editions from 2010 up to 2012.
IEA Secretariat estimates.
Sources 1996 to 2005:
Direct communication with the Ministry of Energy and Power Development.
Direct communication with the Zimbabwe Electricity Supply Authority (ZESA), 2003, 2005, 2006.
African Economic Outlook 2004, OECD, Paris, 2004.
Direct communication with the Department of Energy Resources and Development, February 2002, AFREPREN, 2002.
Direct communication with the Ministry of Environment and Tourism, Harare, 1999, 2000.
Direct communication with the electricity utility.
Electricity Statistics Information, Central Statist-ical Office, Causeway, February 1998.
IEA Secretariat estimates.
Sources 1992 to 1995:
Eskom Annual Statistical Yearbook 1993, 1994, 1995, Johannesburg, 1994, 1995, 1996, citing Zimbabwe Electricity Supply Authority, Harare as source.
The UN Energy Statistics Database.
Sources up to 1991:
Zimbabwe Statistical Yearbook 1986, Central Statistical Office, Harare, 1990.
Quarterly Digest of Statistics, Central Statistical Office, Harare, 1990.
Zimbabwe Electricity Supply Authority Annual Report, Zimbabwe Electricity Supply Authority, Harare, 1986 to 1991.
Sources for biofuels and waste:
IEA Secretariat estimates based on 1991 data from Forests and Biomass Sub-sector in Africa, African Energy Programme of the African Development Bank, Abidjan, 1996.
Other Africa
General notes
Time series for this region are obtained by summing data corresponding to individual countries (see lists in section I.5, Geographical coverage). As a con-sequence, intra-regional trade is included as part of total trade. Therefore, trade is likely to be overstated.
The UN Statistics Division database is the main data source for the countries not listed individually and included in the region. At the time when this edition was prepared only 2014 data were available. As a consequence, all data points for 2015 have been estimated based on developments in population and GDP in the region.
In 2015 data for bagasse use in the transformation sector in autoproducer electricity plants, main activity producer CHP plants and autoproducer CHP plants became available for the years 2011-2013. This may lead to breaks in time series between 2010 and 2011.
Since 2015 edition, data for Niger are no longer included in Other Africa for the period 2000-2015. This may lead to breaks in time series between 1999 and 2000.
Sources
Sources up to 2015:
The UN Energy Statistics Database.
IEA Secretariat estimates.
Other non-OECD Asia
General notes
Time series for this region are obtained by summing data corresponding to individual countries (see lists in section I.5, Geographical coverage). As a con-sequence, intra-regional trade is included as part of total trade. Therefore, trade is likely to be overstated.
The UN Statistics Division database is the main data source for the countries not listed individually and included in the region. At the time when this edition was prepared only 2014 data were available. As a consequence, all data points for 2015 have been estimated based on developments in population and GDP in the region.
182 - WORLD ENERGY BALANCES: DATABASE DOCUMENTATION (2017 edition)
INTERNATIONAL ENERGY AGENCY
In this edition only UN data for the period 2011-2014 were uploaded which may create breaks in time series between 2010 and 2011.
Sources
Sources up to 2015:
The UN Energy Statistics Database.
IEA Secretariat estimates.
Other non-OECD Americas
General notes
Time series for this region are obtained by summing data corresponding to individual countries (see lists in section I.5, Geographical coverage). As a con-sequence, intra-regional trade is included as part of total trade. Therefore, trade is likely to be overstated.
The UN Statistics Division database is the main data source for the countries not listed individually and included in the region. At the time when this edition was prepared only 2014 data were available. As a consequence, all data points for 2015 have been estimated based on developments in population and GDP in the region.
The refinery in Aruba was shut down in September 2012. This may lead to breaks in time series for the period 2011-2013.
Energy data for Bonaire, Saba, Saint Eustratius and Sint Maarten are included in Other non-OECD Americas for the period 2012-2015.
Data for Suriname are no longer included in Other non-OECD America’s for the period 2000-2014. This may lead to breaks in time series between 1999 and 2000.
Sources
Sources up to 2015:
Annual Statistical Digest of the Central Bank of Aruba.
The economy of Curacao and Sint Maarten in Data and Charts Yearly Overview.
The UN Energy Statistics Database.
IEA Secretariat estimates.
Memo: Greenland
Sources
Sources 2004 to 2015:
Direct communication with Statistics Greenland, Nuuk.
Statbank Greenland, accessed December 2016, http://bank.stat.gl
IEA Secretariat estimates.
Sources for biofuels and waste:
Statbank Greenland, accessed December 2016, http://bank.stat.gl
IEA Secretariat estimates.
Memo: Mali
Sources
Sources 2000 to 2015:
Direct communication with the Ministère de l’Energie et de l’Eau, Bamako.
Système d’Information Energétique du Mali 2014 and 2015, Ministère de l’Energie et de l’Eau, Bamako, 2015 and 2017.
Rapport Annuel 2011 to 2015, Energie du Mali, Bamako, 2012 to 2016.
AFREC Energy questionnaire, African Energy Commission, 2000 to 2015.
Sources for biofuels and waste:
AFREC Energy questionnaire, African Energy Commission, 2000 to 2015.
IEA Secretariat estimates.
WORLD ENERGY BALANCES: DATABASE DOCUMENTATION (2017 edition) - 183
INTERNATIONAL ENERGY AGENCY
7. METHODOLOGICAL NOTES
This publication is based on the data in physical units of the IEA World Energy Statistics publication, which follow the definitions of the United Nations International Recommendations for Energy Statistics (IRES)20 and on the IEA energy balance methodology, briefly summarised below.
Energy balance: key concepts
Energy data are generally collected independently across different commodities. Energy statistics are the simplest format to present all the data together, assembling the individual balances of all products, each expressed in its own physical unit (e.g. TJ for natural gas, kt for coal, etc). These are called commodity balances.
However, energy products can be converted into one another through a number of transformation processes. Therefore, it is very useful to also develop one comprehensive national energy balance, to understand how products are transformed into one another, and to highlight the various relationships among them.
By presenting all the data in a common energy unit, the energy balance allows users to see the total amount of energy used and the relative contribution of each different source, for the whole economy and for each individual consumption sector; to compute the different fuel transformation efficiencies; to develop various aggregated indicators (for example
20. http://unstats.un.org/unsd/energy/ires/IRES_Whitecover.pdf.
consumption per capita or per unit of GDP) and to estimate CO2 emissions from fuel combustion.
The energy balance is a natural starting point to study the evolution of the domestic energy market, forecast energy demand, monitor impacts of energy policies and assess potential areas for action. The statistician also uses the energy balance as a high-level check on the data accuracy, as large statistical differences in energy units, apparent energy gains or large losses in transformation processes, or large unexplained variations in shares or in high-level indicators may all indicate underlying data problems.
The energy balance takes the form of a matrix, where columns present all the different energy sources (“products”) categories and rows represent all the different “flows”, grouped in three main blocks: energy supply, transformation/energy use and final consumption.
To develop an energy balance from the set of commodity balances, the two main steps are: i) all the data are converted to a common energy unit – also allowing to compute a “total” product; and ii) some re-formatting is performed to avoid double counting when summing all products together. For example, for secondary products (e.g. motor gasoline) the production appears in the production row in commodity balances, but is reported as an output of the relevant transformation (e.g. oil refineries) in an energy balance, where the production row only refers to production of primary products (e.g. crude oil).
The methodological assumptions underlying energy balances, discussed in the next section, are particularly important to understand differences across balances derived by different national and international organ-isations starting from the same energy commodity data.
184 - WORLD ENERGY BALANCES: DATABASE DOCUMENTATION, (2017 edition)
INTERNATIONAL ENERGY AGENCY
IEA energy balances methodology
The unit adopted by the IEA is the tonne of oil equivalent (toe), defined as 107 kilocalories (41.868 gigajoules). This quantity of energy is, within a few per cent, equal to the net heat content of 1 tonne of crude oil. Conversion of the IEA energy balances to other energy units would be straightforward.
The main methodological choices underlying energy balances that can differentiate the final balances layout across organisations are: i) “net” versus “gross” energy content; ii) calorific values; and iii) primary energy conventions.
Net versus gross energy content
The IEA energy balances are based on a “net” energy content, which excludes the energy lost to produce water vapour during combustion. All the elements of the energy balance are expressed on the same net basis to ensure comparability. Even elements (e.g. natural gas) that in commodity balances may be already in energy units but on a different basis (e.g. “gross”) are converted (e.g. from “gross” to “net”).
The difference between the "net" and the "gross" calorific value for each fuel is the latent heat of vaporisation of the water produced during combustion of the fuel. For coal and oil, the net calorific value is about 5% less than gross, for most forms of natural and manufactured gas the difference is 9-10%, while for electricity and heat there is no difference as they are not combusted.
Calorific values
Generally, the IEA adopts country-specific, time-varying, and for some products flow-dependent, net calorific values supplied by national administrations for most products; and regional default values (in conjunction with Eurostat for the European countries) for the oil products. More detailed explanations on the IEA conversion to energy units for the different energy sources are given in Section 2, Units and conversions.
Primary energy conventions
A very important methodological choice is the definition of the “primary energy equivalent” for the electricity and heat produced from non-combustible sources, such as nuclear, geothermal, solar, hydro, wind. The information collected is generally the amount of electricity and heat produced, represented
in the balance as an output of transformation. Conventions are needed to compute the most appropriate corresponding primary energy, input to the transformation, both in form and in amount.
The principle adopted by the IEA is that the primary energy form is the first energy form downstream in the production process for which multiple energy uses are practical. For example, the first energy form that can be used as energy in the case of nuclear is the nuclear heat of the reactor, most of which is then transformed into electricity. The application of this principle leads to the choice of the following primary energy forms:
Electricity for primary electricity (hydro, wind, tide/wave/ocean and solar photovoltaic).
Heat for heat and secondary electricity (nuclear, geothermal and solar thermal).
Once the primary energy form is identified for all electricity and heat generated from non-combustible sources, the IEA adopts the physical energy content method to compute the corresponding primary energy equivalent amounts: the primary energy equivalent is simply the physical energy content of the corresponding primary energy form.
For primary electricity, such as hydro and solar PV, as electricity is identified as the primary energy form, the primary energy equivalent is simply the gross electricity generated in the plant.
For nuclear electricity, the primary energy equivalent is the quantity of heat generated in the reactors. In the absence of country-specific information, the IEA estimates the primary energy equivalent from the electricity generated by assuming an efficiency of 33%, derived as the average efficiency of nuclear power plants across Europe. Note that the principle of using the heat from nuclear reactors as the primary energy form for the energy statistics has an important effect on any indicators of energy supply dependence. Under the present convention, the primary nuclear heat appears as an indigenous resource. However, the majority of countries using nuclear power import their nuclear fuel, and if this fact could be taken into account, it would lead to an increase in the supply dependence on other countries.
For geothermal electricity, the primary energy equivalent is the quantity of heat and a similar back-calculation is used where the quantities of steam supplied to the plant are not measured, assuming a thermal efficiency of 10%. This figure is only approximate and reflects the fact that the steam from
WORLD ENERGY BALANCES: DATABASE DOCUMENTATION (2017 edition) - 185
INTERNATIONAL ENERGY AGENCY
geothermal sources is generally of low quality. If data for the steam input to geothermal power plants are available, they are used directly as primary energy equivalent.
Similarly, for solar thermal plants the heat supply is back-calculated assuming a 33% efficiency of conversion of heat into electricity, reflecting relatively low working temperatures, although central receiver systems can reach higher temperatures and therefore higher efficiencies.
In summary, for geothermal and solar thermal, if no country-specific information is reported, the primary energy equivalent is calculated using the following efficiencies:
10% for geothermal electricity;
50% for geothermal heat;
33% for solar thermal electricity;
100% for solar thermal heat.
An alternative to the physical energy content method is the partial substitution method, used in the past by the IEA. In this case, the primary energy equivalent of the electricity generated from non-combustible sources is computed as the hypothetical amount of energy necessary to generate the same amount of electricity in thermal power plants, assuming an average generation efficiency. The method was abandoned by the IEA and other organisations because it had little meaning for countries with significant hydro electricity generation, and because the actual substitution values were hard to establish, as they depended on the efficiency of the marginal electricity production. It also had unreal effects on the energy balance, as transformation losses appeared without a physical basis.
Since the two methods differ significantly in the treatment of solar, hydro, etc., the share of renewables in total energy supply varies depending on the method. To interpret shares of various energy sources in total supply, it is important to understand the conventions used to calculate the primary energy supply.
186 - WORLD ENERGY BALANCES: DATABASE DOCUMENTATION (2017 edition)
INTERNATIONAL ENERGY AGENCY
8. NOTES ON DATA QUALITY
Methodology
For OECD Member countries, the data shown in this publication are derived based on information provided in the five annual OECD questionnaires21: “Oil”, “Natural Gas”, “Solid Fossil Fuels and Manufactured Gases”, “Renewables” and “Electricity and Heat” completed by the national administrations. For the member countries of the Economic Commission for Europe of the United Nations (UNECE) and a few others, the data shown in this publication are mostly based on information provided by the national administrations through the same annual questionnaires. The commodity balances for all other countries are based on national energy data of heterogeneous nature, converted and adapted to fit the IEA format and methodology.
Considerable effort has been made to ensure that the data presented in this publication adhere to the IEA definitions reported in the section on Methodological notes. These definitions, based on the United Nations International Recommendations on Energy Statistics 22 , are used by most of the international organisations that collect energy statistics.
Nevertheless, energy statistics at the national level are often collected using criteria and definitions which differ, sometimes considerably, from those of international organisations. This is especially true for non-OECD countries, which are submitting data to the IEA on a voluntary basis. The IEA Secretariat has identified most of these differences and, where possible, adjusted the data to meet international definitions.
21. See link to the annual questionnaires: www.iea.org/statistics/resources/questionnaires/annual/ 22. http://unstats.un.org/unsd/energy/ires/IRES_Whitecover.pdf.
Recognised anomalies occurring in specific countries are presented in the section on Country notes and sources. Country notes present the most important deviations from the IEA methodology, and are by no means a comprehensive list of anomalies by country.
Estimation
In addition to adjustments addressing differences in definitions, estimations23 are sometimes required to complete major aggregates, when key statistics are missing.
The IEA secretariat has attempted to provide all the elements of energy balances down to the level of final consumption, for all countries and years. Providing all the elements of supply, as well as all inputs and outputs of the main transformation activities (such as oil refining and electricity generation), has often required estim-ations. Estimations have been generally made after con-sultation with national statistical offices, oil companies, electricity utilities and national energy experts.
Time series and political changes
The IEA secretariat reviews its databases each year. In the light of new assessments, important revisions may be made to time series of individual countries during the course of this review. Therefore, some data in this publication have been substantially revised with respect to previous editions. Please always consult the section on Country notes and sources.
23. Data may not include all informal and/or illegal trade, production or consumption of energy products, although the IEA Secretariat makes efforts to estimate these where reliable information is available.
WORLD ENERGY BALANCES: DATABASE DOCUMENTATION (2017 edition) - 187
INTERNATIONAL ENERGY AGENCY
More in general, energy statistics for some countries undergo continuous changes in their coverage or methodology. Consequently, breaks in time series are considered to be unavoidable.
For example, energy balances for the individual countries of the Former Soviet Union and the Former Yugoslavia have been constructed since 1990 and are not available for previous years. These balances are generally based on official submissions, but estimations also have been made by the IEA secretariat. The section on Country notes and sources describes in detail these elements country by country.
Classification of fuel uses
National statistical sources often lack adequate information on the consumption of fuels in different categories of end use. Many countries do not conduct annual surveys of consumption in the main sectors of economic activity, and published data may be based on out-of-date surveys. Therefore, sectoral disaggregation of consumption should generally be interpreted with caution.
In transition economies (countries of non-OECD Europe and Eurasia) and in China, the sectoral classification of fuel consumption before the reforms of the 1990’s significantly differed from that of market economies. Sectoral consumption was defined according to the economic branch of the user, rather than according to the purpose or use of the fuel. For example, consumption of gasoline in the vehicle fleet of an enterprise attached to the economic branch ‘Iron and steel’ was classified as consumption in the ‘Iron and steel’ industry itself.
Where possible, data have been adjusted to fit international classifications, for example by assuming that most gasoline is consumed in transport. However, it has not been possible to reclassify products other than gasoline and jet fuel as easily, and few other adjustments have been made to other products.
Imports and exports
For a given product, imports and exports may not sum up to zero at the world level for a number of reasons. Fuels may be classified differently (i.e. fuel oil exports may be reported as refinery feedstocks by the importing country; NGL exports may be reported as LPG by the importing country, etc.). Other possible reasons include discrepancies in conversion factors, inclusion of international bunkers in exports, timing differences, data reported on a fiscal year basis instead
of calendar year for certain countries, and under-reporting of imports and exports for fiscal reasons.
Specific issues by fuel
Coal
Data on sectoral coal consumption are usually reported in metric tonnes. Net calorific values of different coal types used in different end use sectors are not always available. In the absence of specific information, the IEA secretariat estimates end use net calorific values based on the available net calorific values for production, imports and exports.
Oil
The IEA secretariat collects comprehensive statistics for oil supply and use, including oil for own use of refineries, oil delivered to international bunkers, and oil used as petrochemical feedstock. National statistics often do not report all these amounts.
Reported production of refined products may refer to net rather than gross refinery output; consumption of oil products may be limited to sales to domestic markets and may not include deliveries to international shipping or aircraft. Oil consumed as petrochemical feedstock in integrated refinery/petrochemical complexes is often not included in available official statistics.
Where possible, the IEA secretariat has estimated those unreported data, in consultation with the oil industry. In the absence of any other indication, refinery fuel use is estimated to be a percentage (e.g. 5%) of refinery throughput, and where possible, split between refinery gas and fuel oil. For a descript-tion of some adjustments made to the sectoral con-sumption of oil products, see the above section ‘Classification of fuel uses’.
Natural gas
Natural gas should be comprised mainly of methane; other gases, such as ethane and heavier hydrocarbons, should be reported under the heading of ‘oil’. The IEA defines natural gas production as the marketable production, i.e. net of field losses, flaring, venting and re-injection.
However, the lack of adequate definitions makes it difficult or impossible to identify all quantities of gas at all different stages of its separation into dry gas (methane) and heavier fractions. National data for natural gas do not always explicitly show separate quantities for field losses, flaring, venting and re-injection.
188 - WORLD ENERGY BALANCES: DATABASE DOCUMENTATION (2017 edition)
INTERNATIONAL ENERGY AGENCY
Natural gas supply and demand statistics are normally reported in volumetric units and it is difficult to obtain accurate data on the calorific value. In the absence of specific information, the IEA generally applies an average gross calorific value of 38 TJ/million m3.
Reliable consumption data for natural gas at a disaggregated level are often difficult to find. This is especially true for some of the largest natural gas consuming countries in the Middle East. Therefore, industrial use of natural gas for these countries is frequently missing from the data published here.
Electricity
The IEA classification shows ‘main activity producers’ separately from ‘autoproducers’ of electricity and heat. An autoproducer of electricity is an establishment which, in addition to its main activities, generates electricity wholly or partly for its own use. For non-OECD countries, data on autoproducers are not always reported. In such cases, the quantities of fuels used as input to electricity are included under the appropriate end-use sector.
When statistics of production of electricity from biofuels and waste are available, they are included in total electricity production. However, these data are not comprehensive; for example, much of the electricity generated from waste biomass in sugar refining facilities remains unreported.
When unreported, inputs of fuels for electricity generation are estimated using information on electricity output, fuel efficiency and type of generation capacity.
Heat
For heat, transition economies (countries of non-OECD Europe and Eurasia) and China used to adopt a different methodology from that adopted in market economies. They allocated the transformation of primary fuels (coal, oil and gas) by industry into heat for consumption on site to the transformation activity ‘heat production’, not to industrial consumption, as in the IEA methodology24. The transformation output of Heat was then allocated to the various end use sectors. The losses occurring in the transformation of fuels into heat in industry were not included in final consumption of industry.
24. For autoproducer plants, the international methodology restricts the inclusion of heat in transformation processes to that sold to third parties.
Although a number of countries have recently switched to the practice of international organisations, this important issue reduces the possibility of cross-country comparisons for sectoral end use consumption between transition economies and market economies.
Biofuels and waste
The IEA publishes data on production, domestic supply and consumption of biofuels and waste for all countries and all regions.
Data for non-OECD countries are often based on secondary sources and may be of variable quality, which makes comparisons between countries difficult. For many countries, historical data are derived from surveys which were often irregular, irreconcilable and conducted at a local rather than national level.
Where historical series were incomplete or unavailable, they were estimated using a methodology consistent with the projection framework of the IEA’s 1998 edition of World Energy Outlook (September 1998). First, nation-wide domestic supply per capita of biofuels and wastes was compiled or estimated for 1995. Then, per capita supply for the years 1971 to 1994 was estimated using a log/log equation with either GDP per capita or percentage of urban population as exogenous variables, depending on the region. Finally, supply of total biofuels and waste after 1996 was estimated assuming a growth rate either constant, equal to the population growth rate, or based on the 1971-1994 trend.
Those estimated time series should be treated very cautiously. The chart below provides a broad indication of the estimation methodology and of the data quality by region.
Region Main source of data
Data quality
Exogenous variables
Africa FAO database and AfDB
low population growth rate
Non-OECD Americas
national and OLADE
high none
Asia surveys high to low
population growth rate
Non-OECD Europe and Eurasia
questionnaires and FAO
high to medium
none
Middle East FAO medium to low
none
Given the importance of vegetal fuels in the energy picture of many developing countries, balances down to final consumption by end-use for individual products or product categories have been compiled for all countries.

WORLD ENERGY BALANCES: DATABASE DOCUMENTATION (2017 edition) - 189
INTERNATIONAL ENERGY AGENCY
The IEA hopes that the inclusion of these data will encourage national administrations and other agencies active in the field to enhance the level and quality of data
collection and coverage for biofuels and waste. More details on the methodology used by each country may be provided on request and comments are welcome.
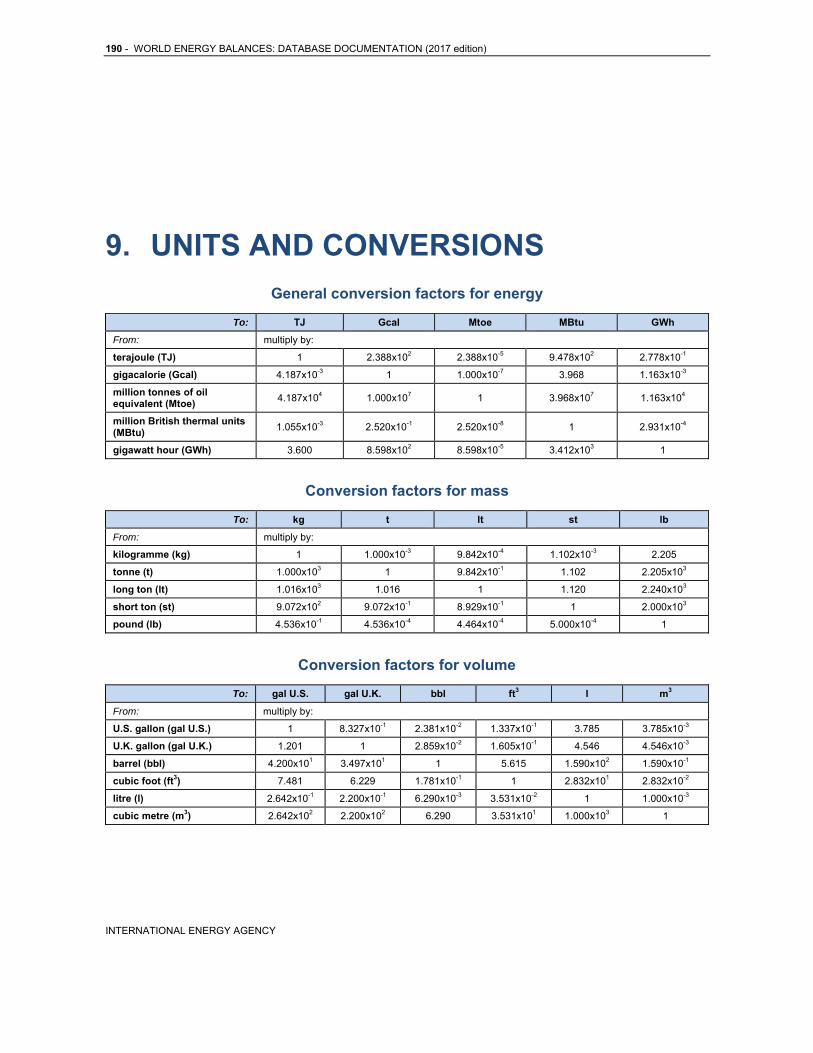
190 - WORLD ENERGY BALANCES: DATABASE DOCUMENTATION (2017 edition)
INTERNATIONAL ENERGY AGENCY
9. UNITS AND CONVERSIONS
General conversion factors for energy
To: TJ Gcal Mtoe MBtu GWh
From: multiply by:
terajoule (TJ) 1 2.388x10² 2.388x10⁻⁵ 9.478x10² 2.778x10⁻¹
gigacalorie (Gcal) 4.187x10⁻³ 1 1.000x10⁻⁷ 3.968 1.163x10⁻³
million tonnes of oil equivalent (Mtoe)
4.187x10⁴ 1.000x10⁷ 1 3.968x10⁷ 1.163x10⁴
million British thermal units (MBtu)
1.055x10⁻³ 2.520x10⁻¹ 2.520x10⁻⁸ 1 2.931x10⁻⁴
gigawatt hour (GWh) 3.600 8.598x10² 8.598x10⁻⁵ 3.412x10³ 1
Conversion factors for mass
To: kg t lt st lb
From: multiply by:
kilogramme (kg) 1 1.000x10⁻³ 9.842x10⁻⁴ 1.102x10⁻³ 2.205
tonne (t) 1.000x10³ 1 9.842x10⁻¹ 1.102 2.205x10³
long ton (lt) 1.016x10³ 1.016 1 1.120 2.240x10³
short ton (st) 9.072x10² 9.072x10⁻¹ 8.929x10⁻¹ 1 2.000x10³
pound (lb) 4.536x10⁻¹ 4.536x10⁻⁴ 4.464x10⁻⁴ 5.000x10⁻⁴ 1
Conversion factors for volume
To: gal U.S. gal U.K. bbl ft3 l m3
From: multiply by:
U.S. gallon (gal U.S.) 1 8.327x10⁻¹ 2.381x10⁻² 1.337x10⁻¹ 3.785 3.785x10⁻³
U.K. gallon (gal U.K.) 1.201 1 2.859x10⁻² 1.605x10⁻¹ 4.546 4.546x10⁻³
barrel (bbl) 4.200x101 3.497x101 1 5.615 1.590x10² 1.590x10⁻¹
cubic foot (ft3) 7.481 6.229 1.781x10⁻¹ 1 2.832x101 2.832x10⁻²
litre (l) 2.642x10⁻¹ 2.200x10⁻¹ 6.290x10⁻³ 3.531x10⁻² 1 1.000x10⁻³
cubic metre (m3) 2.642x10² 2.200x10² 6.290 3.531x101 1.000x10³ 1
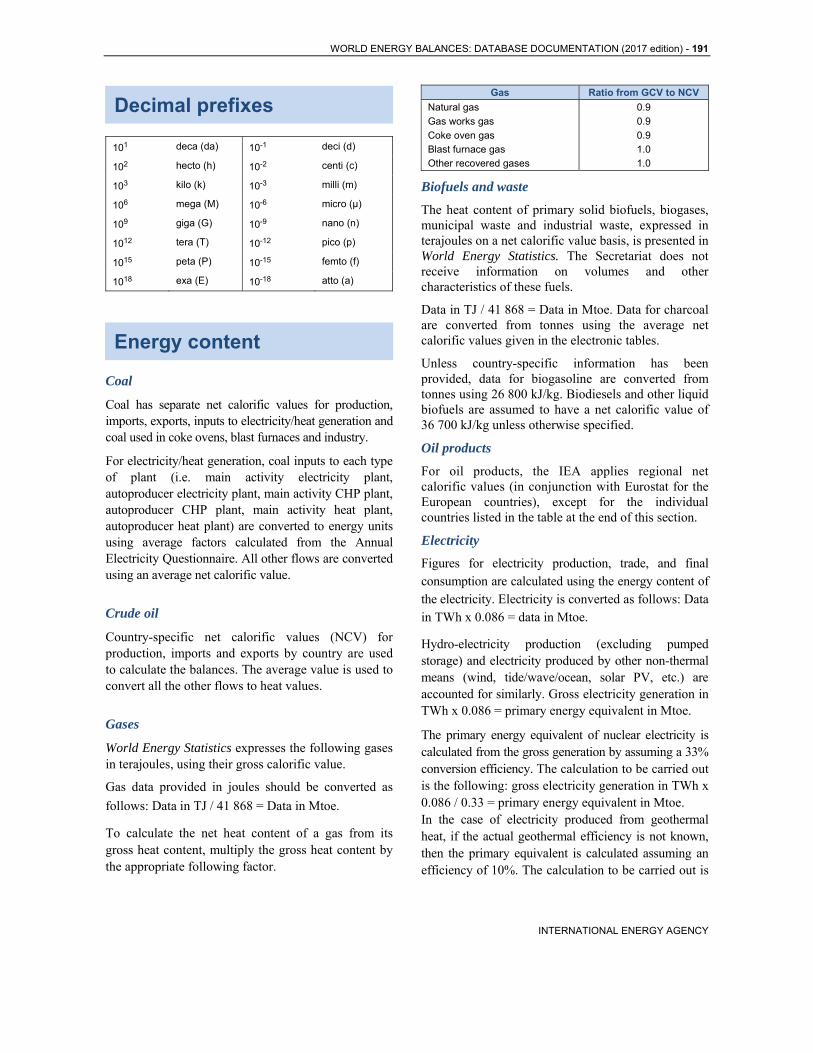
WORLD ENERGY BALANCES: DATABASE DOCUMENTATION (2017 edition) - 191
INTERNATIONAL ENERGY AGENCY
Decimal prefixes
101 deca (da) 10-1 deci (d)
102 hecto (h) 10-2 centi (c)
103 kilo (k) 10-3 milli (m)
106 mega (M) 10-6 micro (µ)
109 giga (G) 10-9 nano (n)
1012 tera (T) 10-12 pico (p)
1015 peta (P) 10-15 femto (f)
1018 exa (E) 10-18 atto (a)
Energy content
Coal
Coal has separate net calorific values for production, imports, exports, inputs to electricity/heat generation and coal used in coke ovens, blast furnaces and industry.
For electricity/heat generation, coal inputs to each type of plant (i.e. main activity electricity plant, autoproducer electricity plant, main activity CHP plant, autoproducer CHP plant, main activity heat plant, autoproducer heat plant) are converted to energy units using average factors calculated from the Annual Electricity Questionnaire. All other flows are converted using an average net calorific value.
Crude oil
Country-specific net calorific values (NCV) for production, imports and exports by country are used to calculate the balances. The average value is used to convert all the other flows to heat values.
Gases
World Energy Statistics expresses the following gases in terajoules, using their gross calorific value.
Gas data provided in joules should be converted as
follows: Data in TJ 41 868 = Data in Mtoe.
To calculate the net heat content of a gas from its gross heat content, multiply the gross heat content by the appropriate following factor.
Gas Ratio from GCV to NCV
Natural gas 0.9
Gas works gas 0.9
Coke oven gas 0.9
Blast furnace gas 1.0
Other recovered gases 1.0
Biofuels and waste
The heat content of primary solid biofuels, biogases, municipal waste and industrial waste, expressed in terajoules on a net calorific value basis, is presented in World Energy Statistics. The Secretariat does not receive information on volumes and other characteristics of these fuels.
Data in TJ 41 868 = Data in Mtoe. Data for charcoal are converted from tonnes using the average net calorific values given in the electronic tables.
Unless country-specific information has been provided, data for biogasoline are converted from tonnes using 26 800 kJ/kg. Biodiesels and other liquid biofuels are assumed to have a net calorific value of 36 700 kJ/kg unless otherwise specified.
Oil products
For oil products, the IEA applies regional net calorific values (in conjunction with Eurostat for the European countries), except for the individual countries listed in the table at the end of this section.
Electricity
Figures for electricity production, trade, and final consumption are calculated using the energy content of the electricity. Electricity is converted as follows: Data in TWh x 0.086 = data in Mtoe.
Hydro-electricity production (excluding pumped storage) and electricity produced by other non-thermal means (wind, tide/wave/ocean, solar PV, etc.) are accounted for similarly. Gross electricity generation in TWh x 0.086 = primary energy equivalent in Mtoe.
The primary energy equivalent of nuclear electricity is calculated from the gross generation by assuming a 33% conversion efficiency. The calculation to be carried out is the following: gross electricity generation in TWh x 0.086 0.33 = primary energy equivalent in Mtoe. In the case of electricity produced from geothermal heat, if the actual geothermal efficiency is not known, then the primary equivalent is calculated assuming an efficiency of 10%. The calculation to be carried out is
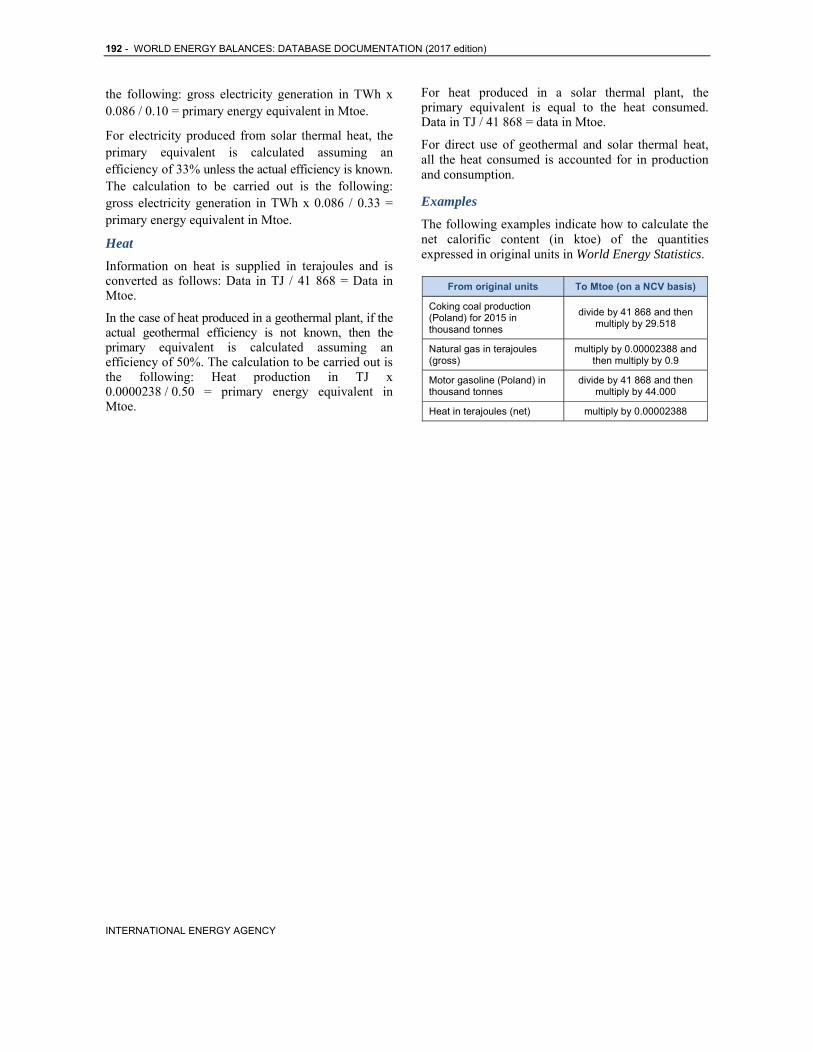
192 - WORLD ENERGY BALANCES: DATABASE DOCUMENTATION (2017 edition)
INTERNATIONAL ENERGY AGENCY
the following: gross electricity generation in TWh x 0.086 / 0.10 = primary energy equivalent in Mtoe.
For electricity produced from solar thermal heat, the primary equivalent is calculated assuming an efficiency of 33% unless the actual efficiency is known. The calculation to be carried out is the following: gross electricity generation in TWh x 0.086 / 0.33 = primary energy equivalent in Mtoe.
Heat
Information on heat is supplied in terajoules and is converted as follows: Data in TJ 41 868 = Data in Mtoe.
In the case of heat produced in a geothermal plant, if the actual geothermal efficiency is not known, then the primary equivalent is calculated assuming an efficiency of 50%. The calculation to be carried out is the following: Heat production in TJ x 0.0000238 / 0.50 = primary energy equivalent in Mtoe.
For heat produced in a solar thermal plant, the primary equivalent is equal to the heat consumed. Data in TJ 41 868 = data in Mtoe.
For direct use of geothermal and solar thermal heat, all the heat consumed is accounted for in production and consumption.
Examples
The following examples indicate how to calculate the net calorific content (in ktoe) of the quantities expressed in original units in World Energy Statistics.
From original units To Mtoe (on a NCV basis)
Coking coal production (Poland) for 2015 in thousand tonnes
divide by 41 868 and then multiply by 29.518
Natural gas in terajoules (gross)
multiply by 0.00002388 and then multiply by 0.9
Motor gasoline (Poland) in thousand tonnes
divide by 41 868 and then multiply by 44.000
Heat in terajoules (net) multiply by 0.00002388
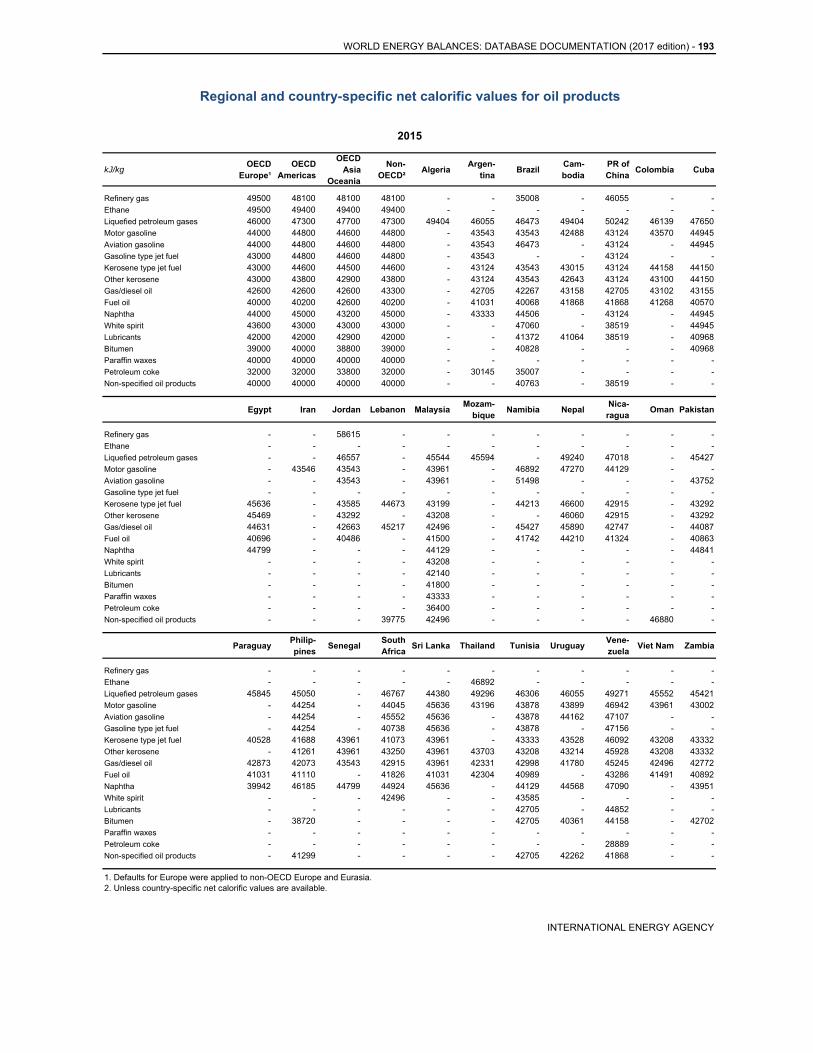
WORLD ENERGY BALANCES: DATABASE DOCUMENTATION (2017 edition) - 193
Regional and country-specific net calorific values for oil products
2015
kJ/kgOECD
Europe¹OECD
Americas
OECD Asia
Oceania
Non-OECD²
AlgeriaArgen-
tinaBrazil
Cam-bodia
PR of China
Colombia Cuba
Refinery gas 49500 48100 48100 48100 - - 35008 - 46055 - -Ethane 49500 49400 49400 49400 - - - - - - -Liquefied petroleum gases 46000 47300 47700 47300 49404 46055 46473 49404 50242 46139 47650Motor gasoline 44000 44800 44600 44800 - 43543 43543 42488 43124 43570 44945Aviation gasoline 44000 44800 44600 44800 - 43543 46473 - 43124 - 44945Gasoline type jet fuel 43000 44800 44600 44800 - 43543 - - 43124 - -Kerosene type jet fuel 43000 44600 44500 44600 - 43124 43543 43015 43124 44158 44150Other kerosene 43000 43800 42900 43800 - 43124 43543 42643 43124 43100 44150Gas/diesel oil 42600 42600 42600 43300 - 42705 42267 43158 42705 43102 43155Fuel oil 40000 40200 42600 40200 - 41031 40068 41868 41868 41268 40570Naphtha 44000 45000 43200 45000 - 43333 44506 - 43124 - 44945White spirit 43600 43000 43000 43000 - - 47060 - 38519 - 44945Lubricants 42000 42000 42900 42000 - - 41372 41064 38519 - 40968Bitumen 39000 40000 38800 39000 - - 40828 - - - 40968Paraffin waxes 40000 40000 40000 40000 - - - - - - -Petroleum coke 32000 32000 33800 32000 - 30145 35007 - - - -Non-specified oil products 40000 40000 40000 40000 - - 40763 - 38519 - -
Egypt Iran Jordan Lebanon MalaysiaMozam-
biqueNamibia Nepal
Nica-ragua
Oman Pakistan
Refinery gas - - 58615 - - - - - - - -Ethane - - - - - - - - - - -Liquefied petroleum gases - - 46557 - 45544 45594 - 49240 47018 - 45427Motor gasoline - 43546 43543 - 43961 - 46892 47270 44129 - -Aviation gasoline - - 43543 - 43961 - 51498 - - - 43752Gasoline type jet fuel - - - - - - - - - - -Kerosene type jet fuel 45636 - 43585 44673 43199 - 44213 46600 42915 - 43292Other kerosene 45469 - 43292 - 43208 - - 46060 42915 - 43292Gas/diesel oil 44631 - 42663 45217 42496 - 45427 45890 42747 - 44087Fuel oil 40696 - 40486 - 41500 - 41742 44210 41324 - 40863Naphtha 44799 - - - 44129 - - - - - 44841White spirit - - - - 43208 - - - - - -Lubricants - - - - 42140 - - - - - -Bitumen - - - - 41800 - - - - - -Paraffin waxes - - - - 43333 - - - - - -Petroleum coke - - - - 36400 - - - - - -Non-specified oil products - - - 39775 42496 - - - - 46880 -
ParaguayPhilip-pines
SenegalSouth Africa
Sri Lanka Thailand Tunisia UruguayVene-zuela
Viet Nam Zambia
Refinery gas - - - - - - - - - - -Ethane - - - - - 46892 - - - - -Liquefied petroleum gases 45845 45050 - 46767 44380 49296 46306 46055 49271 45552 45421Motor gasoline - 44254 - 44045 45636 43196 43878 43899 46942 43961 43002Aviation gasoline - 44254 - 45552 45636 - 43878 44162 47107 - -Gasoline type jet fuel - 44254 - 40738 45636 - 43878 - 47156 - -Kerosene type jet fuel 40528 41688 43961 41073 43961 - 43333 43528 46092 43208 43332Other kerosene - 41261 43961 43250 43961 43703 43208 43214 45928 43208 43332Gas/diesel oil 42873 42073 43543 42915 43961 42331 42998 41780 45245 42496 42772Fuel oil 41031 41110 - 41826 41031 42304 40989 - 43286 41491 40892Naphtha 39942 46185 44799 44924 45636 - 44129 44568 47090 - 43951White spirit - - - 42496 - - 43585 - - - -Lubricants - - - - - - 42705 - 44852 - -Bitumen - 38720 - - - - 42705 40361 44158 - 42702Paraffin waxes - - - - - - - - - - -Petroleum coke - - - - - - - - 28889 - -Non-specified oil products - 41299 - - - - 42705 42262 41868 - -
1. Defaults for Europe were applied to non-OECD Europe and Eurasia.2. Unless country-specific net calorific values are available.
INTERNATIONAL ENERGY AGENCY
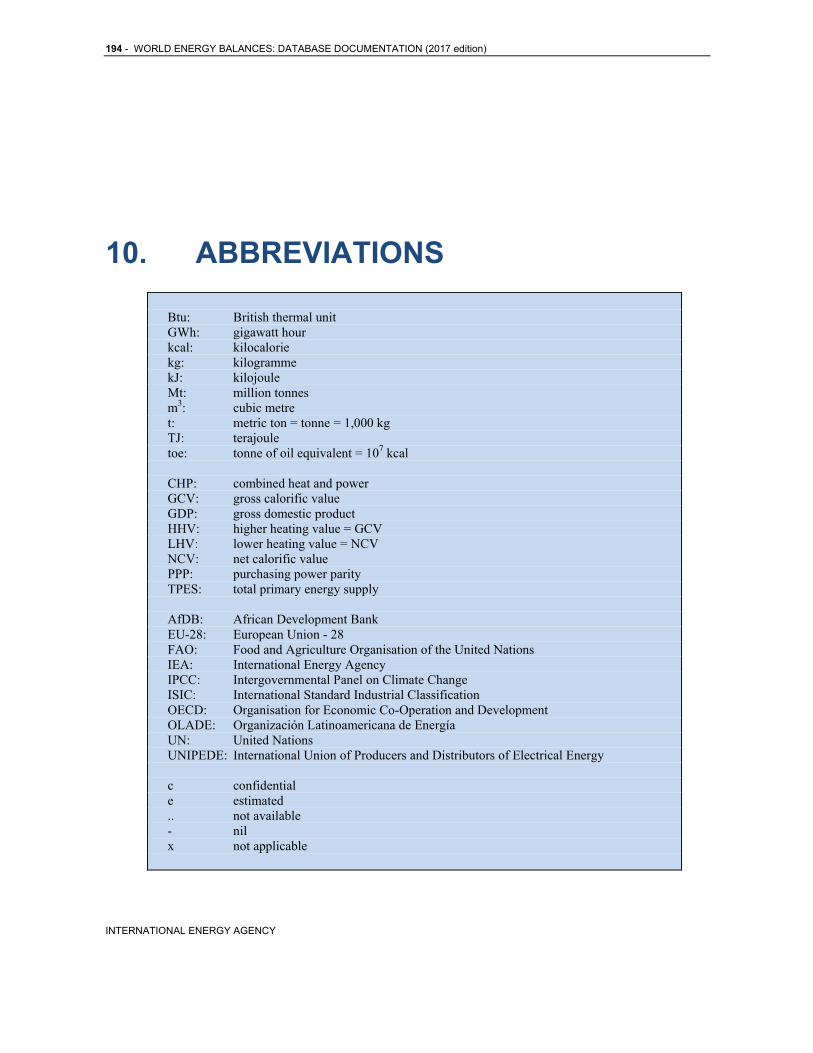
194 - WORLD ENERGY BALANCES: DATABASE DOCUMENTATION (2017 edition)
INTERNATIONAL ENERGY AGENCY
10. ABBREVIATIONS
Btu: British thermal unit
GWh: gigawatt hour kcal: kilocalorie kg: kilogramme kJ: kilojoule Mt: million tonnes m3: cubic metre t: metric ton = tonne = 1,000 kg TJ: terajoule toe: tonne of oil equivalent = 107 kcal CHP: combined heat and power GCV: gross calorific value GDP: gross domestic product HHV: higher heating value = GCV LHV: lower heating value = NCV NCV: net calorific value PPP: purchasing power parity TPES: total primary energy supply AfDB: African Development Bank EU-28: European Union - 28 FAO: Food and Agriculture Organisation of the United Nations IEA: International Energy Agency IPCC: Intergovernmental Panel on Climate Change ISIC: International Standard Industrial Classification OECD: Organisation for Economic Co-Operation and Development OLADE: Organización Latinoamericana de Energía UN: United Nations UNIPEDE: International Union of Producers and Distributors of Electrical Energy c confidential e estimated .. not available - nil x not applicable