Embed Size (px)
Citation preview

IED Semester test
Mr. WaxMeridian Joint School District No 2
1/11/2013

Design Process 6 steps• List the 6 steps of the design process.
1. Identify the problem2. Generate concepts3. Develop a solution4. Construct and test a prototype5. Evaluate the solution6. Present the solution

More on the design process
• What is a design brief?– A short document that tells everyone 1. Problem statement (what is the problem)2. Design statement (what you are going to do)3. Customer4. Constraints 5. Deliverables
• When is it written?– As part of step one, Identify the problem.

Still more on the design process
• What are criteria?–Goals for the project
• What are constraints?–Limits on the project
• What are deliverables?–What you must “deliver” to the
customer.

Engineer’s Notebook
• What is an engineers notebook?– A permanent record of everything the engineer
does on a project.• What are the rules of a notebook?
– List them all• What is a Portfolio>
– A record that demonstrates to others what you have learned, what you can do.

Brainstorming
• What is the purpose of Brainstorming?– Create as many ideas as possible in a short
amount of time.• What are the rules?
1. No Criticizing2. Go for quantity3. Welcome piling on4. Have fun, welcome wild ideas5. Write them all down

S.I. Unit prefixes
• What does SI stand for? (not a magazine)– System international
• Convert .24 km to m.– 240 m.
• Convert 1250 µg to mg– 1.25 mg
• Convert 12 kg to Mg– .012 Mg

Unit Conversion
• What does SI stand for? (not a magazine)– System international
• Convert .24 km to m.– 240 m.
• Convert 1250 µg to mg– 1.25 mg
• Convert 12 kg to Mg– .012 Mg

• Conversion Factor• Given unit in denominator, desired unit in numerator
• Grams to micrograms: 10-6 g = 1 µg or
Conversion of Units – SI System• Prefixes indicate the power of 10
Power of 10 Prefix Abbreviation
101 deca- da
102 hecto- h
103 kilo- k
106 Mega- M
109 Giga- G
Power of 10 Prefix Abbreviation
10-1 deci- d
10-2 centi- c
10-3 milli- m
10-6 micro- µ
10-9 nano- n
Desired Unit
Given Unit
(3 ft1 yd )
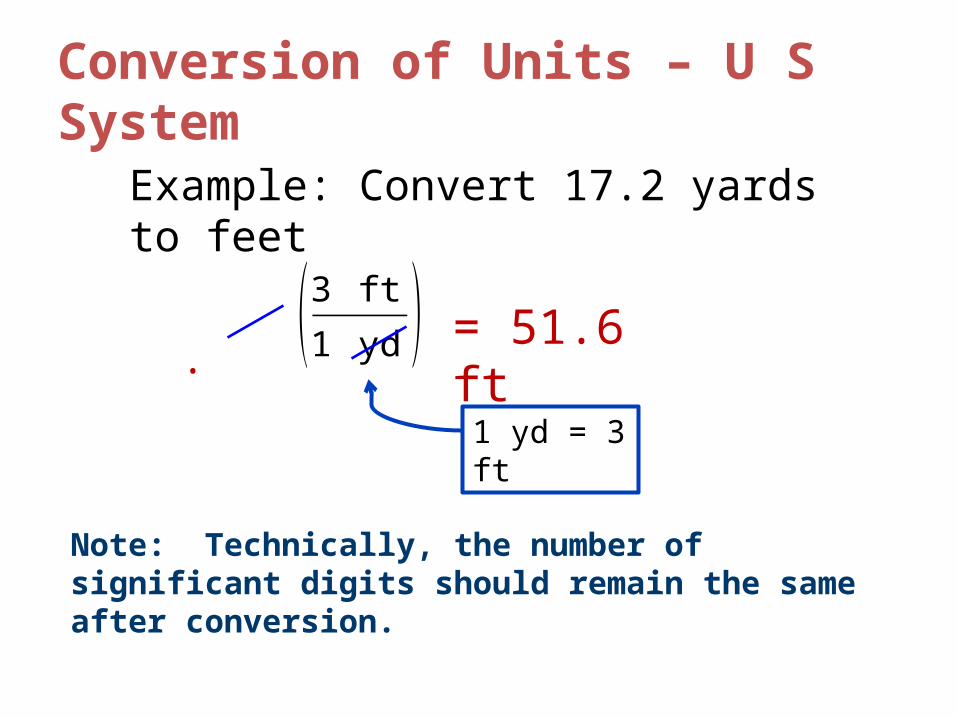
Conversion of Units – U S System
Example: Convert 17.2 yards to feet
·
Note: Technically, the number of significant digits should remain the same after conversion.
1 yd = 3 ft
= 51.6 ft

Drawings
• What type of drawing is this?– Oblique
• What are the three main types o of oblique drawing?– Cavalier, Cabinet and general
• What is the proper angle between the depth line and a horizontal line?– 30°, 45°, or 60° are preferred, but any are
acceptable

Drawing 2
• What type of drawing is this?– Isometric
• What is the proper angle the depth lines make with the horizon?– ALWAYS 30°
• What is the scale relationship between the height and the width?– 1:1

Drawing 3
• What type of drawing is this?– Orthographic
• How many view do you need?– That depends

Drawing 4
• What type of drawing is this?– Two point perspective.
• How do you know that?– From it shrinking to two points in the
distance.• What is the name of the two points?
– Vanishing points.

Construction Line
• Very lightly drawn lines to guide drawing other lines and shapes
What is this line called?

Object Line
• Thick and dark• Define the object
What is this line called?
What is this line called?

Hidden Line
• Show interior detail not visible from the outside of the part
What is this line called?
What is this line called?

Center Line
• Define the center of arcs, circles, or symmetrical parts
• Half as thick as an object line
What is this line called?
What is this line called?

Dimension Line
• Shows distance • Arrows drawn on ends
to show where dimension line starts and ends
• Actual distance is typically located in middle of this line to display distance
What is this line called?
What is this line called?

Extension Line
• Shows where a dimension starts and stops
• Used with dimension lines
• Line is 1/16” away from part to avoid confusion with object lines
What is this line called?
What is this line called?

Leader Line
• Show dimensions of arcs, circles and detail What is this line
called?
What is this line called?
Precedence of Lines
• Complex object sketches may require different line types to overlap
• Line precedence must be used• Rules that govern line precedence in sketches
and technical drawings– Object lines take precedence over hidden and
center lines– Hidden lines take precedence over center lines– Cutting plane lines take precedence over all others

Rules for Choosing a Front View
Recommendations for how to select the front view
– Most natural position or use– Shows best shape and characteristic contours– Longest dimensions– Fewest hidden lines– Best side and top views
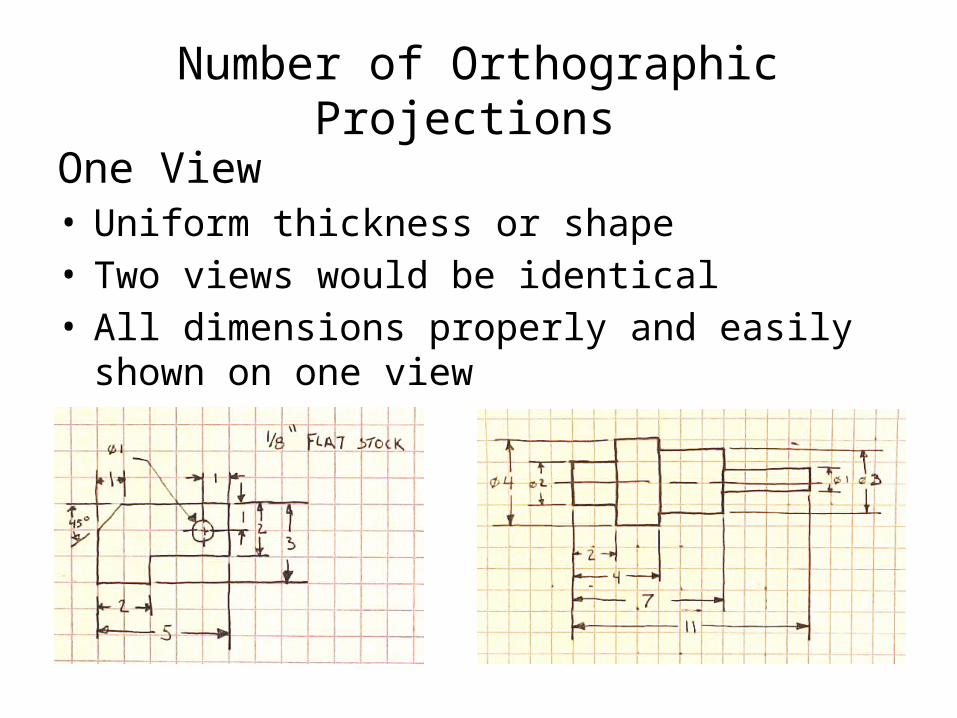
Number of Orthographic Projections One View• Uniform thickness or shape• Two views would be identical• All dimensions properly and easily shown on one
view
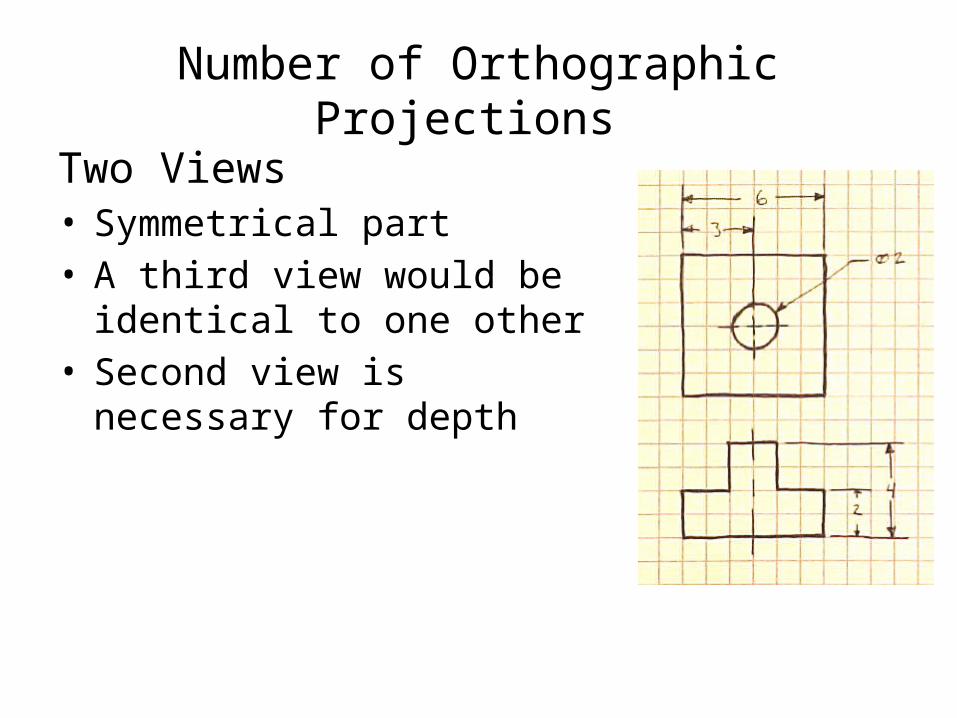
Number of Orthographic Projections Two Views• Symmetrical part• A third view would be identical to
one other• Second view is necessary for
depth
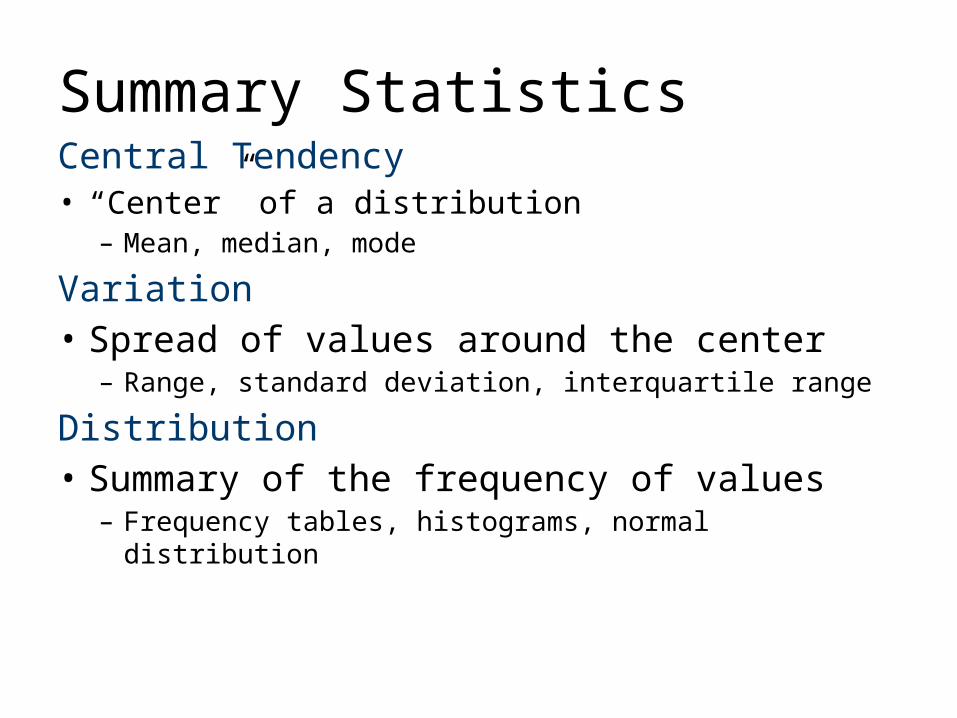
Summary StatisticsCentral Tendency• “Center” of a distribution
– Mean, median, mode
Variation• Spread of values around the center
– Range, standard deviation, interquartile range
Distribution• Summary of the frequency of values
– Frequency tables, histograms, normal distribution
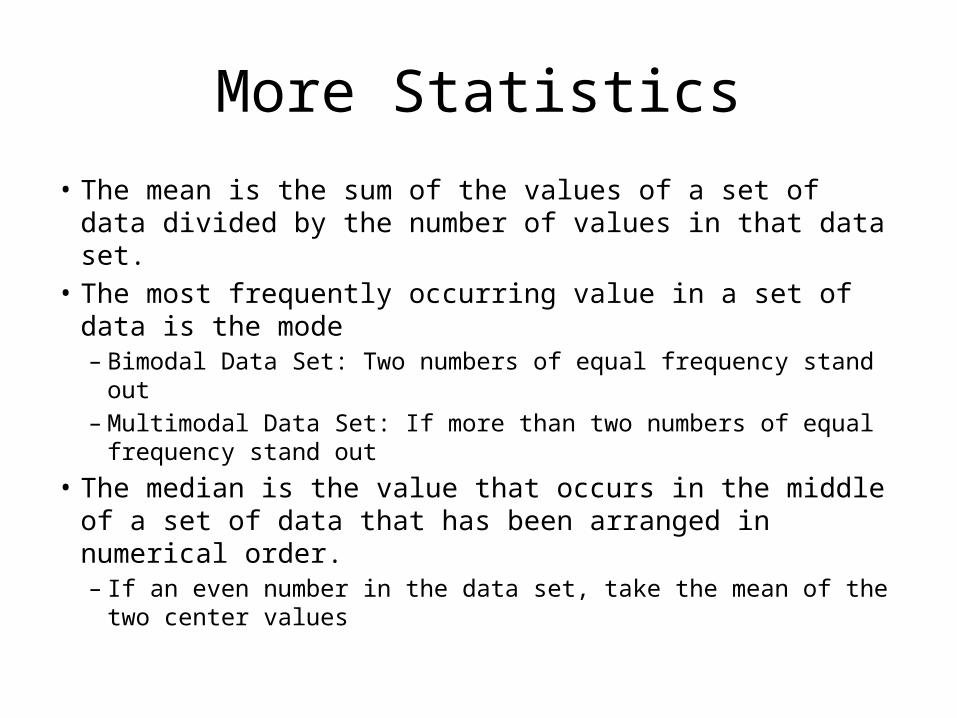
More Statistics
• The mean is the sum of the values of a set of data divided by the number of values in that data set.
• The most frequently occurring value in a set of data is the mode– Bimodal Data Set: Two numbers of equal frequency stand out– Multimodal Data Set: If more than two numbers of equal
frequency stand out• The median is the value that occurs in the middle of a set
of data that has been arranged in numerical order.– If an even number in the data set, take the mean of the two
center values
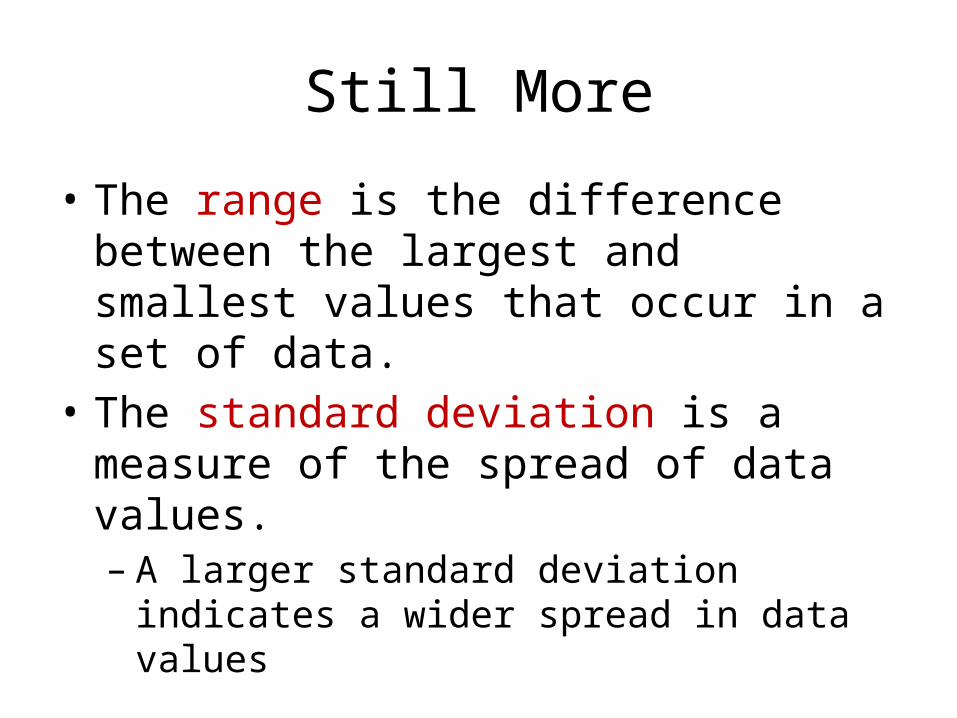
Still More
• The range is the difference between the largest and smallest values that occur in a set of data.
• The standard deviation is a measure of the spread of data values.– A larger standard deviation indicates a wider
spread in data values

• 68% of the observations fall within 1 standard deviation of the mean.
• 95% of the observations fall within 2 standard deviations of the mean.
• 99.7% of the observations fall within 3 standard deviations of the mean.
Normal Distribution Distribution
If the data are normally distributed: