Embed Size (px)
Citation preview
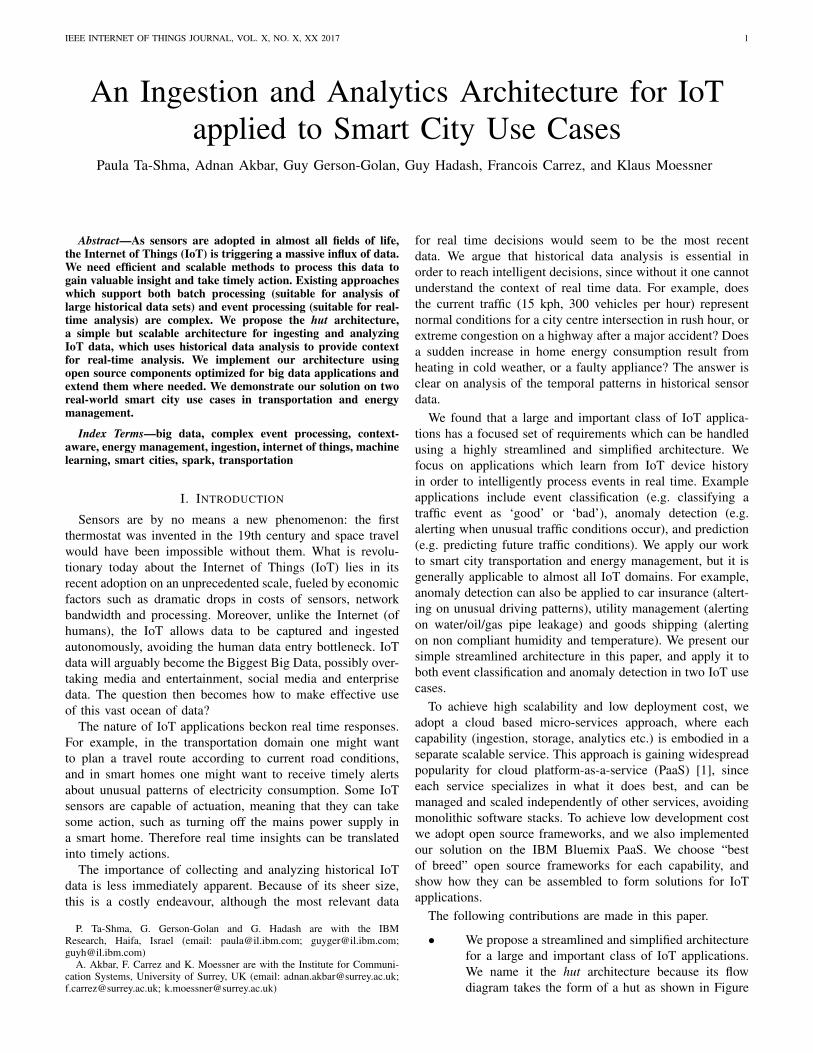
IEEE INTERNET OF THINGS JOURNAL, VOL. X, NO. X, XX 2017 1
An Ingestion and Analytics Architecture for IoTapplied to Smart City Use Cases
Paula Ta-Shma, Adnan Akbar, Guy Gerson-Golan, Guy Hadash, Francois Carrez, and Klaus Moessner
Abstract—As sensors are adopted in almost all fields of life,the Internet of Things (IoT) is triggering a massive influx of data.We need efficient and scalable methods to process this data togain valuable insight and take timely action. Existing approacheswhich support both batch processing (suitable for analysis oflarge historical data sets) and event processing (suitable for real-time analysis) are complex. We propose the hut architecture,a simple but scalable architecture for ingesting and analyzingIoT data, which uses historical data analysis to provide contextfor real-time analysis. We implement our architecture usingopen source components optimized for big data applications andextend them where needed. We demonstrate our solution on tworeal-world smart city use cases in transportation and energymanagement.
Index Terms—big data, complex event processing, context-aware, energy management, ingestion, internet of things, machinelearning, smart cities, spark, transportation
I. INTRODUCTION
Sensors are by no means a new phenomenon: the firstthermostat was invented in the 19th century and space travelwould have been impossible without them. What is revolu-tionary today about the Internet of Things (IoT) lies in itsrecent adoption on an unprecedented scale, fueled by economicfactors such as dramatic drops in costs of sensors, networkbandwidth and processing. Moreover, unlike the Internet (ofhumans), the IoT allows data to be captured and ingestedautonomously, avoiding the human data entry bottleneck. IoTdata will arguably become the Biggest Big Data, possibly over-taking media and entertainment, social media and enterprisedata. The question then becomes how to make effective useof this vast ocean of data?
The nature of IoT applications beckon real time responses.For example, in the transportation domain one might wantto plan a travel route according to current road conditions,and in smart homes one might want to receive timely alertsabout unusual patterns of electricity consumption. Some IoTsensors are capable of actuation, meaning that they can takesome action, such as turning off the mains power supply ina smart home. Therefore real time insights can be translatedinto timely actions.
The importance of collecting and analyzing historical IoTdata is less immediately apparent. Because of its sheer size,this is a costly endeavour, although the most relevant data
P. Ta-Shma, G. Gerson-Golan and G. Hadash are with the IBMResearch, Haifa, Israel (email: [email protected]; [email protected];[email protected])
A. Akbar, F. Carrez and K. Moessner are with the Institute for Communi-cation Systems, University of Surrey, UK (email: [email protected];[email protected]; [email protected])
for real time decisions would seem to be the most recentdata. We argue that historical data analysis is essential inorder to reach intelligent decisions, since without it one cannotunderstand the context of real time data. For example, doesthe current traffic (15 kph, 300 vehicles per hour) representnormal conditions for a city centre intersection in rush hour, orextreme congestion on a highway after a major accident? Doesa sudden increase in home energy consumption result fromheating in cold weather, or a faulty appliance? The answer isclear on analysis of the temporal patterns in historical sensordata.
We found that a large and important class of IoT applica-tions has a focused set of requirements which can be handledusing a highly streamlined and simplified architecture. Wefocus on applications which learn from IoT device historyin order to intelligently process events in real time. Exampleapplications include event classification (e.g. classifying atraffic event as ‘good’ or ‘bad’), anomaly detection (e.g.alerting when unusual traffic conditions occur), and prediction(e.g. predicting future traffic conditions). We apply our workto smart city transportation and energy management, but it isgenerally applicable to almost all IoT domains. For example,anomaly detection can also be applied to car insurance (altert-ing on unusual driving patterns), utility management (alertingon water/oil/gas pipe leakage) and goods shipping (alertingon non compliant humidity and temperature). We present oursimple streamlined architecture in this paper, and apply it toboth event classification and anomaly detection in two IoT usecases.
To achieve high scalability and low deployment cost, weadopt a cloud based micro-services approach, where eachcapability (ingestion, storage, analytics etc.) is embodied in aseparate scalable service. This approach is gaining widespreadpopularity for cloud platform-as-a-service (PaaS) [1], sinceeach service specializes in what it does best, and can bemanaged and scaled independently of other services, avoidingmonolithic software stacks. To achieve low development costwe adopt open source frameworks, and we also implementedour solution on the IBM Bluemix PaaS. We choose “bestof breed” open source frameworks for each capability, andshow how they can be assembled to form solutions for IoTapplications.
The following contributions are made in this paper.
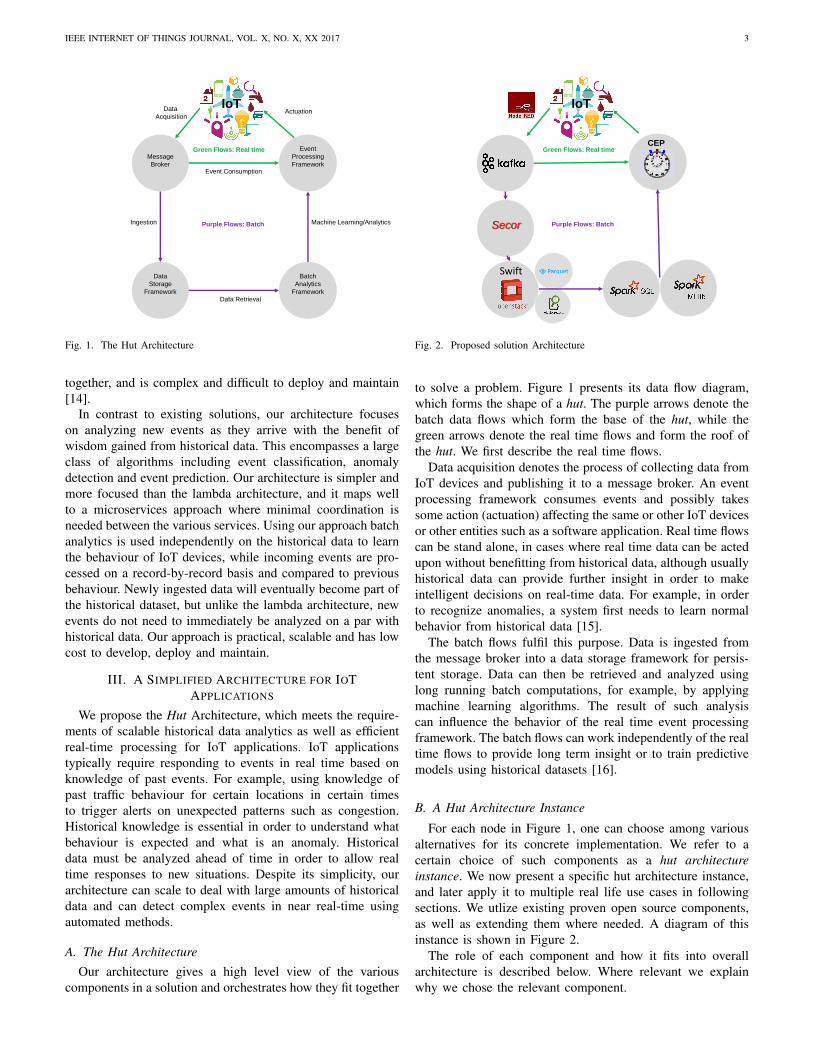
• We propose a streamlined and simplified architecturefor a large and important class of IoT applications.We name it the hut architecture because its flowdiagram takes the form of a hut as shown in Figure
IEEE INTERNET OF THINGS JOURNAL, VOL. X, NO. X, XX 2017 2
1. We use historical (batch) analytics to improve thequality of real-time analytics on IoT data.
• We implement our proposed architecture using amicro-services approach with best of breed opensource frameworks while making extensions asneeded. Our proposed solution is flexible with re-spect to the choice of specific analysis algorithmsand suitable for a range of different machine learningand statistical algorithms.
• We demonstrate the feasibility of our proposed solu-tion by implementing it for two real-world smart cityuse cases in transportation and energy management.We implement the transportation scenario on theIBM Bluemix PaaS and make the code available asopen source.
The remainder of the paper is organized as follows.Section II presents related work and explains how we extend
prior research. Section III explains our proposed architecturealong with descriptions of the various components involved inits implementation. Section IV-A describes the application ofour proposed architecture to a smart transportation use casescenario. Section IV-B demonstrates the application of oursolution to smart energy management. Finally we concludethe paper and highlight future work in section V.
II. RELATED WORK
The massive proportions of historical IoT data highlight thenecessity of scalable and low cost solutions. At first glance,IoT data is similar to Big Data from application domainssuch as clickstream and online advertising data, retail and e-commerce data, and CRM data. All these data sources havetimestamps, are (semi) structured, and measure some metricssuch as number of clicks or money spent. Similarly, the needto scalably ingest, store and analyze data from these domainsis somewhat similar.
Analytics frameworks for Big Data can often be categorizedas either batch or real-time processing frameworks. Batchprocessing frameworks are suitable for efficiently processinglarge amounts of data with high throughput but also highlatency - it can take hours or days to complete a batchjob. Real-time processing typically involves time sensitivecomputations on a continuous stream of data.
One of the most common and widely used techniquesfor batch processing on Big Data is called MapReduce [2].MapReduce is a programming model for carrying out compu-tations on large amounts of data in an efficient and distributedmanner. It is also an execution framework for processing datadistributed among large numbers of machines. It was originallydeveloped by Google as a generic but proprietary frameworkfor analytics on Google’s own Big Data, and later was widelyadopted and embodied in open source tools. MapReduce wasintended to provide a unified solution for large scale batchanalytics and address challenges like parallel computation,distribution of data and handling of failures.
Hadoop [3], an open source embodiment of MapReduce,was first released in 2007, and later adopted by hundredsof companies for a variety of use cases. Notably, Amazon
released Elastic Map Reduce (EMR) [4], a hosted versionof MapReduce integrated into its own cloud infrastructureplatform running Amazon Elastic Compute Cloud (EC2)[5]and Simple Storage Service (S3)[6]. OpenStack has a similarframework called Sahara which can be used to provision anddeploy Hadoop clusters [7].
Hadoop provides generic and scalable solutions for big data,but was not designed for iterative algorithms like machinelearning, which repeatedly run batch jobs and save intermedi-ate results to disk. In such scenarios, disk access can becomea major bottleneck hence degrading performance.
In order to overcome the limitations of Hadoop, a newcluster computing framework called Spark [8] was developed.Spark provides the ability to run computations in memoryusing Resilient Distributed Datasets (RDDs) [9] which enablesit to provide faster computation times for iterative applicationscompared to Hadoop. Spark not only supports large-scalebatch processing, it also offers a streaming module known asSpark streaming [10] for real-time analytics. Spark streamingprocesses data streams in micro-batches, where each batchcontains a collection of events that arrived over the batchperiod (regardless of when the data was created). It works wellfor simple applications but the lack of true record-by-recordprocessing makes time series and event processing difficult forcomplex IoT applications.
The need for real time processing of events in data streamson a record-by-record basis led to a research area knownas complex event processing (CEP) [11]. CEP is specificallydesigned for latency sensitive applications which involve largevolumes of streaming data with timestamps such as tradingsystems, fraud detection and monitoring applications. In con-trast to batch processing techniques which store the data andlater run queries on it, CEP instead stores queries and runsdata through these queries. The inbuilt capability of CEPto handle multiple seemingly unrelated events and correlatethem to infer complex events make it suitable for manyIoT applications. The core of CEP is typically a rule-basedengine which requires rules for extracting complex patterns.A drawback of CEP is that the authoring of these rules requiressystem administrators or application developers to have priorknowledge about the system which is not always available.
Big Data analytics systems have the challenge of processingmassive amounts of historical data while at the same timeingesting and analyzing real-time data at a high rate. Thedichotomy of event processing frameworks for real time data,and batch processing frameworks for historical data, led tothe prevalence of multiple independent systems analyzingthe same data. The Lambda architecture was proposed byNathan Marz [12] to address this, and provides a scalable andfault tolerant architecture for processing both real-time andhistorical data in an integrated fashion. The purpose of thisarchitecture was to analyze vast amounts of data as it arrivesin an efficient, timely and fault tolerant fashion. Its focus wason speeding up Online Analytical Processing (OLAP) stylecomputations, for example web page view and click streamanalysis. It was not designed to make per-event decisions orrespond to events as they arrive [13]. It comprises batch, speedand serving layers, which must be coordinated to work closely
IEEE INTERNET OF THINGS JOURNAL, VOL. X, NO. X, XX 2017 3
IoT
Event
Processing
Framework
Message
Broker
Data
Storage
Framework
Batch
Analytics
Framework
Green Flows: Real time
Purple Flows: BatchIngestion
Data Retrieval
Machine Learning/Analytics
Data
AcquisitionActuation
Event Consumption
Fig. 1. The Hut Architecture
together, and is complex and difficult to deploy and maintain[14].
In contrast to existing solutions, our architecture focuseson analyzing new events as they arrive with the benefit ofwisdom gained from historical data. This encompasses a largeclass of algorithms including event classification, anomalydetection and event prediction. Our architecture is simpler andmore focused than the lambda architecture, and it maps wellto a microservices approach where minimal coordination isneeded between the various services. Using our approach batchanalytics is used independently on the historical data to learnthe behaviour of IoT devices, while incoming events are pro-cessed on a record-by-record basis and compared to previousbehaviour. Newly ingested data will eventually become part ofthe historical dataset, but unlike the lambda architecture, newevents do not need to immediately be analyzed on a par withhistorical data. Our approach is practical, scalable and has lowcost to develop, deploy and maintain.
III. A SIMPLIFIED ARCHITECTURE FOR IOTAPPLICATIONS
We propose the Hut Architecture, which meets the require-ments of scalable historical data analytics as well as efficientreal-time processing for IoT applications. IoT applicationstypically require responding to events in real time based onknowledge of past events. For example, using knowledge ofpast traffic behaviour for certain locations in certain timesto trigger alerts on unexpected patterns such as congestion.Historical knowledge is essential in order to understand whatbehaviour is expected and what is an anomaly. Historicaldata must be analyzed ahead of time in order to allow realtime responses to new situations. Despite its simplicity, ourarchitecture can scale to deal with large amounts of historicaldata and can detect complex events in near real-time usingautomated methods.
A. The Hut ArchitectureOur architecture gives a high level view of the various
components in a solution and orchestrates how they fit together
IoT
CEP
Secor
Swift
Green Flows: Real time
Purple Flows: Batch
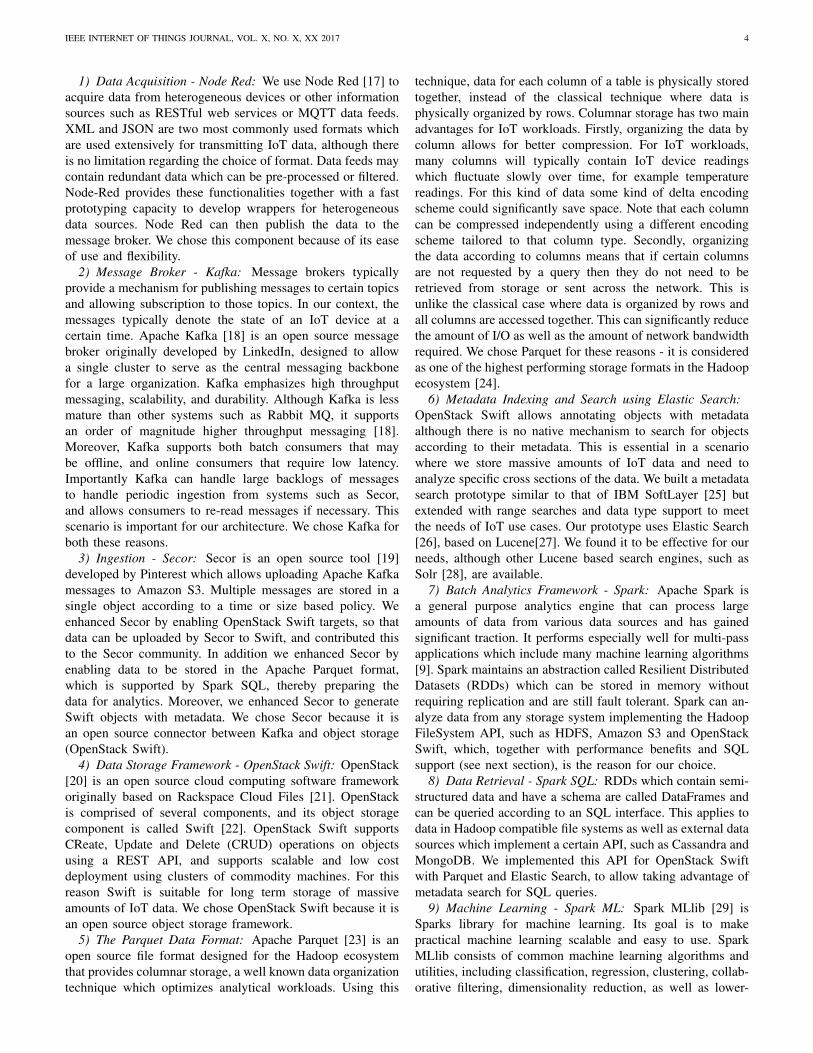
Fig. 2. Proposed solution Architecture
to solve a problem. Figure 1 presents its data flow diagram,which forms the shape of a hut. The purple arrows denote thebatch data flows which form the base of the hut, while thegreen arrows denote the real time flows and form the roof ofthe hut. We first describe the real time flows.
Data acquisition denotes the process of collecting data fromIoT devices and publishing it to a message broker. An eventprocessing framework consumes events and possibly takessome action (actuation) affecting the same or other IoT devicesor other entities such as a software application. Real time flowscan be stand alone, in cases where real time data can be actedupon without benefitting from historical data, although usuallyhistorical data can provide further insight in order to makeintelligent decisions on real-time data. For example, in orderto recognize anomalies, a system first needs to learn normalbehavior from historical data [15].
The batch flows fulfil this purpose. Data is ingested fromthe message broker into a data storage framework for persis-tent storage. Data can then be retrieved and analyzed usinglong running batch computations, for example, by applyingmachine learning algorithms. The result of such analysiscan influence the behavior of the real time event processingframework. The batch flows can work independently of the realtime flows to provide long term insight or to train predictivemodels using historical datasets [16].
B. A Hut Architecture Instance
For each node in Figure 1, one can choose among variousalternatives for its concrete implementation. We refer to acertain choice of such components as a hut architectureinstance. We now present a specific hut architecture instance,and later apply it to multiple real life use cases in followingsections. We utlize existing proven open source components,as well as extending them where needed. A diagram of thisinstance is shown in Figure 2.
The role of each component and how it fits into overallarchitecture is described below. Where relevant we explainwhy we chose the relevant component.
IEEE INTERNET OF THINGS JOURNAL, VOL. X, NO. X, XX 2017 4
1) Data Acquisition - Node Red: We use Node Red [17] toacquire data from heterogeneous devices or other informationsources such as RESTful web services or MQTT data feeds.XML and JSON are two most commonly used formats whichare used extensively for transmitting IoT data, although thereis no limitation regarding the choice of format. Data feeds maycontain redundant data which can be pre-processed or filtered.Node-Red provides these functionalities together with a fastprototyping capacity to develop wrappers for heterogeneousdata sources. Node Red can then publish the data to themessage broker. We chose this component because of its easeof use and flexibility.
2) Message Broker - Kafka: Message brokers typicallyprovide a mechanism for publishing messages to certain topicsand allowing subscription to those topics. In our context, themessages typically denote the state of an IoT device at acertain time. Apache Kafka [18] is an open source messagebroker originally developed by LinkedIn, designed to allowa single cluster to serve as the central messaging backbonefor a large organization. Kafka emphasizes high throughputmessaging, scalability, and durability. Although Kafka is lessmature than other systems such as Rabbit MQ, it supportsan order of magnitude higher throughput messaging [18].Moreover, Kafka supports both batch consumers that maybe offline, and online consumers that require low latency.Importantly Kafka can handle large backlogs of messagesto handle periodic ingestion from systems such as Secor,and allows consumers to re-read messages if necessary. Thisscenario is important for our architecture. We chose Kafka forboth these reasons.
3) Ingestion - Secor: Secor is an open source tool [19]developed by Pinterest which allows uploading Apache Kafkamessages to Amazon S3. Multiple messages are stored in asingle object according to a time or size based policy. Weenhanced Secor by enabling OpenStack Swift targets, so thatdata can be uploaded by Secor to Swift, and contributed thisto the Secor community. In addition we enhanced Secor byenabling data to be stored in the Apache Parquet format,which is supported by Spark SQL, thereby preparing thedata for analytics. Moreover, we enhanced Secor to generateSwift objects with metadata. We chose Secor because it isan open source connector between Kafka and object storage(OpenStack Swift).
4) Data Storage Framework - OpenStack Swift: OpenStack[20] is an open source cloud computing software frameworkoriginally based on Rackspace Cloud Files [21]. OpenStackis comprised of several components, and its object storagecomponent is called Swift [22]. OpenStack Swift supportsCReate, Update and Delete (CRUD) operations on objectsusing a REST API, and supports scalable and low costdeployment using clusters of commodity machines. For thisreason Swift is suitable for long term storage of massiveamounts of IoT data. We chose OpenStack Swift because it isan open source object storage framework.
5) The Parquet Data Format: Apache Parquet [23] is anopen source file format designed for the Hadoop ecosystemthat provides columnar storage, a well known data organizationtechnique which optimizes analytical workloads. Using this
technique, data for each column of a table is physically storedtogether, instead of the classical technique where data isphysically organized by rows. Columnar storage has two mainadvantages for IoT workloads. Firstly, organizing the data bycolumn allows for better compression. For IoT workloads,many columns will typically contain IoT device readingswhich fluctuate slowly over time, for example temperaturereadings. For this kind of data some kind of delta encodingscheme could significantly save space. Note that each columncan be compressed independently using a different encodingscheme tailored to that column type. Secondly, organizingthe data according to columns means that if certain columnsare not requested by a query then they do not need to beretrieved from storage or sent across the network. This isunlike the classical case where data is organized by rows andall columns are accessed together. This can significantly reducethe amount of I/O as well as the amount of network bandwidthrequired. We chose Parquet for these reasons - it is consideredas one of the highest performing storage formats in the Hadoopecosystem [24].
6) Metadata Indexing and Search using Elastic Search:OpenStack Swift allows annotating objects with metadataalthough there is no native mechanism to search for objectsaccording to their metadata. This is essential in a scenariowhere we store massive amounts of IoT data and need toanalyze specific cross sections of the data. We built a metadatasearch prototype similar to that of IBM SoftLayer [25] butextended with range searches and data type support to meetthe needs of IoT use cases. Our prototype uses Elastic Search[26], based on Lucene[27]. We found it to be effective for ourneeds, although other Lucene based search engines, such asSolr [28], are available.
7) Batch Analytics Framework - Spark: Apache Spark isa general purpose analytics engine that can process largeamounts of data from various data sources and has gainedsignificant traction. It performs especially well for multi-passapplications which include many machine learning algorithms[9]. Spark maintains an abstraction called Resilient DistributedDatasets (RDDs) which can be stored in memory withoutrequiring replication and are still fault tolerant. Spark can an-alyze data from any storage system implementing the HadoopFileSystem API, such as HDFS, Amazon S3 and OpenStackSwift, which, together with performance benefits and SQLsupport (see next section), is the reason for our choice.
8) Data Retrieval - Spark SQL: RDDs which contain semi-structured data and have a schema are called DataFrames andcan be queried according to an SQL interface. This applies todata in Hadoop compatible file systems as well as external datasources which implement a certain API, such as Cassandra andMongoDB. We implemented this API for OpenStack Swiftwith Parquet and Elastic Search, to allow taking advantage ofmetadata search for SQL queries.
9) Machine Learning - Spark ML: Spark MLlib [29] isSparks library for machine learning. Its goal is to makepractical machine learning scalable and easy to use. SparkMLlib consists of common machine learning algorithms andutilities, including classification, regression, clustering, collab-orative filtering, dimensionality reduction, as well as lower-
IEEE INTERNET OF THINGS JOURNAL, VOL. X, NO. X, XX 2017 5
level optimization primitives and higher-level pipeline APIs.10) Event Processing Framework - CEP: A Complex Event
Processing (CEP) Engine is a software component capableof asynchronously detecting independent incoming events ofdifferent types and generating a Complex Event by correlatingthese events together. In this sense, Complex Events canbe defined as the output generated after processing manysmall, independent incoming input data streams, which canbe understood as a given collection of parameters at a certaintemporal point. A CEP Engine is commonly provided witha series of plugins or additional sub-components in order toimprove data acquisition from external sources, and also somekind of rule system to implement the business logic whichcreates the output of the system.
Our architecture is modular, so a particular component inthis instance could be replaced by another. For example, SparkStreaming or Apache Storm could be used for the eventprocessing framework instead of CEP software, and Hadoopmap reduce could be used instead of Spark. Our focus hereis on the architecture itself, and in order to demonstrate thearchitecture we made an intelligent choice of open sourcecomponents as an architecture instance.
IV. USE CASES
The hut architecture, as well as our instance, is generic andcan be applied to a range of IoT use cases. In this section wedemonstrate its application to real-world problems and showhow it can provide optimized, automated and context-awaresolutions for large scale IoT applications. We demonstrateit in practice by applying it to the following two scenarios,Madrid Transportation and Taiwan Energy Management. Wedescribe the first use case in detail and later describe how thesame architecture and data flow can be applied to the secondcase. Despite the fact that these use cases are from differentdomains, they share the same architecture and data flow. Eachuse case has specific requirements which dictate differentconfigurations and extensions which are also described in thissection.
A. Use case 1: Madrid Transportation
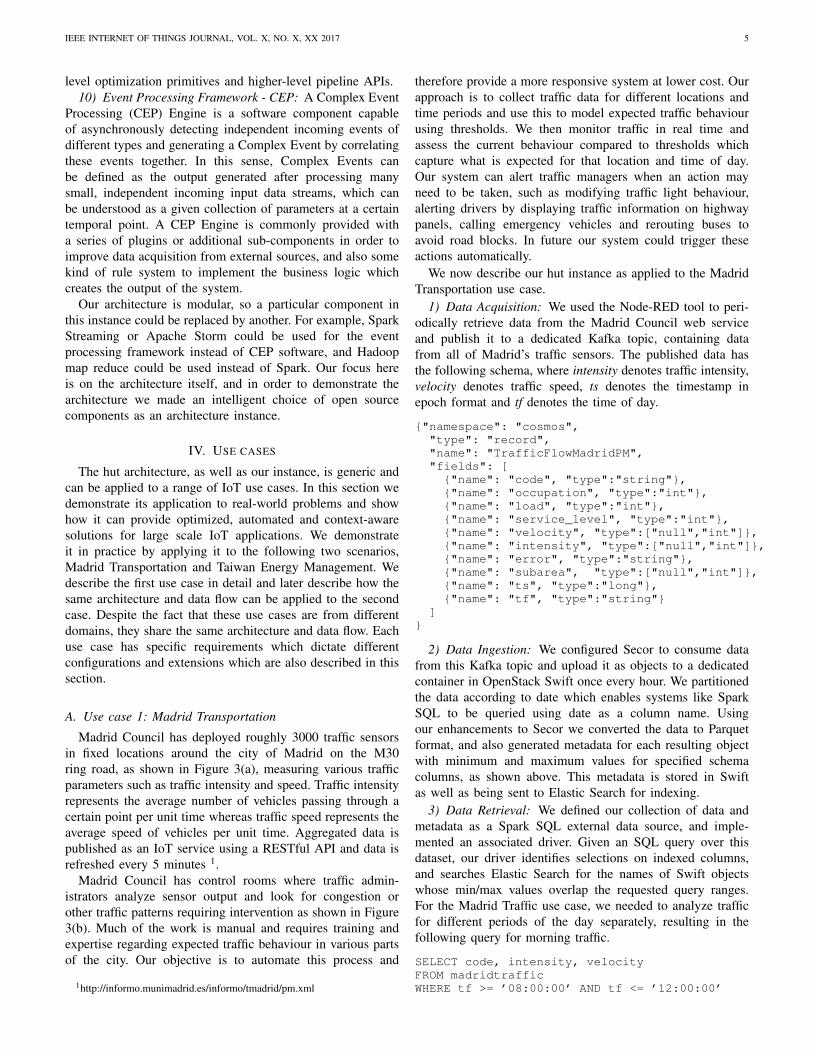
Madrid Council has deployed roughly 3000 traffic sensorsin fixed locations around the city of Madrid on the M30ring road, as shown in Figure 3(a), measuring various trafficparameters such as traffic intensity and speed. Traffic intensityrepresents the average number of vehicles passing through acertain point per unit time whereas traffic speed represents theaverage speed of vehicles per unit time. Aggregated data ispublished as an IoT service using a RESTful API and data isrefreshed every 5 minutes 1.
Madrid Council has control rooms where traffic admin-istrators analyze sensor output and look for congestion orother traffic patterns requiring intervention as shown in Figure3(b). Much of the work is manual and requires training andexpertise regarding expected traffic behaviour in various partsof the city. Our objective is to automate this process and
1http://informo.munimadrid.es/informo/tmadrid/pm.xml
therefore provide a more responsive system at lower cost. Ourapproach is to collect traffic data for different locations andtime periods and use this to model expected traffic behaviourusing thresholds. We then monitor traffic in real time andassess the current behaviour compared to thresholds whichcapture what is expected for that location and time of day.Our system can alert traffic managers when an action mayneed to be taken, such as modifying traffic light behaviour,alerting drivers by displaying traffic information on highwaypanels, calling emergency vehicles and rerouting buses toavoid road blocks. In future our system could trigger theseactions automatically.
We now describe our hut instance as applied to the MadridTransportation use case.
1) Data Acquisition: We used the Node-RED tool to peri-odically retrieve data from the Madrid Council web serviceand publish it to a dedicated Kafka topic, containing datafrom all of Madrid’s traffic sensors. The published data hasthe following schema, where intensity denotes traffic intensity,velocity denotes traffic speed, ts denotes the timestamp inepoch format and tf denotes the time of day.
{"namespace": "cosmos","type": "record","name": "TrafficFlowMadridPM","fields": [
{"name": "code", "type":"string"},{"name": "occupation", "type":"int"},{"name": "load", "type":"int"},{"name": "service_level", "type":"int"},{"name": "velocity", "type":["null","int"]},{"name": "intensity", "type":["null","int"]},{"name": "error", "type":"string"},{"name": "subarea", "type":["null","int"]},{"name": "ts", "type":"long"},{"name": "tf", "type":"string"}
]}
2) Data Ingestion: We configured Secor to consume datafrom this Kafka topic and upload it as objects to a dedicatedcontainer in OpenStack Swift once every hour. We partitionedthe data according to date which enables systems like SparkSQL to be queried using date as a column name. Usingour enhancements to Secor we converted the data to Parquetformat, and also generated metadata for each resulting objectwith minimum and maximum values for specified schemacolumns, as shown above. This metadata is stored in Swiftas well as being sent to Elastic Search for indexing.
3) Data Retrieval: We defined our collection of data andmetadata as a Spark SQL external data source, and imple-mented an associated driver. Given an SQL query over thisdataset, our driver identifies selections on indexed columns,and searches Elastic Search for the names of Swift objectswhose min/max values overlap the requested query ranges.For the Madrid Traffic use case, we needed to analyze trafficfor different periods of the day separately, resulting in thefollowing query for morning traffic.
SELECT code, intensity, velocityFROM madridtrafficWHERE tf >= ’08:00:00’ AND tf <= ’12:00:00’
IEEE INTERNET OF THINGS JOURNAL, VOL. X, NO. X, XX 2017 6
(a) Sensors location on M30 ring road (b) M30 Control Room
Fig. 3. Madrid Transportation Scenario
To evaluate this query, our driver searches for objects whosemin/max timestamps overlap this time period, and evaluatesthe query on these objects only. Objects which do not qualifydo not need to be read from disk or sent across the networkfrom Swift to Spark. For one example query we tested onthe Madrid Traffic data we collected, we found our method toreduce the number of Swift requests by a factor of over 20.
4) Event Processing: We used CEP as an event processingcomponent to consume events in real-time from the MessageBroker and detect complex events like bad traffic. The core ofCEP is a rule-based engine which requires rules for extractingcomplex patterns. These rules are typically based on variousthreshold values. An example rule analysing traffic speed andintensity to detect bad traffic events is shown in algorithm 1,which checks whether current speed and intensity cross thresh-olds for 3 consecutive time points. The manual calibration ofthreshold values in such rules require traffic administrators tohave deep prior knowledge about the city traffic. In addition,rules set using a CEP system are typically static and there isno means to update them automatically.
Algorithm 1 Example Rule for CEP1: for (speed, intensity) ∈ TupleWindow(3) do2: if (speed(t) < speedthr and intensity(t) <
intensitythr AND3: speed(t + 1) < speedthr and intensity(t + 1) <
intensitythr AND4: speed(t + 2) < speedthr and intensity(t + 2) <
intensitythr) then5: Generate complex event Bad Traffic6: end if7: end for
In contrast, we adopted a context-aware approach usingmachine learning to generate optimized thresholds automat-ically based on historical sensor data and taking differentcontexts including time-of-day and day-of-week into account.New rules are generated dynamically whenever our algorithmdetects a change in the context. The idea of using machine
learning to generate optimized thresholds for CEP rules wasproposed in our initial work [30] where we demonstrated acontext-aware solution for monitoring traffic automatically.In this paper, we improve our initial approach, extend ourexperimental evaluation and integrate it with the more generalhut architecture and hut instance, optimized for large scale IoTapplications.
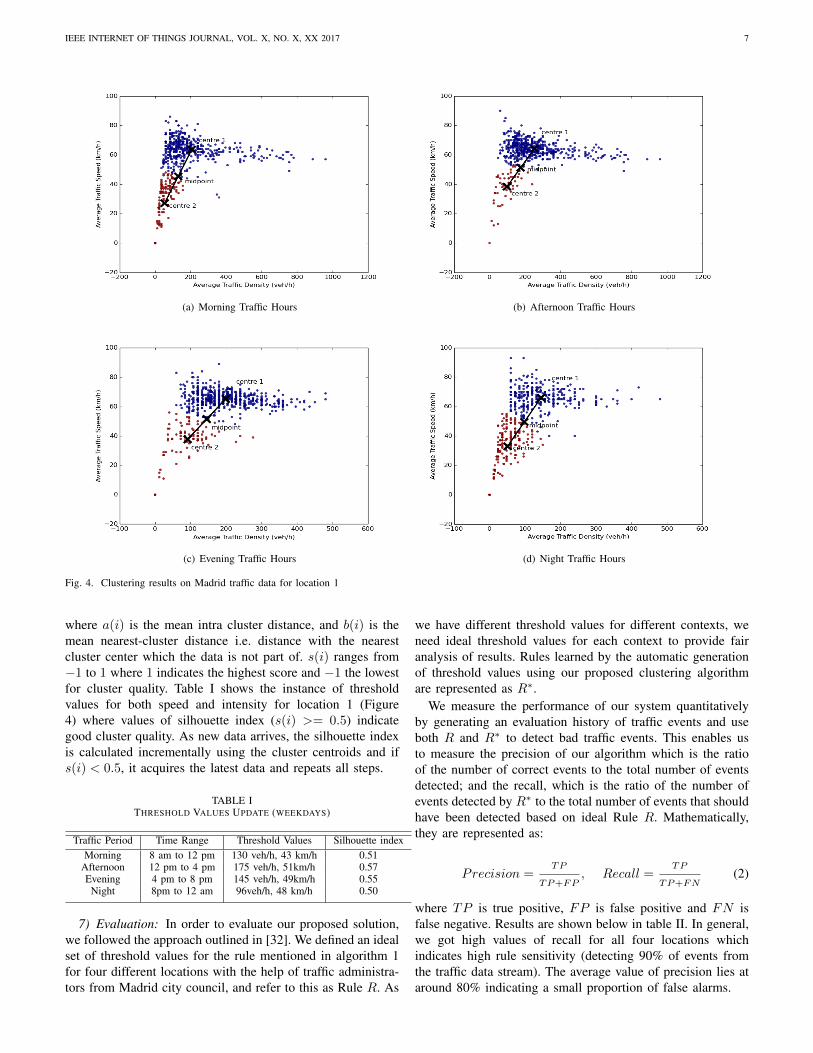
5) Machine Learning: In order to classify traffic eventsas ‘good’ or ‘bad’ we built a model for each sensor lo-cation and time period (morning, afternoon, evening andnight) using k-means clustering, an unsupervised algorithm(not requiring labeled training data) implemented in SparkMLlib and optimized for large data sets. The data points areseparated into k different groups, in our case k = 2 and thegroups represent good versus bad traffic. The resulting clusterboundary generates thresholds for real time event processing,since crossing these thresholds signifies moving from good tobad traffic (or vice versa).
Experimentation results of our approach on Madrid trafficdata are shown in Figure 4 for a particular location on aweekday. Different sub-figures indicate different time contexts(morning, afternoon, evening and night). Blue clusters repre-sent high average speed and intensity indicating good trafficstate, whereas red clusters represent low average speed andintensity indicating bad traffic state (note the varying scales ofthe X-axes in the various graphs). Midpoints between clustercenters represents the boundary separating both states andwe use this boundary to define threshold values for detectingcomplex events.
6) When to Recompute the Thresholds?: Statistical proper-ties of the underlying data may change over time resulting ininaccurate threshold values. Therefore, we assess the clusterquality for different contexts as new data arrives, and once itsignificantly deteriorates, we retrain the k-means models andgenerate new threshold values. The Silhouette index s(i) [31]is used to assess cluster quality by quantitatively measuringthe data fitness on existing clusters and is defined as
s(i) =b(i)− a(i)
max(a(i), b(i))(1)
IEEE INTERNET OF THINGS JOURNAL, VOL. X, NO. X, XX 2017 7
(a) Morning Traffic Hours (b) Afternoon Traffic Hours
(c) Evening Traffic Hours (d) Night Traffic Hours
Fig. 4. Clustering results on Madrid traffic data for location 1
where a(i) is the mean intra cluster distance, and b(i) is themean nearest-cluster distance i.e. distance with the nearestcluster center which the data is not part of. s(i) ranges from−1 to 1 where 1 indicates the highest score and −1 the lowestfor cluster quality. Table I shows the instance of thresholdvalues for both speed and intensity for location 1 (Figure4) where values of silhouette index (s(i) >= 0.5) indicategood cluster quality. As new data arrives, the silhouette indexis calculated incrementally using the cluster centroids and ifs(i) < 0.5, it acquires the latest data and repeats all steps.
TABLE ITHRESHOLD VALUES UPDATE (WEEKDAYS)
Traffic Period Time Range Threshold Values Silhouette indexMorning 8 am to 12 pm 130 veh/h, 43 km/h 0.51
Afternoon 12 pm to 4 pm 175 veh/h, 51km/h 0.57Evening 4 pm to 8 pm 145 veh/h, 49km/h 0.55
Night 8pm to 12 am 96veh/h, 48 km/h 0.50
7) Evaluation: In order to evaluate our proposed solution,we followed the approach outlined in [32]. We defined an idealset of threshold values for the rule mentioned in algorithm 1for four different locations with the help of traffic administra-tors from Madrid city council, and refer to this as Rule R. As
we have different threshold values for different contexts, weneed ideal threshold values for each context to provide fairanalysis of results. Rules learned by the automatic generationof threshold values using our proposed clustering algorithmare represented as R∗.
We measure the performance of our system quantitativelyby generating an evaluation history of traffic events and useboth R and R∗ to detect bad traffic events. This enables usto measure the precision of our algorithm which is the ratioof the number of correct events to the total number of eventsdetected; and the recall, which is the ratio of the number ofevents detected by R∗ to the total number of events that shouldhave been detected based on ideal Rule R. Mathematically,they are represented as:
Precision =TP
TP+FP, Recall =
TP
TP+FN(2)
where TP is true positive, FP is false positive and FN isfalse negative. Results are shown below in table II. In general,we got high values of recall for all four locations whichindicates high rule sensitivity (detecting 90% of events fromthe traffic data stream). The average value of precision lies ataround 80% indicating a small proportion of false alarms.
IEEE INTERNET OF THINGS JOURNAL, VOL. X, NO. X, XX 2017 8
TABLE IICEP RULES EVALUATION FOR MADRID SCENARIO
Locations TP FP FN Precision Recall1 97 17 8 0.85 0.922 68 14 7 0.82 0.913 71 12 11 0.85 0.864 112 29 9 0.79 0.93
8) Discussion: The main focus of our work is on a genericarchitecture for IoT data analytics which allows plugging invarious algorithms. We presented one particular choice whereunsupervised machine learning (k-means clustering) was usedfor event classification. Our modular approach enables explo-ration of other unsupervised or supervised methods for thesame problem. In addition, our architecture can be used foradditional applications; for example, one can train regressionmodels with Spark MLlib using Madrid Council’s historicaldataset and provide traffic predictions [33].
B. Use case 2: Taiwan Electricity Metering
Smart energy kits are gaining popularity for monitoringreal time energy usage to raise awareness about users’ energyconsumption [34]. The Institute for Information Industry (III)Taiwan have deployed smart energy kits consisting of smartplugs and management gateways in over 200 residences.These smart plugs have built-in energy meters which keeptrack of real-time energy usage of connected appliances bylogging electrical data measurements. They are connected toa management gateway via the ZigBee protocol, which isconnected to the internet via WiFi.
Our aim is to monitor energy consumption data in real timeand automatically detect anomalies which are then communi-cated to the respective users. An anomaly can be defined asunusual or abnormal behaviour. For example, a malfunctioningelectronic device or a fridge with its door left open can resultin excessive power dissipation which should be detected andreported as soon as possible. Another type of anomaly isappliance usage at unusual times such as a radiator during thesummer or an oven operated at 3am. Automatic monitoring ofdevices to detect anomalies can contribute to energy savingsas well as enhanced safety.
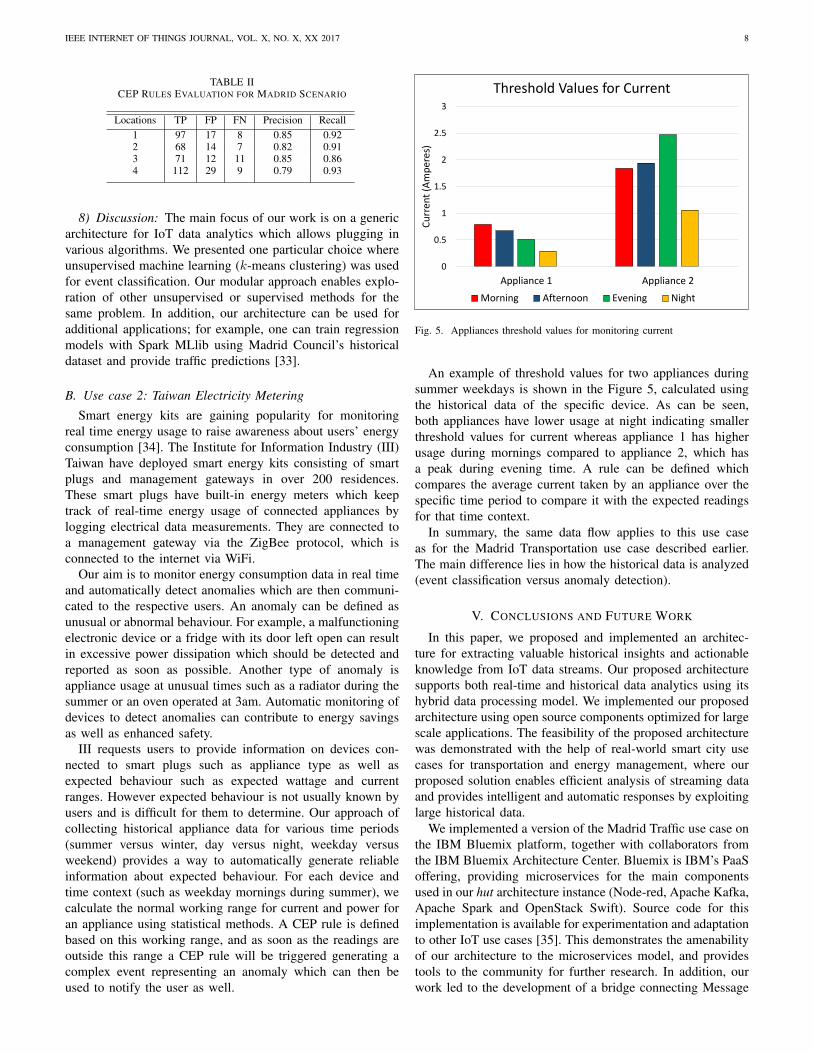
III requests users to provide information on devices con-nected to smart plugs such as appliance type as well asexpected behaviour such as expected wattage and currentranges. However expected behaviour is not usually known byusers and is difficult for them to determine. Our approach ofcollecting historical appliance data for various time periods(summer versus winter, day versus night, weekday versusweekend) provides a way to automatically generate reliableinformation about expected behaviour. For each device andtime context (such as weekday mornings during summer), wecalculate the normal working range for current and power foran appliance using statistical methods. A CEP rule is definedbased on this working range, and as soon as the readings areoutside this range a CEP rule will be triggered generating acomplex event representing an anomaly which can then beused to notify the user as well.
0
0.5
1
1.5
2
2.5
3
Appliance 1 Appliance 2
Cu
rren
t (A
mp
eres
)
Threshold Values for Current
Morning Afternoon Evening Night
Fig. 5. Appliances threshold values for monitoring current
An example of threshold values for two appliances duringsummer weekdays is shown in the Figure 5, calculated usingthe historical data of the specific device. As can be seen,both appliances have lower usage at night indicating smallerthreshold values for current whereas appliance 1 has higherusage during mornings compared to appliance 2, which hasa peak during evening time. A rule can be defined whichcompares the average current taken by an appliance over thespecific time period to compare it with the expected readingsfor that time context.
In summary, the same data flow applies to this use caseas for the Madrid Transportation use case described earlier.The main difference lies in how the historical data is analyzed(event classification versus anomaly detection).
V. CONCLUSIONS AND FUTURE WORK
In this paper, we proposed and implemented an architec-ture for extracting valuable historical insights and actionableknowledge from IoT data streams. Our proposed architecturesupports both real-time and historical data analytics using itshybrid data processing model. We implemented our proposedarchitecture using open source components optimized for largescale applications. The feasibility of the proposed architecturewas demonstrated with the help of real-world smart city usecases for transportation and energy management, where ourproposed solution enables efficient analysis of streaming dataand provides intelligent and automatic responses by exploitinglarge historical data.
We implemented a version of the Madrid Traffic use case onthe IBM Bluemix platform, together with collaborators fromthe IBM Bluemix Architecture Center. Bluemix is IBM’s PaaSoffering, providing microservices for the main componentsused in our hut architecture instance (Node-red, Apache Kafka,Apache Spark and OpenStack Swift). Source code for thisimplementation is available for experimentation and adaptationto other IoT use cases [35]. This demonstrates the amenabilityof our architecture to the microservices model, and providestools to the community for further research. In addition, ourwork led to the development of a bridge connecting Message
IEEE INTERNET OF THINGS JOURNAL, VOL. X, NO. X, XX 2017 9
Hub (the Bluemix Kafka service) with the Bluemix ObjectStorage service [36].
Our experiments using the hut architecture extend existingsolutions by providing simple but integrated batch and eventprocessing capabilities. Our implementation applies to bothtransportation and energy management scenarios with only mi-nor changes. Given the generality of the proposed architecture,it can also be applied to many other IoT scenarios such asmonitoring goods in a supply chain or smart health care. Amajor benefit of adopting such an architecture is the potentialcost reduction at both development and deployment time byusing a common framework for multiple IoT applicationsand plugging in various alternative components to generatevariations as needed.
In future, we aim to evaluate our architecture on addi-tional IoT applications where knowledge about complex eventscan contribute to more innovative and automated solutions.Furthermore, we intend to improve the process of automaticgeneration of threshold values by considering other machinelearning algorithms. We also plan to make our system morecontext-aware by ingesting and analyzing social media data.
ACKNOWLEDGEMENTS
The research leading to these results was supported bythe European Union’s FP7 project COSMOS under grant No609043 and European Union’s Horizon 2020 project CPaaS.iounder grant No 723076.
REFERENCES
[1] R. Sakhuja. (2016) 5 Reasons why Microser-vices have become so popular in the last 2years. [Online]. Available: https://www.linkedin.com/pulse/5-reasons-why-microservices-have-become-so-popular-last-sakhuja
[2] J. Dean and S. Ghemawat, “Mapreduce: Simplified data processing onlarge clusters,” Commun. ACM, vol. 51, no. 1, pp. 107–113, Jan. 2008.[Online]. Available: http://doi.acm.org/10.1145/1327452.1327492
[3] A. Hadoop, “Hadoop,” 2009.[4] D. Guide, “Amazon elastic mapreduce,” 2010.[5] Amazon EC2 - Virtual Server Hosting. [Online]. Available: https:
//aws.amazon.com/ec2/[6] Amazon S3 AWS Cloud - Simple, durable, massively scalable object
storage. [Online]. Available: https://aws.amazon.com/s3/[7] OpenStack Sahara. [Online]. Available: https://wiki.openstack.org/wiki/
Sahara[8] M. Zaharia, M. Chowdhury, M. J. Franklin, S. Shenker, and I. Stoica,
“Spark: cluster computing with working sets.” HotCloud, vol. 10, pp.10–10, 2010.
[9] M. Zaharia, M. Chowdhury, T. Das, A. Dave, J. Ma, M. McCauley,M. J. Franklin, S. Shenker, and I. Stoica, “Resilient distributeddatasets: A fault-tolerant abstraction for in-memory cluster computing,”in Proceedings of the 9th USENIX Conference on NetworkedSystems Design and Implementation, ser. NSDI’12. Berkeley, CA,USA: USENIX Association, 2012, pp. 2–2. [Online]. Available:http://dl.acm.org/citation.cfm?id=2228298.2228301
[10] M. Zaharia, T. Das, H. Li, T. Hunter, S. Shenker, and I. Stoica,“Discretized streams: Fault-tolerant streaming computation at scale,”in Proceedings of the Twenty-Fourth ACM Symposium on OperatingSystems Principles. ACM, 2013, pp. 423–438.
[11] G. Cugola and A. Margara, “Processing flows of information: Fromdata stream to complex event processing,” ACM Comput. Surv.,vol. 44, no. 3, pp. 15:1–15:62, Jun. 2012. [Online]. Available:http://doi.acm.org/10.1145/2187671.2187677
[12] N. Marz and J. Warren, Big Data: Principles and Best Practices ofScalable Realtime Data Systems, 1st ed. Greenwich, CT, USA: ManningPublications Co., 2015.
[13] Simplifying the (complex) Lambda architecture. [Online]. Available:https://voltdb.com/blog/simplifying-complex-lambda-architecture
[14] Questioning the Lambda Architecture. [Online]. Available: https://www.oreilly.com/ideas/questioning-the-lambda-architecture
[15] V. Chandola, A. Banerjee, and V. Kumar, “Anomaly detection: Asurvey,” ACM Comput. Surv., vol. 41, no. 3, pp. 15:1–15:58, Jul. 2009.[Online]. Available: http://doi.acm.org/10.1145/1541880.1541882
[16] A. Akbar, F. Carrez, K. Moessner, and A. Zoha, “Predicting complexevents for pro-active iot applications,” in 2015 IEEE 2nd World Forumon Internet of Things (WF-IoT), Dec 2015, pp. 327–332.
[17] Node-RED, “Node-RED: A visual tool for wiring the Internet of Things,” http://nodered.org//, 2016, [Online; accessed 6-May-2016].
[18] J. Kreps, N. Narkhede, J. Rao et al., “Kafka: A distributed messagingsystem for log processing,” in Proceedings of the NetDB, 2011, pp. 1–7.
[19] Pinterest Secor. [Online]. Available: https://github.com/pinterest/secor[20] OpenStack: Open source software for creating private and public
clouds. [Online]. Available: https://www.openstack.org/[21] CloudFiles: Scalable cloud object storage. [Online]. Available:
https://www.rackspace.com/cloud/files[22] OpenStack Swift Documentation. [Online]. Available: http://docs.
openstack.org/developer/swift/[23] Apache Parquet Documentation. [Online]. Available: https://parquet.
apache.org/documentation/latest/[24] J. Kestelyn. (2016) Benchmarking Apache Parquet: The Allstate
Experience. [Online]. Available: https://blog.cloudera.com/blog/2016/04/benchmarking-apache-parquet-the-allstate-experience/
[25] Softlayer - API Operations for Search Services. [Online]. Available:http://sldn.softlayer.com/article/API-Operations-Search-Services
[26] Elastic Search github repository. [Online]. Available: https://github.com/elastic/elasticsearch
[27] Welcome to Apache Lucene. [Online]. Available: http://lucene.apache.org/
[28] Learn More About Solr. [Online]. Available: http://lucene.apache.org/solr/
[29] X. Meng, J. Bradley, B. Yuvaz, E. Sparks, S. Venkataraman, D. Liu,J. Freeman, D. Tsai, M. Amde, S. Owen et al., “Mllib: Machine learningin apache spark,” JMLR, vol. 17, no. 34, pp. 1–7, 2016.
[30] A. Akbar, F. Carrez, K. Moessner, J. Sancho, and J. Rico, “Context-aware stream processing for distributed iot applications,” in 2015 IEEE2nd World Forum on Internet of Things (WF-IoT), Dec 2015, pp. 663–668.
[31] S. Petrovic, “A comparison between the silhouette index and the davies-bouldin index in labelling ids clusters,” in Proceedings of the 11th NordicWorkshop of Secure IT Systems, 2006, pp. 53–64.
[32] A. Margara, G. Cugola, and G. Tamburrelli, “Learning from thepast: Automated rule generation for complex event processing,”in Proceedings of the 8th ACM International Conference onDistributed Event-Based Systems, ser. DEBS ’14. New York,NY, USA: ACM, 2014, pp. 47–58. [Online]. Available: http://doi.acm.org/10.1145/2611286.2611289
[33] A. Akbar, A. khan, F. Carrez, and K. Moessner, “Predictive analyticsfor complex iot data streams,” IEEE Internet of Things Journal, vol. PP,no. 99, pp. 1–1, 2017.
[34] T. Hargreaves, M. Nye, and J. Burgess, “Making energy visible: Aqualitative field study of how householders interact with feedback fromsmart energy monitors,” Energy policy, vol. 38, no. 10, pp. 6111–6119,2010.
[35] Real Time Traffic Analysis Sample Application. [Online]. Available:https://github.com/cfsworkload/data-analytics-transportation
[36] P. Ta-Shma. (2017) End-to-End IoT Data Pipelines in IBMBluemix: Introducing the Message Hub Object Storage Bridge.[Online]. Available: https://www.ibm.com/blogs/bluemix/2017/03/end-to-end-iot-data-pipelines-introducing-the-message-hub-object-storage/


![Kera: A Unified Storage and Ingestion Architecture for Efficient … · 2020-05-12 · Unified Storage and Ingestion Architecture for Efficient Stream Processing. [Research Report]](https://img.pdfslide.net/doc/110x75/5ed372ed87321e22e04825dc/kera-a-unified-storage-and-ingestion-architecture-for-efficient-2020-05-12-unified.jpg)