Embed Size (px)
Citation preview
IEEE JOURNAL OF SELECTED TOPICS IN APPLIED EARTH OBSERVATIONS AND REMOTE SENSING, VOL. 6, NO. 3, JUNE 2013 1749
Examining Urban Heat Island Relations to Land Useand Air Pollution: Multiple Endmember SpectralMixture Analysis for Thermal Remote Sensing
Bakhtiar Feizizadeh and Thomas Blaschke
Abstract—This paper proposes an integration of Spectral Mix-ture Analysis and Endmember Remote Sensing Indices to deriveland surface temperature (LST), to identify urban heat islands(UHI) and to investigate their relationships to land use/land cover(LULC) and air-pollution in Tabriz city, Iran. LST values areassessed from ASTER remotely sensed thermal images to appraisethe intensity of UHIs through a statistical approach. The resultsindicate that LST is highly influenced by LULC and that UHIsare closely linked to LST and LULC. As expected, LST is sensitiveto vegetation and moisture and low temperatures are found inwater bodies and vegetated areas. High temperatures are relatedto construction zones and industrial sites which are not neces-sarily located in the city centre. While the results demonstrate ahigh correlation between UHIs and air-pollution spatial analysisdiscloses a different pattern: when correlating identified UHIzones with air pollution the market area of Tabriz city reveals thehighest measured PM values.
Index Terms—Air pollution, ASTER, endmember remotesensing indices, land surface temperature, land use, spectralmixture analysis, Tabriz city, urban heat island.
I. INTRODUCTION
U RBAN heating and the formation of urban heat islands(UHIs) is one attribute of urban land transformation that
is of interest across science disciplines, since the UHI signal re-flects a broad suite of important land surface changes impactinghuman health, ecosystem function, local weather and, possibly,climate [1]. In recent years, the mapping of urban biophysicaland thermal conditions, as well as their relation to land use andland cover (LULC) and air pollution, has attracted increasing in-terest. In most cases, UHIs are a result of the use of fossil fuelswhich affects air-pollution in urban areas. It is a well-known factthat increasing population numbers, particularly in developingcountries, intensify the pressure on natural resources [2]. Rapidpopulation growth, in conjunction with urbanization, expansion,and encroachment into the limited agricultural and green areas
Manuscript received March 20, 2013; accepted May 11, 2013. Date of pub-lication May 30, 2013; date of current version June 17, 2013. This work wassupported in part by the Austrian Science Fund (FWF) through the DoctoralCollege GIScience (DK W 1237-N23).B. Feizizadeh is with the Center for GIS and Remote Sensing, Department
of Physical Geography, University of Tabriz, Tabriz 51368, Iran. He is alsowith the Department of Geoinformatics, University of Salzburg, Salzburg 5020,Austria (corresponding author, e-mail: [email protected]; [email protected]).T. Blaschke is with the Department of Geoinformatics, University of
Salzburg, Salzburg 5020, Austria (e-mail: [email protected]).Color versions of one or more of the figures in this paper are available online
at http://ieeexplore.ieee.org.Digital Object Identifier 10.1109/JSTARS.2013.2263425
lead to the destruction of vegetation coverage [3]. It is obviousthat such destruction, in combination with population growths,causes environmental impacts such as intensified land surfacetemperature (LST), UHIs and air-pollution. LST is consideredas one of the important parameters in urban climate, which di-rectly controls the UHI effect. LST is believed to correspondclosely with the LULC, resulting in heat islands [4]. LST re-search shows that the balance of land surface energy can be in-fluenced by the conversion of surface soil, water content, andvegetation [5]. It is well known that the incoming and outgoingradiation of urban surfaces correspond closely to the distribu-tion of LULC characteristics [6], [7]. An increasing number ofstudies analyse urban climate and, in particular, differences inobserved ambient air temperature between cities and their sur-rounding rural regions, which collectively describe the UHI ef-fect [4], [8]. A wide range of satellite and airborne sensors—in-cluding thermal sensors—have been used to study UHIs [3].In general, thermal remote sensing is regarded as an efficienttechnology which provides a synoptic and uniform means ofstudying UHI effects on a regional scale. In the absence of adense network of land-based meteorological stations, the spa-tiotemporal distribution of LSTs from thermal remote sensingimagery can be used as information to support UHI manage-ment [9] and, potentially, countermeasures. Thermal satellitemeasured LST has been utilized in various heat-balance, climatemodelling, and global change studies since it is determined bythe effective radiating temperature of the Earth’s surface, andto assess UHIs [10]. LST is also used in models of land sur-face atmosphere exchange, and when analyzing the relationshipbetween temperature and LULC [11], [3]. Based on this idea,the main objective of this research is to investigate the relation-ship between LST, UHI and LULC in Tabriz city, using ASTERthermal remote sensing satellite images.
II. STUDY AREA AND DATA
The study area of Tabriz city is located in Northwestern Iran.Tabriz city has about 2 million inhabitants and is one of the mostimportant urban and industrial regions in Iran. Tabriz has a semi-arid climate with pronounced seasons. The temperature variesbetween 38 C and 15C . The city is almost entirely sur-rounded by the steep foothills of mountain ranges [3]. The topo-graphical situation and the increasing number of industrial siteslead to a growing UHI effect, as well as to rising air pollution.In order to obtain LST and subsequently UHI zones, ASTER
images were acquired for June 25, 2011. ASTER is one of themajor satellite sensors used for LST and UHI determination[12]. In our research, the separate bands were layer stacked and
1939-1404/$31.00 © 2013 IEEE
1750 IEEE JOURNAL OF SELECTED TOPICS IN APPLIED EARTH OBSERVATIONS AND REMOTE SENSING, VOL. 6, NO. 3, JUNE 2013
transformed to pixel sizes of 15 by 15 m, in order to preservethe spatial features provided in the VNIR bands. Then the at-mospheric correction was carried out using ENVI software. Interms of the geometric correction, digital topographic maps of1:25,000 scale and GPS based ground control points were usedto correct the images. In order to achieve an acceptable geo-metric accuracy, 25 ground control points were used. A polyno-mial model was used for the rectification process with nearestneighbor resampling. The root-mean-square-error (RMSE) ofthe images was estimated to be 0.38.
III. METHODS
A. Remote Sensing Indices Used
First, original ASTER digital numbers (DNs) were convertedto radiance values. The visible and near-infrared bands weretransformed to reflectivity values and the thermal infrared bandsto radiant brightness values, using the parameters provided inthe header file. Respectively, the radiant brightness was con-verted to the brightness temperature based on the Planck func-tion. In order to obtain accurate LST values, we adopted thesubpixel temperature approach based on the endmember remotesensing indices (DisEMI). As the base of the DisEMI technique,the selection of remote sensing indices plays an important rolewhen estimating subpixel temperature for different land covertypes [13]. ASTER data provide a total of 9 VNIR/SWIR wave-bands which can be selected when constructing different remotesensing indices for different land cover types based on the dif-ference of spectral characteristics. We used the disTrad and theTsHARP techniques [13], [14]. The NDVI-LST relationship ex-ists within a sensor scene at multiple spatial resolutions. Simi-larly, in order to predict LST from available ASTER bands, thenormalized difference spectral indices (NDSI) were employedwith “pure pixels” temperature for each land cover type [13]:
(1)
where is the reflectance; and represent the central wave-length of each ASTER VNIR/SWIR band.The normalization aims to reduce atmospheric or other
sources of disturbances, reducing the proportional changesof the reflectance spectrum, as well as enhancing the spectralresponse to observed targets [13], [15]. In this study, all com-binations of the nine ASTER VNIR/SWIR bands were appliedin the NDSI formula as described in [13].
B. Linear Spectral Mixture Analysis
In order to extract subpixel information a linear spectralmixture analysis (LSMA) approach was performed. LSMA is aphysically based image processing technique, which supports arepeatable and accurate extraction of quantitative subpixel infor-mation [16], [17]. It is believed that the spectrum measured by asensor is a linear combination of the spectra of all componentswithin the pixel [18]. Because of its effectiveness in handling thespectral mixture problem, LSMA has been widely used in urbanUHI studies [18], [19]. LSMA provides subpixel endmemberfraction estimates, probably the most commonly used techniqueof all subpixel analysis techniques. An endmember is the spec-trum of a pure ground component (e.g., vegetation, soil, water)
and thus LSMA endmember fractions are typically interpretedas ground component fractions [20]. The LSMA approach canbe mathematically expressed as follows [20]:
(2)
where spectral reflectance of pixels in band ,number of endmembers, fraction of endmember withina pixel, known spectral reflectance of endmemberwithin the pixel in band , and error term for band [22].In respect to (2), lowest root mean square error (RMSE) can becomputed as follows [20]:
(3)
where is the error term for each of the spectra considered.Applying LSMA to remotely sensed satellite imagery typicallyalso adds the following additional constraints [20]:
(4)
Because finding requires solving a system of or(when the sum of fractions is forced to be 1) equations, thenumber of endmembers cannot exceed the number of bands[20]. Since ASTER imagery contains nine VNIR and SWIRbands and five TIR bands, both the urban biophysical descrip-tors and thermal features can be extracted from them. Theseimage transformations would allow the relationship betweenLST and biophysical descriptors to be examined [16].
C. Multiple Endmember Spectral Mixture Analysis
Numerous variants of LSMA have been developed to ad-dress the issue of endmember variability. In this regard, Mul-tiple Endmember Spectral Mixture Analysis (MESMA) was de-veloped by Roberts et al. [21] to allow the number and type ofendmembers to vary on a per-pixel basis [22]. MESMA itera-tively computes linear models using different sets of endmem-bers, and the model with the lowest RMSE is selected for eachindividual pixel [22]. In practice, MESMA iteratively computeslinear models using different sets of endmembers, and themodelwith the lowest RMSE is selected for each individual pixel [22].The flexibility of MESMA has permitted its application to map-ping a wide variety of vegetated and non-vegetated land cover.Within this research the advantage of MESMA together withNDSI and LSMA was used to retrieve LST and subsequently toidentifying UHI zones.
D. Computing Land Surface Temperature
In order to compute LST as a base map for UHIs we selectedASTER band 13 (10.25–10.95 m), since the spectral width ofthis band is close to the peak radiation of the black-body spec-trum released by the urban surface of the study area. Two stepsmust be considered when computing LSTs from ASTER satel-lite images: 1) spectral radiance must be converted to at-sensorbrightness temperature (i.e., black-body temperature); and
FEIZIZADEH AND BLASCHKE: EXAMINING URBAN HEAT ISLAND RELATIONS TO LAND USE AND AIR POLLUTION 1751
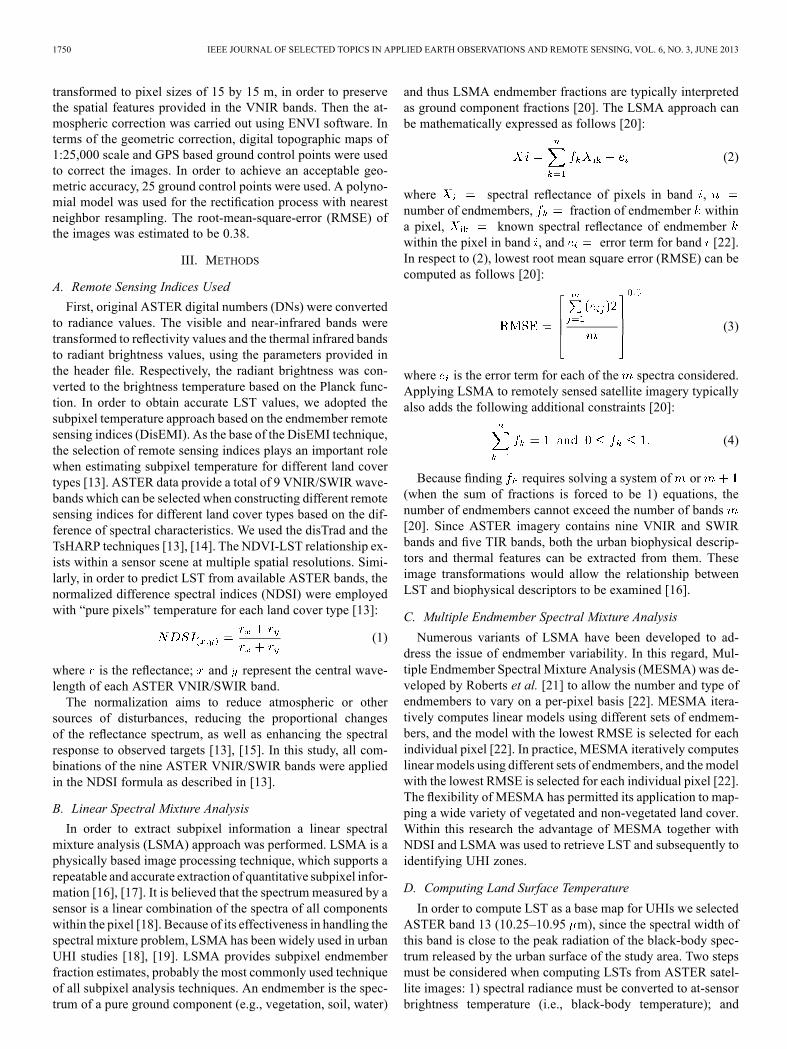
Fig. 1. Spatial distribution of the derived LST and the identified UHI zones in Tabriz city.
2) spectral emissivity must be corrected [16]. We adopted themost straightforward approximation of replacing the sensorresponse function with a delta function at the sensor’s centralwavelength, to invert LSTs with the assumption of uniformemissivity [23], [16]. The conversion performed is based onthe following equation [16]:
(5)
where is the brightness temperature of the central wavelengthin Kelvin (K), is the spectral radiance in Wm sr m ,is the sensor’s central wavelength, is the first radiation
constant ( Wm sr m ) and is thesecond radiation constant (0.0143879 ). The temperaturevalues obtained above are in reference to a black body. There-fore, a correction of spectral emissivity ( ) became necessary inregard to the nature of land cover [16]. In this regard, Snyder etal. [24] assigned an emissivity value to each of the land covercategories according to an emissivity classification scheme.The emissivity-corrected LSTs were computed as follows [16]:
(6)
where wavelength of emitted radiance (the peak responseand the average of the limiting wavelengths) [ m].
, Boltzmann constant, Planck’s constant
and velocity of light ms [16].
E. Selection of Endmembers
In LSMA, the spectral signatures of the mixed pixels are as-sumed to be a linear combination of the spectral signatures of
the surface materials which are known as endmembers, compo-nents or cover types, with their areal proportions as weightingfactors [25]. Selection of the endmembers is a critical step, asdevelopment of high-quality fraction images depends stronglyon the selection of suitable endmembers [26] which is consid-ered to be the key to success in LSMA and MESMA applica-tion [25].There are several advantages in using endmembers. Firstly,
they contain the same systematic errors due to atmospheric cor-rection as the image to be unmixed [20]. Secondly, the endmem-bers can represent responses from the selected material at thesame scale as the original image [20]. The selection of imageendmembers can be effectively performed through the use of apixel purity index (PPI) [27], [20]. The PPI method calculatesa score for each pixel, based on the number of times it is foundto occupy a near-vertex position in the repeated projections ofthe -dimensional data onto a randomly oriented vector passingthrough the mean of the data cloud. The output scores help iden-tify image endmembers, since the pixels that hold pure spectraoften display high PPI scores [20].For calculating endmembers in our study, ENVI software
was used. We selected endmembers manually by visual-izing the PPI results of spectrally pure pixels, which areidentified using the PPI in an -dimensional visualizer. Theimage-based endmember selection approach was applied toidentify two categories of endmembers (i.e., cold object andhot object). In order for this to happen, the TIR bands wereused to identify five endmembers from the VNIR and SWIRbands. The regions of interest determined for the endmem-bers, defined in the maximum noise fraction feature spaces,were used to extract endmembers’ spectra from the calibrated9-band ASTER imagery using a common spectral unmixingmethod [27], [20].
1752 IEEE JOURNAL OF SELECTED TOPICS IN APPLIED EARTH OBSERVATIONS AND REMOTE SENSING, VOL. 6, NO. 3, JUNE 2013
F. Extraction of Thermal Features Using LSMA and MESMA
In order to integrate ASTER’s five TIR bands into a newdataset, principal component analysis (PCA) was used. PCAis used here for the integration of the main information of thefive thermal bands into the LST calculation. In this respect, thePCA is used to convert TIR bands into new datasets, and theoutcome of PCA can be used to identify the number of end-members. The urban environment was assumed to be composedof three fundamental components, namely vegetation (mainlygreen vegetation), impervious and soil. The impervious com-ponent in urban environment includes artificial surfaces whichvary widely in spectral response. Two main categories of im-pervious surface components were assumed: a high-albedo anda low-albedo component [16]. Bright impervious surface infor-mation is included in the high-albedo component while dark im-pervious surface information is included in the low-albedo com-ponent [26]. Respectively, the hot- and cold- object endmem-bers were selected based on the scatterplots between the TIRimages. The hot-object endmember represented objects withhigh thermal radiance such as industrial sites, and the cold-ob-ject endmember represented objects with low thermal radiancesuch as water bodies and green spaces area. A constrained least-squares solution was then applied to unmix the five TIR bandsinto hot-object and cold-object fraction images. The hot-objectfraction image displayed high values in industrial areas, mediumvalues in residential areas, construction sites and bare lands, andlow values in green lands and water bodies. The derived LSTmap represents the LST values range between 8 and 30 C (seeFig. 1).
G. Correlating LST and NDVI
The relationship between LST and vegetation cover has beenfrequently studied using vegetation indices such as the NDVI[16] which provides an estimate of the abundance of activelyphotosynthesizing vegetation. In this study, NDVI was calcu-lated for the ASTER images used. It is well known that higherNDVI values typically indicate a larger fraction of vegetationin a pixel. The amount of vegetation determines the LST by thelatent heat flux from the surface to atmosphere via evapotranspi-ration. Lower LSTs are usually found in areas with high NDVI.This negative correlation between NDVI and LST is valuablefor urban climate studies [2]. Within our study, the NDVI wasused to examine the relationship between LST and vegetationcover. NDVI values for each pixel were scaled between baresoil ( ) and dense vegetation ( ) within a givenscene. The scaled value was calculated as follows [3]:
(7)
Using the scaled , the fractional vegetation cover( ) was calculated:
(8)
This nonlinear relationship was based on the assumption of un-stressed vegetation conditions [27]. Temperature values werealso scaled between the minimum and maximum values. These
TABLE ICORRELATION COEFFICIENTS BETWEEN LST, NDVI, AND LULC
values were identified in the LST image, and were used to cal-culate the normalized temperature values as follows [3]:
(9)
where is the LST for a given pixel, is the minimum tem-perature value corresponding to dense vegetation, and isthe maximum temperature value corresponding to bare soil, allobtained within a given scene [3]. The detailed results and cor-relation coefficients between LST, NDVI, and LULC are pre-sented in Table I.
H. Calculation of UHI Intensity
Once the LST is obtained, the UHI intensity can be calcu-lated respectively [20]. At the micro-scale, the UHI intensitywas strongly influenced by pixels with extreme LST values [18].In order to investigate the sensitivity of urban temperature anal-ysis and measurement of the UHI in respect to temporal aver-aging, statistical comparisons were performed for several levelsof aggregation. To examine the spatial distribution of surfaceradiant temperatures, the LST map was reclassified into seventemperature zones based on the classification scheme of stan-dard deviation. These classes were differentiated based on themean and standard deviation of the data distribution. The aver-aged LSTs of those five areas were regarded as the comparabletemperature in Tabriz city. Fig. 1 depicts the spatial distributionof identified UHI zones.
I. Relationship Between UHIs and Air-Pollution Maps
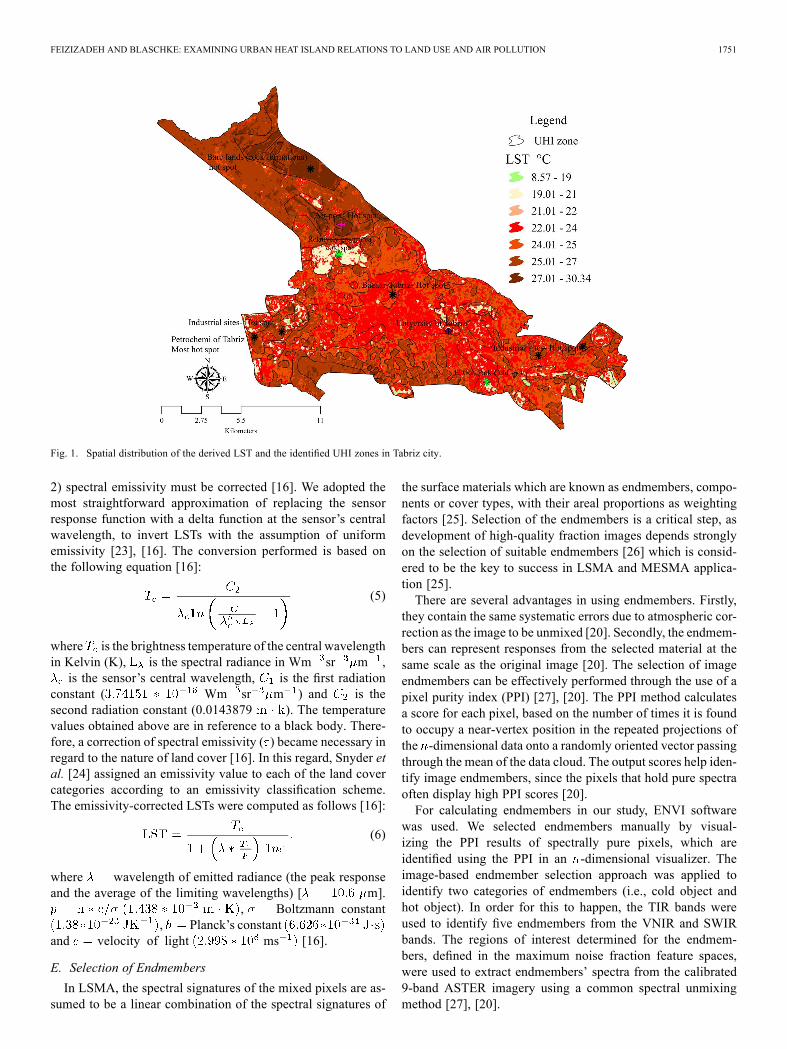
In order to compare UHIs and air-pollution conditions,ground-based measurements of particular matter (PM) wereobtained on same day as the ASTER satellite images (June25, 2011). The PM data was recorded by eight ground-basedair-pollution measurement stations within different parts ofTabriz city. The results of this data were interpolated usingthe inverse distance weighted method in GIS. In the followingstep, the PM map was compared to UHI zones. Fig. 2 showsthe resulting spatial distribution for the PM data in Tabriz city.
FEIZIZADEH AND BLASCHKE: EXAMINING URBAN HEAT ISLAND RELATIONS TO LAND USE AND AIR POLLUTION 1753
Fig. 2. Air pollution map of Tabriz city.
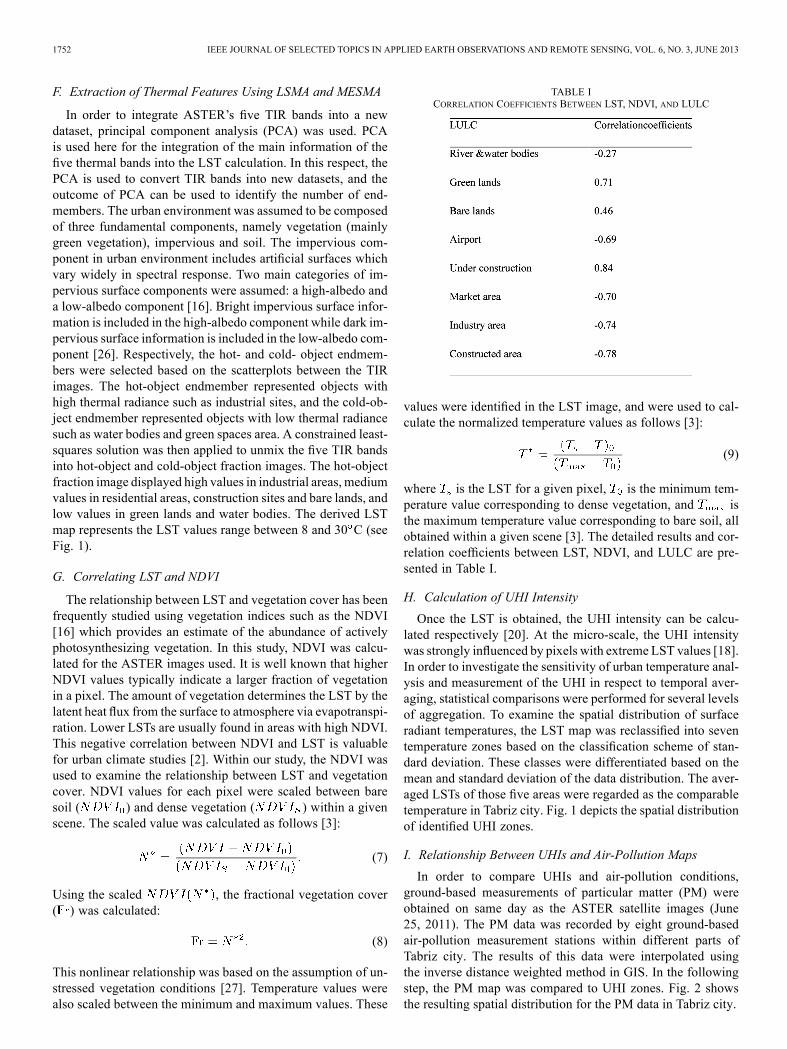
Fig. 3. LULC map of Tabriz city.
IV. RESULTS
A. Relationship of UHI and LULC
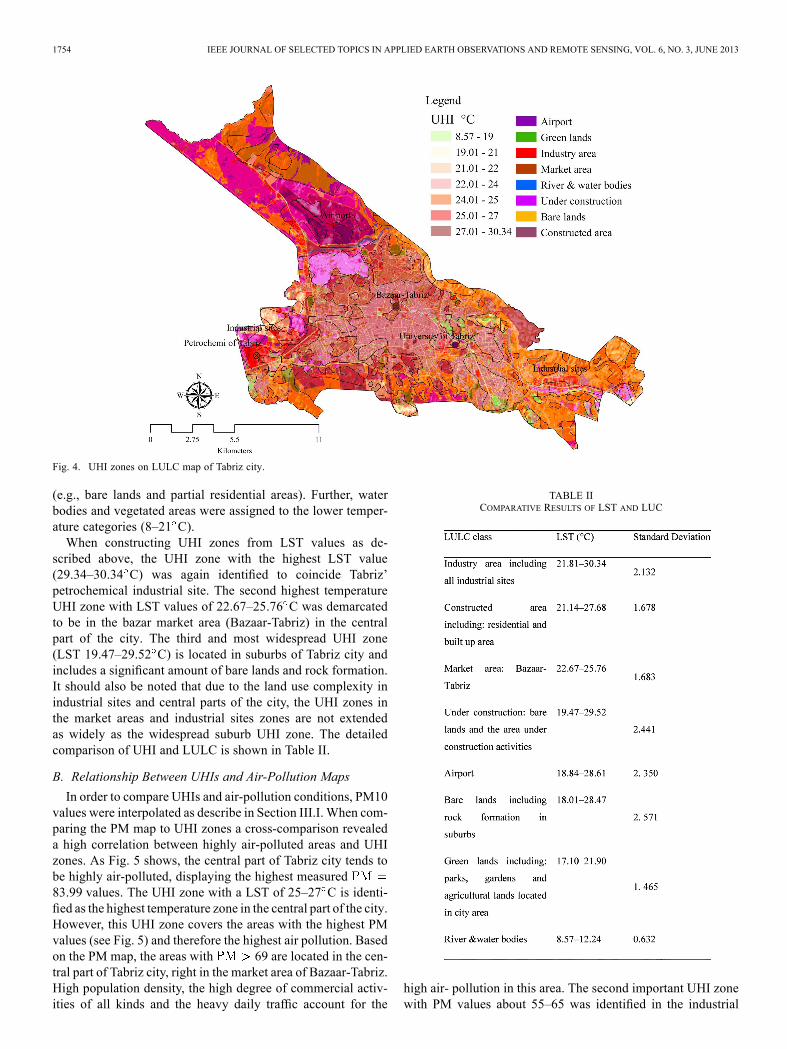
The UHI map was compared to a very detailed LULC mapof Tabriz city which was derived from aerial photography ina 1:2000 scale, using photogrammetric methods (see Fig. 3).The identified UHI zones were converted to vector format ina GIS environment and integrated with the LULC map (seeFig. 4). In order to analyse the impact of LULC on UHI andtheir interactions, the relationship between the UHI and LULC
maps were investigated. The comparison indicated a positivecorrelation between HUI, LST and UHI zones which are con-trolled by LULC classes. A cross-comparison between the UHImap and the LULC map revealed a minimum value of 8.57 Cfor reflective water bodies. A maximum of 30.34 C was ob-served for a point in Tabriz petrochemical industrial site. For theLUCL class industry (21.14–29.52 C) the highest LST valuesfell within construction sites, the market areas of Bazaar-Tabrizand built up areas at the airport. However, moderate tempera-tures (18–28 C) were also observed within non-vegetated areas
1754 IEEE JOURNAL OF SELECTED TOPICS IN APPLIED EARTH OBSERVATIONS AND REMOTE SENSING, VOL. 6, NO. 3, JUNE 2013
Fig. 4. UHI zones on LULC map of Tabriz city.
(e.g., bare lands and partial residential areas). Further, waterbodies and vegetated areas were assigned to the lower temper-ature categories (8–21 C).When constructing UHI zones from LST values as de-
scribed above, the UHI zone with the highest LST value(29.34–30.34 C) was again identified to coincide Tabriz’petrochemical industrial site. The second highest temperatureUHI zone with LST values of 22.67–25.76 C was demarcatedto be in the bazar market area (Bazaar-Tabriz) in the centralpart of the city. The third and most widespread UHI zone(LST 19.47–29.52 C) is located in suburbs of Tabriz city andincludes a significant amount of bare lands and rock formation.It should also be noted that due to the land use complexity inindustrial sites and central parts of the city, the UHI zones inthe market areas and industrial sites zones are not extendedas widely as the widespread suburb UHI zone. The detailedcomparison of UHI and LULC is shown in Table II.
B. Relationship Between UHIs and Air-Pollution Maps
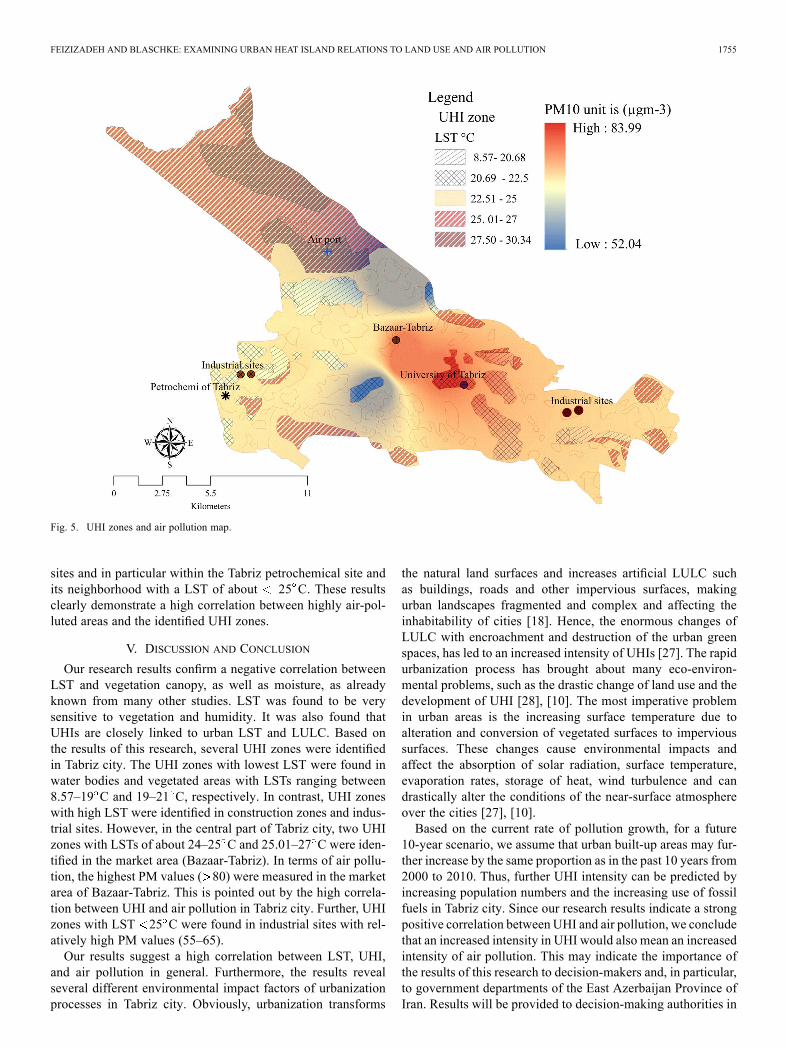
In order to compare UHIs and air-pollution conditions, PM10values were interpolated as describe in Section III.I. When com-paring the PM map to UHI zones a cross-comparison revealeda high correlation between highly air-polluted areas and UHIzones. As Fig. 5 shows, the central part of Tabriz city tends tobe highly air-polluted, displaying the highest measured83.99 values. The UHI zone with a LST of 25–27 C is identi-fied as the highest temperature zone in the central part of the city.However, this UHI zone covers the areas with the highest PMvalues (see Fig. 5) and therefore the highest air pollution. Basedon the PM map, the areas with 69 are located in the cen-tral part of Tabriz city, right in the market area of Bazaar-Tabriz.High population density, the high degree of commercial activ-ities of all kinds and the heavy daily traffic account for the
TABLE IICOMPARATIVE RESULTS OF LST AND LUC
high air- pollution in this area. The second important UHI zonewith PM values about 55–65 was identified in the industrial
FEIZIZADEH AND BLASCHKE: EXAMINING URBAN HEAT ISLAND RELATIONS TO LAND USE AND AIR POLLUTION 1755
Fig. 5. UHI zones and air pollution map.
sites and in particular within the Tabriz petrochemical site andits neighborhood with a LST of about 25 C. These resultsclearly demonstrate a high correlation between highly air-pol-luted areas and the identified UHI zones.
V. DISCUSSION AND CONCLUSION
Our research results confirm a negative correlation betweenLST and vegetation canopy, as well as moisture, as alreadyknown from many other studies. LST was found to be verysensitive to vegetation and humidity. It was also found thatUHIs are closely linked to urban LST and LULC. Based onthe results of this research, several UHI zones were identifiedin Tabriz city. The UHI zones with lowest LST were found inwater bodies and vegetated areas with LSTs ranging between8.57–19 C and 19–21 C, respectively. In contrast, UHI zoneswith high LST were identified in construction zones and indus-trial sites. However, in the central part of Tabriz city, two UHIzones with LSTs of about 24–25 C and 25.01–27 C were iden-tified in the market area (Bazaar-Tabriz). In terms of air pollu-tion, the highest PM values ( 80) were measured in the marketarea of Bazaar-Tabriz. This is pointed out by the high correla-tion between UHI and air pollution in Tabriz city. Further, UHIzones with LST 25 C were found in industrial sites with rel-atively high PM values (55–65).Our results suggest a high correlation between LST, UHI,
and air pollution in general. Furthermore, the results revealseveral different environmental impact factors of urbanizationprocesses in Tabriz city. Obviously, urbanization transforms
the natural land surfaces and increases artificial LULC suchas buildings, roads and other impervious surfaces, makingurban landscapes fragmented and complex and affecting theinhabitability of cities [18]. Hence, the enormous changes ofLULC with encroachment and destruction of the urban greenspaces, has led to an increased intensity of UHIs [27]. The rapidurbanization process has brought about many eco-environ-mental problems, such as the drastic change of land use and thedevelopment of UHI [28], [10]. The most imperative problemin urban areas is the increasing surface temperature due toalteration and conversion of vegetated surfaces to impervioussurfaces. These changes cause environmental impacts andaffect the absorption of solar radiation, surface temperature,evaporation rates, storage of heat, wind turbulence and candrastically alter the conditions of the near-surface atmosphereover the cities [27], [10].Based on the current rate of pollution growth, for a future
10-year scenario, we assume that urban built-up areas may fur-ther increase by the same proportion as in the past 10 years from2000 to 2010. Thus, further UHI intensity can be predicted byincreasing population numbers and the increasing use of fossilfuels in Tabriz city. Since our research results indicate a strongpositive correlation between UHI and air pollution, we concludethat an increased intensity in UHI would also mean an increasedintensity of air pollution. This may indicate the importance ofthe results of this research to decision-makers and, in particular,to government departments of the East Azerbaijan Province ofIran. Results will be provided to decision-making authorities in
1756 IEEE JOURNAL OF SELECTED TOPICS IN APPLIED EARTH OBSERVATIONS AND REMOTE SENSING, VOL. 6, NO. 3, JUNE 2013
order to take further action to control LULC changes and to con-trol air pollution and UHI intensities.
ACKNOWLEDGMENT
The authors would like to thank the anonymous reviewers fortheir constructive comments on an earlier version of this paper.
REFERENCES
[1] M. L. Imhoff, P. Zhang, R. E.Wolfe, and L. Bounoua, “Remote sensingof the urban heat island effect across biomes in the continental USA,”Remote Sens. Environ., vol. 114, pp. 504–513, 2010.
[2] B. Feizizadeh and T. Blaschke, “Land suitability analysis for TabrizCounty, Iran: A multi-criteria evaluation approach using GIS,” J. Env-iron. Plan. Manag., vol. 56, pp. 1–23, 2013.
[3] R. Amiri, Q. Weng, A. Alimohammadi, and S. K. Alavipana, “Spatial-temporal dynamics of land surface temperature in relation to fractionalvegetation cover and land use/cover in the Tabriz urban area, Iran,”Remote Sens. Environ., vol. 113, pp. 2606–2617, 2009.
[4] Q. Weng, D. Lu, and J. Schubring, “Estimation of land surface temper-ature-vegetation abundance relationship for urban heat island studies,”Remote Sens. Environ., vol. 89, pp. 467–483, 2004.
[5] Z. Q. Li and Q. G. Zhou, “Utility of Landsat image in the study of landcover and land surface temperature change,” Procedia Environ. Sci.,vol. 10, pp. 1287–1292, 2011.
[6] C. P. Lo, D. Quattrochi, and J. Luvall, “Application of high-resolutionthermal infrared remote sensing and GIS to assess the urban heat islandeffect,” Int. J. Remote Sens., vol. 18, pp. 287–304, 1997.
[7] Q. Weng, “A remote sensing-GIS evaluation of urban expansion andits impact on surface temperature in the Zhujiang Delta, China,” Int. J.Remote Sens., vol. 22, no. 10, pp. 1999–2014, 2001.
[8] H. E. Landsberg, The Urban Climate. New York, NY, USA: Aca-demic Press, 1981.
[9] B. Feizizadeh, T. Blaschke, H. Nazmfar, E. Akbari, and H. R. Ko-hbanani, “Monitoring land surface temperature relationship to land use/land cover from satellite imagery inMaraqeh County, Iran,” J. Environ.Plan. Manag., 2013, DOI: 10.1080/09640568.2012.717888.
[10] F. Yuan and M. E. Bauer, “Comparison of impervious surface area andnormalized difference vegetation index as indicators of surface urbanheat island effects in Landsat imagery,” Remote Sens. Environ., vol.106, pp. 375–386, 2007.
[11] J. A. Voogt and T. R. Oke, “Thermal remote sensing of urban climate,”Remote Sens. Environ., vol. 86, pp. 370–384, 2003.
[12] B. Feizizadeh and T. Blaschke, “Thermal remote sensing for exam-ining the relationship between urban land surface temperature and landuse/cover in Tabriz city, Iran,” in Proc. IEEE IGARSS, Jul. 2012, pp.2229–2232, DOI: 10.1109/IGARSS.2012.6351056.
[13] G. Yang, P. Ruiliang, Z. Chunjian, H. Wenjiang, and W. Jihua, “Esti-mation of subpixel land surface temperature using an endmember indexbased technique: A case examination on ASTER and MODIS temper-ature products over a heterogeneous area,” Remote Sens. Environ., vol.115, pp. 1202–1219, 2011.
[14] N. Agam, W. P. Kustas, M. C. Anderson, F. Q. Li, and C. M. U. Neale,“A vegetation index based technique for spatial sharpening of thermalimagery,” Remote Sens. Environ., vol. 107, pp. 545–558, 2007.
[15] A. R. Huete, “A soil adjusted vegetation index (SAVI),” Remote Sens.Environ., vol. 25, pp. 295–309, 1998.
[16] D. Lu and Q. Weng, “Spectral mixture analysis of ASTER images forexamining the relationship between urban thermal features and bio-physical descriptors in Indianapolis, Indiana, USA,” Remote Sens. En-viron., vol. 104, pp. 157–167, 2006.
[17] M. O. Smith, S. L. Ustin, J. B. Adams, and A. R. Gillespie, “Vegeta-tion in deserts: I. A regional measure of abundance from multispectralimages,” Remote Sens. Environ., vol. 31, pp. 1–26, 1990.
[18] Q. Weng, U. Rajasekar, and X. Hu, “Modeling urban heat islands andtheir relationship with impervious surface and vegetation abundanceby using ASTER images,” IEEE Trans. Geosci. Remote Sens., SpecialIssue on IGARSS 2010, vol. 49, no. 10, pp. 4080–4089, Oct. 2011.
[19] Q. Weng and D. Lu, “Landscape as a continuum: An examinationof the urban landscape structures and dynamics of Indianapolis city,1991–2000,” Int. J. Remote Sens., vol. 30, pp. 2547–2577, 2009.
[20] D. A. Roberts, M. Gardner, R. Church, S. Ustin, G. Scheer, and R.O. Green, “Mapping Chaparral in the Santa Monica Mountains usingmultiple endmember spectral mixture models,” Remote Sens. Environ.,vol. 65, pp. 267–279, 1998.
[21] K. L. Roth, P. E. Dennison, and D. A. Roberts, “Comparing end-member selection techniques for accurate mapping of plant speciesand land cover using imaging spectrometer data,” Remote Sens.Environ., vol. 127, pp. 139–152, 2012.
[22] F. Li, T. J. Jackson, W. P. Kustas, T. J. Schmugge, A. N. French, andM. H. Cosh, “Deriving land surface temperature from Landsat 5 and 7during,” Remote Sens. Environ., vol. 92, pp. 521–534, 2004.
[23] W. C. Snyder, Z.Wan, Y. Zhang, and Y.-Z. Feng, “Classification-basedemissivity for land surface temperature measurement from space,” Int.J. Remote Sens., vol. 19, pp. 2753–2774, 1998.
[24] R. Pu, P. Gong, R. Michishita, and T. Sagwa, “Spectral mixture anal-ysis for mapping abundance of urban surface components from theTerra/ASTER data,” Remote Sens. Environ., vol. 112, pp. 939–954,2008.
[25] Z. Mitraka, N. Chrysoulakis, Y. Kamarianakis, P. Partsinevelos, andP. Tsouchlaraki, “Improving the estimation of urban surface emissivitybased on sub-pixel classification of high resolution satellite imagery,”Remote Sens. Environ., vol. 117, pp. 125–134, 2012.
[26] J. B. Adams, D. E. Sabol, V. Kapos, R. A. Filho, D. A. R. A. Roberts,M. O. Smith, and A. R. Gillespie, “Classification of multispectralimages based on fractions of endmembers: Application to land coverchange in the Brazilian Amazon,” Remote Sens. Environ., vol. 52, pp.137–154, 1995.
[27] A. S. Mather, Land Use. London, U.K.: Longman, 2008.[28] Y. K. Mallick and B. D. Bharath, “Estimation of land surface temper-
ature over Delhi using Landsat-7 ETM+,” J. Indian Geophys. Union,vol. 12, no. 3, pp. 131–140, 2008.
Bakhtiar Feizizadeh is currently pursuing the Ph.D.degree within the doctoral program Applied Geoin-formatics at the University of Salzburg, Salzburg,Austria. His main research interests include method-ological issues in geoinformatics, integration ofGIS and Remote Sensing for land use/cover mon-itoring, land suitability analysis, geohazard andrisk assessment, in particular landslide mapping.He has practiced developing methodology for GISbased Multicriteria Decision Anlysis (GIS-MCDA),modelling sensitivity and uncertainty in GIS envi-
ronment, Object Based Image Analysis (OBIA) and thermal Remote Sensingimage processing. He has published more than 50 scientific publications andhas teaching experiences in both Remote Sensing and GIS.
Thomas Blaschke is a full Professor at the Univer-sity of Salzburg and Deputy Chair of the Departmentof Geoinformatics – Z_GIS, Head of the ResearchStudio iSPACE and Director of the Doctoral CollegeGIScience. His research interests include method-ological issues of the integration of GIS, remotesensing and image processing also with aspects ofparticipation and human-environment interaction.His academic record includes several temporaryaffiliations as guest professor and visiting scien-tist in Germany, the UK and the US including a
Fulbright Professorship at California State University and has 300 scientificpublications including 65 journal publications. He is author, co-author or editorof 17 books and received several academic prices and awards including theChristian-Doppler Prize 1995.