Embed Size (px)
Citation preview
This article has been accepted for inclusion in a future issue of this journal. Content is final as presented, with the exception of pagination.
IEEE TRANSACTIONS ON POWER DELIVERY 1
Stochastic Multiperiod OPF Model of Power SystemsWith HVDC-Connected Intermittent Wind Power
GenerationAbbas Rabiee and Alireza Soroudi
Abstract—This paper presents a newmodel for a stochastic mul-tiperiod optimal power-flow (SMP-OPF) problem which includesan offshore wind farm connected to the grid by a line-commutatedconverter high-voltage dc link. The offshore wind farm is com-posed of doubly fed induction generators (DFIGs), and the DFIG’scapability curve is considered in order to obtain a more realisticdispatch for wind farms. The uncertainties of wind power gener-ation are also taken into account using a scenario-based approachwhich can be adopted by the system operator to obtain the op-timal active and reactive power schedules for thermal and windpower generation units. To illustrate the effectiveness of the pro-posed approach, it is applied on the IEEE 118-bus test system.The obtained results demonstrate the capability of the proposedSMP-OPFmodel for the determination of the optimal operation ofpower systems.
Index Terms—HVDC, optimal power flow (OPF), sce-nario-based modeling, uncertainty, wind power.
NOMENCLATURE
Active/reactive power of DFIG’s stator (in perunit).
Active/reactive power generation by thethermal unit located in bus (in per unit).
Active/reactive load in bus (in per unit).
Active power flowing through the HVDC link(in megawatts).
Active/reactive power of DFIG’s rotor (in perunit).
Active/reactive power output of DFIG (in perunit).
Active/reactive power purchased from pool (inper unit).
Manuscript received October 29, 2012; revised March 19, 2013; acceptedApril 14, 2013. Paper no. TPWRD-01164–2012.A. Rabiee is with the Department of Electrical Engineering, Faculty of Engi-
neering, University of Zanjan, Zanjan, Iran (e-mail: [email protected]).A. Soroudi is with the Department of Renewable Energies and Environmental
Sciences, Faculty of New Sciences and Technologies, University of Tehran,Tehran, Iran (e-mail: [email protected]).Color versions of one or more of the figures in this paper are available online
at http://ieeexplore.ieee.org.Digital Object Identifier 10.1109/TPWRD.2013.2259600
Angle difference between the fundamental linecurrent and line-to-neutral ac voltage (Radian).
Commutation resistances .
DFIG’s mutual/stator reactance (in per unit).
DFIG’s rotor slip.
DFIG’s load angle (in radians).
DFIG’s rotor current (in per unit).
DC voltage magnitudes at the HVDC terminals(in kilovolts).
DC current carried by the HVDC link (inkiloamperes).
Electricity price in scenario and time($/MWh).
Flow of th transmission line (in per unit).
Fuel cost coefficients of the th generation unit.
Ignition angle (in radians).
Ideal no-load voltage at the HVDC terminals(in kilovolts).
Magnitude/angle of the th element ofadmittance matrix (per unit/radians).
Number of series-connected bridges in theHVDC terminal.
Percent of available wind capacity in scenario.
Probability of scenario .
Rated active power output of DFIG (inmegawatts).
Ramp-up limit of the th thermal unit (inMW/h).
Ramp-down limit of power generation of theth thermal unit (in MW/h).
Reactive power compensation at the ac side ofHVDC terminals (in per unit).
Reactive power flowing into the ac side of theHVDC link (MVAr).
Resistance of the HVDC line .
0885-8977/$31.00 © 2013 IEEE
This article has been accepted for inclusion in a future issue of this journal. Content is final as presented, with the exception of pagination.
2 IEEE TRANSACTIONS ON POWER DELIVERY
Set of network buses.
Shunt admittance of passive filters at the ac sideof HVDC terminals (in per unit).
Stator voltage/current of DFIG (in per unit).
Tap ratio of the HVDC feeding transformer.
Time interval/scenario/system buses index.
Voltage magnitude/angle in bus (in perunit/radians).
I. INTRODUCTION
U TILIZATION of wind power generation technology istaking substantial attention around the world due to the
economical and environmental concerns [1]. Due to the sto-chastic nature of wind, the uncertainty modeling of wind powergeneration is still an important issue in the operation of prac-tical power systems [2]. One of the system operator’s objectivesis operating the system in a way that the total operation cost isminimized for a given future horizon, while satisfying a set oftechnical constraints. Such an optimization problem is calledmultiperiod optimal power flow (MP–OPF) [3]. The aim of aconventional MP–OPF problem is to find the steady-state op-erating point of the power system which minimizes generationcost or maximizes the social welfare and loadability, while sat-isfying a set of technical constraints, such as power-flow equa-tions, limits on generators’ active and reactive powers, line-flowlimits, and output of various compensating devices [3]–[5]. Inthe stochastic version ofMP–OPF (i.e., the SMP-OPF problem),the aforementioned objectives and constraints are considered ina probabilistic framework, by considering stochastic nature ofuncertainties.In many countries, the best locations for onshore wind farms
(WFs) are already developed, and the utilities are turning to off-shore sites. The main reason for this attraction is the availabilityof enormous wind resources. The lack of obstacles, such as hillsand generally smooth surface of the sea, also make the offshorewind power generation more reliable. The offshore wind farm isgenerally located far away from the onshore grid. If the distanceis long or if the offshore wind farm is connected to a weak ac on-shore grid, a high-voltage dc (HVDC) transmission system maybe a more suitable choice than the conventional high-voltageac transmission [6]. Two types of HVDC transmission topolo-gies (i.e., HVDCwith a voltage-source converter (VSC-HVDC)using insulated-gate bipolar transistors (IGBTs) and line-com-mutated converters HVDC (LCC-HVDC)) are available for off-shore wind farm connectivity [7], [8]. Different OPF modelshave been proposed in the literature to consider the impacts ofwind power generation. The previous studies for integration ofwind farms using HVDC links can be widely categorized basedon the considered objective functions and methodology point ofview: The objective functions cover a vast range of items suchas:• opportunity cost of wind power shortage and surplus [9];• cost of environmental benefit loss [9];
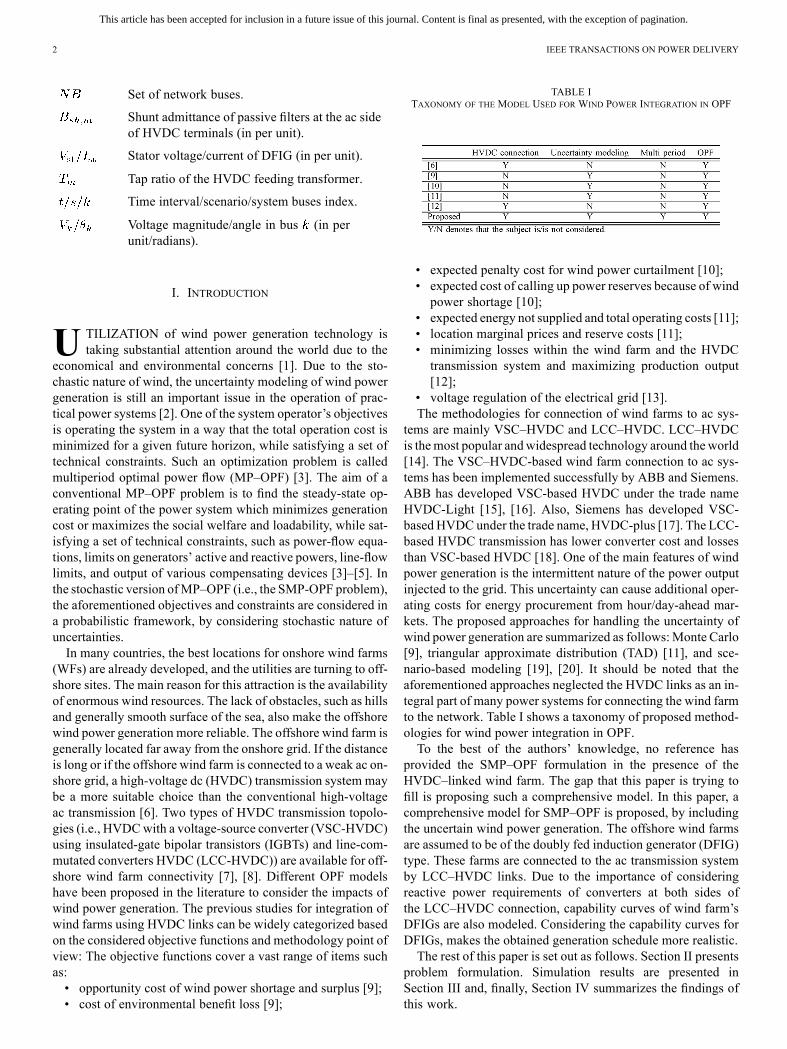
TABLE ITAXONOMY OF THE MODEL USED FOR WIND POWER INTEGRATION IN OPF
• expected penalty cost for wind power curtailment [10];• expected cost of calling up power reserves because of windpower shortage [10];
• expected energy not supplied and total operating costs [11];• location marginal prices and reserve costs [11];• minimizing losses within the wind farm and the HVDCtransmission system and maximizing production output[12];
• voltage regulation of the electrical grid [13].The methodologies for connection of wind farms to ac sys-
tems are mainly VSC–HVDC and LCC–HVDC. LCC–HVDCis themost popular andwidespread technology around theworld[14]. The VSC–HVDC-based wind farm connection to ac sys-tems has been implemented successfully by ABB and Siemens.ABB has developed VSC-based HVDC under the trade nameHVDC-Light [15], [16]. Also, Siemens has developed VSC-based HVDC under the trade name, HVDC-plus [17]. The LCC-based HVDC transmission has lower converter cost and lossesthan VSC-based HVDC [18]. One of the main features of windpower generation is the intermittent nature of the power outputinjected to the grid. This uncertainty can cause additional oper-ating costs for energy procurement from hour/day-ahead mar-kets. The proposed approaches for handling the uncertainty ofwind power generation are summarized as follows:Monte Carlo[9], triangular approximate distribution (TAD) [11], and sce-nario-based modeling [19], [20]. It should be noted that theaforementioned approaches neglected the HVDC links as an in-tegral part of many power systems for connecting the wind farmto the network. Table I shows a taxonomy of proposed method-ologies for wind power integration in OPF.To the best of the authors’ knowledge, no reference has
provided the SMP–OPF formulation in the presence of theHVDC–linked wind farm. The gap that this paper is trying tofill is proposing such a comprehensive model. In this paper, acomprehensive model for SMP–OPF is proposed, by includingthe uncertain wind power generation. The offshore wind farmsare assumed to be of the doubly fed induction generator (DFIG)type. These farms are connected to the ac transmission systemby LCC–HVDC links. Due to the importance of consideringreactive power requirements of converters at both sides ofthe LCC–HVDC connection, capability curves of wind farm’sDFIGs are also modeled. Considering the capability curves forDFIGs, makes the obtained generation schedule more realistic.The rest of this paper is set out as follows. Section II presents
problem formulation. Simulation results are presented inSection III and, finally, Section IV summarizes the findings ofthis work.
This article has been accepted for inclusion in a future issue of this journal. Content is final as presented, with the exception of pagination.
RABIEE AND SOROUDI: STOCHASTIC MULTIPERIOD OPF MODEL OF POWER SYSTEMS 3
II. PROBLEM FORMULATION
Load-flow equations of ac/dc networks, HVDC links’ steady-state model, and characteristics of wind power generation areformulated in this section. The assumptions, decision variables,constraints, and objective function of the proposed SMP–OPFare described as follows:
A. Decision Variables (DVs)
Two types of decision variables (DVs) are available for theproblem. The first type is the hourly active power generationschedule and terminal voltage of thermal units and tap settingsof HVDC links’ feeding transformers. These variables are de-termined based on a set of wind generation scenarios and re-main the same for all scenarios. These types of variables arecalled “here and now” variables. On the other hand, anothertype of control variable exists which differs from one scenarioto another, such as terminal voltages and active/reactive poweroutput of WFs, transmitted power through HVDC links, etc.These types of variables are also called “wait and see” variables[21].
B. Capability Curve of DFIG
By considering all quantities in per unit (p.u.) based on thenominal ratings of each DFIG (i.e., nominal volt-ampere andterminal voltage), the following constraints hold as follows.1) Stator Current Limit: This limit models the stator heating
due to the stator winding Joule losses. The relation betweenstator voltage, current, and active/reactive power outputs can beexpressed as follows [12]:
(1)
2) Rotor Current Limit: This limit considers the rotor heatingdue to the rotor winding Joule losses. In per unit, the equationsof the active and reactive power outputs of the DFIG’s stator areas follows [22]:
(2)
(3)
The following relation between the active and reactive poweroutput of the stator is obtained from (2) and (3):
(4)
Equation (4) represents a circle with the center ofand a radius equal to in
the – plane.3) Steady-State Stability Limit: The steady-state stability
limit shows maximum reactive power absorption by the DFIG,which is obtained when [6]. Therefore, from (2), thislimit is as follows:
(5)
Equation (5) gives a vertical line at , in the– plane. It is noteworthy that is the no-load re-
active power absorption, which means that the DFIG becomesunstable when the reactive power consumption is greater thanthe no-load reactive power [12].4) Total Capability Limit : By neglecting
stator and rotor resistances, the rotor active power generation,can be expressed as follows:
(6)
The grid-side inverter of the DFIG is usually operating witha unity power factor [12]. Hence, the injected reactive powerfrom the rotor winding is zero
(7)
The DFIG’s total active and reactive power generations are ob-tained by adding rotor active/reactive powers to the stator ac-tive/reactive powers, as follows:
(8)
(9)
By substituting the in (1) with the DFIG’s gird-sideterminal quantities (i.e., obtained from (8) and (9)),the stator current limits of DFIG are expressed as follows:
(10)
(11)
Similarly by substituting the in (4) with(obtained by (8) and (9)), the rotor current limit of DFIG is givenas
(12)
Also, the stability limit (5) is redefined as follows:
(13)
Therefore, the maximum limit of DFIG’s reactive power outputis determined by the minimum of (10) and (12). Similarly, theminimum limit of DFIG’s reactive power output is obtainedfrom the maximum of (11) and (13) as follows:
(14)
(15)
5) Wind-Turbine Maximum/Minimum Active Power OutputLimit: The restrictions related to the maximum active poweravailable at the wind turbine are expressed as follows:
(16)

This article has been accepted for inclusion in a future issue of this journal. Content is final as presented, with the exception of pagination.
4 IEEE TRANSACTIONS ON POWER DELIVERY
Fig. 1. Capability curve of DFIG, including the limits of stability and stator/rotor currents, and wind turbine available capacity.
Fig. 2. One-line diagram of the wind farm connection using the LCC–HVDClink.
The capability curve of the DFIG determines the feasible oper-ation regime in the – plane [22] as shown in Fig. 1. Fromthis figure, the feasible operating area in the – plane, is theclosed area specified by coordinates.
C. HVDC Modeling
The schematic of the LCC–HVDC link is depicted in Fig. 2.The relationship between the ideal no-load voltage at the dcsides of the LCC–HVDC link , and the ac-sidesvoltages are as follows. For , i (r: Rectifier, i: Inverter)[23]
(17)
Due to the commutation overlap, the aforementioned dc voltagedrops, and the actual voltages at both dc terminals will be asfollows [23]:
(18)
(19)
Hence, the active power at the dc sides is given by
(20)
Besides, the power factors at the HV buses of the HVDC link’sac sides (i.e., buses and in Fig. 2) are calculated as follows:
(21)
Also, with losses neglected, the ac and dc active powers areequal and the reactive power absorbed by the HVDC link at itsac terminals is expressed as follows:
(22)
Fig. 3. Single-line diagram of the IEEE 118-node system.
TABLE IITECHNICAL CHARACTERISTICS OF WIND TURBINES
TABLE IIIWIND POWER GENERATION SCENARIOS
TABLE IVDATA OF STUDIED HVDC LINKS
D. Uncertainty Modeling of Wind Power Generation
In this paper, a scenario-based model is used to describe thewind power generation [20]. It is assumed that the probabilitydensity function (PDF) of wind speed as well as the powercurve of the wind turbine is available. Using these data andscenario generation technique (described in Appendix A), thewind power generation is described and modeled in the pro-posed SMP–OPF model.

This article has been accepted for inclusion in a future issue of this journal. Content is final as presented, with the exception of pagination.
RABIEE AND SOROUDI: STOCHASTIC MULTIPERIOD OPF MODEL OF POWER SYSTEMS 5
Fig. 4. Schematic of the system under study.
E. Load-Flow Equations of the AC Network
The ac load balance equations for the th bus are as follows:
(23)
(24)
where and are injected active and reactivepowers, respectively, which are calculated as follows:
(25)
(26)
If bus is not connected to the pool market, thenand will be zero in (23) and (24).The magnitude of voltage in each bus should remain be-
tween the safe operating limits during each scenario and time
(27)
The thermal limits of transmission lines should also be satisfied
(28)
F. Load-Flow Equations at the Interface of the AC/DCNetworks
LCC–HVDC converters consumes reactive power, for allloading levels, and, hence, it is necessary to provide reactivepower compensating devices at the converter sites, to pre-vent large reactive power flow from the ac network. Usuallycapacitor banks, synchronous condensers, and static VArcompensators (SVCs) are employed for this aim. The VArcompensators are shown at the ac sides of the HVDC linkin Fig. 2. The passive filters are also connected to these acbuses. According to Fig. 2, at the inverter side of the HVDCconnection (i.e., for ), the power balance equations ofac/dc networks are as follows:
(29)
(30)
Similarly, for the rectifier side (i.e., for ), by neglectingthe active power losses of the transformers connecting theWF toHVDC rectifier terminal, the power balance equations of ac/dcnetworks are as follows:
(31)
(32)
where is the total reactive power injected from theHV side of transformers connecting the WF to the HVDC link,in scenario and time . The passive filters connected to theHVDC rectifier and inverter ac terminals, are represented byconstant shunt admittance in (30) and (32).
G. Thermal Power Generation Constraints
The following constraints are considered in order to modelthe cost and technical limits of thermal generation units [24]:1) Total power production cost of thermal generation units:the production cost is assumed to be quadratic as follows:
(33)
2) Generation limits of thermal units
(34)
(35)
where and are the maximum/min-imum limits of active/reactive power outputs in the ththermal unit.
3) Ramp-up and ramp-down constraints: the output-powerchange rate of the thermal unit should be below the pre-specified limits (ramp rates) to avoid damaging the boilerand combustion equipment, stated as follows:
(36)
(37)
H. Objective Function
The objective function of SMP–OPF to be minimized is de-fined as the total payment for energy procurement as follows:
Subject to: – (38)
The total cost in (38) is composed of two distinct terms. Thefirst term is related to the power purchased from the pool market,and the second term is related to the operating cost of thermalgeneration units over the entire operation horizon.
III. SIMULATION RESULTS
The proposed model for the SMP–OPF problem is exam-ined on the IEEE 118-bus system as depicted in Fig. 3 [25].This system consists of 54 generator buses and 186 transmis-sion lines. The necessary data of this system including the data
This article has been accepted for inclusion in a future issue of this journal. Content is final as presented, with the exception of pagination.
6 IEEE TRANSACTIONS ON POWER DELIVERY
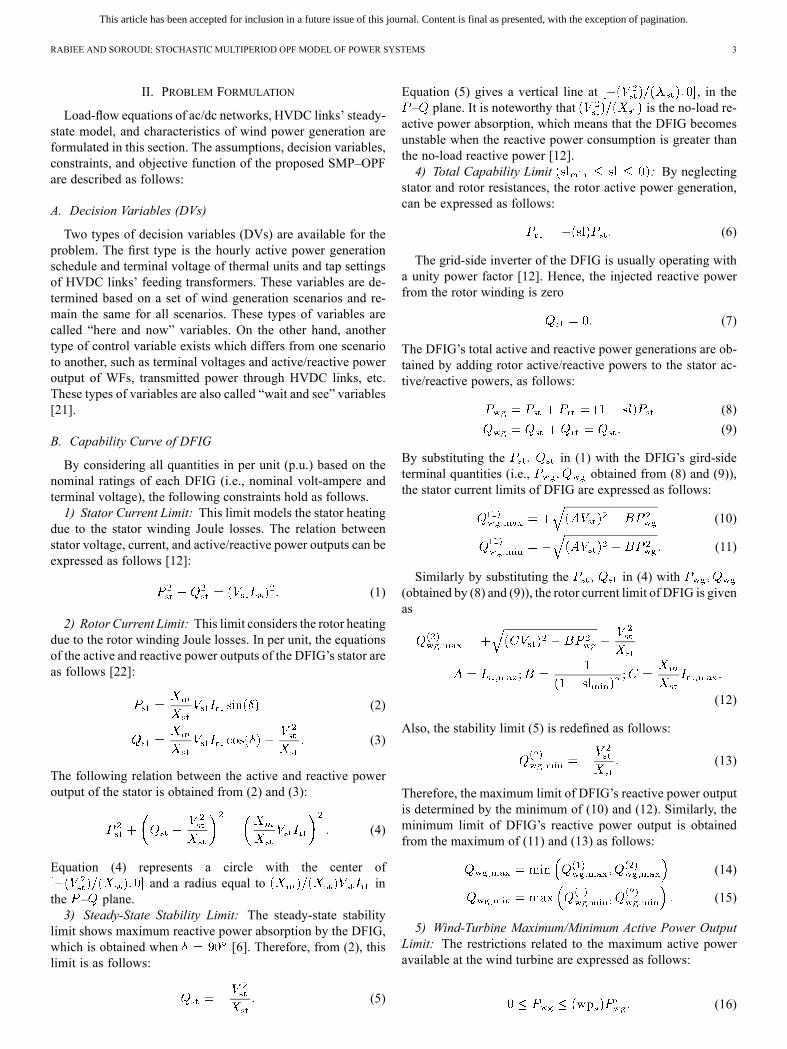
Fig. 5. Active power schedule of thermal generation units.
of loads, generating units, and transmission lines are given in[26]. It is worth noting that the load level given in [26] is 20%higher than the original value for this system, given in [27]. Thepurchased power from the pool market is injected to the net-work through the slack bus which is bus in this network.Also, the electricity price in scenario and time (i.e., )is assumed to be even during the operating horizon and equal toU.S.$8/MWh.In this study, two WFs are considered. Each WF consists of
500DFIG-basedwind turbines. The characteristics of each windturbine are given in Table II. In this paper, Rayleigh PDF isutilized to describe the probabilistic nature of wind speed. Thevalue of scale index for the PDF at the location of both WFsis 6.209 (see Appendix A). Using the technique described inAppendix A, 12 scenarios are determined for wind power gen-eration. These scenarios and their associated probabilities aregiven in Table III.It is observed from Table II that the total capacity of each WF
is 1000 MW, which is connected to the system via a 24-pulseLCC–HVDC link. The HVDC links are bipolar with the ratingof 1000 MW, and 250 kV. The data of these dc links are de-rived from [23], and are given in Table IV. As shown in Fig. 4,WF-1 and WF-2 are connected to buses and , respec-tively. It is noteworthy that these buses are selected arbitrarilyin this study. In practice, there may be several areas in a system,which are potentially suitable for establishing wind farms. Inthis case, one may use a proper algorithm to select the best lo-cation for installing wind farms [20]. For the sake of brevity,three load levels are considered for each dayas 90%, 100%, and 80% of the peak value. The duration of eachperiod is assumed to be 8 h. The value of peak demand is as-sumed to be 5090.4 MW. Also, it is assumed that the total loadof each period is distributed based on the initial load share ofeach bus, as given in [26]. The proposed algorithm is imple-mented in the general algebraic modeling system (GAMS) [28]environment and solved by the CONOPT solver [29].Optimal active power generation schedules of generation
buses for all intervals are given in Fig. 5. The given schedulesare such that the total cost imposed [i.e., (38)] for the operationof the system in the presence of uncertain wind power gen-eration is minimized. Thermal generating units are the mainsources of reactive power support in most power systems. Thereactive power output of a thermal generating unit strongly
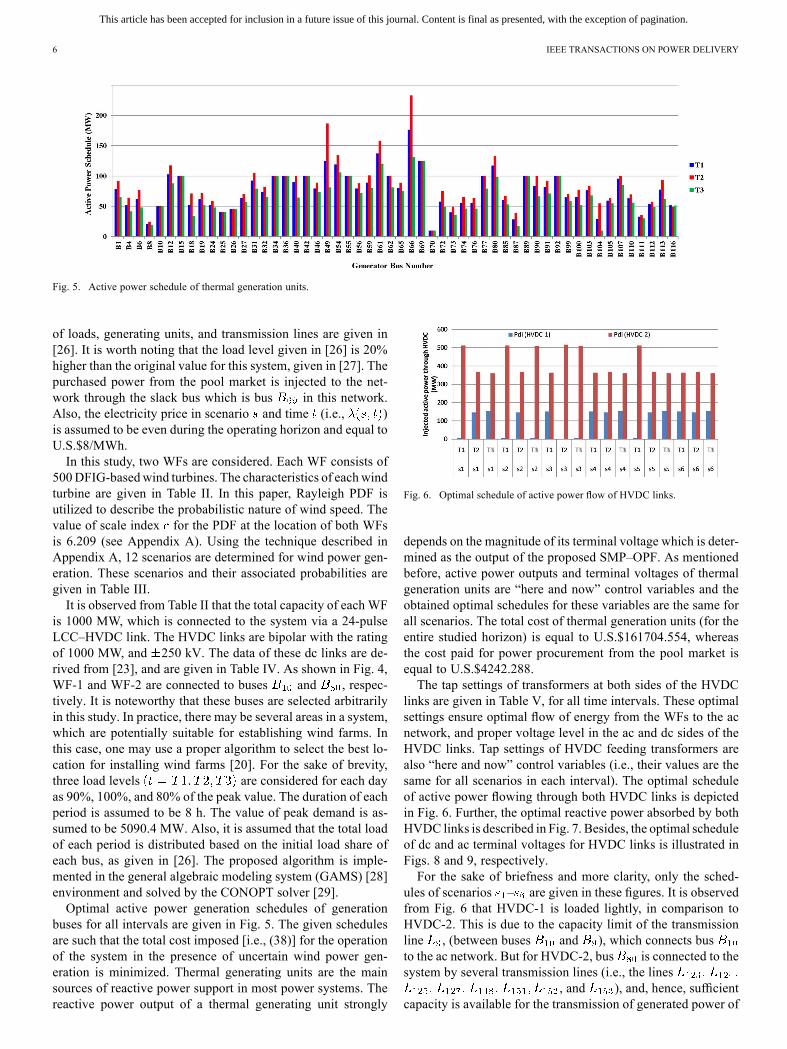
Fig. 6. Optimal schedule of active power flow of HVDC links.
depends on the magnitude of its terminal voltage which is deter-mined as the output of the proposed SMP–OPF. As mentionedbefore, active power outputs and terminal voltages of thermalgeneration units are “here and now” control variables and theobtained optimal schedules for these variables are the same forall scenarios. The total cost of thermal generation units (for theentire studied horizon) is equal to U.S.$161704.554, whereasthe cost paid for power procurement from the pool market isequal to U.S.$4242.288.The tap settings of transformers at both sides of the HVDC
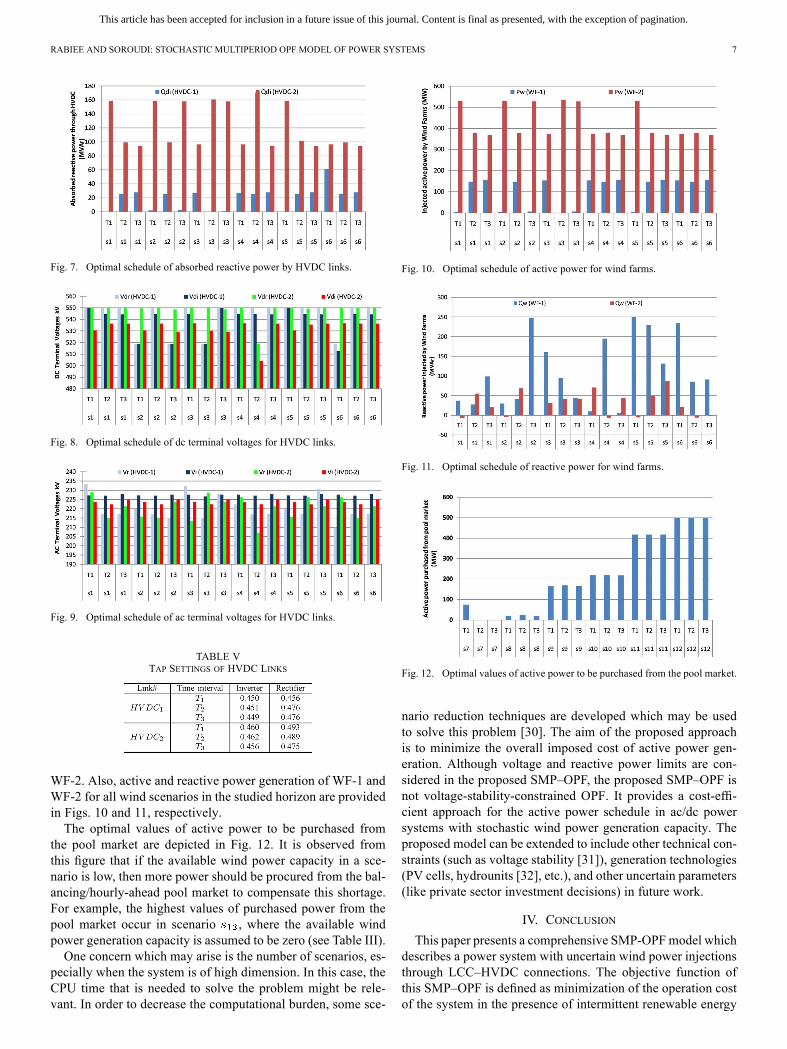
links are given in Table V, for all time intervals. These optimalsettings ensure optimal flow of energy from the WFs to the acnetwork, and proper voltage level in the ac and dc sides of theHVDC links. Tap settings of HVDC feeding transformers arealso “here and now” control variables (i.e., their values are thesame for all scenarios in each interval). The optimal scheduleof active power flowing through both HVDC links is depictedin Fig. 6. Further, the optimal reactive power absorbed by bothHVDC links is described in Fig. 7. Besides, the optimal scheduleof dc and ac terminal voltages for HVDC links is illustrated inFigs. 8 and 9, respectively.For the sake of briefness and more clarity, only the sched-
ules of scenarios – are given in these figures. It is observedfrom Fig. 6 that HVDC-1 is loaded lightly, in comparison toHVDC-2. This is due to the capacity limit of the transmissionline , (between buses and ), which connects busto the ac network. But for HVDC-2, bus is connected to thesystem by several transmission lines (i.e., the lines
, and ), and, hence, sufficientcapacity is available for the transmission of generated power of
This article has been accepted for inclusion in a future issue of this journal. Content is final as presented, with the exception of pagination.
RABIEE AND SOROUDI: STOCHASTIC MULTIPERIOD OPF MODEL OF POWER SYSTEMS 7
Fig. 7. Optimal schedule of absorbed reactive power by HVDC links.
Fig. 8. Optimal schedule of dc terminal voltages for HVDC links.
Fig. 9. Optimal schedule of ac terminal voltages for HVDC links.
TABLE VTAP SETTINGS OF HVDC LINKS
WF-2. Also, active and reactive power generation of WF-1 andWF-2 for all wind scenarios in the studied horizon are providedin Figs. 10 and 11, respectively.The optimal values of active power to be purchased from
the pool market are depicted in Fig. 12. It is observed fromthis figure that if the available wind power capacity in a sce-nario is low, then more power should be procured from the bal-ancing/hourly-ahead pool market to compensate this shortage.For example, the highest values of purchased power from thepool market occur in scenario , where the available windpower generation capacity is assumed to be zero (see Table III).One concern which may arise is the number of scenarios, es-
pecially when the system is of high dimension. In this case, theCPU time that is needed to solve the problem might be rele-vant. In order to decrease the computational burden, some sce-
Fig. 10. Optimal schedule of active power for wind farms.
Fig. 11. Optimal schedule of reactive power for wind farms.
Fig. 12. Optimal values of active power to be purchased from the pool market.
nario reduction techniques are developed which may be usedto solve this problem [30]. The aim of the proposed approachis to minimize the overall imposed cost of active power gen-eration. Although voltage and reactive power limits are con-sidered in the proposed SMP–OPF, the proposed SMP–OPF isnot voltage-stability-constrained OPF. It provides a cost-effi-cient approach for the active power schedule in ac/dc powersystems with stochastic wind power generation capacity. Theproposed model can be extended to include other technical con-straints (such as voltage stability [31]), generation technologies(PV cells, hydrounits [32], etc.), and other uncertain parameters(like private sector investment decisions) in future work.
IV. CONCLUSION
This paper presents a comprehensive SMP-OPFmodel whichdescribes a power system with uncertain wind power injectionsthrough LCC–HVDC connections. The objective function ofthis SMP–OPF is defined as minimization of the operation costof the system in the presence of intermittent renewable energy
This article has been accepted for inclusion in a future issue of this journal. Content is final as presented, with the exception of pagination.
8 IEEE TRANSACTIONS ON POWER DELIVERY
resources, such as wind farms (WFs). One of the aims consid-ered in the objective function is to minimize the expected cost ofpower procurement from the pool market, due to the wind powergeneration fluctuations. Also, the scenario-based approach isutilized to model the uncertainty of wind power generation. Oneof the features of the proposed SMP–OPF is scheduling both“here and now” and “wait and see” control variables for a givenoperation horizon.The proposed approach is implemented on the IEEE 118-bus
test system to demonstrate its applicability. Two offshore WFsare considered in the study, which are connected to the on-shore ac power network through LCC–HVDC links. It is ob-served from the numerical results that the availability of trans-mission network capacity at the interface of ac/dc networks isa key factor affecting the utilization of WF’s power generationability. Besides, in scenarios with lower available capacity ofwind power generation, the power procurement from the poolmarket is higher to keep the balance between hourly generationand demand.
APPENDIX AWIND GENERATION UNCERTAINTY MODELING [33]
It is assumed that if the PDF of wind speed is of Rayleightype and is available in the region under study, then
(39)
The probability of falling into scenario and the correspondingwind speed is calculated as follows:
(40)
(41)
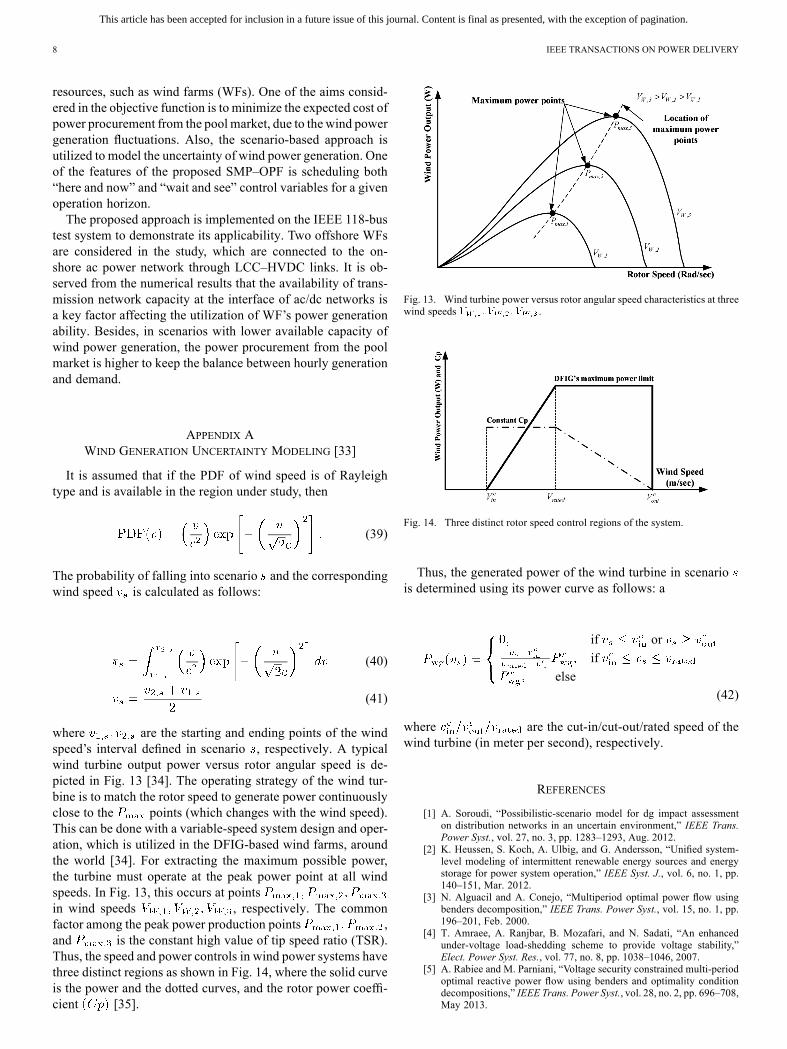
where are the starting and ending points of the windspeed’s interval defined in scenario , respectively. A typicalwind turbine output power versus rotor angular speed is de-picted in Fig. 13 [34]. The operating strategy of the wind tur-bine is to match the rotor speed to generate power continuouslyclose to the points (which changes with the wind speed).This can be done with a variable-speed system design and oper-ation, which is utilized in the DFIG-based wind farms, aroundthe world [34]. For extracting the maximum possible power,the turbine must operate at the peak power point at all windspeeds. In Fig. 13, this occurs at pointsin wind speeds , respectively. The commonfactor among the peak power production points ,and is the constant high value of tip speed ratio (TSR).Thus, the speed and power controls in wind power systems havethree distinct regions as shown in Fig. 14, where the solid curveis the power and the dotted curves, and the rotor power coeffi-cient [35].
Fig. 13. Wind turbine power versus rotor angular speed characteristics at threewind speeds .
Fig. 14. Three distinct rotor speed control regions of the system.
Thus, the generated power of the wind turbine in scenariois determined using its power curve as follows: a
if or
if
else
(42)
where are the cut-in/cut-out/rated speed of thewind turbine (in meter per second), respectively.
REFERENCES
[1] A. Soroudi, “Possibilistic-scenario model for dg impact assessmenton distribution networks in an uncertain environment,” IEEE Trans.Power Syst., vol. 27, no. 3, pp. 1283–1293, Aug. 2012.
[2] K. Heussen, S. Koch, A. Ulbig, and G. Andersson, “Unified system-level modeling of intermittent renewable energy sources and energystorage for power system operation,” IEEE Syst. J., vol. 6, no. 1, pp.140–151, Mar. 2012.
[3] N. Alguacil and A. Conejo, “Multiperiod optimal power flow usingbenders decomposition,” IEEE Trans. Power Syst., vol. 15, no. 1, pp.196–201, Feb. 2000.
[4] T. Amraee, A. Ranjbar, B. Mozafari, and N. Sadati, “An enhancedunder-voltage load-shedding scheme to provide voltage stability,”Elect. Power Syst. Res., vol. 77, no. 8, pp. 1038–1046, 2007.
[5] A. Rabiee and M. Parniani, “Voltage security constrained multi-periodoptimal reactive power flow using benders and optimality conditiondecompositions,” IEEE Trans. Power Syst., vol. 28, no. 2, pp. 696–708,May 2013.
This article has been accepted for inclusion in a future issue of this journal. Content is final as presented, with the exception of pagination.
RABIEE AND SOROUDI: STOCHASTIC MULTIPERIOD OPF MODEL OF POWER SYSTEMS 9
[6] M. Montilla-DJesus, D. Santos-Martin, S. Arnaltes, and E. Castron-uovo, “Optimal operation of offshore wind farms with line-commu-tated HVDC link connection,” IEEE Trans. Energy Convers., vol. 25,no. 2, pp. 504–513, Jun. 2010.
[7] J. Arrillaga, Y. Liu, and N. Watson, Flexible Power Transmission: TheHVDC Options. Hoboken, NJ: Wiley, 2007.
[8] B. Franken and G. Andersson, “Analysis of HVDC converters con-nected to weak ac systems,” IEEE Trans. Power Syst., vol. 5, no. 1, pp.235–242, Feb. 1990.
[9] L. Shi, C. Wang, L. Yao, Y. Ni, and M. Bazargan, “Optimal powerflow solution incorporating wind power,” IEEE Syst. J., vol. 6, no. 2,pp. 233–241, Jun. 2012.
[10] R. Jabr and B. Pal, “Intermittent wind generation in optimal power flowdispatching,” IET Gen., Transm. Distrib., vol. 3, no. 1, pp. 66–74, 2009.
[11] P. Yu and B. Venkatesh, “A practical real-time opf method usingnew triangular approximate model of wind electric generators,” IEEETrans. Power Syst., vol. 27, no. 4, pp. 2036–2046, Nov. 2012.
[12] M. Montilla-DJesus, D. Santos-Martin, S. Arnaltes, and E. Castron-uovo, “Optimal reactive power allocation in an offshore wind farmswith LCC-HVDC link connection,” Renew. Energy, vol. 40, no. 1, pp.157–166, 2012.
[13] A. Tapia, G. Tapia, and J. Ostolaza, “Reactive power control of windfarms for voltage control applications,” Renew. Energy, vol. 29, no. 3,pp. 377–392, 2004.
[14] R. Torres-Olguin, M. Molinas, and T. Undeland, “Offshore wind farmgrid integration by VSC technology with LCC-based HVDC transmis-sion,” IEEE Trans. Sustain. Energy, vol. 3, no. 4, pp. 899–907, Oct.2012.
[15] K. Eriksson, “Operational experience of HVDC light,” in Proc. 7th Int.Conf. AC-DC Power Transm., 2001, pp. 205–210.
[16] ABB, Tech. Rep., Feb. 2013. [Online]. Available: http://www.abb.com/abblibrary/DownloadCenter/?showresultstab=true&catego-ryid=9AAC30300394
[17] S. D. Wright, A. L. Rogers, J. F. Manwell, and A. Ellis, “Transmissionoptions for offshore wind farms in the United States,” in Proc. Amer.Wind Energy Assoc. Annu. Conf.–Transm. Options Offshore WindFarms United States, 2002, pp. 1–12.
[18] S. K. Chaudhary, R. Teodorescu, and P. Rodriguez, “Wind farm gridintegration using VSC based HVDC transmission—An overview,” inProc. IEEE Energy 2030 Conf., Nov. 2008, pp. 1–7.
[19] T. Amraee, A. Soroudi, and A. Ranjbar, “Probabilistic determinationof pilot points for zonal voltage control,” IET Gen., Transm. Distrib.,vol. 6, no. 1, pp. 1–10, 2012.
[20] Y. Atwa and E. El-Saadany, “Probabilistic approach for optimal allo-cation of wind-based distributed generation in distribution systems,”IET Renew. Power Gen., vol. 5, no. 1, pp. 79–88, Jan. 2011.
[21] X. Liu, “Economic load dispatch constrained by wind power avail-ability: A wait-and-see approach,” IEEE Trans. Smart Grid, vol. 1, no.3, pp. 347–355, Jul. 2010.
[22] D. Santos-Martin, S. Arnaltes, and J. R. Amenedo, “Reactive powercapability of doubly fed asynchronous generators,” Elect. Power Syst.Res., vol. 78, no. 11, pp. 1837–1840, 2008.
[23] P. Kundur, Power System Stability and Control. New York: Mc-Graw-Hill, 1994.
[24] B. Mohammadi-Ivatloo, A. Rabiee, and M. Ehsan, “Time-varyingacceleration coefficients ipso for solving dynamic economic dispatchwith non-smooth cost function,” Energy Convers. Manage., vol. 56,pp. 175–183, 2012.
[25] T. Amraee, A. Ranjbar, R. Feuillet, and B. Mozafari, “System protec-tion scheme for mitigation of cascaded voltage collapses,” IET Gen.,Transm. Distrib., vol. 3, no. 3, pp. 242–256, 2009.
[26] Mar. 19, 2013. Alireza soroudi, Iran. [Online]. Available:https://sites.google.com/site/alirezasoroudi/IEEE118Bus.xlsx
[27] R. Zimmerman, C. Murillo-Sánchez, and R. Thomas, “Matpower:Steady-state operations, planning, and analysis tools for power sys-tems research and education,” IEEE Trans. Power Syst., vol. 26, no. 1,pp. 12–19, Feb. 2011.
[28] A. Brook, D. Kendrick, and A. Meeraus, “Gams, a user’s guide,” ACMSIGNUM Newslett., vol. 23, no. 3–4, pp. 10–11, 1988.
[29] A. Drud, “Conopt: A large-scale grg code,” ORSA J. Comput., vol. 6,no. 2, pp. 207–216, 1994.
[30] J. M. Morales, S. Pineda, A. J. Conejo, and M. Carrion, “Scenario re-duction for futures market trading in electricity markets,” IEEE Trans.Power Syst., vol. 24, no. 2, pp. 878–888, May 2009.
[31] D. L. H. Aik and G. Andersson, “Power stability analysis of multi-infeed HVDC systems,” IEEE Trans. Power Del., vol. 13, no. 3, pp.923–931, Jul. 1998.
[32] G. Andersson, R. Atmuri, R. Rosenqvist, and S. Torseng, “Influence ofhydro units’ generator-to-turbine inertia ratio on damping of subsyn-chronous oscillations,” IEEE Trans. Power App. Syst., vol. PAS-103,no. 8, pp. 2352–2361, Aug. 1984.
[33] A. Soroudi and M. Afrasiab, “Binary pso-based dynamic multi-objec-tive model for distributed generation planning under uncertainty,” IETRenew. Power Gen., , vol. 6, no. 2, pp. 67–78, Mar. 2012.
[34] M. R. Patel, Wind and Solar Power Systems: Design, Analysis, andOperation. Boca Raton, FL: CRC, 2005.
[35] M. Stiebler, Wind Energy Systems for Electric Power Generation.New York: Springer, 2008.
Abbas Rabiee received the B.Sc. degree in electrical engineering from IranUniversity of Science and Technology (IUST), Tehran, in 2006, and the M.Sc.and Ph.D. degrees in electrical power engineering from Sharif University ofTechnology (SUT), Tehran, Iran, in 2008 and 2013, respectively.Currently, he is with the Department of Electrical Engineering, Faculty of
Engineering, University of Zanjan, Zanjan. Iran. His research interests includepower system operation and security, and the application of optimization tech-niques in power system operation.
Alireza Soroudi received the B.Sc. and M.Sc. degrees in electrical engineeringfrom Sharif University of Technology, Tehran, Iran, in 2002 and 2003, respec-tively, and the Ph.D. degree in electrical engineering from Sharif Universityof Technology and the Grenoble Institute of Technology (Grenoble-INP),Grenoble, France, in 2011.Currently, he is with the Faculty of New Sciences and Technologies, Uni-
versity of Tehran, Tehran. His research interests are smart grids, power systemplanning, as well as uncertainty modeling and optimization methods.