Embed Size (px)
Citation preview
IFDC
Making Fertilizer Markets Work for Smallholders
Presented by Sarah Gavian
International Fertilizer Development Center
At the AIARD 48th Annual Conference and 2012 Future Leaders Forum on Priorities for Inclusive Agriculture and Rural Development
June 3, 2012
Overview
Overview of the fertilizer situation (in Africa)
Segmenting the “smallholder” concept.Approaches to improving fertilizer
markets for all.
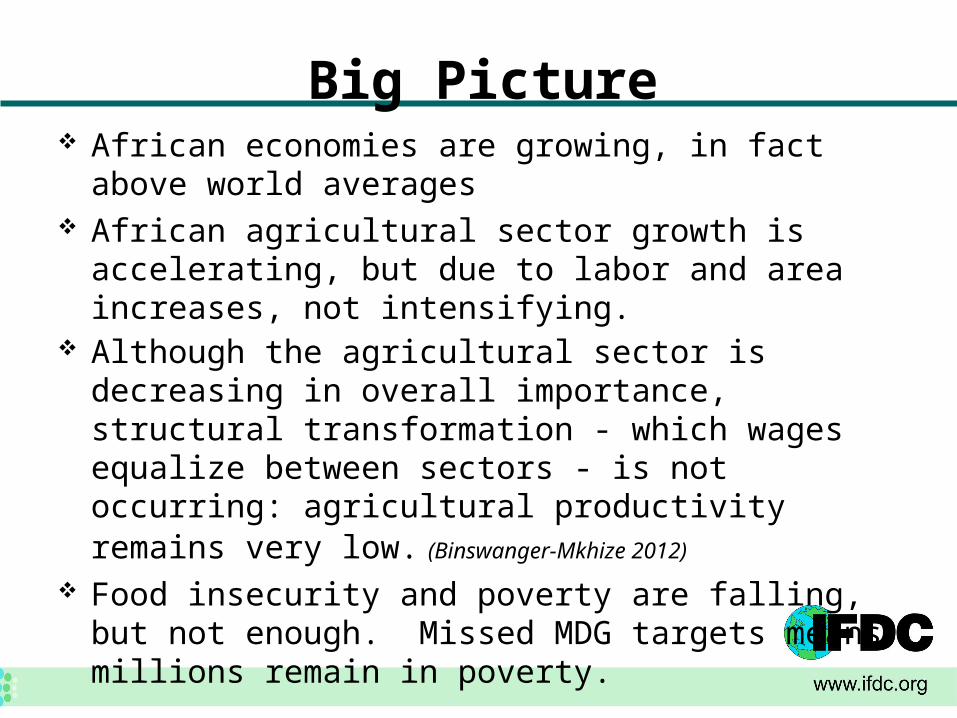
Big Picture African economies are growing, in fact above world
averages African agricultural sector growth is accelerating, but
due to labor and area increases, not intensifying. Although the agricultural sector is decreasing in
overall importance, structural transformation - which wages equalize between sectors - is not occurring: agricultural productivity remains very low. (Binswanger-Mkhize 2012)
Food insecurity and poverty are falling, but not enough. Missed MDG targets means millions remain in poverty.
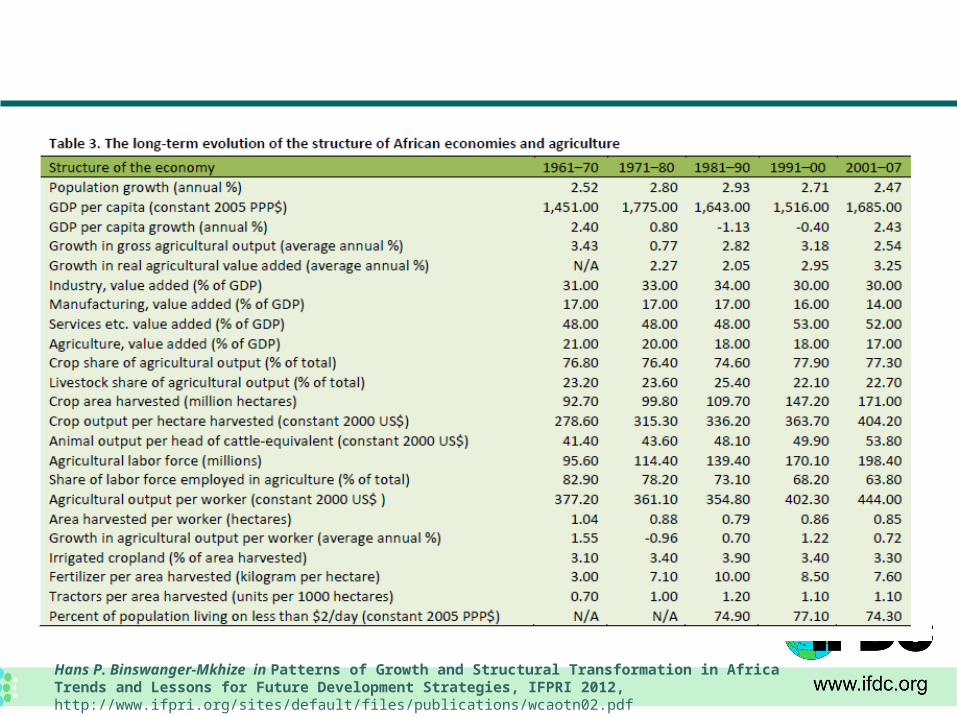
Hans P. Binswanger-Mkhize in Patterns of Growth and Structural Transformation in Africa Trends and Lessons for Future Development Strategies, IFPRI 2012, http://www.ifpri.org/sites/default/files/publications/wcaotn02.pdf
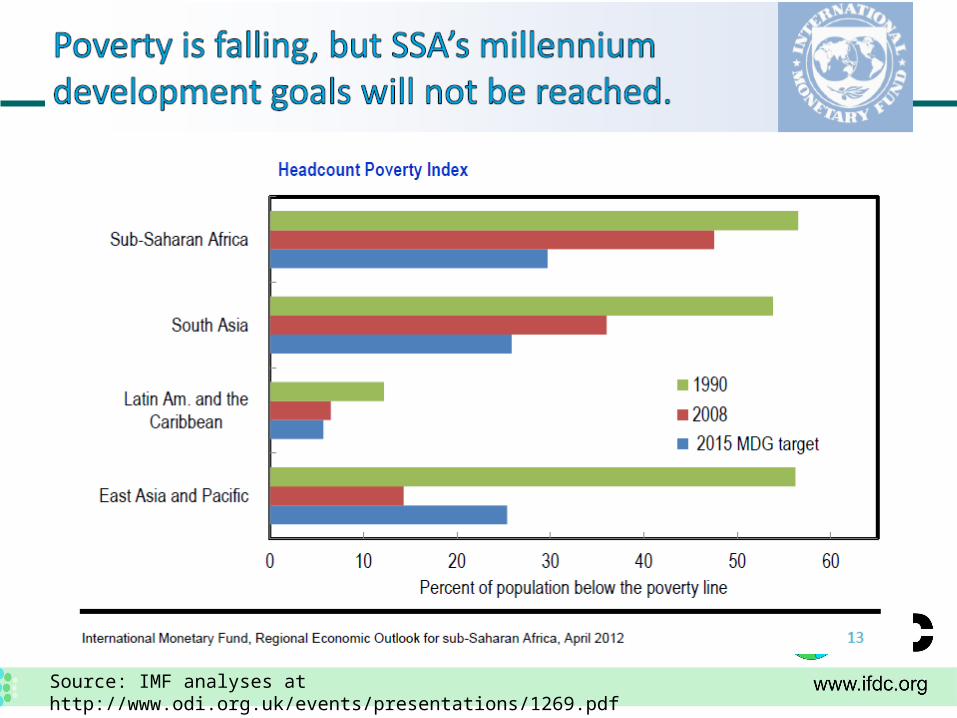
Source: IMF analyses at http://www.odi.org.uk/events/presentations/1269.pdf
But structural transformation appears stalled
What’s thwarting the virtual cycle between economic growth and poverty reduction? Nature of growth: the fastest growing African
economies are the resource rich economies (minerals, petro chemicals).
With the agricultural sector, there is a failure to increase productivity for most smallholders.
Amongst other issues, fertilizer use in Africa is low and overall stagnant
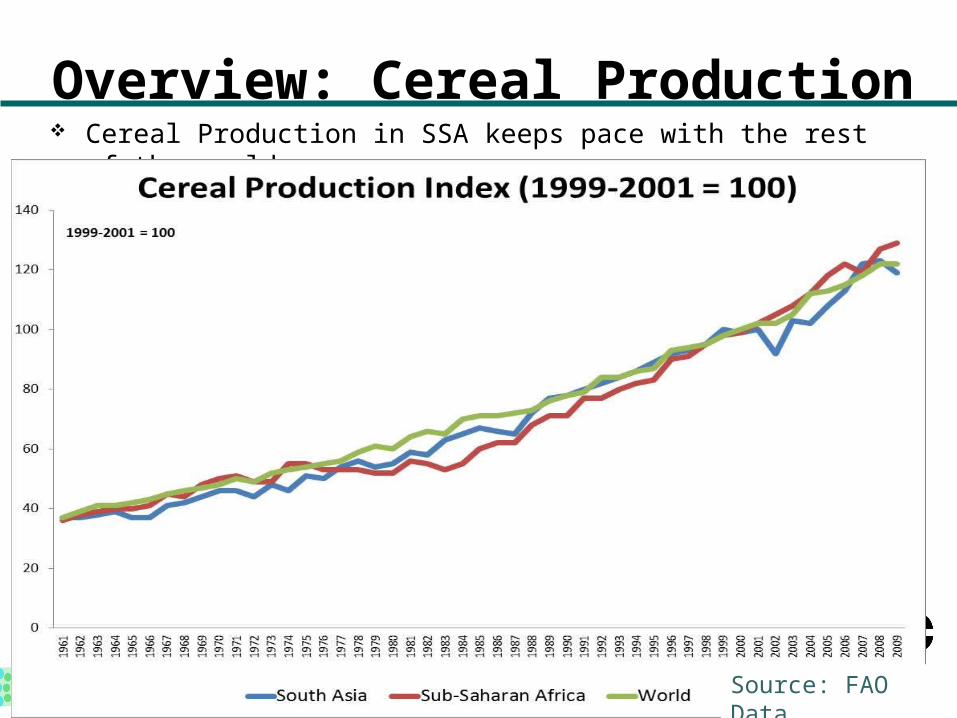
Overview: Cereal Production Cereal Production in SSA keeps pace with the rest of the world.
Source: FAO Data
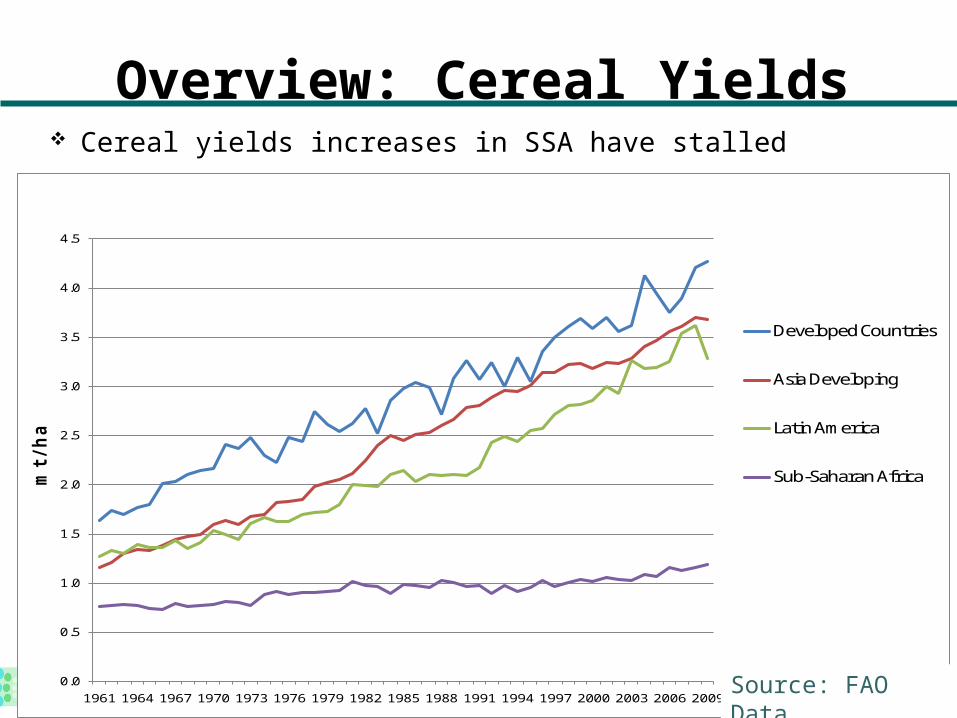
Overview: Cereal Yields
0.0
0.5
1.0
1.5
2.0
2.5
3.0
3.5
4.0
4.5
1961 1964 1967 1970 1973 1976 1979 1982 1985 1988 1991 1994 1997 2000 2003 2006 2009
mt / h
a
Developed Countries
Asia Developing
Latin America
Sub-Saharan Africa
Cereal yields increases in SSA have stalled
Source: FAO Data
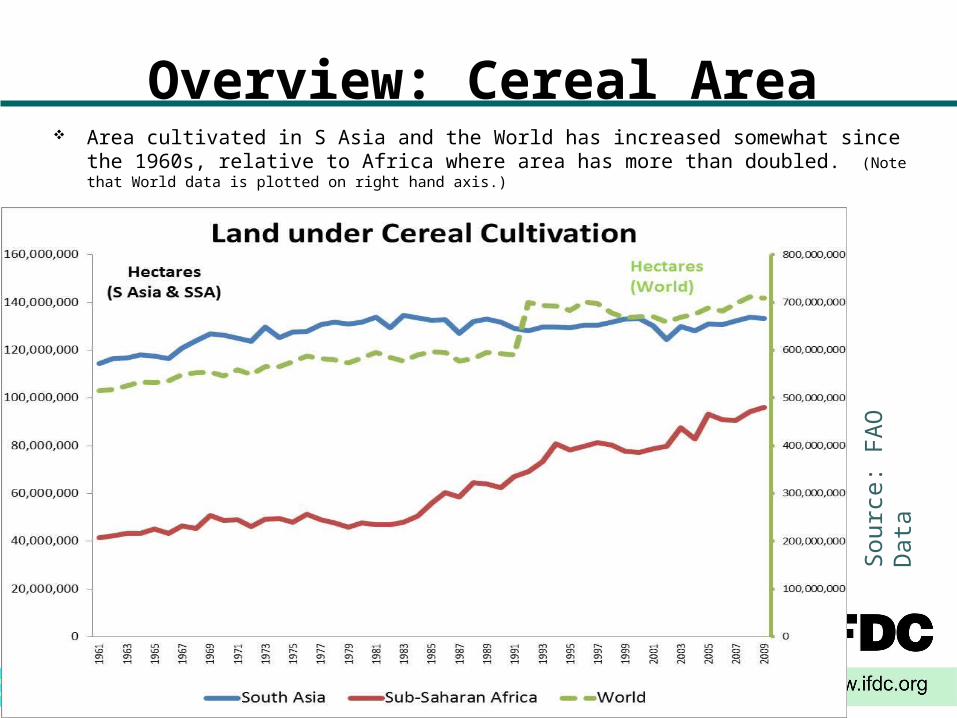
Overview: Cereal Area Area cultivated in S Asia and the World has increased somewhat since the 1960s,
relative to Africa where area has more than doubled. (Note that World data is plotted on right hand axis.)
Sou
rce:
FA
O D
ata
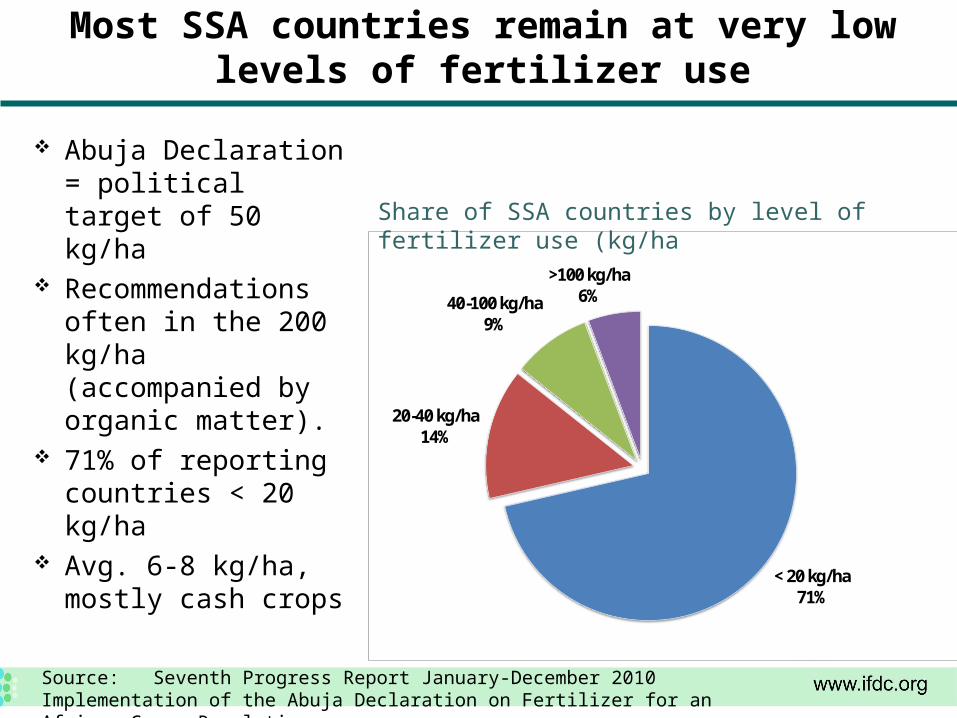
Most SSA countries remain at very low levels of fertilizer use
Abuja Declaration = political target of 50 kg/ha
Recommendations often in the 200 kg/ha (accompanied by organic matter).
71% of reporting countries < 20 kg/ha
Avg. 6-8 kg/ha, mostly cash crops
Source: Seventh Progress Report January-December 2010 Implementation of the Abuja Declaration on Fertilizer for an African Green Revolution
< 20 kg/ha71%
20-40 kg/ha14%
40-100 kg/ha9%
>100 kg/ha6%
Share of SSA countries by level of fertilizer use (kg/ha
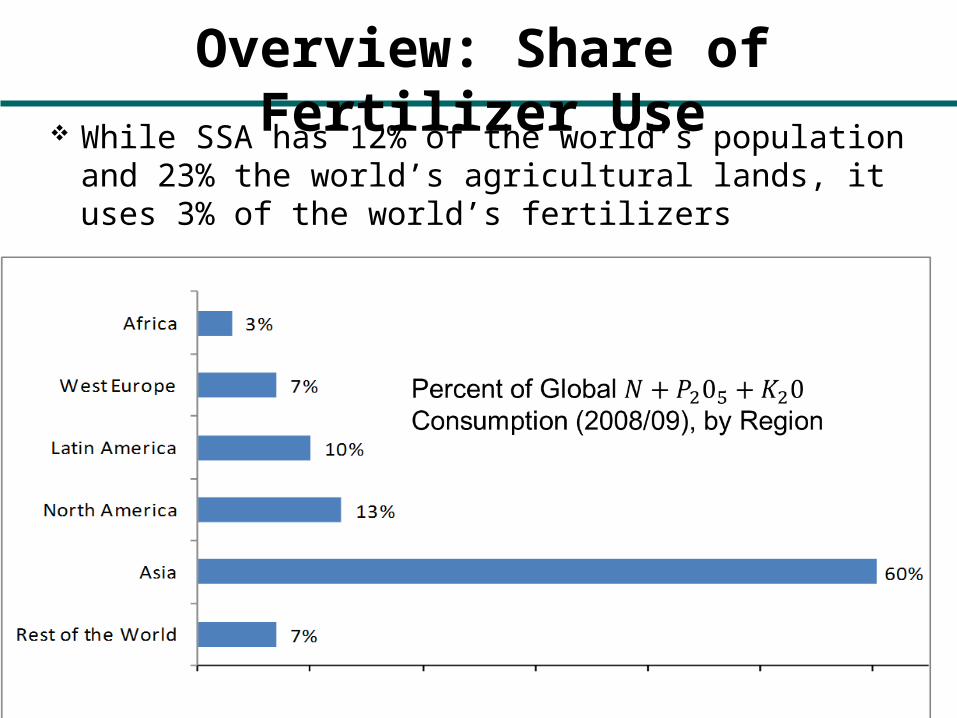
Overview: Share of Fertilizer Use While SSA has 12% of the world’s population and
23% the world’s agricultural lands, it uses 3% of the world’s fertilizers
Aspects of smallholder diversity
that influence the virtual cycle between economic growth and
poverty reduction:
farm size & gender
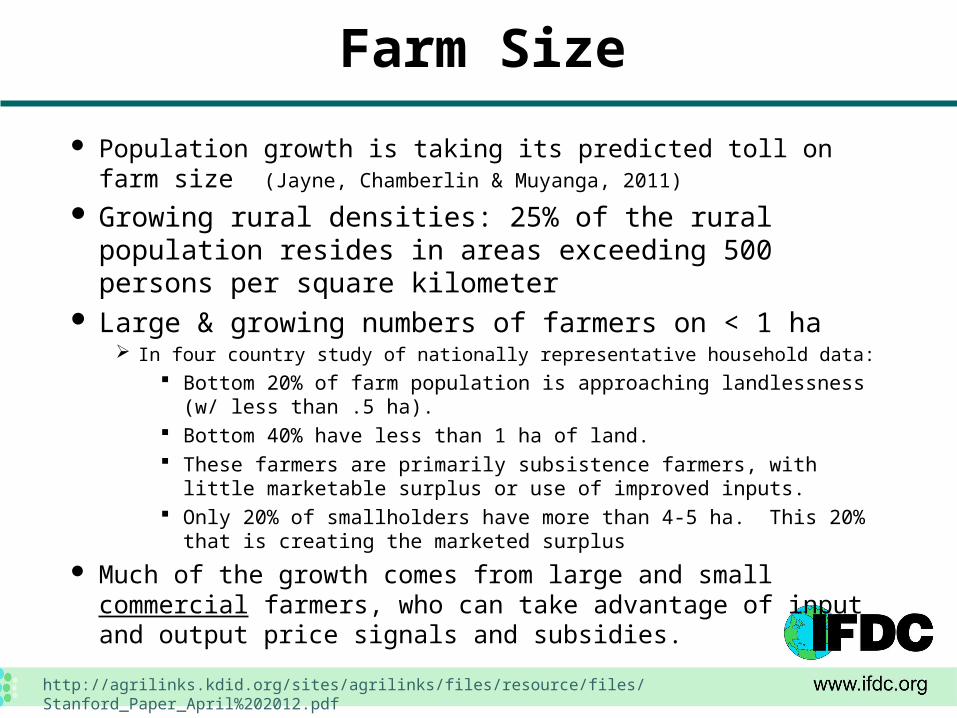
Farm Size
Population growth is taking its predicted toll on farm size (Jayne, Chamberlin & Muyanga, 2011)
Growing rural densities: 25% of the rural population resides in areas exceeding 500 persons per square kilometer
Large & growing numbers of farmers on < 1 ha In four country study of nationally representative household data:
Bottom 20% of farm population is approaching landlessness (w/ less than .5 ha).
Bottom 40% have less than 1 ha of land. These farmers are primarily subsistence farmers, with little marketable
surplus or use of improved inputs. Only 20% of smallholders have more than 4-5 ha. This 20% that is
creating the marketed surplus
Much of the growth comes from large and small commercial farmers, who can take advantage of input and output price signals and subsidies.
http://agrilinks.kdid.org/sites/agrilinks/files/resource/files/Stanford_Paper_April%202012.pdf

Farmers with land can commercialize, reaping higher farm incomes
(Jayne, Chamberlin & Muyanga, 2011)
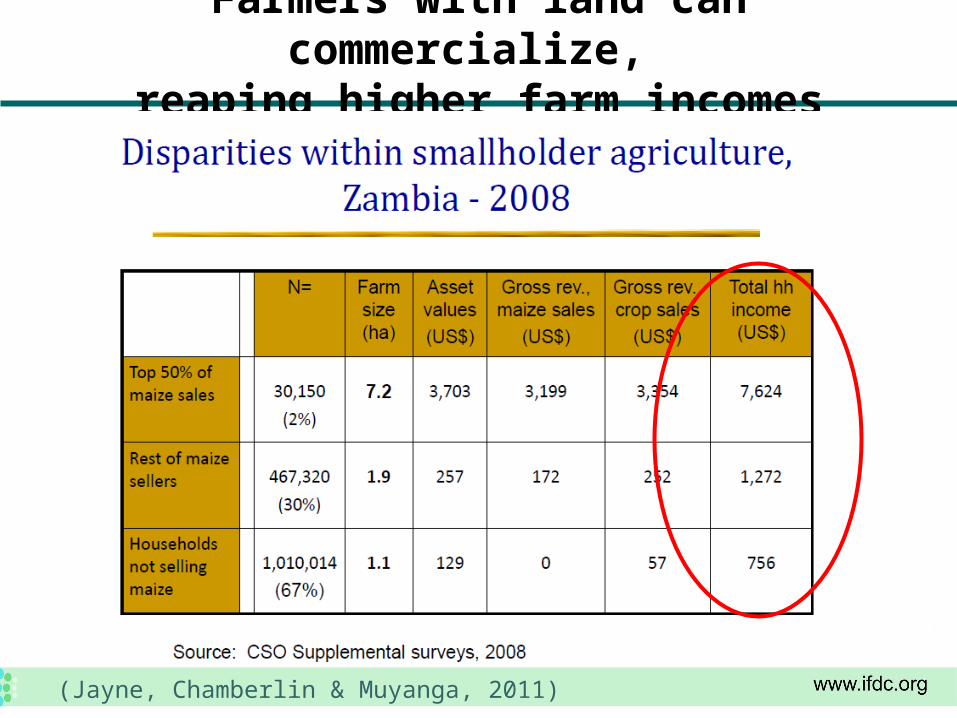
Farmers with land can commercialize, reaping higher farm incomes
(Jayne, Chamberlin & Muyanga, 2011)
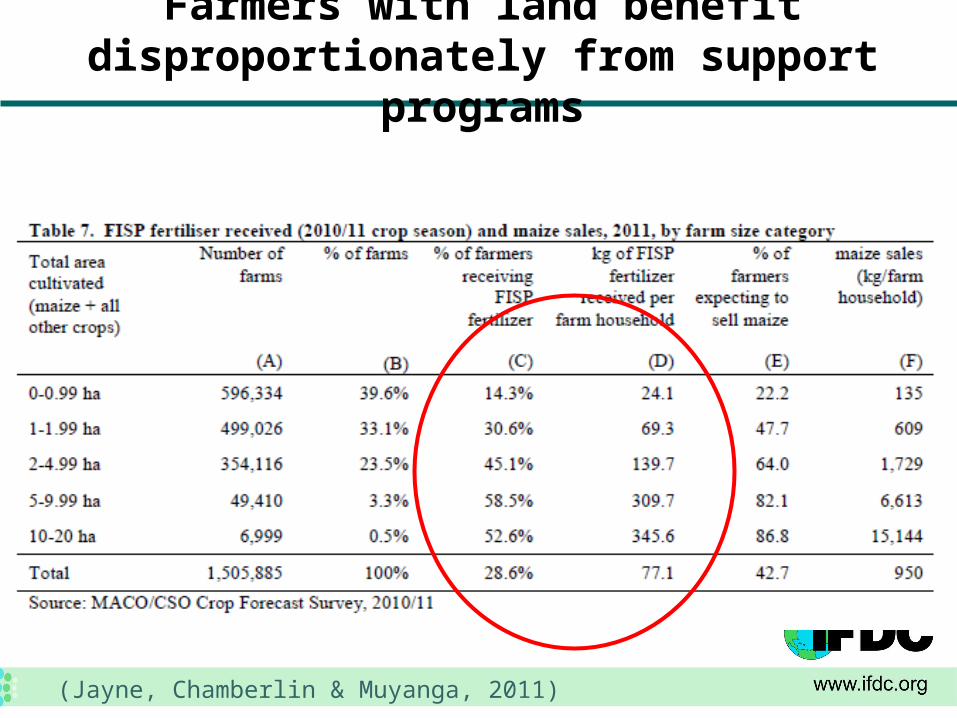
Farmers with land benefit disproportionately from support programs
(Jayne, Chamberlin & Muyanga, 2011)
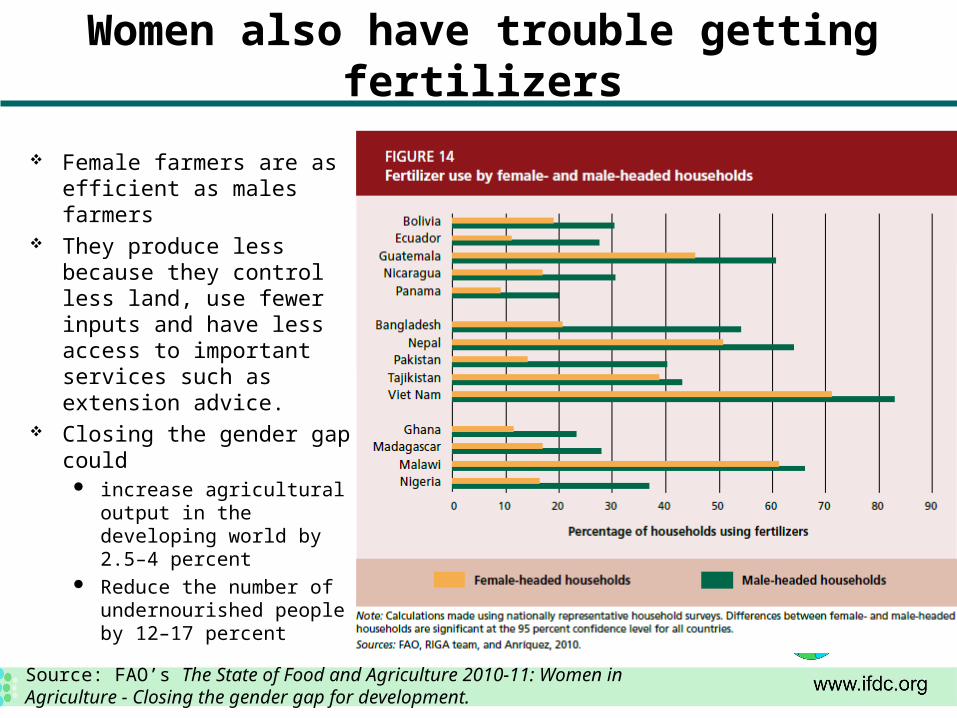
Women also have trouble getting fertilizers
Female farmers are as efficient as males farmers
They produce less because they control less land, use fewer inputs and have less access to important services such as extension advice.
Closing the gender gap could
increase agricultural output in the developing world by 2.5–4 percent
Reduce the number of undernourished people by 12–17 percent
Source: FAO’s The State of Food and Agriculture 2010-11: Women in Agriculture - Closing the gender gap for development.
Implications
We need to rethink inputs interventions to ensure that a far greater share of smallholders can engage in growth processes.
Approach: address constraints along the two interlinked value chains that influence farmer access, availability and utilization of fertilizers
Approaches to improving fertilizer markets for all
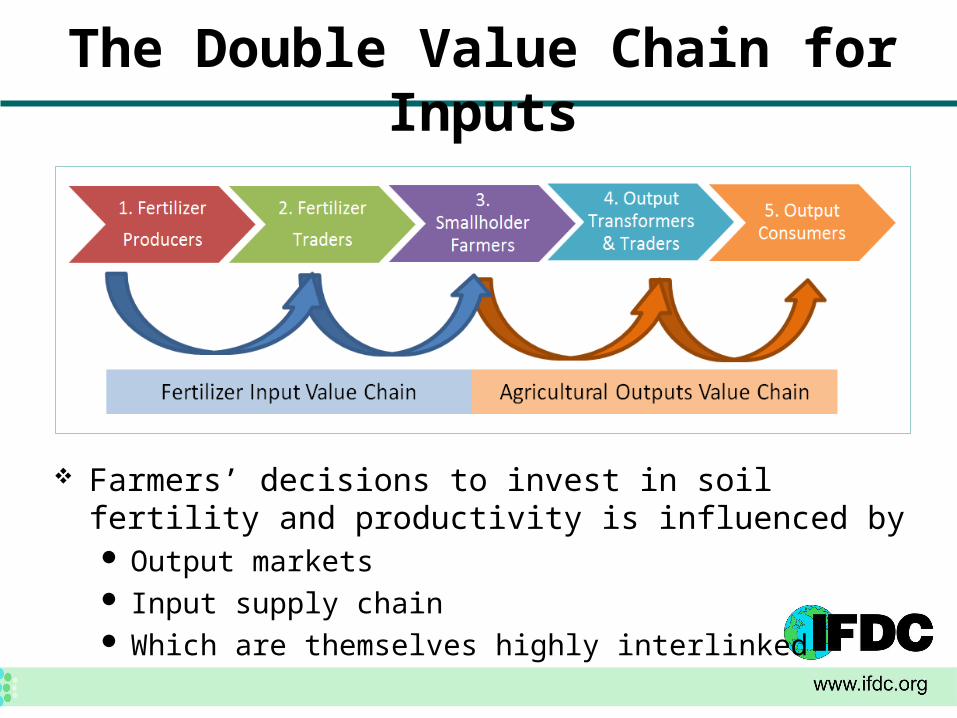
The Double Value Chain for Inputs
Farmers’ decisions to invest in soil fertility and productivity is influenced by Output markets Input supply chain Which are themselves highly interlinked
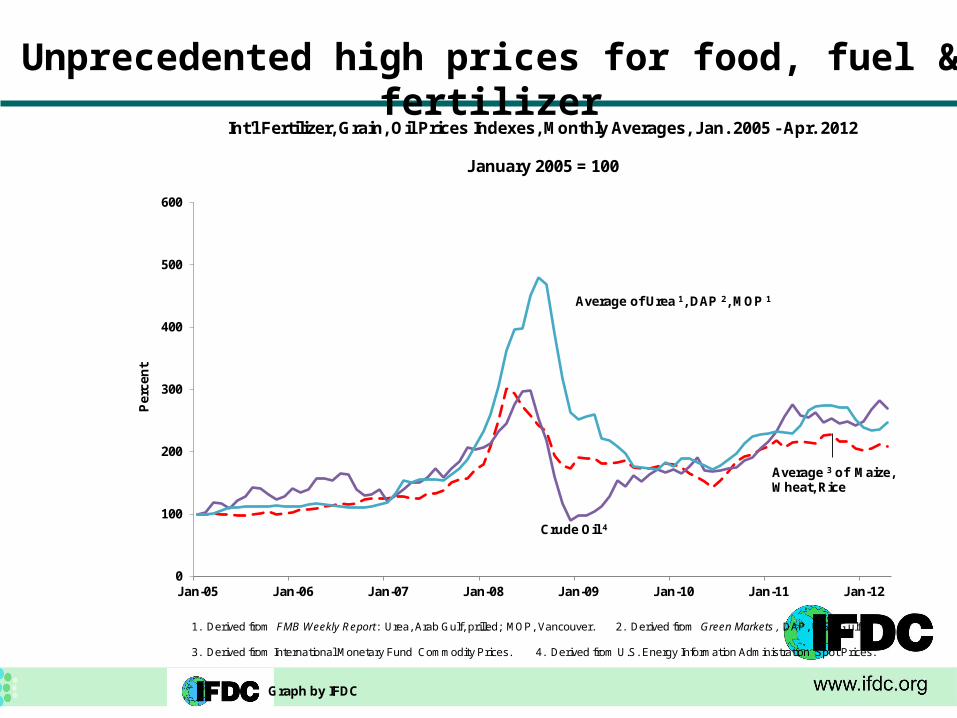
Unprecedented high prices for food, fuel & fertilizer
0
100
200
300
400
500
600
Jan-05 Jan-06 Jan-07 Jan-08 Jan-09 Jan-10 Jan-11 Jan-12
Per
cen
tInt'l Fertilizer, Grain, Oil Prices Indexes, Monthly Averages, Jan. 2005 - Apr. 2012
January 2005 = 100
Average of Urea 1, DAP 2, MOP 1
Crude Oil 4
Average 3 of Maize,Wheat, Rice
1. Derived from FMB Weekly Report: Urea, Arab Gulf, prilled; MOP, Vancouver. 2. Derived from Green Markets , DAP, U.S. Gulf.
3. Derived from International Monetary Fund Commodity Prices. 4. Derived from U.S. Energy Information Administration Spot Prices.
Graph by IFDC
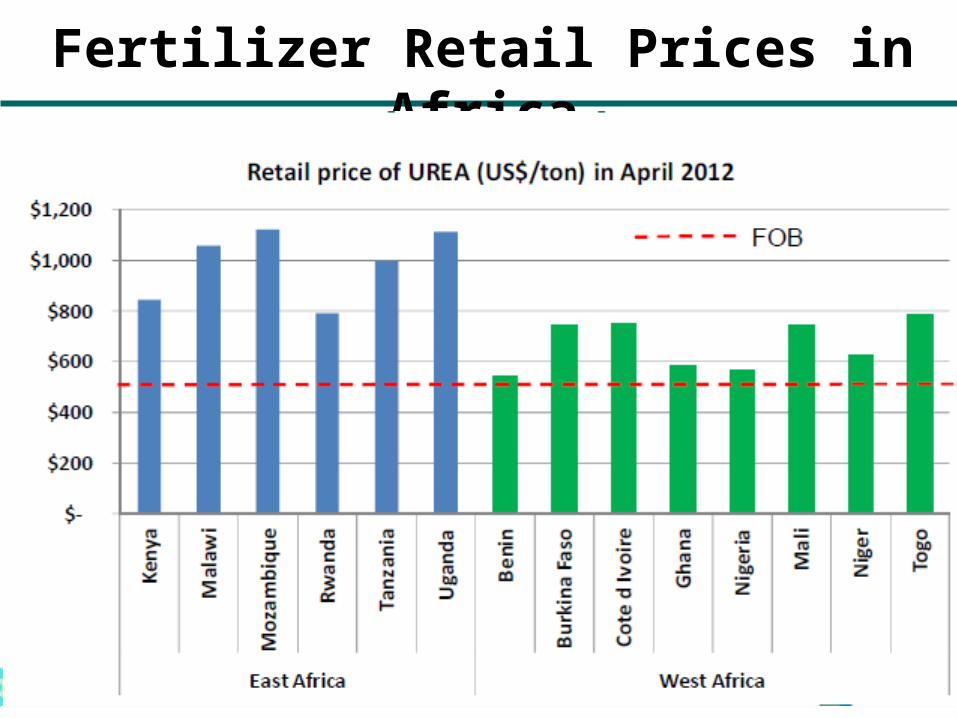
Fertilizer Retail Prices in Africa
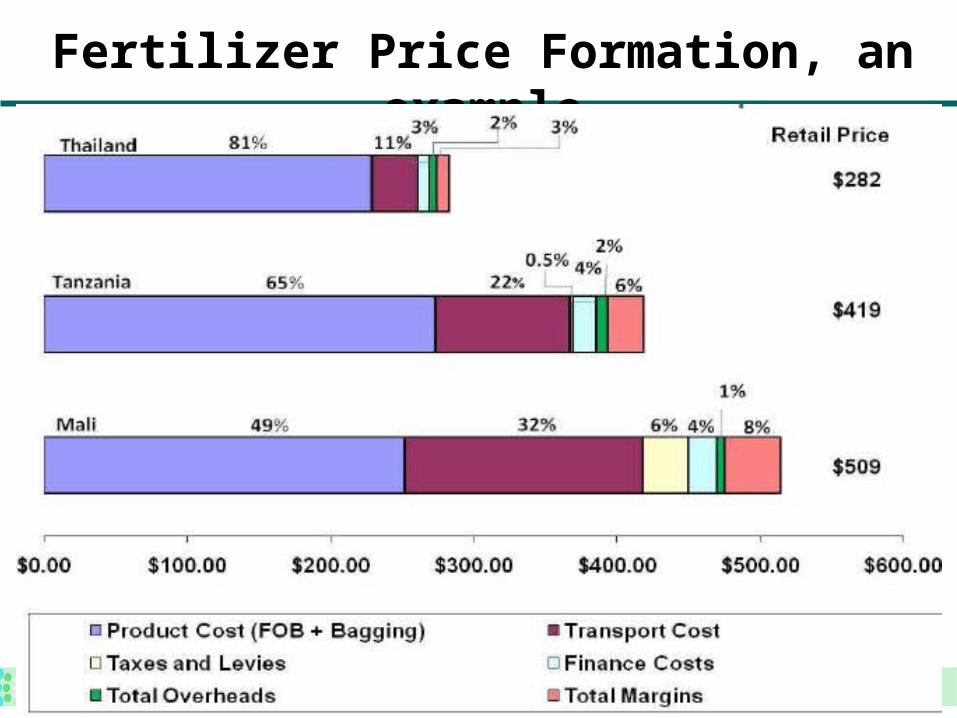
Fertilizer Price Formation, an example
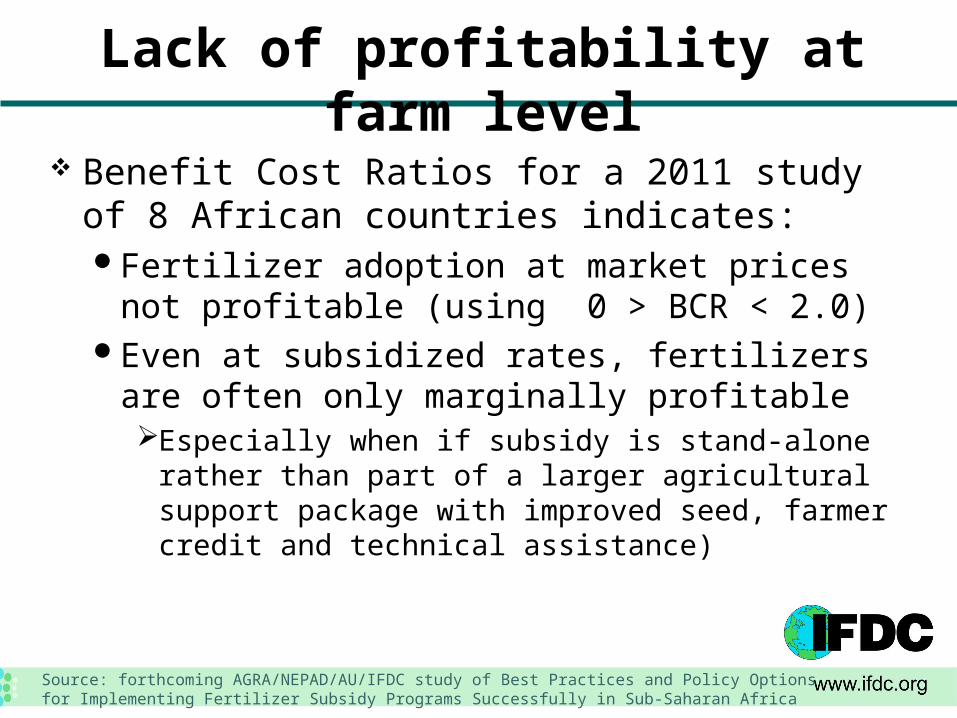
Lack of profitability at farm level
Benefit Cost Ratios for a 2011 study of 8 African countries indicates:Fertilizer adoption at market prices not profitable
(using 0 > BCR < 2.0)Even at subsidized rates, fertilizers are often only
marginally profitableEspecially when if subsidy is stand-alone rather than
part of a larger agricultural support package with improved seed, farmer credit and technical assistance)
Source: forthcoming AGRA/NEPAD/AU/IFDC study of Best Practices and Policy Options for Implementing Fertilizer Subsidy Programs Successfully in Sub-Saharan Africa
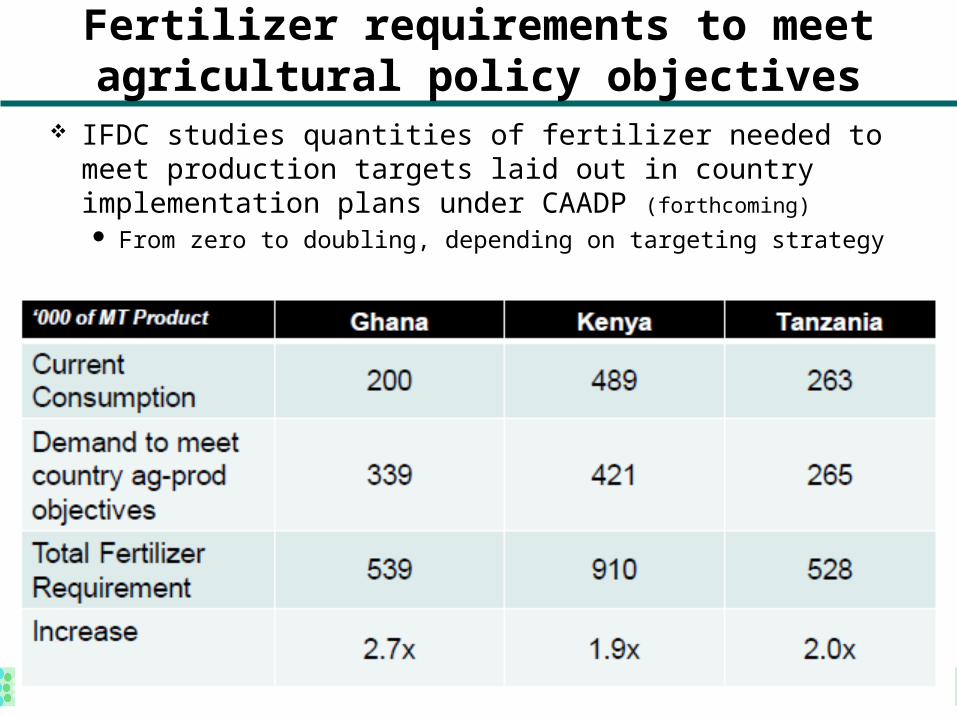
Fertilizer requirements to meet agricultural policy objectives
IFDC studies quantities of fertilizer needed to meet production targets laid out in country implementation plans under CAADP (forthcoming)
From zero to doubling, depending on targeting strategy
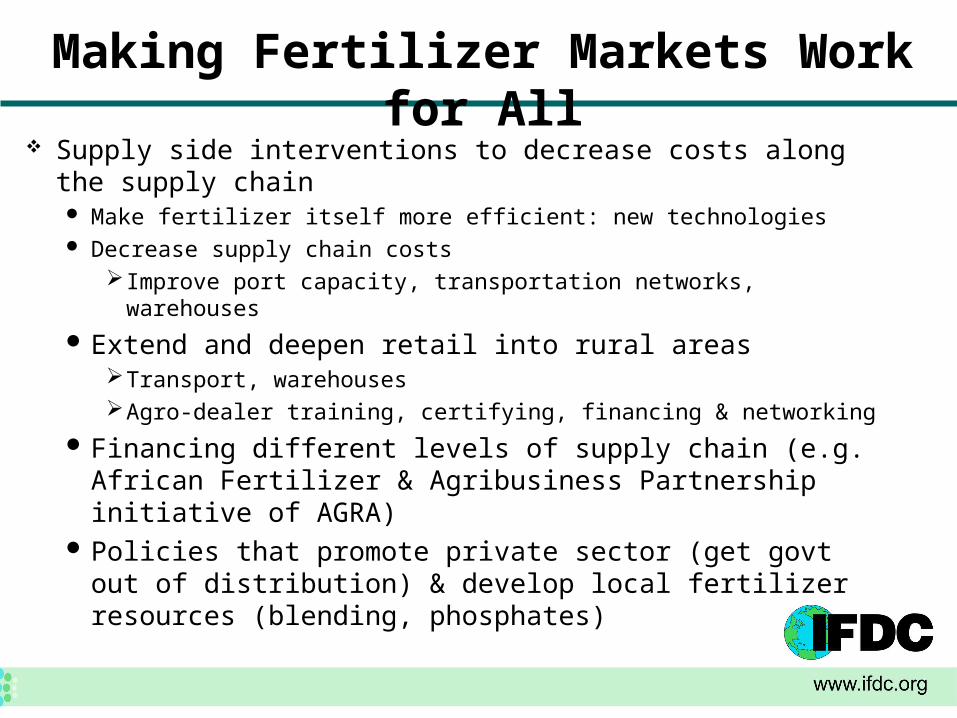
Making Fertilizer Markets Work for All Supply side interventions to decrease costs along the
supply chain Make fertilizer itself more efficient: new technologies Decrease supply chain costs
Improve port capacity, transportation networks, warehouses
Extend and deepen retail into rural areasTransport, warehousesAgro-dealer training, certifying, financing & networking
Financing different levels of supply chain (e.g. African Fertilizer & Agribusiness Partnership initiative of AGRA)
Policies that promote private sector (get govt out of distribution) & develop local fertilizer resources (blending, phosphates)
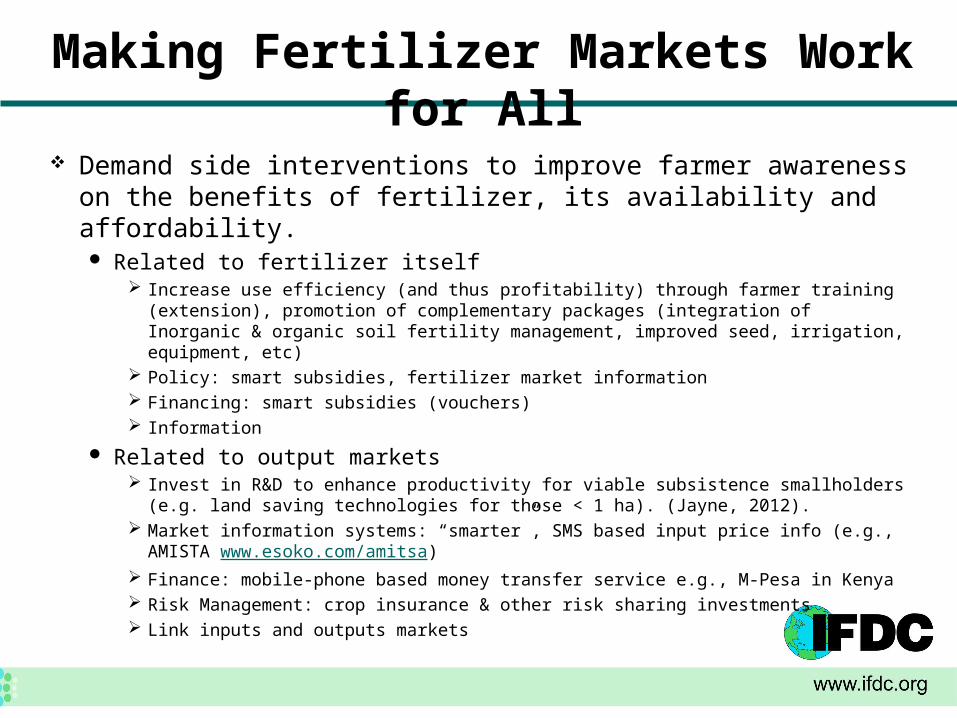
Making Fertilizer Markets Work for All
Demand side interventions to improve farmer awareness on the benefits of fertilizer, its availability and affordability. Related to fertilizer itself
Increase use efficiency (and thus profitability) through farmer training (extension), promotion of complementary packages (integration of Inorganic & organic soil fertility management, improved seed, irrigation, equipment, etc)
Policy: smart subsidies, fertilizer market information Financing: smart subsidies (vouchers) Information
Related to output markets Invest in R&D to enhance productivity for viable subsistence smallholders (e.g.
land saving technologies for those < 1 ha). (Jayne, 2012). Market information systems: “smarter”, SMS based input price info (e.g.,
AMISTA www.esoko.com/amitsa) Finance: mobile-phone based money transfer service e.g., M-Pesa in Kenya Risk Management: crop insurance & other risk sharing investments Link inputs and outputs markets
Fertilizer Subsidies, smart & otherwise
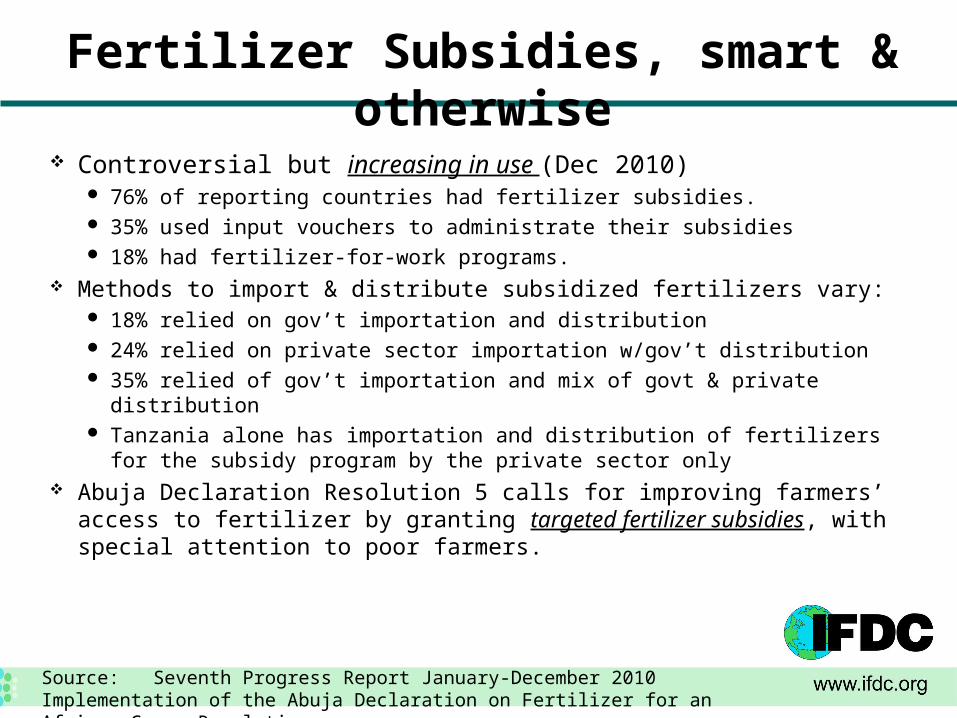
Controversial but increasing in use (Dec 2010) 76% of reporting countries had fertilizer subsidies. 35% used input vouchers to administrate their subsidies 18% had fertilizer-for-work programs.
Methods to import & distribute subsidized fertilizers vary: 18% relied on gov’t importation and distribution 24% relied on private sector importation w/gov’t distribution 35% relied of gov’t importation and mix of govt & private distribution Tanzania alone has importation and distribution of fertilizers for the subsidy
program by the private sector only Abuja Declaration Resolution 5 calls for improving farmers’ access to
fertilizer by granting targeted fertilizer subsidies, with special attention to poor farmers.
Source: Seventh Progress Report January-December 2010 Implementation of the Abuja Declaration on Fertilizer for an African Green Revolution
Fertilizer Subsidies, smart & otherwise
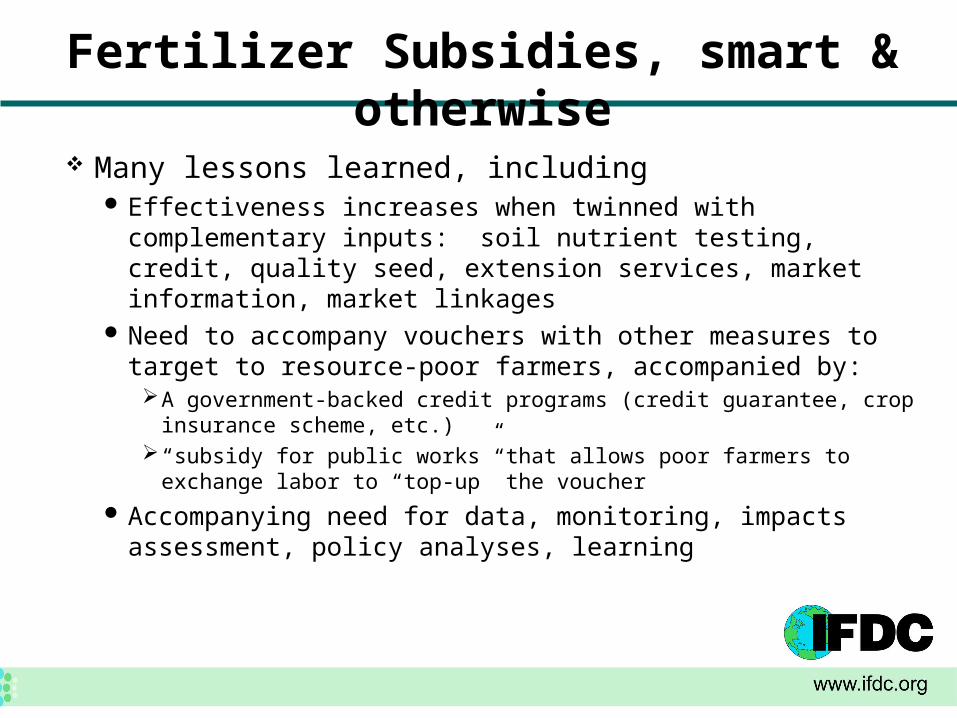
Many lessons learned, including Effectiveness increases when twinned with complementary
inputs: soil nutrient testing, credit, quality seed, extension services, market information, market linkages
Need to accompany vouchers with other measures to target to resource-poor farmers, accompanied by:A government-backed credit programs (credit guarantee, crop
insurance scheme, etc.) “subsidy for public works” that allows poor farmers to exchange labor
to “top-up” the voucher
Accompanying need for data, monitoring, impacts assessment, policy analyses, learning
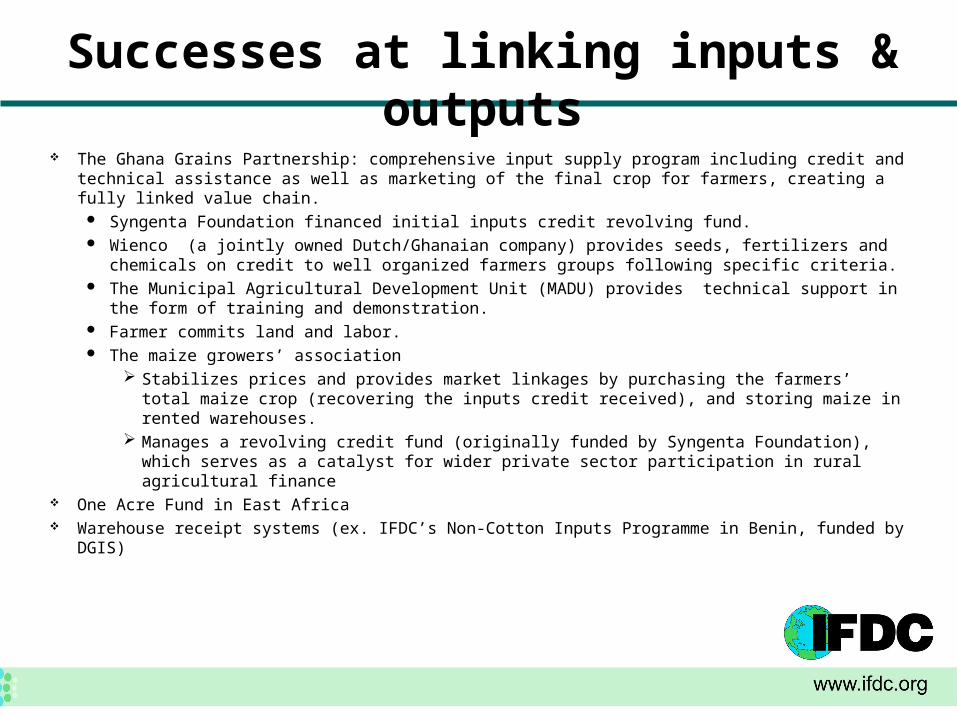
Successes at linking inputs & outputs The Ghana Grains Partnership: comprehensive input supply program including credit and
technical assistance as well as marketing of the final crop for farmers, creating a fully linked value chain.
Syngenta Foundation financed initial inputs credit revolving fund. Wienco (a jointly owned Dutch/Ghanaian company) provides seeds, fertilizers and
chemicals on credit to well organized farmers groups following specific criteria. The Municipal Agricultural Development Unit (MADU) provides technical support in the form
of training and demonstration. Farmer commits land and labor. The maize growers’ association
Stabilizes prices and provides market linkages by purchasing the farmers’ total maize crop (recovering the inputs credit received), and storing maize in rented warehouses.
Manages a revolving credit fund (originally funded by Syngenta Foundation), which serves as a catalyst for wider private sector participation in rural agricultural finance
One Acre Fund in East Africa Warehouse receipt systems (ex. IFDC’s Non-Cotton Inputs Programme in Benin, funded by
DGIS)
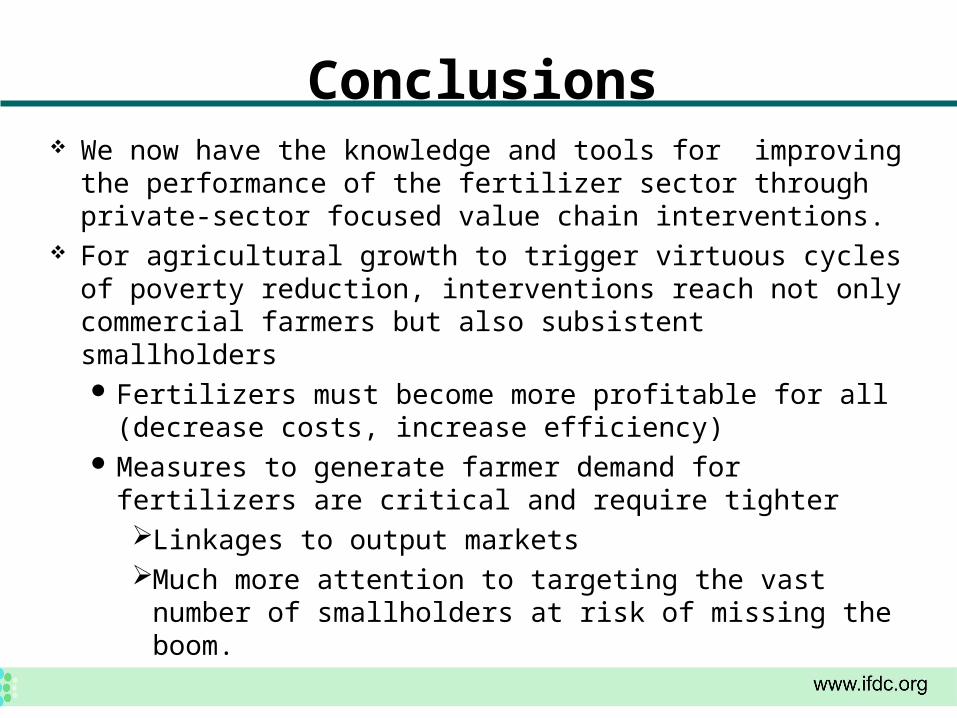
Conclusions We now have the knowledge and tools for improving the
performance of the fertilizer sector through private-sector focused value chain interventions.
For agricultural growth to trigger virtuous cycles of poverty reduction, interventions reach not only commercial farmers but also subsistent smallholders Fertilizers must become more profitable for all
(decrease costs, increase efficiency) Measures to generate farmer demand for fertilizers are
critical and require tighter Linkages to output marketsMuch more attention to targeting the vast number of
smallholders at risk of missing the boom.