Embed Size (px)
Citation preview

FIECopy
FINAL REPORTONR Contract N0001 4-86-C-0398
MEASURING THE IMPACT OF NATIONALADVERTISING ON RECRUITING BY DATA
ENVELOPMENT ANALYSIS METHODS
by
A. CharnesLn' W. W. CooperB. Golany'
I B. KirbyJ. McGahan0) J. Sample
__ D. Thomas
CENTER FORCYBERNETIC
STUDIESThe University of Texa
Austin,Texas 78712
DTICSMAR14 1988
bisrmroN AT 0~I_____Ifr W11 =O

FINAL REPORTONR Contract N00014-86-C-0398
MEASURING THE IMPACT OF NATIONALADVERTISING ON RECRUITING BY DATA
ENVELOPMENT ANALYSIS METHODS
by
A. CharnesW. W. CooperB. Golany"B. KirbyJ. McGahanJ. SempleD. Thomas
February 15, 1988
*The Technion, Israel Institute of Technology, Technion City, Haifa, Israel
leproduction in whole or in part is permitted for any purpose of the United States Government.
DTIC
CENTER FOR CYBERNETIC STUDIES 0A. Charnes, Director G j
College of Business Administration, 5.202The University of Texas at Austin
Austin, rexas 78712-1177(512) 471-1821
MM uMON UTATOM
Distribution Uniimted

1.0 Introduction
Military human resource planners recognize the significance of the
rapidly declining youth manpower pool through 1992. This declining segment of
the population and the increased scrutiny of large recruiting resource budgets
by Congress and others has prompted the services to search for methods to aid
decision makers in planning and allocating resources in the best possible
manner. The Center for Cybernetic Studies at The University of Texas at Austin
has responded to this need with new and improved methods for use by the
services in manpower planning. Data Envelopment Analysis (DEA) represents
one such method which has been developed by the Center for Cybernetic
Studies and greatly enhanced through research conducted jointly with the U.S.
Army Recruiting Command (USAREC) since 1980. DEA represents an
important development in its own right, and it can also be combined with other
tools such as "goal programming" (as also developed by Center staff) for still
further uses in manpower planning.
2.0 Data Envelopment Analysis
DEA is a relatively new approach developed by A. Charnes, W. W.
Cooper and others associated with the Center for Cybernetic Studies, which
can be used to evaluate the efficiency of not-for-profit entities engaged in
operations which characteristically use multiple inputs to produce multiple
outputs. Although these activities do not occur in markets where they can beFor
"priced" or otherwise weighted, DEA does not requiia recourse to preassigned .I
weights or the specification of functional relations between outputs and inputs. 0 m
It requires only identification of those outputs and inputs which are important to
the operations of the organization. It also requires identifying the organization
entities which are to be regarded as being responsible for converting inputs into t17 ce -'& " "ii and/or
Distj Sipeo 18

2
outputs. For purposes of the present discussion, these terms may be defined
and illustrated as follows:
OUtDUtS: The desired outcomes of goods or services that an
organization produces. Examples for USAREC are GSMA contracts and GSMA
applicants as well as less tangible items such as changes in "propensities" to
enlist.
In.. : Resources utilized to produce the desired outputs. For
USAREC these would be recruiters, local advertising funds, market size,
unemployment and other pertinent demographic and economic characteristics.
Decision Making Unit (DMU): An organizational unit (in this case, a U.S.
Army Recruiting battalion or brigade) which is charged with responsibility for
converting inputs into outputs.
Further breakdowns and refinements are possible. For instance, inputs
may also be classified as "discretionary" if they can be varied by management,
(as in the case of recruiters and advertising expenditures) or inputs may be
"non-discretionary" if they cannot be varied by management, (as is the case for
unemployment rates). Note that the latter constitute important inputs which
should enter into the evaluations of how well a DMU is performing in the outputs
it produces. See [1]. As in all past research, the choice of DMUs, inputs and
outputs, is best developed in a collaborative "team effort" by USAREC and staff
from the Center for Cybernetic Studies.

3
The following figure can help to conceptualize what is involved:
Inputs DIV. 1 Outputs
Figure 2.1
To be noted is that the DMU operates as a "black box" in which inputs are
converted into outputs, and explicit formulation of the connecting mathematical
relations between inputs and outputs is not required. Actual managerial data
for inputs and ouputs is utilized to obtain an efficiency evaluation for each DMU
or battalion..
A simple graphical representation of what is involved in such an
efficiency evaluation is provided by Figure 2.2.
OUTPUT 3 4
2.
INPUT
Figure 2.2

4
Only one output and one input are used in this simple example. As can be
seen, DMU 2 is relatively more efficient than DMU I, because it has produced
more output with the same amount of input as was utilized by DMU I. Similarly,
DMU 3 is relatively more efficient than DMU 4 because it secured the same
level of output with less input. Extensions to multiple output-multiple input
situations are desired for such efficiency evaluations, of course, and this, too, is
attended to by DEA in ways that extend beyond the pairwise comparisons used
in Figure 2.2.
Efficiency as a science or engineering concept is usually defined in terms
of an output to input ratio in which the output and the input are measured in the
same units with, in general, output/input < I. This is not immediately suitable for
use when multiple outputs and multiple inputs need to be considered in
possibly different units of measurement. Hence, DEA extends this ratio concept
by defining a "virtual output" to "virtual input" ratio in which the outputs and the
inputs are combined first into single virtual outputs and inputs. These virtual
outputs and virtual inputs are evaluated in a way that maximizes the efficiency
score of each DMU under consideration (e.g., a battalion) by reference to the
evidence on the input to output attainments reported for all other DMUs
(battalions). Efficiency then is defined for this application as below:
COMBINED RCTNG OUTPUTS = EFFICIENCYCOMBINED RCTNG INPUTS
As was true for the single output-to-single input case, the maximum attainable
efficiency rating is unity (or 100%) and the theory underlying DEA guarantees
that the resulting efficiency ratings for each DMU do not depend on the units of
measurement employed.

5
The theory behind this development as well as its methods of
implementation are documented in full detail in [1] and [2] and hence, need not
be repeated here. Instead we shall focus on some of the further developments
that have now occurred in response to the service needs in the collaborative
efforts that have already been undertaken by CCS and USAREC.
3.0 Past Research - the Ad Mix Experiment
In one part of its efforts, the Center for Cybernetic Studies
undertook a detailed review of the Ad Mix Experiment conducted for DOD by the
Wharton Center for Applied Research (WCAR) [3]. The results of this analysis,
as undertaken by A. Charnes, W. W. Cooper, B. Golany and P. L. Brockett as
reported in [4] showed that (a) the statistical experimental design approach
used in the WCAR study was not a suitable approach for addressing the
questions of how best to budget for advertising in terms of service specific and
joint advertising and (b) the models used and the statistical analyses employed
by WCAR were seriously deficient.
Another part of the Center's research effort resulted in a further extension
of DEA which would more accurately reflect what is involved in portraying and
evaluating advertising effort. This extension involved a new type of DEA model
to portray two stages of activity in which outputs at one stage become inputs to a
succeeding stage.
Figure 3.1 pictorially portrays what is involved in this two stage approach
in a very simple way. In Phase I, on the left of this Figure, inputs such as
advertising dollars and recruiting efforts produce outputs such as "propensities"
and "ASVAB Exams." These outputs are then treated as inputs to a succeeding
stage where, combined with other inputs (such as recruiting and follow-up

6
efforts) they result in the contracts and other outputs that are realized as shown
in Phase II of Figure 3.1.
~~~~PROPENSITIES %Cotas
___ Contracts
EXAMS
Phase I Phase II"Creating Awareness" "Creating Contracts"
Figure 3.1 Two-Phased DEA
This two-phase approach differs from the over-simplified one-phase only
approach used by WCAR in which direct casuality was assumed between
advertising expenditures and the production of recruits without any intervening
stages or processes and without important "marketing variables such as
unemployment , other service competition potential market volume, etc.
Furthermore, using DEA, a "production function" was developed utilizing FY 84
recruiting data for each of the Ad Mix test cells by aggregating the battalion level
DEA results. In this analysis GSMA contracts per $1000 advertising was
utilized as a measure of effectiveness. A simple interpretation of the results is in
Figure 3.2:

7
CONTRACTSPER
1KS AD
ARMY AD $
ARMY AD $+ JOINT AD $
Figure 3.2 Development of a Production Function
The analysis showed that Army high quality contracts increased as the Army
share of the total advertising budget increased.[5] Similar analyses for the
Marines and Navy revealed the same result: Service ads are "better" than joint
ads in "producing" high quality contracts. [6, 7] These results conflicted with the
findings of the Department of Defense contractor (WCAR) that actually
performed the Ad Mix experiment.
There are other important differences that should also be noted between
the WCAR study and the DEA approach used by the Center for Cybernetic
Studies. For example, the WCAR study used data collected by ADIs (Areas of
Dominant Influence) whereas the DEA study used data collected directly from
the battalions where recruitment activity occurs. Using the latter approach, it
was possible to identify recruitment activities and possible aberrations (e.g.,
inefficient activity) with specifically identifiable individual battalions. This was
not possible under the WCAR approach which could, at best, only artificially
impute "average behavior" back to individual battalions. Trouble was also
present in the WCAR data in attempts to identify battalion activities with the ADIs
with which they were supposedly associated.

8
Further differences with the WCAR approach can be made clear by
turning to Exhibit 3.1 which shows a sample printout from a particular battalion
that is readily obtainable from the DEA study. Here, only the Phase I inputs and
outputs are included but a similar report can be provided for Phase II or, if
desired, Phases I and II can be combined into a single report. To be noted is
that multiple outputs as well as multiple inputs are included at each stage. This
is in contrast with the WCAR study whose regressions had only one output at a
time as the result of the inputs used.
SUMMARY TABLE
DEA RUN TITLE: ARMY 0385 PHASE II 54 BNS, LAGGED ADVERTISING, SINGLE OUTPUTDEA MODEL: EXTENDED ADDITIVEDECISION MAKING UNIT: 45 5MEFFICIENCY: 0.883REFERENCE UNITS: 12 54 38 49
POTENTIAL POTENTIALVALUE IF POTENTIAL RATES OF
ACTUAL EFFICIENT IMPROVEMENT CHANGE
CONTRACTS 243 00 342 96 99 96 1 0000000000
ARNAT.AD 14822670 114975.16 33251.54 -0,0010000000JT NATAD 35291 31 969468 25596.63 -0.0010000000OS.NATAD 2 77 277 0.00 -143 7318815841m"SRPP 59147 00 56189 65 2957 35 0,0045420733UNEMP85 9 32 821 1 11 -1 0000000000PRODRCTR 107 00 107 00 0.00 -4 9134097931
Exhibit 3.1 Sample DEA Output
Starting at the top of the sample output under "Summary Table", the
output provides a title for remarks to assist in identification. Next "DEA Model"
specifies the theoretical version of the DEA model in use. Currently there are
three versions of the DEA formulation, each possessing different characteristics.
Choice of the model, as stated previously, does not change the earlier assertion
that a priori formulations are not necessary. This choice relates to the methods

9
used to calculate the efficiency measures (i.e. the ratio of the recruiting outputs
to the recruiting inputs). In this sample output the "Extended Additive" model
was utilized. This model allows for extensions to distinguish between
discretionary and non-discretionary inputs alluded to earlier.
Next the Decision Making Unit under investigation is specified. In this
case, battalion number 45, coded "5M" is shown. This code refers to the Peoria,
Illinois Recruiting Battalion.
The "efficiency score" is specified next on line four at the head of the
above table. Remember that this score provides an estimate of the efficiency
utilization of inputs in "producing" outputs. "Reference Unit," on line five, refers
to the collection of DMUs that were utilized by the model in determining the
efficiency score. As the DEA model uses a standard linear programming code
to solve the optimization problem that results from the DEA formulation, these
reference units correspond to the "basis" for this solution. These efficient DMUs
are "most like" the DMU under investigation in their use of resources. Hence
this portion of the output provides insights for comparisons or places to look for
ways to gain improvements in efficiency for the DMU under investigation.
The remainder of the output shows the actual inputs and outputs used in
the DEA analysis. "Actual" refers to the actual data values that were entered in
the data base, This repeatback feature allows for a rapid check of the data for
each DMU. "Potential Values If Efficient" shows the level of output (input) that
would be produced (consumed) if the unit was operating efficiently. "Potential
Improvement" is the difference between "Actual" and "Potential" . Here a wealth
of useful information is provided for possible improvements in performance. For
example, as shown on the line for contracts, approximately 100 more contracts
could have been gained with $33,251 less national advertising, as shown on
the line for ARNAT.AD. The specific amounts are not as important as the

10
indication of general managerial issues to investigate to improve efficiency.
In addition to these possible improvements, the column headed
"Potential Rates of Change" are the rates of change a DMU would experience
even after efficiency is achieved with incremental changes in that input or
output. This rate of change will be discussed in more detail later.
This kind of printout is provided simultaneously for all the DMU specified
in the analysis. A simple input program reads all necessary data at the
beginning of the analysis. The managerial implications of the battalion level
resolution are demonstrated: decision support is provided from the DEA as to
where to focus resource allocation to effect changes in desired outputs,
Still other extensions and uses of DEA are available which can be
explained from the report in Exhibit 3.1. As shown in this report, it is also
possible to estimate possible improvements that might occur in the outputs
produced and the inputs utilized by this battalion if the inefficiencies were
eliminated. Note that these inefficiencies are identified and estimated for each
input and each output. No such identifications could be effected by WCAR from
which average estimates only could be formed with whatever inefficiencies or
confounding observations might be present in the data. It should also be rioted
that the DEA kind of battalion information can be aggregated up to ADIs or other
"higher echelon" units (e g., brigades) as desired. Moreover, such aggregations
from these DEA results can be effected with efficiency adjustments, if desired,
from the battalions with which they are identified. This can be done with
reference to different phases or the two phases can be combined without losing
the ability to track possible inefficiencies back to their sources in the individual
battalions.

11
4.0 Continued Research
DEA - A Decision Support System for Measuring the Impact of
Advertising
Research and past experience have shown that decisions and
operations in the Recruiting Command require quantitative methods that are
sensitive enough to detect even the slightest variations in input/output intensity.
Large scale experiments such as the one attempted by WCAR cannot
adequately reflect the effects of the attenuation of the inputs and outputs,
particularly advertising.
4.1 Purpose of Research
The purpose of this particular phase of the research was to further
explore the uses of DEA in determining the impact of advertising in "producing"
high quality contracts for the U.S. Army Recruiting Command (USAREC).
Instrumental in this effort has been the "team concept" in which members of the
Center for Cybernetics Studies and key decision makers and project officers
have worked together in all phases of the modeling effort and analysis.
Continuation of this concept is critical to future successful research.
4.2 Data
The data utilized in this current developmental stage comes from the
Defense Manpower Data Center (DMDC). DMDC serves the Defense
Department as the repository of all service manpower data reported by the
services. DMDC provided the data collection and management from the
original Ad Mix Experiment discussed above. The Office of the Secretary of
Defense and the services agreed that continued advertising data collection
would foster future research. This secondary data provides a useful source of

12
valid and increasingly reliable data. The Center supports the continued
development of this data as the "industry standard" for military manpower
planning research. It should be noted that DMDC personnel have been
extremely cooperative and helpful in resolving questions and problems with the
data that have arisen during the course of this research.
Table 4.1 lists the major variables provided by DMDC (through USAREC)
in July and August 1987.
ARMY NATIONAL ADVERTISING ARMY GSMA CONTRACTSAIR FORCE NATIONAL ADVERTISING AIR FORCE GSMA CONTRACTSMARINE NATIONAL ADVERTISING MARINE GSMA CONTRACTSNAVY NATIONAL ADVERTISING NAVY GSMA CONTRACTSJOINT NATIONAL ADVERTISING ARMY MISSIONARMY LOCAL ADVERTISING AIR FORCE MISSIONNAVY LOCAL ADVERTISING MARINE MISSIONAIR FORCE LOCAL ADVERTISING NAVY MISSIONMARINE LOCAL ADVERTISING ARMY RECRUITERSARMY APPLI-AN I S AIR F-OHCE HCRUITERSAIR FORCE APPLICANTS MARINE RECRUITERSMARINE APPLICANTS NAVY RECRUITERSNAVY APPLICANTS UNEMPLOYMENTPOPULATION
Table 4.1: FY 85 Data
The data were provided at the county level with battalions (and other service
equivalent recruiting organization) designators provided. DMDC used a
standard algorithm approved by each service to determine the county to
battalion aggregation.
FY 84 data were also supplied by DMDC, but as already stated in [4],
many variables were only reported for a portion of the country. For any
temporal analysis from FY84 to FY85, the data were augmented with official
USAREC data as necessary.

13
Data reduction and preparation for analysis were performed on the
University of Texas at Austin IBM 3081 D.
Based upon guidance from USAREC, the original data were aggregated
by Army recruiting battalion (=DMU) by quarter. Quarterly observations were
chosen, as most recruiting policies are "managed" by quarter. All variables
were summed from month to quarter except recruiters and unemployment,
which were averaged by quatter. Again, the team concept aforementioned was
used in determining inputs, outputs, and DMU's and in any decisions regarding
necessary data manipulation.
This DMDC data allows for inclusion of competitive effects in the
analyses as all service data is provided. Since each "management unit
designator" for each service is provided on each county level record,
aggregation of other service data to Army organization was possible. This
service, provided by DMDC, as stated before, is vital to future recruiting
research.
Numerous difficulties were uncovered in the process of "reducing" the
data for preliminary analysis. Specifically, the High School Senior population
had identical data for all of the approximately 3500 counties of the U.S.
Additionally, the Army recruiter data was in error, showing less than half the
proper number as verified by USAREC. DMDC responded to the Center for
Cybernetic Studies' requests for clarification and provided accurate data.
Summary statistics were provided to USAREC in August 1987 for verification
prior to preliminary analysis. It should be noted that these data were well
documented (in most cases) and that DMDC was responsive to any requests for
clarification. The importance of this resource to all services for future manpower
research is again highlighted.

14
An initial subset of the data was chosen for preliminary analysis. This
subset (Table 4.2) was selected again based upon discussion with U,'AREC.
ARMY NATIONAL ADVERTISING ARMY GSMA CONTRACTSAIR FORCE NATIONAL ADVERTISING AIR FORCE GSMA CONTRACTSMARINE NATIONAL ADVERTISING MARINE GSMA CONTRACTSNAVY NATIONAL ADVERTISING NAVY GSMA CONTRACTSJOINT NATIONAL ADVERTISING UNEMPLOYMENTMARINE RECRUITERS POPULATIONNAVY RECRUITERS SERVICE DIRECT RESPONSE LEADSARMY RECRUITERS SERVICE APPLICANTSAIR FORCE RECRUITERS
Table 4.2: Subset of Data for Analysis
4.3 Analysis
As a precursor to a DEA analysis, a typical regression approach was
utilized to gain in-ih-,,, into possible riinilerpretations of the data. Numerous
combinations of independent variables from the subset in Table 5.2 were
utilized in attempting to "explain" Army quality contracts and Army quality
ASVAB examination applicants.
The most revealing of these are the simple regression lines for the FY85
data set depicted in the following two figures:

15
700•
A 600- mu i
P, 500, * . a M
.', i. "rC 400 e r. M EU
a .-
a 400- M
nh agad M.I 0 •R
C 300 E , mei 1W _ M•" m= •
-- .. .,U_-
200 u m
10 1 i i i --
S100o I I I I I I I
0.2 0.3 0.4 0.5 0.6 0.7 0.8 0.9 1.0
Army shr ad
Figure 4.1: Regression of Army Applicants vs Share of Advertising
500-
MEU
C 400- as ME*
0 l ow on
a 300- UME
100- SO WO E z
0.2 0.3 0.4 0.5 0.6 0.7 0.8 0.9 1.0
Army shr ad
Figure 4.2: Regression of Army GSMVA Contracts vs Share of Advertising
To be noted is that both supplies are negative so that in causal analysis
associated with these regressions it appears that advertising repels recruits!
These strange results are further illustrated in part by the following
histogram of Army "share" of advertising versus Army "share" of applicants.

16
c0u 10"nt
210.000 480.00352.000 '' 400494.000 "4 0.00
636.000 40 3 0.00
Army shr ad 778.000 320.00 Army share apx 1OA-3 920.000 280.00 x 10A-3
Figure 4.3 Histogram of Share of Advertising, Contracts and Applicants
The bimodal distribution depicted in Figure 4.3 raises severe questions about
the use of linear (or even loglinear) regression models, like those used by
'VVCAR.
Regression models like those used by WCAR are the wrong tools for this
analysis. The result is a mis-specified model so that results from this modeling
approach are best regarded as invalid. Similar analyses of FY 1984 revealed
like results. In addition it appears from the previously mentioned critique of the
WCAR efforts that the DOD study utilized these same techniques and reached
similar conclusions. DEA, in contrast, does not require the kind of a priori
model specification that these regression techniques require, so the pitfalls
associated with assumption of linearity in the relations to the models can be
avoided.
Previous uses of DEA in the analysis of Army recruiting have shown the
power of the methodology as a management tool, allowing micro-level
decisions at the battalion (=DMU) level [5]. Earlier work on the development of

17
the production function demonstrated how a macro-level analysis capability for
resource allocation could be developed [5]. Finally the concept of a micro level
DEA for each service utilizing DMDC data "feeding" a macro level goal
programming model has been conceptualized in [8].
A new development in providing decision support in the impact of
advertising is now presented. Although the general concept was presented in
[6], optimal dual variables can be exploited to obtain still more from standard
DEA informatics output. In particular the rate of change values shown for a
particular DMU as in Exhibit 3.1 can be used to plan resource allocations and
reallocations to obtain optimum recruitment plans and strategies across all
DMUs.
Figure 4.4 shows a typical output from a DEA analysis of the subset of
DMDC data described earlier. Particular attention is now called to the values in
the column headed "Potential Rate of Change" where the optimal dual variables
are recorded.
EFFICIENCY SUMMARY
OUTPUTS OTENTIAL RA
INPUTS
Figure 4.4 DEA Output
As shown in [1], the negative of the rja of this "potential rate of change" or
optimal dual variable for input xi to the optimal dual for output Yr is equal to the
rate of change of output Yr with respect to input xi. This ratio, then, provides the

18
Army with an empirical means to determine, for example, the change in quality
contracts (output) with respect to advertising (input). Resource trade-offs and
sensitivity analysis can then be performed at the battalion level or higher. Used
in this manner DEA provides marginal rates of substitution for the decision
maker [5] for each input under observation by moving efficiently across the
frontier of possible solutions. In technical economics terminology, these
represent marginal rates of substitutions between inputs (or between outputs)
and marginal rates of transformations from inputs to outputs at the efficiencies
frontier.
4.4 Findings
The original subset of FY 85 data was aggregated to the Army battalion
level for all services. The "competitive" effects of "other service" (Navy Air
Force, and Marine Corps) advertising was modeled by the following:
1
NAVY AD$ + MARINES AD$ + AIR FORCE AD$
This reciprocal says that there is an inverse relationship between "other service"
advertising and Army contracts. (This relationship was developed in [5] and has
generally been agreed upon by advertising experts and Army leadership). The
"lagged effect" of advertising was modeled by using an average of the previous
quarter and the current quarter advertising expenditure data. Joint advertising
was considered as an input to provide a "best case" estimate of its impact on
Army recruiting.

19
To allow comparison to FY 84, during the period of the Joint Ad Mix
Experiment in which ad levels were changed in certain parts of the country, the
FY 84 data used in [5] were also consicered. Admittedly, these data were
provided in part by USAREC and in part by DMDC, and so the resulting direct
comparisons may be biased. However, the DEA can control for this in the use
of a "window analysis" in which a four-quarter "moving window" of the same
DMUs are compared to other windows in different time periods across the eight
quarters , FY84 to FY85. This window analysis, seen below in Exhibit 4.1,
allows for analysis of temporal effects in the rate of change discussed before.
Complete window analyses for the different types of advertising (Army, joint,
other service and total service) are in Appendices A, B, C, D, respectively.
100 * RATIO OF ARMY DUALS SUMMARY MEASURES
01 C1 Q3 04 05 Q6 07 CS MEAN VAR COLUMNTOTALRANGE RANGE
1A 0.136 0.023 0.393 0.0200.006 0.086 0032 0.100 0.115 0.308 0.371 0.465
0.042 0.032 0.032 0.0530,311 0.049 0 109 0.471
0.100 0.100 0.100 0.100
MEDIAN 0.136 0.014 0.086 0.032 0,074 0.100 0.285 0.100
1B 0.015 0.003 0.008 0.0020.000 0.006 0002 0.004 0.013 0.003 0.043 0.045
0014 0.005 0.007 0.0140.004 0.047 0.015 0.015
0.047 0.013 0.007 0.011
MEDIAN 0015 0002 0008 0003 0027 0.014 0.011 0.011
1C 0153 0045 0100 0.0140 100 0100 0.014 0.086 0092 0.133 0.265 0.311
0.100 0.023 0282 0.3250064 0.017 0.100 0.125
0.020 0,100 0.031 0.040
MEDIAN 0 153 0072 0 100 0.018 0.053 0.100 0.078 0.040
ID 0.152 0399 0483 0 9400.056 0260 0.013 0.812 0.316 2.626 1 540 1540
0100 0013 0808 0.2351 553 0.119 0.367 0.305
0.100 0.230 0.100 0.176
MEDIAN 0 152 0727 0 260 0026 0.464 0.235 0.202 0.176
Exhibit 4.1 Window Analysis

20
Note that the analysis is provided at the battalion (=DMU) level with the same
DMU being compared in different four-quarter "windows." As statistical
observations, these DMUs can be regarded as "different" in each window,
hence increasing the total sample of units "observed" since the data sets are
developed by dropping one quarter and adding another quarter of data in
moving the window from left to right.
Summary measures to the right of the page allow for rapid discovery of"exceptions behavior", where a large variance in measures may indicate outlier
behavior. Management can then utilize this information to direct attention to any
such DMU and investigate to determine causes for this behavior, including
misreponing or the reporting of erroneous data. Additionally, median values
are provided which allow for robust aggregation of the individual DMU
measures to national level for macro analysis. It should be noted that for this
temporal analysis, all variables provided in FY 85 were not available in FY 84,
so only certain input/output combinations could be analyzed.
The input-output combination utilized, then, focusing on a single output
Phase II ("creating contracts") DEA was as follows:
INPUTS OUTPUTS
Army National Advertising GSMA Contracts
Joint National Advertising
Other Service National Advertising
HSSR population
Production Recruiters
Total Unemployment

21
Phase II analysis and the single output combination were selected to
attempt to isolate the effects of advertising on contracts. New software has been
developed by the Center for Cybernetic Studies to provide the ratios of dual
variables for Army Advertising, Joint Advertising, Other Service Advertising, and
Total Service Advertising. Each battalion "rate of change" in contracts with
respect to each type national advertising was summarized by use of the median
rate of change for each quarter in the analysis. These median rates of change
were then weighted by the battalion population. This weighting allowed
aggregation to the national command level by summing. Finally this command
rate was "averaged" by dividing each quarterly command rate by the total
population.
Using the previously described window analyses, comparisons of the
median rates of change in contracts for each type advertising can be made for
the eight quarters of data, FY 84 - FY 85. Results of the analysis are depicted
below in Figure 4.5:
Contracting Rate of GSMAper $ National Advertising
by Quarter*"Popiation Averaged Median Battalion RateC
1.2 r 1r
8 TolSvc Other Svc
r ,a 0.6 -T' - [] " /
a e 0.40---mC 0.2 4 -,_r_ .._____t e' --- --, , , ,
1 2 3 4 5 6 7 8Quarter (FY84-FY85)
Figure 4.5
It is readily apparent that the rate of change in Army quality contracts in
every case is greater than Joint for either Army advertising, Other Service

22
advertising, or Total Service advertising. Note in the chart that the Army rate
declined drastically from the 1st Quarter FY 84 to 2nd Quarter FY 84. This was
the beginning of the Joint Advertising Mix Test, in which Service advertising
was either reduced or held constant, while Joint Advertising was raised. The
Other Service contract rate shows a decline in Quarters 3 through 6, perhaps
reflecting the effects of the changes induced by the experiment. Note
particularly the "recovery effect" on total services advertising with the
termination of the Joint Advertising Mix Test contracting after Quarter 6 and a
seeming return to "normal". The Army rate then remains relatively flat, perhaps
because of the difficulty in recovering from the initial loss of advertising
awareness. The Other Services also show similar behavior.
These findings agree with earlier work performed by the Center in
response to% isue r.i... during the joint Ad Mix Experiment: Service
advertising appears to be more effective in "producing" contracts than Joint
advertising [5,6,7,8].
5.0. Conclusions from DEA analyses
This research is only in the early stages of development. DEA analyses
need to be performed with various other service outputs and inputs to complete
these developments. However, the already developed DEA applications
provide an empirical, battalion-level basis for management decisions regarding
the Service-Joint advertising issue and other resource trade-offs. The rate of
change measure is easily incorporated into previousl, developed informatics
utilized for DEA. True decision support can then be provided to the recruiting
command through DEA on the impact of advertising of different types, and on
the allocation of other resources. Thus DEA can provide the basis of a Decision
Support System which will systematically provide insights from the data while

23
maintaining the managerial level resolution needed to implement those insights
into decisions.
6.0. Future applications
As stated, more detailed DEA can be performed, utilizing local
advertising, other service recruiters, different media types of national
advertising, direct response leads and others to develop a Decision Support
System useful at battalion and national headquarters level. Insights can be
gained on rates of change in other outputs, such as changes in awareness with
respect to advertising inputs (Phase I analysis). In addition the "efficiency"
measure at the battalion level can be utilized to assess changes in missioning
or sales quotas. Finally, the micro level analysis can be aggregated to national
level for each service and "optimal" resource levels can .C be explored using
goal program extensions to DEA [8].
DEA provides decision support at the national level producing a
quantitative justification for future executive-level discussions on the allocation
of expensive recruiting resources-the national advertising budget. The sulport
provided, upon development, can provide real-time management information ;n
highly relevant "digestible" forms of reports for use in the management process.
Future development will hopefully allow a successful ntegration of ail the
hardware and software into the battalion (and above) commander's decision-
making environment so that efficienct resource allocation across brigaCes
and/or battalions can be effected along with monitoring and correcting
inefficiencies in the performance of each DMU in the system

24
REFERENCES
.3 Charnes, A., W.W. Cooper, B. Golany, L. Seiford, J. Stutz, "Foundations of
Data Envelopment Analysis for Pareto Optimal Empirical ProductionFunctions",CCS Report 504, November 1984, University of Texas at
Austin.
[2] Charnes, A., W.W. Cooper, E Rhodes, "Measuring the Efficiency of
Decision Making Units", European Journal of Operations Research
Vol. 2, No. 6, November 1978, pp. 429-444.
[3] Carroll, Vincent P. DOD Advertisina Mix Test: Comparison of Joint-
Service with Service Specific Strategies and Levels of Funding, Office of
the Assistant Secretary of Defense report, July 1987.
[4] Charnes, A., W W Cooper, B. Golany, P. Brockett, "Critique of Draft FinalReport of the Ad-Mix Study",June 1986, CCS Report 546, University of
Texas at Austin.
[5] Charnes, A., W.W. Cooper, B. Golany, R, Halek, G. Klopp, E. Schmitz,D Th-omas, "ata Envelopment Analysis Apprn hes to Policy
Evaluation and Management of Army Recruiting Activities I TheTradeoffs between Joint Services and Army Advertising", CCS Report
532, March 1986, University of Texas at Austin.[6) Charnes, A., W.W. Cooper, B. Golany, "Relative Effects of Service Specific
arid Joint National Advertising in Marine Corps Recruitment Activities",Report for the U.S. Marine Corps, 16 June 1986, CCS, University of
Texas at Austin.
[7 Charnes, A., W.W. Cooper, B. Golany, "Relative Effects of By Data
Envelopment Analysis of Service Specific and Joint National Advertising
in U.S. Navy Recruiting Activities", Report for the U S. Navy, 16 July
1986, CCS, University of Texas at Austin.
[8] Charnes, A., W.W. Cooper, B. Golany, J Roussea, J. Semple, "Data
Envelopment Analysis of Military Recruitment Activities: Interim Report I",
CCS Report 570, April 1987. University of Texas at Austin.

,.-rl 0 0 0D
00CU CD'o N - I
00 C)0
L^ 0O _: 0
rl 1) o~ 0= 0 0CDN
. 7 - - - 13 -4I
04- C qC c 0 0 0 0 0 C
10 4 3-
0 \0 0 C --: -A 0.- 0 CD'0-M o ^Q -.4.?- N 0
44 . 4 m 04 04 4- 0 4m4 4
0n : 0 m 0 . 0 -1 00 o0S 0on'" 10 C$ 0 OLO 0 ?-0
04 1P%0 00.rj-4 D - o LNO1- a a ~ \? i 0 '~j -- 0 0
't ~ CO .40 W~.4 ~ CDN *3 N ~ 0 *m 03m N50 4 8
-y~~ ~ 00N Lo 00CD 0 0 o0
0ll ID 0 0
~00 ~ ".N0N-4
-0 NO 0 0 ~ '0O~ X
0-IS'IN 0ONI 000V V X :0 N N2[00 ddV4

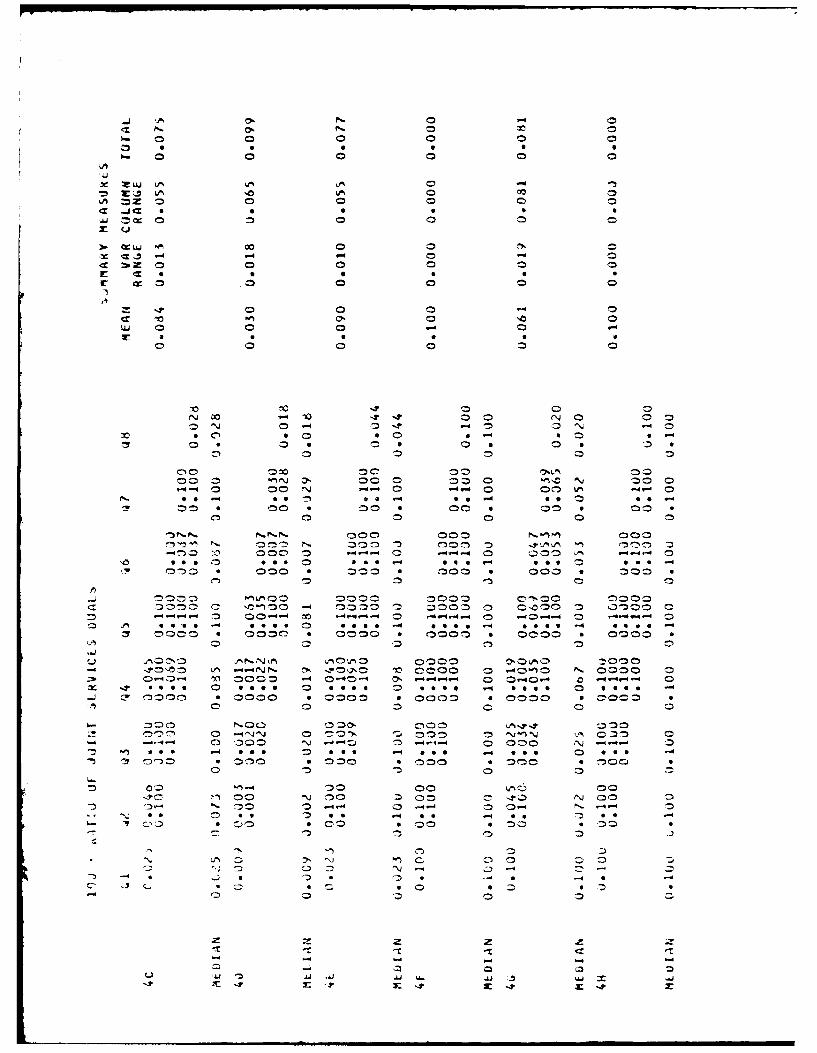
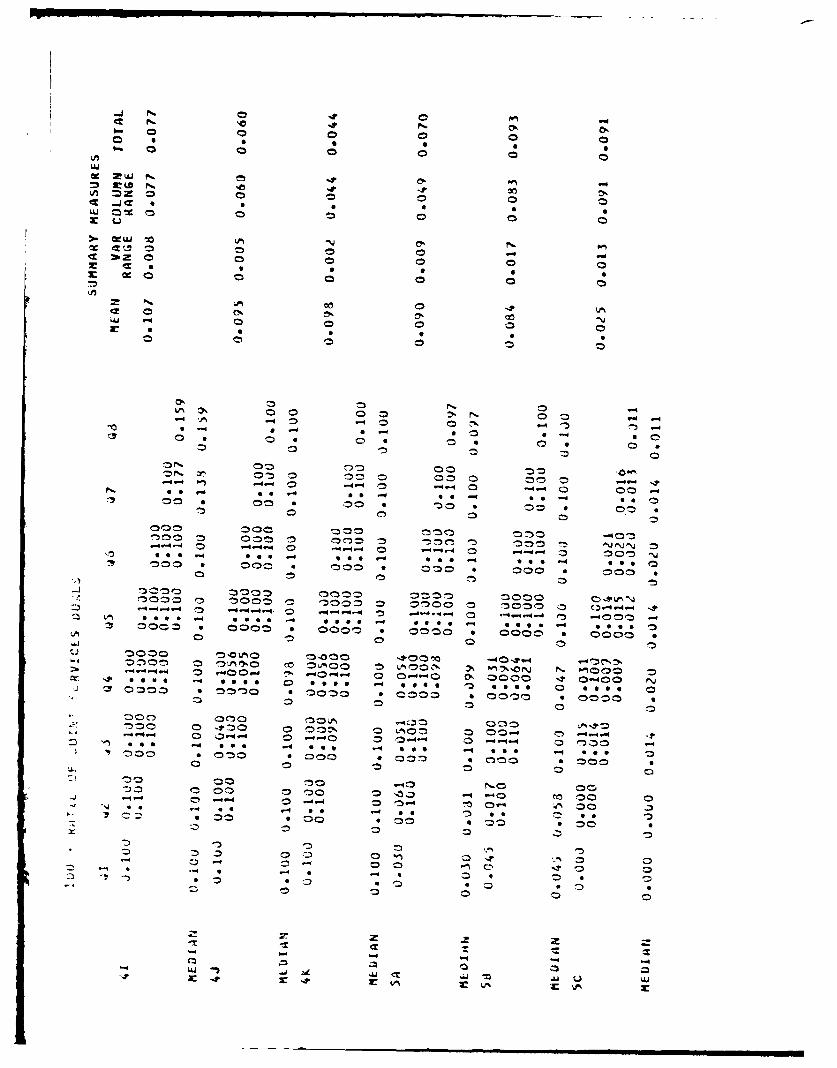
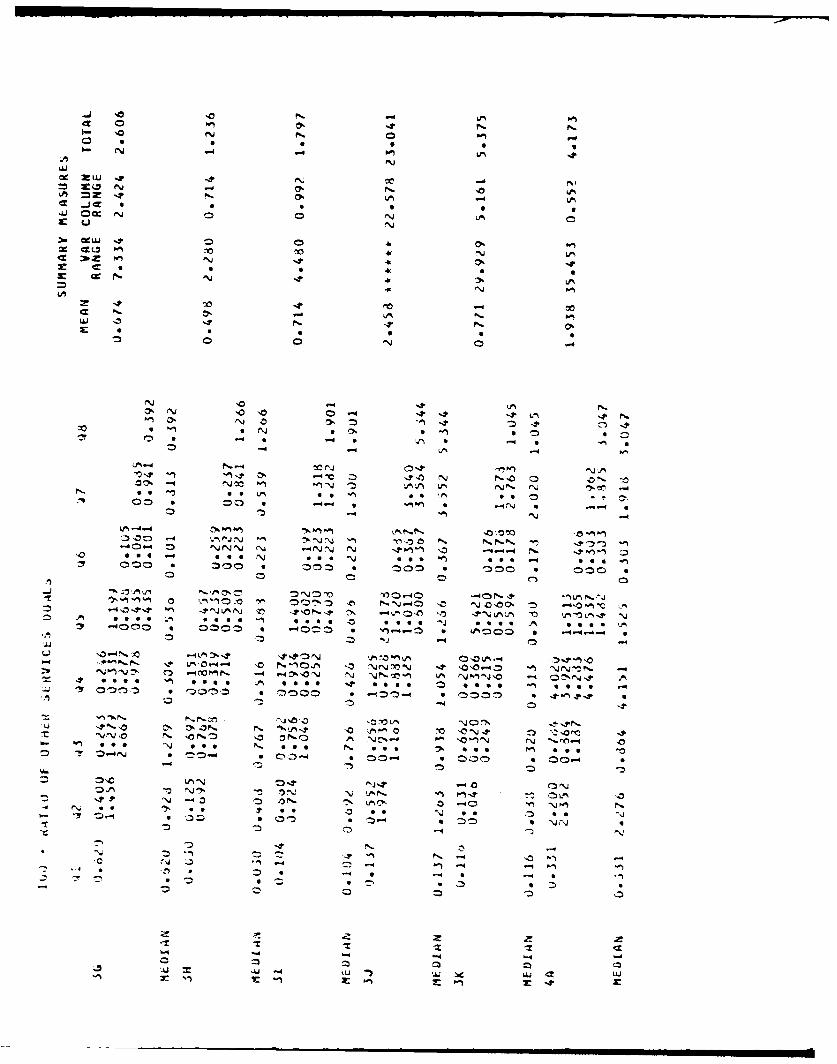
Introduction to Technical Appendices
Appendices A through D represent the window analyses described in
pages 18-19 of this report. Results and conclusions in the report are based in
part on an aggregation of the median summary statistics for each battalion. The
entire window summaries are provided for fututer reference concerning
managerial issues at the battalion level. Appendix A represents the marginal
rates of change in GSMA contracts for a change in Army advertising. Likewise,
Appendices B through D provide rates of change in GSMA contracts for small
changes in Joint advertising, Other Service advertising and Total Service
advertising, respectively.
,,-,-4•a , - n.nnum n• ni

WO 64 -S
i9m 0 0D 0 00D
00 0 01 0
np
00
0 C) 0
U',) 0*n n- 0V ' 0L0's
000 0 0 0-
00-4-.4
-'N 00 00 0 0r'0~ 0 0 11. 0 00 0 1-1 -.
'3 ' 0 0D
0 0 c 0 Cm 0 -44 444
:D-00o~o 00 0 000
0 7 0 a 0 0 a
0 C) 'D C;
_ Otf%0.-I VCcN - - ' r 0 ~ % . 4 ~ 4 '
CA4 Q~-4 - 0 A - 0 ~ 0 4 ' ~ .0~~~~u u0 t&. 0 4 5 * 0 5 6s 0 e g -
(.~~~~~~X wl x~ 0 C.) 0

N 0 N (
z. pu 9 -W L 0
(A X l Ag
U. N N. AS
~n 006600 :-: CD C
1- CC 00 oc0
C, 0 l 0 Ir 3 0
Co 0 0D C0 -
00I~ (A 0 4 . -4 C 0
.0 oN 4 OC 0 0 0 -" 0 0 0 NO Im-1"^ ^
It0 0 0 0
000 00 00 0 -DO n Conn
C4 N10 00 - 0ql0 *06C 0 up 3 .0
3 0 0 0 0 0
00 00 DO0
0 ~ -*** *X 554 a: 60 4 *g ts .

z u nLN PO
UA - N
~~r 02 000
Oo 0j . rl N. a D CD 1 )aA0~' ~0 In o 00 0
a Z 0 0 0 C 0 0
S0 l: C3 CD (Dn4 0 0 0. 03 0
4-44
UJ 4 0 c-3 0 c-
n 0 0nL N" 0 0):O p 0 ^N)0D 0
I.0 4. N 1 -o l e0 IDI v N 0 11
a 4 .4c;4 4 0 N '0
3 0 C *0 fa 0 0 v* Z Ca
CD00 0 Cl!
00 ~ 0 eIT
00 ~ ~ A 0j -t . C UN'

cc i 0 0 0
-ul
Nz 0 ol 0m 0 0In0~00 ID "a0
~~0 *w '-0 0 .
0 0 1 0 0 CD 0 0)
V ,0 0 -30 0t 0 D
0l 0n-, 0 0 00 0 n
vs 0,- N f0 *op nf,, -kLN' N. J 0 ^, 0, 00 4, P 0 TnC
0 N 0 D- N 4 0 000 'l -0 0 9 0D a a e 0 ID .
oc 01 0 0 : n 0 0 a) 0 0
17 -0 0 0 "D 0Tr0 -4-40 00.
00 -D .4.0 4 ll 0 0 3 0.- In n~
N.ON sOl 0 '0.. T" ~ S s
0 0 0 D 00
~~00~u N.0 0 0 00 ~ ~ ~ ~ ~ A 0 r0 ^ x0 0 '~~' ~

LA
L U
cz _ .cc 0 0
ce . j N. '0 . '
T S- F%.65
cz 0 eD CD00
pe C) *I r . 0 6
Wc- N. 4 00 ItI0N.. 01 00 0 0 -_ N 5 .
0 - 0 0 4 0 3 0
C3 CD v O D 0 00
I N feN P_ SO *4\ 0 ..0 % 0o S4 0. CD 0= -0 0
0 0 00D
LON% .q D N - L^~ 0 m -IV.P c0-' 0 -4 N 4n 404 -44- N -00 N- 0W'
N- Cl 0 f.. PI ID 't L", N, es0N
C0 ct 0 'r 00~ L^ 00 *1 00 =000 00 0 0 a 0 0
NP-73 0NO--0 0N'N
00 O . 0 0 5 00 * 0 .
0 .0 Z0 0
0 ~ w0 _jLP0 n.~~ Ad00--"

J. '4r N. .4N
= 0 O. 't ft .
a 0m 0 0 000
w w cc n
cz 0p 0 0 0 0r C 0 0
C9 0.N "
x~ 0 -,-i-
00 ?,1 0n 0 :P 00o 0 V 0 0 0 0 0 *
0 o 0 017 ~~1- 9 - 04. ~00 o 0 on no o
noo o 00 000~ d~ -)n -00 D
0 0 noo n o*i 0 (" 0 ^J 0V *~ 00 C0 0D o 0
o0 O 00 0 n' Ono M=
00 0 00 0 00 0::)-- > 0- -3 0 0 00 N'
N. * - *S 4 *S . s 40 -9
Z, 0 0. 0D o a0~ -
. 0 oko~ In -^ 0 ^44- 0) 00a co . -00-4 _% s-e o4 0 So.-7 C4 0.1 0 CN C O us
.40 0 0 00 o 00 4 0 000 * 000) * a 00 n0 0 a ' - )noC 0 0 '0 n0 C
00.~0^ 0 n0 -n 000 0 00 0 o OON. .0-44 -
0.0 . 0 a '
~~on 0.' .00. n 40 00i. O 00-:1 0 0 0
JO ID 9 . 4 0 . * e -4 e ~ 09 0 * *
- ~ 000 * 00 0 * 0000 * 0 00 * 000 * 0 00D
0 0 00 0z
'.a'd 0 '~0 - 00I=/~ 0"0 0~40 ~ 0 Lf0 0 ..4~ ~ ~0-
V -~ 0v44 N- 4~J~ .0~f ~

3 ,~. -00
- 00
X3 N
cC 000
r 4-4
0, .4 0 0- 0 II 0o ?-5 0 -- -. ttI 0 0 C 0 .~
48 ,4 -. N: '-4 -
U4 LP 0to
10 St fl 534.3 z 03 DO=
F'-40 -d lj
33 C, N- ~ - -O
0 X T 103

LM
30 U L29atW .4 N ~
z 0 0
of 1-10 00000
o q4 e14 on -
!: pn 07 00 0
5~ 0 0 0 t )Pn: 0 0 -D
Z. 0'0 v -1: C A- s
,,j.N N -4
000c CC) C) 0 SN 0 3 o 0~.
0 0 0 e 0 a~
-D 1-1 0 "D m.30 00 0 LN .4
Ny -_I F,^ 0C30*0 0 00 0 I 0 0=0 0 0M 0 - 0N "='04 C .- 4
0 0 00 0 D
.. 1 -e rJ0 UN I' L/N 0 X N 0 0c ~4-0 N

'A 000 0
IC ZW C '
t2 Z 0 0-D
I= 0l z 0
2- 0 0
0, C) 0 0 0 C) s
0 0 0 0 C 00-
0- '6 1.4 lo 'l '0 z r 1
" 0l 0n - 44. 4 0 0K -. "a .
-D , C 0 4 '4 D 00 0 -4 0
-,~~~n 0 0 *0 *'
C) '60 'r CDO -4 001 0St~~~- 00 0~0 ' 04 ~ 04~
iy 0 00 s 0 0000 =OI ao OC C 0 Z> C)
0 ~ 0 N 0 0j 04I= ^0000 Z WW A f-4- 1")- N 00 L
ID 0 0 .- 4- C; 00000 0 OO pe)3 61%t-t -
0.-a.- 0 0= =:3 --1 0D 00- In 00) C-)O.4'0 * S 0 0 0 c o - S ~ _0 *O@ 0 @
0 0'N 0
0OD -00 -00 0-40-0 0 0 t -.-
a 00o io 0C0 f 0o 0 a 0 00f * 000 * 00 01 .31) 0 0 C0 n 0- 0
ONNO ~ *-.tP t ON N 00
"3 S) 0 n
' ~- Xu 0 * *@0- X *
'0 ~~ISIN MONI '000r 9 00 * 00 * 00 * 00 * 00

LA
LM ~LU 0c
LA
.u
al S
ne

_0'
n*
'Ap.
Z 0 on C" S,-
-4- ): - -0 n
0 0" Z: 0- 0 -0 Z0 "
o0 -1 -- 6- C D 70 0 041
N~ 0 0J~ -t '0 0D (0 0-- 0
440
I' .l f- *: -0-
0 0~-0 0 1- '0o
00 '0D
0-. ON ' 000 000 0\ ~J .J03
oO 0- 'C -'- '0~ 0 00 ~ 04 t
N. * 0 0 0-~ S S '0*,m

0T _ s 4z 0u - 0 w 0
0~ -4 -s CD.
CD. 00 CD0
onU -,3 0D -4 0n-
N C5 C'.T --j0 D4.
~~~ C)4~~- * 90 -7 000 0 0 )
Z0 0 - N > iC) 0 c0-
, 9 9 a
Q 03 n 0 0 0"D--
0 u c 0 -_)a ,00 000 0 aD40 r.4 -O -0
-~ ~ ~ C 0 0
D--4 0 0 0 0 * 0
NJ ^I 0 IC 0
-- ~~~ ~ ~~~ a a 0- Q t 0 aa
(Z 0 000 00. L00 NeNOX:'' I0.00 . 0 C 00 .0 O a N
m .2 6^- 0 00C
o 0 CD
e Lw, 00 -
Ui 21. C 0 0
z CD
0o 0 0rN 00 -4 10 -0
00 0 c 0 C0a: CD C. C 0 CD 0I 0~ 0
.. 0 0 NC 0 0A - 0
UJ CO 0 0 0 -30
0W 0 o=00 0 0 C!DCI"
8:; C
N CO '4I=' 0 C C C
"N' Co -C 0-c " p _44 4. CD 0.4- 4C 0
Z) C l 0 C. o* D. In * 0 a C S 0C Cl C CD IN -D
- C C OD 0 -3 C 0 00 PN.1- aB SB a 4@ o
01 0~ C.) in 0
C ~~f C) C C C C C C7)0 a ~ CC 'DC ~ 44 0 -4- C 44
C, .B C s e C * B .4 S . 4 * e C S* -
CCC CC * C C S CCC . 00 * It
u Ci J Ci IA. L0.

o~c fa 0S
Uw L
00 M.00
' _Jc g0
LW 0"T' ~W
cc cr S-l a b 00
1/,
It 0o 00 0 a
ON 0 f' 4 0- 03 4
0 0 3 S0 * 3 % 0 *00 *30 3
.50~~ 30 40.03
C O N-' L r N 0 0 0 3 s 3 03 30-4 ~ C-0 4 4 0l n~33 -
ID n= -3 030 3 0 - .4 0 0'043 03 '~' 0 3 - 3 0 3 C .
.4 3.4 ~ ~ ~ w -w. . 4 4- 30 3 ~ - o -C ~ ~ ~ ~ ~ ~ ~ ~ L *..Ne.** *se 4* o3 0 0~ ~~~ * 0 0 0 * 0 0 * 3 0 3

UJJ
0 0 ' N
~~LO - F --
~~~1 0cc56
n 0 0
0C0
a) - 0 c;,
6e CS 0 0 nI 1
s 0 0 0 0
0 fl '0D- ^0-
00 n. C~ -4 1- Ono
S~~~ 5 0.0.000 0 0 0 0-
0N 0 00 lo -I
3 0 D 0 0 0
000 00 N.~XA ~ ~ 000 000
0 0 0 0 0 0 ~O- ~ 0 ~ 0 0 0 -d 0 0 .4'C~ ~~~ ~~~~ .. e s . -0 . - e e-, 0 0 * 0 0 * 0 0 0 * 0 0 * 0 0 . L0 0i
ne 010 fl. 0I-. 00000
0 e
LfllL6n
LU~C 0~
.4.0- 0 44, 0 ,7
-4---4 0an 00
* .
cc o a 0 -1 0
0 00 00
~4~' 0 - 4 0 4 -u- 0N~~~~P V L^
s ~ e c em

e 0 0j 0 LON
= w 0 N. K.
CA =
3w ad vi Pe 0 -
~~~1 Nm NN4 a 0 0 0
F' Lm 00 0 0 -4
z ~ N N.A ac -- '0 '
UJ00 0 0 - 013 0 0 a 6 0 S
0 'A' 0 0 0 1 0 . 0 D
Lo0-)nI OL 0 -.0 0-00~0 00 000 00 0oo
-4O00 C ) O 00 00 00O
r* 0 0 oo 00 cc 0-o r o VA ?*1 0m 0 0 0 07 N 0'15 0 o M N& 0
00 0 0 0 0
00) 0 0
NN L00' N 00 0 6m o 0 ON. 0 ^0v N
000 0 0 so 0 or.0 o 0 es 00 It a0 0 0 0 0 00 a - 0 0 - -4 0 0 0 0o
Oze3 00 - 000 0 00 00-" 0 0
o-i.4. CD ri 000 0 P 4
oLPa 0 n No 0 0 0N 000 4 .0 440 000 400 0,1- 000 o
0e 0US 0 "s 0 5 00
::y 0 N NLNoO- 000~~ OCD.tO 0;~ 944 NtO
-,a 0004 * 0 0 * 0 00 N 0000 N 0000Li,0 00 0 0 0
0l ll 0 0 00
.1.~ o It
a0 X. so. :L. *.. ug .

. 0 00
I' S 0 M 0 ^
0 0n 84
0 moci 0 0n 0 l 0DN% 00 -O -3 I0 001.0 I 0 1,3n0'No
LU . 0 0 0 00,0 -40v
010 " 'l dt 0n 0 0~l. t 'n j 0 ,
Nm o 0 0 ' 0-4 i 0P "0 - '0"n0 . -0
I- co -4' -0 sa "3 L v.t a- nON*. LOI n 0 :z ~ 0 O 0 . 0 -0
n e44o 44 0 :,, 0 4 0 e 0 4
-4 -4 o~ 00 . 4- 0o ^j 0 0
Q 0 0Q 00
000 X 'a ... -U 6w0 -- j%!%.s O -
10 X 00 x 1 X

c - U
cc - C
z L
ID
LjJ
3 0
ce 0
00
1

-d%
... UNC
0 *0 -4
c 0 0
LM NN W mi -
_4 0 O
2mr) 0 1-
CIO cc N--
a4 -4 0
N~~~r 0 13 S N
..10 0 a s0
.. .d -4 -4 t0 10 101 00 ?I. 0M
r.j-, C5 0 0 n 0 - 0- -'
0 0 0 '
0',.
C,3~ ?'. O0'0 1, n -4 C) ID -40 '0
Lm .0%"D (n In00 "NJ N, 40 0%) P.." -3-11 -It :1 0 ?'
a a 0 N :> %0 1 000 I
-4 0000- C 0 NN.4 7 V'0 C 3" CN 3 -44- ~ '
I% J 0 0i
SIAIN 0ONI 00M MH0 0 ~N~

I-
cc
3" ccujz ctc nib z
~AJ cr
00
,.0~
10~
NO*)

'm 0 N Pei
0 e .
'0 -
2pL 41 %. 0--j
LU zr cc 0~ -4 -47 L0 -
1. wL - 4 i
moz '0k0
x0C 00 A 00
-t -U.-4Air
4m -r 0 0^
LALA N4 0.M -4 '0 4L/
0 * 00 . -- 4 0 ONd * 0 *0
0 v - '0 0 -
ILN 000 ' ' r -
-")4- 0 '4-0 'j 00% -n C00 - 000 1+,NJ .7 Ite 10s e .0 con 0 - 11 Ono
9 00 0 0 0 " 0 4+0 6 00 1- 00IP0 * 13 00 .:00 0 c 0 0 00 0
W) "r * IO ^. F. 34 " r- 4N L^'*0. n' 0U0') -.t? .'f% 0'.-.- pnf' IVN -4 0~~N 9N -4r0 v I-.70.0 0'o - 0 0
0 1% e~. ~ ee 0ge00 v4 seeo '4 0 w 0 em. C0
Yj NOCO -. 00 10 =)0 * -400 1-1 000. 0 000 NJ
00 0 0 0 0
0 -! 01 0 .
~N.4 4On
N4 W -W tN N~ .4N -.7 OC

L' . ' L
u - 0 C 0 -4
0: TLj P-j -4 LA It
LU O o 0 -4 1
C W Nl z N. 10
Z: cZ N.0' 0 0
01 CD.
4 LPN LA N.4 LA
rLU 00 N. 04. N 0 0- tejI
0 0 0 0 0 a4
'C aA 00 N NPA~~- 1-N40-4 A' 0LA N ~ .N
-~~~: - 10 f.N -L C A4 -oo0: L1 Co NJ S r P'J S LA O 0 N
0 ~ ~ ~ L 0 AN *0 00 00 000
VIN r..P N4 '0\ e.4 CN.- N Arj11 -4o IN
ON )N PA I -4' L 100 N. i= C -44 VN PA00&
N N -
N. '.-44 N' V1. ' -.7l NO.3 -4c N0- C) N.'C N
'rkr 00 = '0 0 4
0~C n0 000
-. W
A 0 WIN 03 Oa4
?"ALA0-4N
- 0'0'0 ' .2N.-7 .0 -PL 0 0 '40.4 N~'0"~ '
~~~~j~~w WN N.U-7-.LNf' 7 N.t 9 000 ~ )0A '55 . @ ' e s N e . s c 0 S . P
CC Z WCN
:1- ac N PollP'
-JR
~~1 No .
o 7 vl9 VoN Li l- r~
r4' - 4 toi -' " "-5 :10 a. 0' 9 4 -
-j0,3~ -4 o. nN
f:: "N N. N 40"0~- 0N 0 N0
CD C3 CD -4 0 40 '0 -
f~ o 0 0 * f - *"
0~ '.6
-44 40~P
00. N I ' . '9N f0 fV.' Lm C) \J
N. c "' ~ * 6 u c c 9 c c '~s .IV
'6 0 0 *.-4-e * .9 9 *.-Nr .-4
0 0 '~ '-3
'.A .N
z)~~k0 LN 9 > J 9 n~0 N .NN 9j'

m -r 0
LW NJ 4.-
~ Z km ev0
U~~~ VI. IIN
z L? 0 '0 -~
'- N "p s- Mw a a D
IN Ir 0 1c m-4 11
01 Cl ' f' " e- 1 Q -( N ,Q 4 N 0 In -1 "-- 0D -a N0 CD0 N 4-4 N N N
n N. LIN )o fn N1 0 .'o 4: N .* " -^ " 6 00j an 00 L^ 0 0r 0 1
0 0 0
P-N C). v. 0 0 Ne 4 C0 ?\j -44 -i'n
0AI N. 0 -10 * f,-i t^ = 00 ,-
,'' 1t '4 -1) -D -4 -o* 4- N.-4t.
'0, *SS 0, 10n -I *.Z C', N* * 0 e
0 f0 a -4
7v) C CDC)C 0 0
0 a 0 0 N
ri'p -,p 'N ~ N N ' *',.-'.Ae.. 0 -..
-. 0 D O ~ 'O .. . O ~ 0 ~ -AC'

n W! L5 L^
C - -M --
LI
u0 10 If ' -
~t 30 WIN - '
L-J~~IN IQ0--
INT r-. -00 0 V ON N
-4 I.44 0A - , '0 -.
40 N. IA
S SC 0 0
IN - '.t 'r-1 o1.0It rN-1 ^N
a psI aN 0 aN
0 0 0 0 0
0 a 0 0 4
1 ON .- 'O N-0
' 'O .0 IAIA~ ~O -WNIN '' "'4-4. -4 *~~N ---
'.0~0 ' ~ %JNJ A NN N 00 -4. ~ J ~ 00 -
0 ~ ~~~~~~~~ 0s. 0 S. N ss N o.*0 * o-~~~~ C0 '0) 0 0 * 0 0 * 0 0
2-4

VI 0 NDN
CK --P
C a f
WN "NJ N
-)- _0 040
V N -73 ID 1-
2:N 0,0 ^I
0- - 40
-N 'nN
-4 r4. -. 4 Ni -1i
- ~ A . - -, NI -I a -' NN I a -DC a
N. I N3
u-, ./ N 404-4 I 4 C ~p N.'~ , /S N

0 04
N AP0 0
0 N
N.0
c D
3 -o -n
L" -75 'C'
00
r ~~~N -,I0N-
L~U4 -T
u L6

LAwZ OZ -,0
~ 10 10C
ar
~~NJ N
00 - r 0 N 10 a01
C~o 0 =40 a 0 0 *y :D 0 0 444
o 0 -A N'.,- 0C,.o
% ~~~~~N N N '4 '0-
** '* - lj In -9 *0l r0 S,, "N 10 Ile, 0
0~~~ r ~
0 ~ ~ ~ ~ ~ C N- N CN '. O.*q~~~~l 1%j 1"% . a 0*. N-'N rl r 0 0 0 ao
- - , 0~ -~ C
0' 0 jN . .,w

L
~
~
~
~
1*
z
C
w *
o 0
4
z -'*' -c
- -' .
, .

4c N 0 0'
~40 a 0a
-to
'0 0 0 C0 0 ' 0
-N 02: N (\ C~ -4 no0
0l" N- -' 0r-'. -, 0 C -
Z3 0 0 - 0 00 Z)
-; -0 -4 - 1 "' C)
-- 0 N )1 C Dr - N nC
c u-, CD
0 a . =? 0
13 co t a n C 3 a1o Cl .m --, C C *C * * C * C0
C C C CvA
CD -o--' 0~-17j C-t-D- N ~ ~ O -
NN N C C C N ~ C -4 ~ ~ -
N S. N ~ a S C a. ~ a C 7a -
CC SXIN MOUNI 90A3 IC a a CC * CC

F o NZ 0 - N 0.a -JM 0a1
=O 0 0'
ne c ze
~~r~ ZuD '0 -rP. N
0~ 0- LIN - 0
13 :
0 N. - a 0 0 ~ 4
.0 -,r u' - 0 (n
In 0 0 0 -, -0 0 0
't DC. -) 0 0I
.- 4 0J -4-40
fn -7 C3 0 0 :DD 0 -
0 L,% -4 '-4 -, r. .- 4 N 0
.30 0 r3
77, * ~ ~ ~ .N

"9 '00 "9
3 0r 'D
It 10 z 40o- 10 00 0r a
I-3 0 0 0Q 0 0M
0 1-)j CD ^D N -4" -: )00 ) -M)C
LA a 0 0Da*a10* - 0 aC) 0 -- S !n 0 1-0 :
-It 11 00 0 0 0
10 1&J -N MA -4 ) '04" F.N.IlID In 0 5 0C 1 , 0-. o C DI
41 a 0 0 -3 0 0 -Mr - a 9 0 CD S C 0 0 -
Y N 0W C 0 - 0 0
(43 0: -D -4 7) 0 ,44 0 CD Nr . .0 D 0000
n 0 0 0 0 C
^1 -j C40 0 -5
0~~ -; .0 -. J'1N 0 , , SIn ID r) 0r 0 . N4 . 0*
0 0 0 0 9
Z0 - 0 0D 0
j2V0
Z0 " ~ .~'' 70 0 - -~
.00 M 0 .4~' 00 ~ 00 0 00o ~ r "3 0E 1-n6 5 *g

oZu N. fieS
b- 3 w M N 0CD
Cc~ Lj LN ccN
cl.J z fN '-
cm 01 0 cm 0
00
z
Z 4D. N- J' N. l
JJ ~ -0 0N~0 . .CD C- D 0C 0 -0
15ON N TNl*j j-4
-1- 0 .4 \1 "" % L^ I. It -j NiC0 In 1-5 0 f 4
-,4 0 0 CD * 0 .c'0 0 on C"0
A" Iv -A- -4.*-'l 11 'Du" 4!5, -110= -0 C00 C-4 't L^ -) CD 0
N a 0 9 I 0 * 0 a * -4 N * 0 N
-4 0-' e* 00 p" ?,- :"r mi *- N0 -4 00 "
* -.- 0 0 9 0
$0 -D0 a~N CD J 0
~~ *4 fN jI -. u- t N NN \
0 @0e 0 *0 0 a . I0 o. * 0 * 0a
0 0 0 0 C "'
- ~ ~ -4r.- n'. ell, ~ C) (7)N~.4 - N .' '' *
-c0 -O 000) =) '- 0 N- (-1-4 a 0,00
-D 7- .0 1 0 0 -1
~ 0 -4-CN '0 N~~'A -4. N'N.C N .-i7 ht'
oo-z0 0 -00 ' -Q.4 .4 0 0z''-
0 -. e~. 0 * O 0 g .. moo - ~ eo *. 7"~ 3 000 * 0 00 00 0 * * 000 00004
F Alp
D0
z (0 z --0
Js~ ~4 ~ . O' 0 .4(0.".. *.a.fn

fC. -4-
00 0 0 0 0 D
A'o
CD 2tL 09 C
0 010
F- N~ V) - 0 0
-'I0 0 V) 0 P% -
0 0 M
N 0 :;pN
-7 0 0
0 41 Lt 00
all v%

0~1 P..CC
I-. 000000
~ ZLJ .6 '74
NNJ~ 0O N In
--I 'I nn~~ a 0 0 0
a: 00 0 0 0 0
c Z) 00 ~ 0 0i 000
.4 .4- 0- '.0
0 00 0 0
:D CD 1") :Do 0
0- -N W) -4- C 0c 0
a 0 . 0 0 1-
0 0 .
IA r'O-Dr-'

3r 0 0
-j w 0 0=
ow no S SS
t- C N N
ce 0 0 0D a
z --r U0 04
I-D -p 0 0 0~ F" 0 "
9 0 a 0 " 0 0
Z~On -- 4 N0C
~ NN -NJ VN41 0 0 0_* 0
0 = 0 0 0 0
-n -; O 0 N n I'D 0 0 )0
-to o'0 --
I ','en 0 0 0 I' I,
02303 ID 74-,4 ' 3'j 3 '.44 N .44 - O
ooo ~ ~ ~ ~ ~ ~ ~ ~ ' 0 o - o o-m '0 0 .. 0'3 ~ ~ ~ ~ ~ ~ ~ ~ ~ l C).0 .** 0 * 0 e 0 **.*
000 000 * 00 * 0 0 * oO * 000
0 0 0 0 0 06N'~ 330

o9 aw 9 S= - 0X 0 00 0~
Of 0- -0
cc 0 0 0~
cc
711
IDJ 0 D 0 C) - 0 -
~0 -4 :D ID 0- =!: 0 C
0 ~ ~ ~ ~ ~ C 7 0 *0 *A 0 0 0 0D

r u
23w
x-Z

UnclassifiedSECURITY CLASSIFICATION OF THIS PAGE (When Dees Entered)
REPORT DOCUMENTATION PAGE READ INSTRUCTIONSBEFORE COMPLETING FORM
I REPORT NUMBER2 GOVT ACCESSION NO. 3. RECIPIENT'S CATALOG NUMBER
CCS 595
4 TITLE (An"d Subtle) 5. TYPE OF REPORT & PERIOD COVEREDMEASURING THE IMPACT OF NATIONAL ADVERTISING
ON RECRUITING BY DATA ENVELOPMENT ANALYSIS Final
METHODS 6 PERFORMING ORG. REPORT NUMBER
7. AuTHOR(*) B. CONTRACT OR GRANT NUMBER(e)
A. Charnes, W.W. Cooper, B. Golany, B. Kirby,J. McGahan, J. Semple, D. Thomas N00014-86-C-0398
9 PERFORMING ORGANIZATION NAME AND ADDRESS 10. PROGRAM ELEMENT. PROJECT. TASK
AREA & WORK UNIT NUMBERS
Center for Cybernetic StudiesThe University of Texas at Austin
Austin, Texas 78712-1177CONTROLLING OFFICE NAME AND ADDRESS 12. REPORT DATE
Office of Naval Research (Code 434) February 1988Washington, D.C. 13 NUMBER OF PAGES
6614 MONITORING AGENCY NAME A ADRESS(It dif$eorot from Controlling Office) 1. SECURITY CLASS. (of thll IePol)
Unclassified
15.. DECLASSIFICATION DOWNGRADINGSCHEDULE
16 DISTRIBUTION STATEMENT 'of this Report)
This document has been approved for public release and sale; itsdistribution is unlimited.
17 OISTRIBU'rON STATEM.ENT 'c the .btlect -nr..d In Block 20. i dlIerent fIo,- Report)
18 SUPPLEMENTARY NOT
ES
19 K EY WORDS (Conln.. on I--er.e tde Itf nec e.. end IdentIfy by block n.mbet)
Data Envelopment Analysis (DEA) Sensitivity AnalysisAdvertising Effectiveness U.S. Army Recruiting CommandRecruitingSevcAdrtsnResource Allocation Service AdvertisingJoint Advertising Mix ExperimentJ
20 ABSTR ACT (Conrnue on revrese Ide It noce...e& end Identify by block number)
Empirical Pareto-Efficient Production Function means to assess the impact
of advertising in U.S. Army Recruiting are developed utilizing Data EnvelopmeniAnalysis (DEA). Results show that service specific advertising is "moreeffective" in "producing" high quality army contracts. These resultscorroborate earlier findings by the authors based on DEA that address thejoint vs. service specific advertising issue.
DD ,ANk, 1473 EDITION O' INOV S, 1S OBSOLETE UnclassifiedS/N 0102-014- 6601 ,
SECURITY CLASSIFICATION OF THIS PAGE (When Does Entered)