Embed Size (px)
Citation preview

Copyright copy2014 by International Journal of Sales Retailing and Marketing Vol 3 No 1 2014
IJSRM
EDITORS Mirko Palić PhD ndash Editor in Chief Marketing Department Faculty of Economics and Business University of Zagreb Croatia mpalicefzghr Professor Claudio Vignali PhD ndash Editor for the UK Professor of Retail Marketing Management Leeds Metropolitan University UK cvignalileedsmetacuk Professor Bernd Hallier PhD ndash Editor for Western Europe Managing Director of EHI Retail Institute President of The European Retail Academy pasternakehiorg Professor John L Stanton PhD ndash Editor for the USA Professor and Chairman of the Food Marketing Department St Josephrsquos University Philadelphia jstanton123319comcastnet Prof Dr Laetitia Radder DComm ndash Editor for Africa amp Asia Professor of Marketing Nelson Mandela Metropolitan University South Africa LaetitiaRaddernmmuacza
wwwijsrmcom ISSN 2045-810X
International Journal of Sales Retailing and Marketing is published by Access Press UK 1 Hilllside Gardens Darwen Lancashire BB3 2NJ United Kingdom Technical assistant Lea Lisnski
Copyright copy2014 by International Journal of Sales Retailing and Marketing Vol 3 No 1 2014
IJSRM
EDITORIAL BOARD
Barry Davies University of Gloucestershire UK bdaviesglosacuk Maria Pollard University of Falmouth UK mariajemiczfalmouthacuk Graham Orange Coventry UK gorange0153gmailcom S Henderson Leeds Met University UK shendersonleedsmetacuk Bernd Britzlemaier Pforzheim University DE berndbritzlemaierde Leo Dana The University of Canterbury NZ professordanahotmailcom Hans Rudiger Kaufmann University of Nicosia kaufmannrunicaccy Dominique Roland Gerber Chur University DE dominiquerolandgerberhtwchurch Gianpaolo Basile University of Salerno IT gibasileunisait Tomasz Wisniewski Szczecin University PL twisniewskiplgmailcom Juergen Polke Gloucestershire University polkegbscocom Enrico Bonetti University of Naples IT enricobonettiunina2it Gianpaolo Vignali Manchester University UK gianpaolovignalimanchesteracuk David Pollard Leeds Met University UK djpollardleedsmetacuk Marko Grunhagen Eastern Illinois Univ USA mgrunhageneiuedu George Lodorfos Leeds Met University UK Glodorfosleedsmetacuk
Iga Rudawska University Szczecin Poland igitawneizpl Aftab Dean Leeds Met University adeanleedsmetacuk Martin Samy Leeds Met University UK masamyleedsmetacuk Edyta Rudawska Szczecin University Poland edytarudawskapl Krešimir Žnidar Prizma Zagreb Croatia kresimirznidarprizmacpihr Daniela Ryding UCLAN UK dmrydinguclanacuk John Peters Leeds UK johnpetersgsresearchcom Paul Elmer UCLAN UK PElmer1uclanacuk Katarzyna Byrka-Kita Szczecin University Poland kbyrka-kitawneizpl Antonio Feraco Nan yang University Singapore Antonioferacogmailcom Vitor Ambrosio ESHTE Portugal vitorambrosioeshtept Ivan Kovač Croatian Bureau of Statistics kovacidzshr Sanda Renko Faculty of Economics and Business Zagreb CRO srenkoefzghr Razaq Raj Leeds Met University UK rrajleedsmetacuk Tahir Rashid Salford University UK trashidsalfordacuk
Copyright copy2014 by International Journal of Sales Retailing and Marketing Vol 3 No 1 2014
IJSRM
Subscription Fees 2013 subscriptions are available in a number of major currencies Exchange rates and prices will be held throughout 2013 Subscription fees per volume are $US 300 poundStg 150 $Aus 370 euro 210 SFr 345 yen 33740 Individual journal editions can be purchased at the following prices 10 Journals pound15 per journal 20 Journals pound10 per journal 50 Journals pound7 per journal Subscription information is available from the Publishers at Access Press UK 1 Hilllside Gardens Darwen Lancashire BB3 2NJ UK +447815737243 Reproduction Rights The publishers of the International Journal of Sales Retailing and Marketing have granted free of charge unlimited photocopying and other reproduction rights to subscribers for teaching and study use within the subscribing organization Authors may also photocopy or otherwise reproduce their particular case from The International Journal Sales Retailing and Marketing subject to an acknowledgement of publication and copyright details
Copyright copy2014 by International Journal of Sales Retailing and Marketing Vol 3 No 1 2014
1 Contents
Contents
Contents
Editorial 2
STUDY OF IMPACT OF BRAND IMAGE OF RETAILERS ON CUSTOMERS BUYING DECISION OF STORE
BRANDS 3
Sonal Gupta Rajendra Jain amp Varun Parmal
IMPACT OF RETAIL STORE CHARACTERISTICS ON CONSUMER PURCHASE INTENTION 11
Hafiz Ihsan-ur-Rehman Muhammad Ashar Bakhtawar Javed Mayda Khalid amp Rabia Nawaz
DERIVING CUSTOMER SATISFACTION AND LOYALTY FROM ORGANIZED RETAILERrsquoS SALES
PROMOTION ACTIVITIES IN INDIA 21
Kirti Dutta amp Swati Singh
IMPACT OF RISK FACTORS RELATED TO INTERNET BANKING WITH SPECIAL REFERENCE TO NATIONAL
CAPITAL REGION 34
Shamsul Haq Pawan Kumar amp Bilal Mustafa Khan
SURVIVING OR THRIVING AN EXPLORATORY STUDY INTO COMPETING FOR THE SOUTH AFRICAN
SUPERMARKET SHOPPER 45
Justin Beneke
THE ICT EFFECTS AND THE SWITCHING COSTS IN THE RELATIONAL VARIABLES AN APPLICATION IN
RETAIL TRADE OF GREECE AND SPAIN 61
Irene Gil-Saura Konstantinos-Faidon Sylvestros amp Beatriz Moliner Velazquez
DIGITAL MEDIA amp POLITICAL MARKETING IN ALBANIA 72
Orjona Fjerza amp Vjollca Hysi (Panajoti)
Copyright copy2014 by International Journal of Sales Retailing and Marketing Vol 3 No 1 2014
2
Editorial
The current issue of
the International
Journal of Sales Retail
and Marketing
presents some
outstanding research
papers from all around
the world The journal
focuses on challenging
and complex area of retailing sales and
marketing in general Due to the increased
competition in those fields and changing
patterns of consumption this area is bound to
receive a lot of scientific and scholar attention in
the future There is a lot of space for
investigating and for offering implications and
strategic decisions to retailers and to all those
who are involved in this business
Current issue of the journal is dedicated to
seven research papers of high academic quality
written by academics from India South Africa
Albania Greece and Spain
The articles cover the core theories empirical
researches essential research tools expanding
the existing knowledge base about topics in
retailing sales and marketing and we hope that
they will be read and cited in the future
investigations and relieves dealing with this area
Thank you for following the IJSRM and we wish
you an enjoyable reading
Drsc Mirko Palić
Editor
3 STUDY OF IMPACT OF BRAND IMAGE OF RETAILERS ON CUSTOMERS BUYING DECISION OF STORE BRANDS
Copyright copy2014 by International Journal of Sales Retailing and Marketing Vol 3 No 1 2014
STUDY OF IMPACT OF BRAND IMAGE OF RETAILERS
ON CUSTOMERS BUYING DECISION OF STORE
BRANDS
Sonal Gupta Rajendra Jain amp Varun Parmal
Abstract
This research paper is an attempt to find out the impact of brand image of retailers on customersrsquo
decision whether to buy the store brands The purpose of this study is also to examine how the brand
image of retailers affects the perceived quality and perceived risk of store brands and ultimately the
customersrsquo buying decision of store brands Convenience sampling technique was used to collect
responses from 100 customers through mall intercept method using structured questionnaire as
research instrument This study reveals that brand image of retailer has significant impact on buying
decision of customers Study also suggests that brand image of retailer has significant impact on
perceived quality and perceived risk of buying store brands
Keywords Store Brands Store Image Buying Decision Perceived Quality Perceived Risk
INTRODUCTION
In India the growth of organized retailing results
into the growth of store brands which are also
called as private labels The performance of
store brands in India is quite reckonable There
is an increasing acceptance for private labels in
India According to Global Private Label
Consumer Study by ACNielsen (2005) 56 of
their survey respondents in India considered
private labels to be good alternatives to
manufacturersrsquo brands The growth of store
brands in India presents an interesting
opportunity for the retailer to understand the
motivations of consumers behind choice of
private label brands According to Images Retail
Report (2009) as quoted in Indian Retail Time
to Change Lanes by KPMG private label brands
constitute 10-12 of organized retail in India
Retailers had taken all the steps to enhance the
image of store brands They had repositioned
the private labels in such a way that they
occupy their own identity in competitive
market
Store image is the set of consumer perceptions
of a store based on different attributes
including service selection convenience store
atmosphere and quality Bloemer amp Ruyter
(1997) Store image refers to a consumers
global impression of a retail store Store image
offers recognition familiarity confidence and
other associations that make it easier for
consumers to make the decision to try the
product
In this situation it has become important to
build strong brand image among customers
Reda (2002) Collins-Dodd and Lindley (2003)
and Dhar and Hoch (1997) stated that store
image influences the private labelsrsquo brand
image Positive store image is a key asset for
retailers to achieve and sustain success in an
Dr Sonal Gupta is Associate Professor at Sanghvi
Innovative Academy Devi Ahilya Vishwavidyalaya
Indore India
(email sonalgupta519gmailcom)
Dr Rajendra Jain is Professor and Director of
Govindram Seksaria Institute of Management and
Research Devi Ahilya VishwavidyalayaIndore India
Varun Parmal is Assistant Professor at Sanghvi
Innovative Academy Devi Ahilya Vishwavidyalaya
Indore India
4 STUDY OF IMPACT OF BRAND IMAGE OF RETAILERS ON CUSTOMERS BUYING DECISION OF STORE BRANDS
Copyright copy2014 by International Journal of Sales Retailing and Marketing Vol 3 No 1 2014
increasingly competitive marketplace (Grewal
et al 1998) According to Livesey and Lennon
(1978) possible reasons for perception
differences are experience with store brands
heterogeneous response to marketing
activities different product needs perceived
risk and category importance among
consumers
Building a strong and successful store brand is
one of the important challenges in front of
retailers Consumers buying behaviors are
considerably influenced by the image of retailer
for buying store brands In this regard in the
current study role of brand image of retailer on
buying decision of customers is examined
Rationale
As more and more organized retail chains are
emerging in Indian market each every retailer
is trying to build up their image in the market
With the growth of these chains acceptance of
store brands is also increased in the market In
this scenario image of retailer creates an impact
on store brands There are very limited
researches available regarding store brands in
India The current researches on private labels
are conducted mostly in countries where store
brands are well established Most of the
researches conducted on corporate image and
customerrsquos decision of buying national brands
but there is dearth in researches on image of
retailer and store brands In response to the
concerns raised above this study is undertaken
to understand the influence of retailersrsquo brand
image on customer decision of buying store
brands This study will open the doors for the
new research area and will also help the
retailers to successfully develop an effective
strategy for store brands
Objectives
1 To study the role of brand image of
retailer on customersrsquo buying decision
of store brands
2 To study the affect of brand image of
retailer on perceived quality of store
brands
3 To study the affect of brand image of
retailer on perceived risk in buying
store brands
Hypotheses
H01 Brand image of retailer do not play any
significant role on customersrsquo buying
decision of store brands
H02 Brand image of retailer do not have
significant affect on the perceived quality of
store brands
H03 Brand image of retailer do not have
significant affect on the perceived risk in
buying store brands
LITERATURE REVIEW
Private Labels have long been considered an
important aspect of the retail industry both as
a strategic tool for retailers and a unique source
of competition for manufacturers (Batra and
Sinha 2000 Bellizzi et al 1981) Retailersrsquo
Brand also play a major role in improving stores
profitability (Ailawadi and Harlam 2004) their
differentiation strategy toward competing
stores (Davies 1990) as well as their consumer
attraction and loyalty-building capacity
(Corstjens and Lal 2000) Moreover a
consumer who is loyal to a retailer brand will
have a more favorable perception of the overall
retailer brand (de Wulf et al 2005) Consumers
who are loyal to a specific retailer brand are
likely to be more loyal to the store (Uncles and
Ellis 1989 Steenkamp and Dekimpe 1997)
Collins-Dodd and Lindley (2003) stated that the
store brands are seen as extensions of the store
image and can therefore contribute to store
differentiation in the minds of consumers
Results showed that store brands were rated
most highly by those who shopped most at
each store which may be explained by greater
experience or familiarity Bao et al (2010)
5 STUDY OF IMPACT OF BRAND IMAGE OF RETAILERS ON CUSTOMERS BUYING DECISION OF STORE BRANDS
Copyright copy2014 by International Journal of Sales Retailing and Marketing Vol 3 No 1 2014
focused on the role of intangible extrinsic cues
including store image product signatureness
and quality variation in a product category
Study suggested that private brands of different
stores are differentiated on store images and
exhibit differential quality perception and
purchase intention Richardson Dick and Jain
(1994) demonstrated the role of store
aesthetics in the formation of perceptions of
store brand quality Results showed that store
aesthetics can increase the evaluation of the
quality of store brands Martenson (2007)
showed ldquoStore as a Brandrdquo that is how retailers
perform their job is more important than that
the store offers store brands for customer
satisfaction It was found that customers are
satisfied when the store is neat and pleasant
and when they feel that the store understands
their needs Narasimhan and Wilcox (1998)
suggested that private labels not supported by
consumer advertising by the manufacturers of
these products can be supported by in-store
merchandising by the retailers Vahie and
Paswan (2006) focused on the relationship
between perceived private label brand (PLB)
image and perceived store image (SI) and
feeling associated with the presence of national
brand (NB) Two factors SI-quality and NBSI
national brand and store image (NBSI)-
congruence influence both the quality and
affective dimensions of consumer perception of
private label brand
Dick Jain and Richardson (1995) documented
perceived risk as an important factor in store
brand purchasing behavior Dunn Murphy and
Skelly (1986) found that consumers regard
private label brands as most risky on
performance measures compared to national
brands Researchers suggested that private
label brands are least risky on financial
measures however social risk is less important
for supermarket products generally Liljander et
al (2009) suggested that store image mitigate
the perceived psychosocial risk Both
dimensions of store image atmosphere and
quality negatively affect consumersrsquo perceived
risk Six main risk dimensions have been
proposed to explain consumersrsquo choice
behavior performance financial social
psychological and physical risk Jacoby and
Kaplan (1972) as well as time or convenience
risk Erdem Zhao and Valenzuela (2004) found
that in countries such as the UK private label
brands share is affected by greater risk reduced
price-quality evaluations and lower brand
loyalty
dAstous and Saint-Louis (2005) stated that
consumer evaluations of store brands and
national brands were influenced by the joint
effects of store image and intended usage
situation It was found that consumer
preferences for branded garments result from
the interplay of store image and purchase
motivation Porter and Claycomb (1997)
investigated the relationship between brand
characteristics - awareness level and image and
their influence on consumersrsquo perceptions of
retail image They proposed a model of
relationships between the number of
recognizable brands carried by a retail
establishment the presence or absence of an
anchor brand and perceptions of retail image
Findings indicated that brand image did
significantly influence overall retail store image
Binninger (2008) analyzed that the
improvement of consumer satisfaction with
some particular retailer brands has an impact
on building loyalty to those brands The results
showed that the increase in retailer brands
satisfaction and loyalty influences store loyalty
and that attitude toward retailer brands
products has a moderating effect on the
relationships between retailer brands
satisfaction and loyalty De Wulf Odekerken-
Schroder Goedertier and Van Ossel (2005)
found that for three out of four store brands
brand equity is present when consumers are
loyal to the store carrying the store brand It
was observed that retailers engage much more
6 STUDY OF IMPACT OF BRAND IMAGE OF RETAILERS ON CUSTOMERS BUYING DECISION OF STORE BRANDS
Copyright copy2014 by International Journal of Sales Retailing and Marketing Vol 3 No 1 2014
in experience marketing in comparison to
manufacturers who rely on traditional mass
media Study indicated that private label is part
of the total store experience and helps to build
the store brand
RESEARCH METHODOLOGY
The methodology for the study is quantitative in
nature The present research was carried out
through mall intercept interviews at selected
retail chains in Madhya Pradesh A non-
probability convenience sampling technique
was used to administer a consumer survey A
total of 150 questionnaires were administered
responses to 135 were received Out of the
collected 135 questionnaires 100 were found
to be fit for analysis
Data were collected with the help of structured
questionnaire as a research instrument
Questionnaire was based on 5 point likert scale
anchored between Strongly Disagree to
Strongly Agree
Reliability and validity test
Split half reliability was calculated to check the
reliability and found to be 76 which is high
Validity is checked by face validity and content
validity by the help of experts
Data analysis
1 Role of brand image of retailer in buying
decision of customers for store brands
The first objective of the study was to study the
role of brand image of retailer on buying
decision of customers For this Chi Square test
was applied the results are given in the Table
No1
Table No 1 Chi-Square for role of brand image of retailer on customersrsquo buying decision of
store brands
(a) 0 cells (0) have expected frequencies less than 5 The minimum expected cell frequency is
200
This table shows the test statistics all the
significance values are smaller than 005 at
001 level of significance with 4 degree of
freedom therefore the null hypothesis (H01)
ie Brand image of retailer do not play any
significant role on customersrsquo buying
decision of store brands is rejected Hence it
is concluded that brand image of retailersrsquo
plays significant role in purchase decision of
customers
1 Affect of brand image of retailer on
perceived quality of store brands
The second objective of the study was to study
the affect of brand image of retailer on
perceived quality of store brands For this Chi-
Square test was applied The results are given in
Table No2
I consider the
brand of retailer
before buying
store brands
I buy store
brands only from
retailers having
strong image in
the market
I am more
familiar with
store brands of
retailers who
has strong
branding
Strong brand
image of
retailer
increases my
intention of
buying store
brand
I would be
willing to pay a
higher price for
the private label
of retailers
having strong
image in market
Chi-Square(a) 20500 19800 27900 10000 14800
Df 4 4 4 4 4
Sig 000 001 000 040 005
7 STUDY OF IMPACT OF BRAND IMAGE OF RETAILERS ON CUSTOMERS BUYING DECISION OF STORE BRANDS
Copyright copy2014 by International Journal of Sales Retailing and Marketing Vol 3 No 1 2014
Table No 2 Chi-Square for affect of brand image of retailer on perceived quality of store
brands
Strong brand
image of
retailers
convince me
that store brand
is of good quality
Strong brand
image of
retailers
increase my
satisfaction level
about quality of
store brand
Retailer with
strong brand
image have
more variety of
store brands
Strong brand
image of
retailers
increases trust in
performance of
store brands
Store brands of
Retailers with
strong brand
gives value for
money
Chi-Square(a) 16400 19200 20500 21200 20000
Df 4 4 4 4 4
Sig 003 001 000 000 000
(a) 0 cells (0) have expected frequencies less than 5 The minimum expected cell frequency is
200
This table shows the test statistics all the
significance values are smaller than 005 at
001 level of significance with 4 degree of
freedom therefore the null hypothesis (H02)
ie Brand image of retailer do not have
significant affect on the perceived quality of
store brands is rejected Hence it is
concluded that brand image of retailers have
significant affect on perceived quality of
store brands
2 Affect of brand image of retailer on
perceived risk in buying store brands
The third objective of the study was to
study to study the affect of brand
image of retailer on perceived risk in
buying store brands For this Chi-
square test was applied The results
are given in Table No3
Table No 3 Chi-Square for affect of brand image of retailer on perceived risk in buying store
brands
Putting
money in
buying
store
brands of
retailers
with
strong
image is
worthy for
me
Store brands of
retailers with
strong band
image reduces
the risk of
financial loss in
buying the store
brand
Strong brand
image of
retailer
increases the
image of store
brand
Strong brand image of
retailer reduces the
risk of buying store
brand
Store brands of
retailers with
strong brand
image gives me
psychological
satisfaction of
buying it
I find buying store
brands of retailers
having strong image
in market is reflects
my image in society
Better After sales service
is provided with store
brands of retailers
having strong image in
the market
Chi-
Square(a) 28400 35400 9700 11900 20500 21700 20900
Df 4 4 4 4 4 4 4
Sig 000 000 046 018 000 000 000
(a) 0 cells (0) have expected frequencies less than 5 The minimum expected cell frequency is
200
The above table shows the test statistics all the
significance values are smaller than 005 at 001
level of significance with 4 degree of freedom
therefore the null hypothesis (H03) ie Brand
image of retailer do not have significant affect
8 STUDY OF IMPACT OF BRAND IMAGE OF RETAILERS ON CUSTOMERS BUYING DECISION OF STORE BRANDS
Copyright copy2014 by International Journal of Sales Retailing and Marketing Vol 3 No 1 2014
on the perceived risk in buying store brands is
rejected Hence it is concluded that brand
image of retailer have significant affect on
perceived risk in buying store brands
DISCUSSIONS AND CONCLUSION
Several studies demonstrate that retail store
image affects consumer product judgments and
responses in a positive manner Richardson et
al (1996) showed that if the store has an
attractive store atmosphere quality rating of
store brands increased by 21 percent Presents
research shows similarity in terms of how
retailersrsquo image create an impact on customersrsquo
buying decision of store brands with Collins-
Dodd and Lindley (2003) who stated that store
image influence specific store brand evaluations
and store brands are seen as extensions of the
store image and can therefore contribute to
store differentiation in the minds of consumers
and also with the work of Martenson (2007)
who suggested that there is a reciprocal
influence between store image and individual
store brand image the influence is stronger
from the store to the brand than in the
opposite direction In other words when
consumers have tried the store brand their
opinion about it will have a potential influence
on the store image but it is more likely that the
image of the store already influenced
consumers willingness to try the brand
Liljander et al (2009) suggested that store
image mitigate the perceived psychosocial risk
Both dimensions of store image atmosphere
and quality negatively affect consumersrsquo
perceived risk It was found that each
dimension of the store image affected different
dimensions of risk Present study also supports
these findings by suggesting that brand image
of retailer plays significant role on perceived
risk in buying store brands
Present study also reveals that store image
plays significant role on perceived quality of
store brands These findings are consistent with
the results of Vahie and Paswan (2006)
indicated that the store atmosphere and store
quality positively influence the perception of
private label brands quality and also with the
study of Semeijn et al (2004) who suggested
that the store image acts as an important
indicator of store brand quality
Implications
As private labels have become strategic tools to
create differentiation and increase the footfalls
this study will have important strategic
implications for retailers The findings of this
study will bring their focus on store image and
its impact on customers buying decisions of
store brands This study gives valuable insights
towards perceived quality and perceived risk of
store brands Retailers should put efforts to
chalk out effective strategy for improving their
brand image for the success of store brands
Scope and limitations
Since the scope of present study is limited to
Madhya Pradesh one of the states of India it
can be carried out at national and international
level The scope of present study can further be
expanded in the context of different
geographic demographic and socio-cultural
variables which could not be included in the
present study By considering the present
research as a base further research on private
labels can be carried out for studying the
impact of store image of a specific retail chain
on its store brands Retailers marketing
activities are increasing with the growth of
store brands and they are launching new store
brands in new categories Due to this research
can be extended to find out the best
management practices which should be
adopted by retailers for making their store
brands successful in the market
REFERENCES
ACNielsen (2005) The Power of Private Label
2005 A Review of Growth Trends around the
9 STUDY OF IMPACT OF BRAND IMAGE OF RETAILERS ON CUSTOMERS BUYING DECISION OF STORE BRANDS
Copyright copy2014 by International Journal of Sales Retailing and Marketing Vol 3 No 1 2014
World accessed June 2008 retrieved from
httpwww2acnielsencomreportsdocument
s2005_privatelabelpdf
Ailawadi K L amp Harlam B (2004) An Empirical
Analysis of the Determinants of Retail Margins
The Role of Store-Brand Share Journal of
Marketing 68 (January 2004) 147-165
Batra R amp Sinha I (2000) Consumer-level
factors moderating the success of private label
brands Journal of Retailing 76 175-191
Bao Y et al (2010) Motivating purchase of
private brands Effects of store image product
signatureness and quality variation Journal of
Business Research Article in Press
Bellizzi JA Kruckeberg HF Hamilton JR amp
Martin WS (1981) Consumer perceptions of
national private and generic brands Journal of
Retailing 57(4) 56-70
Binninger AS (2008) Exploring the
relationships between retail brands and
consumer store loyalty Journal of Product amp
Brand Management 36(2) 94-110
Bloemer J and Ruyter KD (1998) On the
Relationship between Store Image Store
Satisfaction and Store Loyalty European Journal
of Marketing 32 (56) 499-513
Corstjens M amp Lal R (2000)Building store
loyalty through store brands Journal of
Marketing Research 37 281-291
Collins-Dodd C amp Lindley T (2003) Store
brands and retail differentiation the influence
of store image and store brand attitude on
store own brand perceptions Journal of
Retailing and Consumer Services 10(6) 345-
353
dAstous A amp Saint-Louis O (2005) National
versus store brand effects on consumer
evaluation of a garment Journal of Fashion
Marketing and Management 9(3) 306-317
Davies G (1990) Marketing to retailers a
battle for distribution Long Range Planning
23(6) 101-108
De Wulf K Odekerken-Schroder G
Goedertier F amp Van Ossel G (2005)
Consumer perceptions of store brands versus
national brands Journal of Consumer
Marketing 22(4) 223-232
Dhar SK amp Hoch SJ (1997) Why
store brand penetration varies by retailer
Marketing Science 16(3) 208-227
Dick A Jain A amp Richardson P (1995)
Correlates of store brand proneness some
empirical observations Journal of Product amp
Brand Management 4 (4) 15-22
Dunn MG Murphy PE amp Skelly GU (1986)
Research note the influence of perceived risk
on brand preference for supermarket products
Journal of Retailing 62 (2) 204-216
Erdem T Zhao Y amp Valenzuela A (2004)
Performance of store brands a cross-country
analysis of consumer store-brand preferences
perceptions and risk Journal of Marketing
Research 41(1) 86-100
Grewal D Baker J Krishnan R amp Borin N
(1998) The effect of store name brand name
and price discounts on consumersrsquo evaluations
and purchase intentions Journal of Retailing
174(23) 331-352
Images Retail Report (2009) Indian Retail
quoted in Indian Retail Time to Change Lanes
by KPMG accessed March 2010 retrieved
from
httpwwwkpmgcomCNenIssuesAndInsight
sArticlesPublicationsDocumentsindian_retail
_O_0904pdf
Jacoby J amp Kaplan L (1972) The components
of perceived risk Advances in Consumer
Research 1(1) 519-532
Liljander V etal (2009) Modelling consumer
responses to an apparel store brand Store
image as a risk reducer Journal of Retailing and
Consumer Services 16 (4) 281-290
Livesey F amp Lennon P (1978) Factors
affecting consumersrsquo choice between
manufacturer brands and retailer own labels
European Journal of Marketing 12 (2) 158-170
Martenson R (2007) Study of the store as a
brand store brands and manufacturer brands
International Journal of Retail amp Distribution
Management 35 (7) 544-555
10 STUDY OF IMPACT OF BRAND IMAGE OF RETAILERS ON CUSTOMERS BUYING DECISION OF STORE BRANDS
Copyright copy2014 by International Journal of Sales Retailing and Marketing Vol 3 No 1 2014
Narasimhan C amp Wilcox RT (1998) Private
labels and the channel relationship a cross-
category analysis The Journal of Business 71
(4) 573-600
Porter SS amp Claycomb C (1997) The
influence of brand recognition on retail store
image Journal of Product amp Brand
Management 6(6) 373-387
Reda S (2002) Department stores struggle to
reinvent troubled model Stores 84(7) 22
Richardson PS Dick AS amp Jain AK (1994)
Extrinsic and intrinsic cue effects on perceptions
of store brand quality Journal of Marketing
58(4) 28-36
Richardson PS Jain AK amp Dick AS (1996)
Household store brand proneness a
framework Journal of Retailing 72 (2) 159-
185
Semeijn van Rielb J A CR and Ambrosini A
B (2004) ldquoConsumer evaluations of store
brandseffects of store image and product
attributesrdquo Journal of Retailing and Consumer
Services 11 pp 247ndash258
Steenkamp JBEM amp Dekimpe MG (1997)
The increasing power of store brands building
loyalty and market share Long Range Planning
30 (6) 917-930
Uncles MD amp Ellis K (1989) The buying of
own-labels European Journal of Marketing 23
(3) 57-70
Vahie A amp Paswan A (2006) Private label
brand image its relationship with store image
and national brand International Journal of
Retail amp Distribution Management 34(1) 67-
84
11 IMPACT OF RETAIL STORE CHARACTERISTICS ON CONSUMER PURCHASE INTENTION
Copyright copy2014 by International Journal of Sales Retailing and Marketing Vol 3 No 1 2014
Hafiz Ihsan-ur-Rehman Muhammad Ashar Bakhtawar Javed Mayda Khalid amp Rabia Nawaz Department of Business Administration University of The Punjab Gujranwala Campus
IMPACT OF RETAIL STORE CHARACTERISTICS ON
CONSUMER PURCHASE INTENTION
Hafiz Ihsan-ur-Rehman Muhammad Ashar Bakhtawar Javed Mayda Khalid amp Rabia Nawaz
Abstract
Global retailers considering the Asian market as a most attractive play field for gaining profit
Through communication networks and mass media global corporate culture has been brought and
influencing the consumerrsquos habits by changing their life style and purchasing patterns The purpose of
this study is to investigate the extent to which store characteristics product assortment store
atmosphere location and Purchase intention would influence the Pakistani consumerrsquos store choice
To analyze the factors that influence consumerrsquos Purchase intention 200 questionnaires were
distributed among the general public out of which One hundred and eighty surveys were received
This study would help the retailers to increase their market share and profitability by providing
desirable store environment to their customers Retailers can use these store attributes to maintain
their existing customers and to attract new customers
INTRODUCTION
Global retailers have been consolidated and
strengthening their roots day by day in
developing countries and trying to improving
their operational performance for gaining
sustainable growth in Asian markets As Asian
markets have become most attractive play field
for global giants due to increase in purchasing
power of customers
The importance of the retailing is seldom
subject to work on it especially in developing
countries like Pakistan Through
communication networks and mass media
global corporate culture has been brought and
influencing the consumerrsquos habits by changing
their life style and purchasing patterns This
study finds out and analyzes the different
aspects of retail store which influence the
consumerrsquos purchase intention towards store
choice Those aspects are product assortment
store atmosphere location and purchase
intention
Product assortment means the availability of
merchandise under one roof which enables the
customer to avail the great width of different
global and local products and as well as provide
one stop shopping experience Store
atmospherics includes store design lighting
music wide aisle and odor All these
characteristics will generate a positive
assessment of the store
Store location has a deep effect on the
consumerrsquos retail store choice A most favorable
store-site can affect different demographic
factors such as age income gender and family
size For getting the competitive advantage
retailers must consider the distance that
customerrsquos willing to travel for shopping at the
store
Purchase intention is customer willingness to
make a purchase of a specific product or
service which can be influenced by product
assortment Store atmosphere and location
The purpose of this study is to investigate the
12 IMPACT OF RETAIL STORE CHARACTERISTICS ON CONSUMER PURCHASE INTENTION
Copyright copy2014 by International Journal of Sales Retailing and Marketing Vol 3 No 1 2014
extent to which these characteristics would
influence the Pakistani consumerrsquos store choice
LITERATURE REVIEW
Product Assortment
Now a day it is commonly said theory that most
of the customers like and have a preference to
large assortments and a large range of
products The likelihood of the selection of a
store typically and largely depends on store
size and its assortment size and is inversely
dependent on distance from home said in the
foundational theory of store choice (Reilly 1931
Huff 1964 see Hubbard 1978 and Brown1989
for reviews of this work Baumol and Idle 1956
makes a similar argument) Among all the store
image attributes only product assortment and
price place great variances in choices said by
Finn and Louviere (1996)
Availability of great breadth of different
products offered by a store has a great amount
of impact on consumerrsquos perception about
store and retail image Because availability
under one roof enables customer to avail many
advantages First the great the width of the
range the greater the number of different
situations under which a retailer is recalled and
is considered by the consumer as noted by the
Keller (2003) Secondly the one stop shopping
convenience that a broad product range
enables more important than ever for
consumers with limited time today (Messinger
and Narasimhan 1997) increasing pressures on
retailers to broaden their range
Also the depth of the retail assortment affects
so much on consumer store choice Variety
seeking consumers will perceive greater
convenience as the perceived assortment of
brands flavors and sizes increases (McAlister
and Pessemier 1982 Kahn and Wansink 2004)
consumers will believe they have more
elasticity in their choices who have vague future
preferences (Kahn and Lehmann 1991) and
there are more chances that those consumers
locate the item they desire Private brand
assortment is very much popular in many stores
also with manufacturesrsquo brand A motivation for
offering private labels is the highest percent
margins (Hoch and Banerji 1993) and second
the implicit assumption that providing a private
label brand generates loyalty to the
store(Steenkamp and Dekimpe 1997) Baumol
and Ide (1956) and Brown (1978) observed that
stores which offer more product assortment
for those consumers are willing to travel farther
to those stores than those which offer low
assortment Assortment is multidimensional ndash
Broniarczyk Hoyer and McAlister (1998)
determined that three factors affect
consumersrsquo perceptions of assortment in a
categorymdashthe amount of shelf space devoted
to the category and the number of SKUs and
the availability of the consumerrsquos favorite item
(note that the terms ldquoitemrdquo ldquoproductrdquo and
ldquoSKUsrdquo will be used interchangeably)
Hoch Bradlow and Wansink (1999) determined
that product attributes affect consumersrsquo
perceptions of an assortment Also in another
study it is examined that product attributes
style colors and SKUrsquos is counted in product
assortment (TerryJ) However the number of
brands and sizes are attributes that can be
applied sparingly across categories (Boatwright
and Nunes 2001) Here in this research we have
chosen following measures of category 1
Number of brands offered 2 Number of sizes
per brand 3 Style and colors 4 Availability of a
householdrsquos favorite brands 5 Private brand 6
Number of stock-keeping units projected
There has also been suggested that shoppers
can feel comfortable and feel extra activity
when you see a wide range and variety of items
and goods (Kahn Moore and Glazer 1987 see
also Broniarczyk Hoyer and McAlister 1998)
And finally large assortment also help shopper
and to increase sale and give surety of sale that
by seeing large assortment and a big range of
products shopper might prefer to purchase
from that store by minimizing the ambiguity of
that available assortment is not good enough
for selection and large assortment also
13 IMPACT OF RETAIL STORE CHARACTERISTICS ON CONSUMER PURCHASE INTENTION
Copyright copy2014 by International Journal of Sales Retailing and Marketing Vol 3 No 1 2014
eliminate the thinking of shopper that available
assortment is not envoy of all good brands or
products and might be another store have more
good variety of products available and shopper
think that heshe should go to other stores also
(Greenleaf and Lehmann 1995 Karni and
Schwartz 1977)
But there are some factors which favor in
reduced or decreased assortment It is the
limited space in the store As if we are saying
that increased assortment increase our sale but
it is constrained here that every retailer is
unable to increase store space and shelf space
As shelf space is limited and it increases the
chances of not as good product visibility as in
limited edition of goods This factor argues on
limited occupancy of the shelf by keeping
sufficient number of stock keeping units So
finally it is concluded that consumers and
competitors leads us to increase assortment but
shelf and store space leads us to reduce
product assortment(Cadenat 2003)
Atmosphere
For a very competitive market retailers can not
benefit from price product distribution and
promotion So retailers set it apart from others
through special characteristics of retail stores
As consumers buy instant action can be
affected by the environment kept Previous
studies focused solely on music and lighting
elements but this particular study many
aspects of store environment The results show
that the store staff and store design can
influence the shopping mood not music It is
also possible satisfaction affected by emotions
of shopping through mediating role of
consumption behavior Consumer experience of
positive emotions in the shop will generate a
positive assessment of the stock (Liao Liaw amp
Jen)
Some studies reveal that retail store music
experience stimulates the consumption level in
terms of behavioral cognitive and emotional
reactions visibility and attitude the money and
spending time in the shop as well The
consumer profile the profile store market
timing and environmental cues moderate the
impact of music on purchasing behavior (Jain amp
Bagdare 2011)
Slow-tempo music perceive positive service
quality and low arousing cues have mediating
effects on consumerrsquos perception but fast
tempo music and high arousing cues have
indirect effect on consumer perception (Michon
amp Chebat 2006)This study investigated the
effect of store atmosphere on consumer
expectations about the quality of products and
store image as a mediator either web-based
shop or a brick and mortar store Findings
support previous studies which have shown
that consumer purchase intentions can be
affected by store image and consumer
expectations (Oh Fiorito Cho amp Hofacker
2007)
Retail stores must utilize unproductive area by
providing wide aisle which facilitate the
movement of customers throughout the store
Aisle deign would influence the pattern of
traffic flow towards the merchandising Lighting
consider as a mood setter tool It can be bright
and soft lights which flow throughout the
display area Retailers use these sophisticated
lights at regular interval for the sake of
customer attention For various behaviour and
situations lighting preferences varies individual
to individual (Butler amp Biner 1987) As compare
to bright lighting soft light create more
pleasant and soothing mood (Meer 1985)
Research suggests that home Interior decor
express the self concept and social status
(Lauman amp House 1973) (Jin 1990 Joy amp
Dholakia 1991 Lauman amp House 1973)
(Sadalla Veshure amp Burroughs 1987) Likewise
stores have self image and personality
(Martineau 1958) and it can be communicated
to the customers through store interior
designing Greenberg Sherman ampShiffman
1983 Rich amp Portis 1964)(Greenberg et al
1983 Kotler 1973 ) Pleasant environmental
14 IMPACT OF RETAIL STORE CHARACTERISTICS ON CONSUMER PURCHASE INTENTION
Copyright copy2014 by International Journal of Sales Retailing and Marketing Vol 3 No 1 2014
odor had positive effect on evaluations of in
store atmosphere available merchandising and
intend the customers to visit the store again
and again (Sprangenberg et al 1996) Results
indicate that fragranced store display generates
the most positive responses and pleasurable
experiences (Fiore Yah amp Yoh 2000)
Location
Retail location analysis helps in site selection for
a business outlet and in shaping the
performance of retail outlets in the trade area
of the store Selection of store location is a
long-term decision which requires a long-term
capital dedication in this context store location
is considered one of the most important
element in retail marketing strategy(Zentes
morschett amp schramm) The choice of a store
location has a deep effect on the entire
business of a retail operation For selecting a
most favorable store-site it is important to
consider the demographic factors of that area
including age income traffic patterns family
size competition and related kind of retail
outlets
This study has discussed Geographic
information system which is being utilized now
a day for analyzing the structure of retail
activities with location data Geographic
information system include Decision Support
Systems and Gravity Model(Byrom Retail
Location AnalysisA Case Study of Burger King amp
McDonaldrsquos in Portage amp Summit Counties
Ohio 2005)Geographic information system
collect and transform the several databases into
a common set of database (Pettit 1999) For
analyzing and mapping spatial data such as
transport networks retail location analysis
land-use patterns and opinion poll data
Geographic information system is the most
extensively used software now
Three key factors such as distance traveled to
get to the store size of the store and the retail
image of the store based on its products easy
accessibility visibility parking are used in
Gravity Model (Mercurio 1984)For getting the
competitive advantage for retailers Decision
support systems is also becoming a significant
source
While selecting a location an important factor
which must be considered is examining the
distance that a customer has to travel The
distances which customers want to travel are
depend upon the type of product to be
purchased On the base of specialty or
commodity product number of the trips made
by consumers and the travel time will be
different (Salvaneschi 1996)
Purchase Intention
Purchase intention of the consumer depends on
the store characteristic like location
assortment and atmosphere of a particular
brand It can be defined as
ldquoA purchase intention is customer willingness to
make a purchase of a specific product or
servicerdquo
Purchase intention of the customers consists on
the following steps
First step is Problem identification than search
out the information about the problem
evaluating the alternatives finally customer
make a purchase on these basis Post-purchase
behavior develops through these steps(Engel et
all 1995)Sometimes consumers buy the
product in store that is more attractive and
make a decision on the spot The intention of
purchasing the consumer may be impulse
buying or partially pre-programmed and can be
fully pre-planned
In impulse buying behavior of consumers to
make the decision and make an instant
purchase of the product that is more attractive
to him partly in pre-planned the consumer to
choose the product type and model but choose
the brand in the store and completely pre-
planned for an existing customer to choose the
product and the brand he will buy (Engel JF
Blackwell 1995)
15 IMPACT OF RETAIL STORE CHARACTERISTICS ON CONSUMER PURCHASE INTENTION
Copyright copy2014 by International Journal of Sales Retailing and Marketing Vol 3 No 1 2014
Consumer sentiment and the situation may
affect their impulsive purchase intent
Consumer sentiment include the personal taste
of the situation and express that impulse
purchase intent of consumers differ due to
variation in a situation such as prices increase
more than customer expectations (Kotler
2003) Brand awareness consumer perception
and brand association has a significant impact
on purchase intent (Shwu-Ing Wu and Chen-
Lien Lo 2009)Brand awareness increase brand
loyalty consumer confidence and purchases
intent for the consumer (Aaker D 1990)
Hypothesi
H1 Product assortment has strong significant
impact on purchase intention
H2 location has strong significant impact on
purchase intention
H3 store atmosphere has significant impact on
purchase intention
METHODOLOGY
To analyze and conclude the effects of product
assortment store atmosphere and location on
purchase intention Data is collected from the
retail store customers of Pakistan with
convenient random sampling technique The
target population of this study was all the retail
store customers 200 questionnaires were
distributed out of 180 complete questionnaire
were received to analyze the data These
questionnaires were got filled from retail store
customers of Gujranwala Gujrat and
Wazirabad A measuring instrument as closed
questionnaire was developed with the aim of
collecting data Questionnaire was classified
into two main sections first one Demographic
and another section was subjective
Demographic Section
Demographic section of this questionnaire
information about the employeersquos Gender Age
Marital Status education and city Total
respondent were 180 out of that 20were male
and female respondents were 160 in numbers
while the age of majority of retail store
customers were in the range of 20-24 years and
their frequency was 114 In marital status of the
retail store customers was 9 were married rest
of the customers were single Analysis of
Educational status shows that 163 are Graduate
and 17 persons are of intermediate level Most
of the respondents belong to Gujranwala city
and
Table 1 Pearsonrsquos moment correlation N=150
Correlation is significant at the 001 level (2-tailed)
Variables
Mean
Std
Deviation
Alpha
1
2
3
4
Product assortment
Store atmosphere
Location
Purchase intention
28944
40213
39370
40426
4329
7329
5946
5549
887
881
885
890
1
631
570
337
504
156
580
1
16 IMPACT OF RETAIL STORE CHARACTERISTICS ON CONSUMER PURCHASE INTENTION
Copyright copy2014 by International Journal of Sales Retailing and Marketing Vol 3 No 1 2014
Table 2
Table3
Table4
Model Summaryb
608a 370 360 44409 2064
Model
1
R R Square
Adjusted
R Square
Std Error of
the Est imate
Durbin-
Watson
Predictors (Constant) Location Store atmosphere Product assortmenta
Dependent Variable purchase intent ionb
ANOVAb
20407 3 6802 34491 000a
34711 176 197
55118 179
Regression
Residual
Total
Model
1
Sum of
Squares df Mean Square F Sig
Predictors (Constant) Location Store atmosphere Product assortmenta
Dependent Variable purchase intentionb
Coefficientsa
1987 253 7850 000
170 107 132 1591 113
-184 060 -243 -3069 002
585 070 627 8388 000
(Constant)
Product assortment
Store atmosphere
Location
Model
1
B Std Error
Unstandardized
Coef f icients
Beta
Standardized
Coef f icients
t Sig
Dependent Variable purchase intentiona
17 IMPACT OF RETAIL STORE CHARACTERISTICS ON CONSUMER PURCHASE INTENTION
Copyright copy2014 by International Journal of Sales Retailing and Marketing Vol 3 No 1 2014
its ratio is 160 and 15 respondents from Gujrat
and the rest of five respondents were the
inhabitants of wazirabad
Results and Discussion
To observe the impact of Product assortment
Store atmosphere and location on Purchase
intention Pearsonrsquos moment correlation was
analyzed and to test the relationship of Product
assortment Store atmosphere and location on
Purchase intention linear regression was
conducted Descriptive statistics was also
computed to analyze the tendency of the
respondents and Cronbachrsquos alpha was
measured to test the reliability of the analysis
In Table 1 Mean value of Product assortment is
2894 that shows positive tendency of the
respondents 2894 is not much close to 5 that
shows product assortment does not have
significant effect on Purchase intention While
4329 is standard Deviation that shows 43
variation among responses where as alpha is
887 that shows 89 reliability of the survey
about Product assortment of the respondents
Table 1 show that Product assortment is
strongly correlated with store atmosphere
location and purchase intention 40213 is close
to 5 that shows Store atmosphere have
significant effect on purchase intention while
7329 is standard Deviation that shows 73
variation among responses where as alpha is
881 that shows 88 reliability of the survey
about store atmosphere of the respondents
Table 1 show that store atmosphere is strongly
correlated with product assortment location
and purchase intention
Mean value of Location is 39370 that show
positive tendency of the respondents 39370 is
close to 5 that shows Location have significant
effect on Purchase intention While 594 is
standard Deviation that shows 59 variation
among responses where as alpha is 885 that
shows 89 reliability of the survey about of the
respondents Table 1 show that Location is
strongly correlated with Product assortment
Store atmosphere and purchase intention
To test the relationship of Product assortment
Store atmosphere and location on Purchase
intention linear regression is applied while to
test the normality of data and nature of
correlation Durbin Watson is also applied
Table 2 shows R = 608 which shows 60
variation in product assortment store
atmosphere and location on purchase
intention R square is the coefficient of
determination which shows that 37 total
variation with its linear relationship of Durbin
Watson test is used to test the nature of
correlation whether it is positive
autocorrelation or negative autocorrelation amp
zero autocorrelation Since the value of ldquodrdquo is
more than 2 it means there is negative
autocorrelation
Table 3 of ANOVA shows level of significance
since the value of ldquoprdquo is less than 05 so it is
accepted that product assortment store
atmosphere and location has significant effect
on purchase intention In Table 4 A = 1987 is
the average of purchase intention when
product assortment is zero whereas 170 is the
value of ldquobetardquo that shows one unit increase of
product assortment will bring 170 unit increase
in purchase intention
Purchase intention = 1987+
170(product assortment)
Above linear equation shows that one percent
product assortment will bring 17 change in
purchase intention
When store atmosphere is zero whereas -184 is
the value of ldquobetardquo that shows one unit
decrease of store atmosphere will bring -18
unit decreases in purchase intention
Purchase intention = 1987 + -184 (store
atmosphere)
Above linear equation shows that one percent
store atmosphere will bring -18 change in
purchase intention When location is zero
whereas 585 is the value of ldquobetardquo that shows
one unit increase of location will bring 585 unit
increases in purchase intention
Purchase intention = 1987 + 585 (location)
18 IMPACT OF RETAIL STORE CHARACTERISTICS ON CONSUMER PURCHASE INTENTION
Copyright copy2014 by International Journal of Sales Retailing and Marketing Vol 3 No 1 2014
Above linear equation shows that one percent
location will bring 58 changes in purchase
intention
According to table 4 if tolerance value exceeds
than 5 and VIF exceed 10 then it means Co
linearity in data exist Table 4 indicates 517
571 and 641 is the tolerance value and VIF is
less than 10 that show there is no Co linearity
exist
Limitations
This research has some limitations along with
its fruitful results First our targeted areas were
limited which Gujranwala wazirabad and
gujrat Second our research was not selective to
some particular retail outlets we collected data
from general retail customers who usually do
shopping Third our survey was based on small
sample of customers Fourth Researchers can
obtain better results of this study by using other
tools and statistical methods Fifth due to time
constraint some customers did not respond
properly
Despite of these limitations this study also
provides some future directions In spite of
above mentioned store characteristics in-store
attitude and after sales services can also be
investigated to measure purchase intention
Area of study and sample size can also be
increased to attain more significant results
Shopping involvement and shopping motive can
also be investigated Third this research could
be extended to cross cultural context
Practical implication
This study would help the retailers to increase
their market share and profitability by providing
desirable store environment to their customers
By using above mentioned store characteristics
local retailers can get competitive advantage
over global retailers Retailers can use these
store attributes to maintain their existing
customers and to attract new customers
REFERENCES
Aaker D (1990) Consumer evaluations of
brand extensions Journal of Marketing 27-42
Ailawadi K L amp Keller K L (2004)
UNDERSTANDING RETAIL
BRANDINGCONCEPTUAL INSIGHTS AND
RESEARCH PRIORITIES (Vols 1-34)
Bianchi C C (2009) Investigating Consumer
Expectations of Convenience-Store Attributes in
Emerging Markets Evidence in Chile Journal of
International Consumer Marketing 309-320
Borle S Boatwright P Kadane J B Nunes J
C amp Shmueli G (2005) The Effect of Product
Assortment Changes on Customer Retention
(Vols 616ndash622) Marketing Science INFORMS
Briesch R A Chintagunta P K amp Fox E J
(2008) How Does Assortment Affect Grocery
Store Choice (Vols 1-49)
Byrom (2005) Retail Location AnalysisA Case
Study of Burger King amp McDonaldrsquos in Portage amp
Summit Counties Ohio
Cadenat A A (2003) Efficient retailer
assortment a consumer choice evaluation
perspective international journal of retail and
distribution management 486-497
CHERNEV A (2003) When More Is Less and
Less Is More The Role of Ideal Point Availability
and Assortment (Vols 170-183) JOURNAL OF
CONSUMER RESEARCH
Darley W k amp lim f s (1999) Effects of store
image and attitude toward secondhand stores
on shopping frequency and distance traveled
International Journal of Retail amp Distribution
Management 311-318
Donofrio T J Beyond Basic Product
PlanningAssortment Planning (Vols 1-2) Retail
Systems and Services
Engel et all J F (1995) Consumer behavior (
8th ed) New York Dryden Press Farr A amp
Hollis N (1997) What do you want your brand
to be when it grows up big and strong Journal
of Advertising Research 23-36
Engel J F Blackwell R D (1995) Consumer
behavior ( 8th ed) New York Dryden Press Farr
A amp Hollis N (1997) What do you want your
brand to be when it grows up big and strong
Journal of Advertising Research 23-36
Fiore A M Yah X amp Yoh E (2000) Effects
of a Product Display and Environmental
19 IMPACT OF RETAIL STORE CHARACTERISTICS ON CONSUMER PURCHASE INTENTION
Copyright copy2014 by International Journal of Sales Retailing and Marketing Vol 3 No 1 2014
Fragrancing on Approach Responses and
Pleasurable Experiences Psychology amp
Marketing 27ndash54
Ibrahim h amp Najjar F (2008) Assessing the
effects of self-congruity attitudes and customer
satisfaction on customer behavioural intentions
in retail environment Marketing Intelligence amp
Planning 207-227
Jain R amp Bagdare S (2011) Music and
consumption experience a review Emerald
Group Publishing Limited
Kotler P (2003) Marketing Management (11th
ed) New Jersey Prentice Hall
Liao Y Y Liaw G F amp Jen F How Cues in the
Multiple Store Environment Influence Shopping
Mood and Patronage Satisfaction
Mercurio (1984) Retail Location Analysis
Michon R amp Chebat J C (2006) The
Interaction Effect of Background Music and
Ambient Scent 20-38
Oh J Fiorito S S Cho H amp Hofacker C F
(2007) Effects of design factors on store image
and expectation of merchandise Journal of
Retailing and Consumer Services 1-13
Pettit P (1999) Retail Location AnalysisA Case
Study of Burger King amp McDonaldrsquos in Portage amp
Summit Counties Ohio
Salvaneschi (1996) Retail Location Analysis
Shwu-Ing Wu amp Chen-Lien Lo (2009) The
influence of core-brand attitude and consumer
perception on purchase intention towards
extended product Asia Pacific Journal of
Marketing and Logistics 174-194
SIMONSON I (1999) The Effect of Product
Assortment on Buyer (Vols 347-370) Stanford
University New York University
Zentes J morschett d amp schramm h (nd)
Store Location ndash Trading Area Analysis and Site
Selection
Darley W k amp lim f s (1999) Effects of store
image and attitude toward secondhand stores
on shopping frequency and distance traveled
International Journal of Retail amp Distribution
Management 311-318
Fiore A M Yah X amp Yoh E (2000) Effects
of a Product Display and Environmental
Fragrancing on Approach Responses and
Pleasurable Experiences Psychology amp
Marketing 27ndash54
Jain R amp Bagdare S (2011) Music and
consumption experience a review Emerald
Group Publishing Limited
Aaker D (1990) Consumer evaluations of
brand extensions Journal of Marketing 27-42
Ailawadi K L amp Keller K L (2004)
UNDERSTANDING RETAIL
BRANDINGCONCEPTUAL INSIGHTS AND
RESEARCH PRIORITIES (Vols 1-34)
Bianchi C C (2009) Investigating Consumer
Expectations of Convenience-Store Attributes in
Emerging Markets Evidence in Chile Journal of
International Consumer Marketing 309-320
Borle S Boatwright P Kadane J B Nunes J
C amp Shmueli G (2005) The Effect of Product
Assortment Changes on Customer Retention
(Vols 616ndash622) Marketing Science INFORMS
Briesch R A Chintagunta P K amp Fox E J
(2008) How Does Assortment Affect Grocery
Store Choice(Vols 1-49)
Byrom (2005)
Byrom (2005) Retail Location AnalysisA Case
Study of Burger King amp McDonaldrsquos in Portage amp
Summit Counties Ohio
Cadenat A A (2003) Efficient retailer
assortment a consumer choice evaluation
perspective international journal of retail and
distribution management 486-497
CHERNEV A (2003) When More Is Less and
Less Is More The Role of Ideal Point Availability
and Assortment (Vols 170-183) JOURNAL OF
CONSUMER RESEARCH
Darley W k amp lim f s (1999) Effects of store
image and attitude toward secondhand stores
on shopping frequency and distance traveled
International Journal of Retail amp Distribution
Management 311-318
Donofrio T J Beyond Basic Product
PlanningAssortment Planning (Vols 1-2) Retail
Systems and Services
Engel et all J F (1995) Consumer behavior (
8th ed) New York Dryden Press Farr A amp
Hollis N (1997) What do you want your brand
20 IMPACT OF RETAIL STORE CHARACTERISTICS ON CONSUMER PURCHASE INTENTION
Copyright copy2014 by International Journal of Sales Retailing and Marketing Vol 3 No 1 2014
to be when it grows up big and strong Journal
of Advertising Research 23-36
Engel J F Blackwell R D (1995) Consumer
behavior ( 8th ed) New York Dryden Press Farr
A amp Hollis N (1997) What do you want your
brand to be when it grows up big and strong
Journal of Advertising Research 23-36
Fiore A M Yah X amp Yoh E (2000) Effects
of a Product Display and Environmental
Fragrancing on Approach Responses and
Pleasurable Experiences Psychology amp
Marketing 27ndash54
Ibrahim h amp Najjar F (2008) Assessing the
effects of self-congruity attitudes and customer
satisfaction on customer behavioural intentions
in retail environment Marketing Intelligence amp
Planning 207-227
Jain R amp Bagdare S (2011) Music and
consumption experience a review Emerald
Group Publishing Limited
Kotler P (2003) Marketing Management (11th
ed) New Jersey Prentice Hall
Liao Y Y Liaw G F amp Jen F How Cues in the
Multiple Store Environment Influence Shopping
Mood and Patronage Satisfaction
Mercurio (1984) Retail Location Analysis
Michon R amp Chebat J C (2006) The
Interaction Effect of Background Music and
Ambient Scent 20-38
Oh J Fiorito S S Cho H amp Hofacker C F
(2007) Effects of design factors on store image
and expectation of merchandise Journal of
Retailing and Consumer Services 1-13
Pettit P (1999) Retail Location AnalysisA Case
Study of Burger King amp McDonaldrsquos in Portage amp
Summit Counties Ohio
Salvaneschi (1996) Retail Location Analysis
Shwu-Ing Wu amp Chen-Lien Lo (2009) The
influence of core-brand attitude and consumer
perception on purchase intention towards
extended product Asia Pacific Journal of
Marketing and Logistics 174-194
SIMONSON I (1999) The Effect of Product
Assortment on Buyer (Vols 347-370) Stanford
University New York University
Zentes J morschett d amp schramm h (nd)
Store Location ndash Trading Area Analysis and Site
Selection
21 DERIVING CUSTOMER SATISFACTION AND LOYALTY FROM ORGANIZED RETAILERrsquoS SALES PROMOTION
ACTIVITIES IN INDIA
Copyright copy2014 by International Journal of Sales Retailing and Marketing Vol 3 No 1 2014
Dr Kirti Dutta is Assistant Professor at Bharatiya Vidya Bhavanrsquos Usha and Lakshmi Mittal Institute of Management (email duttakirtiyahoocoin) Dr Swati Singh is Lecturer Bharatiya Vidya Bhavanrsquos Usha and Lakshmi Mittal Institute of Management
DERIVING CUSTOMER SATISFACTION AND LOYALTY
FROM ORGANIZED RETAILERrsquoS SALES PROMOTION
ACTIVITIES IN INDIA
Kirti Dutta amp Swati Singh
Abstract
Organized retail in India is dominated by few powerful players who are organizing sales promotion
activities at regular intervals to attract customers The paper studies this promotion activity and data
was collected from different organized retail stores of one of the major retailer ACSI ECSI models
were used for analysis Findings reveal the customers have a whole set of expectations from the store
in terms of quality of the products on sale variety on sale behavior of staff etc Increase in perceived
quality is found to impact customer satisfaction and loyalty and retailers need to identify strategies
around the same
Keywords ACSI Promotions management retail management customer satisfaction customer
loyalty
INTRODUCTION
The retail sector in India has seen considerable
growth over the years as a result it has
attracted players from across the globe This
growth has been fuelled by higher income
levels favorable demographics and government
policies The Indian retail sector comprises of
both organized and unorganized players with
the unorganized sector commanding 96 share
of retail sales (Economic Times 2012)
Indiarsquos retail sector is likely to touch US$ 833
billion by the year 2013 amp record US$ 13 trillion
by 2018 with compound annual growth rate
(CAGR) of 10 Retailing both organized and
unorganized contributes almost 10 of Indiarsquos
GDP and employs almost 8 of Indiarsquos
employable population (Research amp Markets
2011) The last couple of years however have
seen retailers reeling under recessionary
pressures While many retailers downed
shutters others stalled expansion plans or shut
down non-viable stores Although conditions
began improving from the year 2010 retailers
realized that they need strong consumer
insights to survive in the long run
AC Nielsons Shoppers Trends study found that
shoppers increasingly prefer to shop at
supermarts and hypermarts for FMCG and
groceries while fresh fruits and vegetables are
still sought locally for freshness With increased
exposure to retail formats consumers are
becoming less flirtatious this being evidenced
by the store loyalty parameter which fell from
242 stores visited month in 2009 to 079 now
(Marketing Whitebook- 2011-12)
Sales promotions associated with manufactures
earlier have now become a forte of retailers
too Future Group was the first to launch a
number of promotions across its Big Bazaar
stores The promotion ldquoSabse saste 5 din
22 DERIVING CUSTOMER SATISFACTION AND LOYALTY FROM ORGANIZED RETAILERrsquoS SALES PROMOTION
ACTIVITIES IN INDIA
Copyright copy2014 by International Journal of Sales Retailing and Marketing Vol 3 No 1 2014
ldquodebuted on January 26th 2007 at Big Bazaar
outletsbecame an instant success and was
made a regular event Frequency of the sales
promotions was increased to include the week
around Independence Day followed by ldquoPublic
Holiday Salerdquo at all its Big Bazaar stores across
the country from April 28 to May 1(PawarT-
2012) The ldquoSabse saste 5 dinrdquo in January (from
23-29 January) 2012 saw Future Group report
national combined retail sales of Rs650 crores
which was 25-30 higher than the previous
year Taking a cue from Future Group all major
retailers launched equally innovative sales
promotion offers The Independence Day week
in 2012 saw retailers trying to outdo each other
with price challenges deep discounts and
lucrative offers Reliance Retail came out with
the 10-day lsquoPrice Challengersquo at its Reliance
Fresh Super and Mart stores Bhartirsquos Easy Day
went a step further with its 18-day lsquoFreedom
from inflationrsquo while Future Group retaliated
with a 6 day ldquoMahaBachatrdquo sale at its Big Bazaar
outlets (Kamath R 2012) Nielson study has
revealed that this definitive move towards sales
promotions particularly from the year 2009 has
been a major driver of store choice (Jacob S amp
Bhushan R 2012)
The mammoth size of all these retailers offering
sales has ensured that they stand at par when it
comes to offering the best in class promotions
Over the years sales promotion activities have
grown in size and stature into repeated mega
events The sales promotion activity therefore
has moved beyond being a short term
lsquotemptingrsquo offer into a strategic event focused
at garnering consumer loyalty To make matters
worse these promotions are run simultaneously
by all these retailers to ensure that their
products are stockpiled by the consumer Hence
to differentiate their sales promotion events
retailers will have to look beyond mere price
cuts and bargains to ensure consumer
patronage The present research focuses on the
sales promotions offered by one of these
organized retailers so as to identify the
perception and satisfaction level of the
consumers towards such promotions
LITERATURE REVIEW
Background
Sales promotions an integral component of the
marketing mix have been utilized to exert a
strong impact on short term purchase behavior
(Laroche et al 2003) Studies have revealed
that sales promotions significantly impact
consumers (Gilbert and Jackaria 2002
Pramataris et al 2001 Fill 2002 and Shump
2003) their decision making process (Mela
Gupta amp Lehman 1997 Papatla amp
Krishnamurthi 1996 Das and Kumar 2009)
increases the basket size (Ramanathan and
Dhar 2010) promotes aggregate sales of the
promoted brand (Blattberg and Neslin 1990)
stock piling increase in quantity purchased
product trial spending more and purchase time
acceleration (Gupta 1988 Shi Cheung amp
Prendergast 2005)
Studies have also been conducted on factors
affecting loyalty (Aaker 1996 Lau et al 2006
Garvin 1988 Evans et al 1996 Cadogen and
Foster 2000) characteristics of loyal customers
as well as switchers (Grover amp Srinivasan 1992
Bloemeramp Kasper 1995) effect of frequency
and amount of sales promotions on quantity
purchased and brand choices (Meyer
ampAssuncao 1990) as well as price judgments
(Alba et al 1999) Research has revealed that
irregular and less predictable promotion
patterns diminish consumerrsquos inclination to
postpone purchases in order to obtain better
deals (Krishna 1994) Impact of promotional
patterns including the degree of regularity and
predictability of the sales promotion has
attracted less attention Thus the present study
attempts to explore the customer satisfaction
and loyalty with sales promotions by modern
retail trade in India which is now in the process
of becoming a regular and predictable event in
the consumerrsquos purchase cycle
23 DERIVING CUSTOMER SATISFACTION AND LOYALTY FROM ORGANIZED RETAILERrsquoS SALES PROMOTION
ACTIVITIES IN INDIA
Copyright copy2014 by International Journal of Sales Retailing and Marketing Vol 3 No 1 2014
Sales promotion cannot be looked at as a mere
price incentive being offered to the consumer
but has to be understood in terms of the more
comprehensive models like the ACSI amp ESCI
This is primarily because retailers are trying to
cultivate loyalty to a sales promotion event and
therefore it requires the assessment of
customer expectations perceived quality
perceived value customer satisfaction
customer complaints and an understanding of
how they impact each other
ACSI ECSI and Customer satisfaction
The importance of customer satisfaction for
business success has been emphasized in the
marketing literature consistently Higher
customer satisfaction leads to improved
financial performance by reducing customer
switching improving loyalty promoting positive
word of mouth reducing price sensitivity and
enhancing firm image and reputation (Garvin
1988 Anderson 1998 Kandanpully amp
Suhartanto 2000 Homburg ampGiering 2001
Kim et al 2004) Over the years numerous
models have been proposed by researchers to
examine customer satisfaction Amongst them
the most compelling model that investigates
the linkages between antecedents amp
consequences of customer satisfaction is the
ACSI ie the American Customer Satisfaction
Index and ECSI (European Customer Satisfaction
Index) which is a national index used to
measure customer satisfaction across
industries The present study adopts the ACSI
model to investigate the antecedents and
consequences of customer satisfaction in the
context of sales promotions by organized
retailers
According to findings of Parasuraman et al
(1991) four factors impact customer
expectations word of mouth (or reputation)
personal needs past experience and external
communications In the CSI model the
determinants of expectations are customerrsquos
pre purchase experience with the
companyproductservice along with a forecast
of a companyrsquos ability to deliver quality (Fornell
et al 1996) Pre purchase experience includes
past consumption experience non-experiential
information like advertising and word of mouth
Although different studies have proposed
varied definitions of customer expectations
majority of literature has found that customer
expectations directly impact perceived quality
and thereby customer satisfaction (Bearden amp
Teel 1983 Tseamp Wilton 1988 Fornell et al
1996 Halstead et al 1994) Perceived value is
another construct of the CSI model that impacts
customer satisfaction Perceived value
evaluates the product quality in relation to the
price of the product (Fornell et al 1996 Balaji
2009) Thus the following hypotheses can be
drawn
H1 Customer expectations will positively affect
perceived quality
H2 Customer expectations will positively affect
perceived value
H3 Customer expectations will positively affect
overall customer satisfaction
H4 Perceived quality will positively affect
perceived value
Perceived quality and customer satisfaction
Most researchers lack agreement in defining
customer satisfaction and quality of service The
CSI model views customer satisfaction as a
function of customerrsquos expectations perceived
quality and value Oliver (1993) argued that
customers must have experienced some quality
in order to determine their satisfaction levels
Similarly many other studies have considered
service quality as an antecedent of customer
satisfaction (Anderson et al 1994 Chiou et
al2002 Cronin et al2000 Fornell 1992
Fornell et al 1996) Adopting most of these
findings this study takes quality of service to be
a determinant of customer satisfaction
Therefore
H5 Perceived quality will positively affect
overall customer satisfaction
Perceived Value and Customer Satisfaction
Perceived value is a unique construct in the CSI
model and was defined by Fornell and his
colleagues as one that represents the perceived
24 DERIVING CUSTOMER SATISFACTION AND LOYALTY FROM ORGANIZED RETAILERrsquoS SALES PROMOTION
ACTIVITIES IN INDIA
Copyright copy2014 by International Journal of Sales Retailing and Marketing Vol 3 No 1 2014
level of product quality relative to the price of
the product (Fornell et al 1996) Zeithaml
(1988) recognized the relevance of perceived
value but regarded it as a component of
perceived quality While Fornell et al
incorporated the perceived value to measure
overall customer satisfaction The existing
literature makes it difficult to draw a clear
distinction between the two constructs
perceived quality and perceived value for the
purpose of this research we have taken
perceived value as a distinct construct
impacting overall customer satisfaction keeping
in mind the primary appeal of a sales promotion
ie value derived from price reductions Thus
H6 Perceived Value will positively affect overall
customer satisfaction
Customer satisfaction and customer loyalty
The outcomes of customer satisfaction have
been examined by quite a few studies (Cronin
et al 2000 Szymanski et al 2001)
Understanding outcomes of customer
satisfaction (Cronin et al 2000) consumer
loyalty (Beiamp Chiao 2001) and intention to
continue business with a company (Burncham
et al 2003) are of central importance to
marketers Hence the study examines both
possible outcomes customer complaints and
customer loyalty Reduced customer complaints
will result in increased loyalty (Tax et al 1998)
The effective redressal of the complaint impacts
customer loyalty positively Thus
H7 Overall customer satisfactions will
negatively affect customer complaints
H8 Overall customer satisfaction will positively
affect customer loyalty
H9 Customer complaint positively affects
customer loyalty
Perceived value customer expectation and
customer loyalty
The various characteristics of services are
inherent in the retail store as well To overcome
this aspect the customer expectations (Ofir and
Simonson 2007) and judgment of perceived
quality can impact customer loyalty directly as
well (Yieh Chiao and Chiu 2007 Sathish and
Venkatesakumar 2011) Thus
H10 Perceived quality positively impacts
customer loyalty
H11 Customer expectations positively impact
customer loyalty
H12 Overall the customers are satisfied with
the sales promotion
METHODOLOGY
Primary research was conducted and data was
gathered from respondents who visited the
stores during the sales promotion The
questionnaire was finalized after a focus group
discussion with eight store managers (four each
from two different organizations) to understand
the various constructs of customer expectation
perceived quality perceived value satisfaction
loyalty and complaint The instrument was
tested on 50 customers with prior experience of
least two similar sales promotion events In the
final instrument perceived quality and customer
satisfaction were measured using 19 specific
constructs which included crowd management
billing time employee response and
knowledge point of purchase display returning
policy etc Perceived value was measured by
three constructs condition of the goods expiry
dates on goods and availability of bargains
Customer loyalty was measured on the basis of
regularity in attending the sales promotions
recommendations made and waiting for sale
Customer complaints were measured on the
basis of five constructs availability and
cooperation of employees complaining
behavior of customers action taken on the
complaint To overcome the consumerrsquos
behavior of not complaining formally customers
were asked to rank their opinion about the
manageability of the crowd and handling of the
same by the management Customers were
asked to rate each item on a ten point scale
where 1 was taken as lsquopoorrsquo and 10 was taken
as excellent
Data was collected from different retail stores
of one of the major organized retailer running
the sales promotion events in Delhi NCR during
25 DERIVING CUSTOMER SATISFACTION AND LOYALTY FROM ORGANIZED RETAILERrsquoS SALES PROMOTION
ACTIVITIES IN INDIA
Copyright copy2014 by International Journal of Sales Retailing and Marketing Vol 3 No 1 2014
the Republic day week of 2012 In total 159
respondents were interviewed and the
questionnaires were personally administered to
the customers who came to avail the offer This
was done to avoid the problem associated with
including non-users in the survey (Szymanski
and Henard 2001) The basic ACSI ECSI model
(as shown in Figure 1) was used to draw the
hypotheses and perform the analysis The
dotted lines in the figure denote the proposed
hypothesis which is not as per the ACSIECSI
Figure 1 The basic model for CSI
Source ECSI 1998 and ACSI 2012
Data Analysis and Results
The respondents for the study were all aware of
the sales beforehand It is interesting to note
that 7 of the sample size consists of retailers
or a lsquokiranarsquo store owners which is in line with
similar observations regarding purchases made
by kirana store owners during the sales
promotion period by organized retailers like Big
Bazaar and Reliance Retail (Malivya 2012)
Electronic goods were the most purchased
goods followed by groceries personal care
items furnishings crockery and then utensils in
the same order
Underlying dimensions of CSI for Retail Sales
Promotion
The values are calculated by Principal
Component Analysis and multiple regressions
Regression analysis was done to find the
relationships and R2 was calculated (all
calculations are significant at 95 level of
confidence) When compared with the basic
ECSI model it was seen that there is a slight
difference as the perceived quality and
customer expectation also directly affects the
customer loyalty (see figure 2) According to the
results perceived quality affects perceived value
(R2 is 094) customer satisfaction (R2 is 062)
and customer loyalty (R2 is 076) more than
customer expectation affects perceived value
(R2 being 052) Customer satisfaction (R2 = 053)
and customer loyalty (R2 = 035) The value of R2
generally varies between 0 to 1 and the more
closer it is to 1 the more perfect fit of the data
on the regression line denoting that the model
is close to reality and so except customer
expectationrsquos effect on loyalty all the other
values are coming more than 050 and are
therefore relevant
Using Lisrel to calculate the impact factor it was
studied that the direct impact of perceived
quality on customer satisfaction is 032 and the
indirect impact means that one point increase
in the expectation index results in 035 x 042=
0147 point increase in customer satisfaction
index A calculation of all the direct and indirect
effects as per the ECSI (Kristensen Martensen
and Gronholdt 2000) shows that a one point
increase in perceived quality and customer
expectation results in 0467 and 0439 increase
(respectively) in the customer satisfaction
index The calculation for the direct and indirect
effect on customer loyalty shows that quality
has a greater impact on loyalty than
expectation A one point increase in quality
Perceived
quality
Customer
expectation
Perceived
value
Customer
satisfaction
(ACSI)
Customer
complaint
Customer
loyalty
H5
H4
H2 H3
H8 H6 H1
H11
H10
H7 H9
26 DERIVING CUSTOMER SATISFACTION AND LOYALTY FROM ORGANIZED RETAILERrsquoS SALES PROMOTION
ACTIVITIES IN INDIA
Copyright copy2014 by International Journal of Sales Retailing and Marketing Vol 3 No 1 2014
results in increasing the loyalty by 051 whereas
a one point increase in expectation results in
increasing the loyalty by 038
The scores for the various components were
calculated using the ACSI formula where the
mean responses were converted into 0-100
scale for reporting purposes where 0 stands for
poor and 100 stands for excellent lsquoA
component score is the weighted average of
the individual attribute ratings given by each
respondent to the questions presented in the
survey A score is a relative measure of
performance for a component as given for a
particular set of respondentsrsquo (ACSI 2006) The
scores are given in the corresponding boxes in
figure 2 It can be observed that the
performance of customer satisfaction is the
highest followed by customer expectation
perceived value customer loyalty perceived
quality and customer complaint
Figure 2 The CSI model for Retail Sales Promotion by organized players
Thus it is perceived quality that impacts the
customer loyalty the most followed by impact
of perceived value customer satisfaction The
dominant model that emerges is that perceived
quality and customer expectations impact
perceived value and perceived quality impacts
both customer satisfaction and loyalty
To study multi-collinearity correlation was
carried out for the three factors It was found
that correlation is positive but the values are
not very high or in excess of 08 (maximum for
this calculation is 046) hence ruling out
multicollinearity (Gujarati 2004 pp 359) The
correlation between the various constructs is
given in table 1 below
Table 1 Correlation coefficients between constructs
Constructs
Customer
expectation
Perceived
quality
Perceived
value
Customer
complaint
Customer
loyalty
Customer
satisfaction
Customer
expectation 1
Perceived
quality 0264378942 1
Perceived value 0149520672 0351027965 1
Cus complaint 0105047077 0055981137 0183702146 1
Cus loyalty 0162089487 0457471401 0371270621 0266418589 1
Cus satisfaction 0227290079 032405844 0420766098 022925679 0401732 1
Perceived
quality (444)
Customer
expectation
(789)
Perceived
value (667)
Customer
satisfaction
(ACSI) (946)
Customer
loyalty (50)
Customer
complaint (20)
R2 =094
I=35
R2 =062
I= 032
R2 = 030
I= 042
R2 =076 I=
046
R2 =015
I= 023 R2 =035
I= 027
R2 =035
I= 011
R2 =052
I= 017
R2 = 034
I= 030
R2 = 035
I= 019
R2 =052
I= 024
27 DERIVING CUSTOMER SATISFACTION AND LOYALTY FROM ORGANIZED RETAILERrsquoS SALES PROMOTION
ACTIVITIES IN INDIA
Copyright copy2014 by International Journal of Sales Retailing and Marketing Vol 3 No 1 2014
The positive values of R2 and the positive
coefficient values suggest that the various
hypotheses studied (H1 ndash H11) are correct The
low value of R2 for H1 H6 H7 H8 H9 H10 and
H11 shows that the constructs of these
variables do not account for (maximum) more
than 46 of the aspect studied but still they
account for some portion of the study The
study can therefore be extrapolated to study
these aspects further
Calculation of Customer Satisfaction Score
Customer satisfaction was studied on the basis
of three constructs laid down by ACSI that is
overall satisfaction with the sales whether the
sales met expectations and evaluation on basis
of comparison to ideal The mean values were
transformed on a scale of 0-100and are given in
table 4 The ACSI scores are calculated as
weighted averages and the calculated weights
(ACSI 2005) for the customer satisfaction
constructs and are shown in table 2 as follows
Table 2 Values for Customer Satisfaction calculation as per ACSI
Constructs Values out of 100 Weights
Overall satisfaction 9203354 0343816
Met expectations 9608665 033543
Comparison to ideal 9580712788 0320755
ASCI score = ((92034 x 0344) + (9609 x 0335)
+ (9581 x 321) ) = 946
Based on this model the total customer
satisfaction for the chosen retailerrsquos sale comes
out to be 946 The ACSI average for retail trade
stands at 761(ACSI 2012) Therefore the H12 is
true and customers are overall satisfied with
the sales promotion
DISCUSSION AND CONCLUSION
Regression analysis shows that the overall
model of ACSI fits in the case of sales promotion
event in an organized retail The customer
satisfaction is influence by perceived value
perceived quality and customer expectation
Most consumers surveyed in this study
patiently waited for these promotions to make
bulk purchases Contrary to normal belief that
sales promotions when used in excess hamper
brand image retailers like Big Bazaar have used
them to enhance consumer loyalty as well as
improve brand image The satisfaction from the
sales promotion in this case comprises of
satisfaction received from buying a product on
sale and also numerous other concepts like
perceived quality perceived value customer
complaints expectations and loyalty The
research thus uncovered that consumers come
to the store to participate in a sales promotion
for the bargains and at the same time have a
whole set of expectations from the store in
terms of quality of the products on sale variety
on sale behavior of staff etc The analysis of the
findings has revealed that customers were
highly satisfied by the sales promotions as
reflected by a high ACSI score of 946 The
customer expectation has a high ACSI score of
79 and when compared to the score for
perceived quality (44) and perceived value (67)
shows a higher expectation than the perception
of quality and value The retailers therefore
need to either manage these high expectations
by avoiding over promising through its
communications or deliver on the promises and
improve the perception of the customers The
high ACSI score for customer satisfaction can be
attributed to the fact that the customer
satisfaction was broadly measured using
28 DERIVING CUSTOMER SATISFACTION AND LOYALTY FROM ORGANIZED RETAILERrsquoS SALES PROMOTION
ACTIVITIES IN INDIA
Copyright copy2014 by International Journal of Sales Retailing and Marketing Vol 3 No 1 2014
constructs like overall satisfaction with the
sales whether the sales met expectations and
evaluation on basis of comparison to ideal The
focus of the customers during the sales
promotion offer was to get the benefit of price
discounts offered which lead to the high
satisfaction score
In terms of customer loyalty the ACSI score was
found to be 50 which is quite encouraging as
sales promotions are associated less with
loyalty The score is indicative of the fact that
the retailer has managed to develop some
loyalty amongst its customers as most
customers were either regular buyer or referred
buyers of the retailer The ACSI score for
perceived quality was found to be 444 The
constructs utilized in the study for measuring
perceived quality addressed minute details of
the consumerrsquos experience during the sale
Hence the low score indicates that consumers
are no longer evaluating the sale as a value
gaining event alone but are also evaluating
operational dynamics of the store that includes
nature of products brands on sale behavior of
staff adequacy of the promotional messages
crowd management etc Moreover the retailer
needs to focus on perceived quality as a one
point increase in the same will result in 047
point increase in customer satisfaction and 051
point increase in customer loyalty
The ACSI score for consumer complaints was
found to be pretty low at 20 This is in line with
the hypothesis 7 that overall customer
satisfaction will negatively affect customer
complaints However in our study we have
mapped the respondentsrsquo willingness to
complain evaluation of the handling of
customer complaints and customers discomfort
during the sales A low overall score highlights
the fact that the customers were also giving low
scores to the company as far as ease of
complaining and appropriate redressal of the
complaints were concerned The unsatisfactory
handling of the complaint has lead to the low
score and retailer needs to effectively address
the complaint procedure in its entirety
Managerial Implications The paper is specific
to customer satisfaction with respect to sales
promotion activities by organized players in
India and is important as these sales promotion
activities are predicted events at regular
intervals of time Extant literature shows
studies conducted for sales promotion activities
that are not regular events and their happening
cannot be predicted by customers The paper
provides insights into the customerrsquos
satisfaction with these sales and the factors
driving the loyalty towards the sales
Sales promotions for retailers like Reliance Big
Bazaar etc happen to be an almost year around
activity through which it intends to draw in new
customers as well as reward its loyal customers
The research sensitizes marketers to the fact
that consumers are drawing satisfaction not
only from the perceived value of the sale but
also customer expectation and perceived
quality The consumer comes to the retail store
with a set of expectations that extend beyond
the type of promotions (buy one get one free
price off etc) on offer During their stay in the
store they are analyzing the nature of services
provided by the retailer the store ambience
management of the entire promotion (chaos at
the store etc) POP displays effectiveness of
announcements behavior of the staff
complaint handling etc On the one hand they
are deriving satisfaction from the sales due to
expectations perceived quality and value for
money derived from the sales However on the
other hand there is a marked gap between the
customer expectations and perceptions Hence
it is mandatory for retailers not only to provide
the right type of promotions but also ensure
operational efficiency of the promotion that will
lead to customer satisfaction and hence
customer loyalty Specific managerial
implications based on the research are as
follows
Enhancing loyalty to Sales Promotion The ACSI
score for loyalty is indicative of the fact that the
regularity of the sales promotions drive by the
said retailer has managed to develop loyalty
29 DERIVING CUSTOMER SATISFACTION AND LOYALTY FROM ORGANIZED RETAILERrsquoS SALES PROMOTION
ACTIVITIES IN INDIA
Copyright copy2014 by International Journal of Sales Retailing and Marketing Vol 3 No 1 2014
amongst the consumers The low score is also
indicative of the possibility of increasing sales
promotion (retailer based) loyalty in the future
by concerted efforts to make the promotion
drive a regular feature as well as a comfortable
encouraging experience for the consumers
Managing Perceived Quality Over the years as
the retail sector has become more crowded by
entry of new players promotions have grown in
number and duration To make matters more
competitive the promotions are scheduled
simultaneously As a result it is no longer
possible to gain consumerrsquos loyalty or consumer
satisfaction by merely providing lucrative deals
Retailers have to seek efficiencies in managing
the complete store experience during the
promotion drive for the consumer which
involves trolley management faster cashier
lanes effective communication availability of
promoted brands dealing with expired and
damaged goods favorable return policy and
appropriate employee behavior A focus on the
perceived quality is also necessitated by the fact
that an increase in the perception impacts
customer satisfaction and loyalty
Inviting amp Addressing Consumer Complaints
Although complaints by consumers were found
to be pretty low during the sales drive the
retailer has to be cautious and has to develop
an appropriate channel to invite and address
consumer complaints as consumer
disgruntment as well as unresolved complaints
can lead to negative WOM which can hamper
consumer satisfaction and loyalty in the long
run
Limitation and Future Research Direction
This study is specific to the sales promotion
activity of organized retailers in Delhi and NCR
It thus cannot be generalized for the organized
retail scenario in general or for the entire retail
scenario (organized as well as unorganized) in
India Organized retail accounts for a small pie
of the entire retail industry in India Thus the
organized retail scenario offers numerous
opportunities for organized players both
national and international keeping in mind the
opening up of the FDI rules governing the same
Research can be thus be conducted to study the
overall customer satisfaction drivers for
organized andor unorganized retail during
normal days as well which can give rich insights
into the culturally diverse consumer base in
India
REFERENCES
ACSI (2006)
httpwwwfsfedusresearchpdf2006_fs_rd
_customer_satisfaction_survey_final_reportpdf
ACSI (2012)
httpwwwtheacsiorgindexphpoption=com
_contentampview=articleampid=261acsi-sectors-
and-industriesampcatid=14ampItemid=338
Aaker DA (1996) Building Strong Brands
Free Press New York
Alba Joseph W Carl FMela Terence A
Shimp and Joel E Urbany (1999) ldquoThe Effect
of Discount Frequency and Depth on Consumer
Price Judgmentsrdquo Journal of Consumer
Research 26 (September) pp99-114
Anderson Eugene W (1998) ldquoCustomer
Satisfaction and Price tolerancerdquo Marketing
Letters Vol7 No3 pp265-74
Bawa Kapil amp Robert Shoemaker (2004) ldquoThe
Effects of Free Samples On Incremental Brand
Salesrdquo Marketing Science 233 pp345-363
BawaK ampShoemakerRW (1989) ldquoAnalyzing
incremental sales from direct mail coupon
promotionrdquo Journal of Marketing 53 (3) 66-76
Bearden William O and Jesse E Teel (1983)
ldquoSelected Determinants of Consumer
Satisfaction and Complaint Reportsrdquo Journal of
Marketing Research Vol 20 No 1 pp 21-28
BeiLTandYCChiao (2001)rdquoA ldquoIntegrated
Model for the Effects of Perceived Product
Perceived Service Quality and Perceived Price
Fairness on Consumer Satisfaction and Loyaltyrdquo
Journal of Consumer Satisfaction
Dissatisfaction and Complaining Behavior 14
125ndash140
30 DERIVING CUSTOMER SATISFACTION AND LOYALTY FROM ORGANIZED RETAILERrsquoS SALES PROMOTION
ACTIVITIES IN INDIA
Copyright copy2014 by International Journal of Sales Retailing and Marketing Vol 3 No 1 2014
Blattberg R C and Scott A N (1990) Sales
Promotions Concepts Methods and Strategies
Englewood Cliffs NJ Prentice Hall
Bloemer JMMamp Kasper HDP (1995) ldquoThe
Complex Relationship between Consumer
Satisfaction and brand Loyaltyrdquo Journal of
Economic Psychology 162 pp311-329
Burnham TA Frels JK Mahajan V (2003)
ldquoConsumer switching costs a typology
antecedents and consequencesrdquo Journal
Marketing Sciences 31(2)109-126
Cadogen JW amp Foster BD (2000)
ldquoRelationship Selling amp Customer Loyalty An
Empirical Investigationrdquo Marketing Intelligence
and Planning 184 pp185-199
Chiou J S Droge C amp Hanvanich S (2002) ldquo
Does customer knowledge affect how
loyalty is formedrdquo Journal of Service Research
5(2) 113ndash124
Cronin JJ Brady MK Hult GTM (2000)
ldquoAssessing the effects of quality value and
customer satisfaction on consumer behavioral
intentions in service environmentsrdquo Journal of
Retailing 6(2)pp193-218
Das G amp Kumar R-2009 ldquoImpact of sales
promotion on buyerrsquos behavior An empirical
study of Indian retail customersrdquo Journal of
Management 3 (1) 11-24
Economic Times(2012) ldquoFDI in multi-brand to
boost organized retail in Indiardquo
httparticleseconomictimesindiatimescom2
012-08-13news33182674_1_fdi-global-retail-
chains-gdp-growth Accessed 2nd September
2012
ECSI Technical Committee (1998) European
Customer Satisfaction Index Foundation and
Structure for Harmonized National Pilot
Projects Report prepared for ECSI Steering
Committee
Evans M MoutinhoL and RaaijWFV
(1996) ldquoApplied Consumer Behaviorrdquo Addison-
Wesely Publication Co Harlow Reading Mass
Fornell C (1992) ldquoA National Customer
Satisfaction Barometer The Swedish
Experiencerdquo Journal of Marketing 56 pp6-21
Fill C (2002) Marketing communications
Contexts strategies and applications (3rd
Edition) Italy Pearson Education Limited
Fornell C Johnson M D Anderson EW Cha
J amp Bryant BE (1996) ldquo The American
Customer Satisfaction Index Nature purpose
and findingsrdquo Journal of Marketing 60 (4)
pp(7-18)
Garvin DA (1988) Managing Quality The
Strategic and Competitive Edge Free Press
New York Maxwell Macmillan Toronto
Maxwell Macmillan International New York
Gilbert DC ampJackaria N(2002) ldquoThe efficacy
of sales promotions in UK supermarkets A
consumer viewrdquo International Journal of Retail
amp Distribution Management 30 (6) 315-322
GoswamiP and Mishra M(2009) ldquoWould
Indian consumers move from kirana stores to
organized when shopping for groceriesrdquo Asia
Pacific Journal of Marketing and Logistics 21(1)
127 - 143
GroverR and Srinivsan V (1992) ldquo Reflection
on a Simultaneous Approach to Market
Segmentation and Market Structuringrdquo Journal
of Marketing Research 294 pp474-476
Gujarati Damodar N (2004) Basic
Econometrics New Delhi Tata McGraw-Hill pp
359
Gupta S (1988) ldquoThe Impact of Sales
Promotions on When What and How Much to
Buyrdquo Journal of marketing research Vol25
pp342-355
Halstead D D Hartman and S L
Schmidt(1994) ldquoMulti source Effects on the
Satisfaction Formation Process Journal of the
Academy of Marketing Science Vol 22 No 2
pp 114-129
Homburg C amp Giering A( 2001) ldquoPersonal
characteristics as moderators of the
relationship between customer satisfaction and
loyalty An empirical analysisrdquo Psychology amp
Marketing Vol18No1 pp 43-66
Jacob S amp Bhushan R (2012) ldquoFuture Group
Lifestyle and Woodland clock record sales as
Republic Day discounts help retailers bounce
backrdquohttparticleseconomictimesindiatimes
31 DERIVING CUSTOMER SATISFACTION AND LOYALTY FROM ORGANIZED RETAILERrsquoS SALES PROMOTION
ACTIVITIES IN INDIA
Copyright copy2014 by International Journal of Sales Retailing and Marketing Vol 3 No 1 2014
com2012-01-31news31010348_1_retail-
sales-end-of-season-sales-discounts Accessed
21st September 2012
Kandanpully J amp Suhartanto D (2000)
ldquoCustomer loyalty in the hotel industry The role
of customer satisfaction and imagerdquo
International Journal of Contemporary
Hospitality Management Vol12 No6 pp346-
351
Kamath K (2012) ldquoRetail biggies outdo each
other with price challenges discountsrdquo
httpwwwbusiness-
standardcomindianewsretail-biggies-outdo-
each-otherprice-challenges-discounts483144
Accessed 8th September 2012
Kim M Park M ampJeong D (2004) ldquo The effects
of customer satisfaction and switching barrier
on customer loyalty in Korean Mobile
Telecommunication Servicesrdquo
Telecommunications Policy Vo28 No2 pp
145-59
Krishna Aradhna (1994) ldquoThe Impact of Dealing
Patterns on Purchase Behaviorrdquo Marketing
Science 13 (Fall) pp351-73
Kristensen K Martensen A and Gronholdt L
(2000) ldquoCustomer Satisfaction measurement at
post Denmark results of application of the
European Customer Satisfaction Index
Methodologyrdquo Total Quality Management
Volume 11 Issue 7 pp1007-1015
Laroche M Pons FZgolli NCervellon MC
and Kim C (2003) ldquo A Model of Consumer
Response to Two Retail Sales Promotion
Techniquesrdquo Journal of Business Research 567
pp513-522
Malviya S (2012) ldquoKirana stores throng big
retailers like Future Group Reliance Retail and
others for better marginsrdquo Economic Times
New Delhi Dated 28 August pp 4
Mela Carl F Gupta Sunil and Donald
BLehmann (1997) ldquo The Long Term Impact of
Promotion and Advertising on Consumer Brand
Choicerdquo Journal of Marketing Research
342pp248-261
Meyer Robert J and Joao Assuncao (1990) ldquo
The Optimality of Consumer Stockpiling
Strategiesrdquo Marketing Science 9 (Winter)
pp18-41
Ofir C and Simonson I (2007) ldquoThe effect of
stating expectations on customer satisfaction
and shopping experiencerdquo Journal of Marketing
Research Vol 44 pp 164-174
Papatla Purushottam and Krishnamurthi
Lakshman (1996) ldquo Measuring the Dynamics
Effects of Promotions on Brand Choicerdquo Journal
of Marketing Research122 pp24-32
PawarT-2012 ldquoBig Bazaars SabseSaste 5 Din
back with Mega deals and bigger bargainsrdquo
httpwwwindiainfolinecomMarketsNewsB
ig-Bazaars-Sabse-Saste-5-Din-back-with-Mega-
deals-and-bigger-bargains5338770514
Accessed 11th May 2012
Oliver R L(1993) ldquoCognitive Affective and
Attribute Bases of the Satisfaction Responserdquo
Journal of Consumer Research Vol 20 No 3
pp418-430
Parasuraman A Zeithmal V A amp Berry L L
(1991) ldquoRefinement and Reassessment of the
SERVQUAL scalerdquo Journal of Retailing 67(4)
pp 420-450
PawarT-2012 ldquoBig Bazaars SabseSaste 5 Din
back with Mega deals and bigger bargainsrdquo
httpwwwindiainfolinecomMarketsNewsB
ig-Bazaars-Sabse-Saste-5-Din-back-with-Mega-
deals-and-bigger-bargains5338770514
Accessed 11th May 2012
PramatarisKC
VrechopoulosAPampDoukidisGI (2001) ldquoThe
transformation of the promotion mix in the
virtual retail environment An initial framework
and comparative studyrdquo
httpwwweltrunaurebgrpapersiechtm
Shi YZ Cheung KM amp Prendergast G (2005)
ldquoBehavioral Response to Sales
Promotion tools-A Hong Kong Studyrdquo
International Journal of Advertising Vol24
No4
pp467-486
32 DERIVING CUSTOMER SATISFACTION AND LOYALTY FROM ORGANIZED RETAILERrsquoS SALES PROMOTION
ACTIVITIES IN INDIA
Copyright copy2014 by International Journal of Sales Retailing and Marketing Vol 3 No 1 2014
Ramanathan S and Dhar S K (2010) ldquoThe
effect of sales promotions on the size and
composition of the shopping basket regulatory
compatibility from framing and temporal
restrictionsrdquo Journal of Marketing Research 47
(3) 542-552
Research amp Markets (2011) ldquoBMI India Retail
Report Q1 2011rdquo
httpwwwresearchandmarketscomreports
1444352bmi_india_retail_report_q1_2011pdf
Accessed 6th September 2012
Sathish A S and Venkatesakumar R (2011)
ldquoCoffee experience and drivers of satisfaction
loyalty in a coffee outlet with special reference
to ldquocafeacute coffee dayrdquo The Journal of
Contemporary Management Research Vol 5
No 2 pp 1-13
Szymanski D M and Henard D H (2001)
ldquoCustomer satisfaction a meta-analysis of the
empirical evidencerdquo Journal of the Academy of
Marketing Science Vol 29 Issue 1 pp 16-35
Tax SS Brown SW and Chandrashekaran M
(1998)ldquoCustomer evaluation of service
complaint experiences Implications for
relationship marketingrdquo Journal of Marketing
Vol 62 April pp 60-76
Tse DK Wilton PC(1988) ldquoModels of Consumer
Satisfaction Formation An Extensionrdquo
Journal of Marketing Research Vol 25 No 2
pp 204ndash12
Yieh K Chiao Y C and Chiu Y K (2007)
ldquoUnderstanding the antecedents to customer
loyalty by applying structural equation
modelingrdquo Total Quality Management Vol 18
No 3 pp 267-284
Zeithaml VA (1988) ldquoConsumer perceptions
of price quality and value a means-end model
andsynthesis of evidencersquorsquo Journal of
Marketing Vol 52 July pp 2-22
Copyright copy2014 by International Journal of Sales Retailing and Marketing Vol 3 No 1 2014
34 IMPACT OF RISK FACTORS RELATED TO INTERNET BANKING WITH SPECIAL REFERENCE TO NATIONAL
CAPITAL REGION
IMPACT OF RISK FACTORS RELATED TO INTERNET
BANKING WITH SPECIAL REFERENCE TO NATIONAL
CAPITAL REGION
Shamsul Haq Pawan Kumar amp Bilal Mustafa Khan
Abstract
As the used of Internet Banking is increasing the cost of operation minimizing various electronic
delivery channels are increasingly used for delivering products and services at the convenience of
customers at low cost Internet Banking is easing the life of clients of banks The objectives of this
paper to know the factors which are influencing the used of internet banking as well as analyzing the
various risk dimension associated with internet banking
To find out the impact of all these variables a structured questionnaire has been prepared a through
a systematic survey which was conducted at the NCR The number of respondents were 300 belongs
to heterogeneous population The Chi-Square testt-test and Exploratory Factor Analysis (EFA) were
used to interpret the hypothesis the result illustrates population vital statistics impel the adoption of
online banking and also financial and social risk security and time risk and performance risk
contribute to the risk perceptions of banking customers
INTRODUCTION
The acceleration in technology has produced an
extraordinary effect upon our economy in
general has had a particularly produced
profound impact an expanding the scope and
utility of financial products over the last ten
years Information technology has made
possible the creation valuation and exchange
of complex financial products on a global basis
and even that just in recent years Derivatives
are obviously the most evident of many
products that technology has inspired but the
substantial increase in our calculation has
permitted a variety of other products and most
beneficially new ways to unbounded risk
LITERATURE REVIEW
The review of literature reveals that adoption
perception and usage of internet banking
extremely heavily examined by the researchers
Joshua (2009) found that the level of awareness
about Internet banking in the state of Karnataka
in India was 78 among users and 31 among
non-users Internet banking is a widely adopted
electronic banking service next to ATM Singh
(2004) found that a majority of Internet banking
users in South Africa used Internet banking for
inter-account transfers and checking
balancesstatements Payment of bills checking
of account balances printing statements funds
transfer and ordering check books are by far the
most popularly used Internet banking services
in Zimbabwe SournataMattila and Munnukka
(2005) Al-Sabbagh and Molla (2004)- all explore
the various inhibitors and drivers of electronic-
banking adoption They believe there are
relatively few empirical analyses of the impact
of electronic banking on customers As cyber
Shamsul Haq is Assistant Professor at UEI Global Rohini Delhi (email shamsulmbagmailcom) Pawan Kumar is Assistant Professor at ITS Mohan NagarGhaziabad Bilal Mustafa Khan is Assistant Professor at AMUAligarh
Copyright copy2014 by International Journal of Sales Retailing and Marketing Vol 3 No 1 2014
35 IMPACT OF RISK FACTORS RELATED TO INTERNET BANKING WITH SPECIAL REFERENCE TO NATIONAL
CAPITAL REGION
banking is a relatively new concept in context of
delivery of banking services online not so many
studies are available in Indian context Most of
the studies that the authors have gone through
are not in the Indian context
Ahmed and Saima (2008) stated that chances of
fraud and lack of information security are the
vital risks associated with electronic banking in
Pakistan Ming (2009) studied the risk factors in
detail and identified that security risk financial
risk performance risk and timeconvenience
risk have negatively affected the intention to
adopt online banking in Taiwan Almahmeed
et al (2008) conducted a research on all Kuwaiti
and non-Kuwaiti banks It was found that the
awareness of Internet banking proved to be
relatively high among business firms The most
frequently used services by the customers
were reviewing the account balance obtaining
detailed transaction histories obtaining
information about deposits loan interest rates
transfer funds between companyrsquos own
accounts transfer funds to other accounts
within Kuwait transfer funds to other accounts
outside Kuwait and issuing standing orders
Maiyaki and Mokhtas (2010) shown in their
research that there is no relation in between
population statistics and choice of banks It was
also found that statistically there is a significant
relationship between age and choice of banks
Khurana (2009) studied the perception of
Internet banking users through the relationship
between population statistics of users along
with the five independent variables
responsiveness reliability efficiency security of
information and ease of use It depicts there
was no significant relation in between age
occupation sex on the use of number of banks
operate by clients It also explain age has
convincing influence on the operational
efficiency of clients As regards reliability
customers had no trust in websites
Maiyaki and Mokhtas (2010) shown in their
research that there is no relation in between
population statistics and choice of banks It was
also found that statistically there is a significant
relationship between age and choice of banks
Selvam and Nanjappa (2011) in their study
examined customersrsquo awareness and
satisfaction about e-banking of ICICI bank on
the basis of vital statistics of the E-banking
users It depicted that college students are
more awareness level compare to other
education groups The study revealed that
awareness level of income group above 10000
per month was high as compared to other
income groupsIt was shown that it also depend
on the size of family Sex is the crucial issues for
the acceptance of internet banking
Ahmed and Saima (2008) stated that chances of
fraud and lack of information security are the
vital risks associated with electronic banking in
Pakistan Ming (2009) studied the risk factors in
detail and identified that security risk financial
risk performance risk and timeconvenience
risk have negatively affected the intention to
adopt online banking in Taiwan
Shergill and Lis (2005)depicted that women are
more serious regarding the security issues
compare to their male counterparSurvey by
Chung and Paynter (2002)privacy and security
issues are crucial for the adoption of cyber
banking Perceived risk like theft of private
information was concerning issues regarding
the adoption of online banking
Research Objectives
This study was conducted to know the impact
of demographic parameters
To identify the challenges those affect
the customers to use internet banking
To identify the challenges those affect
the banks to launch internet banking
services
To identify the main and general
challenges that affecting the internet
banking
To identify the factors influences
consumers to use internet banking
To measure the relationship between
factors (consumer demographic factors
Internet banking attributes social
Copyright copy2014 by International Journal of Sales Retailing and Marketing Vol 3 No 1 2014
36 IMPACT OF RISK FACTORS RELATED TO INTERNET BANKING WITH SPECIAL REFERENCE TO NATIONAL
CAPITAL REGION
influences) and the acceptance of
internet banking
To examine the factors those
discourage customers from using
internet Banking
To understand the influence of
demographic variables on various
dimensions of risk in the usage of
Internet banking
Hypothesis
H1There is no relationship of
population statistics on the
endorsement of e-banking
H2There is any difference between
users and non-users with regard to
their perception of social forces
H3 There is a difference between user
and non users with regard to their
perception of internet banking
H4 Customersrsquo perceptions of
various risk dimensions in the usage
of Internet banking are independent
of demographic factors
RESEARCH METHODOLOGY
The different parameters related to
respondents like age sex Income and
occupation taken through the structured
questionnaire and cross tabulation is given
belowIt is depicted the respondents complete
profile who were using banking service in NCR
region To evaluate data collected and interpret
it SPSS and Microsoft Excel was used This study
has been conducted to know the influence of
demographic factors in the adoption of E-
banking
Exploratory Factor Analysis (EFA) is employed
for validating the constructs used in the study
The significance of variation in constructs across
demographic variables is analyzed by using an
appropriate test statistic
Sample Size
50 questionnaires have to response from four
commercial centers (The ANSAL PLAZA PACIFIC
MALL EDM MALL and GREAT INDIA PALACE)
would be interviewed therefore 200
respondents from the commercial centers the
100 respondents who are professionals like
Faculties and Parma companies therefore total
number of 300 respondents responded the
questionnaires
Demographic Profiles of Respondents
Analysis has been done through the
demographic profile of the users of cyber
banking than different statistical tools are used
like Chi-square test
Table 11 Gender Profile of respondents
Respondents Profile
Male Female Total
General Respondents 168 56 132 44 300 100
Internet Users 72 60 48 40 120 100
Internet Non-users 96 53 84 47 180 100
Copyright copy2014 by International Journal of Sales Retailing and Marketing Vol 3 No 1 2014
37 IMPACT OF RISK FACTORS RELATED TO INTERNET BANKING WITH SPECIAL REFERENCE TO NATIONAL
CAPITAL REGION
Table 12 Age of Respondents
AGE Group (table 62)
General
Respondents Internet users Internet Non-users
124 41 38 32 86 48
95 32 62 52 33 18
51 17 15 13 36 20
30 10 5 4 25 14
300 100 120 100 180 100
Table 13 Education level of respondents
Education level (table 63)
General
Respondents Internet users
Internet Non-
users
Postgraduate 164 55 104 87 60 33
undergraduate 82 27 11 9 71 39
Highschool 46 15 1 1 45 25
Other 8 3 4 3 4 2
Total 300 100 120 100 180 100
Table 14 Income of respondents
General
Respondent Internal users Internet Non-users
Less than `25000 58 19 2 2 56 31
`25000-`34000 54 18 4 3 50 28
`35000-`44000 50 17 16 13 34 19
`45000-`54000 52 17 32 27 20 11
`55000-`99999 51 17 44 37 7 4
`100000-199999 18 6 18 15 0 0
`200000-299999 0 0 0 0 0 0
over `300000 0 0 0 0 0 0
other 17 6 4 3 13 7
Total 300 100 120 100 180 100
Table 15 Age users ampnon users Cross-tabulation
Count
users ampnon users Total
users non-users
Age
20-29 38 86 124
30-39 62 33 95
40-49 15 36 51
Copyright copy2014 by International Journal of Sales Retailing and Marketing Vol 3 No 1 2014
38 IMPACT OF RISK FACTORS RELATED TO INTERNET BANKING WITH SPECIAL REFERENCE TO NATIONAL
CAPITAL REGION
Table 16 -Chi-Square Tests
Value df Asymp Sig (2-
sided)
Pearson Chi-Square 38973a 3 000
Likelihood Ratio 39454 3 000
Linear-by-Linear
Association 858 1 354
N of Valid Cases 300
a 0 cells (00) have expected count less than 5 The minimum
expected count is 1200
The p of 0000 which is less than 005 Table (16) reflected that chi-square test is significant and
shown that there is a relationship between the age and the adoption of internet banking
Table17-EDUCATION users and non-users Cross-
tabulation
Count
USERAND NON
USER
Total
USE
R
NON-USER
Education
PG 104 60 164
Graduate 11 71 82
High school 1 45 46
OTHER 4 4 8
Total 120 180 300
Table 18-Chi-Square Tests
Value df Asymp Sig (2-
sided)
Pearson Chi-Square 89369a 3 000
Likelihood Ratio 103032 3 000
Linear-by-Linear
Association 58843 1 000
N of Valid Cases 300
a 2 cells (250) have expected count less than 5 The minimum
expected count is 320
The Chi-square is significant (p=0000)(Table-18 ) indicating that there is a significant relationship
between education level and the adoption of internet banking
Above 50 5 25 30
Total 120 180 300
Copyright copy2014 by International Journal of Sales Retailing and Marketing Vol 3 No 1 2014
39 IMPACT OF RISK FACTORS RELATED TO INTERNET BANKING WITH SPECIAL REFERENCE TO NATIONAL
CAPITAL REGION
Table 19-Income of users and non-users cross-tabulation
Internet Banking Total
Income Yes No
Less than 14000 2 56 58
14000 to 24999 4 50 54
25000 to 34999 16 34 50
35000 to 49999 32 20 52
50000 to 99999 44 7 51
100000 to199999 18 0 18
Percent 15 0 6
200000 to299999 0 0 0
over 300000 0 0 0
other 4 13 17
Total 120 180 300
Percent 100 100 100
Table-20-Chi-Square Tests
Value df Asymp Sig (2-
sided)
Pearson Chi-Square 141998a 6 000
Likelihood Ratio 166565 6 000
Linear-by-Linear
Association 59622 1 000
N of Valid Cases 300
a 0 cells (00) have expected count less than 5 The minimum
expected count is 680
The Chi-square is significant (p=0000)(table 20) indicating there is a significant relationship
between the income and adoption of internet banking
Table -21-OCCUPATION USERSampNON Cross-tabulation
Count
USERSampNON Total
USER NON-USERS
OCCUPATION
Employed 92 93 185
Un-Employed 0 38 38
Pensioners 2 5 7
Self-employed 24 34 58
OTHER 2 10 12
Total 120 180 300
Table 22-Chi-Square Tests
Copyright copy2014 by International Journal of Sales Retailing and Marketing Vol 3 No 1 2014
40 IMPACT OF RISK FACTORS RELATED TO INTERNET BANKING WITH SPECIAL REFERENCE TO NATIONAL
CAPITAL REGION
Value df Asymp Sig (2-
sided)
Pearson Chi-Square 35780a 4 000
Likelihood Ratio 49486 4 000
Linear-by-Linear
Association 5137 1 023
N of Valid Cases 300
a 3 cells (300) have expected count less than 5 The minimum
expected count is 280
Table 22 establishes that there is a significant interconnection between occupation and the
adoption of internet banking
Table 30(t-test) This sections tests the hypothesis that there is a significant difference between
users and non-users with regard to their perception of relative advantage of internet banking
Most attitudinal factors including factors including relative advantage compatibility complexity
perceived risk and perceived cost are found to be significant however complexity perceived risk and
perceived cost present a negative relationship Social influences did not result in any significant
differences between users and non-users
Table 30
Group Statistics
internet users N Mean
Std
Deviation
Std Error
Mean
work Style users 120 46250 67441 06157
Non-
users
180 26944 89128 06643
life convenient users 120 41083 60524 05525
Non-
users
180 26222 95224 07098
program is easy users 120 35167 102066 09317
Non-
users
180 27944 89503 06671
Internet banking is
complex
users 120 22917 92032 08401
Non-
users
180 35222 89352 06660
Process is Simple users 120 38083 89156 08139
Non-
users
180 25778 77644 05787
Time saving users 120 41333 67280 06142
Non-
users
180 32833 114957 08568
comfortable with bank users 120 40167 69794 06371
Non-
users
180 29278 99176 07392
Copyright copy2014 by International Journal of Sales Retailing and Marketing Vol 3 No 1 2014
41 IMPACT OF RISK FACTORS RELATED TO INTERNET BANKING WITH SPECIAL REFERENCE TO NATIONAL
CAPITAL REGION
Telecommunication cost users 120 20083 96577 08816
Non-
users
180 40722 60750 04528
fees are expensive users 120 28167 79898 07294
Non-
users
180 40667 72157 05378
Reliability and Validity
Reliability is determined by the Cronbachrsquos
coefficient alpha ( ) Nunnaly (1978) suggested
that for any research at its early stage a reliable
score or alpha that is 060 or above is sufficient
As shown in Table 4 all the construct
reliabilities surpassed the required minimum
EFA is applied on the data collected from 300
respondents to reduce the variables to a few
factors for further analysis The Kaiser-Meyer-
Olkin (KMO) measure of sampling adequacy
(KMO = 0735) is greater than the rule of thumb
050 and Bartlettrsquos test of sphericity is
significant which means that the items
included in the scale do have a correlation with
each other Thus factor analysis is found to be
an appropriate technique for construct validity
The variables which had loadings of less than
050 were excluded and dimensions with eigen
values of more than 1 were retained Table 4
exhibits the Rotated Factor Loadings (RFL)
percentage of Variance Explained (VE) by each
factor and Cronbahrsquos Alpha (CA) It is observed
that all the items have high factor loadings and
therefore all items are accepted and the
construct validity of the instrument is
established
Factor 1
It is the most vital factor that contributes to the
risk perceptions of Internet banking users which
explains 4321 of the variation Five items are
loaded on this factor This factor consists of
items associated with financial risk and social
risk as characterized by Featherman and Pavolu
(2003) and therefore this factor is labeled as
lsquofinancial and social risk
Factor 2
Four items are loaded on this factor which
explains 1326 of the variation This factor
consists of items associated with security risk
and time risk (Featherman and Pavolu 2003)
and therefore this factor is labeled as lsquosecurity
and time risk
Factor 3
Two items are loaded on this factor which
explains 1196 of the variation This factor
consists of items associated with performance
risk (Featherman and Pavolu 2003) and
therefore this factor is labeled as lsquoperformance
risk
Copyright copy2014 by International Journal of Sales Retailing and Marketing Vol 3 No 1 2014
42 IMPACT OF RISK FACTORS RELATED TO INTERNET BANKING WITH SPECIAL REFERENCE TO NATIONAL
CAPITAL REGION
Table 40 Customer Risk Perception of Usage of Internet Banking at National Capital region
Factorvariable RFL VE() CA
Factor 1 0832
I am afraid that I will lose money through Internet banking 0759
I worry that I will not get compensation if an error occurs 0763
My friend relatives and colleagues would think less of me if something wrong
with my internet banking account 0753 4321 0775
if fraud or hacking occurs to my Internet banking it will effect my status 0865
If an error occurs I will have to waste a lot of time to correct it 0663
Factor 2
It would take a lot of time to learn how to use Internet banking 0725
I feel unsafe to provide personal information over Internet banking 0659 1326 0765
I worry that other people may access my Internet banking account 0865
I would not feel secure sending sensitive information over
Internet banking 0771
Factor 3
Internet banking servers may not perform well due to low speed 0863 1321 0125
Internet banking servers may process payments incorrectly 0654
Note Principal Component Analysis Rotation Method Varimax with Kaiser Normalization Rotation
converged in 5 iterations
FINDINGS AND CONCLUSION
Most of the users are middle-aged (ie between
(31-39) have monthly income in excess `25000
are educated to Post Graduate level and
belongs to working class Research depicted
that only 28 percent banking clients were using
internet banking after evaluating the population
characteristics it was no significant relationship
in between age and use of cyber banking (the
significance level is 0005 in the chi-square
tests) It also depicted that there is no relation
in between gender and the adoption of internet
banking (the significance level is 0000 so we
assume null hypothesis) There is a gender
neutrality in the adoption of e-banking
Qualification in terms of education and income
of respondents were playing the role in the
acceptance of online banking (At the
Significance level of the chi-square test is 0 so
we reject null hypothesis)
This research depicted that users of internet
banking are increasing as their income and
education standard is improving number of
users depending upon the education standard
of internet banking users with income
Therefore it is the need of time financial literacy
of the users should be increased through
various programs could be run by the banks to
increase the awareness of internet banking
There is still a lot needed for the banking
system to make reforms and train their
customers for using internet for their banking
account Going through the survey main
problem lies that still customers have a fear of
hacking of accounts and thus do not go for
internet banking Banks are trying their level
best by providing the best security options to
Copyright copy2014 by International Journal of Sales Retailing and Marketing Vol 3 No 1 2014
43 IMPACT OF RISK FACTORS RELATED TO INTERNET BANKING WITH SPECIAL REFERENCE TO NATIONAL
CAPITAL REGION
the customers but there are a lot of factors
which betrays a customer from opening an
internet bank account
By that way banks could be able to reduce the
rush at the branches and operating cost also
therefore Banks are now spending heavily on
information technology front but from the side
of the government there is requirement to
invest on the infrastructure like electricity and
internet
The present study considered prominent risk
variables affecting adoption of Internet
banking and EFA segmented these variables
into three dimensions which are labeled as
financial and social risk security and time risk
and performance risk A cross- analysis of these
factors across different demographic variables
revealed that females perceive more risk than
males in the case of financial and social risk
Old customers perceive more security and time
risk than the young Businessmen perceive
more financial and social risk than employees
Undergraduates perceive more financial and
social risk than postgraduates Respondents
with basic level of computer knowledge
perceive more security and time risk than
respondents with advanced level of computer
knowledge Therefore it is concluded that
variables relating to different dimensions of risk
are different to a certain extent to different
categories of customers
It is useful from the view of clients as well as
the banks therefore in the coming years E-
banking reshape the traditional banking
REFERENCES
Ahmed Kaleem and Saima Ahmad (2008)
ldquoBankers Perceptions of Electronic Banking in
Pakistanrdquo Journal of Internet Banking and
Commerce Vol 13 No 1 pp 1-16
Ahmed Kaleem and Saima Ahmad (2008)
ldquoBankers Perceptions of Electronic Banking in
Pakistanrdquo Journal of Internet Banking and
Commerce Vol 13 No 1 pp 1-16
Almahmeed M AAlshirbini A and Paul G (2008)
ldquoAn Analytical Study of the Business Customer
Awareness PerceptionAttitude and Level of
Satisfactionrdquo Research Report Institute of
Banking Studies
Al-Sabbagh I and Molla A
(2004)Determinants of Internet and Cell Phone
Banking Adoption in South Africa available at
wwwarraydevcom commercejibc2005-
02brownhtm accessed in April 2005
Chung W and Paynter J (2002) An Evaluation
of Internet Banking in NewZealand in
Proceedings of 35th Hawaii Conference in
System Sciences (HICSS 2002) IEEE Society
Press 4 Gefen D Karahanna E and Straumlub
Featherman M S and Pavlou P A (2003)
ldquoPredicting e-Services Adoption A Perceived
Risk Facets Perspectiverdquo International Journal
of Hum Comput Stud Vol 59 No 4 pp451-
474
Joshua A J (2009) ldquoAdoption of Technology-
Enabled Banking Self-Services Antecedents and
Consequencesrdquo published PhD thesis
submitted to CUSAT Faculty of Social Sciences
Cochin available at
httpdyuthicusatacinxmluibitstreamhandl
epurl2010adoption 20of20technology-
enabled20banking20self-
services20pdfsequence =1 Accessed on
June 20 2011
Khurana S (2009) ldquoManaging Service Quality
An Empirical Study on Internet Bankingrdquo The
IUP Journal of Marketing Management Vol
VIII Nos 3 amp 4 pp 96-113
Maiyaki A and Mohd Mokhtas SS (2010)
ldquoEffects of Electronic Banking
FacilitiesEmployment Sector and Age Group on
Customersrsquo Choice of Banks in NigeriardquoJournal
of Internet Banking and Commerce Vol 15 No
1 pp 1-8
Maiyaki A and Mohd Mokhtas SS (2010)
ldquoEffects of Electronic Banking
FacilitiesEmployment Sector and Age Group on
Customersrsquo Choice of Banks in NigeriardquoJournal
of Internet Banking and Commerce Vol 15 No
1 pp 1-8
Selvam V and Nanjappa C (2011) ldquoCustomersrsquo
Awareness and Satisfaction About E-Banking A
Copyright copy2014 by International Journal of Sales Retailing and Marketing Vol 3 No 1 2014
44 IMPACT OF RISK FACTORS RELATED TO INTERNET BANKING WITH SPECIAL REFERENCE TO NATIONAL
CAPITAL REGION
Study with Reference to ICICI Bank
Gobichettipalayam TownrdquoPrajnan Vol 39 No
3 pp 218-22729 Sharma N Sehgal R K and
Goyal D P
Shergill GS and Li B (2005)Internet banking -
An empirical investigation of customers
behavior for online banking in New
ZealandJournal of E-business Vol 5(1) pp1-
169 Siu NY-M and Mou JCW(2005)
Singh A M (2004) ldquoTrends in South African
Internet Bankingrdquo Aslib Proceedings New
Information Perspectives Vol 56 No 3 pp
187-196
Suoranta M Mattila M and Munnukka J
(2005) Technology based Services A study on
the Drivers and Inhibitors of mobile
bankingInternational Journal of Management
and Decision Making Vol 6(1)
SURVIVING OR THRIVING AN EXPLORATORY STUDY INTO COMPETING FOR THE SOUTH AFRICAN
45
Copyright copy2014 by International Journal of Sales Retailing and Marketing Vol 3 No 1 2014
SURVIVING OR THRIVING AN EXPLORATORY STUDY
INTO COMPETING FOR THE SOUTH AFRICAN
SUPERMARKET SHOPPER
Justin Beneke
Abstract
The supermarket sector is a major component of the retail industry in South Africa Yet these
particular retail stores largely exist in a lsquosea of samenessrsquo where only subtle characteristics
differentiate them from each other This paper aims to investigate the means through which such
chains can achieve competitive advantage through the creation of customer commitment Whilst
structural bonds might create the impression that customers are loyal commitment goes beyond
behavioural loyalty and is argued to be a better indicator of the customerrsquos propensity to patronise
the retailer into the foreseeable future Through consideration of the retail mix this study determines
that low prices in-store promotions and facilities do not necessarily lead to customer commitment
whereas superior customer service and quality and variety of store merchandise are considerably
more influential in this respect However on the whole customer commitment in the supermarket
sector remains somewhat poor and needs to be further entrenched
Keywords behaviour commitment satisfaction structural bonds supermarkets retail mix
INTRODUCTION
There is little doubt that supermarket retailing
is a competitive business (Levy amp Weitz
2011187) Retailers need to face the realities of
todayrsquos market ndash changing demographics
increasingly sophisticated competitors and
overcapacity of the industry (Beneke 2010203
Cant amp Machado 200984 Kotler 200319)
Managing customer commitment is more
important than ever to ensure not only that
sales are bolstered but also to build continuous
patrongage and ultimately maximise customer
lifetime value (Stauss Chojnacki Decker amp
Hoffmann 20017 Thomas 2001262 Rowley
2005574) Committed customers have an
emotional connection with the retailer Their
reasons for continuing to patronise the retailer
extend beyond the convenience of the retailerrsquos
store andor the low prices and specific brands
on offer In fact many feel such goodwill
towards the retailer that they actively
encourage friends and family to buy from it
(Geyskens Steenkamp Scheer amp Kumar
1996303 Heskett 2002355 Kessim amp Abdulla
2006 424 Morgan amp Hunt 199420) Thus an
effective relationship marketing strategy for
managing commitment and loyalty with
customers is essential in retaining valuable
customers and subsequently developing a
sustainable competitive advantage (Liljander amp
Roos 2002 593)
Kotler and Armstrong (201032) define a
supermarket as a large low-cost low-margin
high-volume store that carries a wide variety of
food laundry and household products The
Justin Beneke is Senior Lecturer of Marketing at School
of Management Studies University of Cape Town
Tel 021 650 4392
Fax 021 689 7570
E-mail JustinBenekeuctacza
SURVIVING OR THRIVING AN EXPLORATORY STUDY INTO COMPETING FOR THE SOUTH AFRICAN
46
Copyright copy2014 by International Journal of Sales Retailing and Marketing Vol 3 No 1 2014
South African supermarket industry includes
major supermarkets such as the Pick n Pay
Shoprite SPAR and Woolworths groups as well
as some lesser known brands which are mainly
situated in smaller towns (FastMoving
2013Internet) The retail mix comprising the
various elements of the retailing function is
utilised by these stores to entice customers and
influence their purchasing behaviour Elements
in the retail mix include merchandise
assortments location pricing customer
service store design and display and the
communication mix of the retailer (Levy amp
Weitz 2011189) Retailers are thus faced with
the challlenge of developing a retail mix that
effectively satisfies its target market and drives
customer commitment
RESEARCH STATEMENT
This study aims to investigate the antecedents
of customer behaviour and commitment in the
South African supermarket industry Whilst
some customers might be behaviourally loyal
they may not necessarily possess true
commitment This may mean they are
vulnerable to defection in due course By
identifying and examining the significance of
these underlying drivers supermarket chains
can refine their strategy to play to their
strengths and minimise their weaknesses The
status quo of the industry will thus be probed
so as to determine general customer
satisfaction levels and the perceived
importance of retail mix attributes
LITERATURE REVIEW
The relationships between satisfaction loyalty
and commitment
Customer loyalty has become an increasingly
important aspect of marketing in the 21st
century (Beneke 2010203 Duffy 2005284)
Baker and Bass (200372) attributes this trend
to the rise of relationship marketing Slow
growth rates in mature markets have resulted
in the pool of new prospects being diminished
steering marketing attention toward retaining
and growing existing customer relationships
Consequently lsquocustomer loyaltyrsquo achieved
priority
Customer loyalty is described as a deeply held
commitment to re-buy or re-patronise a
preferred product or service consistently in the
future thereby causing repetitive same-brand
or same brand-set purchasing despite
situational influences and marketing efforts
having the potential to cause switching
behaviour (Knox 1998729 Oliver 199933
Passikoff 200614) Bowen and Chen (2001213)
assert that customer loyalty is difficult to define
and in general there are three distinctive
approaches to measure loyalty behavioural
measures attitudinal measures and composite
measures
The behavioural measurements consider
consistent repetitious purchase behaviour as
an indicator of loyalty (Bowen amp Chen
2001214) thus making a major assumption
that this repeat purchasing could capture the
loyalty of a consumer towards the supplier of
interest (Bandyopadhyay amp Martell 200735)
Oliver (199933) suggests that customer
satisfaction developed by way of product usage
is a necessary step in loyalty formation
however it becomes less significant as loyalty
begins to set through other mechanisms such as
individual fortitude (ie the degree to which the
consumer resists competitive pressure to switch
over to another brand) and social bonding (ie
the degree to which the community or the
society supports the consumer to remain loyal)
Attitudinal measurements consider the
emotional and psychological attachment
inherent in loyalty The attitudinal
measurements are concerned with the actual
sense of loyalty engagement and allegiance
(Bowen amp Chen 2001213) According to this
definition loyalty is the biased (ie non-
random) behavioural response (ie purchase)
expressed over time by some decision making
unit with respect to one or more alternative
suppliers out of a set of such suppliers and is a
SURVIVING OR THRIVING AN EXPLORATORY STUDY INTO COMPETING FOR THE SOUTH AFRICAN
47
Copyright copy2014 by International Journal of Sales Retailing and Marketing Vol 3 No 1 2014
function of psychological (decision making and
evaluative) processes (Jacoby amp Kyner 19731)
Jacoby and Kyner (19732) express that it is the
evaluation process that makes an individual
develop a commitment towards a supplier
The attitudinal and behavioural approaches
however examine loyalty unidimensionally In
contrast composite measurements of loyalty
combine the attitudinal and behavioural
dimensions and measure loyalty by variables
such as customersrsquo product preferences
propensity of brand-switching frequency of
purchase recency of purchase and total
amount of purchase (Hunter 199818 Pritchard
amp Howard 19972 Wong Dean amp White
199953)
A reputable example of the analysis of loyalty
using composite measurements is that
proposed by Dick and Basu (199499) who
argue that loyalty is determined by the strength
of the relationship between relative attitude
and repeat patronage and thus has both
attitudinal and behavioural elements Dick and
Basursquos (1994 cited by Garland amp Gendall
200481) customer loyalty model is an elegant
conceptualisation of attitude and behaviour
(Garland amp Gendall 200481) They suggest that
loyalty is the result of the interaction between a
customerrsquos relative attitude to a brand or
store and their repeat purchase behaviour The
typology divides customers in to four loyalty
groups (Dick amp Basu 199499) depicted in table
1
1 True loyals are customers with high
attitudinal and behavioural loyalty
2 Spurious loyals are those with high
behavioural loyalty but low attitudinal
loyalty
3 Latent loyals are those with high attitudinal
loyalty but low behavioural loyalty
4 Non loyals are those with low attitudinal and
behavioural loyalty
TABLE 1 DICK AND BASUrsquoS LOYALTY MODEL
Repeat Patronage
High Low
Relative
Attitude
High True loyalty Latent loyalty
Low Spurious loyalty No loyalty
Source Dick and Basu 1994 cited in Garland and Gendall 2004 82
Customer loyalty appears to be one of the most
discussed and contentious marketing concepts
of recent years (Through the Loop Consulting
2002Internet) Much of this debate and
ambiguity stems from the relationship between
customer loyalty and satisfaction Customer
satisfaction is
defined as the state in which customer needs
wants and expectations through the products
or servicesrsquo life are met or exceeded resulting in
repurchase brand loyalty and willingness to
recommend (Nicolson Kemp amp Linnell 19966)
Oliver (199933) argues that the two concepts
are
distinct Satisfaction is a fairly temporal post
usage state for one-time consumption or a
repeatedly experienced state for ongoing
consumption that reflects how the product or
service has fulfilled its purpose Loyalty on the
other hand is an attained state of enduring
preference to the point of determined defence
However he contends that satisfaction is an
essential ingredient for the emergence of
loyalty The ability to convert satisfied
customers into loyal customers is the pivot of
long-term success (Gitomer 19987)
It would appear that high customer satisfaction
does not always correlate with repeat
purchases and therefore with healthy profits
(Yudkin 199922) Dissatisfied customers donrsquot
always defect and satisfied customers
sometimes do Thus satisfaction alone cannot
SURVIVING OR THRIVING AN EXPLORATORY STUDY INTO COMPETING FOR THE SOUTH AFRICAN
48
Copyright copy2014 by International Journal of Sales Retailing and Marketing Vol 3 No 1 2014
predict future behaviour and customers may
even remain behaviourally loyal and not even
be happy with the product or service
Such behaviour has diminished the validity of
examining loyalty from only a behavioural
perspective Bandyopadhyay and Martell
(20072) assert that the existence of situational
factors (such as stock-out and non-availability)
intrinsic factors (such as individual fortitude) or
socio-cultural factors (such as social bonding)
that can differentiate between repeat purchase
and loyalty have prompted recent works that
have called for understanding and
operationalising brand loyalty beyond
behavioural measures Consequently advocates
of attitudinal loyalty have emphasised the
importance of the concept of customer
commitment
Customer commitment has sought to unravel
the confusion between satisfaction and loyalty
As such commitment involves the desire or
intention to maintain a valued relationship into
the future (De Wulf Odekerken-Schroumlder amp
Iacobucci 200133 Gundlach Achrol and
Mentzer 199578 Liljander and Leverin
2006232) Commitment is psychological rather
than behavioural and thus examines loyalty
from an attitudinal perspective Hofmeyr and
Rice (200355) contend that marketers cannot
deduce what consumers feel by observing their
behaviour Somebody who appears loyal could
in fact be completely uncommitted and switch
brands at the next purchasing occasion But
what customers feel dictates the way in which
the relationship between the customer and the
brand should be managed Commitment is
arguably synonymous with attitudinal loyalty
and thus these terms are often used
interchangeably
Commitment is built gradually during the
development of a relationship and parties can
be committed for different reasons Venetis and
Ghauri (20041577) identify three general
antecedents to commitment relational bonds
that are created between parties during the
course of the relationship the trust that has
been established between the partners and the
service quality
Relational bonds can be structural or social in
nature Structural bonds are the in a
relationship that if terminated will result in
considerable economical or financial costs for
the parties (Venetis amp Ghauri 20041577)
Turnbull and Wilson (1989233) assert that the
creation of a structural bond happens when the
two parties make investments that cannot be
retrieved when the relationship ends or when
it is difficult to end the relationship due to the
complexity and cost of changing suppliers The
more investments are made in a relationship
the more difficult its disengagement becomes
and the more a party will be committed to
continue the relationship regardless of their
satisfaction with the supplier An example of
such would be if the consumer is unable to
switch suppliers because the alternatives
require excessive travelling and as a result a
cost could be involved in transportation which
the consumer may not be able to afford
The social bonds are the interpersonal
relationships between the buyer and seller
(Turnbull amp Wilson 1989233 Bendapudi amp
Leone 20023) which are the glue that holds
the individuals together (Venetis amp Ghauri
20041577) Wilson (1995 cited by Venetis amp
Ghauri 2004) found that buyers who have a
strong personal relationship with the sellers are
more committed to maintaining the
relationship
The level of service quality is directly correlated
with the satisfaction the customer receives
from the supplierrsquos offering Satisfaction is
considered an important but not a necessary
condition for a party to be committed to the
relationship Genesan (19941) found that
satisfaction is directly and significantly related
to a partyrsquos relationship commitment whereas
Morgan and Hunt (199420) found that it did
not contribute significantly to a partyrsquos
commitment in comparison with structural ties
trust and share values Thus although
satisfaction is positively related to a partyrsquos
SURVIVING OR THRIVING AN EXPLORATORY STUDY INTO COMPETING FOR THE SOUTH AFRICAN
49
Copyright copy2014 by International Journal of Sales Retailing and Marketing Vol 3 No 1 2014
relationship committed its relative
contribution compared to the other
antecedents may be very small or insignificant
(Venetis amp Ghauri 20041577)
Venetis and Ghauri (20041577) contend that
only if the partner is considered trustworthy will
a party be willing to invest in and become
committed to the relationship thus trust is
needed for a relationship to develop Trust has
been defined as a consumerrsquos belief that another
party will perform actions that will lead to
positive outcomes for the firm as well as not
take unexpected actions that can lead to negative
outcomes (Anderson amp Narus 1990 cited by
Venetis amp Ghauri 2004) It reduces perceived
uncertainties and risk and is considered a key
variable for relationship success (Boersma
Buckley amp Ghauri 2003 1031 Morgan amp Hunt
199420 Kemp amp Ghauri 19986)
Retailers alas have limited direct control over
the relational bonds trust and satisfaction of
their customers However the retail mix
provides a set of tools which can be utilised
when developing a marketing strategy for
targeting customer commitment and loyalty
variables
Utilising the Retail Mix to influence Customer
Behaviour
The retail mix is used by retailers to ensure their
customersrsquo needs are met Elements in the
retail mix include merchandise assortments
location pricing customer service store design
and display and the communication mix of the
retailer (Levy amp Weitz 2011189) The dilemma
faced by marketers is to develop a retail mix
that creates customer satisfaction as well as
building customer commitment and loyalty
These aspects are explored below
Merchandise Assortments
Merchandise assortments are optimised by
retailers to ensure that the stock on shelf
matches customer demand Customers should
therefore have an adequate selection of
merchandise to choose from thereby
facilitating the ability to select the merchandise
which bests suits their needs and provides them
with satisfaction (Curhan 1972406)
Private label brands also known as store
brands are another variation of merchandise
assortment which retailers employ as an
instrument for generating store differentiation
store loyalty and store profitability (Corstjens amp
Lal 2000281 Mullick-Kanwar 2013Internet)
Private label brands typically have lower
variable costs and thus higher margins (Hoch amp
Banerjee 199357) Furthermore these brands
enable retailers to get better deals from
manufacturers in the form of lower wholesale
prices on national brands (Corstjens amp Lal 2000
281)
It is essential for retailers to supply high quality
merchandise and not just focus on offering
inexpensive low-quality products In other
words failing to provide the right combination
of high quality and low prices may result in a
merchandise assortment that is unsuccessful in
creating satisfaction amongst customers
(Stambaugh 199369)
CustomerService
Customer service with its final effect on
repurchasing by customers is considered one of
the most important constructs of the retail mix
(Caruana 2002811) Research points to the fact
that effective customer service satisfies
customers and in turn increases loyalty Lewis
and Booms (1983 cited by Caruana 2002) assert
that customer service is all about what
customers expect and the perceptions of how
these services are actually performed
Customer service tactics are highly effectively in
building commitment and loyalty It is widely
acknowledged that customers like to feel
appreciated The most effective channel at
achieving this in retail is by developing
favourable relationships between employees
and customers The first few words between
the employee and the customer set the tone for
the entire dialog and possibly even the entire
relationship Thus Gitomer (19988) asserts
that the single most important brick in the
SURVIVING OR THRIVING AN EXPLORATORY STUDY INTO COMPETING FOR THE SOUTH AFRICAN
50
Copyright copy2014 by International Journal of Sales Retailing and Marketing Vol 3 No 1 2014
foundation of customer service is ldquofriendlyrdquo A
friendly foundation is further complemented by
a positive attitude which represents the best
possibility of creating a positive customer
perception of the entire company Bad Service
experiences often drive a wedge between a
customer and a supplier (Duffy 2003480)
Retailers may provide unusually high-quality
customer service to build and maintain the
commitment and loyalty of their best
customers (Levy and Weitz 2011190) Heskett
Jones Loveman Sasser amp Schlesinger
(1994164) suggest that customer service will
lead to increases in firm profitability and market
value through the service-profit chain This
model proposes that customer service creates
positive consumer cognitions and behaviours
such as satisfaction and loyalty that create
financial benefits for the firm (Wiles 200719)
Customer service by providing additional value
for customers leads to increased customer
satisfaction (Anderson and Mittal 2000107)
Satisfaction in turn leads to increased
retention (Bolton 199845 Thomas 2001262
Zeithaml 200067) and to increased acquisition
through word-of-mouth recommendations
(Cronin and Taylor 199255) Retailer customer
service has been found to increase customer
satisfaction thus leading to increased
repurchase intentions willingness to
recommend and share-of-wallet (Beatty
Mayer Coleman Reynolds amp Lee 1996223
Dabholkar Thorpe and Rentz 19963 Reynolds
and Beatty 199911 Sirdeshmukh Singh and
Sabol 200215)
Improved customer service is a direct result of
well-organized employee training (Gallo
2012Internet) Cram (19949) argues that
employee training firstly requires the right staff
since without potential no amount of
dedicated training and development can
succeed Setting clear operational controls for
employees and communicating them effectively
is the basis for their understanding of the
organisationrsquos objectives This provides a sense
of direction in which any employee should
move in serving customers and solving their
problems Training can involve the usage of the
products sold or the best retailing techniques to
employ (Cram 19948) Training has its own
intrinsic merits in the way it can boost
operational efficiency and competence Part of
training is to refresh and update staff in order
to keep them informed of new initiatives and
changes The interaction between the customer
and the positive and enthusiastic employee can
provide an instantaneous positive impression
(Cram 19949) Store Location
Retail location is often considered to be the
most important element of the retail mix due to
the time and expense that is needed to find the
right location (Dufton Bailey amp Hopkins
2001Internet) The store choice decision can be
conceptualised as a problem of deciding where
and when to shop for the consumer (Popkowski
Leszczyc Sinha amp Timmerman 2000323) Store
choice and location are thus interrelated and
play a pivotal role in the decision making
process when deciding which store to attend
Store choice is dependent on the timing of
shopping trips as consumers may go to a
smaller convenient retail stores for short fill-in
trips and go to a larger store for regular
shopping trips (Kahn and Schmittlein 198955)
Store location thus has an impact on
convenience to customers as well as the type
of merchandise offered
Pricing
The price in a transaction is the balance point
between the interests of two parties In its
simplest terms it may represent the lowest
figure the supplier is prepared to accept for
parting with the product and the highest
amount the customer is prepared to pay The
essence of relationship marketing is that prices
should be driven by understanding the
customer Cram (199410) suggests that greater
value tends to be appreciated and builds
loyalty Further to this price should never be
used as a promotional weapon Price
promotions can result in unfavourable
outcomes They can start price wars teach
customers to await the next offer create
SURVIVING OR THRIVING AN EXPLORATORY STUDY INTO COMPETING FOR THE SOUTH AFRICAN
51
Copyright copy2014 by International Journal of Sales Retailing and Marketing Vol 3 No 1 2014
expensive demand surges and lead to
subsequent demand collapses
As the cost of advertising has dramatically
increased in recent years marketers are
increasingly turning to pricing and price related
promotions as a means of influencing
purchasing decisions by consumers
(Krishnamurthi amp Raj 1991172) Retailers have
realised the importance of pricing mechanisms
within marketing strategy and the role price
plays with regards to store loyalty and
commitment Customers who are committed to
specific brands will be less-sensitive to brand
price and thus not be concerned with the prices
of substitutes These consumers are more
inclined towards supermarkets which provide
them with a large assortment of merchandise
together with occasional discounted prices
Pricing is thus a pivotal component of the retail
mix and should be carefully managed to
consider all income groups and especially the
target market to attract customers and build
rapid short-term commitment
Communication Mix
A relationship begins with a conversation and
continuing communication maintains and
sustains it (Risdall 2013Internet) The most
important part of the communication strategy
is to ensure that communication is sufficiently
frequent More customers are lost through lack
of follow up and what appears to the
customers to be indifference than any other
cause of lost sales A study of competitor
communications may indicate real
opportunities to get closer to customers (Cram
19947)
A sales promotion is the offer of an incentive to
induce a desired sales result (Gilbert 1999 4) It
is a fundamental component of the
communication mix however researchers have
concluded that sales promotions can only lead
to a short-term increase in sales (Banks amp
Moorthy 1999371 Bawa amp Shoemaker
1987370 Diamond 1992254 Gupta amp Cooper
1992401 Kopalle amp Mela 1999317 Smith amp
Sinha 200083)
Store layout and design
Design management covers the store
environment packaging literature and
corporate identity It was discovered that
British consumers expect packaging to be of a
superior standard and thus are only attracted to
innovative packaging within stores (Vazquez
and Bruce 2002202) Design is thus a tool
which retailers employ in their marketing
strategy to differentiate their merchandise and
in the process strengthen their marketing
position Furthermore design can further be
broken down into pack store and corporate
design These three factors are essential for
effective store design and play an imperative
role with regards to consumersrsquo psychological
defences and entice them in becoming more
involved as well as interested in the retailerrsquos
merchandise
Store design goes beyond just the word
ldquodesignrdquo It involves atmospherics and adding
an ambience to attract customers thereby
creating a pleasurable buying experience
(Vazquez amp Bruce 2002202) It entails
developing certain areas and creating strategies
which will enhance customer commitment in
the process It was revealed that a strong brand
image influences buyer behaviour and purchase
decisions in a positive manner (Porter amp
Claycomb 1997373) A strong identity is thus
necessary in supermarket retailing and must be
managed with utmost care to create a cohesive
and persuasive shopping experience (Fitch
199158)
The importance of store design has undertaken a
new meaning within the retail industry in
underpinning supermarket positioning Viewing
areas special displays aisle widths and
customer traffic flows all influence the
customerrsquos impression of the store and as a
result determine levels of spending within the
store (Doyle amp Broadbridge 199972) This
requires ongoing management and can have a
SURVIVING OR THRIVING AN EXPLORATORY STUDY INTO COMPETING FOR THE SOUTH AFRICAN
52
Copyright copy2014 by International Journal of Sales Retailing and Marketing Vol 3 No 1 2014
significant impact on the perceived image of the
store (Newman amp Cullen 2001449)
METHODOLOGY
General Approach
In order to obtain a comprehensive view of the
elements of supermarket retailing strategy in
South Africa as well as attain an in depth
understanding of customer commitment
experience interviews were conducted
Valuable insight was provided from both an
academic and a commercial perspective
Experience interviews were conducted with
Alice Louw (Global amp Key Accounts Manager at
TNS Customer Equity) Suzanne Ackerman-
Berman (Director in Chairmanrsquos Executive
Committee at Pick n Pay) and Leon Erens
(Woolworths Constantia Store Manager)
Following the completion of the qualitative
research phase outlined above empirical data
needed to be collected in order to quantify the
analysis of customer commitment in relation to
supermarket retailing strategy Descriptive
research was conducted by constructing a self-
administered questionnaire which was
successfully completed by 304 respondents
from the general public Selecting which people
to survey was based on non-probability
sampling Quota sampling was also used to
ensure a fair representation of mainstream
supermarket customers in South Africa based
on data from Statistics South Africa and the All
Media amp Product Survey Although the sample
achieved is not necessarily reflective of the
South African population at large it is
reasonably in keeping with the profile of
mainstream supermarket shoppers in the
country
Overview of the Demographic Profile of the
Sample
The largest percentage of respondents was
Black (39 percent) followed by White (30
percent) and then Coloured (23 percent) while
the Indian and Asian population groups were
less significant (6 percent and 1 percent
respectively) The sample was split fairly evenly
between male and female respondents
However as special effort was made to
interview female respondents owing to them
generally being the primary household
shoppers there is a slight bias toward females
(58 percent) relative to males (42 percent) The
largest proportion of respondents was between
ages 18 and 25 (45 percent) followed by the 26
to 35 group (26 percent) and then the 36 to 45
group (14 percent) while ages 46 and above
were less significant (15 percent collectively)
The sample is thus to some extent biased
toward the younger demographic The sample
provided a fair representation of all the income
groups ndash higher income groups (ie earning R
15 000 per month and above) only represented
28 percent of respondents
Although slight biases were observed (eg the
sample skewed towards young to middle aged
Black lower-medium income group
respondents) this was deemed to be reasonable
as these nuances reflected the demographic of
the urban supermarket in South Africa
EMPIRICAL FINDINGS AND DISCUSSION
The relationship between customer loyalty and
the underlying antecedents (namely
satisfaction involvement an emotional
connection trust and structural relational
bonds) were comprehensively discussed in the
literature review Through utilising a basic
descriptive analysis the characteristics of the
average respondent with respect to these
antecedents and their loyalty were uncovered
These are detailed in table 2 Five point
semantic differential scales were used for all
except the last two scales listed in the table
SURVIVING OR THRIVING AN EXPLORATORY STUDY INTO COMPETING FOR THE SOUTH AFRICAN
53
Copyright copy2014 by International Journal of Sales Retailing and Marketing Vol 3 No 1 2014
TABLE 2 DESCRIPTIVE STATISTICS OF ATTITUDINAL AND BEHAVIOURAL CHARACTERISTICS
Characteristic Overall Response Mean Std Dev
Importance of store choice decision Important 138 049
Degree of loyalty Loyal 194 046
Loyal to the store because Satisfied with the offering 123 044
Satisfaction with the store offering Satisfied 416 067
Importance of an emotional connection Neutral 304 104
Importance of trust Important 391 081
Behavioural loyalty score Moderate ndash 15 out of 30 1507 366
Commitment score Moderate ndash 16 out of 30 1633 418
Source Authorrsquos own compilation
The average respondent considered which
supermarket store heshe shopped at to be an
important decision considered himherself
loyal to one specific supermarket store but
nonetheless shopped at other supermarkets
frequently and was generally satisfied with this
specific supermarketrsquos offering (S)he
considered the trustworthiness of this specific
store to be important but was indifferent over
whether (s)he had an emotional connection
with this specific store Lastly the average
respondent indicated both a commitment and
behavioural loyalty score in the moderate
range
The importance of trust was reiterated by Leon
Erens who asserts that customers desire value
for their money and trust gives them an
assurance of the value they will be receiving
Not only is it essential for the merchandise to
always be of the expected quality and
functionality but also that if it isnrsquot as the
customer expected the customer should be
able to trust that the store will reimburse them
or offer a substitute Erens further expressed
that trust is an element that is passed down to
generations and thus younger customers will
generally initially trust those retailers
introduced to them by family members
Alice Louw asserts that if customers care about
which supermarket store they shop at they are
considered to have a stronger involvement and
willingness to tolerate dissatisfaction before
switching stores This involvement dimension
can also be viewed as a measurement of
potential for
commitment As a measure of involvement
respondents were asked to determine whether
they considered which supermarket they
shopped at to be an important decision The
majority of respondents (62 percent indicated
that they considered this to be an important
decision This implies that these customers are
viewed as being ldquoinvolvedrdquo in their purchasing
decision
Respondents rated their level of satisfaction
with regards to the specific supermarket store
at which they shop of which 88 percent were
satisfied with the offering of the specific
supermarket store they shopped at However
Louw warns that without the presence of
involvement high satisfaction still produces
passive users with low repurchase rates in many
cases commitment requires both involvement
and satisfaction Two thirds (66 percent) of
respondents are both involved and satisfied
with their chosen store and thus have high
potential for commitment It is thus concluded
that the majority of South African customers
are satisfied and involved with the specific
supermarket store at which they shop and
consequently have high potential for
commitment
Furthermore Louw maintains that a
measurement of a customerrsquos emotional
connection to a supermarket is also an accurate
measurement of their commitment to that
SURVIVING OR THRIVING AN EXPLORATORY STUDY INTO COMPETING FOR THE SOUTH AFRICAN
54
Copyright copy2014 by International Journal of Sales Retailing and Marketing Vol 3 No 1 2014
supermarket In the survey respondents were
asked to rate the importance of an emotional
connection in their decision of where to shop
Despite the majority of respondents finding the
decision of which supermarket store they shop
at to be important the mean response for the
importance of an emotional connection was
only 304 interpreted as neutral This implies
that the degree of involvement is fairly low
Hence Louw describes these customers as
passive users who would be classified as
committed albeit on the shallow end of
commitment She notes that this specifically in
fast moving consumer goods retailing is fairly
common
The importance of structural bonds also needs
to be considered so that behavioural loyalty
isnrsquot interpreted as being a pure degree of
loyalty In this respect respondents were asked
whether they shopped at their specific
supermarket store because they were satisfied
with the storersquos offering or because they were
constrained to do so The vast majority of
respondents shopped at their specific
supermarket store because they were satisfied
with the store offering (77 percent)
Nevertheless a significant portion of the
respondents shopped at their specific
supermarket store because they were
constrained to do so (22 percent)
In order to determine the rationale for
customers to be constrained to a specific
supermarket store these constrained
respondents were asked why they were
constrained to shop there The most common
reason (52 percent) for respondents to be
constrained to their specific supermarket store
was due to travelling issues (eg they do not
own a motor vehicle or the other stores are too
far away) followed by convenience (25
percent) These findings emphasise the
importance of store location and accessibility
for retailers because situating a store in a
popular location which is considered
convenient by customers relative to other
supermarket stores attracts customers even if
their attitude towards the store is not
particularly positive
Of the respondents who were dissatisfied with
their specific supermarket storersquos offering 80
percent remained behaviourally loyal to a
specific store as a result of structural relational
bonds Louw concurs that often dissatisfied
customers stay with a brand (ie remain loyal)
due to physical barriers such as location or cost
or psychological barriers such as lsquothey care so
they stay with the brand and try to fix the
problemrsquo Suzanne Ackerman-Berman notes
that specifically in South Africa with many
people still living in poverty aspects of the
retail mix such as price and store location (due
to a cost being involved in transport) play a
pivotal role in determining which store these
customers frequent
The travelling constraint was further
emphasised when respondents were asked to
determine the distance they travelled to their
specific supermarket store The majority of
respondents (61 percent travelled less than 15
minutes to their specific supermarket store and
overall 87 percent travelled 30 minutes or less
to their specific store thus supporting the
pivotal role store location plays in attracting
customers Only 13 percent of respondents
travelled for more than 30 minutes clearly
illustrating that customers generally decide on a
store that is less than 30 minutes away and thus
it is concluded that lsquorequired travelling
distancersquo is a significant structural relational
bond
The six elements of the retail mix (namely price
merchandise assortment customer service
store design and layout communications mix
and location) were analysed by asking
respondents to rate the importance of each of
these elements when deciding which specific
supermarket store they shop at on a scale of 1-
5 The six elements were divided into thirteen
retail mix variables each of which is attributed
to one of the elements of the retail mix This is
reflected in table 3 The aggregated importance
scores are reflected in table 4 thereafter
SURVIVING OR THRIVING AN EXPLORATORY STUDY INTO COMPETING FOR THE SOUTH AFRICAN
55
Copyright copy2014 by International Journal of Sales Retailing and Marketing Vol 3 No 1 2014
TABLE 3 BREAKDOWN OF RETAIL MIX ELEMENTS INTO CLUSTERED VARIABLES
Retail Mix Element Inclusive Variables
Price Prices
Merchandise assortment Variety of merchandise quality of merchandise quality of fresh food
availability of private-label merchandise
Customer service Friendly service well-trained floor staff high quality customer service
Store design and layout Attractiveness of the store facilities available
Communications mix Brand of the Supermarket sales promotions
Location Convenient location
Source Authorrsquos own compilation
TABLE 4 DESCRIPTIVE STATISTICS OF THE RETAIL MIX ELEMENTS
Retail Mix Variable Overall Response Mean Std Dev Rank
Price Important 400 103 7
Variety of merchandise Important 423 083 4
Quality of merchandise Important 447 072 2
Quality of fresh food Very Important 470 058 1
Availability of private-label merchandise Neutral 311 106 13
Friendly service Important 408 091 5
Well-trained floor staff Important 383 010 9
High quality customer service Important 402 088 6
Attractiveness of the store Important 391 082 8
Facilities available Neutral 339 115 11
Brand of the supermarket Neutral 333 104 12
Sales promotions Neutral ndash Important 350 110 10
Convenient location Important 433 079 3
Source Authorrsquos own compilation
As indicated in the table above the quality of
fresh groceries was rated the most important
aspect whereas the availability of private-label
merchandise was considered the least
important
Ackerman-Berman reiterated that friendly
service and high-quality service are important
variables of the retail mix an area where Pick n
Pay have always placed emphasis Furthermore
she stressed the fact that these variables played
a fundamental role in providing consumers with
the lsquooverall shopping experiencersquo In an
environment where parity (or perceived parity)
across product range existed these variables
could well make the difference Erens too
expressed that high-quality customer service is
essential as it makes the customer feel valued
Nonetheless retailers should never lose sight of
the fact that their core offering (the
merchandise) needs to be impressive
CONCLUSIONS
In lieu of the findings of this research the
following conclusions are drawn
South African supermarket customers have
shallow commitment to the store
at which they shop
Whilst South African supermarket shoppers are
satisfied with their storesrsquo offering their
involvement is deemed to be moderate
Furthermore their emotional connection to the
store appears neutral Supermarket chains
therefore need to pay attention to exceeding
the customerrsquos expectations as
SURVIVING OR THRIVING AN EXPLORATORY STUDY INTO COMPETING FOR THE SOUTH AFRICAN
56
Copyright copy2014 by International Journal of Sales Retailing and Marketing Vol 3 No 1 2014
Low prices are not a sure guarantee that the
customer will stay Instead
merchandise and convenience of location
reign supreme
Somewhat interestingly customer service and
the in-store environment were not deemed of
the utmost importance The top tier of priorities
for supermarkets appear to be merchandise
and location Thereafter service delivery
becomes importance and may thus be
classified as the second tier of priorities The
third tier of priorities includes such aspects as
facilities available and sales promotions
Behaviourally loyal patronage to supermarkets
does not imply customer satisfaction with
supermarkets
Behavioural loyalty is a behavioural measure
while satisfaction and commitment are
attitudinal measures Frequent patronage to a
store may often be due to the structural
relational bond of travelling constraints and
not a result of customer satisfaction Findings
suggest that a significant relationship exists
between the travelling constraint and
behavioural loyalty thus stores which are in
close proximity to customersrsquo homes may
receive high patronage but not necessarily
customersrsquo commitment Competition
established in the vicinity may therefore have a
devastating effect on store patronage down the
line
REFERENCES
ANDERSON E amp MITTAL V 2000
STRENGTHENING THE SATISFACTION-PROFIT
CHAIN JOURNAL OF SERVICE RESEARCH 3(2)
107-120
ANDERSON E FORNELL C amp LEHMANN D 1994
CUSTOMER SATISFACTION MARKET SHARE
AND PROFITABILITY FINDINGS FROM SWEDEN
JOURNAL OF MARKETING 58(3) 53-66
AUBERT-GAMET V 1997 TWISTING
SERVICESCAPES DIVERSION OF THE PHYSICAL
ENVIRONMENT IN A RE-APPROPRIATION
PROCESS INTERNATIONAL JOURNAL OF
SERVICE INDUSTRY MANAGEMENT 8(1) 26-41
BAKER S amp BASS M 2003 NEW CONSUMER
MARKETING MANAGING A LIVING DEMAND
SYSTEM WEST SUSSEX WILEY
BANDYOPADHYAY S amp MARTELL M 2007 DOES
ATTITUDINAL LOYALTY INFLUENCE
BEHAVIOURAL LOYALTY JOURNAL OF
RETAILING AND CONSUMER SERVICES 14 35-
44
BANKS J amp MOORTHY S 1999 A MODEL OF
PRICE PROMOTIONS INTERNATIONAL JOURNAL
OF INDUSTRIAL ORGANIZATION 17371-398
BAWA K amp SHOEMAKER RW 1987 THE EFFECTS
OF DIRECT MAIL COUPON ON BRAND CHOICE
BEHAVIOUR JOURNAL OF MARKETING
RESEARCH 24(4) 370-376
BEATTY SE MAYER M COLEMAN JE REYNOLDS
KE amp LEE J 1996 CUSTOMER-SALES ASSOCIATE
RETAIL RELATIONSHIPS JOURNAL OF
RETAILING 72(3) 223-247
BENEKE J 2010 ldquoCONSUMER PERCEPTIONS OF
PRIVATE LABEL BRANDS WITHIN THE RETAIL
GROCERY SECTOR OF SOUTH AFRICA AFRICAN
JOURNAL OF BUSINESS MANAGEMENT 4(2)
203-220
BOERSMA M BUCKLEY P amp GHAURI P 2003
TRUST IN INTERNATIONAL JOINT VENTURE
RELATIONSHIPS JOURNAL OF BUSINESS
RESEARCH 56 (MARCH) 1031-1042
BOLTON RN 1998 A DYNAMIC MODEL OF THE
DURATION OF THE CUSTOMERrsquoS RELATIONSHIP
WITH A CONTINUOUS SERVICE PROVIDER THE
ROLE OF SATISFACTION MARKETING SCIENCE
17(1) 45-65
BOWEN JT amp CHEN SL 2001 THE RELATIONSHIP
BETWEEN CUSTOMER LOYALTY AND
CUSTOMER SATISFACTION INTERNATIONAL
JOURNAL OF CONTEMPORARY HOSPITALITY
MANAGEMENT 13(5) 213-217
SURVIVING OR THRIVING AN EXPLORATORY STUDY INTO COMPETING FOR THE SOUTH AFRICAN
57
Copyright copy2014 by International Journal of Sales Retailing and Marketing Vol 3 No 1 2014
BRINK A amp BERNDT B 2004 CUSTOMER
RELATIONSHIP MANAGEMENT AND CUSTOMER
SERVICE LANSDOWNE JUTA
CANT M amp MACHADO R (EDS) 2009
MARKETING SUCCESS STORIES 6TH ED CAPE
TOWN OXFORD UNIVERSITY PRESS
CALLOWAY J 2005 INDISPENSABLE HOW TO
BECOME THE COMPANY THAT YOUR
CUSTOMERS CANrsquoT LIVE WITHOUT NEW
JERSEY WILEY
CARUANA A 2002 SERVICE LOYALTY THE
EFFECTS OF SERVICE QUALITY AND THE
MEDIATING ROLE OF CUSTOMER
SATISFACTION EUROPEAN JOURNAL OF
MARKETING 36 (78) 811-828
CORSTJIENS M amp LAL R 2000 BUILDING STORE
LOYALTY THOUGH STORE BRANDS JOURNAL OF
MARKETING RESEARCH 37(3) 281-291
CRAM T 1994 THE POWER OF RELATIONSHIP
MARKETING LONDON PITMAN PUBLISHING
CRONIN JJ amp TAYLOR SA 1992 MEASURING
SERVICE QUALITY A RE-EXAMINATION AND
EXTENSION JOURNAL OF MARKETING 56 55-
68
CURHAN RC 1972 THE RELATIONSHIP
BETWEEN SHELF SPACE AND UNIT SALES IN
SUPERMARKETS JOURNAL OF MARKETING
RESEARCH 9(4) 406-412
DABHOLKAR PA THORPE DI amp RENTZ JO 1996
A MEASURE OF SERVICE QUALITY FOR RETAIL
STORES SCALE DEVELOPMENT AND
VALIDATION JOURNAL OF THE ACADEMY OF
MARKETING SCIENCE 24(1) 3-16
DE WULF K ODEKERKEN-SCHROumlDER G amp
IACOBUCCI D 2001 INVESTMENTS IN
CONSUMER RELATIONSHIPS A CROSS-
COUNTRY AND CROSS-INDUSTRY
EXPLORATION JOURNAL OF MARKETING 65(4)
33-50
DIAMOND WD 1992 JUST WHAT IS A DOLLAR
WORTH CONSUMER REACTIONS TO PRICE
DISCOUNTS VS EXTRA PRODUCT PROMOTIONS
JOURNAL OF RETAILING 68(3) 254-270
DICK A amp BASU K 1994 CUSTOMER LOYALTY
TOWARDS AN INTEGRATED FRAMEWORK
JOURNAL OF THE ACADEMY OF MARKETING
SCIENCE 22(2) 99-113
DOYLE SA amp BROADBRIDGE A 1999
DIFFERENTIATION BY DESIGN THE
IMPORTANCE OF DESIGN IN RETAILER
REPOSITIONING AND DIFFERENTIATION
INTERNATIONAL JOURNAL OF RETAIL AND
DISTRIBUTION MANAGEMENT 27(2) 72-83
DUFFY DL 2005 THE EVOLUTION OF
CUSTOMER LOYALTY STRATEGY JOURNAL OF
CONSUMER MARKETING 22(5) 284-286
DUFFY DL 2003 INTERNAL AND EXTERNAL
FACTORS WHICH AFFECT CUSTOMER LOYALTY
JOURNAL OF CONSUMER MARKETING 20(5)
480-485
DUFTON H BAILEY JM amp HOPKINS T 2001 THE
RETAIL STORE DESIGN FOR PROFITABILITY
[INTERNET
HTTPWWWTEXTILESUMISTACUKRESEARC
HTEXONLINEMAN99DUFTONHTM
DOWNLOADED 16 MAY 2011]
DUVEEN-APOSTOLOU S 2006 INTRODUCTION
TO CONVERSION MODEL PRESENTATION AT
UNIVERSITY OF CAPE TOWN ON 18 SEPTEMBER
2006
FASTMOVING 2013 GENERAL SUPERMARKET
RETAIL STORES IN SOUTH AFRICA [INTERNET
HTTPWWWFASTMOVINGCOZARETAILERS
CATEGORYGENERAL-SUPERMARKETS-196
DOWNLOADED 25 JANUARY 2013]
FITCH R 1991 SUCCESS IN RETAILING
IDENTITIES DESIGN MANAGEMENT JOURNAL
14(2) 58-61
GENESAN S 1994 DETERMINANTS OF LONG-
TERM ORIENTATION IN BUYER-SELLER
RELATIONSHIPS JOURNAL OF MARKETING
58(2) 1-19
GALLO C 2012 APPLErsquoS SECRET EMPLOYEE
TRAINING MANUAL REINVENTS CUSTOMER
SERVICE IN SEVEN WAYS [INTERNET
HTTPWWWFORBESCOMSITESCARMINEGA
LLO20120830APPLES-SECRET-EMPLOYEE-
TRAINING-MANUAL-REINVENTS-CUSTOMER-
SERVICE-IN-SEVEN-WAYS DATED 30 AUGUST
2012]
SURVIVING OR THRIVING AN EXPLORATORY STUDY INTO COMPETING FOR THE SOUTH AFRICAN
58
Copyright copy2014 by International Journal of Sales Retailing and Marketing Vol 3 No 1 2014
GARLAND R amp GENDALL P 2004 TESTING DICK
AND BASUrsquoS CUSTOMER LOYALTY MODEL
AUSTRALIAN MARKETING JOURNAL 12(3) 81-
87
GEYSKENS I STEENKAMP J SCHEER LK amp
KUMAR N 1996 THE EFFECTS OF TRUST AND
INTERDEPENDENCY ON RELATIONSHIP
COMMITMENT INTERNATIONAL JOURNAL OF
RESEARCH IN MARKETING 13 (OCTOBER) 303-
317
GILBERT DC amp JACKARIA N 2002 THE EFFICACY
OF SALES PROMOTIONS IN UK SUPERMARKETS
A CONSUMER VIEW INTERNATIONAL JOURNAL
OF RETAIL amp DISTRIBUTION MANAGEMENT
30(6) 315-322
GITOMER J 1998 CUSTOMER SATISFACTION IS
WORTHLESS CUSTOMER LOYALTY IS PRICELESS
AUSTIN BARD PRESS
GUPTA S amp COOPER L 1992 THE DISCOUNTING
OF DISCOUNTS AND PROMOTION THRESHOLDS
JOURNAL OF CONSUMER RESEARCH 19(3)
401-411
GUNDLACH G ACHROL R amp MENTZER J 1995
THE STRUCTURE OF COMMITMENT IN
EXCHANGE JOURNAL OF MARKETING
59 (1) 78-92
HOCH S amp BANERJI S 1993 WHEN DO PRIVATE
LABELS SUCCEED SLOAN MANAGEMENT
REVIEW 34(4) 57-78
HUNTER VL 1998 MEASURE CUSTOMER
LOYALTY FOR COMPLETE PICTURE OF ROI
BUSINESS MARKETING 83(3) 18-30
HESKETT JL 2002 GURUrsquoS VIEW BEYOND
CUSTOMER LOYALTY MANAGING SERVICE
QUALITY 12(6) 355-357
HESKETT JL JONES TO LOVEMAN GW SASSER
WE amp SCHLESINGER LA 1994 PUTTING THE
SERVICE-PROFIT CHAIN TO WORK HARVARD
BUSINESS REVIEW 72 164-174
HOFMEYR J amp RICE B 2003 COMMITMENT-LED
MARKETING WEST SUSSEX WILEY
JACOBY J amp KYNER DB 1973 BRAND LOYALTY
VS REPEAT PURCHASING BEHAVIOUR
JOURNAL OF MARKETING RESEARCH
10 (1) 1-9
KAHN BE amp SCHMITTLEIN DC 1989 SHOPPING
TRIP BEHAVIOR AN EMPIRICAL INVESTIGATION
MARKETING LETTERS 1(1)
55-69
KESSIM N amp ABDULLA A 2006 THE INFLUENCE
OF ATTRACTION ON INTERNET BANKING AN
EXTENSION TO THE TRUST-RELATIONSHIP
COMMITMENT MODEL INTERNATIONAL
JOURNAL OF BANK MARKETING 24(6) 424-442
KNOX S 1998 LOYALTY BASED SEGMENTATION
AND THE CUSTOMER DEVELOPMENT PROCESS
EUROPEAN MANAGEMENT JOURNAL 16(6)
729-737
KOPALLE PK amp MELA CF 1999 THE DYNAMIC
EFFECT OF DISCOUNTING OF SALES EMPIRICAL
ANALYSIS AND NORMATIVE PRICING
IMPLICATIONS MARKETING SCIENCE 18(3)
317-322
KOTLER P amp ARMSTRONG G 2010 PRINCIPLES
OF MARKETING 13TH ED NEW JERSEY
PEARSON EDUCATION
KOTLER P 2003 MARKETING MANAGEMENT
11TH ED NEW JERSEY PEARSON EDUCATION
KRISHNAMURTHI L amp RAJ SP 1991 AN
EMPIRICAL ANALYSIS OF THE RELATIONSHIP
BETWEEN BRAND LOYALTY AND CONSUMER
PRICE ELASTICITY MARKETING SCIENCE 10(2)
172-183
LEVY M amp WEITZ B 2011 RETAIL
MANAGEMENT 8TH ED NEW YORK MCGRAW-
HILLIRWIN
LILJANDER V amp LEVERIN A 2006 DOES
RELATIONSHIP MARKETING IMPROVE
CUSTOMER RELATIONSHIP SATISFACTION AND
LOYALTY INTERNATIONAL JOURNAL OF BANK
MARKETING 24(4) 232-251
LILJANDER V amp ROOS I 2002 CUSTOMER-
RELATIONSHIP LEVELS ndash FROM SPURIOUS TO
TRUE RELATIONSHIPS JOURNAL OF SERVICES
MARKETING 16(7) 593-614
MORGAN R amp HUNT S 1994 THE
COMMITMENT-TRUST THEORY OF
RELATIONSHIP MARKETING JOURNAL OF
MARKETING 58(3) 20-38
MULLICK-KANWAR M 2013 THE EVOLUTION
OF PRIVATE LABEL BRANDING [INTERNET
SURVIVING OR THRIVING AN EXPLORATORY STUDY INTO COMPETING FOR THE SOUTH AFRICAN
59
Copyright copy2014 by International Journal of Sales Retailing and Marketing Vol 3 No 1 2014
HTTPWWWBRANDCHANNELCOMPAPERS_
REVIEWASPSP_ID=360 DOWNLOADED 25
JANUARY 2013]
NEWMAN AJ amp CULLEN P 2001 FROM RETAIL
THEATRE TO RETAIL FOOD SHOW THE
SHRINKING FACE OF GROCERY BRITISH FOOD
JOURNAL 103(7) 443-452
NICOLSON J KEMP J amp LINNELL P 1996 DOES
THE RHETORIC OF CUSTOMER SERVICE MATCH
THE REALITY MANAGING SERVICE QUALITY
6(3) 6-9
OLIVER RL 1999 WHENCE CUSTOMER
LOYALTY JOURNAL OF MARKETING 63 33-44
PASSIKOFF R 2006 PREDICTING MARKET
SUCCESS NEW WAYS TO MEASURE CUSTOMER
LOYALTY AND ENGAGE CONSUMERS WITH
YOUR BRAND NEW JERSEY WILEY
POPKOWSKI LESZCZYC PTL SINHA A amp
TIMMERMAN HJP 2000 CONSUMER STORE
CHOICE DYNAMICS JOURNAL OF RETAILING
76(3) 323-345
PORTER S amp CLAYCOMB C 1997 THE
INFLUENCE OF BRAND RECOGNITION ON
RETAIL STORE IMAGE JOURNAL OF PRODUCT
AND BRAND MANAGEMENT 6(6) 373-387
PRITCHARD MP amp HOWARD DR 1997 THE
LOYAL TRAVELER EXAMINING A TYPOLOGY OF
SERVICE PATRONAGE JOURNAL OF TRAVELERS
RESEARCH 35(4) 2-10
REYNOLDS KE amp BEATTY SE 1999 CUSTOMER
BENEFITS AND COMPANY CONSEQUENCES OF
CUSTOMER-SALESPERSON RELATIONSHIPS IN
RETAILING JOURNAL OF RETAILING 75 11-32
RISDALL J 2013 FROM ADVERTISING TO
CONVERSATION MARKETING [INTERNET
HTTPMINNESOTABUSINESSCOMEXPERTS-
FORUMADVERTISING-CONVERSATION-
MARKETING DOWNLOADED 25 JANUARY 2013]
ROWLEY J 2005 THE FOUR CS OF CUSTOMER
LOYALTY MARKETING INTELLIGENCE AND
PLANNING 23(6) 574-581
SIRDESHMUKH D SINGH J amp SABOL B 2002
CONSUMER TRUST VALUE AND LOYALTY IN
RELATIONAL EXCHANGES JOURNAL OF
MARKETING 66 15-37
SMITH M amp SINHA I 2000 THE IMPACT OF
PRICE AND EXTRA PRODUCT PROMOTIONS ON
STORE PREFERENCE INTERNATIONAL JOURNAL
OF RETAIL amp DISTRIBUTION MANAGEMENT
28(23) 83-92
STAMBAUGH S 1993 TO STORE BRAND OR
NOT TO STORE AFTERMARKET BUSINESS
103(6) 69-78
STAUSS B CHOJNACKI K DECKER A amp
HOFFMANN F 2001 RETENTION EFFECTS OF A
CUSTOMER CLUB INTERNATIONAL JOURNAL OF
SERVICE INDUSTRY MANAGEMENT 12(1) 7-19
THOMAS J 2001 A METHODOLOGY FOR
LINKING CUSTOMER ACQUISITION TO
CUSTOMER RETENTION JOURNAL OF
MARKETING RESEARCH 38(2) 262-268
THROUGH THE LOOP CONSULTING LTD 2002
THE PARADOX OF LOYALTY [INTERNET
ltHTTPWWWTHROUGHTHELOOPCOMKNO
WLEDGEBRAND13HTML DOWNLOADED 17
MARCH 2011]
VAZQUEZ D amp BRUCE M 2002 DESIGN
MANAGEMENT THE UNEXPLORED RETAIL
MARKETING COMPETENCE JOURNAL OF RETAIL
AND DISTRIBUTION MANAGEMENT 30(4) 202-
210
VENETIS KA amp GHAURI PN 2004 SERVICE
QUALITY AND CUSTOMER RETENTION
BUILDING LONG-TERM RELATIONSHIPS
EUROPEAN JOURNAL OF MARKETING 38
(1112) 1577-1598
WILES MA 2007 THE EFFECT OF CUSTOMER
SERVICE ON RETAILERSrsquo SHAREHOLDER
WEALTH THE ROLE OF AVAILABILITY AND
REPUTATION CUES JOURNAL OF RETAILING
83(1) 19-31
WONG A DEAN A amp WHITE CJ 1999
CUSTOMER BEHAVIORAL INTENTIONS IN THE
HOSPITALITY INDUSTRY AUSTRALIAN JOURNAL
OF HOSPITALITY MANAGEMENT 6 53-63
YUDKIN M 1999 INGREDIENTS OF CUSTOMER
LOYALTY [INTERNET
HTTPWWWEPROMOSCOMEDUCATIONCEN
TER-LOYALITYJSP DOWNLOADED 17 MARCH
2011]
SURVIVING OR THRIVING AN EXPLORATORY STUDY INTO COMPETING FOR THE SOUTH AFRICAN
60
Copyright copy2014 by International Journal of Sales Retailing and Marketing Vol 3 No 1 2014
ZEITHAML VA 2000 Service Quality
Profitability and the Economic Worth of
Customers What We Know and What We Need
to Learn Journal of the Academy of Marketing
Science 28(1) 67-85
Copyright copy2014 by International Journal of Sales Retailing and Marketing Vol 3 No 1 2014
61 THE ICT EFFECTS AND THE SWITCHING COSTS IN THE RELATIONAL VARIABLES AN APPLICATION IN RETAIL
TRADE OF GREECE AND SPAIN
THE ICT EFFECTS AND THE SWITCHING COSTS IN THE
RELATIONAL VARIABLES AN APPLICATION IN RETAIL
TRADE OF GREECE AND SPAIN
Irene Gil-Saura Konstantinos-Faidon Sylvestros amp Beatriz Moliner Velazquez
Abstract
The perceived value has been converted to a fundamental construct in the retail context acting as
consequence and antecedent of key conduct variables The present study tries to analyze the
influence of information and communication technologies (ICT) and that of switching costs on a
group of relationship variables We aim to analyze the causal relations and their effects in the textile
sector of the Greek and Spanish market The results show the existing relations of perceived value
with the antecedents and consequences proposed in the model except the ICT
Key words ICT perceived value switching costs commitment
INTRODUCTION
Various essays recognize that the complexity
that changes cause to the market like the
intense competition and the technological
development creates difficulties to
management especially in fast changing
markets (Ferreiros 2012) From this
perspective a firm strategy that becomes
increasingly important is customer retention In
this direction academic research on retailing
seems that focuses on concepts like supplier
dependence (Andaleeb 1995) value (Anderson
and Narus 1990) commitment (Morgan and
Hunt 1994) or loyalty (Reynolds and Beaty
1999) In this sense perceived value is being
perceived as a clientacutes total evaluation about
the relational exchange with retailer (Saacutenchez
et al 2010)
Moreover concerning the distribution
channels a tendency towards globalization can
be observed which summons the research
question if relational variables have stable
perceptions from an international perspective
In this framework the present study tries to
analyze the effects of the changes of dynamic
variables like the ICT in the point of sales on
perceived value commitment and loyalty The
starting point of this study is the evidence of
previous studies about the significance of the
factors that influence this process Additionally
we intend to detect the possible differences
between the generated perceptions of these
variables in two geographical fields Spain and
Greece In summary this study attempts to
contribute through its results and its
conclusions to the supplier efforts in order to
provide sustainable competitive advantages
through the development of management
systems and business differentiation based on
Dr Irene Gil-Saura PhD professor at Department of Market Commercialization and Research University of Valencia Spain (email irenegilluves) Konstantinos - Faidon Sylvestros professor at Department of Market Commercialization and Research University of Valencia Spain (e-mail konsylalumniuves) Beatriz Moliner Velasquez professor at Department of Market Commercialization and Research University of Valencia Spain (email beatrizmolineruves)
Copyright copy2014 by International Journal of Sales Retailing and Marketing Vol 3 No 1 2014
62 THE ICT EFFECTS AND THE SWITCHING COSTS IN THE RELATIONAL VARIABLES AN APPLICATION IN RETAIL
TRADE OF GREECE AND SPAIN
client orientation and more specifically on the
delivery of value
RESEARCH THEORETICAL FRAMEWORK
LITERATURE REVIEW
The study of Value in marketing
In recent marketing investigation we can
observe an increasing interest in the study of
creation of value between the concerning parts
of the relationship (Groumlnroos 2000)
From the review concerning value it is
confirmed that the construct is complex and
multidimensional In respect of its conceptual
definition various authors widely accept the
proposal of Zeithaml (1988) (eg Caruana et al
2000) According to Zeithaml (198814)
perceived value can be seen like ldquothe
customerrsquos overall assessment of the utility of a
product based on perceptions of what is
received and what is givenrdquo In this way Oliver
(199945) adds that value is ldquoa positive function
of what is received and a negative function of
what is sacrificedrdquo however perceptions
exclusively positive or negative can also be
named value In more recent studies the
treatment of perceived value as a
multidimensional construct has gained ground
(Sweeney and Soutar 2001) This evolution has
benefited research in this field as it has
permitted the evaluation of the experience
factor that consumers perceive in the store In
this direction the present study highlights the
contribution of Sweeney and Soutar (2001)
who based on the study of Sheth et al (1991)
they retain three dimensions in order to explain
the nature of perceived value In particular
they use the social value that expresses the
utility that derives from the supplierrsquos capacity
to increase the social self-concept the
emotional value that is associated with the
feelings or affective states generated by the
point of sales and the functional value that
contains two elements First itrsquos the utility
related to the price that derives from the cost
reduction applied by the supplier in short or
long term Second the functional value is
associated to the perceived quality and the
expected results form the supplier
Antecedents and consequences of value
As it is highlighted in the literature there exists
a number of variables that are antecedents of
perceived value and influence significantly the
construct Among these variables we stress the
important influence of ICT The significance of
the ICTsrsquo application in the firms and their
effects in terms of relationship benefits has
been confirmed during the last years (Ruiz et
al 2010a b) Ryssel et al (2004) point out that
ICT is a term that comprises every form of
technology in order to create capture
manipulate communicate exchange present
and use information in various forms (company
data voice conversations photos drawings
multimedia presentations and other forms
included that are not invented yet)
On the other hand the concept of ldquoswitching
costsrdquo appears in the literature since 90s within
the framework of the relationship evaluation
that maintains the company in contact with its
environment In the area of trade distribution
the switching costs are defined as the perceived
costs by the buyer to change his actual supplier
for a new one
These costs include the associated to the
change of spending time money and
psychological cost (Dick and Basu 1994)
In addition to the antecedents the variables
consequences of value have had a prominent
role with regard to the results of marketing
research
Various academic studies have pointed out
commitment as one of the main determinants
in the creation of long-term relationships
between supplier and customer (Ryssel et al
2004) According to Morgan and Hunt
(199423) ldquothe belief of an exchange partner
that the ongoing relationship with another is so
important as to warrant maximum efforts at
maintaining itrdquo Also relationship dependence
is a construct that emerges as relevant to
Copyright copy2014 by International Journal of Sales Retailing and Marketing Vol 3 No 1 2014
63 THE ICT EFFECTS AND THE SWITCHING COSTS IN THE RELATIONAL VARIABLES AN APPLICATION IN RETAIL
TRADE OF GREECE AND SPAIN
explain commitment Emerson (1962) as well
developed the dependence theory form an
interpersonal perspective According to this
theory dependence is perceived as a function
of two factors the value of the goal for the
individual and the existence of alternative ways
to achieve this goal Thus it is concluded that
the dependence of a person is directly related
to the benefits obtained form the resource and
inversely related to the alternative resources of
these benefits
Finally an important relational variable in terms
of its links with value and loyalty Loyalty has
been considered as a significant influence for
the retention of the client and for the repetitive
purchase (Griffin 1996) In this context Dick
and Basu (1994) have interpreted loyalty as the
combination of a positive attitude and purchase
repetition
Research hypotheses
As mentioned previously companies develop
their activities in a highly changing
environment where technological innovations
play a key role in the relationships with the
customer In this way we understand that ICT
exert a positive influence on relationship value
of the company with its suppliers and
customers (Mentzer and Williams 2001 Gil et
al 2008) This permits us to form the basis for
the first working hypotheses
H1a The retailerrsquos ICT intensity has a positive
influence on quality as part of the functional
value that is perceived by the customer
H1b The retailerrsquos ICT intensity has a positive
influence on price as part of the functional
value that is perceived by the customer
H1c The retailerrsquos ICT intensity has a positive
influence on the emotional value that is
perceived by the customer
H1d The retailerrsquos ICT intensity has a positive
influence on the social value that is perceived by
the customer
On the other hand switching costs refer to
benefit and loss costs (White and
Yanamandram 2007) These costs are related
to a customer evaluation about the positive and
negative aspects derived from his permanence
in the relationship with the current supplier
These benefits can be related to the product
and its quality its price and also they can
include social benefits as the relationship of
trust and friendship with the personnel of the
store This enables the creation of value in the
relationship with the retailer and that in turn
provokes entry barriers for the competition and
at the same time creates barriers for a possible
exit of the customer from this link through the
switching costs effect (Lovelock 1991) The
previous considerations permit us to propose
the following hypotheses
H2a The switching costs exert a positive effect
on quality as part of the functional value
perceived by the customer
H2b The switching costs exert a positive effect
on price as part of the functional value
perceived by the customer
H2c The switching costs exert a positive effect
on emotional value that is perceived by the
customer
H2d The switching costs exert a positive effect
on social value that is perceived by the customer
Moreover the conceptualization of value
proposed by Zeithaml (1988) underlines that
the components of quality and price have
relevant as well as different effects on
perceived value (Sweeney and Soutar 2001)
Thus that leads us to propose as working
hypotheses
H3a Quality has a positive influence on
perceived value
H3b Price has a positive influence on perceived
value
Sheth et al (1991) conclude that besides
functional value (quality and price) other
dimensions of value like the social and
emotional component result determinant as
well in customerrsquos choices Based on these
relations defined in the literature we conclude
that
H3c Emotional value has a positive impact on
perceived value
Copyright copy2014 by International Journal of Sales Retailing and Marketing Vol 3 No 1 2014
64
H3d Social value has a positive impact on
perceived value
Several studied have stressed the relationship
between perceived value and commitment
(Morgan and Hunt 1994 Sweeney and Soutar
2001)
In this regard Simpson et al (2001) reach the
conclusion that customerrsquos perceived value
about the company can positively influence on
commitment Therefore we propose that
H4 Perceived value positively influences on
customerrsquos commitment with the retailer
Likewise literature confirms the positive
relation between dependence and commitment
(Srinivasan 2008) Within this context the
existence of alternative retailers has been
considered a potential factor that contributes
to the creation of value (Sharland 1997) as it
enhances the market alternatives and for this
purpose can significantly affect customerrsquos
commitment (Fullerton 2005) That permits us
to formulate the following working hypothesis
H5 Customerrsquos dependence from the supplier
positively influences on commitment with that
supplier
On the other hand Evanschitzky et al (2006)
have highlighted that royalty derives from
commitment which in turn determines
development and maintenance of relationships
of value between buyer and seller (Morgan and
Hunt 1994) This assumption leads us to define
the last working hypothesis
H6 Customerrsquos commitment with the retailer
has a positive effect on customerrsquos loyalty
Figure 1 Proposal of the model
EMPIRICAL RESEARCH METHODOLOGY AND
EVALUATION OF RESULTS
Research approach and data collection
Taking in account the literature review and the
research objectives a questionnaire was
elaborated in order to collect information about
the final customer and his opinion regarding the
group of variables submitted to this research
model
These variables retained in the research were
estimated as following in Table 1
Switching
costs
H2b
ICT
intensity
Dependence
Perceived
value
H1a
H5
Commitment Loyalty H4 H6
Quality
Price
Emotional
value
Social
value
H1b
H1c
H1d
H2c
H2d
H2a
H3a
H3c
H3d
H3b
Copyright copy2014 by International Journal of Sales Retailing and Marketing Vol 3 No 1 2014
65
Table 1 Technical details of the research
GEOGRAPHICAL FIELD Athens Greece and Valencia Spain
UNIVERSE Individuals older than 18 years old
METHODOLOGY Personal interviews through structured questionnaire
SAMPLE SIZE 207 valid surveys
FIELDWORK DATE August 2012
SCALES (5 POINTS LIKERT)
ICT - Observatory (2006) Ruiz et al (2010 a and b)
Switching costs - Patterson and Smith (2001)
Perceived value - Sweeney and Soutar (2001)
Dependency - Gil et al (2011)
Commitment - Hennig-Thurau (2004) Loyalty - Srinivasan et al (2002) and Anderson and Srinivasan (2003)
STATISTICAL TECHNIQUES Descriptive analysis
Analysis of Variance
STATISTIC SOFTWARE PLS 20 SPSS 17
Table 2 Validation of the measuring instrument
Variable Indicator LoadingsWeights T value α Cronbach IFC AVE
ICT INTENSITY
TIC1- Barcode scanner 0899 34990
0954 0964 0819
TIC2- CreditDebit card payment 0696 87389
TIC3- Telephone 0961 104534
TIC4- Fax 0966 92416
TIC5- E-mail 0923 40748
SWITCHING COSTS
COS1- Little effort is required to buy in this store 0073 0661
NA NA NA
COS2- This store solves me some of my problems 0532 5204
COS3- I would waste a lot of time if I changed 0313 2470
COS4- I will lose a friendly and comfortable relationship if I change 0033 0409
COS5- If I change therersquos a risk the new one wouldnrsquot be as good 0243 1951
COS6- The time I need to buy in this store is acceptable 0149 1265
PERCEIVED VALUE
CAL- Quality 0293 3912
NA NA NA PRE- Price 0269 3183
EMO- Emotional value 0244 2740
SOC- Social value 0471 4901
COMMITMENT
COMP1- My relationship with the store is important 0943 93541
0921 0954 0875 COMP2- If the store closed it would be a loss for me 0946 103025
COMP3- I feel committed to this store 0917 79768
LOYALTY
LEAL1- I doubt that I would switch stores 0739 21347
0846 0935 0743
LEAL2- I try to use this store whenever I purchase 0863 56433
LEAL3- This store is my first choice 0902 71999
LEAL4- This store is the best for me 091 95832
LEAL5- This is my favourite store 0884 61780
Copyright copy2014 by International Journal of Sales Retailing and Marketing Vol 3 No 1 2014
66
plt005 plt010 NA Not applicable The underlined indicators correspond to formative variables Source Own formulation
This quantitative research was carried out
through a survey addressed to 207 buyers of
retail stores of shoes and clothes in Athens and
Valencia The fieldwork took place during
August 2012 in the exit of the stores In relation
to some traits of the survey it is stressed that
7714 of the respondents are women as
expected as the purchase of shoes and clothes
is an activity made more often by women who
are more interested in buying clothes than men
(Cowart and Goldsmith 2007) Additionally
more than 80 of the respondents are not
older than 45 years old with a major
representativeness of the segment 26-35 years
old considering that retail stores attract a
younger and more extended age segment
32 Results
In relation to the validation process of the
measuring instrument in the first place we
estimate the convergent validity which is
analyzed for each indicator through the
loadings the crossloadings and the average
mean-variance (Fornell and Larcker 1981) and
secondly the discriminant validity and the
reliability were analyzed All the results were
acceptable as it can be seen in Table 2
With regard to the hypotheses addressed here
as Table 3 illustrates the structural model
permits to accept five out of six hypotheses
regarding the existing relations between the
different constructs
Table 3 Hypotheses testing
Causal relation Hypothesis Standardized β T value
H1 ICT -gt PERCEIVED VALUE Rejected 0062 ns 1346
H2 SWITCHING COSTS -gt PERCEIVED VALUE Accepted 0060 10262
H3a QUALITY -gt PERCEIVED VALUE Accepted 0035 21888
H3b PRICE -gt PERCEIVED VALUE Accepted 0045 14482
H3c EMOTIONAL VALUE -gt PERCEIVED VALUE Accepted 0023 37787
H3d SOCIAL VALUE -gt PERCEIVED VALUE Accepted 0023 35317
H4 PERCEIVED VALUE -gt COMMITMENT Accepted 0056 6378
H5 DEPENDENCE -gt COMMITMENT Accepted 0055 7488
H6 COMMITMENT -gt LOYALTY Accepted 0020 42214
Perceived Value Rsup2=01571 Commitment Rsup2=01861 Loyalty Rsup2=05606 plt 005 ns non significant
The intensity of ICT application from retailers in
Greece and in Spain is the only addressed
assumption that cannot be confirmed The
results show that ICT donacutet affect customeracutes
perceived value (H1 β= 0062 ns) This result
coincides with the obtained of Comer et al
(1998) who reveal that technology doesnacutet
influence significantly the relational variables
(satisfaction commitment loyalty) something
that posterior studies also corroborate (eg
Ruiz-Molina et al 2010b)
Additionally a t-test is carried out with the
objective to detect possible differences in the
relative perceptions on the retained variables of
Copyright copy2014 by International Journal of Sales Retailing and Marketing Vol 3 No 1 2014
67
the model between Greek and Spanish
consumers (see Table 4)
Table 4 Evaluation of the variables by nationality
Mean values and significant differences
Variable Indicator
Total mean value
Group1 Greece
Group2 Spain F
ICT INTENSITY
TIC1- Barcode scanner 454 492 416 9442b
TIC2- CreditDebit card payment 446 486 405 2900c
TIC3- Telephone 450 488 412 2110
TIC4- Fax 450 489 411 3020b
TIC5- E-mail 450 489 410 1226
SWITCHING COSTS
COS1- Little effort is required to buy in this store 390
416 365 8200a
COS2- This store solves me some of my problems 314
416 213 6580a
COS3- I would waste a lot of time if I changed 322
417 226 1160
COS4- I will lose a friendly and comfortable relationship if I change 242
280 205 6890a
COS5- If I change therersquos a risk the new one wouldnrsquot be as good 372
383 362 18260
COS6- The time I need to buy in this store is acceptable 286
209 362
3130c
PERCEIVED VALUE
CAL- Quality 391 422 359 11366a
PRE- Price 396 424 368 13891a
EMO- Emotional value 411 44 381 22763a
SOC- Social value 401 423 378 1213
COMMITMENT
COMP1- My relationship with the store is important 316 364 268 0616
COMP2- If the store closed it would be a loss for me 317 367 268 0995
COMP3- I feel committed to this store 338 416 26 61474a
LOYALTY
LEAL1- I doubt that I would switch stores 410 431 389 47536a
LEAL2- I try to use this store whenever I purchase 335 406 263 20005a
LEAL3- This store is my first choice 357 411 302 52049a
LEAL4- This store is the best for me 313 421 205 18069a
LEAL5- This is my favourite store 299 330 268 5265b
a b c Statistically significant for p lt 001 p lt 005 and p lt 010 respectively
As it can be observed there are statistically
significant differences in the mean values of
Spanish consumers in relation to the mean
values of Greeks almost in all the analyzed
variables In this aspect Greek consumers
present higher rates in all the indicators of ICT
use by the retailer Similarly the existence of
significant differences regarding the four
Copyright copy2014 by International Journal of Sales Retailing and Marketing Vol 3 No 1 2014
68
dimensions of perceived value ndashquality price
social and emotional value- it is highlighted
Specifically Spanish consumers consider that
they perceive less value in the point of sale
compared with the responses of Greek
consumers Regarding the estimation of the rest
of the relational variables the results show that
Greek consumers tend to be more loyal to the
retailer as they reach higher rates while the
commitment perception doesnacutet vary
significantly between the two groups of
customers
All this leads to conclude that customeracutes
nationality affects its perceptions in relation
with all the variables of the model in a
significant manner
CONCLUSIONS LIMITATIONS AND FUTURE
RESEARCH DIRECTIONS
Literature admits the need to analyze the
determinant factors of the provision of services
in the area of retail distribution and their effect
on the customerrsquos behavioural intentions
towards the retail store Within this framework
perceived value has become a fundamental
variable
The present study has analyzed the of ICT and
switching costs influence on relational variables
like value and it has identified their effects on
commitment and loyalty in a retail
environment confirming the pivotal role of
value The research results show the existing
relations between value and the proposed
antecedents and consequences except the ICT
With all that it can be concluded that in order
to maintain in the market the suppliers have to
deliver a proposal of value to the consumer so
to attract him induce the purchase and foster
loyalty (Warnaby et al 2005) This process can
be achieved through the creation of functional
ndashquality price- emotional and social links
However not all of them act with the same
intensity According to the study results the
effect of emotional value on total value and
commitment is stronger than the produced by
the rest of types of value Therefore we
perceive as possible implications for the retail
companies the concentration of their efforts on
investing in the resources that improve
customerrsquos experience in the point of sale
These resources
can be developed through increased staff
training in the store with a true vocation
towards customer orientation service
customisation and interpersonal relationship
Finally in this study we have found that
nationality factor affects the behaviour of the
model variables pointing towards a possible
moderating effect Perhaps the non significant
effect of ICT can be explained by the significant
differences found in the empirical research
between the two customer profiles of
nationality All the above constitutes a new
perspective in the analysis of relationships
between customers and stores of clothing and
footwear It is noteworthy that this study has
certain weaknesses
First a larger sample that includes increased
number of respondents for each group could
permit to refine more the results Likewise the
research in various retail formats and in
different product categories could permit an
increased mainstreaming of the findings In the
same way sectors of activity where technology
plays a more important role in terms of the
relationship with the customer could result
more attractive field of research
Finally as future research lines could be
interesting to assess if ICT can exert a
moderating effect in their relation with
perceived value instead of acting as an
antecedent Furthermore the intensity of the
relation of perceived value with regard to
commitment in relation to the customersrsquo age
could be estimated as well as the role of
emotions or the state of mind which have been
studied as antecedents of satisfaction
(Machleit and Mantel 2001) It would also be
useful to explore in the retailing context the
contribution of customerrsquos search for variety to
the creation of loyalty (eg Christodoulides and
Copyright copy2014 by International Journal of Sales Retailing and Marketing Vol 3 No 1 2014
69
Michaelidou 2010) In this direction the
moderating or antecedent role of this attitude
could be analyzed and observe differences
according the personal characteristics of the
individuals
We also propose to future studies to improve
the measure of loyalty The attitudinal
approach applied in this study for measuring
this construct should be complemented by a
behavioural approach that includes not only the
repetitive purchase but also the word-of-mouth
attitude (Dick and Basu 1994) This last
response is one of the most relevant and
recognised dimensions of loyalty in the
literature and with the technological
development the virtual dimension of word-of-
mouth gets an increasing academic and
business interest (Chan and Ngai 2011) Thus it
would be interesting to measure the word-of-
mouth attitude personal and electronic in
order to identify differences in this dimension
of loyalty across cultures
REFERENCES
Andaleeb SS (1995) ldquoDependence relations
and the moderating role of trust implication for
behavioral intentions in marketing channelsrdquo
International Journal of Research in Marketing
Vol 12 No 2 pp 157-72
Anderson JC and Narus JA (1990) ldquoA model
of distributor firm and manufacturing firm
working relationshipsrdquo Journal of Marketing
Vol 54 No 1 pp 42-58
Caruana A Money AH and Berthon P R
(2000) lsquorsquoService quality and satisfaction-the
moderating role of valuersquorsquo European Journal of
Marketing Vol 34 no 1112 pp 1338-1352
Chan YYY y Ngai EWT (2011)
ldquoConceptualising electronic Word of mouth
activity An input-process-output perspectiverdquo
Marketing Intelligence amp Planning 29 (5) 488-
516
Christodoulides G y Michaelidou N (2010)
ldquoShopping motives as antecedents of e-
satisfaction and e-loyalty Journal of Marketing
Management 27 (1-2) 181-197
Comer JM Mehta R and Holmes TL (1998)
ldquoInformation technology retail users versus
non usersrdquo Journal of Interactive Marketing
Vol 12 No 2 pp 49-62
Cowart KO and Goldsmith RE (2007) ldquoThe
influence of consumer decision-making styles
on online apparel consumption by college
studentsrdquo International Journal of Consumer
Studies Vol31 No 6 pp 639ndash647
Dick A S and Basu K (1994) Customer
loyalty Toward an integrated conceptual
framework Journal of the Academy of
Marketing Science 22(2) 99-113
Emerson R (1962) acuteacutePower-Dependence
Relationsacuteacute American Sociological Review 27
(February) 31-41
Evanschitzky H Iyer G R Plassmann H
Niessing J and Meffert H (2006) The relative
strength of affective commitment in securing
loyalty in service relationships Journal of
Business Research 59(12) pp 1207-1213
Ferreiros Bennett P (2012) acuteacuteHow Social
Networks Digital Media and Digital Marketing
Can Be Applied to the Promotion of Goods and
Services in Business Companies in Order to
Increase Salesacuteacute Journal of US-China Public
Administration July Vol 9 No 7 812-824
Fornell C and Larcker DF (1981) ldquoEvaluating
Structural Equation Models with Unobservable
Variables and Measurement Errorrdquo Journal of
Marketing Research Vol18 pp39-50
Fullerton G (2005) ldquoThe service qualityndashloyalty
relationship in retail services Does
Copyright copy2014 by International Journal of Sales Retailing and Marketing Vol 3 No 1 2014
70
commitment matterrsquorsquo Journal of Retailing and
Consumer Services 12 pp 99ndash111
Gil-Saura I Ruiz-Molina M E and Arteaga-
Moreno F (2011) lsquorsquo Value supplier
dependence and long-term orientation
Outcomes for B2B commerce in the travel
industryrsquorsquo Industrial Management amp Data
Systems Vol 111 No 5 pp 791-808
Gil Saura I Servera Franceacutes D Berenguer
Contriacute G and Fuentes Blasco M (2008)
ldquoLogistics service quality a new way to loyaltyrsquorsquo
Industrial Management amp Data Systems Vol
108 No 5
Griffin MA (1996) acuteacuteExtra-role Behaviors in
Organisations The Mediation of Work and
Individual Factors by Organisational
Commitmentacuteacute Paper presented at the 11th
Annual Conference of the Society for Industrial
and Organisational Psychology San Diego CA
Groumlnroos C (2000) ldquoCreating a relationship
dialogue communication interaction valuerdquo
Marketing Review Vol 1 No 1 pp 5-14
Hennig-Thurau T Gwinner KP Walsh G
Gremler DD (2004) acuteacuteElectronic Word-of-
Mouth via Consumer-Opinion Platforms What
Motivates Consumers to Articulate Themselves
on the Internetacuteacute Journal of Interactive
Marketing 18 (1) 38-52
Lovelock C (1991) ldquoServices Marketing Text
Cases and Readingrsquorsquo 2nd ed Prentice-Hall
Englewood Cliffs NJ
Machleit KA Mantel SP (2001) ldquoEmotional
response and shopping satisfaction Moderating
effects of shopper attributionsrdquo Journal of
Business Research 54 (2) pp 97-106
Mentzer J T and Williams L R (2001) ldquoThe
role of logistics leverage in marketing strategyrsquorsquo
Journal of Marketing Channels 8 pp 29-48
Morgan R M and Hunt S D (1994) ldquoThe
commitment-trust theory of relationship
marketingrsquorsquo Journal of Marketing 58(3) pp 20-
38
Observatorio de las Telecomunicaciones y la
Sociedad de la Informacioacuten (2008) Diagnoacutestico
tecnoloacutegico del sector de comercio minorista
Entidad Puacuteblica Empresarial Redes
httpobservatorioredesmedia2008-
051211193299289pdf
Oliver R (1999) ldquoWhence consumer loyaltyrsquorsquo
Journal of Marketing 63 special issue pp 33-
44
Reynolds KE and Beatty SE (1999)
ldquoCustomer benefits and company consequences
of customer-salesperson relationships in
retailingrdquo Journal of Retailing Vol 75 No 1 pp
11-32
Ruiz-Molina ME Gil-Saura I and Calderoacuten
Garciacutea H (2010a) acuteacuteEl efecto moderador de la
edad en la relacioacuten entre el valor percibido las
TIC del minorista y la lealtad del clientersquorsquo
Cuadernos de Economiacutea and Direccioacuten de la
Empresa Nuacutem 43 junio pp 65-92
Ruiz-Molina ME Gil-Saura I and Moliner-
Velaacutezquez B (2010b) acuteacuteThe role of information
technology in relationships between travel
agencies and their suppliersrsquorsquo Journal of
Hospitality and Tourism Technology Vol 1 No
2 pp 144-162
Ryssel R Ritter T and Gemuumlnden HG (2004)
ldquoThe impact of information technology
deployment on trust commitment and value
creation in business relationshipsrdquo Journal of
Business amp Industrial Marketing Vol 19 No 3
pp 197-207
Saacutenchez J Saacutenchez M Antonio J and
Gutieacuterrez T (2010) ldquoThe impact of relational
variables on value creation in buyer-seller
Copyright copy2014 by International Journal of Sales Retailing and Marketing Vol 3 No 1 2014
71
business relationshipsrdquo Journal of Business-
Business Marketing Vol 17 No 1 pp 62-94
Sharland A (1997) ldquoSourcing strategy the
impact of costs on relationship outcomesrdquo
International Journal of Physical Distribution amp
Logistics Management Vol 27 No 7 pp 395-
409
Sheth Jagdish N Bruce I Newman and Barbara
L Gross (1991) ldquoWhy We Buy What We Buy A
Theory of Consumption Valuesrdquo Journal of
Business Research 22(March) pp 159ndash170
Simpson P M Siguaw J A and Baker T L
(2001) ldquoA model of value creation supplier
behaviors and their impact on reseller
perceived valuersquorsquo Industrial Marketing
Management 30(2) pp 119-134
Srinivasan R (2008) ldquoSources characteristics
and effects of emerging technologies Research
opportunities in innovationrsquorsquo Industrial
Marketing Management 37 pp 633ndash640
Sweeney JC and Soutar G (2001) ldquoConsumer
perceived value the development of a multiple
iacutetem scalersquorsquo Journal of Retailing Vol 77 pp
203-220
Warnaby G Bennison D and Davies BJ
(2005) ldquoRetailing and the marketing of urban
places a UK perspectiverdquo International Review
of Retail Distribution and Consumer Research
Vol15 Ndeg2 pp191-215
White L and Yanamandram V (2007) ldquoA
model of customer retention of dissatisfied
business services customersrsquorsquo Managing Service
Quality Vol 17 No 3 pp 298-316
Zeithaml V A (1988) ldquoConsumer Perceptions
of Price Quality and Value A Means-End Model
and Synthesis of Evidencerdquo Journal of
Marketing 52(July) pp 2ndash22
Copyright copy2014 by International Journal of Sales Retailing and Marketing Vol 3 No 1 2014
72 DIGITAL MEDIA amp POLITICAL MARKETING IN ALBANIA
DIGITAL MEDIA amp POLITICAL MARKETING IN ALBANIA
Orjona Fjerza amp Vjollca Hysi (Panajoti)
Abstract
This paper is a synthesis of a study and analysis conducted in Political marketing focused mainly on
the opinion of the electorate during the elections camping for the Parliamentary in Albania heldrsquos on
23 June 2013 Highlighted already in many scientific articles studies and empirical data Political
Marketing and the development of its technical tools are going in parallel with the development of
technology and the New Social Media Marketing is becoming an increasing necessity for Political
market in the world In a broader plan elements that characterize an electoral campaigns and what
the final results reveals from the elections in Albania this article focuses mainly on political marketing
elements and external factors excluding socio-economic (not less important)
Albanian political parties in the last election campaign gave a highest importance to accurate
program coalitions images and messages forwarded to the electorate Almost all the major political
parties were awareness and showed greater maturity compared with previous election campaigns
regarding the form and content of Political Product
The paper consist on analyzing the collected data through interviews questionnaires statistical and
descriptive methods as well as empirical studies reveal interesting facts and figures in the
implementation of appropriate strategies by political parties for future campaigns This paper also a
reference article for the next academic research in the Political Marketing and represents a picture of
the importance in particular of the social media and Political Marketing as whole
Keywords Digital Media marketing 2013 Election Campaign Factors analyze
INTRODUCTION
POLITICAL DIGITALampSOCIAL MEDIA IN ALBANIA
In recent decades many Western Balkan
countries including Albania began the process of
political transformation and socio - economic
transition which necessaries changes in the
respective political system Such
transformations and brought new developments
in terms of designing appropriate strategies
commensurate political class European models
However it seems to have difficulties even
today in their implementation this because of
cultural differences socio - demographic
economic historical etc
Proposed research topic focus on the modern
literature review regarding the new elements of
Political Marketing contextualize with Albanian
political market
Todays challenge for political parties in the
context of an increasingly dynamic environment
is to enhance the share of the electorate
through the delivery of the message in the
appropriate form for the realization of the main
objective in the future elections campaigns
As the latest literature refers Political Marketing
is a about Political Experience historical and
Political management studies of various
segments of the electorate through social -
demographic analysis relationship with the
media interest groups campaign management
companies fundraising and donations
compliance with the legal code of elections
political image and Political Product designing
political use of previous experience as a
contemporary approach models etc
Orjona Fjerza is a PhD candidate in Political Marketing Economic Faculty of Tirana Marketing Department (email orjonafjerzagmailcom) Vjollca Hysi (Panajoti) is professor and Head of Department of Marketing Economic Faculty of Tirana
Copyright copy2014 by International Journal of Sales Retailing and Marketing Vol 3 No 1 2014
73 DIGITAL MEDIA amp POLITICAL MARKETING IN ALBANIA
Sixty-six political parties and two independent
candidates were registered as contestants in a
largely inclusive process that offered voters a
genuine choice Political parties registered
according to the Law on Political Parties as well
as independent candidates could apply for
registration as electoral subjects
Most parties promoted similar platform goals
economic development employment
opportunities the fight against corruption and
European integration Issues most prominently
featured in the public debate were social
security and taxation While the DP noted
government achievements the SP promised a
new beginning The SMI criticized the
government and focused on job creation and
joining European structures
Major political parties in Albania such as the
Democratic Party Socialist Party Socialist
Movement for Integration Republican Party etc
engaged international companies for the
campaign management During the 2013
elections the Socialist Party hired the ldquoAlastair
Campbell brothers and left the advice of
ldquoCrespirdquo former Italian company which has
provided consultants on previous campaign
Democratic Party chose to collaborate with the
ldquoGovernment Advisory (Tony Blair company
adviser) which replaced the advice given by the
group of companies Tony Podesta Podesta and
Patton Boggs in the previous campaign
Although digital media was one of the key
factors to profit from Obamas election in 2008
presidential election new techniques of digital
media and new social media were almost
nonexistent during the 2009 General Election
Campaign in Albania
A wide range of media outlets operates in
Albania According to the Audiovisual Media
Authority (AMA) there are 3 national television
(TV) channels (public channel TVSH TV Klan and
Top Channel) 71 local TV channels 83 cable TV
channels and 59 radio stations
Print media are numerous although circulation
and impact are limited Internet provides an
open sphere for public discourse TV has the
highest share of advertising market and is
considered the primary source of information
due to its wide geographical coverage
The private broadcasters varied in their
coverage TV Klan favored the DP with 53 per
cent of mostly positive news coverage
compared to the SP with 28 per cent of often
negative news coverage Top Channel and Vizion
Plus were more balanced in their coverage even
if a more negative tone was noted towards the
government The news channels News 24 and
Ora News provided wide and generally neutral
coverage of the major parties The print media
showed some polarization with Shqip and
Shqiptarjacom mainly aligned with the
opposition and Mapo and Panorama with the
ruling party
Digital and Social media are becoming one of the
most important factor of Modern Marketing
which has resulted also important and surely to
be considered in Political marketing in Albania
Social Networks born as a possibility of
communication between friends but today they
have a great importance in communicating with
the public and Business Marketing Strategy
growth development The biggest social network
in the world is Facebook ( in Albania Also )
while Twitter has many users in different
countries of the world but there are very few
users in Albania Another fundamental
difference compared with Twitter is the space
and timing Facebook give the possibility of
social interactions mutual communication what
is most important is to obtain a direct feedback
and expand share and like posts messages
videos comments business or political pages
feedback promotions while Twitter is more
limited
Even though the boom of social media already
confirmed worldwide also requires interaction
with other forms of digital media Parallel with
the development of social media are moving
increasingly mobile application WebPages
Copyright copy2014 by International Journal of Sales Retailing and Marketing Vol 3 No 1 2014
74 DIGITAL MEDIA amp POLITICAL MARKETING IN ALBANIA
Google YouTube Apple Samsung etc In other
words a cross-marketing approach involving
multiple devices including TV touch screen
tablets computers laptops mobile phones etc
As the data revels below using or being focused
only on the social media marketing will not
guarantee the success for the political
marketing Cross digital marketing Strategies will
be necessary to be elaborate and implement in
the future campaigns
RESEARCH QUESTIONS
According to the recent changes on the
marketing concepts especially in the nonprofit
marketing in our case on Political Marketing
the article tries to give answers to the following
questions
1 Are applicable in Albania new patterns and
trends based on contemporary literature and
practices of Political Marketing
2 The positive effects of the use of digital and
social media in politics compared with the most
developed countries will have particular impact
on the successes of the Political Parties If there
is a positive connection what influence them
have and how political parties should use it
METHODOLOGY
The study is focused on the research works
articles scientific literature and in terms of
contextualization in order to highlight the way
s how the Albanian case confirms rejects or
criticizes models an approach already widely
accepted theory within the science disciplines
social and human In this sense we gave
fundamental approach combining theoretical
and empirical analysis
Initially a preliminary testing of the survey was
considered in December 2012 with around 200
questionnaires and in March- May 2013 the
realization of the survey with specific focus
groups and representatives regarding 1500
questionnaires were complete analyzed and
processed
Initially were set the dimensions of the survey
plot (with the help of inter - market Cronbacher
consistency alpha) = preliminary factorial
analysis After this step the problematic
questions identification helped a false removing
alpha coefficient (which shows the consistency
of variables) Further we focused on re - defining
the sampler for the selected sub- community (
ie reduced questionnaire )
The respondents were of different ages ranging
from 18 years to 52 years Field survey lasted
about two weeks and interviews conducted
through face- to-face confrontation with the
interviewee Respondents selected at random
and the sample selection made depending on
the weight that each university selected item
Demographic data presented in the tables
below
City Frequency Percentage
Tirana 778 519
Berat 97 65
Vloreuml 126 84
Shkoder 148 99
Durres 94 63
Elbasan 206 137
Gjirokaster 51 34
Total 1500 1000
Copyright copy2014 by International Journal of Sales Retailing and Marketing Vol 3 No 1 2014
75 DIGITAL MEDIA amp POLITICAL MARKETING IN ALBANIA
Age segments
Gender
Male Female Total
Frequency Frequency Frequency
18-21 350 304 800 696 1150 1000
22-25 118 423 161 577 279 1000
26-29 20 588 14 412 34 1000
30-33 7 467 8 533 15 1000
gt34 15 682 7 318 22 1000
Total 510 340 990 660 1500 1000
Part of this process was the creation of a
database with the collected data and their
processing and analysis which was conduct via
computer software like SPSS Excel and for the
purposes of the study used statistical models as
the principal analysis enabling components
finding correlations between dependent
variables and independent ones
FINDINGS ANALYZE
Factor Analyze
This section describes the data processed of the
second survey conducted as explained above in
the methodology section during the period
March-May 2013 Here are described the results
of the data regarding the impact of the use of
social media marketing techniques and
information received by the interviewers related
with Political information The Statistical model
used for the data processing is the factors
analyze and the analysis of the primary
processing elements
The table 1 shows the relationship (correlation)
between the variables gender and age on the
one hand and the questions - Which party do
you think has better organized election
campaign And the question which of the
parties predict will win the 2013 elections
Based on factor analysis of the correlation
coefficient with regard to gender the first
question is
-0073 which means that the connection is very
weak and negative direction The same is
observed with the second question for
predicting the winners of elections where the
coefficient is again very small thus making
insignificant Note that the correlation
coefficient indicates a mathematical value to
measure the strength of linear vibrations in
relation between two variables which takes
values from -1 to 1
1 Value +1 means that the connection is
completely strong
2 Value 0 indicates that the two variables have
no connection
3 A value of -1 indicates that the connection is
strong but completely opposite direction
The same phenomenon is also observed with
variable age where the values of these
correlations are very small reaching the
conclusion that the relationship between them
is almost inexistent Finally we can say that the
forecast for the winning party and the fact that
one of them has better organized electoral
campaign do not depend of the gender or age of
the respondents
Table 1 Matrix of Correlations
Which political party do you think
of the better organized the
campaign until now
In Your opinion which party do you
think will win the election
Gender -0073 -0076
Age -0041 -005
Copyright copy2014 by International Journal of Sales Retailing and Marketing Vol 3 No 1 2014
76 DIGITAL MEDIA amp POLITICAL MARKETING IN ALBANIA
Table 2
Table 3
Extraction Method Principal Component Analysis
Table 3 shows that the component 1 and 2
together account for 699 of the total variance
compared with the four factors taken together
where the largest share of the variation of voice
first factor to 417 Factor 3 and 4 has been
excluded (gender and age) which means that it
does not affect the analysis of variance factors
Table 4 shows the weight of each factor on
another expressed through correlation
According to the coefficient values obtained
data shows that the correlation of gender and
age with the first factor are respectively too low
(-0233 and -0171)
Table 4 Component Matrix
Extraction Method Principal Component Analysis
Table 5 shows the correlation coefficients for
each pair of variables The table also shows that
regardless of the respondents use the Internet
they are almost indifferent as regards
information relating to political parties on social
networks like Facebook Twitter on whether
they do Like these party websites or making
information Share from their respective post
which is indicated by the very low values of
these coefficients of correlations It is also
indicated in Table 6 which shows very low
values of these variables adjustment On the
other hand Table 7 also shows that the use of
the Internet Facebook and Twitter it also
occupied the largest share accounting for a
total weight of 64 of the 12 variables
considered
Initial
Extractio
n
Gender 1 0559
Age 1 0587
Which political party do you think of the better organized the campaign until now 1 0822
Your track which party do you think will win the election 1 0821
Extraction Method Principal Component Analysis
Component
Total
of
Variance
Cumulati
ve Total
of
Variance
Cumulati
ve
1 1672 41792 41792 1672 41792 41792
2 1116 27903 69695
3 0856 21395 9109
4 0356 891 100
Initial Eigenvalues
Extraction Sums of Squared
Loadings
1116
Total Variance Explained
1 2
Gender -0233 071
Age -0171 0747
Which political party do you think better organized the electoral campaign so far 089 017
According to your opinion which party do you think will win the election 0892 0159
Component
Copyright copy2014 by International Journal of Sales Retailing and Marketing Vol 3 No 1 2014
77 DIGITAL MEDIA amp POLITICAL MARKETING IN ALBANIA
Table 5 matrix of correlations
Table 6 Communalities
Extraction Method Principal Component Analysis
On
average
how
many
hours of
Internet
use
during a
week
Do you
use
Do you
use
Twiter
Do you
use
Twiteri
Are you
part of
the blog
Do you
use
If you
have an
account
on
have
you done
Like for
your
party
If you
have an
account
on
Twiter
have you
made the
web
Share
your
party
If you
have an
account
on
Twiter
have you
called
your
friends to
vote for
your
favorite
party
Have you
made
Like
Share
Call for
your
Party
Which
political
party do
you think
has better
organized
the
electoral
campaign
until now
Accordin
g to your
opinion
which
party do
you think
will win
the
election
On average how many hours of Internet use during a week 1 0182 0121 0175 0174 0165 0119 009 0084 0104 -0034 -0051
Do you use Facebook 0182 1 0053 0946 0089 0075 0266 0099 0068 0247 -0015 -0033
Do you use Twiterin 0121 0053 1 0137 021 016 0088 0173 0058 0103 -0029 0004
Do you use Facebook Twiteri0175 0946 0137 1 0112 0095 0263 0121 0087 0263 -0029 -0043
Are you part of the blog 0174 0089 021 0112 1 0318 0119 0092 0045 0105 0018 -0025
Do you use LinkedIn 0165 0075 016 0095 0318 1 0102 0075 0094 0102 -0042 -0049
If you have an account on Facebook have you done Like for your party 0119 0266 0088 0263 0119 0102 1 0389 0245 0923 -0314 -0302
If you have an account on Facebook Twiter have you made the web Share your party 009 0099 0173 0121 0092 0075 0389 1 0399 0447 -0221 -0183
If you have an account on Facebook Twiter have you called your friends to vote for your favorite party 0084 0068 0058 0087 0045 0094 0245 0399 1 0388 -0163 -0143
Have you made Like Share Call for your Party0104 0247 0103 0263 0105 0102 0923 0447 0388 1 -0308 -0313
Which political party do you think has better organized the electoral campaign until now -0034 -0015 -0029 -0029 0018 -0042 -0314 -0221 -0163 -0308 1 0644
According to your opinion which party do you think will win the election-0051 -0033 0004 -0043 -0025 -0049 -0302 -0183 -0143 -0313 0644 1
Initial Extraction
On average how many hours of Internet use during a week 1 0279
Do you use Facebook 1 0955
Do you use Twiter 1 0323
Do you use facebookTwiterin 1 0943
Are you part of the Blogs 1 0544
Do you have a Linkedin account 1 0506
If you have a fb Twiter account did u klik like to your favorite party post 1 073
If you have an account on Facebook Twiter have you made the web Share your party 1 055
If you have a fb Twiter account did you invite friends to voto for your favorite poltical Party 1 0453
Did u make like share invite for your favorite Party 1 0823
Which political party do you think better organized the electoral campaign so far 1 0789
According to your opinion which party do you think will win the election 1 0808
Copyright copy2014 by International Journal of Sales Retailing and Marketing Vol 3 No 1 2014
78 DIGITAL MEDIA amp POLITICAL MARKETING IN ALBANIA
Table 7 Total Variance Explained
Extraction Method Principal Component Analysis
Table 8
Extraction Method Principal Component Analysis
a 4 components extracted
Table 8 presents the weight of these four main
components showing once again the weak link
between variables As to the manner of
obtaining information about political parties
associated with the program activities etc
Table 9 shows that respondents receive more
information through the social network
Facebook that has high correlation with Internet
use variable value 066 Also the correlation
between access to information through the
media like radio or television has low value
which means that although it can see or hear
the various programs they are much less
interested to hear or see programs on political
campaign concluding that a very small
proportion of young people are mainly those
who follow political information and most are
those who are actively involved in youth of
political parties or those who directly participate
in staff close candidates for deputies
Component Extractio
n Sums
of
Squared
Loadings
Total
of
Variance
Cumulati
ve Total
of
Variance
Cumulati
ve
1 3224 26865 26865 3224 26865 26865
2 1872 15603 42468
3 1432 11937 54406 1432 11937 54406
4 1175 9789 64194 1175 9789 64194
5 0893 7444 71638
6 0883 7359 78997
7 0822 6847 85844
8 0671 5588 91432
9 0563 4694 96126
10 0352 2933 9906
11 0067 0555 99615
12 0046 0385 100
Initial Eigenvalues
1872
Initial Extraction
On average how many hours of Internet use during a week 1 0279
Do you use Facebook 1 0955
Do you use Twiter 1 0323
Do you use facebookTwiterin 1 0943
Are you part of the Blogs 1 0544
Do you have a Linkedin account 1 0506
If you have a fb Twiter account did u klik like to your favorite party post 1 073
If you have an account on Facebook Twiter have you made the web Share your party 1 055
If you have a fb Twiter account did you invite friends to voto for your favorite poltical Party 1 0453
Did u make like share invite for your favorite Party 1 0823
Which political party do you think better organized the electoral campaign so far 1 0789
According to your opinion which party do you think will win the election 1 0808
Copyright copy2014 by International Journal of Sales Retailing and Marketing Vol 3 No 1 2014
79 DIGITAL MEDIA amp POLITICAL MARKETING IN ALBANIA
This fact also support the values expressed in
Tables 10 and 11 for weight and adjusting the
variables where higher values are those using
the Internet and social network Facebook value
respectively 082 and 079 while other factors
are presented in low values Table 11 also shows
that only 6 of the 12 variables taken proper
review variances occupy 67 of their total
values of which are presented in Table 12
distributed
Table 9 Correlation Matrix
Correlati
on Matrix
Informed
about
politics
through
Internet
Informed
about
politics
through
Informed
about
politics
through
magazine
s
Informed
about
politics
through
Twiter
Informed
about
politics
through
Televisio
n
Informaci
onin per
politiken
e merrni
Nepermje
t Radios
Informed
about
politics
through
Radio
Informed
about
politics
through
friends
If you
are
informed
through
television
the
informati
on gained
from TV
Klan
seems to
you to be
realistic
If you
are
informed
through
television
the
informati
on gained
from
NEWS
24 seems
to you to
be
realistic
Nese
informaci
onin per
politiken
e merrni
nepermje
t medias
vizive a
ju duket
realist
informaci
oni ne
Ora
News
If you
are
informed
through
television
the
informati
on gained
fromTop -
Channel
seems to
you to be
realistic
If you
are
informed
through
television
the
informati
on gained
from
TVSH
seems to
you to be
realistic
If you
are
informed
through
television
the
informati
on gained
from
UFO TV
seems to
you to be
realistic
Which
political
party do
you think
better
organized
the
electoral
campaign
until
now
Accordin
g to your
opinion
which
party do
you think
will win
the
election
Informed about politics through Internet1 0668 0185 0195 0233 0158 0231 0307 0139 0158 0117 0124 0067 0119 -0149 -0169
Informed about politics through Facebook0668 1 0131 021 0207 0185 0274 0359 0172 0174 0173 0152 0081 012 -0146 -0157
Informed about politics through magazines0185 0131 1 0038 0432 0175 0223 0207 0189 0194 0231 0067 0237 0214 -0128 -0092
Informed about politics through Twiter0195 021 0038 1 -0195 0365 0076 0127 0165 0158 014 0075 0059 0093 -0025 0008
Informed about politics through Television0233 0207 0432 -0195 1 0073 0299 02 012 0153 0171 02 015 014 -0101 -0141
Informed about politics through Radio0158 0185 0175 0365 0073 1 0211 025 0169 0221 0208 0153 0122 0182 -0005 -0002
Informed about politics through Familiars0231 0274 0223 0076 0299 0211 1 0612 025 02 0231 013 0115 0175 -0176 -017
Informed about politics through friends0307 0359 0207 0127 02 025 0612 1 0186 0169 0218 0088 0091 019 -0153 -0167
If you are informed through television the information gained from TV Klan seems to you to be realistic0139 0172 0189 0165 012 0169 025 0186 1 0347 0334 0034 0415 0213 -0068 -0048
If you are informed through television the information gained from NEWS 24 seems to you to be realistic0158 0174 0194 0158 0153 0221 02 0169 0347 1 0683 0321 0247 0249 -0002 -0028
If you are informed through television the information gained from Ora News seems to you to be realistic0117 0173 0231 014 0171 0208 0231 0218 0334 0683 1 0217 0297 0324 -0007 -0025
If you are informed through television the information gained fromTop -Channel seems to you to be realistic0124 0152 0067 0075 02 0153 013 0088 0034 0321 0217 1 0032 0042 -0042 -0084
If you are informed through television the information gained from TVSH seems to you to be realistic0067 0081 0237 0059 015 0122 0115 0091 0415 0247 0297 0032 1 0494 -0058 -0033
If you are informed through television the information gained from UFO TV seems to you to be realistic0119 012 0214 0093 014 0182 0175 019 0213 0249 0324 0042 0494 1 -0004 -0005
Which political party do you think better organized the electoral campaign until now-0149 -0146 -0128 -0025 -0101 -0005 -0176 -0153 -0068 -0002 -0007 -0042 -0058 -0004 1 0644
According to your opinion which party do you think will win the election-0169 -0157 -0092 0008 -0141 -0002 -017 -0167 -0048 -0028 -0025 -0084 -0033 -0005 0644 1
Copyright copy2014 by International Journal of Sales Retailing and Marketing Vol 3 No 1 2014
80 DIGITAL MEDIA amp POLITICAL MARKETING IN ALBANIA
Table 10 Communalities
Extraction Method Principal Component Analysis
Table 11 Total Variance Explained
Extraction Method Principal Component Analysis
Initial
Extractio
n
Informed about politics through Internet 1 0827
Informed about politics through Facebook 1 0794
Informed about politics through magazines 1 0432
Informed about politics through Twiter 1 0655
Informed about politics through Television 1 0701
Informed about politics through Radio 1 0461
Informed about politics through Familiars 1 0753
Informed about politics through friends 1 0737
If you are informed through television the information gained from TV Klan seems to you to be realistic 1 045
If you are informed through television the information gained from NEWS 24 seems to you to be realistic1 075
If you are informed through television the information gained from Ora News seems to you to be realistic1 0681
If you are informed through television the information gained fromTop -Channel seems to you to be realistic1 0612
If you are informed through television the information gained from TVSH seems to you to be realistic 1 0711
If you are informed through television the information gained from UFO TV seems to you to be realistic 1 0534
Which political party do you think better organized the electoral campaign until now 1 082
According to your opinion which party do you think will win the election 1 0814
Component Extractio
n Sums
of
Squared
Loadings
Total
of
Variance
Cumulati
ve Total
of
Variance
Cumulati
ve
1 3774 2359 2359 3774 2359 2359
2 1909 11934 35524
3 1505 9405 44929 1505 9405 44929
4 1282 8011 5294 1282 8011 5294
5 1206 754 6048 1206 754 6048
6 1055 6595 67075 1055 6595 67075
7 0948 5927 73001
8 0812 5073 78075
9 0719 4493 82568
10 0585 3656 86224
11 0465 2905 89129
12 0414 2587 91716
13 0367 2294 9401
14 0346 2163 96172
15 0326 2039 98212
16 0286 1788 100
Initial Eigenvalues
1909
Copyright copy2014 by International Journal of Sales Retailing and Marketing Vol 3 No 1 2014
81 DIGITAL MEDIA amp POLITICAL MARKETING IN ALBANIA
Table 12 Component Matrix
Extraction Method Principal Component Analysis
6 components extracted
CONCLUSIONS
Political marketing is not only the elections
campaign The election campaign is the period
of emergence and implementation of marketing
strategy suitable constraint to growth target
electorate
Undoubtedly the implementation of modern
marketing strategies as in business as well as in
the field of Political Marketing depends on the
economic power of the political entity Even if
implementing with specialists the most
sophisticated and modern one campaign it
could not be enough to have the required
success in the elections
If the political Parties will not take in
consideration the campaign finance electoral
system legal framework election
administration Postelection period socio-
economic factors of the country regularly study
segments of the electorate whether there
would not operate in a social democratic system
inside and outside the Political Party political
marketing or other marketing techniques surely
will fail
As mentioned in the introduction of the paper
also after analyzing the survey conducted during
electoral campaigns marketing strategies
interaction in Albanian political market are
required
Note that this study excludes the impact of
external variables such as economic level
demographic composition social factors
relationship with the previous election history
etc
Despite the limitations of the research
mentioned above and the following set of
answers at the top of the paper we can
conclude
New forms and techniques of digital media has
been implanted from the political Parties in
2013 Election Campaign Data shows that more
and more the Digitalization of the campaign will
increase and new and more sophisticated
techniques would be elaborate and implement
Conclusions drawn through the final reports that
the digital media and social media applications
as part of marketing budget has to consider also
advertising spots rallies promotional products
1 2 3 4 5 6
Informed about politics through Internet 0533 -0367 0354 017 0095 0495
Informed about politics through Facebook 0565 -0341 0396 0145 0075 0418
Informed about politics through magazines 0493 -0006 -0328 0252 0128 0031
Informed about politics through Twiter 0291 0119 0622 -0405 0064 -0028
Informed about politics through Television 0454 -018 -0411 0532 -0066 0086
Informed about politics through Radio 0446 0142 0395 -0102 0041 -0273
Informed about politics through Familiars 0603 -0235 0001 0194 0146 -0525
Informed about politics through friends 0598 -0269 0154 0164 0219 -0456
If you are informed through television the information gained from TV Klan seems to you to be realistic0525 0277 -0102 -0238 0174 0028
If you are informed through television the information gained from NEWS 24 seems to you to be realistic06 0409 -0009 -007 -0466 0013
If you are informed through television the information gained from Ora News seems to you to be realistic0618 0426 -008 -0069 -0325 -0036
If you are informed through television the information gained fromTop -Channel seems to you to be realistic0328 0027 0076 0147 -069 002
If you are informed through television the information gained from TVSH seems to you to be realistic 0463 0389 -0358 -0237 0332 0226
If you are informed through television the information gained from UFO TV seems to you to be realistic0481 0352 -0208 -0109 0333 0118
Which political party do you think better organized the electoral campaign until now -0266 0612 0304 0519 011 0014
According to your opinion which party do you think will win the election -0275 0624 0305 047 0184 0
Component
Copyright copy2014 by International Journal of Sales Retailing and Marketing Vol 3 No 1 2014
82 DIGITAL MEDIA amp POLITICAL MARKETING IN ALBANIA
posters leaflets banners city light meetings
concerts etc
The final Reports of Parties and other interested
institutions and the deep analyses should offer
an accurate image
Political parties one shall be give due
importance to all public and certain market
segmentation but always in coherence with
socio-political system of Albania and in mean
time to stay in contact with the electorate also
in post election period
REFERENCES
Harris P 2001To Spin or not to Spin that is the
Question The Emergence of Modern
PoliticalMarketing The Marketing Review 2000
1 pages
wwcecgocal
OSCEODIHR Election Observation Mission Final
Report
httpwwweastjournalnetalbania-tony-blair-
torna-a-casa-gli-affari-delle-societa-di-
consulenza-nei-balcani33000
Electoral Code of Albania
wwwbuddecomauResearchGlobal-Digital-
Media-The-Dynamic-Digital-IPTV-and-Smart-
TVMarketshtml
httpwwwsocialbakerscomfacebook-
statisticsalbania
Fjerza O Hysi (Panajoti)V 2013 Authors survey
statistical methods and data analyze

Copyright copy2014 by International Journal of Sales Retailing and Marketing Vol 3 No 1 2014
IJSRM
Subscription Fees 2013 subscriptions are available in a number of major currencies Exchange rates and prices will be held throughout 2013 Subscription fees per volume are $US 300 poundStg 150 $Aus 370 euro 210 SFr 345 yen 33740 Individual journal editions can be purchased at the following prices 10 Journals pound15 per journal 20 Journals pound10 per journal 50 Journals pound7 per journal Subscription information is available from the Publishers at Access Press UK 1 Hilllside Gardens Darwen Lancashire BB3 2NJ UK +447815737243 Reproduction Rights The publishers of the International Journal of Sales Retailing and Marketing have granted free of charge unlimited photocopying and other reproduction rights to subscribers for teaching and study use within the subscribing organization Authors may also photocopy or otherwise reproduce their particular case from The International Journal Sales Retailing and Marketing subject to an acknowledgement of publication and copyright details
Copyright copy2014 by International Journal of Sales Retailing and Marketing Vol 3 No 1 2014
1 Contents
Contents
Contents
Editorial 2
STUDY OF IMPACT OF BRAND IMAGE OF RETAILERS ON CUSTOMERS BUYING DECISION OF STORE
BRANDS 3
Sonal Gupta Rajendra Jain amp Varun Parmal
IMPACT OF RETAIL STORE CHARACTERISTICS ON CONSUMER PURCHASE INTENTION 11
Hafiz Ihsan-ur-Rehman Muhammad Ashar Bakhtawar Javed Mayda Khalid amp Rabia Nawaz
DERIVING CUSTOMER SATISFACTION AND LOYALTY FROM ORGANIZED RETAILERrsquoS SALES
PROMOTION ACTIVITIES IN INDIA 21
Kirti Dutta amp Swati Singh
IMPACT OF RISK FACTORS RELATED TO INTERNET BANKING WITH SPECIAL REFERENCE TO NATIONAL
CAPITAL REGION 34
Shamsul Haq Pawan Kumar amp Bilal Mustafa Khan
SURVIVING OR THRIVING AN EXPLORATORY STUDY INTO COMPETING FOR THE SOUTH AFRICAN
SUPERMARKET SHOPPER 45
Justin Beneke
THE ICT EFFECTS AND THE SWITCHING COSTS IN THE RELATIONAL VARIABLES AN APPLICATION IN
RETAIL TRADE OF GREECE AND SPAIN 61
Irene Gil-Saura Konstantinos-Faidon Sylvestros amp Beatriz Moliner Velazquez
DIGITAL MEDIA amp POLITICAL MARKETING IN ALBANIA 72
Orjona Fjerza amp Vjollca Hysi (Panajoti)
Copyright copy2014 by International Journal of Sales Retailing and Marketing Vol 3 No 1 2014
2
Editorial
The current issue of
the International
Journal of Sales Retail
and Marketing
presents some
outstanding research
papers from all around
the world The journal
focuses on challenging
and complex area of retailing sales and
marketing in general Due to the increased
competition in those fields and changing
patterns of consumption this area is bound to
receive a lot of scientific and scholar attention in
the future There is a lot of space for
investigating and for offering implications and
strategic decisions to retailers and to all those
who are involved in this business
Current issue of the journal is dedicated to
seven research papers of high academic quality
written by academics from India South Africa
Albania Greece and Spain
The articles cover the core theories empirical
researches essential research tools expanding
the existing knowledge base about topics in
retailing sales and marketing and we hope that
they will be read and cited in the future
investigations and relieves dealing with this area
Thank you for following the IJSRM and we wish
you an enjoyable reading
Drsc Mirko Palić
Editor
3 STUDY OF IMPACT OF BRAND IMAGE OF RETAILERS ON CUSTOMERS BUYING DECISION OF STORE BRANDS
Copyright copy2014 by International Journal of Sales Retailing and Marketing Vol 3 No 1 2014
STUDY OF IMPACT OF BRAND IMAGE OF RETAILERS
ON CUSTOMERS BUYING DECISION OF STORE
BRANDS
Sonal Gupta Rajendra Jain amp Varun Parmal
Abstract
This research paper is an attempt to find out the impact of brand image of retailers on customersrsquo
decision whether to buy the store brands The purpose of this study is also to examine how the brand
image of retailers affects the perceived quality and perceived risk of store brands and ultimately the
customersrsquo buying decision of store brands Convenience sampling technique was used to collect
responses from 100 customers through mall intercept method using structured questionnaire as
research instrument This study reveals that brand image of retailer has significant impact on buying
decision of customers Study also suggests that brand image of retailer has significant impact on
perceived quality and perceived risk of buying store brands
Keywords Store Brands Store Image Buying Decision Perceived Quality Perceived Risk
INTRODUCTION
In India the growth of organized retailing results
into the growth of store brands which are also
called as private labels The performance of
store brands in India is quite reckonable There
is an increasing acceptance for private labels in
India According to Global Private Label
Consumer Study by ACNielsen (2005) 56 of
their survey respondents in India considered
private labels to be good alternatives to
manufacturersrsquo brands The growth of store
brands in India presents an interesting
opportunity for the retailer to understand the
motivations of consumers behind choice of
private label brands According to Images Retail
Report (2009) as quoted in Indian Retail Time
to Change Lanes by KPMG private label brands
constitute 10-12 of organized retail in India
Retailers had taken all the steps to enhance the
image of store brands They had repositioned
the private labels in such a way that they
occupy their own identity in competitive
market
Store image is the set of consumer perceptions
of a store based on different attributes
including service selection convenience store
atmosphere and quality Bloemer amp Ruyter
(1997) Store image refers to a consumers
global impression of a retail store Store image
offers recognition familiarity confidence and
other associations that make it easier for
consumers to make the decision to try the
product
In this situation it has become important to
build strong brand image among customers
Reda (2002) Collins-Dodd and Lindley (2003)
and Dhar and Hoch (1997) stated that store
image influences the private labelsrsquo brand
image Positive store image is a key asset for
retailers to achieve and sustain success in an
Dr Sonal Gupta is Associate Professor at Sanghvi
Innovative Academy Devi Ahilya Vishwavidyalaya
Indore India
(email sonalgupta519gmailcom)
Dr Rajendra Jain is Professor and Director of
Govindram Seksaria Institute of Management and
Research Devi Ahilya VishwavidyalayaIndore India
Varun Parmal is Assistant Professor at Sanghvi
Innovative Academy Devi Ahilya Vishwavidyalaya
Indore India
4 STUDY OF IMPACT OF BRAND IMAGE OF RETAILERS ON CUSTOMERS BUYING DECISION OF STORE BRANDS
Copyright copy2014 by International Journal of Sales Retailing and Marketing Vol 3 No 1 2014
increasingly competitive marketplace (Grewal
et al 1998) According to Livesey and Lennon
(1978) possible reasons for perception
differences are experience with store brands
heterogeneous response to marketing
activities different product needs perceived
risk and category importance among
consumers
Building a strong and successful store brand is
one of the important challenges in front of
retailers Consumers buying behaviors are
considerably influenced by the image of retailer
for buying store brands In this regard in the
current study role of brand image of retailer on
buying decision of customers is examined
Rationale
As more and more organized retail chains are
emerging in Indian market each every retailer
is trying to build up their image in the market
With the growth of these chains acceptance of
store brands is also increased in the market In
this scenario image of retailer creates an impact
on store brands There are very limited
researches available regarding store brands in
India The current researches on private labels
are conducted mostly in countries where store
brands are well established Most of the
researches conducted on corporate image and
customerrsquos decision of buying national brands
but there is dearth in researches on image of
retailer and store brands In response to the
concerns raised above this study is undertaken
to understand the influence of retailersrsquo brand
image on customer decision of buying store
brands This study will open the doors for the
new research area and will also help the
retailers to successfully develop an effective
strategy for store brands
Objectives
1 To study the role of brand image of
retailer on customersrsquo buying decision
of store brands
2 To study the affect of brand image of
retailer on perceived quality of store
brands
3 To study the affect of brand image of
retailer on perceived risk in buying
store brands
Hypotheses
H01 Brand image of retailer do not play any
significant role on customersrsquo buying
decision of store brands
H02 Brand image of retailer do not have
significant affect on the perceived quality of
store brands
H03 Brand image of retailer do not have
significant affect on the perceived risk in
buying store brands
LITERATURE REVIEW
Private Labels have long been considered an
important aspect of the retail industry both as
a strategic tool for retailers and a unique source
of competition for manufacturers (Batra and
Sinha 2000 Bellizzi et al 1981) Retailersrsquo
Brand also play a major role in improving stores
profitability (Ailawadi and Harlam 2004) their
differentiation strategy toward competing
stores (Davies 1990) as well as their consumer
attraction and loyalty-building capacity
(Corstjens and Lal 2000) Moreover a
consumer who is loyal to a retailer brand will
have a more favorable perception of the overall
retailer brand (de Wulf et al 2005) Consumers
who are loyal to a specific retailer brand are
likely to be more loyal to the store (Uncles and
Ellis 1989 Steenkamp and Dekimpe 1997)
Collins-Dodd and Lindley (2003) stated that the
store brands are seen as extensions of the store
image and can therefore contribute to store
differentiation in the minds of consumers
Results showed that store brands were rated
most highly by those who shopped most at
each store which may be explained by greater
experience or familiarity Bao et al (2010)
5 STUDY OF IMPACT OF BRAND IMAGE OF RETAILERS ON CUSTOMERS BUYING DECISION OF STORE BRANDS
Copyright copy2014 by International Journal of Sales Retailing and Marketing Vol 3 No 1 2014
focused on the role of intangible extrinsic cues
including store image product signatureness
and quality variation in a product category
Study suggested that private brands of different
stores are differentiated on store images and
exhibit differential quality perception and
purchase intention Richardson Dick and Jain
(1994) demonstrated the role of store
aesthetics in the formation of perceptions of
store brand quality Results showed that store
aesthetics can increase the evaluation of the
quality of store brands Martenson (2007)
showed ldquoStore as a Brandrdquo that is how retailers
perform their job is more important than that
the store offers store brands for customer
satisfaction It was found that customers are
satisfied when the store is neat and pleasant
and when they feel that the store understands
their needs Narasimhan and Wilcox (1998)
suggested that private labels not supported by
consumer advertising by the manufacturers of
these products can be supported by in-store
merchandising by the retailers Vahie and
Paswan (2006) focused on the relationship
between perceived private label brand (PLB)
image and perceived store image (SI) and
feeling associated with the presence of national
brand (NB) Two factors SI-quality and NBSI
national brand and store image (NBSI)-
congruence influence both the quality and
affective dimensions of consumer perception of
private label brand
Dick Jain and Richardson (1995) documented
perceived risk as an important factor in store
brand purchasing behavior Dunn Murphy and
Skelly (1986) found that consumers regard
private label brands as most risky on
performance measures compared to national
brands Researchers suggested that private
label brands are least risky on financial
measures however social risk is less important
for supermarket products generally Liljander et
al (2009) suggested that store image mitigate
the perceived psychosocial risk Both
dimensions of store image atmosphere and
quality negatively affect consumersrsquo perceived
risk Six main risk dimensions have been
proposed to explain consumersrsquo choice
behavior performance financial social
psychological and physical risk Jacoby and
Kaplan (1972) as well as time or convenience
risk Erdem Zhao and Valenzuela (2004) found
that in countries such as the UK private label
brands share is affected by greater risk reduced
price-quality evaluations and lower brand
loyalty
dAstous and Saint-Louis (2005) stated that
consumer evaluations of store brands and
national brands were influenced by the joint
effects of store image and intended usage
situation It was found that consumer
preferences for branded garments result from
the interplay of store image and purchase
motivation Porter and Claycomb (1997)
investigated the relationship between brand
characteristics - awareness level and image and
their influence on consumersrsquo perceptions of
retail image They proposed a model of
relationships between the number of
recognizable brands carried by a retail
establishment the presence or absence of an
anchor brand and perceptions of retail image
Findings indicated that brand image did
significantly influence overall retail store image
Binninger (2008) analyzed that the
improvement of consumer satisfaction with
some particular retailer brands has an impact
on building loyalty to those brands The results
showed that the increase in retailer brands
satisfaction and loyalty influences store loyalty
and that attitude toward retailer brands
products has a moderating effect on the
relationships between retailer brands
satisfaction and loyalty De Wulf Odekerken-
Schroder Goedertier and Van Ossel (2005)
found that for three out of four store brands
brand equity is present when consumers are
loyal to the store carrying the store brand It
was observed that retailers engage much more
6 STUDY OF IMPACT OF BRAND IMAGE OF RETAILERS ON CUSTOMERS BUYING DECISION OF STORE BRANDS
Copyright copy2014 by International Journal of Sales Retailing and Marketing Vol 3 No 1 2014
in experience marketing in comparison to
manufacturers who rely on traditional mass
media Study indicated that private label is part
of the total store experience and helps to build
the store brand
RESEARCH METHODOLOGY
The methodology for the study is quantitative in
nature The present research was carried out
through mall intercept interviews at selected
retail chains in Madhya Pradesh A non-
probability convenience sampling technique
was used to administer a consumer survey A
total of 150 questionnaires were administered
responses to 135 were received Out of the
collected 135 questionnaires 100 were found
to be fit for analysis
Data were collected with the help of structured
questionnaire as a research instrument
Questionnaire was based on 5 point likert scale
anchored between Strongly Disagree to
Strongly Agree
Reliability and validity test
Split half reliability was calculated to check the
reliability and found to be 76 which is high
Validity is checked by face validity and content
validity by the help of experts
Data analysis
1 Role of brand image of retailer in buying
decision of customers for store brands
The first objective of the study was to study the
role of brand image of retailer on buying
decision of customers For this Chi Square test
was applied the results are given in the Table
No1
Table No 1 Chi-Square for role of brand image of retailer on customersrsquo buying decision of
store brands
(a) 0 cells (0) have expected frequencies less than 5 The minimum expected cell frequency is
200
This table shows the test statistics all the
significance values are smaller than 005 at
001 level of significance with 4 degree of
freedom therefore the null hypothesis (H01)
ie Brand image of retailer do not play any
significant role on customersrsquo buying
decision of store brands is rejected Hence it
is concluded that brand image of retailersrsquo
plays significant role in purchase decision of
customers
1 Affect of brand image of retailer on
perceived quality of store brands
The second objective of the study was to study
the affect of brand image of retailer on
perceived quality of store brands For this Chi-
Square test was applied The results are given in
Table No2
I consider the
brand of retailer
before buying
store brands
I buy store
brands only from
retailers having
strong image in
the market
I am more
familiar with
store brands of
retailers who
has strong
branding
Strong brand
image of
retailer
increases my
intention of
buying store
brand
I would be
willing to pay a
higher price for
the private label
of retailers
having strong
image in market
Chi-Square(a) 20500 19800 27900 10000 14800
Df 4 4 4 4 4
Sig 000 001 000 040 005
7 STUDY OF IMPACT OF BRAND IMAGE OF RETAILERS ON CUSTOMERS BUYING DECISION OF STORE BRANDS
Copyright copy2014 by International Journal of Sales Retailing and Marketing Vol 3 No 1 2014
Table No 2 Chi-Square for affect of brand image of retailer on perceived quality of store
brands
Strong brand
image of
retailers
convince me
that store brand
is of good quality
Strong brand
image of
retailers
increase my
satisfaction level
about quality of
store brand
Retailer with
strong brand
image have
more variety of
store brands
Strong brand
image of
retailers
increases trust in
performance of
store brands
Store brands of
Retailers with
strong brand
gives value for
money
Chi-Square(a) 16400 19200 20500 21200 20000
Df 4 4 4 4 4
Sig 003 001 000 000 000
(a) 0 cells (0) have expected frequencies less than 5 The minimum expected cell frequency is
200
This table shows the test statistics all the
significance values are smaller than 005 at
001 level of significance with 4 degree of
freedom therefore the null hypothesis (H02)
ie Brand image of retailer do not have
significant affect on the perceived quality of
store brands is rejected Hence it is
concluded that brand image of retailers have
significant affect on perceived quality of
store brands
2 Affect of brand image of retailer on
perceived risk in buying store brands
The third objective of the study was to
study to study the affect of brand
image of retailer on perceived risk in
buying store brands For this Chi-
square test was applied The results
are given in Table No3
Table No 3 Chi-Square for affect of brand image of retailer on perceived risk in buying store
brands
Putting
money in
buying
store
brands of
retailers
with
strong
image is
worthy for
me
Store brands of
retailers with
strong band
image reduces
the risk of
financial loss in
buying the store
brand
Strong brand
image of
retailer
increases the
image of store
brand
Strong brand image of
retailer reduces the
risk of buying store
brand
Store brands of
retailers with
strong brand
image gives me
psychological
satisfaction of
buying it
I find buying store
brands of retailers
having strong image
in market is reflects
my image in society
Better After sales service
is provided with store
brands of retailers
having strong image in
the market
Chi-
Square(a) 28400 35400 9700 11900 20500 21700 20900
Df 4 4 4 4 4 4 4
Sig 000 000 046 018 000 000 000
(a) 0 cells (0) have expected frequencies less than 5 The minimum expected cell frequency is
200
The above table shows the test statistics all the
significance values are smaller than 005 at 001
level of significance with 4 degree of freedom
therefore the null hypothesis (H03) ie Brand
image of retailer do not have significant affect
8 STUDY OF IMPACT OF BRAND IMAGE OF RETAILERS ON CUSTOMERS BUYING DECISION OF STORE BRANDS
Copyright copy2014 by International Journal of Sales Retailing and Marketing Vol 3 No 1 2014
on the perceived risk in buying store brands is
rejected Hence it is concluded that brand
image of retailer have significant affect on
perceived risk in buying store brands
DISCUSSIONS AND CONCLUSION
Several studies demonstrate that retail store
image affects consumer product judgments and
responses in a positive manner Richardson et
al (1996) showed that if the store has an
attractive store atmosphere quality rating of
store brands increased by 21 percent Presents
research shows similarity in terms of how
retailersrsquo image create an impact on customersrsquo
buying decision of store brands with Collins-
Dodd and Lindley (2003) who stated that store
image influence specific store brand evaluations
and store brands are seen as extensions of the
store image and can therefore contribute to
store differentiation in the minds of consumers
and also with the work of Martenson (2007)
who suggested that there is a reciprocal
influence between store image and individual
store brand image the influence is stronger
from the store to the brand than in the
opposite direction In other words when
consumers have tried the store brand their
opinion about it will have a potential influence
on the store image but it is more likely that the
image of the store already influenced
consumers willingness to try the brand
Liljander et al (2009) suggested that store
image mitigate the perceived psychosocial risk
Both dimensions of store image atmosphere
and quality negatively affect consumersrsquo
perceived risk It was found that each
dimension of the store image affected different
dimensions of risk Present study also supports
these findings by suggesting that brand image
of retailer plays significant role on perceived
risk in buying store brands
Present study also reveals that store image
plays significant role on perceived quality of
store brands These findings are consistent with
the results of Vahie and Paswan (2006)
indicated that the store atmosphere and store
quality positively influence the perception of
private label brands quality and also with the
study of Semeijn et al (2004) who suggested
that the store image acts as an important
indicator of store brand quality
Implications
As private labels have become strategic tools to
create differentiation and increase the footfalls
this study will have important strategic
implications for retailers The findings of this
study will bring their focus on store image and
its impact on customers buying decisions of
store brands This study gives valuable insights
towards perceived quality and perceived risk of
store brands Retailers should put efforts to
chalk out effective strategy for improving their
brand image for the success of store brands
Scope and limitations
Since the scope of present study is limited to
Madhya Pradesh one of the states of India it
can be carried out at national and international
level The scope of present study can further be
expanded in the context of different
geographic demographic and socio-cultural
variables which could not be included in the
present study By considering the present
research as a base further research on private
labels can be carried out for studying the
impact of store image of a specific retail chain
on its store brands Retailers marketing
activities are increasing with the growth of
store brands and they are launching new store
brands in new categories Due to this research
can be extended to find out the best
management practices which should be
adopted by retailers for making their store
brands successful in the market
REFERENCES
ACNielsen (2005) The Power of Private Label
2005 A Review of Growth Trends around the
9 STUDY OF IMPACT OF BRAND IMAGE OF RETAILERS ON CUSTOMERS BUYING DECISION OF STORE BRANDS
Copyright copy2014 by International Journal of Sales Retailing and Marketing Vol 3 No 1 2014
World accessed June 2008 retrieved from
httpwww2acnielsencomreportsdocument
s2005_privatelabelpdf
Ailawadi K L amp Harlam B (2004) An Empirical
Analysis of the Determinants of Retail Margins
The Role of Store-Brand Share Journal of
Marketing 68 (January 2004) 147-165
Batra R amp Sinha I (2000) Consumer-level
factors moderating the success of private label
brands Journal of Retailing 76 175-191
Bao Y et al (2010) Motivating purchase of
private brands Effects of store image product
signatureness and quality variation Journal of
Business Research Article in Press
Bellizzi JA Kruckeberg HF Hamilton JR amp
Martin WS (1981) Consumer perceptions of
national private and generic brands Journal of
Retailing 57(4) 56-70
Binninger AS (2008) Exploring the
relationships between retail brands and
consumer store loyalty Journal of Product amp
Brand Management 36(2) 94-110
Bloemer J and Ruyter KD (1998) On the
Relationship between Store Image Store
Satisfaction and Store Loyalty European Journal
of Marketing 32 (56) 499-513
Corstjens M amp Lal R (2000)Building store
loyalty through store brands Journal of
Marketing Research 37 281-291
Collins-Dodd C amp Lindley T (2003) Store
brands and retail differentiation the influence
of store image and store brand attitude on
store own brand perceptions Journal of
Retailing and Consumer Services 10(6) 345-
353
dAstous A amp Saint-Louis O (2005) National
versus store brand effects on consumer
evaluation of a garment Journal of Fashion
Marketing and Management 9(3) 306-317
Davies G (1990) Marketing to retailers a
battle for distribution Long Range Planning
23(6) 101-108
De Wulf K Odekerken-Schroder G
Goedertier F amp Van Ossel G (2005)
Consumer perceptions of store brands versus
national brands Journal of Consumer
Marketing 22(4) 223-232
Dhar SK amp Hoch SJ (1997) Why
store brand penetration varies by retailer
Marketing Science 16(3) 208-227
Dick A Jain A amp Richardson P (1995)
Correlates of store brand proneness some
empirical observations Journal of Product amp
Brand Management 4 (4) 15-22
Dunn MG Murphy PE amp Skelly GU (1986)
Research note the influence of perceived risk
on brand preference for supermarket products
Journal of Retailing 62 (2) 204-216
Erdem T Zhao Y amp Valenzuela A (2004)
Performance of store brands a cross-country
analysis of consumer store-brand preferences
perceptions and risk Journal of Marketing
Research 41(1) 86-100
Grewal D Baker J Krishnan R amp Borin N
(1998) The effect of store name brand name
and price discounts on consumersrsquo evaluations
and purchase intentions Journal of Retailing
174(23) 331-352
Images Retail Report (2009) Indian Retail
quoted in Indian Retail Time to Change Lanes
by KPMG accessed March 2010 retrieved
from
httpwwwkpmgcomCNenIssuesAndInsight
sArticlesPublicationsDocumentsindian_retail
_O_0904pdf
Jacoby J amp Kaplan L (1972) The components
of perceived risk Advances in Consumer
Research 1(1) 519-532
Liljander V etal (2009) Modelling consumer
responses to an apparel store brand Store
image as a risk reducer Journal of Retailing and
Consumer Services 16 (4) 281-290
Livesey F amp Lennon P (1978) Factors
affecting consumersrsquo choice between
manufacturer brands and retailer own labels
European Journal of Marketing 12 (2) 158-170
Martenson R (2007) Study of the store as a
brand store brands and manufacturer brands
International Journal of Retail amp Distribution
Management 35 (7) 544-555
10 STUDY OF IMPACT OF BRAND IMAGE OF RETAILERS ON CUSTOMERS BUYING DECISION OF STORE BRANDS
Copyright copy2014 by International Journal of Sales Retailing and Marketing Vol 3 No 1 2014
Narasimhan C amp Wilcox RT (1998) Private
labels and the channel relationship a cross-
category analysis The Journal of Business 71
(4) 573-600
Porter SS amp Claycomb C (1997) The
influence of brand recognition on retail store
image Journal of Product amp Brand
Management 6(6) 373-387
Reda S (2002) Department stores struggle to
reinvent troubled model Stores 84(7) 22
Richardson PS Dick AS amp Jain AK (1994)
Extrinsic and intrinsic cue effects on perceptions
of store brand quality Journal of Marketing
58(4) 28-36
Richardson PS Jain AK amp Dick AS (1996)
Household store brand proneness a
framework Journal of Retailing 72 (2) 159-
185
Semeijn van Rielb J A CR and Ambrosini A
B (2004) ldquoConsumer evaluations of store
brandseffects of store image and product
attributesrdquo Journal of Retailing and Consumer
Services 11 pp 247ndash258
Steenkamp JBEM amp Dekimpe MG (1997)
The increasing power of store brands building
loyalty and market share Long Range Planning
30 (6) 917-930
Uncles MD amp Ellis K (1989) The buying of
own-labels European Journal of Marketing 23
(3) 57-70
Vahie A amp Paswan A (2006) Private label
brand image its relationship with store image
and national brand International Journal of
Retail amp Distribution Management 34(1) 67-
84
11 IMPACT OF RETAIL STORE CHARACTERISTICS ON CONSUMER PURCHASE INTENTION
Copyright copy2014 by International Journal of Sales Retailing and Marketing Vol 3 No 1 2014
Hafiz Ihsan-ur-Rehman Muhammad Ashar Bakhtawar Javed Mayda Khalid amp Rabia Nawaz Department of Business Administration University of The Punjab Gujranwala Campus
IMPACT OF RETAIL STORE CHARACTERISTICS ON
CONSUMER PURCHASE INTENTION
Hafiz Ihsan-ur-Rehman Muhammad Ashar Bakhtawar Javed Mayda Khalid amp Rabia Nawaz
Abstract
Global retailers considering the Asian market as a most attractive play field for gaining profit
Through communication networks and mass media global corporate culture has been brought and
influencing the consumerrsquos habits by changing their life style and purchasing patterns The purpose of
this study is to investigate the extent to which store characteristics product assortment store
atmosphere location and Purchase intention would influence the Pakistani consumerrsquos store choice
To analyze the factors that influence consumerrsquos Purchase intention 200 questionnaires were
distributed among the general public out of which One hundred and eighty surveys were received
This study would help the retailers to increase their market share and profitability by providing
desirable store environment to their customers Retailers can use these store attributes to maintain
their existing customers and to attract new customers
INTRODUCTION
Global retailers have been consolidated and
strengthening their roots day by day in
developing countries and trying to improving
their operational performance for gaining
sustainable growth in Asian markets As Asian
markets have become most attractive play field
for global giants due to increase in purchasing
power of customers
The importance of the retailing is seldom
subject to work on it especially in developing
countries like Pakistan Through
communication networks and mass media
global corporate culture has been brought and
influencing the consumerrsquos habits by changing
their life style and purchasing patterns This
study finds out and analyzes the different
aspects of retail store which influence the
consumerrsquos purchase intention towards store
choice Those aspects are product assortment
store atmosphere location and purchase
intention
Product assortment means the availability of
merchandise under one roof which enables the
customer to avail the great width of different
global and local products and as well as provide
one stop shopping experience Store
atmospherics includes store design lighting
music wide aisle and odor All these
characteristics will generate a positive
assessment of the store
Store location has a deep effect on the
consumerrsquos retail store choice A most favorable
store-site can affect different demographic
factors such as age income gender and family
size For getting the competitive advantage
retailers must consider the distance that
customerrsquos willing to travel for shopping at the
store
Purchase intention is customer willingness to
make a purchase of a specific product or
service which can be influenced by product
assortment Store atmosphere and location
The purpose of this study is to investigate the
12 IMPACT OF RETAIL STORE CHARACTERISTICS ON CONSUMER PURCHASE INTENTION
Copyright copy2014 by International Journal of Sales Retailing and Marketing Vol 3 No 1 2014
extent to which these characteristics would
influence the Pakistani consumerrsquos store choice
LITERATURE REVIEW
Product Assortment
Now a day it is commonly said theory that most
of the customers like and have a preference to
large assortments and a large range of
products The likelihood of the selection of a
store typically and largely depends on store
size and its assortment size and is inversely
dependent on distance from home said in the
foundational theory of store choice (Reilly 1931
Huff 1964 see Hubbard 1978 and Brown1989
for reviews of this work Baumol and Idle 1956
makes a similar argument) Among all the store
image attributes only product assortment and
price place great variances in choices said by
Finn and Louviere (1996)
Availability of great breadth of different
products offered by a store has a great amount
of impact on consumerrsquos perception about
store and retail image Because availability
under one roof enables customer to avail many
advantages First the great the width of the
range the greater the number of different
situations under which a retailer is recalled and
is considered by the consumer as noted by the
Keller (2003) Secondly the one stop shopping
convenience that a broad product range
enables more important than ever for
consumers with limited time today (Messinger
and Narasimhan 1997) increasing pressures on
retailers to broaden their range
Also the depth of the retail assortment affects
so much on consumer store choice Variety
seeking consumers will perceive greater
convenience as the perceived assortment of
brands flavors and sizes increases (McAlister
and Pessemier 1982 Kahn and Wansink 2004)
consumers will believe they have more
elasticity in their choices who have vague future
preferences (Kahn and Lehmann 1991) and
there are more chances that those consumers
locate the item they desire Private brand
assortment is very much popular in many stores
also with manufacturesrsquo brand A motivation for
offering private labels is the highest percent
margins (Hoch and Banerji 1993) and second
the implicit assumption that providing a private
label brand generates loyalty to the
store(Steenkamp and Dekimpe 1997) Baumol
and Ide (1956) and Brown (1978) observed that
stores which offer more product assortment
for those consumers are willing to travel farther
to those stores than those which offer low
assortment Assortment is multidimensional ndash
Broniarczyk Hoyer and McAlister (1998)
determined that three factors affect
consumersrsquo perceptions of assortment in a
categorymdashthe amount of shelf space devoted
to the category and the number of SKUs and
the availability of the consumerrsquos favorite item
(note that the terms ldquoitemrdquo ldquoproductrdquo and
ldquoSKUsrdquo will be used interchangeably)
Hoch Bradlow and Wansink (1999) determined
that product attributes affect consumersrsquo
perceptions of an assortment Also in another
study it is examined that product attributes
style colors and SKUrsquos is counted in product
assortment (TerryJ) However the number of
brands and sizes are attributes that can be
applied sparingly across categories (Boatwright
and Nunes 2001) Here in this research we have
chosen following measures of category 1
Number of brands offered 2 Number of sizes
per brand 3 Style and colors 4 Availability of a
householdrsquos favorite brands 5 Private brand 6
Number of stock-keeping units projected
There has also been suggested that shoppers
can feel comfortable and feel extra activity
when you see a wide range and variety of items
and goods (Kahn Moore and Glazer 1987 see
also Broniarczyk Hoyer and McAlister 1998)
And finally large assortment also help shopper
and to increase sale and give surety of sale that
by seeing large assortment and a big range of
products shopper might prefer to purchase
from that store by minimizing the ambiguity of
that available assortment is not good enough
for selection and large assortment also
13 IMPACT OF RETAIL STORE CHARACTERISTICS ON CONSUMER PURCHASE INTENTION
Copyright copy2014 by International Journal of Sales Retailing and Marketing Vol 3 No 1 2014
eliminate the thinking of shopper that available
assortment is not envoy of all good brands or
products and might be another store have more
good variety of products available and shopper
think that heshe should go to other stores also
(Greenleaf and Lehmann 1995 Karni and
Schwartz 1977)
But there are some factors which favor in
reduced or decreased assortment It is the
limited space in the store As if we are saying
that increased assortment increase our sale but
it is constrained here that every retailer is
unable to increase store space and shelf space
As shelf space is limited and it increases the
chances of not as good product visibility as in
limited edition of goods This factor argues on
limited occupancy of the shelf by keeping
sufficient number of stock keeping units So
finally it is concluded that consumers and
competitors leads us to increase assortment but
shelf and store space leads us to reduce
product assortment(Cadenat 2003)
Atmosphere
For a very competitive market retailers can not
benefit from price product distribution and
promotion So retailers set it apart from others
through special characteristics of retail stores
As consumers buy instant action can be
affected by the environment kept Previous
studies focused solely on music and lighting
elements but this particular study many
aspects of store environment The results show
that the store staff and store design can
influence the shopping mood not music It is
also possible satisfaction affected by emotions
of shopping through mediating role of
consumption behavior Consumer experience of
positive emotions in the shop will generate a
positive assessment of the stock (Liao Liaw amp
Jen)
Some studies reveal that retail store music
experience stimulates the consumption level in
terms of behavioral cognitive and emotional
reactions visibility and attitude the money and
spending time in the shop as well The
consumer profile the profile store market
timing and environmental cues moderate the
impact of music on purchasing behavior (Jain amp
Bagdare 2011)
Slow-tempo music perceive positive service
quality and low arousing cues have mediating
effects on consumerrsquos perception but fast
tempo music and high arousing cues have
indirect effect on consumer perception (Michon
amp Chebat 2006)This study investigated the
effect of store atmosphere on consumer
expectations about the quality of products and
store image as a mediator either web-based
shop or a brick and mortar store Findings
support previous studies which have shown
that consumer purchase intentions can be
affected by store image and consumer
expectations (Oh Fiorito Cho amp Hofacker
2007)
Retail stores must utilize unproductive area by
providing wide aisle which facilitate the
movement of customers throughout the store
Aisle deign would influence the pattern of
traffic flow towards the merchandising Lighting
consider as a mood setter tool It can be bright
and soft lights which flow throughout the
display area Retailers use these sophisticated
lights at regular interval for the sake of
customer attention For various behaviour and
situations lighting preferences varies individual
to individual (Butler amp Biner 1987) As compare
to bright lighting soft light create more
pleasant and soothing mood (Meer 1985)
Research suggests that home Interior decor
express the self concept and social status
(Lauman amp House 1973) (Jin 1990 Joy amp
Dholakia 1991 Lauman amp House 1973)
(Sadalla Veshure amp Burroughs 1987) Likewise
stores have self image and personality
(Martineau 1958) and it can be communicated
to the customers through store interior
designing Greenberg Sherman ampShiffman
1983 Rich amp Portis 1964)(Greenberg et al
1983 Kotler 1973 ) Pleasant environmental
14 IMPACT OF RETAIL STORE CHARACTERISTICS ON CONSUMER PURCHASE INTENTION
Copyright copy2014 by International Journal of Sales Retailing and Marketing Vol 3 No 1 2014
odor had positive effect on evaluations of in
store atmosphere available merchandising and
intend the customers to visit the store again
and again (Sprangenberg et al 1996) Results
indicate that fragranced store display generates
the most positive responses and pleasurable
experiences (Fiore Yah amp Yoh 2000)
Location
Retail location analysis helps in site selection for
a business outlet and in shaping the
performance of retail outlets in the trade area
of the store Selection of store location is a
long-term decision which requires a long-term
capital dedication in this context store location
is considered one of the most important
element in retail marketing strategy(Zentes
morschett amp schramm) The choice of a store
location has a deep effect on the entire
business of a retail operation For selecting a
most favorable store-site it is important to
consider the demographic factors of that area
including age income traffic patterns family
size competition and related kind of retail
outlets
This study has discussed Geographic
information system which is being utilized now
a day for analyzing the structure of retail
activities with location data Geographic
information system include Decision Support
Systems and Gravity Model(Byrom Retail
Location AnalysisA Case Study of Burger King amp
McDonaldrsquos in Portage amp Summit Counties
Ohio 2005)Geographic information system
collect and transform the several databases into
a common set of database (Pettit 1999) For
analyzing and mapping spatial data such as
transport networks retail location analysis
land-use patterns and opinion poll data
Geographic information system is the most
extensively used software now
Three key factors such as distance traveled to
get to the store size of the store and the retail
image of the store based on its products easy
accessibility visibility parking are used in
Gravity Model (Mercurio 1984)For getting the
competitive advantage for retailers Decision
support systems is also becoming a significant
source
While selecting a location an important factor
which must be considered is examining the
distance that a customer has to travel The
distances which customers want to travel are
depend upon the type of product to be
purchased On the base of specialty or
commodity product number of the trips made
by consumers and the travel time will be
different (Salvaneschi 1996)
Purchase Intention
Purchase intention of the consumer depends on
the store characteristic like location
assortment and atmosphere of a particular
brand It can be defined as
ldquoA purchase intention is customer willingness to
make a purchase of a specific product or
servicerdquo
Purchase intention of the customers consists on
the following steps
First step is Problem identification than search
out the information about the problem
evaluating the alternatives finally customer
make a purchase on these basis Post-purchase
behavior develops through these steps(Engel et
all 1995)Sometimes consumers buy the
product in store that is more attractive and
make a decision on the spot The intention of
purchasing the consumer may be impulse
buying or partially pre-programmed and can be
fully pre-planned
In impulse buying behavior of consumers to
make the decision and make an instant
purchase of the product that is more attractive
to him partly in pre-planned the consumer to
choose the product type and model but choose
the brand in the store and completely pre-
planned for an existing customer to choose the
product and the brand he will buy (Engel JF
Blackwell 1995)
15 IMPACT OF RETAIL STORE CHARACTERISTICS ON CONSUMER PURCHASE INTENTION
Copyright copy2014 by International Journal of Sales Retailing and Marketing Vol 3 No 1 2014
Consumer sentiment and the situation may
affect their impulsive purchase intent
Consumer sentiment include the personal taste
of the situation and express that impulse
purchase intent of consumers differ due to
variation in a situation such as prices increase
more than customer expectations (Kotler
2003) Brand awareness consumer perception
and brand association has a significant impact
on purchase intent (Shwu-Ing Wu and Chen-
Lien Lo 2009)Brand awareness increase brand
loyalty consumer confidence and purchases
intent for the consumer (Aaker D 1990)
Hypothesi
H1 Product assortment has strong significant
impact on purchase intention
H2 location has strong significant impact on
purchase intention
H3 store atmosphere has significant impact on
purchase intention
METHODOLOGY
To analyze and conclude the effects of product
assortment store atmosphere and location on
purchase intention Data is collected from the
retail store customers of Pakistan with
convenient random sampling technique The
target population of this study was all the retail
store customers 200 questionnaires were
distributed out of 180 complete questionnaire
were received to analyze the data These
questionnaires were got filled from retail store
customers of Gujranwala Gujrat and
Wazirabad A measuring instrument as closed
questionnaire was developed with the aim of
collecting data Questionnaire was classified
into two main sections first one Demographic
and another section was subjective
Demographic Section
Demographic section of this questionnaire
information about the employeersquos Gender Age
Marital Status education and city Total
respondent were 180 out of that 20were male
and female respondents were 160 in numbers
while the age of majority of retail store
customers were in the range of 20-24 years and
their frequency was 114 In marital status of the
retail store customers was 9 were married rest
of the customers were single Analysis of
Educational status shows that 163 are Graduate
and 17 persons are of intermediate level Most
of the respondents belong to Gujranwala city
and
Table 1 Pearsonrsquos moment correlation N=150
Correlation is significant at the 001 level (2-tailed)
Variables
Mean
Std
Deviation
Alpha
1
2
3
4
Product assortment
Store atmosphere
Location
Purchase intention
28944
40213
39370
40426
4329
7329
5946
5549
887
881
885
890
1
631
570
337
504
156
580
1
16 IMPACT OF RETAIL STORE CHARACTERISTICS ON CONSUMER PURCHASE INTENTION
Copyright copy2014 by International Journal of Sales Retailing and Marketing Vol 3 No 1 2014
Table 2
Table3
Table4
Model Summaryb
608a 370 360 44409 2064
Model
1
R R Square
Adjusted
R Square
Std Error of
the Est imate
Durbin-
Watson
Predictors (Constant) Location Store atmosphere Product assortmenta
Dependent Variable purchase intent ionb
ANOVAb
20407 3 6802 34491 000a
34711 176 197
55118 179
Regression
Residual
Total
Model
1
Sum of
Squares df Mean Square F Sig
Predictors (Constant) Location Store atmosphere Product assortmenta
Dependent Variable purchase intentionb
Coefficientsa
1987 253 7850 000
170 107 132 1591 113
-184 060 -243 -3069 002
585 070 627 8388 000
(Constant)
Product assortment
Store atmosphere
Location
Model
1
B Std Error
Unstandardized
Coef f icients
Beta
Standardized
Coef f icients
t Sig
Dependent Variable purchase intentiona
17 IMPACT OF RETAIL STORE CHARACTERISTICS ON CONSUMER PURCHASE INTENTION
Copyright copy2014 by International Journal of Sales Retailing and Marketing Vol 3 No 1 2014
its ratio is 160 and 15 respondents from Gujrat
and the rest of five respondents were the
inhabitants of wazirabad
Results and Discussion
To observe the impact of Product assortment
Store atmosphere and location on Purchase
intention Pearsonrsquos moment correlation was
analyzed and to test the relationship of Product
assortment Store atmosphere and location on
Purchase intention linear regression was
conducted Descriptive statistics was also
computed to analyze the tendency of the
respondents and Cronbachrsquos alpha was
measured to test the reliability of the analysis
In Table 1 Mean value of Product assortment is
2894 that shows positive tendency of the
respondents 2894 is not much close to 5 that
shows product assortment does not have
significant effect on Purchase intention While
4329 is standard Deviation that shows 43
variation among responses where as alpha is
887 that shows 89 reliability of the survey
about Product assortment of the respondents
Table 1 show that Product assortment is
strongly correlated with store atmosphere
location and purchase intention 40213 is close
to 5 that shows Store atmosphere have
significant effect on purchase intention while
7329 is standard Deviation that shows 73
variation among responses where as alpha is
881 that shows 88 reliability of the survey
about store atmosphere of the respondents
Table 1 show that store atmosphere is strongly
correlated with product assortment location
and purchase intention
Mean value of Location is 39370 that show
positive tendency of the respondents 39370 is
close to 5 that shows Location have significant
effect on Purchase intention While 594 is
standard Deviation that shows 59 variation
among responses where as alpha is 885 that
shows 89 reliability of the survey about of the
respondents Table 1 show that Location is
strongly correlated with Product assortment
Store atmosphere and purchase intention
To test the relationship of Product assortment
Store atmosphere and location on Purchase
intention linear regression is applied while to
test the normality of data and nature of
correlation Durbin Watson is also applied
Table 2 shows R = 608 which shows 60
variation in product assortment store
atmosphere and location on purchase
intention R square is the coefficient of
determination which shows that 37 total
variation with its linear relationship of Durbin
Watson test is used to test the nature of
correlation whether it is positive
autocorrelation or negative autocorrelation amp
zero autocorrelation Since the value of ldquodrdquo is
more than 2 it means there is negative
autocorrelation
Table 3 of ANOVA shows level of significance
since the value of ldquoprdquo is less than 05 so it is
accepted that product assortment store
atmosphere and location has significant effect
on purchase intention In Table 4 A = 1987 is
the average of purchase intention when
product assortment is zero whereas 170 is the
value of ldquobetardquo that shows one unit increase of
product assortment will bring 170 unit increase
in purchase intention
Purchase intention = 1987+
170(product assortment)
Above linear equation shows that one percent
product assortment will bring 17 change in
purchase intention
When store atmosphere is zero whereas -184 is
the value of ldquobetardquo that shows one unit
decrease of store atmosphere will bring -18
unit decreases in purchase intention
Purchase intention = 1987 + -184 (store
atmosphere)
Above linear equation shows that one percent
store atmosphere will bring -18 change in
purchase intention When location is zero
whereas 585 is the value of ldquobetardquo that shows
one unit increase of location will bring 585 unit
increases in purchase intention
Purchase intention = 1987 + 585 (location)
18 IMPACT OF RETAIL STORE CHARACTERISTICS ON CONSUMER PURCHASE INTENTION
Copyright copy2014 by International Journal of Sales Retailing and Marketing Vol 3 No 1 2014
Above linear equation shows that one percent
location will bring 58 changes in purchase
intention
According to table 4 if tolerance value exceeds
than 5 and VIF exceed 10 then it means Co
linearity in data exist Table 4 indicates 517
571 and 641 is the tolerance value and VIF is
less than 10 that show there is no Co linearity
exist
Limitations
This research has some limitations along with
its fruitful results First our targeted areas were
limited which Gujranwala wazirabad and
gujrat Second our research was not selective to
some particular retail outlets we collected data
from general retail customers who usually do
shopping Third our survey was based on small
sample of customers Fourth Researchers can
obtain better results of this study by using other
tools and statistical methods Fifth due to time
constraint some customers did not respond
properly
Despite of these limitations this study also
provides some future directions In spite of
above mentioned store characteristics in-store
attitude and after sales services can also be
investigated to measure purchase intention
Area of study and sample size can also be
increased to attain more significant results
Shopping involvement and shopping motive can
also be investigated Third this research could
be extended to cross cultural context
Practical implication
This study would help the retailers to increase
their market share and profitability by providing
desirable store environment to their customers
By using above mentioned store characteristics
local retailers can get competitive advantage
over global retailers Retailers can use these
store attributes to maintain their existing
customers and to attract new customers
REFERENCES
Aaker D (1990) Consumer evaluations of
brand extensions Journal of Marketing 27-42
Ailawadi K L amp Keller K L (2004)
UNDERSTANDING RETAIL
BRANDINGCONCEPTUAL INSIGHTS AND
RESEARCH PRIORITIES (Vols 1-34)
Bianchi C C (2009) Investigating Consumer
Expectations of Convenience-Store Attributes in
Emerging Markets Evidence in Chile Journal of
International Consumer Marketing 309-320
Borle S Boatwright P Kadane J B Nunes J
C amp Shmueli G (2005) The Effect of Product
Assortment Changes on Customer Retention
(Vols 616ndash622) Marketing Science INFORMS
Briesch R A Chintagunta P K amp Fox E J
(2008) How Does Assortment Affect Grocery
Store Choice (Vols 1-49)
Byrom (2005) Retail Location AnalysisA Case
Study of Burger King amp McDonaldrsquos in Portage amp
Summit Counties Ohio
Cadenat A A (2003) Efficient retailer
assortment a consumer choice evaluation
perspective international journal of retail and
distribution management 486-497
CHERNEV A (2003) When More Is Less and
Less Is More The Role of Ideal Point Availability
and Assortment (Vols 170-183) JOURNAL OF
CONSUMER RESEARCH
Darley W k amp lim f s (1999) Effects of store
image and attitude toward secondhand stores
on shopping frequency and distance traveled
International Journal of Retail amp Distribution
Management 311-318
Donofrio T J Beyond Basic Product
PlanningAssortment Planning (Vols 1-2) Retail
Systems and Services
Engel et all J F (1995) Consumer behavior (
8th ed) New York Dryden Press Farr A amp
Hollis N (1997) What do you want your brand
to be when it grows up big and strong Journal
of Advertising Research 23-36
Engel J F Blackwell R D (1995) Consumer
behavior ( 8th ed) New York Dryden Press Farr
A amp Hollis N (1997) What do you want your
brand to be when it grows up big and strong
Journal of Advertising Research 23-36
Fiore A M Yah X amp Yoh E (2000) Effects
of a Product Display and Environmental
19 IMPACT OF RETAIL STORE CHARACTERISTICS ON CONSUMER PURCHASE INTENTION
Copyright copy2014 by International Journal of Sales Retailing and Marketing Vol 3 No 1 2014
Fragrancing on Approach Responses and
Pleasurable Experiences Psychology amp
Marketing 27ndash54
Ibrahim h amp Najjar F (2008) Assessing the
effects of self-congruity attitudes and customer
satisfaction on customer behavioural intentions
in retail environment Marketing Intelligence amp
Planning 207-227
Jain R amp Bagdare S (2011) Music and
consumption experience a review Emerald
Group Publishing Limited
Kotler P (2003) Marketing Management (11th
ed) New Jersey Prentice Hall
Liao Y Y Liaw G F amp Jen F How Cues in the
Multiple Store Environment Influence Shopping
Mood and Patronage Satisfaction
Mercurio (1984) Retail Location Analysis
Michon R amp Chebat J C (2006) The
Interaction Effect of Background Music and
Ambient Scent 20-38
Oh J Fiorito S S Cho H amp Hofacker C F
(2007) Effects of design factors on store image
and expectation of merchandise Journal of
Retailing and Consumer Services 1-13
Pettit P (1999) Retail Location AnalysisA Case
Study of Burger King amp McDonaldrsquos in Portage amp
Summit Counties Ohio
Salvaneschi (1996) Retail Location Analysis
Shwu-Ing Wu amp Chen-Lien Lo (2009) The
influence of core-brand attitude and consumer
perception on purchase intention towards
extended product Asia Pacific Journal of
Marketing and Logistics 174-194
SIMONSON I (1999) The Effect of Product
Assortment on Buyer (Vols 347-370) Stanford
University New York University
Zentes J morschett d amp schramm h (nd)
Store Location ndash Trading Area Analysis and Site
Selection
Darley W k amp lim f s (1999) Effects of store
image and attitude toward secondhand stores
on shopping frequency and distance traveled
International Journal of Retail amp Distribution
Management 311-318
Fiore A M Yah X amp Yoh E (2000) Effects
of a Product Display and Environmental
Fragrancing on Approach Responses and
Pleasurable Experiences Psychology amp
Marketing 27ndash54
Jain R amp Bagdare S (2011) Music and
consumption experience a review Emerald
Group Publishing Limited
Aaker D (1990) Consumer evaluations of
brand extensions Journal of Marketing 27-42
Ailawadi K L amp Keller K L (2004)
UNDERSTANDING RETAIL
BRANDINGCONCEPTUAL INSIGHTS AND
RESEARCH PRIORITIES (Vols 1-34)
Bianchi C C (2009) Investigating Consumer
Expectations of Convenience-Store Attributes in
Emerging Markets Evidence in Chile Journal of
International Consumer Marketing 309-320
Borle S Boatwright P Kadane J B Nunes J
C amp Shmueli G (2005) The Effect of Product
Assortment Changes on Customer Retention
(Vols 616ndash622) Marketing Science INFORMS
Briesch R A Chintagunta P K amp Fox E J
(2008) How Does Assortment Affect Grocery
Store Choice(Vols 1-49)
Byrom (2005)
Byrom (2005) Retail Location AnalysisA Case
Study of Burger King amp McDonaldrsquos in Portage amp
Summit Counties Ohio
Cadenat A A (2003) Efficient retailer
assortment a consumer choice evaluation
perspective international journal of retail and
distribution management 486-497
CHERNEV A (2003) When More Is Less and
Less Is More The Role of Ideal Point Availability
and Assortment (Vols 170-183) JOURNAL OF
CONSUMER RESEARCH
Darley W k amp lim f s (1999) Effects of store
image and attitude toward secondhand stores
on shopping frequency and distance traveled
International Journal of Retail amp Distribution
Management 311-318
Donofrio T J Beyond Basic Product
PlanningAssortment Planning (Vols 1-2) Retail
Systems and Services
Engel et all J F (1995) Consumer behavior (
8th ed) New York Dryden Press Farr A amp
Hollis N (1997) What do you want your brand
20 IMPACT OF RETAIL STORE CHARACTERISTICS ON CONSUMER PURCHASE INTENTION
Copyright copy2014 by International Journal of Sales Retailing and Marketing Vol 3 No 1 2014
to be when it grows up big and strong Journal
of Advertising Research 23-36
Engel J F Blackwell R D (1995) Consumer
behavior ( 8th ed) New York Dryden Press Farr
A amp Hollis N (1997) What do you want your
brand to be when it grows up big and strong
Journal of Advertising Research 23-36
Fiore A M Yah X amp Yoh E (2000) Effects
of a Product Display and Environmental
Fragrancing on Approach Responses and
Pleasurable Experiences Psychology amp
Marketing 27ndash54
Ibrahim h amp Najjar F (2008) Assessing the
effects of self-congruity attitudes and customer
satisfaction on customer behavioural intentions
in retail environment Marketing Intelligence amp
Planning 207-227
Jain R amp Bagdare S (2011) Music and
consumption experience a review Emerald
Group Publishing Limited
Kotler P (2003) Marketing Management (11th
ed) New Jersey Prentice Hall
Liao Y Y Liaw G F amp Jen F How Cues in the
Multiple Store Environment Influence Shopping
Mood and Patronage Satisfaction
Mercurio (1984) Retail Location Analysis
Michon R amp Chebat J C (2006) The
Interaction Effect of Background Music and
Ambient Scent 20-38
Oh J Fiorito S S Cho H amp Hofacker C F
(2007) Effects of design factors on store image
and expectation of merchandise Journal of
Retailing and Consumer Services 1-13
Pettit P (1999) Retail Location AnalysisA Case
Study of Burger King amp McDonaldrsquos in Portage amp
Summit Counties Ohio
Salvaneschi (1996) Retail Location Analysis
Shwu-Ing Wu amp Chen-Lien Lo (2009) The
influence of core-brand attitude and consumer
perception on purchase intention towards
extended product Asia Pacific Journal of
Marketing and Logistics 174-194
SIMONSON I (1999) The Effect of Product
Assortment on Buyer (Vols 347-370) Stanford
University New York University
Zentes J morschett d amp schramm h (nd)
Store Location ndash Trading Area Analysis and Site
Selection
21 DERIVING CUSTOMER SATISFACTION AND LOYALTY FROM ORGANIZED RETAILERrsquoS SALES PROMOTION
ACTIVITIES IN INDIA
Copyright copy2014 by International Journal of Sales Retailing and Marketing Vol 3 No 1 2014
Dr Kirti Dutta is Assistant Professor at Bharatiya Vidya Bhavanrsquos Usha and Lakshmi Mittal Institute of Management (email duttakirtiyahoocoin) Dr Swati Singh is Lecturer Bharatiya Vidya Bhavanrsquos Usha and Lakshmi Mittal Institute of Management
DERIVING CUSTOMER SATISFACTION AND LOYALTY
FROM ORGANIZED RETAILERrsquoS SALES PROMOTION
ACTIVITIES IN INDIA
Kirti Dutta amp Swati Singh
Abstract
Organized retail in India is dominated by few powerful players who are organizing sales promotion
activities at regular intervals to attract customers The paper studies this promotion activity and data
was collected from different organized retail stores of one of the major retailer ACSI ECSI models
were used for analysis Findings reveal the customers have a whole set of expectations from the store
in terms of quality of the products on sale variety on sale behavior of staff etc Increase in perceived
quality is found to impact customer satisfaction and loyalty and retailers need to identify strategies
around the same
Keywords ACSI Promotions management retail management customer satisfaction customer
loyalty
INTRODUCTION
The retail sector in India has seen considerable
growth over the years as a result it has
attracted players from across the globe This
growth has been fuelled by higher income
levels favorable demographics and government
policies The Indian retail sector comprises of
both organized and unorganized players with
the unorganized sector commanding 96 share
of retail sales (Economic Times 2012)
Indiarsquos retail sector is likely to touch US$ 833
billion by the year 2013 amp record US$ 13 trillion
by 2018 with compound annual growth rate
(CAGR) of 10 Retailing both organized and
unorganized contributes almost 10 of Indiarsquos
GDP and employs almost 8 of Indiarsquos
employable population (Research amp Markets
2011) The last couple of years however have
seen retailers reeling under recessionary
pressures While many retailers downed
shutters others stalled expansion plans or shut
down non-viable stores Although conditions
began improving from the year 2010 retailers
realized that they need strong consumer
insights to survive in the long run
AC Nielsons Shoppers Trends study found that
shoppers increasingly prefer to shop at
supermarts and hypermarts for FMCG and
groceries while fresh fruits and vegetables are
still sought locally for freshness With increased
exposure to retail formats consumers are
becoming less flirtatious this being evidenced
by the store loyalty parameter which fell from
242 stores visited month in 2009 to 079 now
(Marketing Whitebook- 2011-12)
Sales promotions associated with manufactures
earlier have now become a forte of retailers
too Future Group was the first to launch a
number of promotions across its Big Bazaar
stores The promotion ldquoSabse saste 5 din
22 DERIVING CUSTOMER SATISFACTION AND LOYALTY FROM ORGANIZED RETAILERrsquoS SALES PROMOTION
ACTIVITIES IN INDIA
Copyright copy2014 by International Journal of Sales Retailing and Marketing Vol 3 No 1 2014
ldquodebuted on January 26th 2007 at Big Bazaar
outletsbecame an instant success and was
made a regular event Frequency of the sales
promotions was increased to include the week
around Independence Day followed by ldquoPublic
Holiday Salerdquo at all its Big Bazaar stores across
the country from April 28 to May 1(PawarT-
2012) The ldquoSabse saste 5 dinrdquo in January (from
23-29 January) 2012 saw Future Group report
national combined retail sales of Rs650 crores
which was 25-30 higher than the previous
year Taking a cue from Future Group all major
retailers launched equally innovative sales
promotion offers The Independence Day week
in 2012 saw retailers trying to outdo each other
with price challenges deep discounts and
lucrative offers Reliance Retail came out with
the 10-day lsquoPrice Challengersquo at its Reliance
Fresh Super and Mart stores Bhartirsquos Easy Day
went a step further with its 18-day lsquoFreedom
from inflationrsquo while Future Group retaliated
with a 6 day ldquoMahaBachatrdquo sale at its Big Bazaar
outlets (Kamath R 2012) Nielson study has
revealed that this definitive move towards sales
promotions particularly from the year 2009 has
been a major driver of store choice (Jacob S amp
Bhushan R 2012)
The mammoth size of all these retailers offering
sales has ensured that they stand at par when it
comes to offering the best in class promotions
Over the years sales promotion activities have
grown in size and stature into repeated mega
events The sales promotion activity therefore
has moved beyond being a short term
lsquotemptingrsquo offer into a strategic event focused
at garnering consumer loyalty To make matters
worse these promotions are run simultaneously
by all these retailers to ensure that their
products are stockpiled by the consumer Hence
to differentiate their sales promotion events
retailers will have to look beyond mere price
cuts and bargains to ensure consumer
patronage The present research focuses on the
sales promotions offered by one of these
organized retailers so as to identify the
perception and satisfaction level of the
consumers towards such promotions
LITERATURE REVIEW
Background
Sales promotions an integral component of the
marketing mix have been utilized to exert a
strong impact on short term purchase behavior
(Laroche et al 2003) Studies have revealed
that sales promotions significantly impact
consumers (Gilbert and Jackaria 2002
Pramataris et al 2001 Fill 2002 and Shump
2003) their decision making process (Mela
Gupta amp Lehman 1997 Papatla amp
Krishnamurthi 1996 Das and Kumar 2009)
increases the basket size (Ramanathan and
Dhar 2010) promotes aggregate sales of the
promoted brand (Blattberg and Neslin 1990)
stock piling increase in quantity purchased
product trial spending more and purchase time
acceleration (Gupta 1988 Shi Cheung amp
Prendergast 2005)
Studies have also been conducted on factors
affecting loyalty (Aaker 1996 Lau et al 2006
Garvin 1988 Evans et al 1996 Cadogen and
Foster 2000) characteristics of loyal customers
as well as switchers (Grover amp Srinivasan 1992
Bloemeramp Kasper 1995) effect of frequency
and amount of sales promotions on quantity
purchased and brand choices (Meyer
ampAssuncao 1990) as well as price judgments
(Alba et al 1999) Research has revealed that
irregular and less predictable promotion
patterns diminish consumerrsquos inclination to
postpone purchases in order to obtain better
deals (Krishna 1994) Impact of promotional
patterns including the degree of regularity and
predictability of the sales promotion has
attracted less attention Thus the present study
attempts to explore the customer satisfaction
and loyalty with sales promotions by modern
retail trade in India which is now in the process
of becoming a regular and predictable event in
the consumerrsquos purchase cycle
23 DERIVING CUSTOMER SATISFACTION AND LOYALTY FROM ORGANIZED RETAILERrsquoS SALES PROMOTION
ACTIVITIES IN INDIA
Copyright copy2014 by International Journal of Sales Retailing and Marketing Vol 3 No 1 2014
Sales promotion cannot be looked at as a mere
price incentive being offered to the consumer
but has to be understood in terms of the more
comprehensive models like the ACSI amp ESCI
This is primarily because retailers are trying to
cultivate loyalty to a sales promotion event and
therefore it requires the assessment of
customer expectations perceived quality
perceived value customer satisfaction
customer complaints and an understanding of
how they impact each other
ACSI ECSI and Customer satisfaction
The importance of customer satisfaction for
business success has been emphasized in the
marketing literature consistently Higher
customer satisfaction leads to improved
financial performance by reducing customer
switching improving loyalty promoting positive
word of mouth reducing price sensitivity and
enhancing firm image and reputation (Garvin
1988 Anderson 1998 Kandanpully amp
Suhartanto 2000 Homburg ampGiering 2001
Kim et al 2004) Over the years numerous
models have been proposed by researchers to
examine customer satisfaction Amongst them
the most compelling model that investigates
the linkages between antecedents amp
consequences of customer satisfaction is the
ACSI ie the American Customer Satisfaction
Index and ECSI (European Customer Satisfaction
Index) which is a national index used to
measure customer satisfaction across
industries The present study adopts the ACSI
model to investigate the antecedents and
consequences of customer satisfaction in the
context of sales promotions by organized
retailers
According to findings of Parasuraman et al
(1991) four factors impact customer
expectations word of mouth (or reputation)
personal needs past experience and external
communications In the CSI model the
determinants of expectations are customerrsquos
pre purchase experience with the
companyproductservice along with a forecast
of a companyrsquos ability to deliver quality (Fornell
et al 1996) Pre purchase experience includes
past consumption experience non-experiential
information like advertising and word of mouth
Although different studies have proposed
varied definitions of customer expectations
majority of literature has found that customer
expectations directly impact perceived quality
and thereby customer satisfaction (Bearden amp
Teel 1983 Tseamp Wilton 1988 Fornell et al
1996 Halstead et al 1994) Perceived value is
another construct of the CSI model that impacts
customer satisfaction Perceived value
evaluates the product quality in relation to the
price of the product (Fornell et al 1996 Balaji
2009) Thus the following hypotheses can be
drawn
H1 Customer expectations will positively affect
perceived quality
H2 Customer expectations will positively affect
perceived value
H3 Customer expectations will positively affect
overall customer satisfaction
H4 Perceived quality will positively affect
perceived value
Perceived quality and customer satisfaction
Most researchers lack agreement in defining
customer satisfaction and quality of service The
CSI model views customer satisfaction as a
function of customerrsquos expectations perceived
quality and value Oliver (1993) argued that
customers must have experienced some quality
in order to determine their satisfaction levels
Similarly many other studies have considered
service quality as an antecedent of customer
satisfaction (Anderson et al 1994 Chiou et
al2002 Cronin et al2000 Fornell 1992
Fornell et al 1996) Adopting most of these
findings this study takes quality of service to be
a determinant of customer satisfaction
Therefore
H5 Perceived quality will positively affect
overall customer satisfaction
Perceived Value and Customer Satisfaction
Perceived value is a unique construct in the CSI
model and was defined by Fornell and his
colleagues as one that represents the perceived
24 DERIVING CUSTOMER SATISFACTION AND LOYALTY FROM ORGANIZED RETAILERrsquoS SALES PROMOTION
ACTIVITIES IN INDIA
Copyright copy2014 by International Journal of Sales Retailing and Marketing Vol 3 No 1 2014
level of product quality relative to the price of
the product (Fornell et al 1996) Zeithaml
(1988) recognized the relevance of perceived
value but regarded it as a component of
perceived quality While Fornell et al
incorporated the perceived value to measure
overall customer satisfaction The existing
literature makes it difficult to draw a clear
distinction between the two constructs
perceived quality and perceived value for the
purpose of this research we have taken
perceived value as a distinct construct
impacting overall customer satisfaction keeping
in mind the primary appeal of a sales promotion
ie value derived from price reductions Thus
H6 Perceived Value will positively affect overall
customer satisfaction
Customer satisfaction and customer loyalty
The outcomes of customer satisfaction have
been examined by quite a few studies (Cronin
et al 2000 Szymanski et al 2001)
Understanding outcomes of customer
satisfaction (Cronin et al 2000) consumer
loyalty (Beiamp Chiao 2001) and intention to
continue business with a company (Burncham
et al 2003) are of central importance to
marketers Hence the study examines both
possible outcomes customer complaints and
customer loyalty Reduced customer complaints
will result in increased loyalty (Tax et al 1998)
The effective redressal of the complaint impacts
customer loyalty positively Thus
H7 Overall customer satisfactions will
negatively affect customer complaints
H8 Overall customer satisfaction will positively
affect customer loyalty
H9 Customer complaint positively affects
customer loyalty
Perceived value customer expectation and
customer loyalty
The various characteristics of services are
inherent in the retail store as well To overcome
this aspect the customer expectations (Ofir and
Simonson 2007) and judgment of perceived
quality can impact customer loyalty directly as
well (Yieh Chiao and Chiu 2007 Sathish and
Venkatesakumar 2011) Thus
H10 Perceived quality positively impacts
customer loyalty
H11 Customer expectations positively impact
customer loyalty
H12 Overall the customers are satisfied with
the sales promotion
METHODOLOGY
Primary research was conducted and data was
gathered from respondents who visited the
stores during the sales promotion The
questionnaire was finalized after a focus group
discussion with eight store managers (four each
from two different organizations) to understand
the various constructs of customer expectation
perceived quality perceived value satisfaction
loyalty and complaint The instrument was
tested on 50 customers with prior experience of
least two similar sales promotion events In the
final instrument perceived quality and customer
satisfaction were measured using 19 specific
constructs which included crowd management
billing time employee response and
knowledge point of purchase display returning
policy etc Perceived value was measured by
three constructs condition of the goods expiry
dates on goods and availability of bargains
Customer loyalty was measured on the basis of
regularity in attending the sales promotions
recommendations made and waiting for sale
Customer complaints were measured on the
basis of five constructs availability and
cooperation of employees complaining
behavior of customers action taken on the
complaint To overcome the consumerrsquos
behavior of not complaining formally customers
were asked to rank their opinion about the
manageability of the crowd and handling of the
same by the management Customers were
asked to rate each item on a ten point scale
where 1 was taken as lsquopoorrsquo and 10 was taken
as excellent
Data was collected from different retail stores
of one of the major organized retailer running
the sales promotion events in Delhi NCR during
25 DERIVING CUSTOMER SATISFACTION AND LOYALTY FROM ORGANIZED RETAILERrsquoS SALES PROMOTION
ACTIVITIES IN INDIA
Copyright copy2014 by International Journal of Sales Retailing and Marketing Vol 3 No 1 2014
the Republic day week of 2012 In total 159
respondents were interviewed and the
questionnaires were personally administered to
the customers who came to avail the offer This
was done to avoid the problem associated with
including non-users in the survey (Szymanski
and Henard 2001) The basic ACSI ECSI model
(as shown in Figure 1) was used to draw the
hypotheses and perform the analysis The
dotted lines in the figure denote the proposed
hypothesis which is not as per the ACSIECSI
Figure 1 The basic model for CSI
Source ECSI 1998 and ACSI 2012
Data Analysis and Results
The respondents for the study were all aware of
the sales beforehand It is interesting to note
that 7 of the sample size consists of retailers
or a lsquokiranarsquo store owners which is in line with
similar observations regarding purchases made
by kirana store owners during the sales
promotion period by organized retailers like Big
Bazaar and Reliance Retail (Malivya 2012)
Electronic goods were the most purchased
goods followed by groceries personal care
items furnishings crockery and then utensils in
the same order
Underlying dimensions of CSI for Retail Sales
Promotion
The values are calculated by Principal
Component Analysis and multiple regressions
Regression analysis was done to find the
relationships and R2 was calculated (all
calculations are significant at 95 level of
confidence) When compared with the basic
ECSI model it was seen that there is a slight
difference as the perceived quality and
customer expectation also directly affects the
customer loyalty (see figure 2) According to the
results perceived quality affects perceived value
(R2 is 094) customer satisfaction (R2 is 062)
and customer loyalty (R2 is 076) more than
customer expectation affects perceived value
(R2 being 052) Customer satisfaction (R2 = 053)
and customer loyalty (R2 = 035) The value of R2
generally varies between 0 to 1 and the more
closer it is to 1 the more perfect fit of the data
on the regression line denoting that the model
is close to reality and so except customer
expectationrsquos effect on loyalty all the other
values are coming more than 050 and are
therefore relevant
Using Lisrel to calculate the impact factor it was
studied that the direct impact of perceived
quality on customer satisfaction is 032 and the
indirect impact means that one point increase
in the expectation index results in 035 x 042=
0147 point increase in customer satisfaction
index A calculation of all the direct and indirect
effects as per the ECSI (Kristensen Martensen
and Gronholdt 2000) shows that a one point
increase in perceived quality and customer
expectation results in 0467 and 0439 increase
(respectively) in the customer satisfaction
index The calculation for the direct and indirect
effect on customer loyalty shows that quality
has a greater impact on loyalty than
expectation A one point increase in quality
Perceived
quality
Customer
expectation
Perceived
value
Customer
satisfaction
(ACSI)
Customer
complaint
Customer
loyalty
H5
H4
H2 H3
H8 H6 H1
H11
H10
H7 H9
26 DERIVING CUSTOMER SATISFACTION AND LOYALTY FROM ORGANIZED RETAILERrsquoS SALES PROMOTION
ACTIVITIES IN INDIA
Copyright copy2014 by International Journal of Sales Retailing and Marketing Vol 3 No 1 2014
results in increasing the loyalty by 051 whereas
a one point increase in expectation results in
increasing the loyalty by 038
The scores for the various components were
calculated using the ACSI formula where the
mean responses were converted into 0-100
scale for reporting purposes where 0 stands for
poor and 100 stands for excellent lsquoA
component score is the weighted average of
the individual attribute ratings given by each
respondent to the questions presented in the
survey A score is a relative measure of
performance for a component as given for a
particular set of respondentsrsquo (ACSI 2006) The
scores are given in the corresponding boxes in
figure 2 It can be observed that the
performance of customer satisfaction is the
highest followed by customer expectation
perceived value customer loyalty perceived
quality and customer complaint
Figure 2 The CSI model for Retail Sales Promotion by organized players
Thus it is perceived quality that impacts the
customer loyalty the most followed by impact
of perceived value customer satisfaction The
dominant model that emerges is that perceived
quality and customer expectations impact
perceived value and perceived quality impacts
both customer satisfaction and loyalty
To study multi-collinearity correlation was
carried out for the three factors It was found
that correlation is positive but the values are
not very high or in excess of 08 (maximum for
this calculation is 046) hence ruling out
multicollinearity (Gujarati 2004 pp 359) The
correlation between the various constructs is
given in table 1 below
Table 1 Correlation coefficients between constructs
Constructs
Customer
expectation
Perceived
quality
Perceived
value
Customer
complaint
Customer
loyalty
Customer
satisfaction
Customer
expectation 1
Perceived
quality 0264378942 1
Perceived value 0149520672 0351027965 1
Cus complaint 0105047077 0055981137 0183702146 1
Cus loyalty 0162089487 0457471401 0371270621 0266418589 1
Cus satisfaction 0227290079 032405844 0420766098 022925679 0401732 1
Perceived
quality (444)
Customer
expectation
(789)
Perceived
value (667)
Customer
satisfaction
(ACSI) (946)
Customer
loyalty (50)
Customer
complaint (20)
R2 =094
I=35
R2 =062
I= 032
R2 = 030
I= 042
R2 =076 I=
046
R2 =015
I= 023 R2 =035
I= 027
R2 =035
I= 011
R2 =052
I= 017
R2 = 034
I= 030
R2 = 035
I= 019
R2 =052
I= 024
27 DERIVING CUSTOMER SATISFACTION AND LOYALTY FROM ORGANIZED RETAILERrsquoS SALES PROMOTION
ACTIVITIES IN INDIA
Copyright copy2014 by International Journal of Sales Retailing and Marketing Vol 3 No 1 2014
The positive values of R2 and the positive
coefficient values suggest that the various
hypotheses studied (H1 ndash H11) are correct The
low value of R2 for H1 H6 H7 H8 H9 H10 and
H11 shows that the constructs of these
variables do not account for (maximum) more
than 46 of the aspect studied but still they
account for some portion of the study The
study can therefore be extrapolated to study
these aspects further
Calculation of Customer Satisfaction Score
Customer satisfaction was studied on the basis
of three constructs laid down by ACSI that is
overall satisfaction with the sales whether the
sales met expectations and evaluation on basis
of comparison to ideal The mean values were
transformed on a scale of 0-100and are given in
table 4 The ACSI scores are calculated as
weighted averages and the calculated weights
(ACSI 2005) for the customer satisfaction
constructs and are shown in table 2 as follows
Table 2 Values for Customer Satisfaction calculation as per ACSI
Constructs Values out of 100 Weights
Overall satisfaction 9203354 0343816
Met expectations 9608665 033543
Comparison to ideal 9580712788 0320755
ASCI score = ((92034 x 0344) + (9609 x 0335)
+ (9581 x 321) ) = 946
Based on this model the total customer
satisfaction for the chosen retailerrsquos sale comes
out to be 946 The ACSI average for retail trade
stands at 761(ACSI 2012) Therefore the H12 is
true and customers are overall satisfied with
the sales promotion
DISCUSSION AND CONCLUSION
Regression analysis shows that the overall
model of ACSI fits in the case of sales promotion
event in an organized retail The customer
satisfaction is influence by perceived value
perceived quality and customer expectation
Most consumers surveyed in this study
patiently waited for these promotions to make
bulk purchases Contrary to normal belief that
sales promotions when used in excess hamper
brand image retailers like Big Bazaar have used
them to enhance consumer loyalty as well as
improve brand image The satisfaction from the
sales promotion in this case comprises of
satisfaction received from buying a product on
sale and also numerous other concepts like
perceived quality perceived value customer
complaints expectations and loyalty The
research thus uncovered that consumers come
to the store to participate in a sales promotion
for the bargains and at the same time have a
whole set of expectations from the store in
terms of quality of the products on sale variety
on sale behavior of staff etc The analysis of the
findings has revealed that customers were
highly satisfied by the sales promotions as
reflected by a high ACSI score of 946 The
customer expectation has a high ACSI score of
79 and when compared to the score for
perceived quality (44) and perceived value (67)
shows a higher expectation than the perception
of quality and value The retailers therefore
need to either manage these high expectations
by avoiding over promising through its
communications or deliver on the promises and
improve the perception of the customers The
high ACSI score for customer satisfaction can be
attributed to the fact that the customer
satisfaction was broadly measured using
28 DERIVING CUSTOMER SATISFACTION AND LOYALTY FROM ORGANIZED RETAILERrsquoS SALES PROMOTION
ACTIVITIES IN INDIA
Copyright copy2014 by International Journal of Sales Retailing and Marketing Vol 3 No 1 2014
constructs like overall satisfaction with the
sales whether the sales met expectations and
evaluation on basis of comparison to ideal The
focus of the customers during the sales
promotion offer was to get the benefit of price
discounts offered which lead to the high
satisfaction score
In terms of customer loyalty the ACSI score was
found to be 50 which is quite encouraging as
sales promotions are associated less with
loyalty The score is indicative of the fact that
the retailer has managed to develop some
loyalty amongst its customers as most
customers were either regular buyer or referred
buyers of the retailer The ACSI score for
perceived quality was found to be 444 The
constructs utilized in the study for measuring
perceived quality addressed minute details of
the consumerrsquos experience during the sale
Hence the low score indicates that consumers
are no longer evaluating the sale as a value
gaining event alone but are also evaluating
operational dynamics of the store that includes
nature of products brands on sale behavior of
staff adequacy of the promotional messages
crowd management etc Moreover the retailer
needs to focus on perceived quality as a one
point increase in the same will result in 047
point increase in customer satisfaction and 051
point increase in customer loyalty
The ACSI score for consumer complaints was
found to be pretty low at 20 This is in line with
the hypothesis 7 that overall customer
satisfaction will negatively affect customer
complaints However in our study we have
mapped the respondentsrsquo willingness to
complain evaluation of the handling of
customer complaints and customers discomfort
during the sales A low overall score highlights
the fact that the customers were also giving low
scores to the company as far as ease of
complaining and appropriate redressal of the
complaints were concerned The unsatisfactory
handling of the complaint has lead to the low
score and retailer needs to effectively address
the complaint procedure in its entirety
Managerial Implications The paper is specific
to customer satisfaction with respect to sales
promotion activities by organized players in
India and is important as these sales promotion
activities are predicted events at regular
intervals of time Extant literature shows
studies conducted for sales promotion activities
that are not regular events and their happening
cannot be predicted by customers The paper
provides insights into the customerrsquos
satisfaction with these sales and the factors
driving the loyalty towards the sales
Sales promotions for retailers like Reliance Big
Bazaar etc happen to be an almost year around
activity through which it intends to draw in new
customers as well as reward its loyal customers
The research sensitizes marketers to the fact
that consumers are drawing satisfaction not
only from the perceived value of the sale but
also customer expectation and perceived
quality The consumer comes to the retail store
with a set of expectations that extend beyond
the type of promotions (buy one get one free
price off etc) on offer During their stay in the
store they are analyzing the nature of services
provided by the retailer the store ambience
management of the entire promotion (chaos at
the store etc) POP displays effectiveness of
announcements behavior of the staff
complaint handling etc On the one hand they
are deriving satisfaction from the sales due to
expectations perceived quality and value for
money derived from the sales However on the
other hand there is a marked gap between the
customer expectations and perceptions Hence
it is mandatory for retailers not only to provide
the right type of promotions but also ensure
operational efficiency of the promotion that will
lead to customer satisfaction and hence
customer loyalty Specific managerial
implications based on the research are as
follows
Enhancing loyalty to Sales Promotion The ACSI
score for loyalty is indicative of the fact that the
regularity of the sales promotions drive by the
said retailer has managed to develop loyalty
29 DERIVING CUSTOMER SATISFACTION AND LOYALTY FROM ORGANIZED RETAILERrsquoS SALES PROMOTION
ACTIVITIES IN INDIA
Copyright copy2014 by International Journal of Sales Retailing and Marketing Vol 3 No 1 2014
amongst the consumers The low score is also
indicative of the possibility of increasing sales
promotion (retailer based) loyalty in the future
by concerted efforts to make the promotion
drive a regular feature as well as a comfortable
encouraging experience for the consumers
Managing Perceived Quality Over the years as
the retail sector has become more crowded by
entry of new players promotions have grown in
number and duration To make matters more
competitive the promotions are scheduled
simultaneously As a result it is no longer
possible to gain consumerrsquos loyalty or consumer
satisfaction by merely providing lucrative deals
Retailers have to seek efficiencies in managing
the complete store experience during the
promotion drive for the consumer which
involves trolley management faster cashier
lanes effective communication availability of
promoted brands dealing with expired and
damaged goods favorable return policy and
appropriate employee behavior A focus on the
perceived quality is also necessitated by the fact
that an increase in the perception impacts
customer satisfaction and loyalty
Inviting amp Addressing Consumer Complaints
Although complaints by consumers were found
to be pretty low during the sales drive the
retailer has to be cautious and has to develop
an appropriate channel to invite and address
consumer complaints as consumer
disgruntment as well as unresolved complaints
can lead to negative WOM which can hamper
consumer satisfaction and loyalty in the long
run
Limitation and Future Research Direction
This study is specific to the sales promotion
activity of organized retailers in Delhi and NCR
It thus cannot be generalized for the organized
retail scenario in general or for the entire retail
scenario (organized as well as unorganized) in
India Organized retail accounts for a small pie
of the entire retail industry in India Thus the
organized retail scenario offers numerous
opportunities for organized players both
national and international keeping in mind the
opening up of the FDI rules governing the same
Research can be thus be conducted to study the
overall customer satisfaction drivers for
organized andor unorganized retail during
normal days as well which can give rich insights
into the culturally diverse consumer base in
India
REFERENCES
ACSI (2006)
httpwwwfsfedusresearchpdf2006_fs_rd
_customer_satisfaction_survey_final_reportpdf
ACSI (2012)
httpwwwtheacsiorgindexphpoption=com
_contentampview=articleampid=261acsi-sectors-
and-industriesampcatid=14ampItemid=338
Aaker DA (1996) Building Strong Brands
Free Press New York
Alba Joseph W Carl FMela Terence A
Shimp and Joel E Urbany (1999) ldquoThe Effect
of Discount Frequency and Depth on Consumer
Price Judgmentsrdquo Journal of Consumer
Research 26 (September) pp99-114
Anderson Eugene W (1998) ldquoCustomer
Satisfaction and Price tolerancerdquo Marketing
Letters Vol7 No3 pp265-74
Bawa Kapil amp Robert Shoemaker (2004) ldquoThe
Effects of Free Samples On Incremental Brand
Salesrdquo Marketing Science 233 pp345-363
BawaK ampShoemakerRW (1989) ldquoAnalyzing
incremental sales from direct mail coupon
promotionrdquo Journal of Marketing 53 (3) 66-76
Bearden William O and Jesse E Teel (1983)
ldquoSelected Determinants of Consumer
Satisfaction and Complaint Reportsrdquo Journal of
Marketing Research Vol 20 No 1 pp 21-28
BeiLTandYCChiao (2001)rdquoA ldquoIntegrated
Model for the Effects of Perceived Product
Perceived Service Quality and Perceived Price
Fairness on Consumer Satisfaction and Loyaltyrdquo
Journal of Consumer Satisfaction
Dissatisfaction and Complaining Behavior 14
125ndash140
30 DERIVING CUSTOMER SATISFACTION AND LOYALTY FROM ORGANIZED RETAILERrsquoS SALES PROMOTION
ACTIVITIES IN INDIA
Copyright copy2014 by International Journal of Sales Retailing and Marketing Vol 3 No 1 2014
Blattberg R C and Scott A N (1990) Sales
Promotions Concepts Methods and Strategies
Englewood Cliffs NJ Prentice Hall
Bloemer JMMamp Kasper HDP (1995) ldquoThe
Complex Relationship between Consumer
Satisfaction and brand Loyaltyrdquo Journal of
Economic Psychology 162 pp311-329
Burnham TA Frels JK Mahajan V (2003)
ldquoConsumer switching costs a typology
antecedents and consequencesrdquo Journal
Marketing Sciences 31(2)109-126
Cadogen JW amp Foster BD (2000)
ldquoRelationship Selling amp Customer Loyalty An
Empirical Investigationrdquo Marketing Intelligence
and Planning 184 pp185-199
Chiou J S Droge C amp Hanvanich S (2002) ldquo
Does customer knowledge affect how
loyalty is formedrdquo Journal of Service Research
5(2) 113ndash124
Cronin JJ Brady MK Hult GTM (2000)
ldquoAssessing the effects of quality value and
customer satisfaction on consumer behavioral
intentions in service environmentsrdquo Journal of
Retailing 6(2)pp193-218
Das G amp Kumar R-2009 ldquoImpact of sales
promotion on buyerrsquos behavior An empirical
study of Indian retail customersrdquo Journal of
Management 3 (1) 11-24
Economic Times(2012) ldquoFDI in multi-brand to
boost organized retail in Indiardquo
httparticleseconomictimesindiatimescom2
012-08-13news33182674_1_fdi-global-retail-
chains-gdp-growth Accessed 2nd September
2012
ECSI Technical Committee (1998) European
Customer Satisfaction Index Foundation and
Structure for Harmonized National Pilot
Projects Report prepared for ECSI Steering
Committee
Evans M MoutinhoL and RaaijWFV
(1996) ldquoApplied Consumer Behaviorrdquo Addison-
Wesely Publication Co Harlow Reading Mass
Fornell C (1992) ldquoA National Customer
Satisfaction Barometer The Swedish
Experiencerdquo Journal of Marketing 56 pp6-21
Fill C (2002) Marketing communications
Contexts strategies and applications (3rd
Edition) Italy Pearson Education Limited
Fornell C Johnson M D Anderson EW Cha
J amp Bryant BE (1996) ldquo The American
Customer Satisfaction Index Nature purpose
and findingsrdquo Journal of Marketing 60 (4)
pp(7-18)
Garvin DA (1988) Managing Quality The
Strategic and Competitive Edge Free Press
New York Maxwell Macmillan Toronto
Maxwell Macmillan International New York
Gilbert DC ampJackaria N(2002) ldquoThe efficacy
of sales promotions in UK supermarkets A
consumer viewrdquo International Journal of Retail
amp Distribution Management 30 (6) 315-322
GoswamiP and Mishra M(2009) ldquoWould
Indian consumers move from kirana stores to
organized when shopping for groceriesrdquo Asia
Pacific Journal of Marketing and Logistics 21(1)
127 - 143
GroverR and Srinivsan V (1992) ldquo Reflection
on a Simultaneous Approach to Market
Segmentation and Market Structuringrdquo Journal
of Marketing Research 294 pp474-476
Gujarati Damodar N (2004) Basic
Econometrics New Delhi Tata McGraw-Hill pp
359
Gupta S (1988) ldquoThe Impact of Sales
Promotions on When What and How Much to
Buyrdquo Journal of marketing research Vol25
pp342-355
Halstead D D Hartman and S L
Schmidt(1994) ldquoMulti source Effects on the
Satisfaction Formation Process Journal of the
Academy of Marketing Science Vol 22 No 2
pp 114-129
Homburg C amp Giering A( 2001) ldquoPersonal
characteristics as moderators of the
relationship between customer satisfaction and
loyalty An empirical analysisrdquo Psychology amp
Marketing Vol18No1 pp 43-66
Jacob S amp Bhushan R (2012) ldquoFuture Group
Lifestyle and Woodland clock record sales as
Republic Day discounts help retailers bounce
backrdquohttparticleseconomictimesindiatimes
31 DERIVING CUSTOMER SATISFACTION AND LOYALTY FROM ORGANIZED RETAILERrsquoS SALES PROMOTION
ACTIVITIES IN INDIA
Copyright copy2014 by International Journal of Sales Retailing and Marketing Vol 3 No 1 2014
com2012-01-31news31010348_1_retail-
sales-end-of-season-sales-discounts Accessed
21st September 2012
Kandanpully J amp Suhartanto D (2000)
ldquoCustomer loyalty in the hotel industry The role
of customer satisfaction and imagerdquo
International Journal of Contemporary
Hospitality Management Vol12 No6 pp346-
351
Kamath K (2012) ldquoRetail biggies outdo each
other with price challenges discountsrdquo
httpwwwbusiness-
standardcomindianewsretail-biggies-outdo-
each-otherprice-challenges-discounts483144
Accessed 8th September 2012
Kim M Park M ampJeong D (2004) ldquo The effects
of customer satisfaction and switching barrier
on customer loyalty in Korean Mobile
Telecommunication Servicesrdquo
Telecommunications Policy Vo28 No2 pp
145-59
Krishna Aradhna (1994) ldquoThe Impact of Dealing
Patterns on Purchase Behaviorrdquo Marketing
Science 13 (Fall) pp351-73
Kristensen K Martensen A and Gronholdt L
(2000) ldquoCustomer Satisfaction measurement at
post Denmark results of application of the
European Customer Satisfaction Index
Methodologyrdquo Total Quality Management
Volume 11 Issue 7 pp1007-1015
Laroche M Pons FZgolli NCervellon MC
and Kim C (2003) ldquo A Model of Consumer
Response to Two Retail Sales Promotion
Techniquesrdquo Journal of Business Research 567
pp513-522
Malviya S (2012) ldquoKirana stores throng big
retailers like Future Group Reliance Retail and
others for better marginsrdquo Economic Times
New Delhi Dated 28 August pp 4
Mela Carl F Gupta Sunil and Donald
BLehmann (1997) ldquo The Long Term Impact of
Promotion and Advertising on Consumer Brand
Choicerdquo Journal of Marketing Research
342pp248-261
Meyer Robert J and Joao Assuncao (1990) ldquo
The Optimality of Consumer Stockpiling
Strategiesrdquo Marketing Science 9 (Winter)
pp18-41
Ofir C and Simonson I (2007) ldquoThe effect of
stating expectations on customer satisfaction
and shopping experiencerdquo Journal of Marketing
Research Vol 44 pp 164-174
Papatla Purushottam and Krishnamurthi
Lakshman (1996) ldquo Measuring the Dynamics
Effects of Promotions on Brand Choicerdquo Journal
of Marketing Research122 pp24-32
PawarT-2012 ldquoBig Bazaars SabseSaste 5 Din
back with Mega deals and bigger bargainsrdquo
httpwwwindiainfolinecomMarketsNewsB
ig-Bazaars-Sabse-Saste-5-Din-back-with-Mega-
deals-and-bigger-bargains5338770514
Accessed 11th May 2012
Oliver R L(1993) ldquoCognitive Affective and
Attribute Bases of the Satisfaction Responserdquo
Journal of Consumer Research Vol 20 No 3
pp418-430
Parasuraman A Zeithmal V A amp Berry L L
(1991) ldquoRefinement and Reassessment of the
SERVQUAL scalerdquo Journal of Retailing 67(4)
pp 420-450
PawarT-2012 ldquoBig Bazaars SabseSaste 5 Din
back with Mega deals and bigger bargainsrdquo
httpwwwindiainfolinecomMarketsNewsB
ig-Bazaars-Sabse-Saste-5-Din-back-with-Mega-
deals-and-bigger-bargains5338770514
Accessed 11th May 2012
PramatarisKC
VrechopoulosAPampDoukidisGI (2001) ldquoThe
transformation of the promotion mix in the
virtual retail environment An initial framework
and comparative studyrdquo
httpwwweltrunaurebgrpapersiechtm
Shi YZ Cheung KM amp Prendergast G (2005)
ldquoBehavioral Response to Sales
Promotion tools-A Hong Kong Studyrdquo
International Journal of Advertising Vol24
No4
pp467-486
32 DERIVING CUSTOMER SATISFACTION AND LOYALTY FROM ORGANIZED RETAILERrsquoS SALES PROMOTION
ACTIVITIES IN INDIA
Copyright copy2014 by International Journal of Sales Retailing and Marketing Vol 3 No 1 2014
Ramanathan S and Dhar S K (2010) ldquoThe
effect of sales promotions on the size and
composition of the shopping basket regulatory
compatibility from framing and temporal
restrictionsrdquo Journal of Marketing Research 47
(3) 542-552
Research amp Markets (2011) ldquoBMI India Retail
Report Q1 2011rdquo
httpwwwresearchandmarketscomreports
1444352bmi_india_retail_report_q1_2011pdf
Accessed 6th September 2012
Sathish A S and Venkatesakumar R (2011)
ldquoCoffee experience and drivers of satisfaction
loyalty in a coffee outlet with special reference
to ldquocafeacute coffee dayrdquo The Journal of
Contemporary Management Research Vol 5
No 2 pp 1-13
Szymanski D M and Henard D H (2001)
ldquoCustomer satisfaction a meta-analysis of the
empirical evidencerdquo Journal of the Academy of
Marketing Science Vol 29 Issue 1 pp 16-35
Tax SS Brown SW and Chandrashekaran M
(1998)ldquoCustomer evaluation of service
complaint experiences Implications for
relationship marketingrdquo Journal of Marketing
Vol 62 April pp 60-76
Tse DK Wilton PC(1988) ldquoModels of Consumer
Satisfaction Formation An Extensionrdquo
Journal of Marketing Research Vol 25 No 2
pp 204ndash12
Yieh K Chiao Y C and Chiu Y K (2007)
ldquoUnderstanding the antecedents to customer
loyalty by applying structural equation
modelingrdquo Total Quality Management Vol 18
No 3 pp 267-284
Zeithaml VA (1988) ldquoConsumer perceptions
of price quality and value a means-end model
andsynthesis of evidencersquorsquo Journal of
Marketing Vol 52 July pp 2-22
Copyright copy2014 by International Journal of Sales Retailing and Marketing Vol 3 No 1 2014
34 IMPACT OF RISK FACTORS RELATED TO INTERNET BANKING WITH SPECIAL REFERENCE TO NATIONAL
CAPITAL REGION
IMPACT OF RISK FACTORS RELATED TO INTERNET
BANKING WITH SPECIAL REFERENCE TO NATIONAL
CAPITAL REGION
Shamsul Haq Pawan Kumar amp Bilal Mustafa Khan
Abstract
As the used of Internet Banking is increasing the cost of operation minimizing various electronic
delivery channels are increasingly used for delivering products and services at the convenience of
customers at low cost Internet Banking is easing the life of clients of banks The objectives of this
paper to know the factors which are influencing the used of internet banking as well as analyzing the
various risk dimension associated with internet banking
To find out the impact of all these variables a structured questionnaire has been prepared a through
a systematic survey which was conducted at the NCR The number of respondents were 300 belongs
to heterogeneous population The Chi-Square testt-test and Exploratory Factor Analysis (EFA) were
used to interpret the hypothesis the result illustrates population vital statistics impel the adoption of
online banking and also financial and social risk security and time risk and performance risk
contribute to the risk perceptions of banking customers
INTRODUCTION
The acceleration in technology has produced an
extraordinary effect upon our economy in
general has had a particularly produced
profound impact an expanding the scope and
utility of financial products over the last ten
years Information technology has made
possible the creation valuation and exchange
of complex financial products on a global basis
and even that just in recent years Derivatives
are obviously the most evident of many
products that technology has inspired but the
substantial increase in our calculation has
permitted a variety of other products and most
beneficially new ways to unbounded risk
LITERATURE REVIEW
The review of literature reveals that adoption
perception and usage of internet banking
extremely heavily examined by the researchers
Joshua (2009) found that the level of awareness
about Internet banking in the state of Karnataka
in India was 78 among users and 31 among
non-users Internet banking is a widely adopted
electronic banking service next to ATM Singh
(2004) found that a majority of Internet banking
users in South Africa used Internet banking for
inter-account transfers and checking
balancesstatements Payment of bills checking
of account balances printing statements funds
transfer and ordering check books are by far the
most popularly used Internet banking services
in Zimbabwe SournataMattila and Munnukka
(2005) Al-Sabbagh and Molla (2004)- all explore
the various inhibitors and drivers of electronic-
banking adoption They believe there are
relatively few empirical analyses of the impact
of electronic banking on customers As cyber
Shamsul Haq is Assistant Professor at UEI Global Rohini Delhi (email shamsulmbagmailcom) Pawan Kumar is Assistant Professor at ITS Mohan NagarGhaziabad Bilal Mustafa Khan is Assistant Professor at AMUAligarh
Copyright copy2014 by International Journal of Sales Retailing and Marketing Vol 3 No 1 2014
35 IMPACT OF RISK FACTORS RELATED TO INTERNET BANKING WITH SPECIAL REFERENCE TO NATIONAL
CAPITAL REGION
banking is a relatively new concept in context of
delivery of banking services online not so many
studies are available in Indian context Most of
the studies that the authors have gone through
are not in the Indian context
Ahmed and Saima (2008) stated that chances of
fraud and lack of information security are the
vital risks associated with electronic banking in
Pakistan Ming (2009) studied the risk factors in
detail and identified that security risk financial
risk performance risk and timeconvenience
risk have negatively affected the intention to
adopt online banking in Taiwan Almahmeed
et al (2008) conducted a research on all Kuwaiti
and non-Kuwaiti banks It was found that the
awareness of Internet banking proved to be
relatively high among business firms The most
frequently used services by the customers
were reviewing the account balance obtaining
detailed transaction histories obtaining
information about deposits loan interest rates
transfer funds between companyrsquos own
accounts transfer funds to other accounts
within Kuwait transfer funds to other accounts
outside Kuwait and issuing standing orders
Maiyaki and Mokhtas (2010) shown in their
research that there is no relation in between
population statistics and choice of banks It was
also found that statistically there is a significant
relationship between age and choice of banks
Khurana (2009) studied the perception of
Internet banking users through the relationship
between population statistics of users along
with the five independent variables
responsiveness reliability efficiency security of
information and ease of use It depicts there
was no significant relation in between age
occupation sex on the use of number of banks
operate by clients It also explain age has
convincing influence on the operational
efficiency of clients As regards reliability
customers had no trust in websites
Maiyaki and Mokhtas (2010) shown in their
research that there is no relation in between
population statistics and choice of banks It was
also found that statistically there is a significant
relationship between age and choice of banks
Selvam and Nanjappa (2011) in their study
examined customersrsquo awareness and
satisfaction about e-banking of ICICI bank on
the basis of vital statistics of the E-banking
users It depicted that college students are
more awareness level compare to other
education groups The study revealed that
awareness level of income group above 10000
per month was high as compared to other
income groupsIt was shown that it also depend
on the size of family Sex is the crucial issues for
the acceptance of internet banking
Ahmed and Saima (2008) stated that chances of
fraud and lack of information security are the
vital risks associated with electronic banking in
Pakistan Ming (2009) studied the risk factors in
detail and identified that security risk financial
risk performance risk and timeconvenience
risk have negatively affected the intention to
adopt online banking in Taiwan
Shergill and Lis (2005)depicted that women are
more serious regarding the security issues
compare to their male counterparSurvey by
Chung and Paynter (2002)privacy and security
issues are crucial for the adoption of cyber
banking Perceived risk like theft of private
information was concerning issues regarding
the adoption of online banking
Research Objectives
This study was conducted to know the impact
of demographic parameters
To identify the challenges those affect
the customers to use internet banking
To identify the challenges those affect
the banks to launch internet banking
services
To identify the main and general
challenges that affecting the internet
banking
To identify the factors influences
consumers to use internet banking
To measure the relationship between
factors (consumer demographic factors
Internet banking attributes social
Copyright copy2014 by International Journal of Sales Retailing and Marketing Vol 3 No 1 2014
36 IMPACT OF RISK FACTORS RELATED TO INTERNET BANKING WITH SPECIAL REFERENCE TO NATIONAL
CAPITAL REGION
influences) and the acceptance of
internet banking
To examine the factors those
discourage customers from using
internet Banking
To understand the influence of
demographic variables on various
dimensions of risk in the usage of
Internet banking
Hypothesis
H1There is no relationship of
population statistics on the
endorsement of e-banking
H2There is any difference between
users and non-users with regard to
their perception of social forces
H3 There is a difference between user
and non users with regard to their
perception of internet banking
H4 Customersrsquo perceptions of
various risk dimensions in the usage
of Internet banking are independent
of demographic factors
RESEARCH METHODOLOGY
The different parameters related to
respondents like age sex Income and
occupation taken through the structured
questionnaire and cross tabulation is given
belowIt is depicted the respondents complete
profile who were using banking service in NCR
region To evaluate data collected and interpret
it SPSS and Microsoft Excel was used This study
has been conducted to know the influence of
demographic factors in the adoption of E-
banking
Exploratory Factor Analysis (EFA) is employed
for validating the constructs used in the study
The significance of variation in constructs across
demographic variables is analyzed by using an
appropriate test statistic
Sample Size
50 questionnaires have to response from four
commercial centers (The ANSAL PLAZA PACIFIC
MALL EDM MALL and GREAT INDIA PALACE)
would be interviewed therefore 200
respondents from the commercial centers the
100 respondents who are professionals like
Faculties and Parma companies therefore total
number of 300 respondents responded the
questionnaires
Demographic Profiles of Respondents
Analysis has been done through the
demographic profile of the users of cyber
banking than different statistical tools are used
like Chi-square test
Table 11 Gender Profile of respondents
Respondents Profile
Male Female Total
General Respondents 168 56 132 44 300 100
Internet Users 72 60 48 40 120 100
Internet Non-users 96 53 84 47 180 100
Copyright copy2014 by International Journal of Sales Retailing and Marketing Vol 3 No 1 2014
37 IMPACT OF RISK FACTORS RELATED TO INTERNET BANKING WITH SPECIAL REFERENCE TO NATIONAL
CAPITAL REGION
Table 12 Age of Respondents
AGE Group (table 62)
General
Respondents Internet users Internet Non-users
124 41 38 32 86 48
95 32 62 52 33 18
51 17 15 13 36 20
30 10 5 4 25 14
300 100 120 100 180 100
Table 13 Education level of respondents
Education level (table 63)
General
Respondents Internet users
Internet Non-
users
Postgraduate 164 55 104 87 60 33
undergraduate 82 27 11 9 71 39
Highschool 46 15 1 1 45 25
Other 8 3 4 3 4 2
Total 300 100 120 100 180 100
Table 14 Income of respondents
General
Respondent Internal users Internet Non-users
Less than `25000 58 19 2 2 56 31
`25000-`34000 54 18 4 3 50 28
`35000-`44000 50 17 16 13 34 19
`45000-`54000 52 17 32 27 20 11
`55000-`99999 51 17 44 37 7 4
`100000-199999 18 6 18 15 0 0
`200000-299999 0 0 0 0 0 0
over `300000 0 0 0 0 0 0
other 17 6 4 3 13 7
Total 300 100 120 100 180 100
Table 15 Age users ampnon users Cross-tabulation
Count
users ampnon users Total
users non-users
Age
20-29 38 86 124
30-39 62 33 95
40-49 15 36 51
Copyright copy2014 by International Journal of Sales Retailing and Marketing Vol 3 No 1 2014
38 IMPACT OF RISK FACTORS RELATED TO INTERNET BANKING WITH SPECIAL REFERENCE TO NATIONAL
CAPITAL REGION
Table 16 -Chi-Square Tests
Value df Asymp Sig (2-
sided)
Pearson Chi-Square 38973a 3 000
Likelihood Ratio 39454 3 000
Linear-by-Linear
Association 858 1 354
N of Valid Cases 300
a 0 cells (00) have expected count less than 5 The minimum
expected count is 1200
The p of 0000 which is less than 005 Table (16) reflected that chi-square test is significant and
shown that there is a relationship between the age and the adoption of internet banking
Table17-EDUCATION users and non-users Cross-
tabulation
Count
USERAND NON
USER
Total
USE
R
NON-USER
Education
PG 104 60 164
Graduate 11 71 82
High school 1 45 46
OTHER 4 4 8
Total 120 180 300
Table 18-Chi-Square Tests
Value df Asymp Sig (2-
sided)
Pearson Chi-Square 89369a 3 000
Likelihood Ratio 103032 3 000
Linear-by-Linear
Association 58843 1 000
N of Valid Cases 300
a 2 cells (250) have expected count less than 5 The minimum
expected count is 320
The Chi-square is significant (p=0000)(Table-18 ) indicating that there is a significant relationship
between education level and the adoption of internet banking
Above 50 5 25 30
Total 120 180 300
Copyright copy2014 by International Journal of Sales Retailing and Marketing Vol 3 No 1 2014
39 IMPACT OF RISK FACTORS RELATED TO INTERNET BANKING WITH SPECIAL REFERENCE TO NATIONAL
CAPITAL REGION
Table 19-Income of users and non-users cross-tabulation
Internet Banking Total
Income Yes No
Less than 14000 2 56 58
14000 to 24999 4 50 54
25000 to 34999 16 34 50
35000 to 49999 32 20 52
50000 to 99999 44 7 51
100000 to199999 18 0 18
Percent 15 0 6
200000 to299999 0 0 0
over 300000 0 0 0
other 4 13 17
Total 120 180 300
Percent 100 100 100
Table-20-Chi-Square Tests
Value df Asymp Sig (2-
sided)
Pearson Chi-Square 141998a 6 000
Likelihood Ratio 166565 6 000
Linear-by-Linear
Association 59622 1 000
N of Valid Cases 300
a 0 cells (00) have expected count less than 5 The minimum
expected count is 680
The Chi-square is significant (p=0000)(table 20) indicating there is a significant relationship
between the income and adoption of internet banking
Table -21-OCCUPATION USERSampNON Cross-tabulation
Count
USERSampNON Total
USER NON-USERS
OCCUPATION
Employed 92 93 185
Un-Employed 0 38 38
Pensioners 2 5 7
Self-employed 24 34 58
OTHER 2 10 12
Total 120 180 300
Table 22-Chi-Square Tests
Copyright copy2014 by International Journal of Sales Retailing and Marketing Vol 3 No 1 2014
40 IMPACT OF RISK FACTORS RELATED TO INTERNET BANKING WITH SPECIAL REFERENCE TO NATIONAL
CAPITAL REGION
Value df Asymp Sig (2-
sided)
Pearson Chi-Square 35780a 4 000
Likelihood Ratio 49486 4 000
Linear-by-Linear
Association 5137 1 023
N of Valid Cases 300
a 3 cells (300) have expected count less than 5 The minimum
expected count is 280
Table 22 establishes that there is a significant interconnection between occupation and the
adoption of internet banking
Table 30(t-test) This sections tests the hypothesis that there is a significant difference between
users and non-users with regard to their perception of relative advantage of internet banking
Most attitudinal factors including factors including relative advantage compatibility complexity
perceived risk and perceived cost are found to be significant however complexity perceived risk and
perceived cost present a negative relationship Social influences did not result in any significant
differences between users and non-users
Table 30
Group Statistics
internet users N Mean
Std
Deviation
Std Error
Mean
work Style users 120 46250 67441 06157
Non-
users
180 26944 89128 06643
life convenient users 120 41083 60524 05525
Non-
users
180 26222 95224 07098
program is easy users 120 35167 102066 09317
Non-
users
180 27944 89503 06671
Internet banking is
complex
users 120 22917 92032 08401
Non-
users
180 35222 89352 06660
Process is Simple users 120 38083 89156 08139
Non-
users
180 25778 77644 05787
Time saving users 120 41333 67280 06142
Non-
users
180 32833 114957 08568
comfortable with bank users 120 40167 69794 06371
Non-
users
180 29278 99176 07392
Copyright copy2014 by International Journal of Sales Retailing and Marketing Vol 3 No 1 2014
41 IMPACT OF RISK FACTORS RELATED TO INTERNET BANKING WITH SPECIAL REFERENCE TO NATIONAL
CAPITAL REGION
Telecommunication cost users 120 20083 96577 08816
Non-
users
180 40722 60750 04528
fees are expensive users 120 28167 79898 07294
Non-
users
180 40667 72157 05378
Reliability and Validity
Reliability is determined by the Cronbachrsquos
coefficient alpha ( ) Nunnaly (1978) suggested
that for any research at its early stage a reliable
score or alpha that is 060 or above is sufficient
As shown in Table 4 all the construct
reliabilities surpassed the required minimum
EFA is applied on the data collected from 300
respondents to reduce the variables to a few
factors for further analysis The Kaiser-Meyer-
Olkin (KMO) measure of sampling adequacy
(KMO = 0735) is greater than the rule of thumb
050 and Bartlettrsquos test of sphericity is
significant which means that the items
included in the scale do have a correlation with
each other Thus factor analysis is found to be
an appropriate technique for construct validity
The variables which had loadings of less than
050 were excluded and dimensions with eigen
values of more than 1 were retained Table 4
exhibits the Rotated Factor Loadings (RFL)
percentage of Variance Explained (VE) by each
factor and Cronbahrsquos Alpha (CA) It is observed
that all the items have high factor loadings and
therefore all items are accepted and the
construct validity of the instrument is
established
Factor 1
It is the most vital factor that contributes to the
risk perceptions of Internet banking users which
explains 4321 of the variation Five items are
loaded on this factor This factor consists of
items associated with financial risk and social
risk as characterized by Featherman and Pavolu
(2003) and therefore this factor is labeled as
lsquofinancial and social risk
Factor 2
Four items are loaded on this factor which
explains 1326 of the variation This factor
consists of items associated with security risk
and time risk (Featherman and Pavolu 2003)
and therefore this factor is labeled as lsquosecurity
and time risk
Factor 3
Two items are loaded on this factor which
explains 1196 of the variation This factor
consists of items associated with performance
risk (Featherman and Pavolu 2003) and
therefore this factor is labeled as lsquoperformance
risk
Copyright copy2014 by International Journal of Sales Retailing and Marketing Vol 3 No 1 2014
42 IMPACT OF RISK FACTORS RELATED TO INTERNET BANKING WITH SPECIAL REFERENCE TO NATIONAL
CAPITAL REGION
Table 40 Customer Risk Perception of Usage of Internet Banking at National Capital region
Factorvariable RFL VE() CA
Factor 1 0832
I am afraid that I will lose money through Internet banking 0759
I worry that I will not get compensation if an error occurs 0763
My friend relatives and colleagues would think less of me if something wrong
with my internet banking account 0753 4321 0775
if fraud or hacking occurs to my Internet banking it will effect my status 0865
If an error occurs I will have to waste a lot of time to correct it 0663
Factor 2
It would take a lot of time to learn how to use Internet banking 0725
I feel unsafe to provide personal information over Internet banking 0659 1326 0765
I worry that other people may access my Internet banking account 0865
I would not feel secure sending sensitive information over
Internet banking 0771
Factor 3
Internet banking servers may not perform well due to low speed 0863 1321 0125
Internet banking servers may process payments incorrectly 0654
Note Principal Component Analysis Rotation Method Varimax with Kaiser Normalization Rotation
converged in 5 iterations
FINDINGS AND CONCLUSION
Most of the users are middle-aged (ie between
(31-39) have monthly income in excess `25000
are educated to Post Graduate level and
belongs to working class Research depicted
that only 28 percent banking clients were using
internet banking after evaluating the population
characteristics it was no significant relationship
in between age and use of cyber banking (the
significance level is 0005 in the chi-square
tests) It also depicted that there is no relation
in between gender and the adoption of internet
banking (the significance level is 0000 so we
assume null hypothesis) There is a gender
neutrality in the adoption of e-banking
Qualification in terms of education and income
of respondents were playing the role in the
acceptance of online banking (At the
Significance level of the chi-square test is 0 so
we reject null hypothesis)
This research depicted that users of internet
banking are increasing as their income and
education standard is improving number of
users depending upon the education standard
of internet banking users with income
Therefore it is the need of time financial literacy
of the users should be increased through
various programs could be run by the banks to
increase the awareness of internet banking
There is still a lot needed for the banking
system to make reforms and train their
customers for using internet for their banking
account Going through the survey main
problem lies that still customers have a fear of
hacking of accounts and thus do not go for
internet banking Banks are trying their level
best by providing the best security options to
Copyright copy2014 by International Journal of Sales Retailing and Marketing Vol 3 No 1 2014
43 IMPACT OF RISK FACTORS RELATED TO INTERNET BANKING WITH SPECIAL REFERENCE TO NATIONAL
CAPITAL REGION
the customers but there are a lot of factors
which betrays a customer from opening an
internet bank account
By that way banks could be able to reduce the
rush at the branches and operating cost also
therefore Banks are now spending heavily on
information technology front but from the side
of the government there is requirement to
invest on the infrastructure like electricity and
internet
The present study considered prominent risk
variables affecting adoption of Internet
banking and EFA segmented these variables
into three dimensions which are labeled as
financial and social risk security and time risk
and performance risk A cross- analysis of these
factors across different demographic variables
revealed that females perceive more risk than
males in the case of financial and social risk
Old customers perceive more security and time
risk than the young Businessmen perceive
more financial and social risk than employees
Undergraduates perceive more financial and
social risk than postgraduates Respondents
with basic level of computer knowledge
perceive more security and time risk than
respondents with advanced level of computer
knowledge Therefore it is concluded that
variables relating to different dimensions of risk
are different to a certain extent to different
categories of customers
It is useful from the view of clients as well as
the banks therefore in the coming years E-
banking reshape the traditional banking
REFERENCES
Ahmed Kaleem and Saima Ahmad (2008)
ldquoBankers Perceptions of Electronic Banking in
Pakistanrdquo Journal of Internet Banking and
Commerce Vol 13 No 1 pp 1-16
Ahmed Kaleem and Saima Ahmad (2008)
ldquoBankers Perceptions of Electronic Banking in
Pakistanrdquo Journal of Internet Banking and
Commerce Vol 13 No 1 pp 1-16
Almahmeed M AAlshirbini A and Paul G (2008)
ldquoAn Analytical Study of the Business Customer
Awareness PerceptionAttitude and Level of
Satisfactionrdquo Research Report Institute of
Banking Studies
Al-Sabbagh I and Molla A
(2004)Determinants of Internet and Cell Phone
Banking Adoption in South Africa available at
wwwarraydevcom commercejibc2005-
02brownhtm accessed in April 2005
Chung W and Paynter J (2002) An Evaluation
of Internet Banking in NewZealand in
Proceedings of 35th Hawaii Conference in
System Sciences (HICSS 2002) IEEE Society
Press 4 Gefen D Karahanna E and Straumlub
Featherman M S and Pavlou P A (2003)
ldquoPredicting e-Services Adoption A Perceived
Risk Facets Perspectiverdquo International Journal
of Hum Comput Stud Vol 59 No 4 pp451-
474
Joshua A J (2009) ldquoAdoption of Technology-
Enabled Banking Self-Services Antecedents and
Consequencesrdquo published PhD thesis
submitted to CUSAT Faculty of Social Sciences
Cochin available at
httpdyuthicusatacinxmluibitstreamhandl
epurl2010adoption 20of20technology-
enabled20banking20self-
services20pdfsequence =1 Accessed on
June 20 2011
Khurana S (2009) ldquoManaging Service Quality
An Empirical Study on Internet Bankingrdquo The
IUP Journal of Marketing Management Vol
VIII Nos 3 amp 4 pp 96-113
Maiyaki A and Mohd Mokhtas SS (2010)
ldquoEffects of Electronic Banking
FacilitiesEmployment Sector and Age Group on
Customersrsquo Choice of Banks in NigeriardquoJournal
of Internet Banking and Commerce Vol 15 No
1 pp 1-8
Maiyaki A and Mohd Mokhtas SS (2010)
ldquoEffects of Electronic Banking
FacilitiesEmployment Sector and Age Group on
Customersrsquo Choice of Banks in NigeriardquoJournal
of Internet Banking and Commerce Vol 15 No
1 pp 1-8
Selvam V and Nanjappa C (2011) ldquoCustomersrsquo
Awareness and Satisfaction About E-Banking A
Copyright copy2014 by International Journal of Sales Retailing and Marketing Vol 3 No 1 2014
44 IMPACT OF RISK FACTORS RELATED TO INTERNET BANKING WITH SPECIAL REFERENCE TO NATIONAL
CAPITAL REGION
Study with Reference to ICICI Bank
Gobichettipalayam TownrdquoPrajnan Vol 39 No
3 pp 218-22729 Sharma N Sehgal R K and
Goyal D P
Shergill GS and Li B (2005)Internet banking -
An empirical investigation of customers
behavior for online banking in New
ZealandJournal of E-business Vol 5(1) pp1-
169 Siu NY-M and Mou JCW(2005)
Singh A M (2004) ldquoTrends in South African
Internet Bankingrdquo Aslib Proceedings New
Information Perspectives Vol 56 No 3 pp
187-196
Suoranta M Mattila M and Munnukka J
(2005) Technology based Services A study on
the Drivers and Inhibitors of mobile
bankingInternational Journal of Management
and Decision Making Vol 6(1)
SURVIVING OR THRIVING AN EXPLORATORY STUDY INTO COMPETING FOR THE SOUTH AFRICAN
45
Copyright copy2014 by International Journal of Sales Retailing and Marketing Vol 3 No 1 2014
SURVIVING OR THRIVING AN EXPLORATORY STUDY
INTO COMPETING FOR THE SOUTH AFRICAN
SUPERMARKET SHOPPER
Justin Beneke
Abstract
The supermarket sector is a major component of the retail industry in South Africa Yet these
particular retail stores largely exist in a lsquosea of samenessrsquo where only subtle characteristics
differentiate them from each other This paper aims to investigate the means through which such
chains can achieve competitive advantage through the creation of customer commitment Whilst
structural bonds might create the impression that customers are loyal commitment goes beyond
behavioural loyalty and is argued to be a better indicator of the customerrsquos propensity to patronise
the retailer into the foreseeable future Through consideration of the retail mix this study determines
that low prices in-store promotions and facilities do not necessarily lead to customer commitment
whereas superior customer service and quality and variety of store merchandise are considerably
more influential in this respect However on the whole customer commitment in the supermarket
sector remains somewhat poor and needs to be further entrenched
Keywords behaviour commitment satisfaction structural bonds supermarkets retail mix
INTRODUCTION
There is little doubt that supermarket retailing
is a competitive business (Levy amp Weitz
2011187) Retailers need to face the realities of
todayrsquos market ndash changing demographics
increasingly sophisticated competitors and
overcapacity of the industry (Beneke 2010203
Cant amp Machado 200984 Kotler 200319)
Managing customer commitment is more
important than ever to ensure not only that
sales are bolstered but also to build continuous
patrongage and ultimately maximise customer
lifetime value (Stauss Chojnacki Decker amp
Hoffmann 20017 Thomas 2001262 Rowley
2005574) Committed customers have an
emotional connection with the retailer Their
reasons for continuing to patronise the retailer
extend beyond the convenience of the retailerrsquos
store andor the low prices and specific brands
on offer In fact many feel such goodwill
towards the retailer that they actively
encourage friends and family to buy from it
(Geyskens Steenkamp Scheer amp Kumar
1996303 Heskett 2002355 Kessim amp Abdulla
2006 424 Morgan amp Hunt 199420) Thus an
effective relationship marketing strategy for
managing commitment and loyalty with
customers is essential in retaining valuable
customers and subsequently developing a
sustainable competitive advantage (Liljander amp
Roos 2002 593)
Kotler and Armstrong (201032) define a
supermarket as a large low-cost low-margin
high-volume store that carries a wide variety of
food laundry and household products The
Justin Beneke is Senior Lecturer of Marketing at School
of Management Studies University of Cape Town
Tel 021 650 4392
Fax 021 689 7570
E-mail JustinBenekeuctacza
SURVIVING OR THRIVING AN EXPLORATORY STUDY INTO COMPETING FOR THE SOUTH AFRICAN
46
Copyright copy2014 by International Journal of Sales Retailing and Marketing Vol 3 No 1 2014
South African supermarket industry includes
major supermarkets such as the Pick n Pay
Shoprite SPAR and Woolworths groups as well
as some lesser known brands which are mainly
situated in smaller towns (FastMoving
2013Internet) The retail mix comprising the
various elements of the retailing function is
utilised by these stores to entice customers and
influence their purchasing behaviour Elements
in the retail mix include merchandise
assortments location pricing customer
service store design and display and the
communication mix of the retailer (Levy amp
Weitz 2011189) Retailers are thus faced with
the challlenge of developing a retail mix that
effectively satisfies its target market and drives
customer commitment
RESEARCH STATEMENT
This study aims to investigate the antecedents
of customer behaviour and commitment in the
South African supermarket industry Whilst
some customers might be behaviourally loyal
they may not necessarily possess true
commitment This may mean they are
vulnerable to defection in due course By
identifying and examining the significance of
these underlying drivers supermarket chains
can refine their strategy to play to their
strengths and minimise their weaknesses The
status quo of the industry will thus be probed
so as to determine general customer
satisfaction levels and the perceived
importance of retail mix attributes
LITERATURE REVIEW
The relationships between satisfaction loyalty
and commitment
Customer loyalty has become an increasingly
important aspect of marketing in the 21st
century (Beneke 2010203 Duffy 2005284)
Baker and Bass (200372) attributes this trend
to the rise of relationship marketing Slow
growth rates in mature markets have resulted
in the pool of new prospects being diminished
steering marketing attention toward retaining
and growing existing customer relationships
Consequently lsquocustomer loyaltyrsquo achieved
priority
Customer loyalty is described as a deeply held
commitment to re-buy or re-patronise a
preferred product or service consistently in the
future thereby causing repetitive same-brand
or same brand-set purchasing despite
situational influences and marketing efforts
having the potential to cause switching
behaviour (Knox 1998729 Oliver 199933
Passikoff 200614) Bowen and Chen (2001213)
assert that customer loyalty is difficult to define
and in general there are three distinctive
approaches to measure loyalty behavioural
measures attitudinal measures and composite
measures
The behavioural measurements consider
consistent repetitious purchase behaviour as
an indicator of loyalty (Bowen amp Chen
2001214) thus making a major assumption
that this repeat purchasing could capture the
loyalty of a consumer towards the supplier of
interest (Bandyopadhyay amp Martell 200735)
Oliver (199933) suggests that customer
satisfaction developed by way of product usage
is a necessary step in loyalty formation
however it becomes less significant as loyalty
begins to set through other mechanisms such as
individual fortitude (ie the degree to which the
consumer resists competitive pressure to switch
over to another brand) and social bonding (ie
the degree to which the community or the
society supports the consumer to remain loyal)
Attitudinal measurements consider the
emotional and psychological attachment
inherent in loyalty The attitudinal
measurements are concerned with the actual
sense of loyalty engagement and allegiance
(Bowen amp Chen 2001213) According to this
definition loyalty is the biased (ie non-
random) behavioural response (ie purchase)
expressed over time by some decision making
unit with respect to one or more alternative
suppliers out of a set of such suppliers and is a
SURVIVING OR THRIVING AN EXPLORATORY STUDY INTO COMPETING FOR THE SOUTH AFRICAN
47
Copyright copy2014 by International Journal of Sales Retailing and Marketing Vol 3 No 1 2014
function of psychological (decision making and
evaluative) processes (Jacoby amp Kyner 19731)
Jacoby and Kyner (19732) express that it is the
evaluation process that makes an individual
develop a commitment towards a supplier
The attitudinal and behavioural approaches
however examine loyalty unidimensionally In
contrast composite measurements of loyalty
combine the attitudinal and behavioural
dimensions and measure loyalty by variables
such as customersrsquo product preferences
propensity of brand-switching frequency of
purchase recency of purchase and total
amount of purchase (Hunter 199818 Pritchard
amp Howard 19972 Wong Dean amp White
199953)
A reputable example of the analysis of loyalty
using composite measurements is that
proposed by Dick and Basu (199499) who
argue that loyalty is determined by the strength
of the relationship between relative attitude
and repeat patronage and thus has both
attitudinal and behavioural elements Dick and
Basursquos (1994 cited by Garland amp Gendall
200481) customer loyalty model is an elegant
conceptualisation of attitude and behaviour
(Garland amp Gendall 200481) They suggest that
loyalty is the result of the interaction between a
customerrsquos relative attitude to a brand or
store and their repeat purchase behaviour The
typology divides customers in to four loyalty
groups (Dick amp Basu 199499) depicted in table
1
1 True loyals are customers with high
attitudinal and behavioural loyalty
2 Spurious loyals are those with high
behavioural loyalty but low attitudinal
loyalty
3 Latent loyals are those with high attitudinal
loyalty but low behavioural loyalty
4 Non loyals are those with low attitudinal and
behavioural loyalty
TABLE 1 DICK AND BASUrsquoS LOYALTY MODEL
Repeat Patronage
High Low
Relative
Attitude
High True loyalty Latent loyalty
Low Spurious loyalty No loyalty
Source Dick and Basu 1994 cited in Garland and Gendall 2004 82
Customer loyalty appears to be one of the most
discussed and contentious marketing concepts
of recent years (Through the Loop Consulting
2002Internet) Much of this debate and
ambiguity stems from the relationship between
customer loyalty and satisfaction Customer
satisfaction is
defined as the state in which customer needs
wants and expectations through the products
or servicesrsquo life are met or exceeded resulting in
repurchase brand loyalty and willingness to
recommend (Nicolson Kemp amp Linnell 19966)
Oliver (199933) argues that the two concepts
are
distinct Satisfaction is a fairly temporal post
usage state for one-time consumption or a
repeatedly experienced state for ongoing
consumption that reflects how the product or
service has fulfilled its purpose Loyalty on the
other hand is an attained state of enduring
preference to the point of determined defence
However he contends that satisfaction is an
essential ingredient for the emergence of
loyalty The ability to convert satisfied
customers into loyal customers is the pivot of
long-term success (Gitomer 19987)
It would appear that high customer satisfaction
does not always correlate with repeat
purchases and therefore with healthy profits
(Yudkin 199922) Dissatisfied customers donrsquot
always defect and satisfied customers
sometimes do Thus satisfaction alone cannot
SURVIVING OR THRIVING AN EXPLORATORY STUDY INTO COMPETING FOR THE SOUTH AFRICAN
48
Copyright copy2014 by International Journal of Sales Retailing and Marketing Vol 3 No 1 2014
predict future behaviour and customers may
even remain behaviourally loyal and not even
be happy with the product or service
Such behaviour has diminished the validity of
examining loyalty from only a behavioural
perspective Bandyopadhyay and Martell
(20072) assert that the existence of situational
factors (such as stock-out and non-availability)
intrinsic factors (such as individual fortitude) or
socio-cultural factors (such as social bonding)
that can differentiate between repeat purchase
and loyalty have prompted recent works that
have called for understanding and
operationalising brand loyalty beyond
behavioural measures Consequently advocates
of attitudinal loyalty have emphasised the
importance of the concept of customer
commitment
Customer commitment has sought to unravel
the confusion between satisfaction and loyalty
As such commitment involves the desire or
intention to maintain a valued relationship into
the future (De Wulf Odekerken-Schroumlder amp
Iacobucci 200133 Gundlach Achrol and
Mentzer 199578 Liljander and Leverin
2006232) Commitment is psychological rather
than behavioural and thus examines loyalty
from an attitudinal perspective Hofmeyr and
Rice (200355) contend that marketers cannot
deduce what consumers feel by observing their
behaviour Somebody who appears loyal could
in fact be completely uncommitted and switch
brands at the next purchasing occasion But
what customers feel dictates the way in which
the relationship between the customer and the
brand should be managed Commitment is
arguably synonymous with attitudinal loyalty
and thus these terms are often used
interchangeably
Commitment is built gradually during the
development of a relationship and parties can
be committed for different reasons Venetis and
Ghauri (20041577) identify three general
antecedents to commitment relational bonds
that are created between parties during the
course of the relationship the trust that has
been established between the partners and the
service quality
Relational bonds can be structural or social in
nature Structural bonds are the in a
relationship that if terminated will result in
considerable economical or financial costs for
the parties (Venetis amp Ghauri 20041577)
Turnbull and Wilson (1989233) assert that the
creation of a structural bond happens when the
two parties make investments that cannot be
retrieved when the relationship ends or when
it is difficult to end the relationship due to the
complexity and cost of changing suppliers The
more investments are made in a relationship
the more difficult its disengagement becomes
and the more a party will be committed to
continue the relationship regardless of their
satisfaction with the supplier An example of
such would be if the consumer is unable to
switch suppliers because the alternatives
require excessive travelling and as a result a
cost could be involved in transportation which
the consumer may not be able to afford
The social bonds are the interpersonal
relationships between the buyer and seller
(Turnbull amp Wilson 1989233 Bendapudi amp
Leone 20023) which are the glue that holds
the individuals together (Venetis amp Ghauri
20041577) Wilson (1995 cited by Venetis amp
Ghauri 2004) found that buyers who have a
strong personal relationship with the sellers are
more committed to maintaining the
relationship
The level of service quality is directly correlated
with the satisfaction the customer receives
from the supplierrsquos offering Satisfaction is
considered an important but not a necessary
condition for a party to be committed to the
relationship Genesan (19941) found that
satisfaction is directly and significantly related
to a partyrsquos relationship commitment whereas
Morgan and Hunt (199420) found that it did
not contribute significantly to a partyrsquos
commitment in comparison with structural ties
trust and share values Thus although
satisfaction is positively related to a partyrsquos
SURVIVING OR THRIVING AN EXPLORATORY STUDY INTO COMPETING FOR THE SOUTH AFRICAN
49
Copyright copy2014 by International Journal of Sales Retailing and Marketing Vol 3 No 1 2014
relationship committed its relative
contribution compared to the other
antecedents may be very small or insignificant
(Venetis amp Ghauri 20041577)
Venetis and Ghauri (20041577) contend that
only if the partner is considered trustworthy will
a party be willing to invest in and become
committed to the relationship thus trust is
needed for a relationship to develop Trust has
been defined as a consumerrsquos belief that another
party will perform actions that will lead to
positive outcomes for the firm as well as not
take unexpected actions that can lead to negative
outcomes (Anderson amp Narus 1990 cited by
Venetis amp Ghauri 2004) It reduces perceived
uncertainties and risk and is considered a key
variable for relationship success (Boersma
Buckley amp Ghauri 2003 1031 Morgan amp Hunt
199420 Kemp amp Ghauri 19986)
Retailers alas have limited direct control over
the relational bonds trust and satisfaction of
their customers However the retail mix
provides a set of tools which can be utilised
when developing a marketing strategy for
targeting customer commitment and loyalty
variables
Utilising the Retail Mix to influence Customer
Behaviour
The retail mix is used by retailers to ensure their
customersrsquo needs are met Elements in the
retail mix include merchandise assortments
location pricing customer service store design
and display and the communication mix of the
retailer (Levy amp Weitz 2011189) The dilemma
faced by marketers is to develop a retail mix
that creates customer satisfaction as well as
building customer commitment and loyalty
These aspects are explored below
Merchandise Assortments
Merchandise assortments are optimised by
retailers to ensure that the stock on shelf
matches customer demand Customers should
therefore have an adequate selection of
merchandise to choose from thereby
facilitating the ability to select the merchandise
which bests suits their needs and provides them
with satisfaction (Curhan 1972406)
Private label brands also known as store
brands are another variation of merchandise
assortment which retailers employ as an
instrument for generating store differentiation
store loyalty and store profitability (Corstjens amp
Lal 2000281 Mullick-Kanwar 2013Internet)
Private label brands typically have lower
variable costs and thus higher margins (Hoch amp
Banerjee 199357) Furthermore these brands
enable retailers to get better deals from
manufacturers in the form of lower wholesale
prices on national brands (Corstjens amp Lal 2000
281)
It is essential for retailers to supply high quality
merchandise and not just focus on offering
inexpensive low-quality products In other
words failing to provide the right combination
of high quality and low prices may result in a
merchandise assortment that is unsuccessful in
creating satisfaction amongst customers
(Stambaugh 199369)
CustomerService
Customer service with its final effect on
repurchasing by customers is considered one of
the most important constructs of the retail mix
(Caruana 2002811) Research points to the fact
that effective customer service satisfies
customers and in turn increases loyalty Lewis
and Booms (1983 cited by Caruana 2002) assert
that customer service is all about what
customers expect and the perceptions of how
these services are actually performed
Customer service tactics are highly effectively in
building commitment and loyalty It is widely
acknowledged that customers like to feel
appreciated The most effective channel at
achieving this in retail is by developing
favourable relationships between employees
and customers The first few words between
the employee and the customer set the tone for
the entire dialog and possibly even the entire
relationship Thus Gitomer (19988) asserts
that the single most important brick in the
SURVIVING OR THRIVING AN EXPLORATORY STUDY INTO COMPETING FOR THE SOUTH AFRICAN
50
Copyright copy2014 by International Journal of Sales Retailing and Marketing Vol 3 No 1 2014
foundation of customer service is ldquofriendlyrdquo A
friendly foundation is further complemented by
a positive attitude which represents the best
possibility of creating a positive customer
perception of the entire company Bad Service
experiences often drive a wedge between a
customer and a supplier (Duffy 2003480)
Retailers may provide unusually high-quality
customer service to build and maintain the
commitment and loyalty of their best
customers (Levy and Weitz 2011190) Heskett
Jones Loveman Sasser amp Schlesinger
(1994164) suggest that customer service will
lead to increases in firm profitability and market
value through the service-profit chain This
model proposes that customer service creates
positive consumer cognitions and behaviours
such as satisfaction and loyalty that create
financial benefits for the firm (Wiles 200719)
Customer service by providing additional value
for customers leads to increased customer
satisfaction (Anderson and Mittal 2000107)
Satisfaction in turn leads to increased
retention (Bolton 199845 Thomas 2001262
Zeithaml 200067) and to increased acquisition
through word-of-mouth recommendations
(Cronin and Taylor 199255) Retailer customer
service has been found to increase customer
satisfaction thus leading to increased
repurchase intentions willingness to
recommend and share-of-wallet (Beatty
Mayer Coleman Reynolds amp Lee 1996223
Dabholkar Thorpe and Rentz 19963 Reynolds
and Beatty 199911 Sirdeshmukh Singh and
Sabol 200215)
Improved customer service is a direct result of
well-organized employee training (Gallo
2012Internet) Cram (19949) argues that
employee training firstly requires the right staff
since without potential no amount of
dedicated training and development can
succeed Setting clear operational controls for
employees and communicating them effectively
is the basis for their understanding of the
organisationrsquos objectives This provides a sense
of direction in which any employee should
move in serving customers and solving their
problems Training can involve the usage of the
products sold or the best retailing techniques to
employ (Cram 19948) Training has its own
intrinsic merits in the way it can boost
operational efficiency and competence Part of
training is to refresh and update staff in order
to keep them informed of new initiatives and
changes The interaction between the customer
and the positive and enthusiastic employee can
provide an instantaneous positive impression
(Cram 19949) Store Location
Retail location is often considered to be the
most important element of the retail mix due to
the time and expense that is needed to find the
right location (Dufton Bailey amp Hopkins
2001Internet) The store choice decision can be
conceptualised as a problem of deciding where
and when to shop for the consumer (Popkowski
Leszczyc Sinha amp Timmerman 2000323) Store
choice and location are thus interrelated and
play a pivotal role in the decision making
process when deciding which store to attend
Store choice is dependent on the timing of
shopping trips as consumers may go to a
smaller convenient retail stores for short fill-in
trips and go to a larger store for regular
shopping trips (Kahn and Schmittlein 198955)
Store location thus has an impact on
convenience to customers as well as the type
of merchandise offered
Pricing
The price in a transaction is the balance point
between the interests of two parties In its
simplest terms it may represent the lowest
figure the supplier is prepared to accept for
parting with the product and the highest
amount the customer is prepared to pay The
essence of relationship marketing is that prices
should be driven by understanding the
customer Cram (199410) suggests that greater
value tends to be appreciated and builds
loyalty Further to this price should never be
used as a promotional weapon Price
promotions can result in unfavourable
outcomes They can start price wars teach
customers to await the next offer create
SURVIVING OR THRIVING AN EXPLORATORY STUDY INTO COMPETING FOR THE SOUTH AFRICAN
51
Copyright copy2014 by International Journal of Sales Retailing and Marketing Vol 3 No 1 2014
expensive demand surges and lead to
subsequent demand collapses
As the cost of advertising has dramatically
increased in recent years marketers are
increasingly turning to pricing and price related
promotions as a means of influencing
purchasing decisions by consumers
(Krishnamurthi amp Raj 1991172) Retailers have
realised the importance of pricing mechanisms
within marketing strategy and the role price
plays with regards to store loyalty and
commitment Customers who are committed to
specific brands will be less-sensitive to brand
price and thus not be concerned with the prices
of substitutes These consumers are more
inclined towards supermarkets which provide
them with a large assortment of merchandise
together with occasional discounted prices
Pricing is thus a pivotal component of the retail
mix and should be carefully managed to
consider all income groups and especially the
target market to attract customers and build
rapid short-term commitment
Communication Mix
A relationship begins with a conversation and
continuing communication maintains and
sustains it (Risdall 2013Internet) The most
important part of the communication strategy
is to ensure that communication is sufficiently
frequent More customers are lost through lack
of follow up and what appears to the
customers to be indifference than any other
cause of lost sales A study of competitor
communications may indicate real
opportunities to get closer to customers (Cram
19947)
A sales promotion is the offer of an incentive to
induce a desired sales result (Gilbert 1999 4) It
is a fundamental component of the
communication mix however researchers have
concluded that sales promotions can only lead
to a short-term increase in sales (Banks amp
Moorthy 1999371 Bawa amp Shoemaker
1987370 Diamond 1992254 Gupta amp Cooper
1992401 Kopalle amp Mela 1999317 Smith amp
Sinha 200083)
Store layout and design
Design management covers the store
environment packaging literature and
corporate identity It was discovered that
British consumers expect packaging to be of a
superior standard and thus are only attracted to
innovative packaging within stores (Vazquez
and Bruce 2002202) Design is thus a tool
which retailers employ in their marketing
strategy to differentiate their merchandise and
in the process strengthen their marketing
position Furthermore design can further be
broken down into pack store and corporate
design These three factors are essential for
effective store design and play an imperative
role with regards to consumersrsquo psychological
defences and entice them in becoming more
involved as well as interested in the retailerrsquos
merchandise
Store design goes beyond just the word
ldquodesignrdquo It involves atmospherics and adding
an ambience to attract customers thereby
creating a pleasurable buying experience
(Vazquez amp Bruce 2002202) It entails
developing certain areas and creating strategies
which will enhance customer commitment in
the process It was revealed that a strong brand
image influences buyer behaviour and purchase
decisions in a positive manner (Porter amp
Claycomb 1997373) A strong identity is thus
necessary in supermarket retailing and must be
managed with utmost care to create a cohesive
and persuasive shopping experience (Fitch
199158)
The importance of store design has undertaken a
new meaning within the retail industry in
underpinning supermarket positioning Viewing
areas special displays aisle widths and
customer traffic flows all influence the
customerrsquos impression of the store and as a
result determine levels of spending within the
store (Doyle amp Broadbridge 199972) This
requires ongoing management and can have a
SURVIVING OR THRIVING AN EXPLORATORY STUDY INTO COMPETING FOR THE SOUTH AFRICAN
52
Copyright copy2014 by International Journal of Sales Retailing and Marketing Vol 3 No 1 2014
significant impact on the perceived image of the
store (Newman amp Cullen 2001449)
METHODOLOGY
General Approach
In order to obtain a comprehensive view of the
elements of supermarket retailing strategy in
South Africa as well as attain an in depth
understanding of customer commitment
experience interviews were conducted
Valuable insight was provided from both an
academic and a commercial perspective
Experience interviews were conducted with
Alice Louw (Global amp Key Accounts Manager at
TNS Customer Equity) Suzanne Ackerman-
Berman (Director in Chairmanrsquos Executive
Committee at Pick n Pay) and Leon Erens
(Woolworths Constantia Store Manager)
Following the completion of the qualitative
research phase outlined above empirical data
needed to be collected in order to quantify the
analysis of customer commitment in relation to
supermarket retailing strategy Descriptive
research was conducted by constructing a self-
administered questionnaire which was
successfully completed by 304 respondents
from the general public Selecting which people
to survey was based on non-probability
sampling Quota sampling was also used to
ensure a fair representation of mainstream
supermarket customers in South Africa based
on data from Statistics South Africa and the All
Media amp Product Survey Although the sample
achieved is not necessarily reflective of the
South African population at large it is
reasonably in keeping with the profile of
mainstream supermarket shoppers in the
country
Overview of the Demographic Profile of the
Sample
The largest percentage of respondents was
Black (39 percent) followed by White (30
percent) and then Coloured (23 percent) while
the Indian and Asian population groups were
less significant (6 percent and 1 percent
respectively) The sample was split fairly evenly
between male and female respondents
However as special effort was made to
interview female respondents owing to them
generally being the primary household
shoppers there is a slight bias toward females
(58 percent) relative to males (42 percent) The
largest proportion of respondents was between
ages 18 and 25 (45 percent) followed by the 26
to 35 group (26 percent) and then the 36 to 45
group (14 percent) while ages 46 and above
were less significant (15 percent collectively)
The sample is thus to some extent biased
toward the younger demographic The sample
provided a fair representation of all the income
groups ndash higher income groups (ie earning R
15 000 per month and above) only represented
28 percent of respondents
Although slight biases were observed (eg the
sample skewed towards young to middle aged
Black lower-medium income group
respondents) this was deemed to be reasonable
as these nuances reflected the demographic of
the urban supermarket in South Africa
EMPIRICAL FINDINGS AND DISCUSSION
The relationship between customer loyalty and
the underlying antecedents (namely
satisfaction involvement an emotional
connection trust and structural relational
bonds) were comprehensively discussed in the
literature review Through utilising a basic
descriptive analysis the characteristics of the
average respondent with respect to these
antecedents and their loyalty were uncovered
These are detailed in table 2 Five point
semantic differential scales were used for all
except the last two scales listed in the table
SURVIVING OR THRIVING AN EXPLORATORY STUDY INTO COMPETING FOR THE SOUTH AFRICAN
53
Copyright copy2014 by International Journal of Sales Retailing and Marketing Vol 3 No 1 2014
TABLE 2 DESCRIPTIVE STATISTICS OF ATTITUDINAL AND BEHAVIOURAL CHARACTERISTICS
Characteristic Overall Response Mean Std Dev
Importance of store choice decision Important 138 049
Degree of loyalty Loyal 194 046
Loyal to the store because Satisfied with the offering 123 044
Satisfaction with the store offering Satisfied 416 067
Importance of an emotional connection Neutral 304 104
Importance of trust Important 391 081
Behavioural loyalty score Moderate ndash 15 out of 30 1507 366
Commitment score Moderate ndash 16 out of 30 1633 418
Source Authorrsquos own compilation
The average respondent considered which
supermarket store heshe shopped at to be an
important decision considered himherself
loyal to one specific supermarket store but
nonetheless shopped at other supermarkets
frequently and was generally satisfied with this
specific supermarketrsquos offering (S)he
considered the trustworthiness of this specific
store to be important but was indifferent over
whether (s)he had an emotional connection
with this specific store Lastly the average
respondent indicated both a commitment and
behavioural loyalty score in the moderate
range
The importance of trust was reiterated by Leon
Erens who asserts that customers desire value
for their money and trust gives them an
assurance of the value they will be receiving
Not only is it essential for the merchandise to
always be of the expected quality and
functionality but also that if it isnrsquot as the
customer expected the customer should be
able to trust that the store will reimburse them
or offer a substitute Erens further expressed
that trust is an element that is passed down to
generations and thus younger customers will
generally initially trust those retailers
introduced to them by family members
Alice Louw asserts that if customers care about
which supermarket store they shop at they are
considered to have a stronger involvement and
willingness to tolerate dissatisfaction before
switching stores This involvement dimension
can also be viewed as a measurement of
potential for
commitment As a measure of involvement
respondents were asked to determine whether
they considered which supermarket they
shopped at to be an important decision The
majority of respondents (62 percent indicated
that they considered this to be an important
decision This implies that these customers are
viewed as being ldquoinvolvedrdquo in their purchasing
decision
Respondents rated their level of satisfaction
with regards to the specific supermarket store
at which they shop of which 88 percent were
satisfied with the offering of the specific
supermarket store they shopped at However
Louw warns that without the presence of
involvement high satisfaction still produces
passive users with low repurchase rates in many
cases commitment requires both involvement
and satisfaction Two thirds (66 percent) of
respondents are both involved and satisfied
with their chosen store and thus have high
potential for commitment It is thus concluded
that the majority of South African customers
are satisfied and involved with the specific
supermarket store at which they shop and
consequently have high potential for
commitment
Furthermore Louw maintains that a
measurement of a customerrsquos emotional
connection to a supermarket is also an accurate
measurement of their commitment to that
SURVIVING OR THRIVING AN EXPLORATORY STUDY INTO COMPETING FOR THE SOUTH AFRICAN
54
Copyright copy2014 by International Journal of Sales Retailing and Marketing Vol 3 No 1 2014
supermarket In the survey respondents were
asked to rate the importance of an emotional
connection in their decision of where to shop
Despite the majority of respondents finding the
decision of which supermarket store they shop
at to be important the mean response for the
importance of an emotional connection was
only 304 interpreted as neutral This implies
that the degree of involvement is fairly low
Hence Louw describes these customers as
passive users who would be classified as
committed albeit on the shallow end of
commitment She notes that this specifically in
fast moving consumer goods retailing is fairly
common
The importance of structural bonds also needs
to be considered so that behavioural loyalty
isnrsquot interpreted as being a pure degree of
loyalty In this respect respondents were asked
whether they shopped at their specific
supermarket store because they were satisfied
with the storersquos offering or because they were
constrained to do so The vast majority of
respondents shopped at their specific
supermarket store because they were satisfied
with the store offering (77 percent)
Nevertheless a significant portion of the
respondents shopped at their specific
supermarket store because they were
constrained to do so (22 percent)
In order to determine the rationale for
customers to be constrained to a specific
supermarket store these constrained
respondents were asked why they were
constrained to shop there The most common
reason (52 percent) for respondents to be
constrained to their specific supermarket store
was due to travelling issues (eg they do not
own a motor vehicle or the other stores are too
far away) followed by convenience (25
percent) These findings emphasise the
importance of store location and accessibility
for retailers because situating a store in a
popular location which is considered
convenient by customers relative to other
supermarket stores attracts customers even if
their attitude towards the store is not
particularly positive
Of the respondents who were dissatisfied with
their specific supermarket storersquos offering 80
percent remained behaviourally loyal to a
specific store as a result of structural relational
bonds Louw concurs that often dissatisfied
customers stay with a brand (ie remain loyal)
due to physical barriers such as location or cost
or psychological barriers such as lsquothey care so
they stay with the brand and try to fix the
problemrsquo Suzanne Ackerman-Berman notes
that specifically in South Africa with many
people still living in poverty aspects of the
retail mix such as price and store location (due
to a cost being involved in transport) play a
pivotal role in determining which store these
customers frequent
The travelling constraint was further
emphasised when respondents were asked to
determine the distance they travelled to their
specific supermarket store The majority of
respondents (61 percent travelled less than 15
minutes to their specific supermarket store and
overall 87 percent travelled 30 minutes or less
to their specific store thus supporting the
pivotal role store location plays in attracting
customers Only 13 percent of respondents
travelled for more than 30 minutes clearly
illustrating that customers generally decide on a
store that is less than 30 minutes away and thus
it is concluded that lsquorequired travelling
distancersquo is a significant structural relational
bond
The six elements of the retail mix (namely price
merchandise assortment customer service
store design and layout communications mix
and location) were analysed by asking
respondents to rate the importance of each of
these elements when deciding which specific
supermarket store they shop at on a scale of 1-
5 The six elements were divided into thirteen
retail mix variables each of which is attributed
to one of the elements of the retail mix This is
reflected in table 3 The aggregated importance
scores are reflected in table 4 thereafter
SURVIVING OR THRIVING AN EXPLORATORY STUDY INTO COMPETING FOR THE SOUTH AFRICAN
55
Copyright copy2014 by International Journal of Sales Retailing and Marketing Vol 3 No 1 2014
TABLE 3 BREAKDOWN OF RETAIL MIX ELEMENTS INTO CLUSTERED VARIABLES
Retail Mix Element Inclusive Variables
Price Prices
Merchandise assortment Variety of merchandise quality of merchandise quality of fresh food
availability of private-label merchandise
Customer service Friendly service well-trained floor staff high quality customer service
Store design and layout Attractiveness of the store facilities available
Communications mix Brand of the Supermarket sales promotions
Location Convenient location
Source Authorrsquos own compilation
TABLE 4 DESCRIPTIVE STATISTICS OF THE RETAIL MIX ELEMENTS
Retail Mix Variable Overall Response Mean Std Dev Rank
Price Important 400 103 7
Variety of merchandise Important 423 083 4
Quality of merchandise Important 447 072 2
Quality of fresh food Very Important 470 058 1
Availability of private-label merchandise Neutral 311 106 13
Friendly service Important 408 091 5
Well-trained floor staff Important 383 010 9
High quality customer service Important 402 088 6
Attractiveness of the store Important 391 082 8
Facilities available Neutral 339 115 11
Brand of the supermarket Neutral 333 104 12
Sales promotions Neutral ndash Important 350 110 10
Convenient location Important 433 079 3
Source Authorrsquos own compilation
As indicated in the table above the quality of
fresh groceries was rated the most important
aspect whereas the availability of private-label
merchandise was considered the least
important
Ackerman-Berman reiterated that friendly
service and high-quality service are important
variables of the retail mix an area where Pick n
Pay have always placed emphasis Furthermore
she stressed the fact that these variables played
a fundamental role in providing consumers with
the lsquooverall shopping experiencersquo In an
environment where parity (or perceived parity)
across product range existed these variables
could well make the difference Erens too
expressed that high-quality customer service is
essential as it makes the customer feel valued
Nonetheless retailers should never lose sight of
the fact that their core offering (the
merchandise) needs to be impressive
CONCLUSIONS
In lieu of the findings of this research the
following conclusions are drawn
South African supermarket customers have
shallow commitment to the store
at which they shop
Whilst South African supermarket shoppers are
satisfied with their storesrsquo offering their
involvement is deemed to be moderate
Furthermore their emotional connection to the
store appears neutral Supermarket chains
therefore need to pay attention to exceeding
the customerrsquos expectations as
SURVIVING OR THRIVING AN EXPLORATORY STUDY INTO COMPETING FOR THE SOUTH AFRICAN
56
Copyright copy2014 by International Journal of Sales Retailing and Marketing Vol 3 No 1 2014
Low prices are not a sure guarantee that the
customer will stay Instead
merchandise and convenience of location
reign supreme
Somewhat interestingly customer service and
the in-store environment were not deemed of
the utmost importance The top tier of priorities
for supermarkets appear to be merchandise
and location Thereafter service delivery
becomes importance and may thus be
classified as the second tier of priorities The
third tier of priorities includes such aspects as
facilities available and sales promotions
Behaviourally loyal patronage to supermarkets
does not imply customer satisfaction with
supermarkets
Behavioural loyalty is a behavioural measure
while satisfaction and commitment are
attitudinal measures Frequent patronage to a
store may often be due to the structural
relational bond of travelling constraints and
not a result of customer satisfaction Findings
suggest that a significant relationship exists
between the travelling constraint and
behavioural loyalty thus stores which are in
close proximity to customersrsquo homes may
receive high patronage but not necessarily
customersrsquo commitment Competition
established in the vicinity may therefore have a
devastating effect on store patronage down the
line
REFERENCES
ANDERSON E amp MITTAL V 2000
STRENGTHENING THE SATISFACTION-PROFIT
CHAIN JOURNAL OF SERVICE RESEARCH 3(2)
107-120
ANDERSON E FORNELL C amp LEHMANN D 1994
CUSTOMER SATISFACTION MARKET SHARE
AND PROFITABILITY FINDINGS FROM SWEDEN
JOURNAL OF MARKETING 58(3) 53-66
AUBERT-GAMET V 1997 TWISTING
SERVICESCAPES DIVERSION OF THE PHYSICAL
ENVIRONMENT IN A RE-APPROPRIATION
PROCESS INTERNATIONAL JOURNAL OF
SERVICE INDUSTRY MANAGEMENT 8(1) 26-41
BAKER S amp BASS M 2003 NEW CONSUMER
MARKETING MANAGING A LIVING DEMAND
SYSTEM WEST SUSSEX WILEY
BANDYOPADHYAY S amp MARTELL M 2007 DOES
ATTITUDINAL LOYALTY INFLUENCE
BEHAVIOURAL LOYALTY JOURNAL OF
RETAILING AND CONSUMER SERVICES 14 35-
44
BANKS J amp MOORTHY S 1999 A MODEL OF
PRICE PROMOTIONS INTERNATIONAL JOURNAL
OF INDUSTRIAL ORGANIZATION 17371-398
BAWA K amp SHOEMAKER RW 1987 THE EFFECTS
OF DIRECT MAIL COUPON ON BRAND CHOICE
BEHAVIOUR JOURNAL OF MARKETING
RESEARCH 24(4) 370-376
BEATTY SE MAYER M COLEMAN JE REYNOLDS
KE amp LEE J 1996 CUSTOMER-SALES ASSOCIATE
RETAIL RELATIONSHIPS JOURNAL OF
RETAILING 72(3) 223-247
BENEKE J 2010 ldquoCONSUMER PERCEPTIONS OF
PRIVATE LABEL BRANDS WITHIN THE RETAIL
GROCERY SECTOR OF SOUTH AFRICA AFRICAN
JOURNAL OF BUSINESS MANAGEMENT 4(2)
203-220
BOERSMA M BUCKLEY P amp GHAURI P 2003
TRUST IN INTERNATIONAL JOINT VENTURE
RELATIONSHIPS JOURNAL OF BUSINESS
RESEARCH 56 (MARCH) 1031-1042
BOLTON RN 1998 A DYNAMIC MODEL OF THE
DURATION OF THE CUSTOMERrsquoS RELATIONSHIP
WITH A CONTINUOUS SERVICE PROVIDER THE
ROLE OF SATISFACTION MARKETING SCIENCE
17(1) 45-65
BOWEN JT amp CHEN SL 2001 THE RELATIONSHIP
BETWEEN CUSTOMER LOYALTY AND
CUSTOMER SATISFACTION INTERNATIONAL
JOURNAL OF CONTEMPORARY HOSPITALITY
MANAGEMENT 13(5) 213-217
SURVIVING OR THRIVING AN EXPLORATORY STUDY INTO COMPETING FOR THE SOUTH AFRICAN
57
Copyright copy2014 by International Journal of Sales Retailing and Marketing Vol 3 No 1 2014
BRINK A amp BERNDT B 2004 CUSTOMER
RELATIONSHIP MANAGEMENT AND CUSTOMER
SERVICE LANSDOWNE JUTA
CANT M amp MACHADO R (EDS) 2009
MARKETING SUCCESS STORIES 6TH ED CAPE
TOWN OXFORD UNIVERSITY PRESS
CALLOWAY J 2005 INDISPENSABLE HOW TO
BECOME THE COMPANY THAT YOUR
CUSTOMERS CANrsquoT LIVE WITHOUT NEW
JERSEY WILEY
CARUANA A 2002 SERVICE LOYALTY THE
EFFECTS OF SERVICE QUALITY AND THE
MEDIATING ROLE OF CUSTOMER
SATISFACTION EUROPEAN JOURNAL OF
MARKETING 36 (78) 811-828
CORSTJIENS M amp LAL R 2000 BUILDING STORE
LOYALTY THOUGH STORE BRANDS JOURNAL OF
MARKETING RESEARCH 37(3) 281-291
CRAM T 1994 THE POWER OF RELATIONSHIP
MARKETING LONDON PITMAN PUBLISHING
CRONIN JJ amp TAYLOR SA 1992 MEASURING
SERVICE QUALITY A RE-EXAMINATION AND
EXTENSION JOURNAL OF MARKETING 56 55-
68
CURHAN RC 1972 THE RELATIONSHIP
BETWEEN SHELF SPACE AND UNIT SALES IN
SUPERMARKETS JOURNAL OF MARKETING
RESEARCH 9(4) 406-412
DABHOLKAR PA THORPE DI amp RENTZ JO 1996
A MEASURE OF SERVICE QUALITY FOR RETAIL
STORES SCALE DEVELOPMENT AND
VALIDATION JOURNAL OF THE ACADEMY OF
MARKETING SCIENCE 24(1) 3-16
DE WULF K ODEKERKEN-SCHROumlDER G amp
IACOBUCCI D 2001 INVESTMENTS IN
CONSUMER RELATIONSHIPS A CROSS-
COUNTRY AND CROSS-INDUSTRY
EXPLORATION JOURNAL OF MARKETING 65(4)
33-50
DIAMOND WD 1992 JUST WHAT IS A DOLLAR
WORTH CONSUMER REACTIONS TO PRICE
DISCOUNTS VS EXTRA PRODUCT PROMOTIONS
JOURNAL OF RETAILING 68(3) 254-270
DICK A amp BASU K 1994 CUSTOMER LOYALTY
TOWARDS AN INTEGRATED FRAMEWORK
JOURNAL OF THE ACADEMY OF MARKETING
SCIENCE 22(2) 99-113
DOYLE SA amp BROADBRIDGE A 1999
DIFFERENTIATION BY DESIGN THE
IMPORTANCE OF DESIGN IN RETAILER
REPOSITIONING AND DIFFERENTIATION
INTERNATIONAL JOURNAL OF RETAIL AND
DISTRIBUTION MANAGEMENT 27(2) 72-83
DUFFY DL 2005 THE EVOLUTION OF
CUSTOMER LOYALTY STRATEGY JOURNAL OF
CONSUMER MARKETING 22(5) 284-286
DUFFY DL 2003 INTERNAL AND EXTERNAL
FACTORS WHICH AFFECT CUSTOMER LOYALTY
JOURNAL OF CONSUMER MARKETING 20(5)
480-485
DUFTON H BAILEY JM amp HOPKINS T 2001 THE
RETAIL STORE DESIGN FOR PROFITABILITY
[INTERNET
HTTPWWWTEXTILESUMISTACUKRESEARC
HTEXONLINEMAN99DUFTONHTM
DOWNLOADED 16 MAY 2011]
DUVEEN-APOSTOLOU S 2006 INTRODUCTION
TO CONVERSION MODEL PRESENTATION AT
UNIVERSITY OF CAPE TOWN ON 18 SEPTEMBER
2006
FASTMOVING 2013 GENERAL SUPERMARKET
RETAIL STORES IN SOUTH AFRICA [INTERNET
HTTPWWWFASTMOVINGCOZARETAILERS
CATEGORYGENERAL-SUPERMARKETS-196
DOWNLOADED 25 JANUARY 2013]
FITCH R 1991 SUCCESS IN RETAILING
IDENTITIES DESIGN MANAGEMENT JOURNAL
14(2) 58-61
GENESAN S 1994 DETERMINANTS OF LONG-
TERM ORIENTATION IN BUYER-SELLER
RELATIONSHIPS JOURNAL OF MARKETING
58(2) 1-19
GALLO C 2012 APPLErsquoS SECRET EMPLOYEE
TRAINING MANUAL REINVENTS CUSTOMER
SERVICE IN SEVEN WAYS [INTERNET
HTTPWWWFORBESCOMSITESCARMINEGA
LLO20120830APPLES-SECRET-EMPLOYEE-
TRAINING-MANUAL-REINVENTS-CUSTOMER-
SERVICE-IN-SEVEN-WAYS DATED 30 AUGUST
2012]
SURVIVING OR THRIVING AN EXPLORATORY STUDY INTO COMPETING FOR THE SOUTH AFRICAN
58
Copyright copy2014 by International Journal of Sales Retailing and Marketing Vol 3 No 1 2014
GARLAND R amp GENDALL P 2004 TESTING DICK
AND BASUrsquoS CUSTOMER LOYALTY MODEL
AUSTRALIAN MARKETING JOURNAL 12(3) 81-
87
GEYSKENS I STEENKAMP J SCHEER LK amp
KUMAR N 1996 THE EFFECTS OF TRUST AND
INTERDEPENDENCY ON RELATIONSHIP
COMMITMENT INTERNATIONAL JOURNAL OF
RESEARCH IN MARKETING 13 (OCTOBER) 303-
317
GILBERT DC amp JACKARIA N 2002 THE EFFICACY
OF SALES PROMOTIONS IN UK SUPERMARKETS
A CONSUMER VIEW INTERNATIONAL JOURNAL
OF RETAIL amp DISTRIBUTION MANAGEMENT
30(6) 315-322
GITOMER J 1998 CUSTOMER SATISFACTION IS
WORTHLESS CUSTOMER LOYALTY IS PRICELESS
AUSTIN BARD PRESS
GUPTA S amp COOPER L 1992 THE DISCOUNTING
OF DISCOUNTS AND PROMOTION THRESHOLDS
JOURNAL OF CONSUMER RESEARCH 19(3)
401-411
GUNDLACH G ACHROL R amp MENTZER J 1995
THE STRUCTURE OF COMMITMENT IN
EXCHANGE JOURNAL OF MARKETING
59 (1) 78-92
HOCH S amp BANERJI S 1993 WHEN DO PRIVATE
LABELS SUCCEED SLOAN MANAGEMENT
REVIEW 34(4) 57-78
HUNTER VL 1998 MEASURE CUSTOMER
LOYALTY FOR COMPLETE PICTURE OF ROI
BUSINESS MARKETING 83(3) 18-30
HESKETT JL 2002 GURUrsquoS VIEW BEYOND
CUSTOMER LOYALTY MANAGING SERVICE
QUALITY 12(6) 355-357
HESKETT JL JONES TO LOVEMAN GW SASSER
WE amp SCHLESINGER LA 1994 PUTTING THE
SERVICE-PROFIT CHAIN TO WORK HARVARD
BUSINESS REVIEW 72 164-174
HOFMEYR J amp RICE B 2003 COMMITMENT-LED
MARKETING WEST SUSSEX WILEY
JACOBY J amp KYNER DB 1973 BRAND LOYALTY
VS REPEAT PURCHASING BEHAVIOUR
JOURNAL OF MARKETING RESEARCH
10 (1) 1-9
KAHN BE amp SCHMITTLEIN DC 1989 SHOPPING
TRIP BEHAVIOR AN EMPIRICAL INVESTIGATION
MARKETING LETTERS 1(1)
55-69
KESSIM N amp ABDULLA A 2006 THE INFLUENCE
OF ATTRACTION ON INTERNET BANKING AN
EXTENSION TO THE TRUST-RELATIONSHIP
COMMITMENT MODEL INTERNATIONAL
JOURNAL OF BANK MARKETING 24(6) 424-442
KNOX S 1998 LOYALTY BASED SEGMENTATION
AND THE CUSTOMER DEVELOPMENT PROCESS
EUROPEAN MANAGEMENT JOURNAL 16(6)
729-737
KOPALLE PK amp MELA CF 1999 THE DYNAMIC
EFFECT OF DISCOUNTING OF SALES EMPIRICAL
ANALYSIS AND NORMATIVE PRICING
IMPLICATIONS MARKETING SCIENCE 18(3)
317-322
KOTLER P amp ARMSTRONG G 2010 PRINCIPLES
OF MARKETING 13TH ED NEW JERSEY
PEARSON EDUCATION
KOTLER P 2003 MARKETING MANAGEMENT
11TH ED NEW JERSEY PEARSON EDUCATION
KRISHNAMURTHI L amp RAJ SP 1991 AN
EMPIRICAL ANALYSIS OF THE RELATIONSHIP
BETWEEN BRAND LOYALTY AND CONSUMER
PRICE ELASTICITY MARKETING SCIENCE 10(2)
172-183
LEVY M amp WEITZ B 2011 RETAIL
MANAGEMENT 8TH ED NEW YORK MCGRAW-
HILLIRWIN
LILJANDER V amp LEVERIN A 2006 DOES
RELATIONSHIP MARKETING IMPROVE
CUSTOMER RELATIONSHIP SATISFACTION AND
LOYALTY INTERNATIONAL JOURNAL OF BANK
MARKETING 24(4) 232-251
LILJANDER V amp ROOS I 2002 CUSTOMER-
RELATIONSHIP LEVELS ndash FROM SPURIOUS TO
TRUE RELATIONSHIPS JOURNAL OF SERVICES
MARKETING 16(7) 593-614
MORGAN R amp HUNT S 1994 THE
COMMITMENT-TRUST THEORY OF
RELATIONSHIP MARKETING JOURNAL OF
MARKETING 58(3) 20-38
MULLICK-KANWAR M 2013 THE EVOLUTION
OF PRIVATE LABEL BRANDING [INTERNET
SURVIVING OR THRIVING AN EXPLORATORY STUDY INTO COMPETING FOR THE SOUTH AFRICAN
59
Copyright copy2014 by International Journal of Sales Retailing and Marketing Vol 3 No 1 2014
HTTPWWWBRANDCHANNELCOMPAPERS_
REVIEWASPSP_ID=360 DOWNLOADED 25
JANUARY 2013]
NEWMAN AJ amp CULLEN P 2001 FROM RETAIL
THEATRE TO RETAIL FOOD SHOW THE
SHRINKING FACE OF GROCERY BRITISH FOOD
JOURNAL 103(7) 443-452
NICOLSON J KEMP J amp LINNELL P 1996 DOES
THE RHETORIC OF CUSTOMER SERVICE MATCH
THE REALITY MANAGING SERVICE QUALITY
6(3) 6-9
OLIVER RL 1999 WHENCE CUSTOMER
LOYALTY JOURNAL OF MARKETING 63 33-44
PASSIKOFF R 2006 PREDICTING MARKET
SUCCESS NEW WAYS TO MEASURE CUSTOMER
LOYALTY AND ENGAGE CONSUMERS WITH
YOUR BRAND NEW JERSEY WILEY
POPKOWSKI LESZCZYC PTL SINHA A amp
TIMMERMAN HJP 2000 CONSUMER STORE
CHOICE DYNAMICS JOURNAL OF RETAILING
76(3) 323-345
PORTER S amp CLAYCOMB C 1997 THE
INFLUENCE OF BRAND RECOGNITION ON
RETAIL STORE IMAGE JOURNAL OF PRODUCT
AND BRAND MANAGEMENT 6(6) 373-387
PRITCHARD MP amp HOWARD DR 1997 THE
LOYAL TRAVELER EXAMINING A TYPOLOGY OF
SERVICE PATRONAGE JOURNAL OF TRAVELERS
RESEARCH 35(4) 2-10
REYNOLDS KE amp BEATTY SE 1999 CUSTOMER
BENEFITS AND COMPANY CONSEQUENCES OF
CUSTOMER-SALESPERSON RELATIONSHIPS IN
RETAILING JOURNAL OF RETAILING 75 11-32
RISDALL J 2013 FROM ADVERTISING TO
CONVERSATION MARKETING [INTERNET
HTTPMINNESOTABUSINESSCOMEXPERTS-
FORUMADVERTISING-CONVERSATION-
MARKETING DOWNLOADED 25 JANUARY 2013]
ROWLEY J 2005 THE FOUR CS OF CUSTOMER
LOYALTY MARKETING INTELLIGENCE AND
PLANNING 23(6) 574-581
SIRDESHMUKH D SINGH J amp SABOL B 2002
CONSUMER TRUST VALUE AND LOYALTY IN
RELATIONAL EXCHANGES JOURNAL OF
MARKETING 66 15-37
SMITH M amp SINHA I 2000 THE IMPACT OF
PRICE AND EXTRA PRODUCT PROMOTIONS ON
STORE PREFERENCE INTERNATIONAL JOURNAL
OF RETAIL amp DISTRIBUTION MANAGEMENT
28(23) 83-92
STAMBAUGH S 1993 TO STORE BRAND OR
NOT TO STORE AFTERMARKET BUSINESS
103(6) 69-78
STAUSS B CHOJNACKI K DECKER A amp
HOFFMANN F 2001 RETENTION EFFECTS OF A
CUSTOMER CLUB INTERNATIONAL JOURNAL OF
SERVICE INDUSTRY MANAGEMENT 12(1) 7-19
THOMAS J 2001 A METHODOLOGY FOR
LINKING CUSTOMER ACQUISITION TO
CUSTOMER RETENTION JOURNAL OF
MARKETING RESEARCH 38(2) 262-268
THROUGH THE LOOP CONSULTING LTD 2002
THE PARADOX OF LOYALTY [INTERNET
ltHTTPWWWTHROUGHTHELOOPCOMKNO
WLEDGEBRAND13HTML DOWNLOADED 17
MARCH 2011]
VAZQUEZ D amp BRUCE M 2002 DESIGN
MANAGEMENT THE UNEXPLORED RETAIL
MARKETING COMPETENCE JOURNAL OF RETAIL
AND DISTRIBUTION MANAGEMENT 30(4) 202-
210
VENETIS KA amp GHAURI PN 2004 SERVICE
QUALITY AND CUSTOMER RETENTION
BUILDING LONG-TERM RELATIONSHIPS
EUROPEAN JOURNAL OF MARKETING 38
(1112) 1577-1598
WILES MA 2007 THE EFFECT OF CUSTOMER
SERVICE ON RETAILERSrsquo SHAREHOLDER
WEALTH THE ROLE OF AVAILABILITY AND
REPUTATION CUES JOURNAL OF RETAILING
83(1) 19-31
WONG A DEAN A amp WHITE CJ 1999
CUSTOMER BEHAVIORAL INTENTIONS IN THE
HOSPITALITY INDUSTRY AUSTRALIAN JOURNAL
OF HOSPITALITY MANAGEMENT 6 53-63
YUDKIN M 1999 INGREDIENTS OF CUSTOMER
LOYALTY [INTERNET
HTTPWWWEPROMOSCOMEDUCATIONCEN
TER-LOYALITYJSP DOWNLOADED 17 MARCH
2011]
SURVIVING OR THRIVING AN EXPLORATORY STUDY INTO COMPETING FOR THE SOUTH AFRICAN
60
Copyright copy2014 by International Journal of Sales Retailing and Marketing Vol 3 No 1 2014
ZEITHAML VA 2000 Service Quality
Profitability and the Economic Worth of
Customers What We Know and What We Need
to Learn Journal of the Academy of Marketing
Science 28(1) 67-85
Copyright copy2014 by International Journal of Sales Retailing and Marketing Vol 3 No 1 2014
61 THE ICT EFFECTS AND THE SWITCHING COSTS IN THE RELATIONAL VARIABLES AN APPLICATION IN RETAIL
TRADE OF GREECE AND SPAIN
THE ICT EFFECTS AND THE SWITCHING COSTS IN THE
RELATIONAL VARIABLES AN APPLICATION IN RETAIL
TRADE OF GREECE AND SPAIN
Irene Gil-Saura Konstantinos-Faidon Sylvestros amp Beatriz Moliner Velazquez
Abstract
The perceived value has been converted to a fundamental construct in the retail context acting as
consequence and antecedent of key conduct variables The present study tries to analyze the
influence of information and communication technologies (ICT) and that of switching costs on a
group of relationship variables We aim to analyze the causal relations and their effects in the textile
sector of the Greek and Spanish market The results show the existing relations of perceived value
with the antecedents and consequences proposed in the model except the ICT
Key words ICT perceived value switching costs commitment
INTRODUCTION
Various essays recognize that the complexity
that changes cause to the market like the
intense competition and the technological
development creates difficulties to
management especially in fast changing
markets (Ferreiros 2012) From this
perspective a firm strategy that becomes
increasingly important is customer retention In
this direction academic research on retailing
seems that focuses on concepts like supplier
dependence (Andaleeb 1995) value (Anderson
and Narus 1990) commitment (Morgan and
Hunt 1994) or loyalty (Reynolds and Beaty
1999) In this sense perceived value is being
perceived as a clientacutes total evaluation about
the relational exchange with retailer (Saacutenchez
et al 2010)
Moreover concerning the distribution
channels a tendency towards globalization can
be observed which summons the research
question if relational variables have stable
perceptions from an international perspective
In this framework the present study tries to
analyze the effects of the changes of dynamic
variables like the ICT in the point of sales on
perceived value commitment and loyalty The
starting point of this study is the evidence of
previous studies about the significance of the
factors that influence this process Additionally
we intend to detect the possible differences
between the generated perceptions of these
variables in two geographical fields Spain and
Greece In summary this study attempts to
contribute through its results and its
conclusions to the supplier efforts in order to
provide sustainable competitive advantages
through the development of management
systems and business differentiation based on
Dr Irene Gil-Saura PhD professor at Department of Market Commercialization and Research University of Valencia Spain (email irenegilluves) Konstantinos - Faidon Sylvestros professor at Department of Market Commercialization and Research University of Valencia Spain (e-mail konsylalumniuves) Beatriz Moliner Velasquez professor at Department of Market Commercialization and Research University of Valencia Spain (email beatrizmolineruves)
Copyright copy2014 by International Journal of Sales Retailing and Marketing Vol 3 No 1 2014
62 THE ICT EFFECTS AND THE SWITCHING COSTS IN THE RELATIONAL VARIABLES AN APPLICATION IN RETAIL
TRADE OF GREECE AND SPAIN
client orientation and more specifically on the
delivery of value
RESEARCH THEORETICAL FRAMEWORK
LITERATURE REVIEW
The study of Value in marketing
In recent marketing investigation we can
observe an increasing interest in the study of
creation of value between the concerning parts
of the relationship (Groumlnroos 2000)
From the review concerning value it is
confirmed that the construct is complex and
multidimensional In respect of its conceptual
definition various authors widely accept the
proposal of Zeithaml (1988) (eg Caruana et al
2000) According to Zeithaml (198814)
perceived value can be seen like ldquothe
customerrsquos overall assessment of the utility of a
product based on perceptions of what is
received and what is givenrdquo In this way Oliver
(199945) adds that value is ldquoa positive function
of what is received and a negative function of
what is sacrificedrdquo however perceptions
exclusively positive or negative can also be
named value In more recent studies the
treatment of perceived value as a
multidimensional construct has gained ground
(Sweeney and Soutar 2001) This evolution has
benefited research in this field as it has
permitted the evaluation of the experience
factor that consumers perceive in the store In
this direction the present study highlights the
contribution of Sweeney and Soutar (2001)
who based on the study of Sheth et al (1991)
they retain three dimensions in order to explain
the nature of perceived value In particular
they use the social value that expresses the
utility that derives from the supplierrsquos capacity
to increase the social self-concept the
emotional value that is associated with the
feelings or affective states generated by the
point of sales and the functional value that
contains two elements First itrsquos the utility
related to the price that derives from the cost
reduction applied by the supplier in short or
long term Second the functional value is
associated to the perceived quality and the
expected results form the supplier
Antecedents and consequences of value
As it is highlighted in the literature there exists
a number of variables that are antecedents of
perceived value and influence significantly the
construct Among these variables we stress the
important influence of ICT The significance of
the ICTsrsquo application in the firms and their
effects in terms of relationship benefits has
been confirmed during the last years (Ruiz et
al 2010a b) Ryssel et al (2004) point out that
ICT is a term that comprises every form of
technology in order to create capture
manipulate communicate exchange present
and use information in various forms (company
data voice conversations photos drawings
multimedia presentations and other forms
included that are not invented yet)
On the other hand the concept of ldquoswitching
costsrdquo appears in the literature since 90s within
the framework of the relationship evaluation
that maintains the company in contact with its
environment In the area of trade distribution
the switching costs are defined as the perceived
costs by the buyer to change his actual supplier
for a new one
These costs include the associated to the
change of spending time money and
psychological cost (Dick and Basu 1994)
In addition to the antecedents the variables
consequences of value have had a prominent
role with regard to the results of marketing
research
Various academic studies have pointed out
commitment as one of the main determinants
in the creation of long-term relationships
between supplier and customer (Ryssel et al
2004) According to Morgan and Hunt
(199423) ldquothe belief of an exchange partner
that the ongoing relationship with another is so
important as to warrant maximum efforts at
maintaining itrdquo Also relationship dependence
is a construct that emerges as relevant to
Copyright copy2014 by International Journal of Sales Retailing and Marketing Vol 3 No 1 2014
63 THE ICT EFFECTS AND THE SWITCHING COSTS IN THE RELATIONAL VARIABLES AN APPLICATION IN RETAIL
TRADE OF GREECE AND SPAIN
explain commitment Emerson (1962) as well
developed the dependence theory form an
interpersonal perspective According to this
theory dependence is perceived as a function
of two factors the value of the goal for the
individual and the existence of alternative ways
to achieve this goal Thus it is concluded that
the dependence of a person is directly related
to the benefits obtained form the resource and
inversely related to the alternative resources of
these benefits
Finally an important relational variable in terms
of its links with value and loyalty Loyalty has
been considered as a significant influence for
the retention of the client and for the repetitive
purchase (Griffin 1996) In this context Dick
and Basu (1994) have interpreted loyalty as the
combination of a positive attitude and purchase
repetition
Research hypotheses
As mentioned previously companies develop
their activities in a highly changing
environment where technological innovations
play a key role in the relationships with the
customer In this way we understand that ICT
exert a positive influence on relationship value
of the company with its suppliers and
customers (Mentzer and Williams 2001 Gil et
al 2008) This permits us to form the basis for
the first working hypotheses
H1a The retailerrsquos ICT intensity has a positive
influence on quality as part of the functional
value that is perceived by the customer
H1b The retailerrsquos ICT intensity has a positive
influence on price as part of the functional
value that is perceived by the customer
H1c The retailerrsquos ICT intensity has a positive
influence on the emotional value that is
perceived by the customer
H1d The retailerrsquos ICT intensity has a positive
influence on the social value that is perceived by
the customer
On the other hand switching costs refer to
benefit and loss costs (White and
Yanamandram 2007) These costs are related
to a customer evaluation about the positive and
negative aspects derived from his permanence
in the relationship with the current supplier
These benefits can be related to the product
and its quality its price and also they can
include social benefits as the relationship of
trust and friendship with the personnel of the
store This enables the creation of value in the
relationship with the retailer and that in turn
provokes entry barriers for the competition and
at the same time creates barriers for a possible
exit of the customer from this link through the
switching costs effect (Lovelock 1991) The
previous considerations permit us to propose
the following hypotheses
H2a The switching costs exert a positive effect
on quality as part of the functional value
perceived by the customer
H2b The switching costs exert a positive effect
on price as part of the functional value
perceived by the customer
H2c The switching costs exert a positive effect
on emotional value that is perceived by the
customer
H2d The switching costs exert a positive effect
on social value that is perceived by the customer
Moreover the conceptualization of value
proposed by Zeithaml (1988) underlines that
the components of quality and price have
relevant as well as different effects on
perceived value (Sweeney and Soutar 2001)
Thus that leads us to propose as working
hypotheses
H3a Quality has a positive influence on
perceived value
H3b Price has a positive influence on perceived
value
Sheth et al (1991) conclude that besides
functional value (quality and price) other
dimensions of value like the social and
emotional component result determinant as
well in customerrsquos choices Based on these
relations defined in the literature we conclude
that
H3c Emotional value has a positive impact on
perceived value
Copyright copy2014 by International Journal of Sales Retailing and Marketing Vol 3 No 1 2014
64
H3d Social value has a positive impact on
perceived value
Several studied have stressed the relationship
between perceived value and commitment
(Morgan and Hunt 1994 Sweeney and Soutar
2001)
In this regard Simpson et al (2001) reach the
conclusion that customerrsquos perceived value
about the company can positively influence on
commitment Therefore we propose that
H4 Perceived value positively influences on
customerrsquos commitment with the retailer
Likewise literature confirms the positive
relation between dependence and commitment
(Srinivasan 2008) Within this context the
existence of alternative retailers has been
considered a potential factor that contributes
to the creation of value (Sharland 1997) as it
enhances the market alternatives and for this
purpose can significantly affect customerrsquos
commitment (Fullerton 2005) That permits us
to formulate the following working hypothesis
H5 Customerrsquos dependence from the supplier
positively influences on commitment with that
supplier
On the other hand Evanschitzky et al (2006)
have highlighted that royalty derives from
commitment which in turn determines
development and maintenance of relationships
of value between buyer and seller (Morgan and
Hunt 1994) This assumption leads us to define
the last working hypothesis
H6 Customerrsquos commitment with the retailer
has a positive effect on customerrsquos loyalty
Figure 1 Proposal of the model
EMPIRICAL RESEARCH METHODOLOGY AND
EVALUATION OF RESULTS
Research approach and data collection
Taking in account the literature review and the
research objectives a questionnaire was
elaborated in order to collect information about
the final customer and his opinion regarding the
group of variables submitted to this research
model
These variables retained in the research were
estimated as following in Table 1
Switching
costs
H2b
ICT
intensity
Dependence
Perceived
value
H1a
H5
Commitment Loyalty H4 H6
Quality
Price
Emotional
value
Social
value
H1b
H1c
H1d
H2c
H2d
H2a
H3a
H3c
H3d
H3b
Copyright copy2014 by International Journal of Sales Retailing and Marketing Vol 3 No 1 2014
65
Table 1 Technical details of the research
GEOGRAPHICAL FIELD Athens Greece and Valencia Spain
UNIVERSE Individuals older than 18 years old
METHODOLOGY Personal interviews through structured questionnaire
SAMPLE SIZE 207 valid surveys
FIELDWORK DATE August 2012
SCALES (5 POINTS LIKERT)
ICT - Observatory (2006) Ruiz et al (2010 a and b)
Switching costs - Patterson and Smith (2001)
Perceived value - Sweeney and Soutar (2001)
Dependency - Gil et al (2011)
Commitment - Hennig-Thurau (2004) Loyalty - Srinivasan et al (2002) and Anderson and Srinivasan (2003)
STATISTICAL TECHNIQUES Descriptive analysis
Analysis of Variance
STATISTIC SOFTWARE PLS 20 SPSS 17
Table 2 Validation of the measuring instrument
Variable Indicator LoadingsWeights T value α Cronbach IFC AVE
ICT INTENSITY
TIC1- Barcode scanner 0899 34990
0954 0964 0819
TIC2- CreditDebit card payment 0696 87389
TIC3- Telephone 0961 104534
TIC4- Fax 0966 92416
TIC5- E-mail 0923 40748
SWITCHING COSTS
COS1- Little effort is required to buy in this store 0073 0661
NA NA NA
COS2- This store solves me some of my problems 0532 5204
COS3- I would waste a lot of time if I changed 0313 2470
COS4- I will lose a friendly and comfortable relationship if I change 0033 0409
COS5- If I change therersquos a risk the new one wouldnrsquot be as good 0243 1951
COS6- The time I need to buy in this store is acceptable 0149 1265
PERCEIVED VALUE
CAL- Quality 0293 3912
NA NA NA PRE- Price 0269 3183
EMO- Emotional value 0244 2740
SOC- Social value 0471 4901
COMMITMENT
COMP1- My relationship with the store is important 0943 93541
0921 0954 0875 COMP2- If the store closed it would be a loss for me 0946 103025
COMP3- I feel committed to this store 0917 79768
LOYALTY
LEAL1- I doubt that I would switch stores 0739 21347
0846 0935 0743
LEAL2- I try to use this store whenever I purchase 0863 56433
LEAL3- This store is my first choice 0902 71999
LEAL4- This store is the best for me 091 95832
LEAL5- This is my favourite store 0884 61780
Copyright copy2014 by International Journal of Sales Retailing and Marketing Vol 3 No 1 2014
66
plt005 plt010 NA Not applicable The underlined indicators correspond to formative variables Source Own formulation
This quantitative research was carried out
through a survey addressed to 207 buyers of
retail stores of shoes and clothes in Athens and
Valencia The fieldwork took place during
August 2012 in the exit of the stores In relation
to some traits of the survey it is stressed that
7714 of the respondents are women as
expected as the purchase of shoes and clothes
is an activity made more often by women who
are more interested in buying clothes than men
(Cowart and Goldsmith 2007) Additionally
more than 80 of the respondents are not
older than 45 years old with a major
representativeness of the segment 26-35 years
old considering that retail stores attract a
younger and more extended age segment
32 Results
In relation to the validation process of the
measuring instrument in the first place we
estimate the convergent validity which is
analyzed for each indicator through the
loadings the crossloadings and the average
mean-variance (Fornell and Larcker 1981) and
secondly the discriminant validity and the
reliability were analyzed All the results were
acceptable as it can be seen in Table 2
With regard to the hypotheses addressed here
as Table 3 illustrates the structural model
permits to accept five out of six hypotheses
regarding the existing relations between the
different constructs
Table 3 Hypotheses testing
Causal relation Hypothesis Standardized β T value
H1 ICT -gt PERCEIVED VALUE Rejected 0062 ns 1346
H2 SWITCHING COSTS -gt PERCEIVED VALUE Accepted 0060 10262
H3a QUALITY -gt PERCEIVED VALUE Accepted 0035 21888
H3b PRICE -gt PERCEIVED VALUE Accepted 0045 14482
H3c EMOTIONAL VALUE -gt PERCEIVED VALUE Accepted 0023 37787
H3d SOCIAL VALUE -gt PERCEIVED VALUE Accepted 0023 35317
H4 PERCEIVED VALUE -gt COMMITMENT Accepted 0056 6378
H5 DEPENDENCE -gt COMMITMENT Accepted 0055 7488
H6 COMMITMENT -gt LOYALTY Accepted 0020 42214
Perceived Value Rsup2=01571 Commitment Rsup2=01861 Loyalty Rsup2=05606 plt 005 ns non significant
The intensity of ICT application from retailers in
Greece and in Spain is the only addressed
assumption that cannot be confirmed The
results show that ICT donacutet affect customeracutes
perceived value (H1 β= 0062 ns) This result
coincides with the obtained of Comer et al
(1998) who reveal that technology doesnacutet
influence significantly the relational variables
(satisfaction commitment loyalty) something
that posterior studies also corroborate (eg
Ruiz-Molina et al 2010b)
Additionally a t-test is carried out with the
objective to detect possible differences in the
relative perceptions on the retained variables of
Copyright copy2014 by International Journal of Sales Retailing and Marketing Vol 3 No 1 2014
67
the model between Greek and Spanish
consumers (see Table 4)
Table 4 Evaluation of the variables by nationality
Mean values and significant differences
Variable Indicator
Total mean value
Group1 Greece
Group2 Spain F
ICT INTENSITY
TIC1- Barcode scanner 454 492 416 9442b
TIC2- CreditDebit card payment 446 486 405 2900c
TIC3- Telephone 450 488 412 2110
TIC4- Fax 450 489 411 3020b
TIC5- E-mail 450 489 410 1226
SWITCHING COSTS
COS1- Little effort is required to buy in this store 390
416 365 8200a
COS2- This store solves me some of my problems 314
416 213 6580a
COS3- I would waste a lot of time if I changed 322
417 226 1160
COS4- I will lose a friendly and comfortable relationship if I change 242
280 205 6890a
COS5- If I change therersquos a risk the new one wouldnrsquot be as good 372
383 362 18260
COS6- The time I need to buy in this store is acceptable 286
209 362
3130c
PERCEIVED VALUE
CAL- Quality 391 422 359 11366a
PRE- Price 396 424 368 13891a
EMO- Emotional value 411 44 381 22763a
SOC- Social value 401 423 378 1213
COMMITMENT
COMP1- My relationship with the store is important 316 364 268 0616
COMP2- If the store closed it would be a loss for me 317 367 268 0995
COMP3- I feel committed to this store 338 416 26 61474a
LOYALTY
LEAL1- I doubt that I would switch stores 410 431 389 47536a
LEAL2- I try to use this store whenever I purchase 335 406 263 20005a
LEAL3- This store is my first choice 357 411 302 52049a
LEAL4- This store is the best for me 313 421 205 18069a
LEAL5- This is my favourite store 299 330 268 5265b
a b c Statistically significant for p lt 001 p lt 005 and p lt 010 respectively
As it can be observed there are statistically
significant differences in the mean values of
Spanish consumers in relation to the mean
values of Greeks almost in all the analyzed
variables In this aspect Greek consumers
present higher rates in all the indicators of ICT
use by the retailer Similarly the existence of
significant differences regarding the four
Copyright copy2014 by International Journal of Sales Retailing and Marketing Vol 3 No 1 2014
68
dimensions of perceived value ndashquality price
social and emotional value- it is highlighted
Specifically Spanish consumers consider that
they perceive less value in the point of sale
compared with the responses of Greek
consumers Regarding the estimation of the rest
of the relational variables the results show that
Greek consumers tend to be more loyal to the
retailer as they reach higher rates while the
commitment perception doesnacutet vary
significantly between the two groups of
customers
All this leads to conclude that customeracutes
nationality affects its perceptions in relation
with all the variables of the model in a
significant manner
CONCLUSIONS LIMITATIONS AND FUTURE
RESEARCH DIRECTIONS
Literature admits the need to analyze the
determinant factors of the provision of services
in the area of retail distribution and their effect
on the customerrsquos behavioural intentions
towards the retail store Within this framework
perceived value has become a fundamental
variable
The present study has analyzed the of ICT and
switching costs influence on relational variables
like value and it has identified their effects on
commitment and loyalty in a retail
environment confirming the pivotal role of
value The research results show the existing
relations between value and the proposed
antecedents and consequences except the ICT
With all that it can be concluded that in order
to maintain in the market the suppliers have to
deliver a proposal of value to the consumer so
to attract him induce the purchase and foster
loyalty (Warnaby et al 2005) This process can
be achieved through the creation of functional
ndashquality price- emotional and social links
However not all of them act with the same
intensity According to the study results the
effect of emotional value on total value and
commitment is stronger than the produced by
the rest of types of value Therefore we
perceive as possible implications for the retail
companies the concentration of their efforts on
investing in the resources that improve
customerrsquos experience in the point of sale
These resources
can be developed through increased staff
training in the store with a true vocation
towards customer orientation service
customisation and interpersonal relationship
Finally in this study we have found that
nationality factor affects the behaviour of the
model variables pointing towards a possible
moderating effect Perhaps the non significant
effect of ICT can be explained by the significant
differences found in the empirical research
between the two customer profiles of
nationality All the above constitutes a new
perspective in the analysis of relationships
between customers and stores of clothing and
footwear It is noteworthy that this study has
certain weaknesses
First a larger sample that includes increased
number of respondents for each group could
permit to refine more the results Likewise the
research in various retail formats and in
different product categories could permit an
increased mainstreaming of the findings In the
same way sectors of activity where technology
plays a more important role in terms of the
relationship with the customer could result
more attractive field of research
Finally as future research lines could be
interesting to assess if ICT can exert a
moderating effect in their relation with
perceived value instead of acting as an
antecedent Furthermore the intensity of the
relation of perceived value with regard to
commitment in relation to the customersrsquo age
could be estimated as well as the role of
emotions or the state of mind which have been
studied as antecedents of satisfaction
(Machleit and Mantel 2001) It would also be
useful to explore in the retailing context the
contribution of customerrsquos search for variety to
the creation of loyalty (eg Christodoulides and
Copyright copy2014 by International Journal of Sales Retailing and Marketing Vol 3 No 1 2014
69
Michaelidou 2010) In this direction the
moderating or antecedent role of this attitude
could be analyzed and observe differences
according the personal characteristics of the
individuals
We also propose to future studies to improve
the measure of loyalty The attitudinal
approach applied in this study for measuring
this construct should be complemented by a
behavioural approach that includes not only the
repetitive purchase but also the word-of-mouth
attitude (Dick and Basu 1994) This last
response is one of the most relevant and
recognised dimensions of loyalty in the
literature and with the technological
development the virtual dimension of word-of-
mouth gets an increasing academic and
business interest (Chan and Ngai 2011) Thus it
would be interesting to measure the word-of-
mouth attitude personal and electronic in
order to identify differences in this dimension
of loyalty across cultures
REFERENCES
Andaleeb SS (1995) ldquoDependence relations
and the moderating role of trust implication for
behavioral intentions in marketing channelsrdquo
International Journal of Research in Marketing
Vol 12 No 2 pp 157-72
Anderson JC and Narus JA (1990) ldquoA model
of distributor firm and manufacturing firm
working relationshipsrdquo Journal of Marketing
Vol 54 No 1 pp 42-58
Caruana A Money AH and Berthon P R
(2000) lsquorsquoService quality and satisfaction-the
moderating role of valuersquorsquo European Journal of
Marketing Vol 34 no 1112 pp 1338-1352
Chan YYY y Ngai EWT (2011)
ldquoConceptualising electronic Word of mouth
activity An input-process-output perspectiverdquo
Marketing Intelligence amp Planning 29 (5) 488-
516
Christodoulides G y Michaelidou N (2010)
ldquoShopping motives as antecedents of e-
satisfaction and e-loyalty Journal of Marketing
Management 27 (1-2) 181-197
Comer JM Mehta R and Holmes TL (1998)
ldquoInformation technology retail users versus
non usersrdquo Journal of Interactive Marketing
Vol 12 No 2 pp 49-62
Cowart KO and Goldsmith RE (2007) ldquoThe
influence of consumer decision-making styles
on online apparel consumption by college
studentsrdquo International Journal of Consumer
Studies Vol31 No 6 pp 639ndash647
Dick A S and Basu K (1994) Customer
loyalty Toward an integrated conceptual
framework Journal of the Academy of
Marketing Science 22(2) 99-113
Emerson R (1962) acuteacutePower-Dependence
Relationsacuteacute American Sociological Review 27
(February) 31-41
Evanschitzky H Iyer G R Plassmann H
Niessing J and Meffert H (2006) The relative
strength of affective commitment in securing
loyalty in service relationships Journal of
Business Research 59(12) pp 1207-1213
Ferreiros Bennett P (2012) acuteacuteHow Social
Networks Digital Media and Digital Marketing
Can Be Applied to the Promotion of Goods and
Services in Business Companies in Order to
Increase Salesacuteacute Journal of US-China Public
Administration July Vol 9 No 7 812-824
Fornell C and Larcker DF (1981) ldquoEvaluating
Structural Equation Models with Unobservable
Variables and Measurement Errorrdquo Journal of
Marketing Research Vol18 pp39-50
Fullerton G (2005) ldquoThe service qualityndashloyalty
relationship in retail services Does
Copyright copy2014 by International Journal of Sales Retailing and Marketing Vol 3 No 1 2014
70
commitment matterrsquorsquo Journal of Retailing and
Consumer Services 12 pp 99ndash111
Gil-Saura I Ruiz-Molina M E and Arteaga-
Moreno F (2011) lsquorsquo Value supplier
dependence and long-term orientation
Outcomes for B2B commerce in the travel
industryrsquorsquo Industrial Management amp Data
Systems Vol 111 No 5 pp 791-808
Gil Saura I Servera Franceacutes D Berenguer
Contriacute G and Fuentes Blasco M (2008)
ldquoLogistics service quality a new way to loyaltyrsquorsquo
Industrial Management amp Data Systems Vol
108 No 5
Griffin MA (1996) acuteacuteExtra-role Behaviors in
Organisations The Mediation of Work and
Individual Factors by Organisational
Commitmentacuteacute Paper presented at the 11th
Annual Conference of the Society for Industrial
and Organisational Psychology San Diego CA
Groumlnroos C (2000) ldquoCreating a relationship
dialogue communication interaction valuerdquo
Marketing Review Vol 1 No 1 pp 5-14
Hennig-Thurau T Gwinner KP Walsh G
Gremler DD (2004) acuteacuteElectronic Word-of-
Mouth via Consumer-Opinion Platforms What
Motivates Consumers to Articulate Themselves
on the Internetacuteacute Journal of Interactive
Marketing 18 (1) 38-52
Lovelock C (1991) ldquoServices Marketing Text
Cases and Readingrsquorsquo 2nd ed Prentice-Hall
Englewood Cliffs NJ
Machleit KA Mantel SP (2001) ldquoEmotional
response and shopping satisfaction Moderating
effects of shopper attributionsrdquo Journal of
Business Research 54 (2) pp 97-106
Mentzer J T and Williams L R (2001) ldquoThe
role of logistics leverage in marketing strategyrsquorsquo
Journal of Marketing Channels 8 pp 29-48
Morgan R M and Hunt S D (1994) ldquoThe
commitment-trust theory of relationship
marketingrsquorsquo Journal of Marketing 58(3) pp 20-
38
Observatorio de las Telecomunicaciones y la
Sociedad de la Informacioacuten (2008) Diagnoacutestico
tecnoloacutegico del sector de comercio minorista
Entidad Puacuteblica Empresarial Redes
httpobservatorioredesmedia2008-
051211193299289pdf
Oliver R (1999) ldquoWhence consumer loyaltyrsquorsquo
Journal of Marketing 63 special issue pp 33-
44
Reynolds KE and Beatty SE (1999)
ldquoCustomer benefits and company consequences
of customer-salesperson relationships in
retailingrdquo Journal of Retailing Vol 75 No 1 pp
11-32
Ruiz-Molina ME Gil-Saura I and Calderoacuten
Garciacutea H (2010a) acuteacuteEl efecto moderador de la
edad en la relacioacuten entre el valor percibido las
TIC del minorista y la lealtad del clientersquorsquo
Cuadernos de Economiacutea and Direccioacuten de la
Empresa Nuacutem 43 junio pp 65-92
Ruiz-Molina ME Gil-Saura I and Moliner-
Velaacutezquez B (2010b) acuteacuteThe role of information
technology in relationships between travel
agencies and their suppliersrsquorsquo Journal of
Hospitality and Tourism Technology Vol 1 No
2 pp 144-162
Ryssel R Ritter T and Gemuumlnden HG (2004)
ldquoThe impact of information technology
deployment on trust commitment and value
creation in business relationshipsrdquo Journal of
Business amp Industrial Marketing Vol 19 No 3
pp 197-207
Saacutenchez J Saacutenchez M Antonio J and
Gutieacuterrez T (2010) ldquoThe impact of relational
variables on value creation in buyer-seller
Copyright copy2014 by International Journal of Sales Retailing and Marketing Vol 3 No 1 2014
71
business relationshipsrdquo Journal of Business-
Business Marketing Vol 17 No 1 pp 62-94
Sharland A (1997) ldquoSourcing strategy the
impact of costs on relationship outcomesrdquo
International Journal of Physical Distribution amp
Logistics Management Vol 27 No 7 pp 395-
409
Sheth Jagdish N Bruce I Newman and Barbara
L Gross (1991) ldquoWhy We Buy What We Buy A
Theory of Consumption Valuesrdquo Journal of
Business Research 22(March) pp 159ndash170
Simpson P M Siguaw J A and Baker T L
(2001) ldquoA model of value creation supplier
behaviors and their impact on reseller
perceived valuersquorsquo Industrial Marketing
Management 30(2) pp 119-134
Srinivasan R (2008) ldquoSources characteristics
and effects of emerging technologies Research
opportunities in innovationrsquorsquo Industrial
Marketing Management 37 pp 633ndash640
Sweeney JC and Soutar G (2001) ldquoConsumer
perceived value the development of a multiple
iacutetem scalersquorsquo Journal of Retailing Vol 77 pp
203-220
Warnaby G Bennison D and Davies BJ
(2005) ldquoRetailing and the marketing of urban
places a UK perspectiverdquo International Review
of Retail Distribution and Consumer Research
Vol15 Ndeg2 pp191-215
White L and Yanamandram V (2007) ldquoA
model of customer retention of dissatisfied
business services customersrsquorsquo Managing Service
Quality Vol 17 No 3 pp 298-316
Zeithaml V A (1988) ldquoConsumer Perceptions
of Price Quality and Value A Means-End Model
and Synthesis of Evidencerdquo Journal of
Marketing 52(July) pp 2ndash22
Copyright copy2014 by International Journal of Sales Retailing and Marketing Vol 3 No 1 2014
72 DIGITAL MEDIA amp POLITICAL MARKETING IN ALBANIA
DIGITAL MEDIA amp POLITICAL MARKETING IN ALBANIA
Orjona Fjerza amp Vjollca Hysi (Panajoti)
Abstract
This paper is a synthesis of a study and analysis conducted in Political marketing focused mainly on
the opinion of the electorate during the elections camping for the Parliamentary in Albania heldrsquos on
23 June 2013 Highlighted already in many scientific articles studies and empirical data Political
Marketing and the development of its technical tools are going in parallel with the development of
technology and the New Social Media Marketing is becoming an increasing necessity for Political
market in the world In a broader plan elements that characterize an electoral campaigns and what
the final results reveals from the elections in Albania this article focuses mainly on political marketing
elements and external factors excluding socio-economic (not less important)
Albanian political parties in the last election campaign gave a highest importance to accurate
program coalitions images and messages forwarded to the electorate Almost all the major political
parties were awareness and showed greater maturity compared with previous election campaigns
regarding the form and content of Political Product
The paper consist on analyzing the collected data through interviews questionnaires statistical and
descriptive methods as well as empirical studies reveal interesting facts and figures in the
implementation of appropriate strategies by political parties for future campaigns This paper also a
reference article for the next academic research in the Political Marketing and represents a picture of
the importance in particular of the social media and Political Marketing as whole
Keywords Digital Media marketing 2013 Election Campaign Factors analyze
INTRODUCTION
POLITICAL DIGITALampSOCIAL MEDIA IN ALBANIA
In recent decades many Western Balkan
countries including Albania began the process of
political transformation and socio - economic
transition which necessaries changes in the
respective political system Such
transformations and brought new developments
in terms of designing appropriate strategies
commensurate political class European models
However it seems to have difficulties even
today in their implementation this because of
cultural differences socio - demographic
economic historical etc
Proposed research topic focus on the modern
literature review regarding the new elements of
Political Marketing contextualize with Albanian
political market
Todays challenge for political parties in the
context of an increasingly dynamic environment
is to enhance the share of the electorate
through the delivery of the message in the
appropriate form for the realization of the main
objective in the future elections campaigns
As the latest literature refers Political Marketing
is a about Political Experience historical and
Political management studies of various
segments of the electorate through social -
demographic analysis relationship with the
media interest groups campaign management
companies fundraising and donations
compliance with the legal code of elections
political image and Political Product designing
political use of previous experience as a
contemporary approach models etc
Orjona Fjerza is a PhD candidate in Political Marketing Economic Faculty of Tirana Marketing Department (email orjonafjerzagmailcom) Vjollca Hysi (Panajoti) is professor and Head of Department of Marketing Economic Faculty of Tirana
Copyright copy2014 by International Journal of Sales Retailing and Marketing Vol 3 No 1 2014
73 DIGITAL MEDIA amp POLITICAL MARKETING IN ALBANIA
Sixty-six political parties and two independent
candidates were registered as contestants in a
largely inclusive process that offered voters a
genuine choice Political parties registered
according to the Law on Political Parties as well
as independent candidates could apply for
registration as electoral subjects
Most parties promoted similar platform goals
economic development employment
opportunities the fight against corruption and
European integration Issues most prominently
featured in the public debate were social
security and taxation While the DP noted
government achievements the SP promised a
new beginning The SMI criticized the
government and focused on job creation and
joining European structures
Major political parties in Albania such as the
Democratic Party Socialist Party Socialist
Movement for Integration Republican Party etc
engaged international companies for the
campaign management During the 2013
elections the Socialist Party hired the ldquoAlastair
Campbell brothers and left the advice of
ldquoCrespirdquo former Italian company which has
provided consultants on previous campaign
Democratic Party chose to collaborate with the
ldquoGovernment Advisory (Tony Blair company
adviser) which replaced the advice given by the
group of companies Tony Podesta Podesta and
Patton Boggs in the previous campaign
Although digital media was one of the key
factors to profit from Obamas election in 2008
presidential election new techniques of digital
media and new social media were almost
nonexistent during the 2009 General Election
Campaign in Albania
A wide range of media outlets operates in
Albania According to the Audiovisual Media
Authority (AMA) there are 3 national television
(TV) channels (public channel TVSH TV Klan and
Top Channel) 71 local TV channels 83 cable TV
channels and 59 radio stations
Print media are numerous although circulation
and impact are limited Internet provides an
open sphere for public discourse TV has the
highest share of advertising market and is
considered the primary source of information
due to its wide geographical coverage
The private broadcasters varied in their
coverage TV Klan favored the DP with 53 per
cent of mostly positive news coverage
compared to the SP with 28 per cent of often
negative news coverage Top Channel and Vizion
Plus were more balanced in their coverage even
if a more negative tone was noted towards the
government The news channels News 24 and
Ora News provided wide and generally neutral
coverage of the major parties The print media
showed some polarization with Shqip and
Shqiptarjacom mainly aligned with the
opposition and Mapo and Panorama with the
ruling party
Digital and Social media are becoming one of the
most important factor of Modern Marketing
which has resulted also important and surely to
be considered in Political marketing in Albania
Social Networks born as a possibility of
communication between friends but today they
have a great importance in communicating with
the public and Business Marketing Strategy
growth development The biggest social network
in the world is Facebook ( in Albania Also )
while Twitter has many users in different
countries of the world but there are very few
users in Albania Another fundamental
difference compared with Twitter is the space
and timing Facebook give the possibility of
social interactions mutual communication what
is most important is to obtain a direct feedback
and expand share and like posts messages
videos comments business or political pages
feedback promotions while Twitter is more
limited
Even though the boom of social media already
confirmed worldwide also requires interaction
with other forms of digital media Parallel with
the development of social media are moving
increasingly mobile application WebPages
Copyright copy2014 by International Journal of Sales Retailing and Marketing Vol 3 No 1 2014
74 DIGITAL MEDIA amp POLITICAL MARKETING IN ALBANIA
Google YouTube Apple Samsung etc In other
words a cross-marketing approach involving
multiple devices including TV touch screen
tablets computers laptops mobile phones etc
As the data revels below using or being focused
only on the social media marketing will not
guarantee the success for the political
marketing Cross digital marketing Strategies will
be necessary to be elaborate and implement in
the future campaigns
RESEARCH QUESTIONS
According to the recent changes on the
marketing concepts especially in the nonprofit
marketing in our case on Political Marketing
the article tries to give answers to the following
questions
1 Are applicable in Albania new patterns and
trends based on contemporary literature and
practices of Political Marketing
2 The positive effects of the use of digital and
social media in politics compared with the most
developed countries will have particular impact
on the successes of the Political Parties If there
is a positive connection what influence them
have and how political parties should use it
METHODOLOGY
The study is focused on the research works
articles scientific literature and in terms of
contextualization in order to highlight the way
s how the Albanian case confirms rejects or
criticizes models an approach already widely
accepted theory within the science disciplines
social and human In this sense we gave
fundamental approach combining theoretical
and empirical analysis
Initially a preliminary testing of the survey was
considered in December 2012 with around 200
questionnaires and in March- May 2013 the
realization of the survey with specific focus
groups and representatives regarding 1500
questionnaires were complete analyzed and
processed
Initially were set the dimensions of the survey
plot (with the help of inter - market Cronbacher
consistency alpha) = preliminary factorial
analysis After this step the problematic
questions identification helped a false removing
alpha coefficient (which shows the consistency
of variables) Further we focused on re - defining
the sampler for the selected sub- community (
ie reduced questionnaire )
The respondents were of different ages ranging
from 18 years to 52 years Field survey lasted
about two weeks and interviews conducted
through face- to-face confrontation with the
interviewee Respondents selected at random
and the sample selection made depending on
the weight that each university selected item
Demographic data presented in the tables
below
City Frequency Percentage
Tirana 778 519
Berat 97 65
Vloreuml 126 84
Shkoder 148 99
Durres 94 63
Elbasan 206 137
Gjirokaster 51 34
Total 1500 1000
Copyright copy2014 by International Journal of Sales Retailing and Marketing Vol 3 No 1 2014
75 DIGITAL MEDIA amp POLITICAL MARKETING IN ALBANIA
Age segments
Gender
Male Female Total
Frequency Frequency Frequency
18-21 350 304 800 696 1150 1000
22-25 118 423 161 577 279 1000
26-29 20 588 14 412 34 1000
30-33 7 467 8 533 15 1000
gt34 15 682 7 318 22 1000
Total 510 340 990 660 1500 1000
Part of this process was the creation of a
database with the collected data and their
processing and analysis which was conduct via
computer software like SPSS Excel and for the
purposes of the study used statistical models as
the principal analysis enabling components
finding correlations between dependent
variables and independent ones
FINDINGS ANALYZE
Factor Analyze
This section describes the data processed of the
second survey conducted as explained above in
the methodology section during the period
March-May 2013 Here are described the results
of the data regarding the impact of the use of
social media marketing techniques and
information received by the interviewers related
with Political information The Statistical model
used for the data processing is the factors
analyze and the analysis of the primary
processing elements
The table 1 shows the relationship (correlation)
between the variables gender and age on the
one hand and the questions - Which party do
you think has better organized election
campaign And the question which of the
parties predict will win the 2013 elections
Based on factor analysis of the correlation
coefficient with regard to gender the first
question is
-0073 which means that the connection is very
weak and negative direction The same is
observed with the second question for
predicting the winners of elections where the
coefficient is again very small thus making
insignificant Note that the correlation
coefficient indicates a mathematical value to
measure the strength of linear vibrations in
relation between two variables which takes
values from -1 to 1
1 Value +1 means that the connection is
completely strong
2 Value 0 indicates that the two variables have
no connection
3 A value of -1 indicates that the connection is
strong but completely opposite direction
The same phenomenon is also observed with
variable age where the values of these
correlations are very small reaching the
conclusion that the relationship between them
is almost inexistent Finally we can say that the
forecast for the winning party and the fact that
one of them has better organized electoral
campaign do not depend of the gender or age of
the respondents
Table 1 Matrix of Correlations
Which political party do you think
of the better organized the
campaign until now
In Your opinion which party do you
think will win the election
Gender -0073 -0076
Age -0041 -005
Copyright copy2014 by International Journal of Sales Retailing and Marketing Vol 3 No 1 2014
76 DIGITAL MEDIA amp POLITICAL MARKETING IN ALBANIA
Table 2
Table 3
Extraction Method Principal Component Analysis
Table 3 shows that the component 1 and 2
together account for 699 of the total variance
compared with the four factors taken together
where the largest share of the variation of voice
first factor to 417 Factor 3 and 4 has been
excluded (gender and age) which means that it
does not affect the analysis of variance factors
Table 4 shows the weight of each factor on
another expressed through correlation
According to the coefficient values obtained
data shows that the correlation of gender and
age with the first factor are respectively too low
(-0233 and -0171)
Table 4 Component Matrix
Extraction Method Principal Component Analysis
Table 5 shows the correlation coefficients for
each pair of variables The table also shows that
regardless of the respondents use the Internet
they are almost indifferent as regards
information relating to political parties on social
networks like Facebook Twitter on whether
they do Like these party websites or making
information Share from their respective post
which is indicated by the very low values of
these coefficients of correlations It is also
indicated in Table 6 which shows very low
values of these variables adjustment On the
other hand Table 7 also shows that the use of
the Internet Facebook and Twitter it also
occupied the largest share accounting for a
total weight of 64 of the 12 variables
considered
Initial
Extractio
n
Gender 1 0559
Age 1 0587
Which political party do you think of the better organized the campaign until now 1 0822
Your track which party do you think will win the election 1 0821
Extraction Method Principal Component Analysis
Component
Total
of
Variance
Cumulati
ve Total
of
Variance
Cumulati
ve
1 1672 41792 41792 1672 41792 41792
2 1116 27903 69695
3 0856 21395 9109
4 0356 891 100
Initial Eigenvalues
Extraction Sums of Squared
Loadings
1116
Total Variance Explained
1 2
Gender -0233 071
Age -0171 0747
Which political party do you think better organized the electoral campaign so far 089 017
According to your opinion which party do you think will win the election 0892 0159
Component
Copyright copy2014 by International Journal of Sales Retailing and Marketing Vol 3 No 1 2014
77 DIGITAL MEDIA amp POLITICAL MARKETING IN ALBANIA
Table 5 matrix of correlations
Table 6 Communalities
Extraction Method Principal Component Analysis
On
average
how
many
hours of
Internet
use
during a
week
Do you
use
Do you
use
Twiter
Do you
use
Twiteri
Are you
part of
the blog
Do you
use
If you
have an
account
on
have
you done
Like for
your
party
If you
have an
account
on
Twiter
have you
made the
web
Share
your
party
If you
have an
account
on
Twiter
have you
called
your
friends to
vote for
your
favorite
party
Have you
made
Like
Share
Call for
your
Party
Which
political
party do
you think
has better
organized
the
electoral
campaign
until now
Accordin
g to your
opinion
which
party do
you think
will win
the
election
On average how many hours of Internet use during a week 1 0182 0121 0175 0174 0165 0119 009 0084 0104 -0034 -0051
Do you use Facebook 0182 1 0053 0946 0089 0075 0266 0099 0068 0247 -0015 -0033
Do you use Twiterin 0121 0053 1 0137 021 016 0088 0173 0058 0103 -0029 0004
Do you use Facebook Twiteri0175 0946 0137 1 0112 0095 0263 0121 0087 0263 -0029 -0043
Are you part of the blog 0174 0089 021 0112 1 0318 0119 0092 0045 0105 0018 -0025
Do you use LinkedIn 0165 0075 016 0095 0318 1 0102 0075 0094 0102 -0042 -0049
If you have an account on Facebook have you done Like for your party 0119 0266 0088 0263 0119 0102 1 0389 0245 0923 -0314 -0302
If you have an account on Facebook Twiter have you made the web Share your party 009 0099 0173 0121 0092 0075 0389 1 0399 0447 -0221 -0183
If you have an account on Facebook Twiter have you called your friends to vote for your favorite party 0084 0068 0058 0087 0045 0094 0245 0399 1 0388 -0163 -0143
Have you made Like Share Call for your Party0104 0247 0103 0263 0105 0102 0923 0447 0388 1 -0308 -0313
Which political party do you think has better organized the electoral campaign until now -0034 -0015 -0029 -0029 0018 -0042 -0314 -0221 -0163 -0308 1 0644
According to your opinion which party do you think will win the election-0051 -0033 0004 -0043 -0025 -0049 -0302 -0183 -0143 -0313 0644 1
Initial Extraction
On average how many hours of Internet use during a week 1 0279
Do you use Facebook 1 0955
Do you use Twiter 1 0323
Do you use facebookTwiterin 1 0943
Are you part of the Blogs 1 0544
Do you have a Linkedin account 1 0506
If you have a fb Twiter account did u klik like to your favorite party post 1 073
If you have an account on Facebook Twiter have you made the web Share your party 1 055
If you have a fb Twiter account did you invite friends to voto for your favorite poltical Party 1 0453
Did u make like share invite for your favorite Party 1 0823
Which political party do you think better organized the electoral campaign so far 1 0789
According to your opinion which party do you think will win the election 1 0808
Copyright copy2014 by International Journal of Sales Retailing and Marketing Vol 3 No 1 2014
78 DIGITAL MEDIA amp POLITICAL MARKETING IN ALBANIA
Table 7 Total Variance Explained
Extraction Method Principal Component Analysis
Table 8
Extraction Method Principal Component Analysis
a 4 components extracted
Table 8 presents the weight of these four main
components showing once again the weak link
between variables As to the manner of
obtaining information about political parties
associated with the program activities etc
Table 9 shows that respondents receive more
information through the social network
Facebook that has high correlation with Internet
use variable value 066 Also the correlation
between access to information through the
media like radio or television has low value
which means that although it can see or hear
the various programs they are much less
interested to hear or see programs on political
campaign concluding that a very small
proportion of young people are mainly those
who follow political information and most are
those who are actively involved in youth of
political parties or those who directly participate
in staff close candidates for deputies
Component Extractio
n Sums
of
Squared
Loadings
Total
of
Variance
Cumulati
ve Total
of
Variance
Cumulati
ve
1 3224 26865 26865 3224 26865 26865
2 1872 15603 42468
3 1432 11937 54406 1432 11937 54406
4 1175 9789 64194 1175 9789 64194
5 0893 7444 71638
6 0883 7359 78997
7 0822 6847 85844
8 0671 5588 91432
9 0563 4694 96126
10 0352 2933 9906
11 0067 0555 99615
12 0046 0385 100
Initial Eigenvalues
1872
Initial Extraction
On average how many hours of Internet use during a week 1 0279
Do you use Facebook 1 0955
Do you use Twiter 1 0323
Do you use facebookTwiterin 1 0943
Are you part of the Blogs 1 0544
Do you have a Linkedin account 1 0506
If you have a fb Twiter account did u klik like to your favorite party post 1 073
If you have an account on Facebook Twiter have you made the web Share your party 1 055
If you have a fb Twiter account did you invite friends to voto for your favorite poltical Party 1 0453
Did u make like share invite for your favorite Party 1 0823
Which political party do you think better organized the electoral campaign so far 1 0789
According to your opinion which party do you think will win the election 1 0808
Copyright copy2014 by International Journal of Sales Retailing and Marketing Vol 3 No 1 2014
79 DIGITAL MEDIA amp POLITICAL MARKETING IN ALBANIA
This fact also support the values expressed in
Tables 10 and 11 for weight and adjusting the
variables where higher values are those using
the Internet and social network Facebook value
respectively 082 and 079 while other factors
are presented in low values Table 11 also shows
that only 6 of the 12 variables taken proper
review variances occupy 67 of their total
values of which are presented in Table 12
distributed
Table 9 Correlation Matrix
Correlati
on Matrix
Informed
about
politics
through
Internet
Informed
about
politics
through
Informed
about
politics
through
magazine
s
Informed
about
politics
through
Twiter
Informed
about
politics
through
Televisio
n
Informaci
onin per
politiken
e merrni
Nepermje
t Radios
Informed
about
politics
through
Radio
Informed
about
politics
through
friends
If you
are
informed
through
television
the
informati
on gained
from TV
Klan
seems to
you to be
realistic
If you
are
informed
through
television
the
informati
on gained
from
NEWS
24 seems
to you to
be
realistic
Nese
informaci
onin per
politiken
e merrni
nepermje
t medias
vizive a
ju duket
realist
informaci
oni ne
Ora
News
If you
are
informed
through
television
the
informati
on gained
fromTop -
Channel
seems to
you to be
realistic
If you
are
informed
through
television
the
informati
on gained
from
TVSH
seems to
you to be
realistic
If you
are
informed
through
television
the
informati
on gained
from
UFO TV
seems to
you to be
realistic
Which
political
party do
you think
better
organized
the
electoral
campaign
until
now
Accordin
g to your
opinion
which
party do
you think
will win
the
election
Informed about politics through Internet1 0668 0185 0195 0233 0158 0231 0307 0139 0158 0117 0124 0067 0119 -0149 -0169
Informed about politics through Facebook0668 1 0131 021 0207 0185 0274 0359 0172 0174 0173 0152 0081 012 -0146 -0157
Informed about politics through magazines0185 0131 1 0038 0432 0175 0223 0207 0189 0194 0231 0067 0237 0214 -0128 -0092
Informed about politics through Twiter0195 021 0038 1 -0195 0365 0076 0127 0165 0158 014 0075 0059 0093 -0025 0008
Informed about politics through Television0233 0207 0432 -0195 1 0073 0299 02 012 0153 0171 02 015 014 -0101 -0141
Informed about politics through Radio0158 0185 0175 0365 0073 1 0211 025 0169 0221 0208 0153 0122 0182 -0005 -0002
Informed about politics through Familiars0231 0274 0223 0076 0299 0211 1 0612 025 02 0231 013 0115 0175 -0176 -017
Informed about politics through friends0307 0359 0207 0127 02 025 0612 1 0186 0169 0218 0088 0091 019 -0153 -0167
If you are informed through television the information gained from TV Klan seems to you to be realistic0139 0172 0189 0165 012 0169 025 0186 1 0347 0334 0034 0415 0213 -0068 -0048
If you are informed through television the information gained from NEWS 24 seems to you to be realistic0158 0174 0194 0158 0153 0221 02 0169 0347 1 0683 0321 0247 0249 -0002 -0028
If you are informed through television the information gained from Ora News seems to you to be realistic0117 0173 0231 014 0171 0208 0231 0218 0334 0683 1 0217 0297 0324 -0007 -0025
If you are informed through television the information gained fromTop -Channel seems to you to be realistic0124 0152 0067 0075 02 0153 013 0088 0034 0321 0217 1 0032 0042 -0042 -0084
If you are informed through television the information gained from TVSH seems to you to be realistic0067 0081 0237 0059 015 0122 0115 0091 0415 0247 0297 0032 1 0494 -0058 -0033
If you are informed through television the information gained from UFO TV seems to you to be realistic0119 012 0214 0093 014 0182 0175 019 0213 0249 0324 0042 0494 1 -0004 -0005
Which political party do you think better organized the electoral campaign until now-0149 -0146 -0128 -0025 -0101 -0005 -0176 -0153 -0068 -0002 -0007 -0042 -0058 -0004 1 0644
According to your opinion which party do you think will win the election-0169 -0157 -0092 0008 -0141 -0002 -017 -0167 -0048 -0028 -0025 -0084 -0033 -0005 0644 1
Copyright copy2014 by International Journal of Sales Retailing and Marketing Vol 3 No 1 2014
80 DIGITAL MEDIA amp POLITICAL MARKETING IN ALBANIA
Table 10 Communalities
Extraction Method Principal Component Analysis
Table 11 Total Variance Explained
Extraction Method Principal Component Analysis
Initial
Extractio
n
Informed about politics through Internet 1 0827
Informed about politics through Facebook 1 0794
Informed about politics through magazines 1 0432
Informed about politics through Twiter 1 0655
Informed about politics through Television 1 0701
Informed about politics through Radio 1 0461
Informed about politics through Familiars 1 0753
Informed about politics through friends 1 0737
If you are informed through television the information gained from TV Klan seems to you to be realistic 1 045
If you are informed through television the information gained from NEWS 24 seems to you to be realistic1 075
If you are informed through television the information gained from Ora News seems to you to be realistic1 0681
If you are informed through television the information gained fromTop -Channel seems to you to be realistic1 0612
If you are informed through television the information gained from TVSH seems to you to be realistic 1 0711
If you are informed through television the information gained from UFO TV seems to you to be realistic 1 0534
Which political party do you think better organized the electoral campaign until now 1 082
According to your opinion which party do you think will win the election 1 0814
Component Extractio
n Sums
of
Squared
Loadings
Total
of
Variance
Cumulati
ve Total
of
Variance
Cumulati
ve
1 3774 2359 2359 3774 2359 2359
2 1909 11934 35524
3 1505 9405 44929 1505 9405 44929
4 1282 8011 5294 1282 8011 5294
5 1206 754 6048 1206 754 6048
6 1055 6595 67075 1055 6595 67075
7 0948 5927 73001
8 0812 5073 78075
9 0719 4493 82568
10 0585 3656 86224
11 0465 2905 89129
12 0414 2587 91716
13 0367 2294 9401
14 0346 2163 96172
15 0326 2039 98212
16 0286 1788 100
Initial Eigenvalues
1909
Copyright copy2014 by International Journal of Sales Retailing and Marketing Vol 3 No 1 2014
81 DIGITAL MEDIA amp POLITICAL MARKETING IN ALBANIA
Table 12 Component Matrix
Extraction Method Principal Component Analysis
6 components extracted
CONCLUSIONS
Political marketing is not only the elections
campaign The election campaign is the period
of emergence and implementation of marketing
strategy suitable constraint to growth target
electorate
Undoubtedly the implementation of modern
marketing strategies as in business as well as in
the field of Political Marketing depends on the
economic power of the political entity Even if
implementing with specialists the most
sophisticated and modern one campaign it
could not be enough to have the required
success in the elections
If the political Parties will not take in
consideration the campaign finance electoral
system legal framework election
administration Postelection period socio-
economic factors of the country regularly study
segments of the electorate whether there
would not operate in a social democratic system
inside and outside the Political Party political
marketing or other marketing techniques surely
will fail
As mentioned in the introduction of the paper
also after analyzing the survey conducted during
electoral campaigns marketing strategies
interaction in Albanian political market are
required
Note that this study excludes the impact of
external variables such as economic level
demographic composition social factors
relationship with the previous election history
etc
Despite the limitations of the research
mentioned above and the following set of
answers at the top of the paper we can
conclude
New forms and techniques of digital media has
been implanted from the political Parties in
2013 Election Campaign Data shows that more
and more the Digitalization of the campaign will
increase and new and more sophisticated
techniques would be elaborate and implement
Conclusions drawn through the final reports that
the digital media and social media applications
as part of marketing budget has to consider also
advertising spots rallies promotional products
1 2 3 4 5 6
Informed about politics through Internet 0533 -0367 0354 017 0095 0495
Informed about politics through Facebook 0565 -0341 0396 0145 0075 0418
Informed about politics through magazines 0493 -0006 -0328 0252 0128 0031
Informed about politics through Twiter 0291 0119 0622 -0405 0064 -0028
Informed about politics through Television 0454 -018 -0411 0532 -0066 0086
Informed about politics through Radio 0446 0142 0395 -0102 0041 -0273
Informed about politics through Familiars 0603 -0235 0001 0194 0146 -0525
Informed about politics through friends 0598 -0269 0154 0164 0219 -0456
If you are informed through television the information gained from TV Klan seems to you to be realistic0525 0277 -0102 -0238 0174 0028
If you are informed through television the information gained from NEWS 24 seems to you to be realistic06 0409 -0009 -007 -0466 0013
If you are informed through television the information gained from Ora News seems to you to be realistic0618 0426 -008 -0069 -0325 -0036
If you are informed through television the information gained fromTop -Channel seems to you to be realistic0328 0027 0076 0147 -069 002
If you are informed through television the information gained from TVSH seems to you to be realistic 0463 0389 -0358 -0237 0332 0226
If you are informed through television the information gained from UFO TV seems to you to be realistic0481 0352 -0208 -0109 0333 0118
Which political party do you think better organized the electoral campaign until now -0266 0612 0304 0519 011 0014
According to your opinion which party do you think will win the election -0275 0624 0305 047 0184 0
Component
Copyright copy2014 by International Journal of Sales Retailing and Marketing Vol 3 No 1 2014
82 DIGITAL MEDIA amp POLITICAL MARKETING IN ALBANIA
posters leaflets banners city light meetings
concerts etc
The final Reports of Parties and other interested
institutions and the deep analyses should offer
an accurate image
Political parties one shall be give due
importance to all public and certain market
segmentation but always in coherence with
socio-political system of Albania and in mean
time to stay in contact with the electorate also
in post election period
REFERENCES
Harris P 2001To Spin or not to Spin that is the
Question The Emergence of Modern
PoliticalMarketing The Marketing Review 2000
1 pages
wwcecgocal
OSCEODIHR Election Observation Mission Final
Report
httpwwweastjournalnetalbania-tony-blair-
torna-a-casa-gli-affari-delle-societa-di-
consulenza-nei-balcani33000
Electoral Code of Albania
wwwbuddecomauResearchGlobal-Digital-
Media-The-Dynamic-Digital-IPTV-and-Smart-
TVMarketshtml
httpwwwsocialbakerscomfacebook-
statisticsalbania
Fjerza O Hysi (Panajoti)V 2013 Authors survey
statistical methods and data analyze

Copyright copy2014 by International Journal of Sales Retailing and Marketing Vol 3 No 1 2014
2
Editorial
The current issue of
the International
Journal of Sales Retail
and Marketing
presents some
outstanding research
papers from all around
the world The journal
focuses on challenging
and complex area of retailing sales and
marketing in general Due to the increased
competition in those fields and changing
patterns of consumption this area is bound to
receive a lot of scientific and scholar attention in
the future There is a lot of space for
investigating and for offering implications and
strategic decisions to retailers and to all those
who are involved in this business
Current issue of the journal is dedicated to
seven research papers of high academic quality
written by academics from India South Africa
Albania Greece and Spain
The articles cover the core theories empirical
researches essential research tools expanding
the existing knowledge base about topics in
retailing sales and marketing and we hope that
they will be read and cited in the future
investigations and relieves dealing with this area
Thank you for following the IJSRM and we wish
you an enjoyable reading
Drsc Mirko Palić
Editor
3 STUDY OF IMPACT OF BRAND IMAGE OF RETAILERS ON CUSTOMERS BUYING DECISION OF STORE BRANDS
Copyright copy2014 by International Journal of Sales Retailing and Marketing Vol 3 No 1 2014
STUDY OF IMPACT OF BRAND IMAGE OF RETAILERS
ON CUSTOMERS BUYING DECISION OF STORE
BRANDS
Sonal Gupta Rajendra Jain amp Varun Parmal
Abstract
This research paper is an attempt to find out the impact of brand image of retailers on customersrsquo
decision whether to buy the store brands The purpose of this study is also to examine how the brand
image of retailers affects the perceived quality and perceived risk of store brands and ultimately the
customersrsquo buying decision of store brands Convenience sampling technique was used to collect
responses from 100 customers through mall intercept method using structured questionnaire as
research instrument This study reveals that brand image of retailer has significant impact on buying
decision of customers Study also suggests that brand image of retailer has significant impact on
perceived quality and perceived risk of buying store brands
Keywords Store Brands Store Image Buying Decision Perceived Quality Perceived Risk
INTRODUCTION
In India the growth of organized retailing results
into the growth of store brands which are also
called as private labels The performance of
store brands in India is quite reckonable There
is an increasing acceptance for private labels in
India According to Global Private Label
Consumer Study by ACNielsen (2005) 56 of
their survey respondents in India considered
private labels to be good alternatives to
manufacturersrsquo brands The growth of store
brands in India presents an interesting
opportunity for the retailer to understand the
motivations of consumers behind choice of
private label brands According to Images Retail
Report (2009) as quoted in Indian Retail Time
to Change Lanes by KPMG private label brands
constitute 10-12 of organized retail in India
Retailers had taken all the steps to enhance the
image of store brands They had repositioned
the private labels in such a way that they
occupy their own identity in competitive
market
Store image is the set of consumer perceptions
of a store based on different attributes
including service selection convenience store
atmosphere and quality Bloemer amp Ruyter
(1997) Store image refers to a consumers
global impression of a retail store Store image
offers recognition familiarity confidence and
other associations that make it easier for
consumers to make the decision to try the
product
In this situation it has become important to
build strong brand image among customers
Reda (2002) Collins-Dodd and Lindley (2003)
and Dhar and Hoch (1997) stated that store
image influences the private labelsrsquo brand
image Positive store image is a key asset for
retailers to achieve and sustain success in an
Dr Sonal Gupta is Associate Professor at Sanghvi
Innovative Academy Devi Ahilya Vishwavidyalaya
Indore India
(email sonalgupta519gmailcom)
Dr Rajendra Jain is Professor and Director of
Govindram Seksaria Institute of Management and
Research Devi Ahilya VishwavidyalayaIndore India
Varun Parmal is Assistant Professor at Sanghvi
Innovative Academy Devi Ahilya Vishwavidyalaya
Indore India
4 STUDY OF IMPACT OF BRAND IMAGE OF RETAILERS ON CUSTOMERS BUYING DECISION OF STORE BRANDS
Copyright copy2014 by International Journal of Sales Retailing and Marketing Vol 3 No 1 2014
increasingly competitive marketplace (Grewal
et al 1998) According to Livesey and Lennon
(1978) possible reasons for perception
differences are experience with store brands
heterogeneous response to marketing
activities different product needs perceived
risk and category importance among
consumers
Building a strong and successful store brand is
one of the important challenges in front of
retailers Consumers buying behaviors are
considerably influenced by the image of retailer
for buying store brands In this regard in the
current study role of brand image of retailer on
buying decision of customers is examined
Rationale
As more and more organized retail chains are
emerging in Indian market each every retailer
is trying to build up their image in the market
With the growth of these chains acceptance of
store brands is also increased in the market In
this scenario image of retailer creates an impact
on store brands There are very limited
researches available regarding store brands in
India The current researches on private labels
are conducted mostly in countries where store
brands are well established Most of the
researches conducted on corporate image and
customerrsquos decision of buying national brands
but there is dearth in researches on image of
retailer and store brands In response to the
concerns raised above this study is undertaken
to understand the influence of retailersrsquo brand
image on customer decision of buying store
brands This study will open the doors for the
new research area and will also help the
retailers to successfully develop an effective
strategy for store brands
Objectives
1 To study the role of brand image of
retailer on customersrsquo buying decision
of store brands
2 To study the affect of brand image of
retailer on perceived quality of store
brands
3 To study the affect of brand image of
retailer on perceived risk in buying
store brands
Hypotheses
H01 Brand image of retailer do not play any
significant role on customersrsquo buying
decision of store brands
H02 Brand image of retailer do not have
significant affect on the perceived quality of
store brands
H03 Brand image of retailer do not have
significant affect on the perceived risk in
buying store brands
LITERATURE REVIEW
Private Labels have long been considered an
important aspect of the retail industry both as
a strategic tool for retailers and a unique source
of competition for manufacturers (Batra and
Sinha 2000 Bellizzi et al 1981) Retailersrsquo
Brand also play a major role in improving stores
profitability (Ailawadi and Harlam 2004) their
differentiation strategy toward competing
stores (Davies 1990) as well as their consumer
attraction and loyalty-building capacity
(Corstjens and Lal 2000) Moreover a
consumer who is loyal to a retailer brand will
have a more favorable perception of the overall
retailer brand (de Wulf et al 2005) Consumers
who are loyal to a specific retailer brand are
likely to be more loyal to the store (Uncles and
Ellis 1989 Steenkamp and Dekimpe 1997)
Collins-Dodd and Lindley (2003) stated that the
store brands are seen as extensions of the store
image and can therefore contribute to store
differentiation in the minds of consumers
Results showed that store brands were rated
most highly by those who shopped most at
each store which may be explained by greater
experience or familiarity Bao et al (2010)
5 STUDY OF IMPACT OF BRAND IMAGE OF RETAILERS ON CUSTOMERS BUYING DECISION OF STORE BRANDS
Copyright copy2014 by International Journal of Sales Retailing and Marketing Vol 3 No 1 2014
focused on the role of intangible extrinsic cues
including store image product signatureness
and quality variation in a product category
Study suggested that private brands of different
stores are differentiated on store images and
exhibit differential quality perception and
purchase intention Richardson Dick and Jain
(1994) demonstrated the role of store
aesthetics in the formation of perceptions of
store brand quality Results showed that store
aesthetics can increase the evaluation of the
quality of store brands Martenson (2007)
showed ldquoStore as a Brandrdquo that is how retailers
perform their job is more important than that
the store offers store brands for customer
satisfaction It was found that customers are
satisfied when the store is neat and pleasant
and when they feel that the store understands
their needs Narasimhan and Wilcox (1998)
suggested that private labels not supported by
consumer advertising by the manufacturers of
these products can be supported by in-store
merchandising by the retailers Vahie and
Paswan (2006) focused on the relationship
between perceived private label brand (PLB)
image and perceived store image (SI) and
feeling associated with the presence of national
brand (NB) Two factors SI-quality and NBSI
national brand and store image (NBSI)-
congruence influence both the quality and
affective dimensions of consumer perception of
private label brand
Dick Jain and Richardson (1995) documented
perceived risk as an important factor in store
brand purchasing behavior Dunn Murphy and
Skelly (1986) found that consumers regard
private label brands as most risky on
performance measures compared to national
brands Researchers suggested that private
label brands are least risky on financial
measures however social risk is less important
for supermarket products generally Liljander et
al (2009) suggested that store image mitigate
the perceived psychosocial risk Both
dimensions of store image atmosphere and
quality negatively affect consumersrsquo perceived
risk Six main risk dimensions have been
proposed to explain consumersrsquo choice
behavior performance financial social
psychological and physical risk Jacoby and
Kaplan (1972) as well as time or convenience
risk Erdem Zhao and Valenzuela (2004) found
that in countries such as the UK private label
brands share is affected by greater risk reduced
price-quality evaluations and lower brand
loyalty
dAstous and Saint-Louis (2005) stated that
consumer evaluations of store brands and
national brands were influenced by the joint
effects of store image and intended usage
situation It was found that consumer
preferences for branded garments result from
the interplay of store image and purchase
motivation Porter and Claycomb (1997)
investigated the relationship between brand
characteristics - awareness level and image and
their influence on consumersrsquo perceptions of
retail image They proposed a model of
relationships between the number of
recognizable brands carried by a retail
establishment the presence or absence of an
anchor brand and perceptions of retail image
Findings indicated that brand image did
significantly influence overall retail store image
Binninger (2008) analyzed that the
improvement of consumer satisfaction with
some particular retailer brands has an impact
on building loyalty to those brands The results
showed that the increase in retailer brands
satisfaction and loyalty influences store loyalty
and that attitude toward retailer brands
products has a moderating effect on the
relationships between retailer brands
satisfaction and loyalty De Wulf Odekerken-
Schroder Goedertier and Van Ossel (2005)
found that for three out of four store brands
brand equity is present when consumers are
loyal to the store carrying the store brand It
was observed that retailers engage much more
6 STUDY OF IMPACT OF BRAND IMAGE OF RETAILERS ON CUSTOMERS BUYING DECISION OF STORE BRANDS
Copyright copy2014 by International Journal of Sales Retailing and Marketing Vol 3 No 1 2014
in experience marketing in comparison to
manufacturers who rely on traditional mass
media Study indicated that private label is part
of the total store experience and helps to build
the store brand
RESEARCH METHODOLOGY
The methodology for the study is quantitative in
nature The present research was carried out
through mall intercept interviews at selected
retail chains in Madhya Pradesh A non-
probability convenience sampling technique
was used to administer a consumer survey A
total of 150 questionnaires were administered
responses to 135 were received Out of the
collected 135 questionnaires 100 were found
to be fit for analysis
Data were collected with the help of structured
questionnaire as a research instrument
Questionnaire was based on 5 point likert scale
anchored between Strongly Disagree to
Strongly Agree
Reliability and validity test
Split half reliability was calculated to check the
reliability and found to be 76 which is high
Validity is checked by face validity and content
validity by the help of experts
Data analysis
1 Role of brand image of retailer in buying
decision of customers for store brands
The first objective of the study was to study the
role of brand image of retailer on buying
decision of customers For this Chi Square test
was applied the results are given in the Table
No1
Table No 1 Chi-Square for role of brand image of retailer on customersrsquo buying decision of
store brands
(a) 0 cells (0) have expected frequencies less than 5 The minimum expected cell frequency is
200
This table shows the test statistics all the
significance values are smaller than 005 at
001 level of significance with 4 degree of
freedom therefore the null hypothesis (H01)
ie Brand image of retailer do not play any
significant role on customersrsquo buying
decision of store brands is rejected Hence it
is concluded that brand image of retailersrsquo
plays significant role in purchase decision of
customers
1 Affect of brand image of retailer on
perceived quality of store brands
The second objective of the study was to study
the affect of brand image of retailer on
perceived quality of store brands For this Chi-
Square test was applied The results are given in
Table No2
I consider the
brand of retailer
before buying
store brands
I buy store
brands only from
retailers having
strong image in
the market
I am more
familiar with
store brands of
retailers who
has strong
branding
Strong brand
image of
retailer
increases my
intention of
buying store
brand
I would be
willing to pay a
higher price for
the private label
of retailers
having strong
image in market
Chi-Square(a) 20500 19800 27900 10000 14800
Df 4 4 4 4 4
Sig 000 001 000 040 005
7 STUDY OF IMPACT OF BRAND IMAGE OF RETAILERS ON CUSTOMERS BUYING DECISION OF STORE BRANDS
Copyright copy2014 by International Journal of Sales Retailing and Marketing Vol 3 No 1 2014
Table No 2 Chi-Square for affect of brand image of retailer on perceived quality of store
brands
Strong brand
image of
retailers
convince me
that store brand
is of good quality
Strong brand
image of
retailers
increase my
satisfaction level
about quality of
store brand
Retailer with
strong brand
image have
more variety of
store brands
Strong brand
image of
retailers
increases trust in
performance of
store brands
Store brands of
Retailers with
strong brand
gives value for
money
Chi-Square(a) 16400 19200 20500 21200 20000
Df 4 4 4 4 4
Sig 003 001 000 000 000
(a) 0 cells (0) have expected frequencies less than 5 The minimum expected cell frequency is
200
This table shows the test statistics all the
significance values are smaller than 005 at
001 level of significance with 4 degree of
freedom therefore the null hypothesis (H02)
ie Brand image of retailer do not have
significant affect on the perceived quality of
store brands is rejected Hence it is
concluded that brand image of retailers have
significant affect on perceived quality of
store brands
2 Affect of brand image of retailer on
perceived risk in buying store brands
The third objective of the study was to
study to study the affect of brand
image of retailer on perceived risk in
buying store brands For this Chi-
square test was applied The results
are given in Table No3
Table No 3 Chi-Square for affect of brand image of retailer on perceived risk in buying store
brands
Putting
money in
buying
store
brands of
retailers
with
strong
image is
worthy for
me
Store brands of
retailers with
strong band
image reduces
the risk of
financial loss in
buying the store
brand
Strong brand
image of
retailer
increases the
image of store
brand
Strong brand image of
retailer reduces the
risk of buying store
brand
Store brands of
retailers with
strong brand
image gives me
psychological
satisfaction of
buying it
I find buying store
brands of retailers
having strong image
in market is reflects
my image in society
Better After sales service
is provided with store
brands of retailers
having strong image in
the market
Chi-
Square(a) 28400 35400 9700 11900 20500 21700 20900
Df 4 4 4 4 4 4 4
Sig 000 000 046 018 000 000 000
(a) 0 cells (0) have expected frequencies less than 5 The minimum expected cell frequency is
200
The above table shows the test statistics all the
significance values are smaller than 005 at 001
level of significance with 4 degree of freedom
therefore the null hypothesis (H03) ie Brand
image of retailer do not have significant affect
8 STUDY OF IMPACT OF BRAND IMAGE OF RETAILERS ON CUSTOMERS BUYING DECISION OF STORE BRANDS
Copyright copy2014 by International Journal of Sales Retailing and Marketing Vol 3 No 1 2014
on the perceived risk in buying store brands is
rejected Hence it is concluded that brand
image of retailer have significant affect on
perceived risk in buying store brands
DISCUSSIONS AND CONCLUSION
Several studies demonstrate that retail store
image affects consumer product judgments and
responses in a positive manner Richardson et
al (1996) showed that if the store has an
attractive store atmosphere quality rating of
store brands increased by 21 percent Presents
research shows similarity in terms of how
retailersrsquo image create an impact on customersrsquo
buying decision of store brands with Collins-
Dodd and Lindley (2003) who stated that store
image influence specific store brand evaluations
and store brands are seen as extensions of the
store image and can therefore contribute to
store differentiation in the minds of consumers
and also with the work of Martenson (2007)
who suggested that there is a reciprocal
influence between store image and individual
store brand image the influence is stronger
from the store to the brand than in the
opposite direction In other words when
consumers have tried the store brand their
opinion about it will have a potential influence
on the store image but it is more likely that the
image of the store already influenced
consumers willingness to try the brand
Liljander et al (2009) suggested that store
image mitigate the perceived psychosocial risk
Both dimensions of store image atmosphere
and quality negatively affect consumersrsquo
perceived risk It was found that each
dimension of the store image affected different
dimensions of risk Present study also supports
these findings by suggesting that brand image
of retailer plays significant role on perceived
risk in buying store brands
Present study also reveals that store image
plays significant role on perceived quality of
store brands These findings are consistent with
the results of Vahie and Paswan (2006)
indicated that the store atmosphere and store
quality positively influence the perception of
private label brands quality and also with the
study of Semeijn et al (2004) who suggested
that the store image acts as an important
indicator of store brand quality
Implications
As private labels have become strategic tools to
create differentiation and increase the footfalls
this study will have important strategic
implications for retailers The findings of this
study will bring their focus on store image and
its impact on customers buying decisions of
store brands This study gives valuable insights
towards perceived quality and perceived risk of
store brands Retailers should put efforts to
chalk out effective strategy for improving their
brand image for the success of store brands
Scope and limitations
Since the scope of present study is limited to
Madhya Pradesh one of the states of India it
can be carried out at national and international
level The scope of present study can further be
expanded in the context of different
geographic demographic and socio-cultural
variables which could not be included in the
present study By considering the present
research as a base further research on private
labels can be carried out for studying the
impact of store image of a specific retail chain
on its store brands Retailers marketing
activities are increasing with the growth of
store brands and they are launching new store
brands in new categories Due to this research
can be extended to find out the best
management practices which should be
adopted by retailers for making their store
brands successful in the market
REFERENCES
ACNielsen (2005) The Power of Private Label
2005 A Review of Growth Trends around the
9 STUDY OF IMPACT OF BRAND IMAGE OF RETAILERS ON CUSTOMERS BUYING DECISION OF STORE BRANDS
Copyright copy2014 by International Journal of Sales Retailing and Marketing Vol 3 No 1 2014
World accessed June 2008 retrieved from
httpwww2acnielsencomreportsdocument
s2005_privatelabelpdf
Ailawadi K L amp Harlam B (2004) An Empirical
Analysis of the Determinants of Retail Margins
The Role of Store-Brand Share Journal of
Marketing 68 (January 2004) 147-165
Batra R amp Sinha I (2000) Consumer-level
factors moderating the success of private label
brands Journal of Retailing 76 175-191
Bao Y et al (2010) Motivating purchase of
private brands Effects of store image product
signatureness and quality variation Journal of
Business Research Article in Press
Bellizzi JA Kruckeberg HF Hamilton JR amp
Martin WS (1981) Consumer perceptions of
national private and generic brands Journal of
Retailing 57(4) 56-70
Binninger AS (2008) Exploring the
relationships between retail brands and
consumer store loyalty Journal of Product amp
Brand Management 36(2) 94-110
Bloemer J and Ruyter KD (1998) On the
Relationship between Store Image Store
Satisfaction and Store Loyalty European Journal
of Marketing 32 (56) 499-513
Corstjens M amp Lal R (2000)Building store
loyalty through store brands Journal of
Marketing Research 37 281-291
Collins-Dodd C amp Lindley T (2003) Store
brands and retail differentiation the influence
of store image and store brand attitude on
store own brand perceptions Journal of
Retailing and Consumer Services 10(6) 345-
353
dAstous A amp Saint-Louis O (2005) National
versus store brand effects on consumer
evaluation of a garment Journal of Fashion
Marketing and Management 9(3) 306-317
Davies G (1990) Marketing to retailers a
battle for distribution Long Range Planning
23(6) 101-108
De Wulf K Odekerken-Schroder G
Goedertier F amp Van Ossel G (2005)
Consumer perceptions of store brands versus
national brands Journal of Consumer
Marketing 22(4) 223-232
Dhar SK amp Hoch SJ (1997) Why
store brand penetration varies by retailer
Marketing Science 16(3) 208-227
Dick A Jain A amp Richardson P (1995)
Correlates of store brand proneness some
empirical observations Journal of Product amp
Brand Management 4 (4) 15-22
Dunn MG Murphy PE amp Skelly GU (1986)
Research note the influence of perceived risk
on brand preference for supermarket products
Journal of Retailing 62 (2) 204-216
Erdem T Zhao Y amp Valenzuela A (2004)
Performance of store brands a cross-country
analysis of consumer store-brand preferences
perceptions and risk Journal of Marketing
Research 41(1) 86-100
Grewal D Baker J Krishnan R amp Borin N
(1998) The effect of store name brand name
and price discounts on consumersrsquo evaluations
and purchase intentions Journal of Retailing
174(23) 331-352
Images Retail Report (2009) Indian Retail
quoted in Indian Retail Time to Change Lanes
by KPMG accessed March 2010 retrieved
from
httpwwwkpmgcomCNenIssuesAndInsight
sArticlesPublicationsDocumentsindian_retail
_O_0904pdf
Jacoby J amp Kaplan L (1972) The components
of perceived risk Advances in Consumer
Research 1(1) 519-532
Liljander V etal (2009) Modelling consumer
responses to an apparel store brand Store
image as a risk reducer Journal of Retailing and
Consumer Services 16 (4) 281-290
Livesey F amp Lennon P (1978) Factors
affecting consumersrsquo choice between
manufacturer brands and retailer own labels
European Journal of Marketing 12 (2) 158-170
Martenson R (2007) Study of the store as a
brand store brands and manufacturer brands
International Journal of Retail amp Distribution
Management 35 (7) 544-555
10 STUDY OF IMPACT OF BRAND IMAGE OF RETAILERS ON CUSTOMERS BUYING DECISION OF STORE BRANDS
Copyright copy2014 by International Journal of Sales Retailing and Marketing Vol 3 No 1 2014
Narasimhan C amp Wilcox RT (1998) Private
labels and the channel relationship a cross-
category analysis The Journal of Business 71
(4) 573-600
Porter SS amp Claycomb C (1997) The
influence of brand recognition on retail store
image Journal of Product amp Brand
Management 6(6) 373-387
Reda S (2002) Department stores struggle to
reinvent troubled model Stores 84(7) 22
Richardson PS Dick AS amp Jain AK (1994)
Extrinsic and intrinsic cue effects on perceptions
of store brand quality Journal of Marketing
58(4) 28-36
Richardson PS Jain AK amp Dick AS (1996)
Household store brand proneness a
framework Journal of Retailing 72 (2) 159-
185
Semeijn van Rielb J A CR and Ambrosini A
B (2004) ldquoConsumer evaluations of store
brandseffects of store image and product
attributesrdquo Journal of Retailing and Consumer
Services 11 pp 247ndash258
Steenkamp JBEM amp Dekimpe MG (1997)
The increasing power of store brands building
loyalty and market share Long Range Planning
30 (6) 917-930
Uncles MD amp Ellis K (1989) The buying of
own-labels European Journal of Marketing 23
(3) 57-70
Vahie A amp Paswan A (2006) Private label
brand image its relationship with store image
and national brand International Journal of
Retail amp Distribution Management 34(1) 67-
84
11 IMPACT OF RETAIL STORE CHARACTERISTICS ON CONSUMER PURCHASE INTENTION
Copyright copy2014 by International Journal of Sales Retailing and Marketing Vol 3 No 1 2014
Hafiz Ihsan-ur-Rehman Muhammad Ashar Bakhtawar Javed Mayda Khalid amp Rabia Nawaz Department of Business Administration University of The Punjab Gujranwala Campus
IMPACT OF RETAIL STORE CHARACTERISTICS ON
CONSUMER PURCHASE INTENTION
Hafiz Ihsan-ur-Rehman Muhammad Ashar Bakhtawar Javed Mayda Khalid amp Rabia Nawaz
Abstract
Global retailers considering the Asian market as a most attractive play field for gaining profit
Through communication networks and mass media global corporate culture has been brought and
influencing the consumerrsquos habits by changing their life style and purchasing patterns The purpose of
this study is to investigate the extent to which store characteristics product assortment store
atmosphere location and Purchase intention would influence the Pakistani consumerrsquos store choice
To analyze the factors that influence consumerrsquos Purchase intention 200 questionnaires were
distributed among the general public out of which One hundred and eighty surveys were received
This study would help the retailers to increase their market share and profitability by providing
desirable store environment to their customers Retailers can use these store attributes to maintain
their existing customers and to attract new customers
INTRODUCTION
Global retailers have been consolidated and
strengthening their roots day by day in
developing countries and trying to improving
their operational performance for gaining
sustainable growth in Asian markets As Asian
markets have become most attractive play field
for global giants due to increase in purchasing
power of customers
The importance of the retailing is seldom
subject to work on it especially in developing
countries like Pakistan Through
communication networks and mass media
global corporate culture has been brought and
influencing the consumerrsquos habits by changing
their life style and purchasing patterns This
study finds out and analyzes the different
aspects of retail store which influence the
consumerrsquos purchase intention towards store
choice Those aspects are product assortment
store atmosphere location and purchase
intention
Product assortment means the availability of
merchandise under one roof which enables the
customer to avail the great width of different
global and local products and as well as provide
one stop shopping experience Store
atmospherics includes store design lighting
music wide aisle and odor All these
characteristics will generate a positive
assessment of the store
Store location has a deep effect on the
consumerrsquos retail store choice A most favorable
store-site can affect different demographic
factors such as age income gender and family
size For getting the competitive advantage
retailers must consider the distance that
customerrsquos willing to travel for shopping at the
store
Purchase intention is customer willingness to
make a purchase of a specific product or
service which can be influenced by product
assortment Store atmosphere and location
The purpose of this study is to investigate the
12 IMPACT OF RETAIL STORE CHARACTERISTICS ON CONSUMER PURCHASE INTENTION
Copyright copy2014 by International Journal of Sales Retailing and Marketing Vol 3 No 1 2014
extent to which these characteristics would
influence the Pakistani consumerrsquos store choice
LITERATURE REVIEW
Product Assortment
Now a day it is commonly said theory that most
of the customers like and have a preference to
large assortments and a large range of
products The likelihood of the selection of a
store typically and largely depends on store
size and its assortment size and is inversely
dependent on distance from home said in the
foundational theory of store choice (Reilly 1931
Huff 1964 see Hubbard 1978 and Brown1989
for reviews of this work Baumol and Idle 1956
makes a similar argument) Among all the store
image attributes only product assortment and
price place great variances in choices said by
Finn and Louviere (1996)
Availability of great breadth of different
products offered by a store has a great amount
of impact on consumerrsquos perception about
store and retail image Because availability
under one roof enables customer to avail many
advantages First the great the width of the
range the greater the number of different
situations under which a retailer is recalled and
is considered by the consumer as noted by the
Keller (2003) Secondly the one stop shopping
convenience that a broad product range
enables more important than ever for
consumers with limited time today (Messinger
and Narasimhan 1997) increasing pressures on
retailers to broaden their range
Also the depth of the retail assortment affects
so much on consumer store choice Variety
seeking consumers will perceive greater
convenience as the perceived assortment of
brands flavors and sizes increases (McAlister
and Pessemier 1982 Kahn and Wansink 2004)
consumers will believe they have more
elasticity in their choices who have vague future
preferences (Kahn and Lehmann 1991) and
there are more chances that those consumers
locate the item they desire Private brand
assortment is very much popular in many stores
also with manufacturesrsquo brand A motivation for
offering private labels is the highest percent
margins (Hoch and Banerji 1993) and second
the implicit assumption that providing a private
label brand generates loyalty to the
store(Steenkamp and Dekimpe 1997) Baumol
and Ide (1956) and Brown (1978) observed that
stores which offer more product assortment
for those consumers are willing to travel farther
to those stores than those which offer low
assortment Assortment is multidimensional ndash
Broniarczyk Hoyer and McAlister (1998)
determined that three factors affect
consumersrsquo perceptions of assortment in a
categorymdashthe amount of shelf space devoted
to the category and the number of SKUs and
the availability of the consumerrsquos favorite item
(note that the terms ldquoitemrdquo ldquoproductrdquo and
ldquoSKUsrdquo will be used interchangeably)
Hoch Bradlow and Wansink (1999) determined
that product attributes affect consumersrsquo
perceptions of an assortment Also in another
study it is examined that product attributes
style colors and SKUrsquos is counted in product
assortment (TerryJ) However the number of
brands and sizes are attributes that can be
applied sparingly across categories (Boatwright
and Nunes 2001) Here in this research we have
chosen following measures of category 1
Number of brands offered 2 Number of sizes
per brand 3 Style and colors 4 Availability of a
householdrsquos favorite brands 5 Private brand 6
Number of stock-keeping units projected
There has also been suggested that shoppers
can feel comfortable and feel extra activity
when you see a wide range and variety of items
and goods (Kahn Moore and Glazer 1987 see
also Broniarczyk Hoyer and McAlister 1998)
And finally large assortment also help shopper
and to increase sale and give surety of sale that
by seeing large assortment and a big range of
products shopper might prefer to purchase
from that store by minimizing the ambiguity of
that available assortment is not good enough
for selection and large assortment also
13 IMPACT OF RETAIL STORE CHARACTERISTICS ON CONSUMER PURCHASE INTENTION
Copyright copy2014 by International Journal of Sales Retailing and Marketing Vol 3 No 1 2014
eliminate the thinking of shopper that available
assortment is not envoy of all good brands or
products and might be another store have more
good variety of products available and shopper
think that heshe should go to other stores also
(Greenleaf and Lehmann 1995 Karni and
Schwartz 1977)
But there are some factors which favor in
reduced or decreased assortment It is the
limited space in the store As if we are saying
that increased assortment increase our sale but
it is constrained here that every retailer is
unable to increase store space and shelf space
As shelf space is limited and it increases the
chances of not as good product visibility as in
limited edition of goods This factor argues on
limited occupancy of the shelf by keeping
sufficient number of stock keeping units So
finally it is concluded that consumers and
competitors leads us to increase assortment but
shelf and store space leads us to reduce
product assortment(Cadenat 2003)
Atmosphere
For a very competitive market retailers can not
benefit from price product distribution and
promotion So retailers set it apart from others
through special characteristics of retail stores
As consumers buy instant action can be
affected by the environment kept Previous
studies focused solely on music and lighting
elements but this particular study many
aspects of store environment The results show
that the store staff and store design can
influence the shopping mood not music It is
also possible satisfaction affected by emotions
of shopping through mediating role of
consumption behavior Consumer experience of
positive emotions in the shop will generate a
positive assessment of the stock (Liao Liaw amp
Jen)
Some studies reveal that retail store music
experience stimulates the consumption level in
terms of behavioral cognitive and emotional
reactions visibility and attitude the money and
spending time in the shop as well The
consumer profile the profile store market
timing and environmental cues moderate the
impact of music on purchasing behavior (Jain amp
Bagdare 2011)
Slow-tempo music perceive positive service
quality and low arousing cues have mediating
effects on consumerrsquos perception but fast
tempo music and high arousing cues have
indirect effect on consumer perception (Michon
amp Chebat 2006)This study investigated the
effect of store atmosphere on consumer
expectations about the quality of products and
store image as a mediator either web-based
shop or a brick and mortar store Findings
support previous studies which have shown
that consumer purchase intentions can be
affected by store image and consumer
expectations (Oh Fiorito Cho amp Hofacker
2007)
Retail stores must utilize unproductive area by
providing wide aisle which facilitate the
movement of customers throughout the store
Aisle deign would influence the pattern of
traffic flow towards the merchandising Lighting
consider as a mood setter tool It can be bright
and soft lights which flow throughout the
display area Retailers use these sophisticated
lights at regular interval for the sake of
customer attention For various behaviour and
situations lighting preferences varies individual
to individual (Butler amp Biner 1987) As compare
to bright lighting soft light create more
pleasant and soothing mood (Meer 1985)
Research suggests that home Interior decor
express the self concept and social status
(Lauman amp House 1973) (Jin 1990 Joy amp
Dholakia 1991 Lauman amp House 1973)
(Sadalla Veshure amp Burroughs 1987) Likewise
stores have self image and personality
(Martineau 1958) and it can be communicated
to the customers through store interior
designing Greenberg Sherman ampShiffman
1983 Rich amp Portis 1964)(Greenberg et al
1983 Kotler 1973 ) Pleasant environmental
14 IMPACT OF RETAIL STORE CHARACTERISTICS ON CONSUMER PURCHASE INTENTION
Copyright copy2014 by International Journal of Sales Retailing and Marketing Vol 3 No 1 2014
odor had positive effect on evaluations of in
store atmosphere available merchandising and
intend the customers to visit the store again
and again (Sprangenberg et al 1996) Results
indicate that fragranced store display generates
the most positive responses and pleasurable
experiences (Fiore Yah amp Yoh 2000)
Location
Retail location analysis helps in site selection for
a business outlet and in shaping the
performance of retail outlets in the trade area
of the store Selection of store location is a
long-term decision which requires a long-term
capital dedication in this context store location
is considered one of the most important
element in retail marketing strategy(Zentes
morschett amp schramm) The choice of a store
location has a deep effect on the entire
business of a retail operation For selecting a
most favorable store-site it is important to
consider the demographic factors of that area
including age income traffic patterns family
size competition and related kind of retail
outlets
This study has discussed Geographic
information system which is being utilized now
a day for analyzing the structure of retail
activities with location data Geographic
information system include Decision Support
Systems and Gravity Model(Byrom Retail
Location AnalysisA Case Study of Burger King amp
McDonaldrsquos in Portage amp Summit Counties
Ohio 2005)Geographic information system
collect and transform the several databases into
a common set of database (Pettit 1999) For
analyzing and mapping spatial data such as
transport networks retail location analysis
land-use patterns and opinion poll data
Geographic information system is the most
extensively used software now
Three key factors such as distance traveled to
get to the store size of the store and the retail
image of the store based on its products easy
accessibility visibility parking are used in
Gravity Model (Mercurio 1984)For getting the
competitive advantage for retailers Decision
support systems is also becoming a significant
source
While selecting a location an important factor
which must be considered is examining the
distance that a customer has to travel The
distances which customers want to travel are
depend upon the type of product to be
purchased On the base of specialty or
commodity product number of the trips made
by consumers and the travel time will be
different (Salvaneschi 1996)
Purchase Intention
Purchase intention of the consumer depends on
the store characteristic like location
assortment and atmosphere of a particular
brand It can be defined as
ldquoA purchase intention is customer willingness to
make a purchase of a specific product or
servicerdquo
Purchase intention of the customers consists on
the following steps
First step is Problem identification than search
out the information about the problem
evaluating the alternatives finally customer
make a purchase on these basis Post-purchase
behavior develops through these steps(Engel et
all 1995)Sometimes consumers buy the
product in store that is more attractive and
make a decision on the spot The intention of
purchasing the consumer may be impulse
buying or partially pre-programmed and can be
fully pre-planned
In impulse buying behavior of consumers to
make the decision and make an instant
purchase of the product that is more attractive
to him partly in pre-planned the consumer to
choose the product type and model but choose
the brand in the store and completely pre-
planned for an existing customer to choose the
product and the brand he will buy (Engel JF
Blackwell 1995)
15 IMPACT OF RETAIL STORE CHARACTERISTICS ON CONSUMER PURCHASE INTENTION
Copyright copy2014 by International Journal of Sales Retailing and Marketing Vol 3 No 1 2014
Consumer sentiment and the situation may
affect their impulsive purchase intent
Consumer sentiment include the personal taste
of the situation and express that impulse
purchase intent of consumers differ due to
variation in a situation such as prices increase
more than customer expectations (Kotler
2003) Brand awareness consumer perception
and brand association has a significant impact
on purchase intent (Shwu-Ing Wu and Chen-
Lien Lo 2009)Brand awareness increase brand
loyalty consumer confidence and purchases
intent for the consumer (Aaker D 1990)
Hypothesi
H1 Product assortment has strong significant
impact on purchase intention
H2 location has strong significant impact on
purchase intention
H3 store atmosphere has significant impact on
purchase intention
METHODOLOGY
To analyze and conclude the effects of product
assortment store atmosphere and location on
purchase intention Data is collected from the
retail store customers of Pakistan with
convenient random sampling technique The
target population of this study was all the retail
store customers 200 questionnaires were
distributed out of 180 complete questionnaire
were received to analyze the data These
questionnaires were got filled from retail store
customers of Gujranwala Gujrat and
Wazirabad A measuring instrument as closed
questionnaire was developed with the aim of
collecting data Questionnaire was classified
into two main sections first one Demographic
and another section was subjective
Demographic Section
Demographic section of this questionnaire
information about the employeersquos Gender Age
Marital Status education and city Total
respondent were 180 out of that 20were male
and female respondents were 160 in numbers
while the age of majority of retail store
customers were in the range of 20-24 years and
their frequency was 114 In marital status of the
retail store customers was 9 were married rest
of the customers were single Analysis of
Educational status shows that 163 are Graduate
and 17 persons are of intermediate level Most
of the respondents belong to Gujranwala city
and
Table 1 Pearsonrsquos moment correlation N=150
Correlation is significant at the 001 level (2-tailed)
Variables
Mean
Std
Deviation
Alpha
1
2
3
4
Product assortment
Store atmosphere
Location
Purchase intention
28944
40213
39370
40426
4329
7329
5946
5549
887
881
885
890
1
631
570
337
504
156
580
1
16 IMPACT OF RETAIL STORE CHARACTERISTICS ON CONSUMER PURCHASE INTENTION
Copyright copy2014 by International Journal of Sales Retailing and Marketing Vol 3 No 1 2014
Table 2
Table3
Table4
Model Summaryb
608a 370 360 44409 2064
Model
1
R R Square
Adjusted
R Square
Std Error of
the Est imate
Durbin-
Watson
Predictors (Constant) Location Store atmosphere Product assortmenta
Dependent Variable purchase intent ionb
ANOVAb
20407 3 6802 34491 000a
34711 176 197
55118 179
Regression
Residual
Total
Model
1
Sum of
Squares df Mean Square F Sig
Predictors (Constant) Location Store atmosphere Product assortmenta
Dependent Variable purchase intentionb
Coefficientsa
1987 253 7850 000
170 107 132 1591 113
-184 060 -243 -3069 002
585 070 627 8388 000
(Constant)
Product assortment
Store atmosphere
Location
Model
1
B Std Error
Unstandardized
Coef f icients
Beta
Standardized
Coef f icients
t Sig
Dependent Variable purchase intentiona
17 IMPACT OF RETAIL STORE CHARACTERISTICS ON CONSUMER PURCHASE INTENTION
Copyright copy2014 by International Journal of Sales Retailing and Marketing Vol 3 No 1 2014
its ratio is 160 and 15 respondents from Gujrat
and the rest of five respondents were the
inhabitants of wazirabad
Results and Discussion
To observe the impact of Product assortment
Store atmosphere and location on Purchase
intention Pearsonrsquos moment correlation was
analyzed and to test the relationship of Product
assortment Store atmosphere and location on
Purchase intention linear regression was
conducted Descriptive statistics was also
computed to analyze the tendency of the
respondents and Cronbachrsquos alpha was
measured to test the reliability of the analysis
In Table 1 Mean value of Product assortment is
2894 that shows positive tendency of the
respondents 2894 is not much close to 5 that
shows product assortment does not have
significant effect on Purchase intention While
4329 is standard Deviation that shows 43
variation among responses where as alpha is
887 that shows 89 reliability of the survey
about Product assortment of the respondents
Table 1 show that Product assortment is
strongly correlated with store atmosphere
location and purchase intention 40213 is close
to 5 that shows Store atmosphere have
significant effect on purchase intention while
7329 is standard Deviation that shows 73
variation among responses where as alpha is
881 that shows 88 reliability of the survey
about store atmosphere of the respondents
Table 1 show that store atmosphere is strongly
correlated with product assortment location
and purchase intention
Mean value of Location is 39370 that show
positive tendency of the respondents 39370 is
close to 5 that shows Location have significant
effect on Purchase intention While 594 is
standard Deviation that shows 59 variation
among responses where as alpha is 885 that
shows 89 reliability of the survey about of the
respondents Table 1 show that Location is
strongly correlated with Product assortment
Store atmosphere and purchase intention
To test the relationship of Product assortment
Store atmosphere and location on Purchase
intention linear regression is applied while to
test the normality of data and nature of
correlation Durbin Watson is also applied
Table 2 shows R = 608 which shows 60
variation in product assortment store
atmosphere and location on purchase
intention R square is the coefficient of
determination which shows that 37 total
variation with its linear relationship of Durbin
Watson test is used to test the nature of
correlation whether it is positive
autocorrelation or negative autocorrelation amp
zero autocorrelation Since the value of ldquodrdquo is
more than 2 it means there is negative
autocorrelation
Table 3 of ANOVA shows level of significance
since the value of ldquoprdquo is less than 05 so it is
accepted that product assortment store
atmosphere and location has significant effect
on purchase intention In Table 4 A = 1987 is
the average of purchase intention when
product assortment is zero whereas 170 is the
value of ldquobetardquo that shows one unit increase of
product assortment will bring 170 unit increase
in purchase intention
Purchase intention = 1987+
170(product assortment)
Above linear equation shows that one percent
product assortment will bring 17 change in
purchase intention
When store atmosphere is zero whereas -184 is
the value of ldquobetardquo that shows one unit
decrease of store atmosphere will bring -18
unit decreases in purchase intention
Purchase intention = 1987 + -184 (store
atmosphere)
Above linear equation shows that one percent
store atmosphere will bring -18 change in
purchase intention When location is zero
whereas 585 is the value of ldquobetardquo that shows
one unit increase of location will bring 585 unit
increases in purchase intention
Purchase intention = 1987 + 585 (location)
18 IMPACT OF RETAIL STORE CHARACTERISTICS ON CONSUMER PURCHASE INTENTION
Copyright copy2014 by International Journal of Sales Retailing and Marketing Vol 3 No 1 2014
Above linear equation shows that one percent
location will bring 58 changes in purchase
intention
According to table 4 if tolerance value exceeds
than 5 and VIF exceed 10 then it means Co
linearity in data exist Table 4 indicates 517
571 and 641 is the tolerance value and VIF is
less than 10 that show there is no Co linearity
exist
Limitations
This research has some limitations along with
its fruitful results First our targeted areas were
limited which Gujranwala wazirabad and
gujrat Second our research was not selective to
some particular retail outlets we collected data
from general retail customers who usually do
shopping Third our survey was based on small
sample of customers Fourth Researchers can
obtain better results of this study by using other
tools and statistical methods Fifth due to time
constraint some customers did not respond
properly
Despite of these limitations this study also
provides some future directions In spite of
above mentioned store characteristics in-store
attitude and after sales services can also be
investigated to measure purchase intention
Area of study and sample size can also be
increased to attain more significant results
Shopping involvement and shopping motive can
also be investigated Third this research could
be extended to cross cultural context
Practical implication
This study would help the retailers to increase
their market share and profitability by providing
desirable store environment to their customers
By using above mentioned store characteristics
local retailers can get competitive advantage
over global retailers Retailers can use these
store attributes to maintain their existing
customers and to attract new customers
REFERENCES
Aaker D (1990) Consumer evaluations of
brand extensions Journal of Marketing 27-42
Ailawadi K L amp Keller K L (2004)
UNDERSTANDING RETAIL
BRANDINGCONCEPTUAL INSIGHTS AND
RESEARCH PRIORITIES (Vols 1-34)
Bianchi C C (2009) Investigating Consumer
Expectations of Convenience-Store Attributes in
Emerging Markets Evidence in Chile Journal of
International Consumer Marketing 309-320
Borle S Boatwright P Kadane J B Nunes J
C amp Shmueli G (2005) The Effect of Product
Assortment Changes on Customer Retention
(Vols 616ndash622) Marketing Science INFORMS
Briesch R A Chintagunta P K amp Fox E J
(2008) How Does Assortment Affect Grocery
Store Choice (Vols 1-49)
Byrom (2005) Retail Location AnalysisA Case
Study of Burger King amp McDonaldrsquos in Portage amp
Summit Counties Ohio
Cadenat A A (2003) Efficient retailer
assortment a consumer choice evaluation
perspective international journal of retail and
distribution management 486-497
CHERNEV A (2003) When More Is Less and
Less Is More The Role of Ideal Point Availability
and Assortment (Vols 170-183) JOURNAL OF
CONSUMER RESEARCH
Darley W k amp lim f s (1999) Effects of store
image and attitude toward secondhand stores
on shopping frequency and distance traveled
International Journal of Retail amp Distribution
Management 311-318
Donofrio T J Beyond Basic Product
PlanningAssortment Planning (Vols 1-2) Retail
Systems and Services
Engel et all J F (1995) Consumer behavior (
8th ed) New York Dryden Press Farr A amp
Hollis N (1997) What do you want your brand
to be when it grows up big and strong Journal
of Advertising Research 23-36
Engel J F Blackwell R D (1995) Consumer
behavior ( 8th ed) New York Dryden Press Farr
A amp Hollis N (1997) What do you want your
brand to be when it grows up big and strong
Journal of Advertising Research 23-36
Fiore A M Yah X amp Yoh E (2000) Effects
of a Product Display and Environmental
19 IMPACT OF RETAIL STORE CHARACTERISTICS ON CONSUMER PURCHASE INTENTION
Copyright copy2014 by International Journal of Sales Retailing and Marketing Vol 3 No 1 2014
Fragrancing on Approach Responses and
Pleasurable Experiences Psychology amp
Marketing 27ndash54
Ibrahim h amp Najjar F (2008) Assessing the
effects of self-congruity attitudes and customer
satisfaction on customer behavioural intentions
in retail environment Marketing Intelligence amp
Planning 207-227
Jain R amp Bagdare S (2011) Music and
consumption experience a review Emerald
Group Publishing Limited
Kotler P (2003) Marketing Management (11th
ed) New Jersey Prentice Hall
Liao Y Y Liaw G F amp Jen F How Cues in the
Multiple Store Environment Influence Shopping
Mood and Patronage Satisfaction
Mercurio (1984) Retail Location Analysis
Michon R amp Chebat J C (2006) The
Interaction Effect of Background Music and
Ambient Scent 20-38
Oh J Fiorito S S Cho H amp Hofacker C F
(2007) Effects of design factors on store image
and expectation of merchandise Journal of
Retailing and Consumer Services 1-13
Pettit P (1999) Retail Location AnalysisA Case
Study of Burger King amp McDonaldrsquos in Portage amp
Summit Counties Ohio
Salvaneschi (1996) Retail Location Analysis
Shwu-Ing Wu amp Chen-Lien Lo (2009) The
influence of core-brand attitude and consumer
perception on purchase intention towards
extended product Asia Pacific Journal of
Marketing and Logistics 174-194
SIMONSON I (1999) The Effect of Product
Assortment on Buyer (Vols 347-370) Stanford
University New York University
Zentes J morschett d amp schramm h (nd)
Store Location ndash Trading Area Analysis and Site
Selection
Darley W k amp lim f s (1999) Effects of store
image and attitude toward secondhand stores
on shopping frequency and distance traveled
International Journal of Retail amp Distribution
Management 311-318
Fiore A M Yah X amp Yoh E (2000) Effects
of a Product Display and Environmental
Fragrancing on Approach Responses and
Pleasurable Experiences Psychology amp
Marketing 27ndash54
Jain R amp Bagdare S (2011) Music and
consumption experience a review Emerald
Group Publishing Limited
Aaker D (1990) Consumer evaluations of
brand extensions Journal of Marketing 27-42
Ailawadi K L amp Keller K L (2004)
UNDERSTANDING RETAIL
BRANDINGCONCEPTUAL INSIGHTS AND
RESEARCH PRIORITIES (Vols 1-34)
Bianchi C C (2009) Investigating Consumer
Expectations of Convenience-Store Attributes in
Emerging Markets Evidence in Chile Journal of
International Consumer Marketing 309-320
Borle S Boatwright P Kadane J B Nunes J
C amp Shmueli G (2005) The Effect of Product
Assortment Changes on Customer Retention
(Vols 616ndash622) Marketing Science INFORMS
Briesch R A Chintagunta P K amp Fox E J
(2008) How Does Assortment Affect Grocery
Store Choice(Vols 1-49)
Byrom (2005)
Byrom (2005) Retail Location AnalysisA Case
Study of Burger King amp McDonaldrsquos in Portage amp
Summit Counties Ohio
Cadenat A A (2003) Efficient retailer
assortment a consumer choice evaluation
perspective international journal of retail and
distribution management 486-497
CHERNEV A (2003) When More Is Less and
Less Is More The Role of Ideal Point Availability
and Assortment (Vols 170-183) JOURNAL OF
CONSUMER RESEARCH
Darley W k amp lim f s (1999) Effects of store
image and attitude toward secondhand stores
on shopping frequency and distance traveled
International Journal of Retail amp Distribution
Management 311-318
Donofrio T J Beyond Basic Product
PlanningAssortment Planning (Vols 1-2) Retail
Systems and Services
Engel et all J F (1995) Consumer behavior (
8th ed) New York Dryden Press Farr A amp
Hollis N (1997) What do you want your brand
20 IMPACT OF RETAIL STORE CHARACTERISTICS ON CONSUMER PURCHASE INTENTION
Copyright copy2014 by International Journal of Sales Retailing and Marketing Vol 3 No 1 2014
to be when it grows up big and strong Journal
of Advertising Research 23-36
Engel J F Blackwell R D (1995) Consumer
behavior ( 8th ed) New York Dryden Press Farr
A amp Hollis N (1997) What do you want your
brand to be when it grows up big and strong
Journal of Advertising Research 23-36
Fiore A M Yah X amp Yoh E (2000) Effects
of a Product Display and Environmental
Fragrancing on Approach Responses and
Pleasurable Experiences Psychology amp
Marketing 27ndash54
Ibrahim h amp Najjar F (2008) Assessing the
effects of self-congruity attitudes and customer
satisfaction on customer behavioural intentions
in retail environment Marketing Intelligence amp
Planning 207-227
Jain R amp Bagdare S (2011) Music and
consumption experience a review Emerald
Group Publishing Limited
Kotler P (2003) Marketing Management (11th
ed) New Jersey Prentice Hall
Liao Y Y Liaw G F amp Jen F How Cues in the
Multiple Store Environment Influence Shopping
Mood and Patronage Satisfaction
Mercurio (1984) Retail Location Analysis
Michon R amp Chebat J C (2006) The
Interaction Effect of Background Music and
Ambient Scent 20-38
Oh J Fiorito S S Cho H amp Hofacker C F
(2007) Effects of design factors on store image
and expectation of merchandise Journal of
Retailing and Consumer Services 1-13
Pettit P (1999) Retail Location AnalysisA Case
Study of Burger King amp McDonaldrsquos in Portage amp
Summit Counties Ohio
Salvaneschi (1996) Retail Location Analysis
Shwu-Ing Wu amp Chen-Lien Lo (2009) The
influence of core-brand attitude and consumer
perception on purchase intention towards
extended product Asia Pacific Journal of
Marketing and Logistics 174-194
SIMONSON I (1999) The Effect of Product
Assortment on Buyer (Vols 347-370) Stanford
University New York University
Zentes J morschett d amp schramm h (nd)
Store Location ndash Trading Area Analysis and Site
Selection
21 DERIVING CUSTOMER SATISFACTION AND LOYALTY FROM ORGANIZED RETAILERrsquoS SALES PROMOTION
ACTIVITIES IN INDIA
Copyright copy2014 by International Journal of Sales Retailing and Marketing Vol 3 No 1 2014
Dr Kirti Dutta is Assistant Professor at Bharatiya Vidya Bhavanrsquos Usha and Lakshmi Mittal Institute of Management (email duttakirtiyahoocoin) Dr Swati Singh is Lecturer Bharatiya Vidya Bhavanrsquos Usha and Lakshmi Mittal Institute of Management
DERIVING CUSTOMER SATISFACTION AND LOYALTY
FROM ORGANIZED RETAILERrsquoS SALES PROMOTION
ACTIVITIES IN INDIA
Kirti Dutta amp Swati Singh
Abstract
Organized retail in India is dominated by few powerful players who are organizing sales promotion
activities at regular intervals to attract customers The paper studies this promotion activity and data
was collected from different organized retail stores of one of the major retailer ACSI ECSI models
were used for analysis Findings reveal the customers have a whole set of expectations from the store
in terms of quality of the products on sale variety on sale behavior of staff etc Increase in perceived
quality is found to impact customer satisfaction and loyalty and retailers need to identify strategies
around the same
Keywords ACSI Promotions management retail management customer satisfaction customer
loyalty
INTRODUCTION
The retail sector in India has seen considerable
growth over the years as a result it has
attracted players from across the globe This
growth has been fuelled by higher income
levels favorable demographics and government
policies The Indian retail sector comprises of
both organized and unorganized players with
the unorganized sector commanding 96 share
of retail sales (Economic Times 2012)
Indiarsquos retail sector is likely to touch US$ 833
billion by the year 2013 amp record US$ 13 trillion
by 2018 with compound annual growth rate
(CAGR) of 10 Retailing both organized and
unorganized contributes almost 10 of Indiarsquos
GDP and employs almost 8 of Indiarsquos
employable population (Research amp Markets
2011) The last couple of years however have
seen retailers reeling under recessionary
pressures While many retailers downed
shutters others stalled expansion plans or shut
down non-viable stores Although conditions
began improving from the year 2010 retailers
realized that they need strong consumer
insights to survive in the long run
AC Nielsons Shoppers Trends study found that
shoppers increasingly prefer to shop at
supermarts and hypermarts for FMCG and
groceries while fresh fruits and vegetables are
still sought locally for freshness With increased
exposure to retail formats consumers are
becoming less flirtatious this being evidenced
by the store loyalty parameter which fell from
242 stores visited month in 2009 to 079 now
(Marketing Whitebook- 2011-12)
Sales promotions associated with manufactures
earlier have now become a forte of retailers
too Future Group was the first to launch a
number of promotions across its Big Bazaar
stores The promotion ldquoSabse saste 5 din
22 DERIVING CUSTOMER SATISFACTION AND LOYALTY FROM ORGANIZED RETAILERrsquoS SALES PROMOTION
ACTIVITIES IN INDIA
Copyright copy2014 by International Journal of Sales Retailing and Marketing Vol 3 No 1 2014
ldquodebuted on January 26th 2007 at Big Bazaar
outletsbecame an instant success and was
made a regular event Frequency of the sales
promotions was increased to include the week
around Independence Day followed by ldquoPublic
Holiday Salerdquo at all its Big Bazaar stores across
the country from April 28 to May 1(PawarT-
2012) The ldquoSabse saste 5 dinrdquo in January (from
23-29 January) 2012 saw Future Group report
national combined retail sales of Rs650 crores
which was 25-30 higher than the previous
year Taking a cue from Future Group all major
retailers launched equally innovative sales
promotion offers The Independence Day week
in 2012 saw retailers trying to outdo each other
with price challenges deep discounts and
lucrative offers Reliance Retail came out with
the 10-day lsquoPrice Challengersquo at its Reliance
Fresh Super and Mart stores Bhartirsquos Easy Day
went a step further with its 18-day lsquoFreedom
from inflationrsquo while Future Group retaliated
with a 6 day ldquoMahaBachatrdquo sale at its Big Bazaar
outlets (Kamath R 2012) Nielson study has
revealed that this definitive move towards sales
promotions particularly from the year 2009 has
been a major driver of store choice (Jacob S amp
Bhushan R 2012)
The mammoth size of all these retailers offering
sales has ensured that they stand at par when it
comes to offering the best in class promotions
Over the years sales promotion activities have
grown in size and stature into repeated mega
events The sales promotion activity therefore
has moved beyond being a short term
lsquotemptingrsquo offer into a strategic event focused
at garnering consumer loyalty To make matters
worse these promotions are run simultaneously
by all these retailers to ensure that their
products are stockpiled by the consumer Hence
to differentiate their sales promotion events
retailers will have to look beyond mere price
cuts and bargains to ensure consumer
patronage The present research focuses on the
sales promotions offered by one of these
organized retailers so as to identify the
perception and satisfaction level of the
consumers towards such promotions
LITERATURE REVIEW
Background
Sales promotions an integral component of the
marketing mix have been utilized to exert a
strong impact on short term purchase behavior
(Laroche et al 2003) Studies have revealed
that sales promotions significantly impact
consumers (Gilbert and Jackaria 2002
Pramataris et al 2001 Fill 2002 and Shump
2003) their decision making process (Mela
Gupta amp Lehman 1997 Papatla amp
Krishnamurthi 1996 Das and Kumar 2009)
increases the basket size (Ramanathan and
Dhar 2010) promotes aggregate sales of the
promoted brand (Blattberg and Neslin 1990)
stock piling increase in quantity purchased
product trial spending more and purchase time
acceleration (Gupta 1988 Shi Cheung amp
Prendergast 2005)
Studies have also been conducted on factors
affecting loyalty (Aaker 1996 Lau et al 2006
Garvin 1988 Evans et al 1996 Cadogen and
Foster 2000) characteristics of loyal customers
as well as switchers (Grover amp Srinivasan 1992
Bloemeramp Kasper 1995) effect of frequency
and amount of sales promotions on quantity
purchased and brand choices (Meyer
ampAssuncao 1990) as well as price judgments
(Alba et al 1999) Research has revealed that
irregular and less predictable promotion
patterns diminish consumerrsquos inclination to
postpone purchases in order to obtain better
deals (Krishna 1994) Impact of promotional
patterns including the degree of regularity and
predictability of the sales promotion has
attracted less attention Thus the present study
attempts to explore the customer satisfaction
and loyalty with sales promotions by modern
retail trade in India which is now in the process
of becoming a regular and predictable event in
the consumerrsquos purchase cycle
23 DERIVING CUSTOMER SATISFACTION AND LOYALTY FROM ORGANIZED RETAILERrsquoS SALES PROMOTION
ACTIVITIES IN INDIA
Copyright copy2014 by International Journal of Sales Retailing and Marketing Vol 3 No 1 2014
Sales promotion cannot be looked at as a mere
price incentive being offered to the consumer
but has to be understood in terms of the more
comprehensive models like the ACSI amp ESCI
This is primarily because retailers are trying to
cultivate loyalty to a sales promotion event and
therefore it requires the assessment of
customer expectations perceived quality
perceived value customer satisfaction
customer complaints and an understanding of
how they impact each other
ACSI ECSI and Customer satisfaction
The importance of customer satisfaction for
business success has been emphasized in the
marketing literature consistently Higher
customer satisfaction leads to improved
financial performance by reducing customer
switching improving loyalty promoting positive
word of mouth reducing price sensitivity and
enhancing firm image and reputation (Garvin
1988 Anderson 1998 Kandanpully amp
Suhartanto 2000 Homburg ampGiering 2001
Kim et al 2004) Over the years numerous
models have been proposed by researchers to
examine customer satisfaction Amongst them
the most compelling model that investigates
the linkages between antecedents amp
consequences of customer satisfaction is the
ACSI ie the American Customer Satisfaction
Index and ECSI (European Customer Satisfaction
Index) which is a national index used to
measure customer satisfaction across
industries The present study adopts the ACSI
model to investigate the antecedents and
consequences of customer satisfaction in the
context of sales promotions by organized
retailers
According to findings of Parasuraman et al
(1991) four factors impact customer
expectations word of mouth (or reputation)
personal needs past experience and external
communications In the CSI model the
determinants of expectations are customerrsquos
pre purchase experience with the
companyproductservice along with a forecast
of a companyrsquos ability to deliver quality (Fornell
et al 1996) Pre purchase experience includes
past consumption experience non-experiential
information like advertising and word of mouth
Although different studies have proposed
varied definitions of customer expectations
majority of literature has found that customer
expectations directly impact perceived quality
and thereby customer satisfaction (Bearden amp
Teel 1983 Tseamp Wilton 1988 Fornell et al
1996 Halstead et al 1994) Perceived value is
another construct of the CSI model that impacts
customer satisfaction Perceived value
evaluates the product quality in relation to the
price of the product (Fornell et al 1996 Balaji
2009) Thus the following hypotheses can be
drawn
H1 Customer expectations will positively affect
perceived quality
H2 Customer expectations will positively affect
perceived value
H3 Customer expectations will positively affect
overall customer satisfaction
H4 Perceived quality will positively affect
perceived value
Perceived quality and customer satisfaction
Most researchers lack agreement in defining
customer satisfaction and quality of service The
CSI model views customer satisfaction as a
function of customerrsquos expectations perceived
quality and value Oliver (1993) argued that
customers must have experienced some quality
in order to determine their satisfaction levels
Similarly many other studies have considered
service quality as an antecedent of customer
satisfaction (Anderson et al 1994 Chiou et
al2002 Cronin et al2000 Fornell 1992
Fornell et al 1996) Adopting most of these
findings this study takes quality of service to be
a determinant of customer satisfaction
Therefore
H5 Perceived quality will positively affect
overall customer satisfaction
Perceived Value and Customer Satisfaction
Perceived value is a unique construct in the CSI
model and was defined by Fornell and his
colleagues as one that represents the perceived
24 DERIVING CUSTOMER SATISFACTION AND LOYALTY FROM ORGANIZED RETAILERrsquoS SALES PROMOTION
ACTIVITIES IN INDIA
Copyright copy2014 by International Journal of Sales Retailing and Marketing Vol 3 No 1 2014
level of product quality relative to the price of
the product (Fornell et al 1996) Zeithaml
(1988) recognized the relevance of perceived
value but regarded it as a component of
perceived quality While Fornell et al
incorporated the perceived value to measure
overall customer satisfaction The existing
literature makes it difficult to draw a clear
distinction between the two constructs
perceived quality and perceived value for the
purpose of this research we have taken
perceived value as a distinct construct
impacting overall customer satisfaction keeping
in mind the primary appeal of a sales promotion
ie value derived from price reductions Thus
H6 Perceived Value will positively affect overall
customer satisfaction
Customer satisfaction and customer loyalty
The outcomes of customer satisfaction have
been examined by quite a few studies (Cronin
et al 2000 Szymanski et al 2001)
Understanding outcomes of customer
satisfaction (Cronin et al 2000) consumer
loyalty (Beiamp Chiao 2001) and intention to
continue business with a company (Burncham
et al 2003) are of central importance to
marketers Hence the study examines both
possible outcomes customer complaints and
customer loyalty Reduced customer complaints
will result in increased loyalty (Tax et al 1998)
The effective redressal of the complaint impacts
customer loyalty positively Thus
H7 Overall customer satisfactions will
negatively affect customer complaints
H8 Overall customer satisfaction will positively
affect customer loyalty
H9 Customer complaint positively affects
customer loyalty
Perceived value customer expectation and
customer loyalty
The various characteristics of services are
inherent in the retail store as well To overcome
this aspect the customer expectations (Ofir and
Simonson 2007) and judgment of perceived
quality can impact customer loyalty directly as
well (Yieh Chiao and Chiu 2007 Sathish and
Venkatesakumar 2011) Thus
H10 Perceived quality positively impacts
customer loyalty
H11 Customer expectations positively impact
customer loyalty
H12 Overall the customers are satisfied with
the sales promotion
METHODOLOGY
Primary research was conducted and data was
gathered from respondents who visited the
stores during the sales promotion The
questionnaire was finalized after a focus group
discussion with eight store managers (four each
from two different organizations) to understand
the various constructs of customer expectation
perceived quality perceived value satisfaction
loyalty and complaint The instrument was
tested on 50 customers with prior experience of
least two similar sales promotion events In the
final instrument perceived quality and customer
satisfaction were measured using 19 specific
constructs which included crowd management
billing time employee response and
knowledge point of purchase display returning
policy etc Perceived value was measured by
three constructs condition of the goods expiry
dates on goods and availability of bargains
Customer loyalty was measured on the basis of
regularity in attending the sales promotions
recommendations made and waiting for sale
Customer complaints were measured on the
basis of five constructs availability and
cooperation of employees complaining
behavior of customers action taken on the
complaint To overcome the consumerrsquos
behavior of not complaining formally customers
were asked to rank their opinion about the
manageability of the crowd and handling of the
same by the management Customers were
asked to rate each item on a ten point scale
where 1 was taken as lsquopoorrsquo and 10 was taken
as excellent
Data was collected from different retail stores
of one of the major organized retailer running
the sales promotion events in Delhi NCR during
25 DERIVING CUSTOMER SATISFACTION AND LOYALTY FROM ORGANIZED RETAILERrsquoS SALES PROMOTION
ACTIVITIES IN INDIA
Copyright copy2014 by International Journal of Sales Retailing and Marketing Vol 3 No 1 2014
the Republic day week of 2012 In total 159
respondents were interviewed and the
questionnaires were personally administered to
the customers who came to avail the offer This
was done to avoid the problem associated with
including non-users in the survey (Szymanski
and Henard 2001) The basic ACSI ECSI model
(as shown in Figure 1) was used to draw the
hypotheses and perform the analysis The
dotted lines in the figure denote the proposed
hypothesis which is not as per the ACSIECSI
Figure 1 The basic model for CSI
Source ECSI 1998 and ACSI 2012
Data Analysis and Results
The respondents for the study were all aware of
the sales beforehand It is interesting to note
that 7 of the sample size consists of retailers
or a lsquokiranarsquo store owners which is in line with
similar observations regarding purchases made
by kirana store owners during the sales
promotion period by organized retailers like Big
Bazaar and Reliance Retail (Malivya 2012)
Electronic goods were the most purchased
goods followed by groceries personal care
items furnishings crockery and then utensils in
the same order
Underlying dimensions of CSI for Retail Sales
Promotion
The values are calculated by Principal
Component Analysis and multiple regressions
Regression analysis was done to find the
relationships and R2 was calculated (all
calculations are significant at 95 level of
confidence) When compared with the basic
ECSI model it was seen that there is a slight
difference as the perceived quality and
customer expectation also directly affects the
customer loyalty (see figure 2) According to the
results perceived quality affects perceived value
(R2 is 094) customer satisfaction (R2 is 062)
and customer loyalty (R2 is 076) more than
customer expectation affects perceived value
(R2 being 052) Customer satisfaction (R2 = 053)
and customer loyalty (R2 = 035) The value of R2
generally varies between 0 to 1 and the more
closer it is to 1 the more perfect fit of the data
on the regression line denoting that the model
is close to reality and so except customer
expectationrsquos effect on loyalty all the other
values are coming more than 050 and are
therefore relevant
Using Lisrel to calculate the impact factor it was
studied that the direct impact of perceived
quality on customer satisfaction is 032 and the
indirect impact means that one point increase
in the expectation index results in 035 x 042=
0147 point increase in customer satisfaction
index A calculation of all the direct and indirect
effects as per the ECSI (Kristensen Martensen
and Gronholdt 2000) shows that a one point
increase in perceived quality and customer
expectation results in 0467 and 0439 increase
(respectively) in the customer satisfaction
index The calculation for the direct and indirect
effect on customer loyalty shows that quality
has a greater impact on loyalty than
expectation A one point increase in quality
Perceived
quality
Customer
expectation
Perceived
value
Customer
satisfaction
(ACSI)
Customer
complaint
Customer
loyalty
H5
H4
H2 H3
H8 H6 H1
H11
H10
H7 H9
26 DERIVING CUSTOMER SATISFACTION AND LOYALTY FROM ORGANIZED RETAILERrsquoS SALES PROMOTION
ACTIVITIES IN INDIA
Copyright copy2014 by International Journal of Sales Retailing and Marketing Vol 3 No 1 2014
results in increasing the loyalty by 051 whereas
a one point increase in expectation results in
increasing the loyalty by 038
The scores for the various components were
calculated using the ACSI formula where the
mean responses were converted into 0-100
scale for reporting purposes where 0 stands for
poor and 100 stands for excellent lsquoA
component score is the weighted average of
the individual attribute ratings given by each
respondent to the questions presented in the
survey A score is a relative measure of
performance for a component as given for a
particular set of respondentsrsquo (ACSI 2006) The
scores are given in the corresponding boxes in
figure 2 It can be observed that the
performance of customer satisfaction is the
highest followed by customer expectation
perceived value customer loyalty perceived
quality and customer complaint
Figure 2 The CSI model for Retail Sales Promotion by organized players
Thus it is perceived quality that impacts the
customer loyalty the most followed by impact
of perceived value customer satisfaction The
dominant model that emerges is that perceived
quality and customer expectations impact
perceived value and perceived quality impacts
both customer satisfaction and loyalty
To study multi-collinearity correlation was
carried out for the three factors It was found
that correlation is positive but the values are
not very high or in excess of 08 (maximum for
this calculation is 046) hence ruling out
multicollinearity (Gujarati 2004 pp 359) The
correlation between the various constructs is
given in table 1 below
Table 1 Correlation coefficients between constructs
Constructs
Customer
expectation
Perceived
quality
Perceived
value
Customer
complaint
Customer
loyalty
Customer
satisfaction
Customer
expectation 1
Perceived
quality 0264378942 1
Perceived value 0149520672 0351027965 1
Cus complaint 0105047077 0055981137 0183702146 1
Cus loyalty 0162089487 0457471401 0371270621 0266418589 1
Cus satisfaction 0227290079 032405844 0420766098 022925679 0401732 1
Perceived
quality (444)
Customer
expectation
(789)
Perceived
value (667)
Customer
satisfaction
(ACSI) (946)
Customer
loyalty (50)
Customer
complaint (20)
R2 =094
I=35
R2 =062
I= 032
R2 = 030
I= 042
R2 =076 I=
046
R2 =015
I= 023 R2 =035
I= 027
R2 =035
I= 011
R2 =052
I= 017
R2 = 034
I= 030
R2 = 035
I= 019
R2 =052
I= 024
27 DERIVING CUSTOMER SATISFACTION AND LOYALTY FROM ORGANIZED RETAILERrsquoS SALES PROMOTION
ACTIVITIES IN INDIA
Copyright copy2014 by International Journal of Sales Retailing and Marketing Vol 3 No 1 2014
The positive values of R2 and the positive
coefficient values suggest that the various
hypotheses studied (H1 ndash H11) are correct The
low value of R2 for H1 H6 H7 H8 H9 H10 and
H11 shows that the constructs of these
variables do not account for (maximum) more
than 46 of the aspect studied but still they
account for some portion of the study The
study can therefore be extrapolated to study
these aspects further
Calculation of Customer Satisfaction Score
Customer satisfaction was studied on the basis
of three constructs laid down by ACSI that is
overall satisfaction with the sales whether the
sales met expectations and evaluation on basis
of comparison to ideal The mean values were
transformed on a scale of 0-100and are given in
table 4 The ACSI scores are calculated as
weighted averages and the calculated weights
(ACSI 2005) for the customer satisfaction
constructs and are shown in table 2 as follows
Table 2 Values for Customer Satisfaction calculation as per ACSI
Constructs Values out of 100 Weights
Overall satisfaction 9203354 0343816
Met expectations 9608665 033543
Comparison to ideal 9580712788 0320755
ASCI score = ((92034 x 0344) + (9609 x 0335)
+ (9581 x 321) ) = 946
Based on this model the total customer
satisfaction for the chosen retailerrsquos sale comes
out to be 946 The ACSI average for retail trade
stands at 761(ACSI 2012) Therefore the H12 is
true and customers are overall satisfied with
the sales promotion
DISCUSSION AND CONCLUSION
Regression analysis shows that the overall
model of ACSI fits in the case of sales promotion
event in an organized retail The customer
satisfaction is influence by perceived value
perceived quality and customer expectation
Most consumers surveyed in this study
patiently waited for these promotions to make
bulk purchases Contrary to normal belief that
sales promotions when used in excess hamper
brand image retailers like Big Bazaar have used
them to enhance consumer loyalty as well as
improve brand image The satisfaction from the
sales promotion in this case comprises of
satisfaction received from buying a product on
sale and also numerous other concepts like
perceived quality perceived value customer
complaints expectations and loyalty The
research thus uncovered that consumers come
to the store to participate in a sales promotion
for the bargains and at the same time have a
whole set of expectations from the store in
terms of quality of the products on sale variety
on sale behavior of staff etc The analysis of the
findings has revealed that customers were
highly satisfied by the sales promotions as
reflected by a high ACSI score of 946 The
customer expectation has a high ACSI score of
79 and when compared to the score for
perceived quality (44) and perceived value (67)
shows a higher expectation than the perception
of quality and value The retailers therefore
need to either manage these high expectations
by avoiding over promising through its
communications or deliver on the promises and
improve the perception of the customers The
high ACSI score for customer satisfaction can be
attributed to the fact that the customer
satisfaction was broadly measured using
28 DERIVING CUSTOMER SATISFACTION AND LOYALTY FROM ORGANIZED RETAILERrsquoS SALES PROMOTION
ACTIVITIES IN INDIA
Copyright copy2014 by International Journal of Sales Retailing and Marketing Vol 3 No 1 2014
constructs like overall satisfaction with the
sales whether the sales met expectations and
evaluation on basis of comparison to ideal The
focus of the customers during the sales
promotion offer was to get the benefit of price
discounts offered which lead to the high
satisfaction score
In terms of customer loyalty the ACSI score was
found to be 50 which is quite encouraging as
sales promotions are associated less with
loyalty The score is indicative of the fact that
the retailer has managed to develop some
loyalty amongst its customers as most
customers were either regular buyer or referred
buyers of the retailer The ACSI score for
perceived quality was found to be 444 The
constructs utilized in the study for measuring
perceived quality addressed minute details of
the consumerrsquos experience during the sale
Hence the low score indicates that consumers
are no longer evaluating the sale as a value
gaining event alone but are also evaluating
operational dynamics of the store that includes
nature of products brands on sale behavior of
staff adequacy of the promotional messages
crowd management etc Moreover the retailer
needs to focus on perceived quality as a one
point increase in the same will result in 047
point increase in customer satisfaction and 051
point increase in customer loyalty
The ACSI score for consumer complaints was
found to be pretty low at 20 This is in line with
the hypothesis 7 that overall customer
satisfaction will negatively affect customer
complaints However in our study we have
mapped the respondentsrsquo willingness to
complain evaluation of the handling of
customer complaints and customers discomfort
during the sales A low overall score highlights
the fact that the customers were also giving low
scores to the company as far as ease of
complaining and appropriate redressal of the
complaints were concerned The unsatisfactory
handling of the complaint has lead to the low
score and retailer needs to effectively address
the complaint procedure in its entirety
Managerial Implications The paper is specific
to customer satisfaction with respect to sales
promotion activities by organized players in
India and is important as these sales promotion
activities are predicted events at regular
intervals of time Extant literature shows
studies conducted for sales promotion activities
that are not regular events and their happening
cannot be predicted by customers The paper
provides insights into the customerrsquos
satisfaction with these sales and the factors
driving the loyalty towards the sales
Sales promotions for retailers like Reliance Big
Bazaar etc happen to be an almost year around
activity through which it intends to draw in new
customers as well as reward its loyal customers
The research sensitizes marketers to the fact
that consumers are drawing satisfaction not
only from the perceived value of the sale but
also customer expectation and perceived
quality The consumer comes to the retail store
with a set of expectations that extend beyond
the type of promotions (buy one get one free
price off etc) on offer During their stay in the
store they are analyzing the nature of services
provided by the retailer the store ambience
management of the entire promotion (chaos at
the store etc) POP displays effectiveness of
announcements behavior of the staff
complaint handling etc On the one hand they
are deriving satisfaction from the sales due to
expectations perceived quality and value for
money derived from the sales However on the
other hand there is a marked gap between the
customer expectations and perceptions Hence
it is mandatory for retailers not only to provide
the right type of promotions but also ensure
operational efficiency of the promotion that will
lead to customer satisfaction and hence
customer loyalty Specific managerial
implications based on the research are as
follows
Enhancing loyalty to Sales Promotion The ACSI
score for loyalty is indicative of the fact that the
regularity of the sales promotions drive by the
said retailer has managed to develop loyalty
29 DERIVING CUSTOMER SATISFACTION AND LOYALTY FROM ORGANIZED RETAILERrsquoS SALES PROMOTION
ACTIVITIES IN INDIA
Copyright copy2014 by International Journal of Sales Retailing and Marketing Vol 3 No 1 2014
amongst the consumers The low score is also
indicative of the possibility of increasing sales
promotion (retailer based) loyalty in the future
by concerted efforts to make the promotion
drive a regular feature as well as a comfortable
encouraging experience for the consumers
Managing Perceived Quality Over the years as
the retail sector has become more crowded by
entry of new players promotions have grown in
number and duration To make matters more
competitive the promotions are scheduled
simultaneously As a result it is no longer
possible to gain consumerrsquos loyalty or consumer
satisfaction by merely providing lucrative deals
Retailers have to seek efficiencies in managing
the complete store experience during the
promotion drive for the consumer which
involves trolley management faster cashier
lanes effective communication availability of
promoted brands dealing with expired and
damaged goods favorable return policy and
appropriate employee behavior A focus on the
perceived quality is also necessitated by the fact
that an increase in the perception impacts
customer satisfaction and loyalty
Inviting amp Addressing Consumer Complaints
Although complaints by consumers were found
to be pretty low during the sales drive the
retailer has to be cautious and has to develop
an appropriate channel to invite and address
consumer complaints as consumer
disgruntment as well as unresolved complaints
can lead to negative WOM which can hamper
consumer satisfaction and loyalty in the long
run
Limitation and Future Research Direction
This study is specific to the sales promotion
activity of organized retailers in Delhi and NCR
It thus cannot be generalized for the organized
retail scenario in general or for the entire retail
scenario (organized as well as unorganized) in
India Organized retail accounts for a small pie
of the entire retail industry in India Thus the
organized retail scenario offers numerous
opportunities for organized players both
national and international keeping in mind the
opening up of the FDI rules governing the same
Research can be thus be conducted to study the
overall customer satisfaction drivers for
organized andor unorganized retail during
normal days as well which can give rich insights
into the culturally diverse consumer base in
India
REFERENCES
ACSI (2006)
httpwwwfsfedusresearchpdf2006_fs_rd
_customer_satisfaction_survey_final_reportpdf
ACSI (2012)
httpwwwtheacsiorgindexphpoption=com
_contentampview=articleampid=261acsi-sectors-
and-industriesampcatid=14ampItemid=338
Aaker DA (1996) Building Strong Brands
Free Press New York
Alba Joseph W Carl FMela Terence A
Shimp and Joel E Urbany (1999) ldquoThe Effect
of Discount Frequency and Depth on Consumer
Price Judgmentsrdquo Journal of Consumer
Research 26 (September) pp99-114
Anderson Eugene W (1998) ldquoCustomer
Satisfaction and Price tolerancerdquo Marketing
Letters Vol7 No3 pp265-74
Bawa Kapil amp Robert Shoemaker (2004) ldquoThe
Effects of Free Samples On Incremental Brand
Salesrdquo Marketing Science 233 pp345-363
BawaK ampShoemakerRW (1989) ldquoAnalyzing
incremental sales from direct mail coupon
promotionrdquo Journal of Marketing 53 (3) 66-76
Bearden William O and Jesse E Teel (1983)
ldquoSelected Determinants of Consumer
Satisfaction and Complaint Reportsrdquo Journal of
Marketing Research Vol 20 No 1 pp 21-28
BeiLTandYCChiao (2001)rdquoA ldquoIntegrated
Model for the Effects of Perceived Product
Perceived Service Quality and Perceived Price
Fairness on Consumer Satisfaction and Loyaltyrdquo
Journal of Consumer Satisfaction
Dissatisfaction and Complaining Behavior 14
125ndash140
30 DERIVING CUSTOMER SATISFACTION AND LOYALTY FROM ORGANIZED RETAILERrsquoS SALES PROMOTION
ACTIVITIES IN INDIA
Copyright copy2014 by International Journal of Sales Retailing and Marketing Vol 3 No 1 2014
Blattberg R C and Scott A N (1990) Sales
Promotions Concepts Methods and Strategies
Englewood Cliffs NJ Prentice Hall
Bloemer JMMamp Kasper HDP (1995) ldquoThe
Complex Relationship between Consumer
Satisfaction and brand Loyaltyrdquo Journal of
Economic Psychology 162 pp311-329
Burnham TA Frels JK Mahajan V (2003)
ldquoConsumer switching costs a typology
antecedents and consequencesrdquo Journal
Marketing Sciences 31(2)109-126
Cadogen JW amp Foster BD (2000)
ldquoRelationship Selling amp Customer Loyalty An
Empirical Investigationrdquo Marketing Intelligence
and Planning 184 pp185-199
Chiou J S Droge C amp Hanvanich S (2002) ldquo
Does customer knowledge affect how
loyalty is formedrdquo Journal of Service Research
5(2) 113ndash124
Cronin JJ Brady MK Hult GTM (2000)
ldquoAssessing the effects of quality value and
customer satisfaction on consumer behavioral
intentions in service environmentsrdquo Journal of
Retailing 6(2)pp193-218
Das G amp Kumar R-2009 ldquoImpact of sales
promotion on buyerrsquos behavior An empirical
study of Indian retail customersrdquo Journal of
Management 3 (1) 11-24
Economic Times(2012) ldquoFDI in multi-brand to
boost organized retail in Indiardquo
httparticleseconomictimesindiatimescom2
012-08-13news33182674_1_fdi-global-retail-
chains-gdp-growth Accessed 2nd September
2012
ECSI Technical Committee (1998) European
Customer Satisfaction Index Foundation and
Structure for Harmonized National Pilot
Projects Report prepared for ECSI Steering
Committee
Evans M MoutinhoL and RaaijWFV
(1996) ldquoApplied Consumer Behaviorrdquo Addison-
Wesely Publication Co Harlow Reading Mass
Fornell C (1992) ldquoA National Customer
Satisfaction Barometer The Swedish
Experiencerdquo Journal of Marketing 56 pp6-21
Fill C (2002) Marketing communications
Contexts strategies and applications (3rd
Edition) Italy Pearson Education Limited
Fornell C Johnson M D Anderson EW Cha
J amp Bryant BE (1996) ldquo The American
Customer Satisfaction Index Nature purpose
and findingsrdquo Journal of Marketing 60 (4)
pp(7-18)
Garvin DA (1988) Managing Quality The
Strategic and Competitive Edge Free Press
New York Maxwell Macmillan Toronto
Maxwell Macmillan International New York
Gilbert DC ampJackaria N(2002) ldquoThe efficacy
of sales promotions in UK supermarkets A
consumer viewrdquo International Journal of Retail
amp Distribution Management 30 (6) 315-322
GoswamiP and Mishra M(2009) ldquoWould
Indian consumers move from kirana stores to
organized when shopping for groceriesrdquo Asia
Pacific Journal of Marketing and Logistics 21(1)
127 - 143
GroverR and Srinivsan V (1992) ldquo Reflection
on a Simultaneous Approach to Market
Segmentation and Market Structuringrdquo Journal
of Marketing Research 294 pp474-476
Gujarati Damodar N (2004) Basic
Econometrics New Delhi Tata McGraw-Hill pp
359
Gupta S (1988) ldquoThe Impact of Sales
Promotions on When What and How Much to
Buyrdquo Journal of marketing research Vol25
pp342-355
Halstead D D Hartman and S L
Schmidt(1994) ldquoMulti source Effects on the
Satisfaction Formation Process Journal of the
Academy of Marketing Science Vol 22 No 2
pp 114-129
Homburg C amp Giering A( 2001) ldquoPersonal
characteristics as moderators of the
relationship between customer satisfaction and
loyalty An empirical analysisrdquo Psychology amp
Marketing Vol18No1 pp 43-66
Jacob S amp Bhushan R (2012) ldquoFuture Group
Lifestyle and Woodland clock record sales as
Republic Day discounts help retailers bounce
backrdquohttparticleseconomictimesindiatimes
31 DERIVING CUSTOMER SATISFACTION AND LOYALTY FROM ORGANIZED RETAILERrsquoS SALES PROMOTION
ACTIVITIES IN INDIA
Copyright copy2014 by International Journal of Sales Retailing and Marketing Vol 3 No 1 2014
com2012-01-31news31010348_1_retail-
sales-end-of-season-sales-discounts Accessed
21st September 2012
Kandanpully J amp Suhartanto D (2000)
ldquoCustomer loyalty in the hotel industry The role
of customer satisfaction and imagerdquo
International Journal of Contemporary
Hospitality Management Vol12 No6 pp346-
351
Kamath K (2012) ldquoRetail biggies outdo each
other with price challenges discountsrdquo
httpwwwbusiness-
standardcomindianewsretail-biggies-outdo-
each-otherprice-challenges-discounts483144
Accessed 8th September 2012
Kim M Park M ampJeong D (2004) ldquo The effects
of customer satisfaction and switching barrier
on customer loyalty in Korean Mobile
Telecommunication Servicesrdquo
Telecommunications Policy Vo28 No2 pp
145-59
Krishna Aradhna (1994) ldquoThe Impact of Dealing
Patterns on Purchase Behaviorrdquo Marketing
Science 13 (Fall) pp351-73
Kristensen K Martensen A and Gronholdt L
(2000) ldquoCustomer Satisfaction measurement at
post Denmark results of application of the
European Customer Satisfaction Index
Methodologyrdquo Total Quality Management
Volume 11 Issue 7 pp1007-1015
Laroche M Pons FZgolli NCervellon MC
and Kim C (2003) ldquo A Model of Consumer
Response to Two Retail Sales Promotion
Techniquesrdquo Journal of Business Research 567
pp513-522
Malviya S (2012) ldquoKirana stores throng big
retailers like Future Group Reliance Retail and
others for better marginsrdquo Economic Times
New Delhi Dated 28 August pp 4
Mela Carl F Gupta Sunil and Donald
BLehmann (1997) ldquo The Long Term Impact of
Promotion and Advertising on Consumer Brand
Choicerdquo Journal of Marketing Research
342pp248-261
Meyer Robert J and Joao Assuncao (1990) ldquo
The Optimality of Consumer Stockpiling
Strategiesrdquo Marketing Science 9 (Winter)
pp18-41
Ofir C and Simonson I (2007) ldquoThe effect of
stating expectations on customer satisfaction
and shopping experiencerdquo Journal of Marketing
Research Vol 44 pp 164-174
Papatla Purushottam and Krishnamurthi
Lakshman (1996) ldquo Measuring the Dynamics
Effects of Promotions on Brand Choicerdquo Journal
of Marketing Research122 pp24-32
PawarT-2012 ldquoBig Bazaars SabseSaste 5 Din
back with Mega deals and bigger bargainsrdquo
httpwwwindiainfolinecomMarketsNewsB
ig-Bazaars-Sabse-Saste-5-Din-back-with-Mega-
deals-and-bigger-bargains5338770514
Accessed 11th May 2012
Oliver R L(1993) ldquoCognitive Affective and
Attribute Bases of the Satisfaction Responserdquo
Journal of Consumer Research Vol 20 No 3
pp418-430
Parasuraman A Zeithmal V A amp Berry L L
(1991) ldquoRefinement and Reassessment of the
SERVQUAL scalerdquo Journal of Retailing 67(4)
pp 420-450
PawarT-2012 ldquoBig Bazaars SabseSaste 5 Din
back with Mega deals and bigger bargainsrdquo
httpwwwindiainfolinecomMarketsNewsB
ig-Bazaars-Sabse-Saste-5-Din-back-with-Mega-
deals-and-bigger-bargains5338770514
Accessed 11th May 2012
PramatarisKC
VrechopoulosAPampDoukidisGI (2001) ldquoThe
transformation of the promotion mix in the
virtual retail environment An initial framework
and comparative studyrdquo
httpwwweltrunaurebgrpapersiechtm
Shi YZ Cheung KM amp Prendergast G (2005)
ldquoBehavioral Response to Sales
Promotion tools-A Hong Kong Studyrdquo
International Journal of Advertising Vol24
No4
pp467-486
32 DERIVING CUSTOMER SATISFACTION AND LOYALTY FROM ORGANIZED RETAILERrsquoS SALES PROMOTION
ACTIVITIES IN INDIA
Copyright copy2014 by International Journal of Sales Retailing and Marketing Vol 3 No 1 2014
Ramanathan S and Dhar S K (2010) ldquoThe
effect of sales promotions on the size and
composition of the shopping basket regulatory
compatibility from framing and temporal
restrictionsrdquo Journal of Marketing Research 47
(3) 542-552
Research amp Markets (2011) ldquoBMI India Retail
Report Q1 2011rdquo
httpwwwresearchandmarketscomreports
1444352bmi_india_retail_report_q1_2011pdf
Accessed 6th September 2012
Sathish A S and Venkatesakumar R (2011)
ldquoCoffee experience and drivers of satisfaction
loyalty in a coffee outlet with special reference
to ldquocafeacute coffee dayrdquo The Journal of
Contemporary Management Research Vol 5
No 2 pp 1-13
Szymanski D M and Henard D H (2001)
ldquoCustomer satisfaction a meta-analysis of the
empirical evidencerdquo Journal of the Academy of
Marketing Science Vol 29 Issue 1 pp 16-35
Tax SS Brown SW and Chandrashekaran M
(1998)ldquoCustomer evaluation of service
complaint experiences Implications for
relationship marketingrdquo Journal of Marketing
Vol 62 April pp 60-76
Tse DK Wilton PC(1988) ldquoModels of Consumer
Satisfaction Formation An Extensionrdquo
Journal of Marketing Research Vol 25 No 2
pp 204ndash12
Yieh K Chiao Y C and Chiu Y K (2007)
ldquoUnderstanding the antecedents to customer
loyalty by applying structural equation
modelingrdquo Total Quality Management Vol 18
No 3 pp 267-284
Zeithaml VA (1988) ldquoConsumer perceptions
of price quality and value a means-end model
andsynthesis of evidencersquorsquo Journal of
Marketing Vol 52 July pp 2-22
Copyright copy2014 by International Journal of Sales Retailing and Marketing Vol 3 No 1 2014
34 IMPACT OF RISK FACTORS RELATED TO INTERNET BANKING WITH SPECIAL REFERENCE TO NATIONAL
CAPITAL REGION
IMPACT OF RISK FACTORS RELATED TO INTERNET
BANKING WITH SPECIAL REFERENCE TO NATIONAL
CAPITAL REGION
Shamsul Haq Pawan Kumar amp Bilal Mustafa Khan
Abstract
As the used of Internet Banking is increasing the cost of operation minimizing various electronic
delivery channels are increasingly used for delivering products and services at the convenience of
customers at low cost Internet Banking is easing the life of clients of banks The objectives of this
paper to know the factors which are influencing the used of internet banking as well as analyzing the
various risk dimension associated with internet banking
To find out the impact of all these variables a structured questionnaire has been prepared a through
a systematic survey which was conducted at the NCR The number of respondents were 300 belongs
to heterogeneous population The Chi-Square testt-test and Exploratory Factor Analysis (EFA) were
used to interpret the hypothesis the result illustrates population vital statistics impel the adoption of
online banking and also financial and social risk security and time risk and performance risk
contribute to the risk perceptions of banking customers
INTRODUCTION
The acceleration in technology has produced an
extraordinary effect upon our economy in
general has had a particularly produced
profound impact an expanding the scope and
utility of financial products over the last ten
years Information technology has made
possible the creation valuation and exchange
of complex financial products on a global basis
and even that just in recent years Derivatives
are obviously the most evident of many
products that technology has inspired but the
substantial increase in our calculation has
permitted a variety of other products and most
beneficially new ways to unbounded risk
LITERATURE REVIEW
The review of literature reveals that adoption
perception and usage of internet banking
extremely heavily examined by the researchers
Joshua (2009) found that the level of awareness
about Internet banking in the state of Karnataka
in India was 78 among users and 31 among
non-users Internet banking is a widely adopted
electronic banking service next to ATM Singh
(2004) found that a majority of Internet banking
users in South Africa used Internet banking for
inter-account transfers and checking
balancesstatements Payment of bills checking
of account balances printing statements funds
transfer and ordering check books are by far the
most popularly used Internet banking services
in Zimbabwe SournataMattila and Munnukka
(2005) Al-Sabbagh and Molla (2004)- all explore
the various inhibitors and drivers of electronic-
banking adoption They believe there are
relatively few empirical analyses of the impact
of electronic banking on customers As cyber
Shamsul Haq is Assistant Professor at UEI Global Rohini Delhi (email shamsulmbagmailcom) Pawan Kumar is Assistant Professor at ITS Mohan NagarGhaziabad Bilal Mustafa Khan is Assistant Professor at AMUAligarh
Copyright copy2014 by International Journal of Sales Retailing and Marketing Vol 3 No 1 2014
35 IMPACT OF RISK FACTORS RELATED TO INTERNET BANKING WITH SPECIAL REFERENCE TO NATIONAL
CAPITAL REGION
banking is a relatively new concept in context of
delivery of banking services online not so many
studies are available in Indian context Most of
the studies that the authors have gone through
are not in the Indian context
Ahmed and Saima (2008) stated that chances of
fraud and lack of information security are the
vital risks associated with electronic banking in
Pakistan Ming (2009) studied the risk factors in
detail and identified that security risk financial
risk performance risk and timeconvenience
risk have negatively affected the intention to
adopt online banking in Taiwan Almahmeed
et al (2008) conducted a research on all Kuwaiti
and non-Kuwaiti banks It was found that the
awareness of Internet banking proved to be
relatively high among business firms The most
frequently used services by the customers
were reviewing the account balance obtaining
detailed transaction histories obtaining
information about deposits loan interest rates
transfer funds between companyrsquos own
accounts transfer funds to other accounts
within Kuwait transfer funds to other accounts
outside Kuwait and issuing standing orders
Maiyaki and Mokhtas (2010) shown in their
research that there is no relation in between
population statistics and choice of banks It was
also found that statistically there is a significant
relationship between age and choice of banks
Khurana (2009) studied the perception of
Internet banking users through the relationship
between population statistics of users along
with the five independent variables
responsiveness reliability efficiency security of
information and ease of use It depicts there
was no significant relation in between age
occupation sex on the use of number of banks
operate by clients It also explain age has
convincing influence on the operational
efficiency of clients As regards reliability
customers had no trust in websites
Maiyaki and Mokhtas (2010) shown in their
research that there is no relation in between
population statistics and choice of banks It was
also found that statistically there is a significant
relationship between age and choice of banks
Selvam and Nanjappa (2011) in their study
examined customersrsquo awareness and
satisfaction about e-banking of ICICI bank on
the basis of vital statistics of the E-banking
users It depicted that college students are
more awareness level compare to other
education groups The study revealed that
awareness level of income group above 10000
per month was high as compared to other
income groupsIt was shown that it also depend
on the size of family Sex is the crucial issues for
the acceptance of internet banking
Ahmed and Saima (2008) stated that chances of
fraud and lack of information security are the
vital risks associated with electronic banking in
Pakistan Ming (2009) studied the risk factors in
detail and identified that security risk financial
risk performance risk and timeconvenience
risk have negatively affected the intention to
adopt online banking in Taiwan
Shergill and Lis (2005)depicted that women are
more serious regarding the security issues
compare to their male counterparSurvey by
Chung and Paynter (2002)privacy and security
issues are crucial for the adoption of cyber
banking Perceived risk like theft of private
information was concerning issues regarding
the adoption of online banking
Research Objectives
This study was conducted to know the impact
of demographic parameters
To identify the challenges those affect
the customers to use internet banking
To identify the challenges those affect
the banks to launch internet banking
services
To identify the main and general
challenges that affecting the internet
banking
To identify the factors influences
consumers to use internet banking
To measure the relationship between
factors (consumer demographic factors
Internet banking attributes social
Copyright copy2014 by International Journal of Sales Retailing and Marketing Vol 3 No 1 2014
36 IMPACT OF RISK FACTORS RELATED TO INTERNET BANKING WITH SPECIAL REFERENCE TO NATIONAL
CAPITAL REGION
influences) and the acceptance of
internet banking
To examine the factors those
discourage customers from using
internet Banking
To understand the influence of
demographic variables on various
dimensions of risk in the usage of
Internet banking
Hypothesis
H1There is no relationship of
population statistics on the
endorsement of e-banking
H2There is any difference between
users and non-users with regard to
their perception of social forces
H3 There is a difference between user
and non users with regard to their
perception of internet banking
H4 Customersrsquo perceptions of
various risk dimensions in the usage
of Internet banking are independent
of demographic factors
RESEARCH METHODOLOGY
The different parameters related to
respondents like age sex Income and
occupation taken through the structured
questionnaire and cross tabulation is given
belowIt is depicted the respondents complete
profile who were using banking service in NCR
region To evaluate data collected and interpret
it SPSS and Microsoft Excel was used This study
has been conducted to know the influence of
demographic factors in the adoption of E-
banking
Exploratory Factor Analysis (EFA) is employed
for validating the constructs used in the study
The significance of variation in constructs across
demographic variables is analyzed by using an
appropriate test statistic
Sample Size
50 questionnaires have to response from four
commercial centers (The ANSAL PLAZA PACIFIC
MALL EDM MALL and GREAT INDIA PALACE)
would be interviewed therefore 200
respondents from the commercial centers the
100 respondents who are professionals like
Faculties and Parma companies therefore total
number of 300 respondents responded the
questionnaires
Demographic Profiles of Respondents
Analysis has been done through the
demographic profile of the users of cyber
banking than different statistical tools are used
like Chi-square test
Table 11 Gender Profile of respondents
Respondents Profile
Male Female Total
General Respondents 168 56 132 44 300 100
Internet Users 72 60 48 40 120 100
Internet Non-users 96 53 84 47 180 100
Copyright copy2014 by International Journal of Sales Retailing and Marketing Vol 3 No 1 2014
37 IMPACT OF RISK FACTORS RELATED TO INTERNET BANKING WITH SPECIAL REFERENCE TO NATIONAL
CAPITAL REGION
Table 12 Age of Respondents
AGE Group (table 62)
General
Respondents Internet users Internet Non-users
124 41 38 32 86 48
95 32 62 52 33 18
51 17 15 13 36 20
30 10 5 4 25 14
300 100 120 100 180 100
Table 13 Education level of respondents
Education level (table 63)
General
Respondents Internet users
Internet Non-
users
Postgraduate 164 55 104 87 60 33
undergraduate 82 27 11 9 71 39
Highschool 46 15 1 1 45 25
Other 8 3 4 3 4 2
Total 300 100 120 100 180 100
Table 14 Income of respondents
General
Respondent Internal users Internet Non-users
Less than `25000 58 19 2 2 56 31
`25000-`34000 54 18 4 3 50 28
`35000-`44000 50 17 16 13 34 19
`45000-`54000 52 17 32 27 20 11
`55000-`99999 51 17 44 37 7 4
`100000-199999 18 6 18 15 0 0
`200000-299999 0 0 0 0 0 0
over `300000 0 0 0 0 0 0
other 17 6 4 3 13 7
Total 300 100 120 100 180 100
Table 15 Age users ampnon users Cross-tabulation
Count
users ampnon users Total
users non-users
Age
20-29 38 86 124
30-39 62 33 95
40-49 15 36 51
Copyright copy2014 by International Journal of Sales Retailing and Marketing Vol 3 No 1 2014
38 IMPACT OF RISK FACTORS RELATED TO INTERNET BANKING WITH SPECIAL REFERENCE TO NATIONAL
CAPITAL REGION
Table 16 -Chi-Square Tests
Value df Asymp Sig (2-
sided)
Pearson Chi-Square 38973a 3 000
Likelihood Ratio 39454 3 000
Linear-by-Linear
Association 858 1 354
N of Valid Cases 300
a 0 cells (00) have expected count less than 5 The minimum
expected count is 1200
The p of 0000 which is less than 005 Table (16) reflected that chi-square test is significant and
shown that there is a relationship between the age and the adoption of internet banking
Table17-EDUCATION users and non-users Cross-
tabulation
Count
USERAND NON
USER
Total
USE
R
NON-USER
Education
PG 104 60 164
Graduate 11 71 82
High school 1 45 46
OTHER 4 4 8
Total 120 180 300
Table 18-Chi-Square Tests
Value df Asymp Sig (2-
sided)
Pearson Chi-Square 89369a 3 000
Likelihood Ratio 103032 3 000
Linear-by-Linear
Association 58843 1 000
N of Valid Cases 300
a 2 cells (250) have expected count less than 5 The minimum
expected count is 320
The Chi-square is significant (p=0000)(Table-18 ) indicating that there is a significant relationship
between education level and the adoption of internet banking
Above 50 5 25 30
Total 120 180 300
Copyright copy2014 by International Journal of Sales Retailing and Marketing Vol 3 No 1 2014
39 IMPACT OF RISK FACTORS RELATED TO INTERNET BANKING WITH SPECIAL REFERENCE TO NATIONAL
CAPITAL REGION
Table 19-Income of users and non-users cross-tabulation
Internet Banking Total
Income Yes No
Less than 14000 2 56 58
14000 to 24999 4 50 54
25000 to 34999 16 34 50
35000 to 49999 32 20 52
50000 to 99999 44 7 51
100000 to199999 18 0 18
Percent 15 0 6
200000 to299999 0 0 0
over 300000 0 0 0
other 4 13 17
Total 120 180 300
Percent 100 100 100
Table-20-Chi-Square Tests
Value df Asymp Sig (2-
sided)
Pearson Chi-Square 141998a 6 000
Likelihood Ratio 166565 6 000
Linear-by-Linear
Association 59622 1 000
N of Valid Cases 300
a 0 cells (00) have expected count less than 5 The minimum
expected count is 680
The Chi-square is significant (p=0000)(table 20) indicating there is a significant relationship
between the income and adoption of internet banking
Table -21-OCCUPATION USERSampNON Cross-tabulation
Count
USERSampNON Total
USER NON-USERS
OCCUPATION
Employed 92 93 185
Un-Employed 0 38 38
Pensioners 2 5 7
Self-employed 24 34 58
OTHER 2 10 12
Total 120 180 300
Table 22-Chi-Square Tests
Copyright copy2014 by International Journal of Sales Retailing and Marketing Vol 3 No 1 2014
40 IMPACT OF RISK FACTORS RELATED TO INTERNET BANKING WITH SPECIAL REFERENCE TO NATIONAL
CAPITAL REGION
Value df Asymp Sig (2-
sided)
Pearson Chi-Square 35780a 4 000
Likelihood Ratio 49486 4 000
Linear-by-Linear
Association 5137 1 023
N of Valid Cases 300
a 3 cells (300) have expected count less than 5 The minimum
expected count is 280
Table 22 establishes that there is a significant interconnection between occupation and the
adoption of internet banking
Table 30(t-test) This sections tests the hypothesis that there is a significant difference between
users and non-users with regard to their perception of relative advantage of internet banking
Most attitudinal factors including factors including relative advantage compatibility complexity
perceived risk and perceived cost are found to be significant however complexity perceived risk and
perceived cost present a negative relationship Social influences did not result in any significant
differences between users and non-users
Table 30
Group Statistics
internet users N Mean
Std
Deviation
Std Error
Mean
work Style users 120 46250 67441 06157
Non-
users
180 26944 89128 06643
life convenient users 120 41083 60524 05525
Non-
users
180 26222 95224 07098
program is easy users 120 35167 102066 09317
Non-
users
180 27944 89503 06671
Internet banking is
complex
users 120 22917 92032 08401
Non-
users
180 35222 89352 06660
Process is Simple users 120 38083 89156 08139
Non-
users
180 25778 77644 05787
Time saving users 120 41333 67280 06142
Non-
users
180 32833 114957 08568
comfortable with bank users 120 40167 69794 06371
Non-
users
180 29278 99176 07392
Copyright copy2014 by International Journal of Sales Retailing and Marketing Vol 3 No 1 2014
41 IMPACT OF RISK FACTORS RELATED TO INTERNET BANKING WITH SPECIAL REFERENCE TO NATIONAL
CAPITAL REGION
Telecommunication cost users 120 20083 96577 08816
Non-
users
180 40722 60750 04528
fees are expensive users 120 28167 79898 07294
Non-
users
180 40667 72157 05378
Reliability and Validity
Reliability is determined by the Cronbachrsquos
coefficient alpha ( ) Nunnaly (1978) suggested
that for any research at its early stage a reliable
score or alpha that is 060 or above is sufficient
As shown in Table 4 all the construct
reliabilities surpassed the required minimum
EFA is applied on the data collected from 300
respondents to reduce the variables to a few
factors for further analysis The Kaiser-Meyer-
Olkin (KMO) measure of sampling adequacy
(KMO = 0735) is greater than the rule of thumb
050 and Bartlettrsquos test of sphericity is
significant which means that the items
included in the scale do have a correlation with
each other Thus factor analysis is found to be
an appropriate technique for construct validity
The variables which had loadings of less than
050 were excluded and dimensions with eigen
values of more than 1 were retained Table 4
exhibits the Rotated Factor Loadings (RFL)
percentage of Variance Explained (VE) by each
factor and Cronbahrsquos Alpha (CA) It is observed
that all the items have high factor loadings and
therefore all items are accepted and the
construct validity of the instrument is
established
Factor 1
It is the most vital factor that contributes to the
risk perceptions of Internet banking users which
explains 4321 of the variation Five items are
loaded on this factor This factor consists of
items associated with financial risk and social
risk as characterized by Featherman and Pavolu
(2003) and therefore this factor is labeled as
lsquofinancial and social risk
Factor 2
Four items are loaded on this factor which
explains 1326 of the variation This factor
consists of items associated with security risk
and time risk (Featherman and Pavolu 2003)
and therefore this factor is labeled as lsquosecurity
and time risk
Factor 3
Two items are loaded on this factor which
explains 1196 of the variation This factor
consists of items associated with performance
risk (Featherman and Pavolu 2003) and
therefore this factor is labeled as lsquoperformance
risk
Copyright copy2014 by International Journal of Sales Retailing and Marketing Vol 3 No 1 2014
42 IMPACT OF RISK FACTORS RELATED TO INTERNET BANKING WITH SPECIAL REFERENCE TO NATIONAL
CAPITAL REGION
Table 40 Customer Risk Perception of Usage of Internet Banking at National Capital region
Factorvariable RFL VE() CA
Factor 1 0832
I am afraid that I will lose money through Internet banking 0759
I worry that I will not get compensation if an error occurs 0763
My friend relatives and colleagues would think less of me if something wrong
with my internet banking account 0753 4321 0775
if fraud or hacking occurs to my Internet banking it will effect my status 0865
If an error occurs I will have to waste a lot of time to correct it 0663
Factor 2
It would take a lot of time to learn how to use Internet banking 0725
I feel unsafe to provide personal information over Internet banking 0659 1326 0765
I worry that other people may access my Internet banking account 0865
I would not feel secure sending sensitive information over
Internet banking 0771
Factor 3
Internet banking servers may not perform well due to low speed 0863 1321 0125
Internet banking servers may process payments incorrectly 0654
Note Principal Component Analysis Rotation Method Varimax with Kaiser Normalization Rotation
converged in 5 iterations
FINDINGS AND CONCLUSION
Most of the users are middle-aged (ie between
(31-39) have monthly income in excess `25000
are educated to Post Graduate level and
belongs to working class Research depicted
that only 28 percent banking clients were using
internet banking after evaluating the population
characteristics it was no significant relationship
in between age and use of cyber banking (the
significance level is 0005 in the chi-square
tests) It also depicted that there is no relation
in between gender and the adoption of internet
banking (the significance level is 0000 so we
assume null hypothesis) There is a gender
neutrality in the adoption of e-banking
Qualification in terms of education and income
of respondents were playing the role in the
acceptance of online banking (At the
Significance level of the chi-square test is 0 so
we reject null hypothesis)
This research depicted that users of internet
banking are increasing as their income and
education standard is improving number of
users depending upon the education standard
of internet banking users with income
Therefore it is the need of time financial literacy
of the users should be increased through
various programs could be run by the banks to
increase the awareness of internet banking
There is still a lot needed for the banking
system to make reforms and train their
customers for using internet for their banking
account Going through the survey main
problem lies that still customers have a fear of
hacking of accounts and thus do not go for
internet banking Banks are trying their level
best by providing the best security options to
Copyright copy2014 by International Journal of Sales Retailing and Marketing Vol 3 No 1 2014
43 IMPACT OF RISK FACTORS RELATED TO INTERNET BANKING WITH SPECIAL REFERENCE TO NATIONAL
CAPITAL REGION
the customers but there are a lot of factors
which betrays a customer from opening an
internet bank account
By that way banks could be able to reduce the
rush at the branches and operating cost also
therefore Banks are now spending heavily on
information technology front but from the side
of the government there is requirement to
invest on the infrastructure like electricity and
internet
The present study considered prominent risk
variables affecting adoption of Internet
banking and EFA segmented these variables
into three dimensions which are labeled as
financial and social risk security and time risk
and performance risk A cross- analysis of these
factors across different demographic variables
revealed that females perceive more risk than
males in the case of financial and social risk
Old customers perceive more security and time
risk than the young Businessmen perceive
more financial and social risk than employees
Undergraduates perceive more financial and
social risk than postgraduates Respondents
with basic level of computer knowledge
perceive more security and time risk than
respondents with advanced level of computer
knowledge Therefore it is concluded that
variables relating to different dimensions of risk
are different to a certain extent to different
categories of customers
It is useful from the view of clients as well as
the banks therefore in the coming years E-
banking reshape the traditional banking
REFERENCES
Ahmed Kaleem and Saima Ahmad (2008)
ldquoBankers Perceptions of Electronic Banking in
Pakistanrdquo Journal of Internet Banking and
Commerce Vol 13 No 1 pp 1-16
Ahmed Kaleem and Saima Ahmad (2008)
ldquoBankers Perceptions of Electronic Banking in
Pakistanrdquo Journal of Internet Banking and
Commerce Vol 13 No 1 pp 1-16
Almahmeed M AAlshirbini A and Paul G (2008)
ldquoAn Analytical Study of the Business Customer
Awareness PerceptionAttitude and Level of
Satisfactionrdquo Research Report Institute of
Banking Studies
Al-Sabbagh I and Molla A
(2004)Determinants of Internet and Cell Phone
Banking Adoption in South Africa available at
wwwarraydevcom commercejibc2005-
02brownhtm accessed in April 2005
Chung W and Paynter J (2002) An Evaluation
of Internet Banking in NewZealand in
Proceedings of 35th Hawaii Conference in
System Sciences (HICSS 2002) IEEE Society
Press 4 Gefen D Karahanna E and Straumlub
Featherman M S and Pavlou P A (2003)
ldquoPredicting e-Services Adoption A Perceived
Risk Facets Perspectiverdquo International Journal
of Hum Comput Stud Vol 59 No 4 pp451-
474
Joshua A J (2009) ldquoAdoption of Technology-
Enabled Banking Self-Services Antecedents and
Consequencesrdquo published PhD thesis
submitted to CUSAT Faculty of Social Sciences
Cochin available at
httpdyuthicusatacinxmluibitstreamhandl
epurl2010adoption 20of20technology-
enabled20banking20self-
services20pdfsequence =1 Accessed on
June 20 2011
Khurana S (2009) ldquoManaging Service Quality
An Empirical Study on Internet Bankingrdquo The
IUP Journal of Marketing Management Vol
VIII Nos 3 amp 4 pp 96-113
Maiyaki A and Mohd Mokhtas SS (2010)
ldquoEffects of Electronic Banking
FacilitiesEmployment Sector and Age Group on
Customersrsquo Choice of Banks in NigeriardquoJournal
of Internet Banking and Commerce Vol 15 No
1 pp 1-8
Maiyaki A and Mohd Mokhtas SS (2010)
ldquoEffects of Electronic Banking
FacilitiesEmployment Sector and Age Group on
Customersrsquo Choice of Banks in NigeriardquoJournal
of Internet Banking and Commerce Vol 15 No
1 pp 1-8
Selvam V and Nanjappa C (2011) ldquoCustomersrsquo
Awareness and Satisfaction About E-Banking A
Copyright copy2014 by International Journal of Sales Retailing and Marketing Vol 3 No 1 2014
44 IMPACT OF RISK FACTORS RELATED TO INTERNET BANKING WITH SPECIAL REFERENCE TO NATIONAL
CAPITAL REGION
Study with Reference to ICICI Bank
Gobichettipalayam TownrdquoPrajnan Vol 39 No
3 pp 218-22729 Sharma N Sehgal R K and
Goyal D P
Shergill GS and Li B (2005)Internet banking -
An empirical investigation of customers
behavior for online banking in New
ZealandJournal of E-business Vol 5(1) pp1-
169 Siu NY-M and Mou JCW(2005)
Singh A M (2004) ldquoTrends in South African
Internet Bankingrdquo Aslib Proceedings New
Information Perspectives Vol 56 No 3 pp
187-196
Suoranta M Mattila M and Munnukka J
(2005) Technology based Services A study on
the Drivers and Inhibitors of mobile
bankingInternational Journal of Management
and Decision Making Vol 6(1)
SURVIVING OR THRIVING AN EXPLORATORY STUDY INTO COMPETING FOR THE SOUTH AFRICAN
45
Copyright copy2014 by International Journal of Sales Retailing and Marketing Vol 3 No 1 2014
SURVIVING OR THRIVING AN EXPLORATORY STUDY
INTO COMPETING FOR THE SOUTH AFRICAN
SUPERMARKET SHOPPER
Justin Beneke
Abstract
The supermarket sector is a major component of the retail industry in South Africa Yet these
particular retail stores largely exist in a lsquosea of samenessrsquo where only subtle characteristics
differentiate them from each other This paper aims to investigate the means through which such
chains can achieve competitive advantage through the creation of customer commitment Whilst
structural bonds might create the impression that customers are loyal commitment goes beyond
behavioural loyalty and is argued to be a better indicator of the customerrsquos propensity to patronise
the retailer into the foreseeable future Through consideration of the retail mix this study determines
that low prices in-store promotions and facilities do not necessarily lead to customer commitment
whereas superior customer service and quality and variety of store merchandise are considerably
more influential in this respect However on the whole customer commitment in the supermarket
sector remains somewhat poor and needs to be further entrenched
Keywords behaviour commitment satisfaction structural bonds supermarkets retail mix
INTRODUCTION
There is little doubt that supermarket retailing
is a competitive business (Levy amp Weitz
2011187) Retailers need to face the realities of
todayrsquos market ndash changing demographics
increasingly sophisticated competitors and
overcapacity of the industry (Beneke 2010203
Cant amp Machado 200984 Kotler 200319)
Managing customer commitment is more
important than ever to ensure not only that
sales are bolstered but also to build continuous
patrongage and ultimately maximise customer
lifetime value (Stauss Chojnacki Decker amp
Hoffmann 20017 Thomas 2001262 Rowley
2005574) Committed customers have an
emotional connection with the retailer Their
reasons for continuing to patronise the retailer
extend beyond the convenience of the retailerrsquos
store andor the low prices and specific brands
on offer In fact many feel such goodwill
towards the retailer that they actively
encourage friends and family to buy from it
(Geyskens Steenkamp Scheer amp Kumar
1996303 Heskett 2002355 Kessim amp Abdulla
2006 424 Morgan amp Hunt 199420) Thus an
effective relationship marketing strategy for
managing commitment and loyalty with
customers is essential in retaining valuable
customers and subsequently developing a
sustainable competitive advantage (Liljander amp
Roos 2002 593)
Kotler and Armstrong (201032) define a
supermarket as a large low-cost low-margin
high-volume store that carries a wide variety of
food laundry and household products The
Justin Beneke is Senior Lecturer of Marketing at School
of Management Studies University of Cape Town
Tel 021 650 4392
Fax 021 689 7570
E-mail JustinBenekeuctacza
SURVIVING OR THRIVING AN EXPLORATORY STUDY INTO COMPETING FOR THE SOUTH AFRICAN
46
Copyright copy2014 by International Journal of Sales Retailing and Marketing Vol 3 No 1 2014
South African supermarket industry includes
major supermarkets such as the Pick n Pay
Shoprite SPAR and Woolworths groups as well
as some lesser known brands which are mainly
situated in smaller towns (FastMoving
2013Internet) The retail mix comprising the
various elements of the retailing function is
utilised by these stores to entice customers and
influence their purchasing behaviour Elements
in the retail mix include merchandise
assortments location pricing customer
service store design and display and the
communication mix of the retailer (Levy amp
Weitz 2011189) Retailers are thus faced with
the challlenge of developing a retail mix that
effectively satisfies its target market and drives
customer commitment
RESEARCH STATEMENT
This study aims to investigate the antecedents
of customer behaviour and commitment in the
South African supermarket industry Whilst
some customers might be behaviourally loyal
they may not necessarily possess true
commitment This may mean they are
vulnerable to defection in due course By
identifying and examining the significance of
these underlying drivers supermarket chains
can refine their strategy to play to their
strengths and minimise their weaknesses The
status quo of the industry will thus be probed
so as to determine general customer
satisfaction levels and the perceived
importance of retail mix attributes
LITERATURE REVIEW
The relationships between satisfaction loyalty
and commitment
Customer loyalty has become an increasingly
important aspect of marketing in the 21st
century (Beneke 2010203 Duffy 2005284)
Baker and Bass (200372) attributes this trend
to the rise of relationship marketing Slow
growth rates in mature markets have resulted
in the pool of new prospects being diminished
steering marketing attention toward retaining
and growing existing customer relationships
Consequently lsquocustomer loyaltyrsquo achieved
priority
Customer loyalty is described as a deeply held
commitment to re-buy or re-patronise a
preferred product or service consistently in the
future thereby causing repetitive same-brand
or same brand-set purchasing despite
situational influences and marketing efforts
having the potential to cause switching
behaviour (Knox 1998729 Oliver 199933
Passikoff 200614) Bowen and Chen (2001213)
assert that customer loyalty is difficult to define
and in general there are three distinctive
approaches to measure loyalty behavioural
measures attitudinal measures and composite
measures
The behavioural measurements consider
consistent repetitious purchase behaviour as
an indicator of loyalty (Bowen amp Chen
2001214) thus making a major assumption
that this repeat purchasing could capture the
loyalty of a consumer towards the supplier of
interest (Bandyopadhyay amp Martell 200735)
Oliver (199933) suggests that customer
satisfaction developed by way of product usage
is a necessary step in loyalty formation
however it becomes less significant as loyalty
begins to set through other mechanisms such as
individual fortitude (ie the degree to which the
consumer resists competitive pressure to switch
over to another brand) and social bonding (ie
the degree to which the community or the
society supports the consumer to remain loyal)
Attitudinal measurements consider the
emotional and psychological attachment
inherent in loyalty The attitudinal
measurements are concerned with the actual
sense of loyalty engagement and allegiance
(Bowen amp Chen 2001213) According to this
definition loyalty is the biased (ie non-
random) behavioural response (ie purchase)
expressed over time by some decision making
unit with respect to one or more alternative
suppliers out of a set of such suppliers and is a
SURVIVING OR THRIVING AN EXPLORATORY STUDY INTO COMPETING FOR THE SOUTH AFRICAN
47
Copyright copy2014 by International Journal of Sales Retailing and Marketing Vol 3 No 1 2014
function of psychological (decision making and
evaluative) processes (Jacoby amp Kyner 19731)
Jacoby and Kyner (19732) express that it is the
evaluation process that makes an individual
develop a commitment towards a supplier
The attitudinal and behavioural approaches
however examine loyalty unidimensionally In
contrast composite measurements of loyalty
combine the attitudinal and behavioural
dimensions and measure loyalty by variables
such as customersrsquo product preferences
propensity of brand-switching frequency of
purchase recency of purchase and total
amount of purchase (Hunter 199818 Pritchard
amp Howard 19972 Wong Dean amp White
199953)
A reputable example of the analysis of loyalty
using composite measurements is that
proposed by Dick and Basu (199499) who
argue that loyalty is determined by the strength
of the relationship between relative attitude
and repeat patronage and thus has both
attitudinal and behavioural elements Dick and
Basursquos (1994 cited by Garland amp Gendall
200481) customer loyalty model is an elegant
conceptualisation of attitude and behaviour
(Garland amp Gendall 200481) They suggest that
loyalty is the result of the interaction between a
customerrsquos relative attitude to a brand or
store and their repeat purchase behaviour The
typology divides customers in to four loyalty
groups (Dick amp Basu 199499) depicted in table
1
1 True loyals are customers with high
attitudinal and behavioural loyalty
2 Spurious loyals are those with high
behavioural loyalty but low attitudinal
loyalty
3 Latent loyals are those with high attitudinal
loyalty but low behavioural loyalty
4 Non loyals are those with low attitudinal and
behavioural loyalty
TABLE 1 DICK AND BASUrsquoS LOYALTY MODEL
Repeat Patronage
High Low
Relative
Attitude
High True loyalty Latent loyalty
Low Spurious loyalty No loyalty
Source Dick and Basu 1994 cited in Garland and Gendall 2004 82
Customer loyalty appears to be one of the most
discussed and contentious marketing concepts
of recent years (Through the Loop Consulting
2002Internet) Much of this debate and
ambiguity stems from the relationship between
customer loyalty and satisfaction Customer
satisfaction is
defined as the state in which customer needs
wants and expectations through the products
or servicesrsquo life are met or exceeded resulting in
repurchase brand loyalty and willingness to
recommend (Nicolson Kemp amp Linnell 19966)
Oliver (199933) argues that the two concepts
are
distinct Satisfaction is a fairly temporal post
usage state for one-time consumption or a
repeatedly experienced state for ongoing
consumption that reflects how the product or
service has fulfilled its purpose Loyalty on the
other hand is an attained state of enduring
preference to the point of determined defence
However he contends that satisfaction is an
essential ingredient for the emergence of
loyalty The ability to convert satisfied
customers into loyal customers is the pivot of
long-term success (Gitomer 19987)
It would appear that high customer satisfaction
does not always correlate with repeat
purchases and therefore with healthy profits
(Yudkin 199922) Dissatisfied customers donrsquot
always defect and satisfied customers
sometimes do Thus satisfaction alone cannot
SURVIVING OR THRIVING AN EXPLORATORY STUDY INTO COMPETING FOR THE SOUTH AFRICAN
48
Copyright copy2014 by International Journal of Sales Retailing and Marketing Vol 3 No 1 2014
predict future behaviour and customers may
even remain behaviourally loyal and not even
be happy with the product or service
Such behaviour has diminished the validity of
examining loyalty from only a behavioural
perspective Bandyopadhyay and Martell
(20072) assert that the existence of situational
factors (such as stock-out and non-availability)
intrinsic factors (such as individual fortitude) or
socio-cultural factors (such as social bonding)
that can differentiate between repeat purchase
and loyalty have prompted recent works that
have called for understanding and
operationalising brand loyalty beyond
behavioural measures Consequently advocates
of attitudinal loyalty have emphasised the
importance of the concept of customer
commitment
Customer commitment has sought to unravel
the confusion between satisfaction and loyalty
As such commitment involves the desire or
intention to maintain a valued relationship into
the future (De Wulf Odekerken-Schroumlder amp
Iacobucci 200133 Gundlach Achrol and
Mentzer 199578 Liljander and Leverin
2006232) Commitment is psychological rather
than behavioural and thus examines loyalty
from an attitudinal perspective Hofmeyr and
Rice (200355) contend that marketers cannot
deduce what consumers feel by observing their
behaviour Somebody who appears loyal could
in fact be completely uncommitted and switch
brands at the next purchasing occasion But
what customers feel dictates the way in which
the relationship between the customer and the
brand should be managed Commitment is
arguably synonymous with attitudinal loyalty
and thus these terms are often used
interchangeably
Commitment is built gradually during the
development of a relationship and parties can
be committed for different reasons Venetis and
Ghauri (20041577) identify three general
antecedents to commitment relational bonds
that are created between parties during the
course of the relationship the trust that has
been established between the partners and the
service quality
Relational bonds can be structural or social in
nature Structural bonds are the in a
relationship that if terminated will result in
considerable economical or financial costs for
the parties (Venetis amp Ghauri 20041577)
Turnbull and Wilson (1989233) assert that the
creation of a structural bond happens when the
two parties make investments that cannot be
retrieved when the relationship ends or when
it is difficult to end the relationship due to the
complexity and cost of changing suppliers The
more investments are made in a relationship
the more difficult its disengagement becomes
and the more a party will be committed to
continue the relationship regardless of their
satisfaction with the supplier An example of
such would be if the consumer is unable to
switch suppliers because the alternatives
require excessive travelling and as a result a
cost could be involved in transportation which
the consumer may not be able to afford
The social bonds are the interpersonal
relationships between the buyer and seller
(Turnbull amp Wilson 1989233 Bendapudi amp
Leone 20023) which are the glue that holds
the individuals together (Venetis amp Ghauri
20041577) Wilson (1995 cited by Venetis amp
Ghauri 2004) found that buyers who have a
strong personal relationship with the sellers are
more committed to maintaining the
relationship
The level of service quality is directly correlated
with the satisfaction the customer receives
from the supplierrsquos offering Satisfaction is
considered an important but not a necessary
condition for a party to be committed to the
relationship Genesan (19941) found that
satisfaction is directly and significantly related
to a partyrsquos relationship commitment whereas
Morgan and Hunt (199420) found that it did
not contribute significantly to a partyrsquos
commitment in comparison with structural ties
trust and share values Thus although
satisfaction is positively related to a partyrsquos
SURVIVING OR THRIVING AN EXPLORATORY STUDY INTO COMPETING FOR THE SOUTH AFRICAN
49
Copyright copy2014 by International Journal of Sales Retailing and Marketing Vol 3 No 1 2014
relationship committed its relative
contribution compared to the other
antecedents may be very small or insignificant
(Venetis amp Ghauri 20041577)
Venetis and Ghauri (20041577) contend that
only if the partner is considered trustworthy will
a party be willing to invest in and become
committed to the relationship thus trust is
needed for a relationship to develop Trust has
been defined as a consumerrsquos belief that another
party will perform actions that will lead to
positive outcomes for the firm as well as not
take unexpected actions that can lead to negative
outcomes (Anderson amp Narus 1990 cited by
Venetis amp Ghauri 2004) It reduces perceived
uncertainties and risk and is considered a key
variable for relationship success (Boersma
Buckley amp Ghauri 2003 1031 Morgan amp Hunt
199420 Kemp amp Ghauri 19986)
Retailers alas have limited direct control over
the relational bonds trust and satisfaction of
their customers However the retail mix
provides a set of tools which can be utilised
when developing a marketing strategy for
targeting customer commitment and loyalty
variables
Utilising the Retail Mix to influence Customer
Behaviour
The retail mix is used by retailers to ensure their
customersrsquo needs are met Elements in the
retail mix include merchandise assortments
location pricing customer service store design
and display and the communication mix of the
retailer (Levy amp Weitz 2011189) The dilemma
faced by marketers is to develop a retail mix
that creates customer satisfaction as well as
building customer commitment and loyalty
These aspects are explored below
Merchandise Assortments
Merchandise assortments are optimised by
retailers to ensure that the stock on shelf
matches customer demand Customers should
therefore have an adequate selection of
merchandise to choose from thereby
facilitating the ability to select the merchandise
which bests suits their needs and provides them
with satisfaction (Curhan 1972406)
Private label brands also known as store
brands are another variation of merchandise
assortment which retailers employ as an
instrument for generating store differentiation
store loyalty and store profitability (Corstjens amp
Lal 2000281 Mullick-Kanwar 2013Internet)
Private label brands typically have lower
variable costs and thus higher margins (Hoch amp
Banerjee 199357) Furthermore these brands
enable retailers to get better deals from
manufacturers in the form of lower wholesale
prices on national brands (Corstjens amp Lal 2000
281)
It is essential for retailers to supply high quality
merchandise and not just focus on offering
inexpensive low-quality products In other
words failing to provide the right combination
of high quality and low prices may result in a
merchandise assortment that is unsuccessful in
creating satisfaction amongst customers
(Stambaugh 199369)
CustomerService
Customer service with its final effect on
repurchasing by customers is considered one of
the most important constructs of the retail mix
(Caruana 2002811) Research points to the fact
that effective customer service satisfies
customers and in turn increases loyalty Lewis
and Booms (1983 cited by Caruana 2002) assert
that customer service is all about what
customers expect and the perceptions of how
these services are actually performed
Customer service tactics are highly effectively in
building commitment and loyalty It is widely
acknowledged that customers like to feel
appreciated The most effective channel at
achieving this in retail is by developing
favourable relationships between employees
and customers The first few words between
the employee and the customer set the tone for
the entire dialog and possibly even the entire
relationship Thus Gitomer (19988) asserts
that the single most important brick in the
SURVIVING OR THRIVING AN EXPLORATORY STUDY INTO COMPETING FOR THE SOUTH AFRICAN
50
Copyright copy2014 by International Journal of Sales Retailing and Marketing Vol 3 No 1 2014
foundation of customer service is ldquofriendlyrdquo A
friendly foundation is further complemented by
a positive attitude which represents the best
possibility of creating a positive customer
perception of the entire company Bad Service
experiences often drive a wedge between a
customer and a supplier (Duffy 2003480)
Retailers may provide unusually high-quality
customer service to build and maintain the
commitment and loyalty of their best
customers (Levy and Weitz 2011190) Heskett
Jones Loveman Sasser amp Schlesinger
(1994164) suggest that customer service will
lead to increases in firm profitability and market
value through the service-profit chain This
model proposes that customer service creates
positive consumer cognitions and behaviours
such as satisfaction and loyalty that create
financial benefits for the firm (Wiles 200719)
Customer service by providing additional value
for customers leads to increased customer
satisfaction (Anderson and Mittal 2000107)
Satisfaction in turn leads to increased
retention (Bolton 199845 Thomas 2001262
Zeithaml 200067) and to increased acquisition
through word-of-mouth recommendations
(Cronin and Taylor 199255) Retailer customer
service has been found to increase customer
satisfaction thus leading to increased
repurchase intentions willingness to
recommend and share-of-wallet (Beatty
Mayer Coleman Reynolds amp Lee 1996223
Dabholkar Thorpe and Rentz 19963 Reynolds
and Beatty 199911 Sirdeshmukh Singh and
Sabol 200215)
Improved customer service is a direct result of
well-organized employee training (Gallo
2012Internet) Cram (19949) argues that
employee training firstly requires the right staff
since without potential no amount of
dedicated training and development can
succeed Setting clear operational controls for
employees and communicating them effectively
is the basis for their understanding of the
organisationrsquos objectives This provides a sense
of direction in which any employee should
move in serving customers and solving their
problems Training can involve the usage of the
products sold or the best retailing techniques to
employ (Cram 19948) Training has its own
intrinsic merits in the way it can boost
operational efficiency and competence Part of
training is to refresh and update staff in order
to keep them informed of new initiatives and
changes The interaction between the customer
and the positive and enthusiastic employee can
provide an instantaneous positive impression
(Cram 19949) Store Location
Retail location is often considered to be the
most important element of the retail mix due to
the time and expense that is needed to find the
right location (Dufton Bailey amp Hopkins
2001Internet) The store choice decision can be
conceptualised as a problem of deciding where
and when to shop for the consumer (Popkowski
Leszczyc Sinha amp Timmerman 2000323) Store
choice and location are thus interrelated and
play a pivotal role in the decision making
process when deciding which store to attend
Store choice is dependent on the timing of
shopping trips as consumers may go to a
smaller convenient retail stores for short fill-in
trips and go to a larger store for regular
shopping trips (Kahn and Schmittlein 198955)
Store location thus has an impact on
convenience to customers as well as the type
of merchandise offered
Pricing
The price in a transaction is the balance point
between the interests of two parties In its
simplest terms it may represent the lowest
figure the supplier is prepared to accept for
parting with the product and the highest
amount the customer is prepared to pay The
essence of relationship marketing is that prices
should be driven by understanding the
customer Cram (199410) suggests that greater
value tends to be appreciated and builds
loyalty Further to this price should never be
used as a promotional weapon Price
promotions can result in unfavourable
outcomes They can start price wars teach
customers to await the next offer create
SURVIVING OR THRIVING AN EXPLORATORY STUDY INTO COMPETING FOR THE SOUTH AFRICAN
51
Copyright copy2014 by International Journal of Sales Retailing and Marketing Vol 3 No 1 2014
expensive demand surges and lead to
subsequent demand collapses
As the cost of advertising has dramatically
increased in recent years marketers are
increasingly turning to pricing and price related
promotions as a means of influencing
purchasing decisions by consumers
(Krishnamurthi amp Raj 1991172) Retailers have
realised the importance of pricing mechanisms
within marketing strategy and the role price
plays with regards to store loyalty and
commitment Customers who are committed to
specific brands will be less-sensitive to brand
price and thus not be concerned with the prices
of substitutes These consumers are more
inclined towards supermarkets which provide
them with a large assortment of merchandise
together with occasional discounted prices
Pricing is thus a pivotal component of the retail
mix and should be carefully managed to
consider all income groups and especially the
target market to attract customers and build
rapid short-term commitment
Communication Mix
A relationship begins with a conversation and
continuing communication maintains and
sustains it (Risdall 2013Internet) The most
important part of the communication strategy
is to ensure that communication is sufficiently
frequent More customers are lost through lack
of follow up and what appears to the
customers to be indifference than any other
cause of lost sales A study of competitor
communications may indicate real
opportunities to get closer to customers (Cram
19947)
A sales promotion is the offer of an incentive to
induce a desired sales result (Gilbert 1999 4) It
is a fundamental component of the
communication mix however researchers have
concluded that sales promotions can only lead
to a short-term increase in sales (Banks amp
Moorthy 1999371 Bawa amp Shoemaker
1987370 Diamond 1992254 Gupta amp Cooper
1992401 Kopalle amp Mela 1999317 Smith amp
Sinha 200083)
Store layout and design
Design management covers the store
environment packaging literature and
corporate identity It was discovered that
British consumers expect packaging to be of a
superior standard and thus are only attracted to
innovative packaging within stores (Vazquez
and Bruce 2002202) Design is thus a tool
which retailers employ in their marketing
strategy to differentiate their merchandise and
in the process strengthen their marketing
position Furthermore design can further be
broken down into pack store and corporate
design These three factors are essential for
effective store design and play an imperative
role with regards to consumersrsquo psychological
defences and entice them in becoming more
involved as well as interested in the retailerrsquos
merchandise
Store design goes beyond just the word
ldquodesignrdquo It involves atmospherics and adding
an ambience to attract customers thereby
creating a pleasurable buying experience
(Vazquez amp Bruce 2002202) It entails
developing certain areas and creating strategies
which will enhance customer commitment in
the process It was revealed that a strong brand
image influences buyer behaviour and purchase
decisions in a positive manner (Porter amp
Claycomb 1997373) A strong identity is thus
necessary in supermarket retailing and must be
managed with utmost care to create a cohesive
and persuasive shopping experience (Fitch
199158)
The importance of store design has undertaken a
new meaning within the retail industry in
underpinning supermarket positioning Viewing
areas special displays aisle widths and
customer traffic flows all influence the
customerrsquos impression of the store and as a
result determine levels of spending within the
store (Doyle amp Broadbridge 199972) This
requires ongoing management and can have a
SURVIVING OR THRIVING AN EXPLORATORY STUDY INTO COMPETING FOR THE SOUTH AFRICAN
52
Copyright copy2014 by International Journal of Sales Retailing and Marketing Vol 3 No 1 2014
significant impact on the perceived image of the
store (Newman amp Cullen 2001449)
METHODOLOGY
General Approach
In order to obtain a comprehensive view of the
elements of supermarket retailing strategy in
South Africa as well as attain an in depth
understanding of customer commitment
experience interviews were conducted
Valuable insight was provided from both an
academic and a commercial perspective
Experience interviews were conducted with
Alice Louw (Global amp Key Accounts Manager at
TNS Customer Equity) Suzanne Ackerman-
Berman (Director in Chairmanrsquos Executive
Committee at Pick n Pay) and Leon Erens
(Woolworths Constantia Store Manager)
Following the completion of the qualitative
research phase outlined above empirical data
needed to be collected in order to quantify the
analysis of customer commitment in relation to
supermarket retailing strategy Descriptive
research was conducted by constructing a self-
administered questionnaire which was
successfully completed by 304 respondents
from the general public Selecting which people
to survey was based on non-probability
sampling Quota sampling was also used to
ensure a fair representation of mainstream
supermarket customers in South Africa based
on data from Statistics South Africa and the All
Media amp Product Survey Although the sample
achieved is not necessarily reflective of the
South African population at large it is
reasonably in keeping with the profile of
mainstream supermarket shoppers in the
country
Overview of the Demographic Profile of the
Sample
The largest percentage of respondents was
Black (39 percent) followed by White (30
percent) and then Coloured (23 percent) while
the Indian and Asian population groups were
less significant (6 percent and 1 percent
respectively) The sample was split fairly evenly
between male and female respondents
However as special effort was made to
interview female respondents owing to them
generally being the primary household
shoppers there is a slight bias toward females
(58 percent) relative to males (42 percent) The
largest proportion of respondents was between
ages 18 and 25 (45 percent) followed by the 26
to 35 group (26 percent) and then the 36 to 45
group (14 percent) while ages 46 and above
were less significant (15 percent collectively)
The sample is thus to some extent biased
toward the younger demographic The sample
provided a fair representation of all the income
groups ndash higher income groups (ie earning R
15 000 per month and above) only represented
28 percent of respondents
Although slight biases were observed (eg the
sample skewed towards young to middle aged
Black lower-medium income group
respondents) this was deemed to be reasonable
as these nuances reflected the demographic of
the urban supermarket in South Africa
EMPIRICAL FINDINGS AND DISCUSSION
The relationship between customer loyalty and
the underlying antecedents (namely
satisfaction involvement an emotional
connection trust and structural relational
bonds) were comprehensively discussed in the
literature review Through utilising a basic
descriptive analysis the characteristics of the
average respondent with respect to these
antecedents and their loyalty were uncovered
These are detailed in table 2 Five point
semantic differential scales were used for all
except the last two scales listed in the table
SURVIVING OR THRIVING AN EXPLORATORY STUDY INTO COMPETING FOR THE SOUTH AFRICAN
53
Copyright copy2014 by International Journal of Sales Retailing and Marketing Vol 3 No 1 2014
TABLE 2 DESCRIPTIVE STATISTICS OF ATTITUDINAL AND BEHAVIOURAL CHARACTERISTICS
Characteristic Overall Response Mean Std Dev
Importance of store choice decision Important 138 049
Degree of loyalty Loyal 194 046
Loyal to the store because Satisfied with the offering 123 044
Satisfaction with the store offering Satisfied 416 067
Importance of an emotional connection Neutral 304 104
Importance of trust Important 391 081
Behavioural loyalty score Moderate ndash 15 out of 30 1507 366
Commitment score Moderate ndash 16 out of 30 1633 418
Source Authorrsquos own compilation
The average respondent considered which
supermarket store heshe shopped at to be an
important decision considered himherself
loyal to one specific supermarket store but
nonetheless shopped at other supermarkets
frequently and was generally satisfied with this
specific supermarketrsquos offering (S)he
considered the trustworthiness of this specific
store to be important but was indifferent over
whether (s)he had an emotional connection
with this specific store Lastly the average
respondent indicated both a commitment and
behavioural loyalty score in the moderate
range
The importance of trust was reiterated by Leon
Erens who asserts that customers desire value
for their money and trust gives them an
assurance of the value they will be receiving
Not only is it essential for the merchandise to
always be of the expected quality and
functionality but also that if it isnrsquot as the
customer expected the customer should be
able to trust that the store will reimburse them
or offer a substitute Erens further expressed
that trust is an element that is passed down to
generations and thus younger customers will
generally initially trust those retailers
introduced to them by family members
Alice Louw asserts that if customers care about
which supermarket store they shop at they are
considered to have a stronger involvement and
willingness to tolerate dissatisfaction before
switching stores This involvement dimension
can also be viewed as a measurement of
potential for
commitment As a measure of involvement
respondents were asked to determine whether
they considered which supermarket they
shopped at to be an important decision The
majority of respondents (62 percent indicated
that they considered this to be an important
decision This implies that these customers are
viewed as being ldquoinvolvedrdquo in their purchasing
decision
Respondents rated their level of satisfaction
with regards to the specific supermarket store
at which they shop of which 88 percent were
satisfied with the offering of the specific
supermarket store they shopped at However
Louw warns that without the presence of
involvement high satisfaction still produces
passive users with low repurchase rates in many
cases commitment requires both involvement
and satisfaction Two thirds (66 percent) of
respondents are both involved and satisfied
with their chosen store and thus have high
potential for commitment It is thus concluded
that the majority of South African customers
are satisfied and involved with the specific
supermarket store at which they shop and
consequently have high potential for
commitment
Furthermore Louw maintains that a
measurement of a customerrsquos emotional
connection to a supermarket is also an accurate
measurement of their commitment to that
SURVIVING OR THRIVING AN EXPLORATORY STUDY INTO COMPETING FOR THE SOUTH AFRICAN
54
Copyright copy2014 by International Journal of Sales Retailing and Marketing Vol 3 No 1 2014
supermarket In the survey respondents were
asked to rate the importance of an emotional
connection in their decision of where to shop
Despite the majority of respondents finding the
decision of which supermarket store they shop
at to be important the mean response for the
importance of an emotional connection was
only 304 interpreted as neutral This implies
that the degree of involvement is fairly low
Hence Louw describes these customers as
passive users who would be classified as
committed albeit on the shallow end of
commitment She notes that this specifically in
fast moving consumer goods retailing is fairly
common
The importance of structural bonds also needs
to be considered so that behavioural loyalty
isnrsquot interpreted as being a pure degree of
loyalty In this respect respondents were asked
whether they shopped at their specific
supermarket store because they were satisfied
with the storersquos offering or because they were
constrained to do so The vast majority of
respondents shopped at their specific
supermarket store because they were satisfied
with the store offering (77 percent)
Nevertheless a significant portion of the
respondents shopped at their specific
supermarket store because they were
constrained to do so (22 percent)
In order to determine the rationale for
customers to be constrained to a specific
supermarket store these constrained
respondents were asked why they were
constrained to shop there The most common
reason (52 percent) for respondents to be
constrained to their specific supermarket store
was due to travelling issues (eg they do not
own a motor vehicle or the other stores are too
far away) followed by convenience (25
percent) These findings emphasise the
importance of store location and accessibility
for retailers because situating a store in a
popular location which is considered
convenient by customers relative to other
supermarket stores attracts customers even if
their attitude towards the store is not
particularly positive
Of the respondents who were dissatisfied with
their specific supermarket storersquos offering 80
percent remained behaviourally loyal to a
specific store as a result of structural relational
bonds Louw concurs that often dissatisfied
customers stay with a brand (ie remain loyal)
due to physical barriers such as location or cost
or psychological barriers such as lsquothey care so
they stay with the brand and try to fix the
problemrsquo Suzanne Ackerman-Berman notes
that specifically in South Africa with many
people still living in poverty aspects of the
retail mix such as price and store location (due
to a cost being involved in transport) play a
pivotal role in determining which store these
customers frequent
The travelling constraint was further
emphasised when respondents were asked to
determine the distance they travelled to their
specific supermarket store The majority of
respondents (61 percent travelled less than 15
minutes to their specific supermarket store and
overall 87 percent travelled 30 minutes or less
to their specific store thus supporting the
pivotal role store location plays in attracting
customers Only 13 percent of respondents
travelled for more than 30 minutes clearly
illustrating that customers generally decide on a
store that is less than 30 minutes away and thus
it is concluded that lsquorequired travelling
distancersquo is a significant structural relational
bond
The six elements of the retail mix (namely price
merchandise assortment customer service
store design and layout communications mix
and location) were analysed by asking
respondents to rate the importance of each of
these elements when deciding which specific
supermarket store they shop at on a scale of 1-
5 The six elements were divided into thirteen
retail mix variables each of which is attributed
to one of the elements of the retail mix This is
reflected in table 3 The aggregated importance
scores are reflected in table 4 thereafter
SURVIVING OR THRIVING AN EXPLORATORY STUDY INTO COMPETING FOR THE SOUTH AFRICAN
55
Copyright copy2014 by International Journal of Sales Retailing and Marketing Vol 3 No 1 2014
TABLE 3 BREAKDOWN OF RETAIL MIX ELEMENTS INTO CLUSTERED VARIABLES
Retail Mix Element Inclusive Variables
Price Prices
Merchandise assortment Variety of merchandise quality of merchandise quality of fresh food
availability of private-label merchandise
Customer service Friendly service well-trained floor staff high quality customer service
Store design and layout Attractiveness of the store facilities available
Communications mix Brand of the Supermarket sales promotions
Location Convenient location
Source Authorrsquos own compilation
TABLE 4 DESCRIPTIVE STATISTICS OF THE RETAIL MIX ELEMENTS
Retail Mix Variable Overall Response Mean Std Dev Rank
Price Important 400 103 7
Variety of merchandise Important 423 083 4
Quality of merchandise Important 447 072 2
Quality of fresh food Very Important 470 058 1
Availability of private-label merchandise Neutral 311 106 13
Friendly service Important 408 091 5
Well-trained floor staff Important 383 010 9
High quality customer service Important 402 088 6
Attractiveness of the store Important 391 082 8
Facilities available Neutral 339 115 11
Brand of the supermarket Neutral 333 104 12
Sales promotions Neutral ndash Important 350 110 10
Convenient location Important 433 079 3
Source Authorrsquos own compilation
As indicated in the table above the quality of
fresh groceries was rated the most important
aspect whereas the availability of private-label
merchandise was considered the least
important
Ackerman-Berman reiterated that friendly
service and high-quality service are important
variables of the retail mix an area where Pick n
Pay have always placed emphasis Furthermore
she stressed the fact that these variables played
a fundamental role in providing consumers with
the lsquooverall shopping experiencersquo In an
environment where parity (or perceived parity)
across product range existed these variables
could well make the difference Erens too
expressed that high-quality customer service is
essential as it makes the customer feel valued
Nonetheless retailers should never lose sight of
the fact that their core offering (the
merchandise) needs to be impressive
CONCLUSIONS
In lieu of the findings of this research the
following conclusions are drawn
South African supermarket customers have
shallow commitment to the store
at which they shop
Whilst South African supermarket shoppers are
satisfied with their storesrsquo offering their
involvement is deemed to be moderate
Furthermore their emotional connection to the
store appears neutral Supermarket chains
therefore need to pay attention to exceeding
the customerrsquos expectations as
SURVIVING OR THRIVING AN EXPLORATORY STUDY INTO COMPETING FOR THE SOUTH AFRICAN
56
Copyright copy2014 by International Journal of Sales Retailing and Marketing Vol 3 No 1 2014
Low prices are not a sure guarantee that the
customer will stay Instead
merchandise and convenience of location
reign supreme
Somewhat interestingly customer service and
the in-store environment were not deemed of
the utmost importance The top tier of priorities
for supermarkets appear to be merchandise
and location Thereafter service delivery
becomes importance and may thus be
classified as the second tier of priorities The
third tier of priorities includes such aspects as
facilities available and sales promotions
Behaviourally loyal patronage to supermarkets
does not imply customer satisfaction with
supermarkets
Behavioural loyalty is a behavioural measure
while satisfaction and commitment are
attitudinal measures Frequent patronage to a
store may often be due to the structural
relational bond of travelling constraints and
not a result of customer satisfaction Findings
suggest that a significant relationship exists
between the travelling constraint and
behavioural loyalty thus stores which are in
close proximity to customersrsquo homes may
receive high patronage but not necessarily
customersrsquo commitment Competition
established in the vicinity may therefore have a
devastating effect on store patronage down the
line
REFERENCES
ANDERSON E amp MITTAL V 2000
STRENGTHENING THE SATISFACTION-PROFIT
CHAIN JOURNAL OF SERVICE RESEARCH 3(2)
107-120
ANDERSON E FORNELL C amp LEHMANN D 1994
CUSTOMER SATISFACTION MARKET SHARE
AND PROFITABILITY FINDINGS FROM SWEDEN
JOURNAL OF MARKETING 58(3) 53-66
AUBERT-GAMET V 1997 TWISTING
SERVICESCAPES DIVERSION OF THE PHYSICAL
ENVIRONMENT IN A RE-APPROPRIATION
PROCESS INTERNATIONAL JOURNAL OF
SERVICE INDUSTRY MANAGEMENT 8(1) 26-41
BAKER S amp BASS M 2003 NEW CONSUMER
MARKETING MANAGING A LIVING DEMAND
SYSTEM WEST SUSSEX WILEY
BANDYOPADHYAY S amp MARTELL M 2007 DOES
ATTITUDINAL LOYALTY INFLUENCE
BEHAVIOURAL LOYALTY JOURNAL OF
RETAILING AND CONSUMER SERVICES 14 35-
44
BANKS J amp MOORTHY S 1999 A MODEL OF
PRICE PROMOTIONS INTERNATIONAL JOURNAL
OF INDUSTRIAL ORGANIZATION 17371-398
BAWA K amp SHOEMAKER RW 1987 THE EFFECTS
OF DIRECT MAIL COUPON ON BRAND CHOICE
BEHAVIOUR JOURNAL OF MARKETING
RESEARCH 24(4) 370-376
BEATTY SE MAYER M COLEMAN JE REYNOLDS
KE amp LEE J 1996 CUSTOMER-SALES ASSOCIATE
RETAIL RELATIONSHIPS JOURNAL OF
RETAILING 72(3) 223-247
BENEKE J 2010 ldquoCONSUMER PERCEPTIONS OF
PRIVATE LABEL BRANDS WITHIN THE RETAIL
GROCERY SECTOR OF SOUTH AFRICA AFRICAN
JOURNAL OF BUSINESS MANAGEMENT 4(2)
203-220
BOERSMA M BUCKLEY P amp GHAURI P 2003
TRUST IN INTERNATIONAL JOINT VENTURE
RELATIONSHIPS JOURNAL OF BUSINESS
RESEARCH 56 (MARCH) 1031-1042
BOLTON RN 1998 A DYNAMIC MODEL OF THE
DURATION OF THE CUSTOMERrsquoS RELATIONSHIP
WITH A CONTINUOUS SERVICE PROVIDER THE
ROLE OF SATISFACTION MARKETING SCIENCE
17(1) 45-65
BOWEN JT amp CHEN SL 2001 THE RELATIONSHIP
BETWEEN CUSTOMER LOYALTY AND
CUSTOMER SATISFACTION INTERNATIONAL
JOURNAL OF CONTEMPORARY HOSPITALITY
MANAGEMENT 13(5) 213-217
SURVIVING OR THRIVING AN EXPLORATORY STUDY INTO COMPETING FOR THE SOUTH AFRICAN
57
Copyright copy2014 by International Journal of Sales Retailing and Marketing Vol 3 No 1 2014
BRINK A amp BERNDT B 2004 CUSTOMER
RELATIONSHIP MANAGEMENT AND CUSTOMER
SERVICE LANSDOWNE JUTA
CANT M amp MACHADO R (EDS) 2009
MARKETING SUCCESS STORIES 6TH ED CAPE
TOWN OXFORD UNIVERSITY PRESS
CALLOWAY J 2005 INDISPENSABLE HOW TO
BECOME THE COMPANY THAT YOUR
CUSTOMERS CANrsquoT LIVE WITHOUT NEW
JERSEY WILEY
CARUANA A 2002 SERVICE LOYALTY THE
EFFECTS OF SERVICE QUALITY AND THE
MEDIATING ROLE OF CUSTOMER
SATISFACTION EUROPEAN JOURNAL OF
MARKETING 36 (78) 811-828
CORSTJIENS M amp LAL R 2000 BUILDING STORE
LOYALTY THOUGH STORE BRANDS JOURNAL OF
MARKETING RESEARCH 37(3) 281-291
CRAM T 1994 THE POWER OF RELATIONSHIP
MARKETING LONDON PITMAN PUBLISHING
CRONIN JJ amp TAYLOR SA 1992 MEASURING
SERVICE QUALITY A RE-EXAMINATION AND
EXTENSION JOURNAL OF MARKETING 56 55-
68
CURHAN RC 1972 THE RELATIONSHIP
BETWEEN SHELF SPACE AND UNIT SALES IN
SUPERMARKETS JOURNAL OF MARKETING
RESEARCH 9(4) 406-412
DABHOLKAR PA THORPE DI amp RENTZ JO 1996
A MEASURE OF SERVICE QUALITY FOR RETAIL
STORES SCALE DEVELOPMENT AND
VALIDATION JOURNAL OF THE ACADEMY OF
MARKETING SCIENCE 24(1) 3-16
DE WULF K ODEKERKEN-SCHROumlDER G amp
IACOBUCCI D 2001 INVESTMENTS IN
CONSUMER RELATIONSHIPS A CROSS-
COUNTRY AND CROSS-INDUSTRY
EXPLORATION JOURNAL OF MARKETING 65(4)
33-50
DIAMOND WD 1992 JUST WHAT IS A DOLLAR
WORTH CONSUMER REACTIONS TO PRICE
DISCOUNTS VS EXTRA PRODUCT PROMOTIONS
JOURNAL OF RETAILING 68(3) 254-270
DICK A amp BASU K 1994 CUSTOMER LOYALTY
TOWARDS AN INTEGRATED FRAMEWORK
JOURNAL OF THE ACADEMY OF MARKETING
SCIENCE 22(2) 99-113
DOYLE SA amp BROADBRIDGE A 1999
DIFFERENTIATION BY DESIGN THE
IMPORTANCE OF DESIGN IN RETAILER
REPOSITIONING AND DIFFERENTIATION
INTERNATIONAL JOURNAL OF RETAIL AND
DISTRIBUTION MANAGEMENT 27(2) 72-83
DUFFY DL 2005 THE EVOLUTION OF
CUSTOMER LOYALTY STRATEGY JOURNAL OF
CONSUMER MARKETING 22(5) 284-286
DUFFY DL 2003 INTERNAL AND EXTERNAL
FACTORS WHICH AFFECT CUSTOMER LOYALTY
JOURNAL OF CONSUMER MARKETING 20(5)
480-485
DUFTON H BAILEY JM amp HOPKINS T 2001 THE
RETAIL STORE DESIGN FOR PROFITABILITY
[INTERNET
HTTPWWWTEXTILESUMISTACUKRESEARC
HTEXONLINEMAN99DUFTONHTM
DOWNLOADED 16 MAY 2011]
DUVEEN-APOSTOLOU S 2006 INTRODUCTION
TO CONVERSION MODEL PRESENTATION AT
UNIVERSITY OF CAPE TOWN ON 18 SEPTEMBER
2006
FASTMOVING 2013 GENERAL SUPERMARKET
RETAIL STORES IN SOUTH AFRICA [INTERNET
HTTPWWWFASTMOVINGCOZARETAILERS
CATEGORYGENERAL-SUPERMARKETS-196
DOWNLOADED 25 JANUARY 2013]
FITCH R 1991 SUCCESS IN RETAILING
IDENTITIES DESIGN MANAGEMENT JOURNAL
14(2) 58-61
GENESAN S 1994 DETERMINANTS OF LONG-
TERM ORIENTATION IN BUYER-SELLER
RELATIONSHIPS JOURNAL OF MARKETING
58(2) 1-19
GALLO C 2012 APPLErsquoS SECRET EMPLOYEE
TRAINING MANUAL REINVENTS CUSTOMER
SERVICE IN SEVEN WAYS [INTERNET
HTTPWWWFORBESCOMSITESCARMINEGA
LLO20120830APPLES-SECRET-EMPLOYEE-
TRAINING-MANUAL-REINVENTS-CUSTOMER-
SERVICE-IN-SEVEN-WAYS DATED 30 AUGUST
2012]
SURVIVING OR THRIVING AN EXPLORATORY STUDY INTO COMPETING FOR THE SOUTH AFRICAN
58
Copyright copy2014 by International Journal of Sales Retailing and Marketing Vol 3 No 1 2014
GARLAND R amp GENDALL P 2004 TESTING DICK
AND BASUrsquoS CUSTOMER LOYALTY MODEL
AUSTRALIAN MARKETING JOURNAL 12(3) 81-
87
GEYSKENS I STEENKAMP J SCHEER LK amp
KUMAR N 1996 THE EFFECTS OF TRUST AND
INTERDEPENDENCY ON RELATIONSHIP
COMMITMENT INTERNATIONAL JOURNAL OF
RESEARCH IN MARKETING 13 (OCTOBER) 303-
317
GILBERT DC amp JACKARIA N 2002 THE EFFICACY
OF SALES PROMOTIONS IN UK SUPERMARKETS
A CONSUMER VIEW INTERNATIONAL JOURNAL
OF RETAIL amp DISTRIBUTION MANAGEMENT
30(6) 315-322
GITOMER J 1998 CUSTOMER SATISFACTION IS
WORTHLESS CUSTOMER LOYALTY IS PRICELESS
AUSTIN BARD PRESS
GUPTA S amp COOPER L 1992 THE DISCOUNTING
OF DISCOUNTS AND PROMOTION THRESHOLDS
JOURNAL OF CONSUMER RESEARCH 19(3)
401-411
GUNDLACH G ACHROL R amp MENTZER J 1995
THE STRUCTURE OF COMMITMENT IN
EXCHANGE JOURNAL OF MARKETING
59 (1) 78-92
HOCH S amp BANERJI S 1993 WHEN DO PRIVATE
LABELS SUCCEED SLOAN MANAGEMENT
REVIEW 34(4) 57-78
HUNTER VL 1998 MEASURE CUSTOMER
LOYALTY FOR COMPLETE PICTURE OF ROI
BUSINESS MARKETING 83(3) 18-30
HESKETT JL 2002 GURUrsquoS VIEW BEYOND
CUSTOMER LOYALTY MANAGING SERVICE
QUALITY 12(6) 355-357
HESKETT JL JONES TO LOVEMAN GW SASSER
WE amp SCHLESINGER LA 1994 PUTTING THE
SERVICE-PROFIT CHAIN TO WORK HARVARD
BUSINESS REVIEW 72 164-174
HOFMEYR J amp RICE B 2003 COMMITMENT-LED
MARKETING WEST SUSSEX WILEY
JACOBY J amp KYNER DB 1973 BRAND LOYALTY
VS REPEAT PURCHASING BEHAVIOUR
JOURNAL OF MARKETING RESEARCH
10 (1) 1-9
KAHN BE amp SCHMITTLEIN DC 1989 SHOPPING
TRIP BEHAVIOR AN EMPIRICAL INVESTIGATION
MARKETING LETTERS 1(1)
55-69
KESSIM N amp ABDULLA A 2006 THE INFLUENCE
OF ATTRACTION ON INTERNET BANKING AN
EXTENSION TO THE TRUST-RELATIONSHIP
COMMITMENT MODEL INTERNATIONAL
JOURNAL OF BANK MARKETING 24(6) 424-442
KNOX S 1998 LOYALTY BASED SEGMENTATION
AND THE CUSTOMER DEVELOPMENT PROCESS
EUROPEAN MANAGEMENT JOURNAL 16(6)
729-737
KOPALLE PK amp MELA CF 1999 THE DYNAMIC
EFFECT OF DISCOUNTING OF SALES EMPIRICAL
ANALYSIS AND NORMATIVE PRICING
IMPLICATIONS MARKETING SCIENCE 18(3)
317-322
KOTLER P amp ARMSTRONG G 2010 PRINCIPLES
OF MARKETING 13TH ED NEW JERSEY
PEARSON EDUCATION
KOTLER P 2003 MARKETING MANAGEMENT
11TH ED NEW JERSEY PEARSON EDUCATION
KRISHNAMURTHI L amp RAJ SP 1991 AN
EMPIRICAL ANALYSIS OF THE RELATIONSHIP
BETWEEN BRAND LOYALTY AND CONSUMER
PRICE ELASTICITY MARKETING SCIENCE 10(2)
172-183
LEVY M amp WEITZ B 2011 RETAIL
MANAGEMENT 8TH ED NEW YORK MCGRAW-
HILLIRWIN
LILJANDER V amp LEVERIN A 2006 DOES
RELATIONSHIP MARKETING IMPROVE
CUSTOMER RELATIONSHIP SATISFACTION AND
LOYALTY INTERNATIONAL JOURNAL OF BANK
MARKETING 24(4) 232-251
LILJANDER V amp ROOS I 2002 CUSTOMER-
RELATIONSHIP LEVELS ndash FROM SPURIOUS TO
TRUE RELATIONSHIPS JOURNAL OF SERVICES
MARKETING 16(7) 593-614
MORGAN R amp HUNT S 1994 THE
COMMITMENT-TRUST THEORY OF
RELATIONSHIP MARKETING JOURNAL OF
MARKETING 58(3) 20-38
MULLICK-KANWAR M 2013 THE EVOLUTION
OF PRIVATE LABEL BRANDING [INTERNET
SURVIVING OR THRIVING AN EXPLORATORY STUDY INTO COMPETING FOR THE SOUTH AFRICAN
59
Copyright copy2014 by International Journal of Sales Retailing and Marketing Vol 3 No 1 2014
HTTPWWWBRANDCHANNELCOMPAPERS_
REVIEWASPSP_ID=360 DOWNLOADED 25
JANUARY 2013]
NEWMAN AJ amp CULLEN P 2001 FROM RETAIL
THEATRE TO RETAIL FOOD SHOW THE
SHRINKING FACE OF GROCERY BRITISH FOOD
JOURNAL 103(7) 443-452
NICOLSON J KEMP J amp LINNELL P 1996 DOES
THE RHETORIC OF CUSTOMER SERVICE MATCH
THE REALITY MANAGING SERVICE QUALITY
6(3) 6-9
OLIVER RL 1999 WHENCE CUSTOMER
LOYALTY JOURNAL OF MARKETING 63 33-44
PASSIKOFF R 2006 PREDICTING MARKET
SUCCESS NEW WAYS TO MEASURE CUSTOMER
LOYALTY AND ENGAGE CONSUMERS WITH
YOUR BRAND NEW JERSEY WILEY
POPKOWSKI LESZCZYC PTL SINHA A amp
TIMMERMAN HJP 2000 CONSUMER STORE
CHOICE DYNAMICS JOURNAL OF RETAILING
76(3) 323-345
PORTER S amp CLAYCOMB C 1997 THE
INFLUENCE OF BRAND RECOGNITION ON
RETAIL STORE IMAGE JOURNAL OF PRODUCT
AND BRAND MANAGEMENT 6(6) 373-387
PRITCHARD MP amp HOWARD DR 1997 THE
LOYAL TRAVELER EXAMINING A TYPOLOGY OF
SERVICE PATRONAGE JOURNAL OF TRAVELERS
RESEARCH 35(4) 2-10
REYNOLDS KE amp BEATTY SE 1999 CUSTOMER
BENEFITS AND COMPANY CONSEQUENCES OF
CUSTOMER-SALESPERSON RELATIONSHIPS IN
RETAILING JOURNAL OF RETAILING 75 11-32
RISDALL J 2013 FROM ADVERTISING TO
CONVERSATION MARKETING [INTERNET
HTTPMINNESOTABUSINESSCOMEXPERTS-
FORUMADVERTISING-CONVERSATION-
MARKETING DOWNLOADED 25 JANUARY 2013]
ROWLEY J 2005 THE FOUR CS OF CUSTOMER
LOYALTY MARKETING INTELLIGENCE AND
PLANNING 23(6) 574-581
SIRDESHMUKH D SINGH J amp SABOL B 2002
CONSUMER TRUST VALUE AND LOYALTY IN
RELATIONAL EXCHANGES JOURNAL OF
MARKETING 66 15-37
SMITH M amp SINHA I 2000 THE IMPACT OF
PRICE AND EXTRA PRODUCT PROMOTIONS ON
STORE PREFERENCE INTERNATIONAL JOURNAL
OF RETAIL amp DISTRIBUTION MANAGEMENT
28(23) 83-92
STAMBAUGH S 1993 TO STORE BRAND OR
NOT TO STORE AFTERMARKET BUSINESS
103(6) 69-78
STAUSS B CHOJNACKI K DECKER A amp
HOFFMANN F 2001 RETENTION EFFECTS OF A
CUSTOMER CLUB INTERNATIONAL JOURNAL OF
SERVICE INDUSTRY MANAGEMENT 12(1) 7-19
THOMAS J 2001 A METHODOLOGY FOR
LINKING CUSTOMER ACQUISITION TO
CUSTOMER RETENTION JOURNAL OF
MARKETING RESEARCH 38(2) 262-268
THROUGH THE LOOP CONSULTING LTD 2002
THE PARADOX OF LOYALTY [INTERNET
ltHTTPWWWTHROUGHTHELOOPCOMKNO
WLEDGEBRAND13HTML DOWNLOADED 17
MARCH 2011]
VAZQUEZ D amp BRUCE M 2002 DESIGN
MANAGEMENT THE UNEXPLORED RETAIL
MARKETING COMPETENCE JOURNAL OF RETAIL
AND DISTRIBUTION MANAGEMENT 30(4) 202-
210
VENETIS KA amp GHAURI PN 2004 SERVICE
QUALITY AND CUSTOMER RETENTION
BUILDING LONG-TERM RELATIONSHIPS
EUROPEAN JOURNAL OF MARKETING 38
(1112) 1577-1598
WILES MA 2007 THE EFFECT OF CUSTOMER
SERVICE ON RETAILERSrsquo SHAREHOLDER
WEALTH THE ROLE OF AVAILABILITY AND
REPUTATION CUES JOURNAL OF RETAILING
83(1) 19-31
WONG A DEAN A amp WHITE CJ 1999
CUSTOMER BEHAVIORAL INTENTIONS IN THE
HOSPITALITY INDUSTRY AUSTRALIAN JOURNAL
OF HOSPITALITY MANAGEMENT 6 53-63
YUDKIN M 1999 INGREDIENTS OF CUSTOMER
LOYALTY [INTERNET
HTTPWWWEPROMOSCOMEDUCATIONCEN
TER-LOYALITYJSP DOWNLOADED 17 MARCH
2011]
SURVIVING OR THRIVING AN EXPLORATORY STUDY INTO COMPETING FOR THE SOUTH AFRICAN
60
Copyright copy2014 by International Journal of Sales Retailing and Marketing Vol 3 No 1 2014
ZEITHAML VA 2000 Service Quality
Profitability and the Economic Worth of
Customers What We Know and What We Need
to Learn Journal of the Academy of Marketing
Science 28(1) 67-85
Copyright copy2014 by International Journal of Sales Retailing and Marketing Vol 3 No 1 2014
61 THE ICT EFFECTS AND THE SWITCHING COSTS IN THE RELATIONAL VARIABLES AN APPLICATION IN RETAIL
TRADE OF GREECE AND SPAIN
THE ICT EFFECTS AND THE SWITCHING COSTS IN THE
RELATIONAL VARIABLES AN APPLICATION IN RETAIL
TRADE OF GREECE AND SPAIN
Irene Gil-Saura Konstantinos-Faidon Sylvestros amp Beatriz Moliner Velazquez
Abstract
The perceived value has been converted to a fundamental construct in the retail context acting as
consequence and antecedent of key conduct variables The present study tries to analyze the
influence of information and communication technologies (ICT) and that of switching costs on a
group of relationship variables We aim to analyze the causal relations and their effects in the textile
sector of the Greek and Spanish market The results show the existing relations of perceived value
with the antecedents and consequences proposed in the model except the ICT
Key words ICT perceived value switching costs commitment
INTRODUCTION
Various essays recognize that the complexity
that changes cause to the market like the
intense competition and the technological
development creates difficulties to
management especially in fast changing
markets (Ferreiros 2012) From this
perspective a firm strategy that becomes
increasingly important is customer retention In
this direction academic research on retailing
seems that focuses on concepts like supplier
dependence (Andaleeb 1995) value (Anderson
and Narus 1990) commitment (Morgan and
Hunt 1994) or loyalty (Reynolds and Beaty
1999) In this sense perceived value is being
perceived as a clientacutes total evaluation about
the relational exchange with retailer (Saacutenchez
et al 2010)
Moreover concerning the distribution
channels a tendency towards globalization can
be observed which summons the research
question if relational variables have stable
perceptions from an international perspective
In this framework the present study tries to
analyze the effects of the changes of dynamic
variables like the ICT in the point of sales on
perceived value commitment and loyalty The
starting point of this study is the evidence of
previous studies about the significance of the
factors that influence this process Additionally
we intend to detect the possible differences
between the generated perceptions of these
variables in two geographical fields Spain and
Greece In summary this study attempts to
contribute through its results and its
conclusions to the supplier efforts in order to
provide sustainable competitive advantages
through the development of management
systems and business differentiation based on
Dr Irene Gil-Saura PhD professor at Department of Market Commercialization and Research University of Valencia Spain (email irenegilluves) Konstantinos - Faidon Sylvestros professor at Department of Market Commercialization and Research University of Valencia Spain (e-mail konsylalumniuves) Beatriz Moliner Velasquez professor at Department of Market Commercialization and Research University of Valencia Spain (email beatrizmolineruves)
Copyright copy2014 by International Journal of Sales Retailing and Marketing Vol 3 No 1 2014
62 THE ICT EFFECTS AND THE SWITCHING COSTS IN THE RELATIONAL VARIABLES AN APPLICATION IN RETAIL
TRADE OF GREECE AND SPAIN
client orientation and more specifically on the
delivery of value
RESEARCH THEORETICAL FRAMEWORK
LITERATURE REVIEW
The study of Value in marketing
In recent marketing investigation we can
observe an increasing interest in the study of
creation of value between the concerning parts
of the relationship (Groumlnroos 2000)
From the review concerning value it is
confirmed that the construct is complex and
multidimensional In respect of its conceptual
definition various authors widely accept the
proposal of Zeithaml (1988) (eg Caruana et al
2000) According to Zeithaml (198814)
perceived value can be seen like ldquothe
customerrsquos overall assessment of the utility of a
product based on perceptions of what is
received and what is givenrdquo In this way Oliver
(199945) adds that value is ldquoa positive function
of what is received and a negative function of
what is sacrificedrdquo however perceptions
exclusively positive or negative can also be
named value In more recent studies the
treatment of perceived value as a
multidimensional construct has gained ground
(Sweeney and Soutar 2001) This evolution has
benefited research in this field as it has
permitted the evaluation of the experience
factor that consumers perceive in the store In
this direction the present study highlights the
contribution of Sweeney and Soutar (2001)
who based on the study of Sheth et al (1991)
they retain three dimensions in order to explain
the nature of perceived value In particular
they use the social value that expresses the
utility that derives from the supplierrsquos capacity
to increase the social self-concept the
emotional value that is associated with the
feelings or affective states generated by the
point of sales and the functional value that
contains two elements First itrsquos the utility
related to the price that derives from the cost
reduction applied by the supplier in short or
long term Second the functional value is
associated to the perceived quality and the
expected results form the supplier
Antecedents and consequences of value
As it is highlighted in the literature there exists
a number of variables that are antecedents of
perceived value and influence significantly the
construct Among these variables we stress the
important influence of ICT The significance of
the ICTsrsquo application in the firms and their
effects in terms of relationship benefits has
been confirmed during the last years (Ruiz et
al 2010a b) Ryssel et al (2004) point out that
ICT is a term that comprises every form of
technology in order to create capture
manipulate communicate exchange present
and use information in various forms (company
data voice conversations photos drawings
multimedia presentations and other forms
included that are not invented yet)
On the other hand the concept of ldquoswitching
costsrdquo appears in the literature since 90s within
the framework of the relationship evaluation
that maintains the company in contact with its
environment In the area of trade distribution
the switching costs are defined as the perceived
costs by the buyer to change his actual supplier
for a new one
These costs include the associated to the
change of spending time money and
psychological cost (Dick and Basu 1994)
In addition to the antecedents the variables
consequences of value have had a prominent
role with regard to the results of marketing
research
Various academic studies have pointed out
commitment as one of the main determinants
in the creation of long-term relationships
between supplier and customer (Ryssel et al
2004) According to Morgan and Hunt
(199423) ldquothe belief of an exchange partner
that the ongoing relationship with another is so
important as to warrant maximum efforts at
maintaining itrdquo Also relationship dependence
is a construct that emerges as relevant to
Copyright copy2014 by International Journal of Sales Retailing and Marketing Vol 3 No 1 2014
63 THE ICT EFFECTS AND THE SWITCHING COSTS IN THE RELATIONAL VARIABLES AN APPLICATION IN RETAIL
TRADE OF GREECE AND SPAIN
explain commitment Emerson (1962) as well
developed the dependence theory form an
interpersonal perspective According to this
theory dependence is perceived as a function
of two factors the value of the goal for the
individual and the existence of alternative ways
to achieve this goal Thus it is concluded that
the dependence of a person is directly related
to the benefits obtained form the resource and
inversely related to the alternative resources of
these benefits
Finally an important relational variable in terms
of its links with value and loyalty Loyalty has
been considered as a significant influence for
the retention of the client and for the repetitive
purchase (Griffin 1996) In this context Dick
and Basu (1994) have interpreted loyalty as the
combination of a positive attitude and purchase
repetition
Research hypotheses
As mentioned previously companies develop
their activities in a highly changing
environment where technological innovations
play a key role in the relationships with the
customer In this way we understand that ICT
exert a positive influence on relationship value
of the company with its suppliers and
customers (Mentzer and Williams 2001 Gil et
al 2008) This permits us to form the basis for
the first working hypotheses
H1a The retailerrsquos ICT intensity has a positive
influence on quality as part of the functional
value that is perceived by the customer
H1b The retailerrsquos ICT intensity has a positive
influence on price as part of the functional
value that is perceived by the customer
H1c The retailerrsquos ICT intensity has a positive
influence on the emotional value that is
perceived by the customer
H1d The retailerrsquos ICT intensity has a positive
influence on the social value that is perceived by
the customer
On the other hand switching costs refer to
benefit and loss costs (White and
Yanamandram 2007) These costs are related
to a customer evaluation about the positive and
negative aspects derived from his permanence
in the relationship with the current supplier
These benefits can be related to the product
and its quality its price and also they can
include social benefits as the relationship of
trust and friendship with the personnel of the
store This enables the creation of value in the
relationship with the retailer and that in turn
provokes entry barriers for the competition and
at the same time creates barriers for a possible
exit of the customer from this link through the
switching costs effect (Lovelock 1991) The
previous considerations permit us to propose
the following hypotheses
H2a The switching costs exert a positive effect
on quality as part of the functional value
perceived by the customer
H2b The switching costs exert a positive effect
on price as part of the functional value
perceived by the customer
H2c The switching costs exert a positive effect
on emotional value that is perceived by the
customer
H2d The switching costs exert a positive effect
on social value that is perceived by the customer
Moreover the conceptualization of value
proposed by Zeithaml (1988) underlines that
the components of quality and price have
relevant as well as different effects on
perceived value (Sweeney and Soutar 2001)
Thus that leads us to propose as working
hypotheses
H3a Quality has a positive influence on
perceived value
H3b Price has a positive influence on perceived
value
Sheth et al (1991) conclude that besides
functional value (quality and price) other
dimensions of value like the social and
emotional component result determinant as
well in customerrsquos choices Based on these
relations defined in the literature we conclude
that
H3c Emotional value has a positive impact on
perceived value
Copyright copy2014 by International Journal of Sales Retailing and Marketing Vol 3 No 1 2014
64
H3d Social value has a positive impact on
perceived value
Several studied have stressed the relationship
between perceived value and commitment
(Morgan and Hunt 1994 Sweeney and Soutar
2001)
In this regard Simpson et al (2001) reach the
conclusion that customerrsquos perceived value
about the company can positively influence on
commitment Therefore we propose that
H4 Perceived value positively influences on
customerrsquos commitment with the retailer
Likewise literature confirms the positive
relation between dependence and commitment
(Srinivasan 2008) Within this context the
existence of alternative retailers has been
considered a potential factor that contributes
to the creation of value (Sharland 1997) as it
enhances the market alternatives and for this
purpose can significantly affect customerrsquos
commitment (Fullerton 2005) That permits us
to formulate the following working hypothesis
H5 Customerrsquos dependence from the supplier
positively influences on commitment with that
supplier
On the other hand Evanschitzky et al (2006)
have highlighted that royalty derives from
commitment which in turn determines
development and maintenance of relationships
of value between buyer and seller (Morgan and
Hunt 1994) This assumption leads us to define
the last working hypothesis
H6 Customerrsquos commitment with the retailer
has a positive effect on customerrsquos loyalty
Figure 1 Proposal of the model
EMPIRICAL RESEARCH METHODOLOGY AND
EVALUATION OF RESULTS
Research approach and data collection
Taking in account the literature review and the
research objectives a questionnaire was
elaborated in order to collect information about
the final customer and his opinion regarding the
group of variables submitted to this research
model
These variables retained in the research were
estimated as following in Table 1
Switching
costs
H2b
ICT
intensity
Dependence
Perceived
value
H1a
H5
Commitment Loyalty H4 H6
Quality
Price
Emotional
value
Social
value
H1b
H1c
H1d
H2c
H2d
H2a
H3a
H3c
H3d
H3b
Copyright copy2014 by International Journal of Sales Retailing and Marketing Vol 3 No 1 2014
65
Table 1 Technical details of the research
GEOGRAPHICAL FIELD Athens Greece and Valencia Spain
UNIVERSE Individuals older than 18 years old
METHODOLOGY Personal interviews through structured questionnaire
SAMPLE SIZE 207 valid surveys
FIELDWORK DATE August 2012
SCALES (5 POINTS LIKERT)
ICT - Observatory (2006) Ruiz et al (2010 a and b)
Switching costs - Patterson and Smith (2001)
Perceived value - Sweeney and Soutar (2001)
Dependency - Gil et al (2011)
Commitment - Hennig-Thurau (2004) Loyalty - Srinivasan et al (2002) and Anderson and Srinivasan (2003)
STATISTICAL TECHNIQUES Descriptive analysis
Analysis of Variance
STATISTIC SOFTWARE PLS 20 SPSS 17
Table 2 Validation of the measuring instrument
Variable Indicator LoadingsWeights T value α Cronbach IFC AVE
ICT INTENSITY
TIC1- Barcode scanner 0899 34990
0954 0964 0819
TIC2- CreditDebit card payment 0696 87389
TIC3- Telephone 0961 104534
TIC4- Fax 0966 92416
TIC5- E-mail 0923 40748
SWITCHING COSTS
COS1- Little effort is required to buy in this store 0073 0661
NA NA NA
COS2- This store solves me some of my problems 0532 5204
COS3- I would waste a lot of time if I changed 0313 2470
COS4- I will lose a friendly and comfortable relationship if I change 0033 0409
COS5- If I change therersquos a risk the new one wouldnrsquot be as good 0243 1951
COS6- The time I need to buy in this store is acceptable 0149 1265
PERCEIVED VALUE
CAL- Quality 0293 3912
NA NA NA PRE- Price 0269 3183
EMO- Emotional value 0244 2740
SOC- Social value 0471 4901
COMMITMENT
COMP1- My relationship with the store is important 0943 93541
0921 0954 0875 COMP2- If the store closed it would be a loss for me 0946 103025
COMP3- I feel committed to this store 0917 79768
LOYALTY
LEAL1- I doubt that I would switch stores 0739 21347
0846 0935 0743
LEAL2- I try to use this store whenever I purchase 0863 56433
LEAL3- This store is my first choice 0902 71999
LEAL4- This store is the best for me 091 95832
LEAL5- This is my favourite store 0884 61780
Copyright copy2014 by International Journal of Sales Retailing and Marketing Vol 3 No 1 2014
66
plt005 plt010 NA Not applicable The underlined indicators correspond to formative variables Source Own formulation
This quantitative research was carried out
through a survey addressed to 207 buyers of
retail stores of shoes and clothes in Athens and
Valencia The fieldwork took place during
August 2012 in the exit of the stores In relation
to some traits of the survey it is stressed that
7714 of the respondents are women as
expected as the purchase of shoes and clothes
is an activity made more often by women who
are more interested in buying clothes than men
(Cowart and Goldsmith 2007) Additionally
more than 80 of the respondents are not
older than 45 years old with a major
representativeness of the segment 26-35 years
old considering that retail stores attract a
younger and more extended age segment
32 Results
In relation to the validation process of the
measuring instrument in the first place we
estimate the convergent validity which is
analyzed for each indicator through the
loadings the crossloadings and the average
mean-variance (Fornell and Larcker 1981) and
secondly the discriminant validity and the
reliability were analyzed All the results were
acceptable as it can be seen in Table 2
With regard to the hypotheses addressed here
as Table 3 illustrates the structural model
permits to accept five out of six hypotheses
regarding the existing relations between the
different constructs
Table 3 Hypotheses testing
Causal relation Hypothesis Standardized β T value
H1 ICT -gt PERCEIVED VALUE Rejected 0062 ns 1346
H2 SWITCHING COSTS -gt PERCEIVED VALUE Accepted 0060 10262
H3a QUALITY -gt PERCEIVED VALUE Accepted 0035 21888
H3b PRICE -gt PERCEIVED VALUE Accepted 0045 14482
H3c EMOTIONAL VALUE -gt PERCEIVED VALUE Accepted 0023 37787
H3d SOCIAL VALUE -gt PERCEIVED VALUE Accepted 0023 35317
H4 PERCEIVED VALUE -gt COMMITMENT Accepted 0056 6378
H5 DEPENDENCE -gt COMMITMENT Accepted 0055 7488
H6 COMMITMENT -gt LOYALTY Accepted 0020 42214
Perceived Value Rsup2=01571 Commitment Rsup2=01861 Loyalty Rsup2=05606 plt 005 ns non significant
The intensity of ICT application from retailers in
Greece and in Spain is the only addressed
assumption that cannot be confirmed The
results show that ICT donacutet affect customeracutes
perceived value (H1 β= 0062 ns) This result
coincides with the obtained of Comer et al
(1998) who reveal that technology doesnacutet
influence significantly the relational variables
(satisfaction commitment loyalty) something
that posterior studies also corroborate (eg
Ruiz-Molina et al 2010b)
Additionally a t-test is carried out with the
objective to detect possible differences in the
relative perceptions on the retained variables of
Copyright copy2014 by International Journal of Sales Retailing and Marketing Vol 3 No 1 2014
67
the model between Greek and Spanish
consumers (see Table 4)
Table 4 Evaluation of the variables by nationality
Mean values and significant differences
Variable Indicator
Total mean value
Group1 Greece
Group2 Spain F
ICT INTENSITY
TIC1- Barcode scanner 454 492 416 9442b
TIC2- CreditDebit card payment 446 486 405 2900c
TIC3- Telephone 450 488 412 2110
TIC4- Fax 450 489 411 3020b
TIC5- E-mail 450 489 410 1226
SWITCHING COSTS
COS1- Little effort is required to buy in this store 390
416 365 8200a
COS2- This store solves me some of my problems 314
416 213 6580a
COS3- I would waste a lot of time if I changed 322
417 226 1160
COS4- I will lose a friendly and comfortable relationship if I change 242
280 205 6890a
COS5- If I change therersquos a risk the new one wouldnrsquot be as good 372
383 362 18260
COS6- The time I need to buy in this store is acceptable 286
209 362
3130c
PERCEIVED VALUE
CAL- Quality 391 422 359 11366a
PRE- Price 396 424 368 13891a
EMO- Emotional value 411 44 381 22763a
SOC- Social value 401 423 378 1213
COMMITMENT
COMP1- My relationship with the store is important 316 364 268 0616
COMP2- If the store closed it would be a loss for me 317 367 268 0995
COMP3- I feel committed to this store 338 416 26 61474a
LOYALTY
LEAL1- I doubt that I would switch stores 410 431 389 47536a
LEAL2- I try to use this store whenever I purchase 335 406 263 20005a
LEAL3- This store is my first choice 357 411 302 52049a
LEAL4- This store is the best for me 313 421 205 18069a
LEAL5- This is my favourite store 299 330 268 5265b
a b c Statistically significant for p lt 001 p lt 005 and p lt 010 respectively
As it can be observed there are statistically
significant differences in the mean values of
Spanish consumers in relation to the mean
values of Greeks almost in all the analyzed
variables In this aspect Greek consumers
present higher rates in all the indicators of ICT
use by the retailer Similarly the existence of
significant differences regarding the four
Copyright copy2014 by International Journal of Sales Retailing and Marketing Vol 3 No 1 2014
68
dimensions of perceived value ndashquality price
social and emotional value- it is highlighted
Specifically Spanish consumers consider that
they perceive less value in the point of sale
compared with the responses of Greek
consumers Regarding the estimation of the rest
of the relational variables the results show that
Greek consumers tend to be more loyal to the
retailer as they reach higher rates while the
commitment perception doesnacutet vary
significantly between the two groups of
customers
All this leads to conclude that customeracutes
nationality affects its perceptions in relation
with all the variables of the model in a
significant manner
CONCLUSIONS LIMITATIONS AND FUTURE
RESEARCH DIRECTIONS
Literature admits the need to analyze the
determinant factors of the provision of services
in the area of retail distribution and their effect
on the customerrsquos behavioural intentions
towards the retail store Within this framework
perceived value has become a fundamental
variable
The present study has analyzed the of ICT and
switching costs influence on relational variables
like value and it has identified their effects on
commitment and loyalty in a retail
environment confirming the pivotal role of
value The research results show the existing
relations between value and the proposed
antecedents and consequences except the ICT
With all that it can be concluded that in order
to maintain in the market the suppliers have to
deliver a proposal of value to the consumer so
to attract him induce the purchase and foster
loyalty (Warnaby et al 2005) This process can
be achieved through the creation of functional
ndashquality price- emotional and social links
However not all of them act with the same
intensity According to the study results the
effect of emotional value on total value and
commitment is stronger than the produced by
the rest of types of value Therefore we
perceive as possible implications for the retail
companies the concentration of their efforts on
investing in the resources that improve
customerrsquos experience in the point of sale
These resources
can be developed through increased staff
training in the store with a true vocation
towards customer orientation service
customisation and interpersonal relationship
Finally in this study we have found that
nationality factor affects the behaviour of the
model variables pointing towards a possible
moderating effect Perhaps the non significant
effect of ICT can be explained by the significant
differences found in the empirical research
between the two customer profiles of
nationality All the above constitutes a new
perspective in the analysis of relationships
between customers and stores of clothing and
footwear It is noteworthy that this study has
certain weaknesses
First a larger sample that includes increased
number of respondents for each group could
permit to refine more the results Likewise the
research in various retail formats and in
different product categories could permit an
increased mainstreaming of the findings In the
same way sectors of activity where technology
plays a more important role in terms of the
relationship with the customer could result
more attractive field of research
Finally as future research lines could be
interesting to assess if ICT can exert a
moderating effect in their relation with
perceived value instead of acting as an
antecedent Furthermore the intensity of the
relation of perceived value with regard to
commitment in relation to the customersrsquo age
could be estimated as well as the role of
emotions or the state of mind which have been
studied as antecedents of satisfaction
(Machleit and Mantel 2001) It would also be
useful to explore in the retailing context the
contribution of customerrsquos search for variety to
the creation of loyalty (eg Christodoulides and
Copyright copy2014 by International Journal of Sales Retailing and Marketing Vol 3 No 1 2014
69
Michaelidou 2010) In this direction the
moderating or antecedent role of this attitude
could be analyzed and observe differences
according the personal characteristics of the
individuals
We also propose to future studies to improve
the measure of loyalty The attitudinal
approach applied in this study for measuring
this construct should be complemented by a
behavioural approach that includes not only the
repetitive purchase but also the word-of-mouth
attitude (Dick and Basu 1994) This last
response is one of the most relevant and
recognised dimensions of loyalty in the
literature and with the technological
development the virtual dimension of word-of-
mouth gets an increasing academic and
business interest (Chan and Ngai 2011) Thus it
would be interesting to measure the word-of-
mouth attitude personal and electronic in
order to identify differences in this dimension
of loyalty across cultures
REFERENCES
Andaleeb SS (1995) ldquoDependence relations
and the moderating role of trust implication for
behavioral intentions in marketing channelsrdquo
International Journal of Research in Marketing
Vol 12 No 2 pp 157-72
Anderson JC and Narus JA (1990) ldquoA model
of distributor firm and manufacturing firm
working relationshipsrdquo Journal of Marketing
Vol 54 No 1 pp 42-58
Caruana A Money AH and Berthon P R
(2000) lsquorsquoService quality and satisfaction-the
moderating role of valuersquorsquo European Journal of
Marketing Vol 34 no 1112 pp 1338-1352
Chan YYY y Ngai EWT (2011)
ldquoConceptualising electronic Word of mouth
activity An input-process-output perspectiverdquo
Marketing Intelligence amp Planning 29 (5) 488-
516
Christodoulides G y Michaelidou N (2010)
ldquoShopping motives as antecedents of e-
satisfaction and e-loyalty Journal of Marketing
Management 27 (1-2) 181-197
Comer JM Mehta R and Holmes TL (1998)
ldquoInformation technology retail users versus
non usersrdquo Journal of Interactive Marketing
Vol 12 No 2 pp 49-62
Cowart KO and Goldsmith RE (2007) ldquoThe
influence of consumer decision-making styles
on online apparel consumption by college
studentsrdquo International Journal of Consumer
Studies Vol31 No 6 pp 639ndash647
Dick A S and Basu K (1994) Customer
loyalty Toward an integrated conceptual
framework Journal of the Academy of
Marketing Science 22(2) 99-113
Emerson R (1962) acuteacutePower-Dependence
Relationsacuteacute American Sociological Review 27
(February) 31-41
Evanschitzky H Iyer G R Plassmann H
Niessing J and Meffert H (2006) The relative
strength of affective commitment in securing
loyalty in service relationships Journal of
Business Research 59(12) pp 1207-1213
Ferreiros Bennett P (2012) acuteacuteHow Social
Networks Digital Media and Digital Marketing
Can Be Applied to the Promotion of Goods and
Services in Business Companies in Order to
Increase Salesacuteacute Journal of US-China Public
Administration July Vol 9 No 7 812-824
Fornell C and Larcker DF (1981) ldquoEvaluating
Structural Equation Models with Unobservable
Variables and Measurement Errorrdquo Journal of
Marketing Research Vol18 pp39-50
Fullerton G (2005) ldquoThe service qualityndashloyalty
relationship in retail services Does
Copyright copy2014 by International Journal of Sales Retailing and Marketing Vol 3 No 1 2014
70
commitment matterrsquorsquo Journal of Retailing and
Consumer Services 12 pp 99ndash111
Gil-Saura I Ruiz-Molina M E and Arteaga-
Moreno F (2011) lsquorsquo Value supplier
dependence and long-term orientation
Outcomes for B2B commerce in the travel
industryrsquorsquo Industrial Management amp Data
Systems Vol 111 No 5 pp 791-808
Gil Saura I Servera Franceacutes D Berenguer
Contriacute G and Fuentes Blasco M (2008)
ldquoLogistics service quality a new way to loyaltyrsquorsquo
Industrial Management amp Data Systems Vol
108 No 5
Griffin MA (1996) acuteacuteExtra-role Behaviors in
Organisations The Mediation of Work and
Individual Factors by Organisational
Commitmentacuteacute Paper presented at the 11th
Annual Conference of the Society for Industrial
and Organisational Psychology San Diego CA
Groumlnroos C (2000) ldquoCreating a relationship
dialogue communication interaction valuerdquo
Marketing Review Vol 1 No 1 pp 5-14
Hennig-Thurau T Gwinner KP Walsh G
Gremler DD (2004) acuteacuteElectronic Word-of-
Mouth via Consumer-Opinion Platforms What
Motivates Consumers to Articulate Themselves
on the Internetacuteacute Journal of Interactive
Marketing 18 (1) 38-52
Lovelock C (1991) ldquoServices Marketing Text
Cases and Readingrsquorsquo 2nd ed Prentice-Hall
Englewood Cliffs NJ
Machleit KA Mantel SP (2001) ldquoEmotional
response and shopping satisfaction Moderating
effects of shopper attributionsrdquo Journal of
Business Research 54 (2) pp 97-106
Mentzer J T and Williams L R (2001) ldquoThe
role of logistics leverage in marketing strategyrsquorsquo
Journal of Marketing Channels 8 pp 29-48
Morgan R M and Hunt S D (1994) ldquoThe
commitment-trust theory of relationship
marketingrsquorsquo Journal of Marketing 58(3) pp 20-
38
Observatorio de las Telecomunicaciones y la
Sociedad de la Informacioacuten (2008) Diagnoacutestico
tecnoloacutegico del sector de comercio minorista
Entidad Puacuteblica Empresarial Redes
httpobservatorioredesmedia2008-
051211193299289pdf
Oliver R (1999) ldquoWhence consumer loyaltyrsquorsquo
Journal of Marketing 63 special issue pp 33-
44
Reynolds KE and Beatty SE (1999)
ldquoCustomer benefits and company consequences
of customer-salesperson relationships in
retailingrdquo Journal of Retailing Vol 75 No 1 pp
11-32
Ruiz-Molina ME Gil-Saura I and Calderoacuten
Garciacutea H (2010a) acuteacuteEl efecto moderador de la
edad en la relacioacuten entre el valor percibido las
TIC del minorista y la lealtad del clientersquorsquo
Cuadernos de Economiacutea and Direccioacuten de la
Empresa Nuacutem 43 junio pp 65-92
Ruiz-Molina ME Gil-Saura I and Moliner-
Velaacutezquez B (2010b) acuteacuteThe role of information
technology in relationships between travel
agencies and their suppliersrsquorsquo Journal of
Hospitality and Tourism Technology Vol 1 No
2 pp 144-162
Ryssel R Ritter T and Gemuumlnden HG (2004)
ldquoThe impact of information technology
deployment on trust commitment and value
creation in business relationshipsrdquo Journal of
Business amp Industrial Marketing Vol 19 No 3
pp 197-207
Saacutenchez J Saacutenchez M Antonio J and
Gutieacuterrez T (2010) ldquoThe impact of relational
variables on value creation in buyer-seller
Copyright copy2014 by International Journal of Sales Retailing and Marketing Vol 3 No 1 2014
71
business relationshipsrdquo Journal of Business-
Business Marketing Vol 17 No 1 pp 62-94
Sharland A (1997) ldquoSourcing strategy the
impact of costs on relationship outcomesrdquo
International Journal of Physical Distribution amp
Logistics Management Vol 27 No 7 pp 395-
409
Sheth Jagdish N Bruce I Newman and Barbara
L Gross (1991) ldquoWhy We Buy What We Buy A
Theory of Consumption Valuesrdquo Journal of
Business Research 22(March) pp 159ndash170
Simpson P M Siguaw J A and Baker T L
(2001) ldquoA model of value creation supplier
behaviors and their impact on reseller
perceived valuersquorsquo Industrial Marketing
Management 30(2) pp 119-134
Srinivasan R (2008) ldquoSources characteristics
and effects of emerging technologies Research
opportunities in innovationrsquorsquo Industrial
Marketing Management 37 pp 633ndash640
Sweeney JC and Soutar G (2001) ldquoConsumer
perceived value the development of a multiple
iacutetem scalersquorsquo Journal of Retailing Vol 77 pp
203-220
Warnaby G Bennison D and Davies BJ
(2005) ldquoRetailing and the marketing of urban
places a UK perspectiverdquo International Review
of Retail Distribution and Consumer Research
Vol15 Ndeg2 pp191-215
White L and Yanamandram V (2007) ldquoA
model of customer retention of dissatisfied
business services customersrsquorsquo Managing Service
Quality Vol 17 No 3 pp 298-316
Zeithaml V A (1988) ldquoConsumer Perceptions
of Price Quality and Value A Means-End Model
and Synthesis of Evidencerdquo Journal of
Marketing 52(July) pp 2ndash22
Copyright copy2014 by International Journal of Sales Retailing and Marketing Vol 3 No 1 2014
72 DIGITAL MEDIA amp POLITICAL MARKETING IN ALBANIA
DIGITAL MEDIA amp POLITICAL MARKETING IN ALBANIA
Orjona Fjerza amp Vjollca Hysi (Panajoti)
Abstract
This paper is a synthesis of a study and analysis conducted in Political marketing focused mainly on
the opinion of the electorate during the elections camping for the Parliamentary in Albania heldrsquos on
23 June 2013 Highlighted already in many scientific articles studies and empirical data Political
Marketing and the development of its technical tools are going in parallel with the development of
technology and the New Social Media Marketing is becoming an increasing necessity for Political
market in the world In a broader plan elements that characterize an electoral campaigns and what
the final results reveals from the elections in Albania this article focuses mainly on political marketing
elements and external factors excluding socio-economic (not less important)
Albanian political parties in the last election campaign gave a highest importance to accurate
program coalitions images and messages forwarded to the electorate Almost all the major political
parties were awareness and showed greater maturity compared with previous election campaigns
regarding the form and content of Political Product
The paper consist on analyzing the collected data through interviews questionnaires statistical and
descriptive methods as well as empirical studies reveal interesting facts and figures in the
implementation of appropriate strategies by political parties for future campaigns This paper also a
reference article for the next academic research in the Political Marketing and represents a picture of
the importance in particular of the social media and Political Marketing as whole
Keywords Digital Media marketing 2013 Election Campaign Factors analyze
INTRODUCTION
POLITICAL DIGITALampSOCIAL MEDIA IN ALBANIA
In recent decades many Western Balkan
countries including Albania began the process of
political transformation and socio - economic
transition which necessaries changes in the
respective political system Such
transformations and brought new developments
in terms of designing appropriate strategies
commensurate political class European models
However it seems to have difficulties even
today in their implementation this because of
cultural differences socio - demographic
economic historical etc
Proposed research topic focus on the modern
literature review regarding the new elements of
Political Marketing contextualize with Albanian
political market
Todays challenge for political parties in the
context of an increasingly dynamic environment
is to enhance the share of the electorate
through the delivery of the message in the
appropriate form for the realization of the main
objective in the future elections campaigns
As the latest literature refers Political Marketing
is a about Political Experience historical and
Political management studies of various
segments of the electorate through social -
demographic analysis relationship with the
media interest groups campaign management
companies fundraising and donations
compliance with the legal code of elections
political image and Political Product designing
political use of previous experience as a
contemporary approach models etc
Orjona Fjerza is a PhD candidate in Political Marketing Economic Faculty of Tirana Marketing Department (email orjonafjerzagmailcom) Vjollca Hysi (Panajoti) is professor and Head of Department of Marketing Economic Faculty of Tirana
Copyright copy2014 by International Journal of Sales Retailing and Marketing Vol 3 No 1 2014
73 DIGITAL MEDIA amp POLITICAL MARKETING IN ALBANIA
Sixty-six political parties and two independent
candidates were registered as contestants in a
largely inclusive process that offered voters a
genuine choice Political parties registered
according to the Law on Political Parties as well
as independent candidates could apply for
registration as electoral subjects
Most parties promoted similar platform goals
economic development employment
opportunities the fight against corruption and
European integration Issues most prominently
featured in the public debate were social
security and taxation While the DP noted
government achievements the SP promised a
new beginning The SMI criticized the
government and focused on job creation and
joining European structures
Major political parties in Albania such as the
Democratic Party Socialist Party Socialist
Movement for Integration Republican Party etc
engaged international companies for the
campaign management During the 2013
elections the Socialist Party hired the ldquoAlastair
Campbell brothers and left the advice of
ldquoCrespirdquo former Italian company which has
provided consultants on previous campaign
Democratic Party chose to collaborate with the
ldquoGovernment Advisory (Tony Blair company
adviser) which replaced the advice given by the
group of companies Tony Podesta Podesta and
Patton Boggs in the previous campaign
Although digital media was one of the key
factors to profit from Obamas election in 2008
presidential election new techniques of digital
media and new social media were almost
nonexistent during the 2009 General Election
Campaign in Albania
A wide range of media outlets operates in
Albania According to the Audiovisual Media
Authority (AMA) there are 3 national television
(TV) channels (public channel TVSH TV Klan and
Top Channel) 71 local TV channels 83 cable TV
channels and 59 radio stations
Print media are numerous although circulation
and impact are limited Internet provides an
open sphere for public discourse TV has the
highest share of advertising market and is
considered the primary source of information
due to its wide geographical coverage
The private broadcasters varied in their
coverage TV Klan favored the DP with 53 per
cent of mostly positive news coverage
compared to the SP with 28 per cent of often
negative news coverage Top Channel and Vizion
Plus were more balanced in their coverage even
if a more negative tone was noted towards the
government The news channels News 24 and
Ora News provided wide and generally neutral
coverage of the major parties The print media
showed some polarization with Shqip and
Shqiptarjacom mainly aligned with the
opposition and Mapo and Panorama with the
ruling party
Digital and Social media are becoming one of the
most important factor of Modern Marketing
which has resulted also important and surely to
be considered in Political marketing in Albania
Social Networks born as a possibility of
communication between friends but today they
have a great importance in communicating with
the public and Business Marketing Strategy
growth development The biggest social network
in the world is Facebook ( in Albania Also )
while Twitter has many users in different
countries of the world but there are very few
users in Albania Another fundamental
difference compared with Twitter is the space
and timing Facebook give the possibility of
social interactions mutual communication what
is most important is to obtain a direct feedback
and expand share and like posts messages
videos comments business or political pages
feedback promotions while Twitter is more
limited
Even though the boom of social media already
confirmed worldwide also requires interaction
with other forms of digital media Parallel with
the development of social media are moving
increasingly mobile application WebPages
Copyright copy2014 by International Journal of Sales Retailing and Marketing Vol 3 No 1 2014
74 DIGITAL MEDIA amp POLITICAL MARKETING IN ALBANIA
Google YouTube Apple Samsung etc In other
words a cross-marketing approach involving
multiple devices including TV touch screen
tablets computers laptops mobile phones etc
As the data revels below using or being focused
only on the social media marketing will not
guarantee the success for the political
marketing Cross digital marketing Strategies will
be necessary to be elaborate and implement in
the future campaigns
RESEARCH QUESTIONS
According to the recent changes on the
marketing concepts especially in the nonprofit
marketing in our case on Political Marketing
the article tries to give answers to the following
questions
1 Are applicable in Albania new patterns and
trends based on contemporary literature and
practices of Political Marketing
2 The positive effects of the use of digital and
social media in politics compared with the most
developed countries will have particular impact
on the successes of the Political Parties If there
is a positive connection what influence them
have and how political parties should use it
METHODOLOGY
The study is focused on the research works
articles scientific literature and in terms of
contextualization in order to highlight the way
s how the Albanian case confirms rejects or
criticizes models an approach already widely
accepted theory within the science disciplines
social and human In this sense we gave
fundamental approach combining theoretical
and empirical analysis
Initially a preliminary testing of the survey was
considered in December 2012 with around 200
questionnaires and in March- May 2013 the
realization of the survey with specific focus
groups and representatives regarding 1500
questionnaires were complete analyzed and
processed
Initially were set the dimensions of the survey
plot (with the help of inter - market Cronbacher
consistency alpha) = preliminary factorial
analysis After this step the problematic
questions identification helped a false removing
alpha coefficient (which shows the consistency
of variables) Further we focused on re - defining
the sampler for the selected sub- community (
ie reduced questionnaire )
The respondents were of different ages ranging
from 18 years to 52 years Field survey lasted
about two weeks and interviews conducted
through face- to-face confrontation with the
interviewee Respondents selected at random
and the sample selection made depending on
the weight that each university selected item
Demographic data presented in the tables
below
City Frequency Percentage
Tirana 778 519
Berat 97 65
Vloreuml 126 84
Shkoder 148 99
Durres 94 63
Elbasan 206 137
Gjirokaster 51 34
Total 1500 1000
Copyright copy2014 by International Journal of Sales Retailing and Marketing Vol 3 No 1 2014
75 DIGITAL MEDIA amp POLITICAL MARKETING IN ALBANIA
Age segments
Gender
Male Female Total
Frequency Frequency Frequency
18-21 350 304 800 696 1150 1000
22-25 118 423 161 577 279 1000
26-29 20 588 14 412 34 1000
30-33 7 467 8 533 15 1000
gt34 15 682 7 318 22 1000
Total 510 340 990 660 1500 1000
Part of this process was the creation of a
database with the collected data and their
processing and analysis which was conduct via
computer software like SPSS Excel and for the
purposes of the study used statistical models as
the principal analysis enabling components
finding correlations between dependent
variables and independent ones
FINDINGS ANALYZE
Factor Analyze
This section describes the data processed of the
second survey conducted as explained above in
the methodology section during the period
March-May 2013 Here are described the results
of the data regarding the impact of the use of
social media marketing techniques and
information received by the interviewers related
with Political information The Statistical model
used for the data processing is the factors
analyze and the analysis of the primary
processing elements
The table 1 shows the relationship (correlation)
between the variables gender and age on the
one hand and the questions - Which party do
you think has better organized election
campaign And the question which of the
parties predict will win the 2013 elections
Based on factor analysis of the correlation
coefficient with regard to gender the first
question is
-0073 which means that the connection is very
weak and negative direction The same is
observed with the second question for
predicting the winners of elections where the
coefficient is again very small thus making
insignificant Note that the correlation
coefficient indicates a mathematical value to
measure the strength of linear vibrations in
relation between two variables which takes
values from -1 to 1
1 Value +1 means that the connection is
completely strong
2 Value 0 indicates that the two variables have
no connection
3 A value of -1 indicates that the connection is
strong but completely opposite direction
The same phenomenon is also observed with
variable age where the values of these
correlations are very small reaching the
conclusion that the relationship between them
is almost inexistent Finally we can say that the
forecast for the winning party and the fact that
one of them has better organized electoral
campaign do not depend of the gender or age of
the respondents
Table 1 Matrix of Correlations
Which political party do you think
of the better organized the
campaign until now
In Your opinion which party do you
think will win the election
Gender -0073 -0076
Age -0041 -005
Copyright copy2014 by International Journal of Sales Retailing and Marketing Vol 3 No 1 2014
76 DIGITAL MEDIA amp POLITICAL MARKETING IN ALBANIA
Table 2
Table 3
Extraction Method Principal Component Analysis
Table 3 shows that the component 1 and 2
together account for 699 of the total variance
compared with the four factors taken together
where the largest share of the variation of voice
first factor to 417 Factor 3 and 4 has been
excluded (gender and age) which means that it
does not affect the analysis of variance factors
Table 4 shows the weight of each factor on
another expressed through correlation
According to the coefficient values obtained
data shows that the correlation of gender and
age with the first factor are respectively too low
(-0233 and -0171)
Table 4 Component Matrix
Extraction Method Principal Component Analysis
Table 5 shows the correlation coefficients for
each pair of variables The table also shows that
regardless of the respondents use the Internet
they are almost indifferent as regards
information relating to political parties on social
networks like Facebook Twitter on whether
they do Like these party websites or making
information Share from their respective post
which is indicated by the very low values of
these coefficients of correlations It is also
indicated in Table 6 which shows very low
values of these variables adjustment On the
other hand Table 7 also shows that the use of
the Internet Facebook and Twitter it also
occupied the largest share accounting for a
total weight of 64 of the 12 variables
considered
Initial
Extractio
n
Gender 1 0559
Age 1 0587
Which political party do you think of the better organized the campaign until now 1 0822
Your track which party do you think will win the election 1 0821
Extraction Method Principal Component Analysis
Component
Total
of
Variance
Cumulati
ve Total
of
Variance
Cumulati
ve
1 1672 41792 41792 1672 41792 41792
2 1116 27903 69695
3 0856 21395 9109
4 0356 891 100
Initial Eigenvalues
Extraction Sums of Squared
Loadings
1116
Total Variance Explained
1 2
Gender -0233 071
Age -0171 0747
Which political party do you think better organized the electoral campaign so far 089 017
According to your opinion which party do you think will win the election 0892 0159
Component
Copyright copy2014 by International Journal of Sales Retailing and Marketing Vol 3 No 1 2014
77 DIGITAL MEDIA amp POLITICAL MARKETING IN ALBANIA
Table 5 matrix of correlations
Table 6 Communalities
Extraction Method Principal Component Analysis
On
average
how
many
hours of
Internet
use
during a
week
Do you
use
Do you
use
Twiter
Do you
use
Twiteri
Are you
part of
the blog
Do you
use
If you
have an
account
on
have
you done
Like for
your
party
If you
have an
account
on
Twiter
have you
made the
web
Share
your
party
If you
have an
account
on
Twiter
have you
called
your
friends to
vote for
your
favorite
party
Have you
made
Like
Share
Call for
your
Party
Which
political
party do
you think
has better
organized
the
electoral
campaign
until now
Accordin
g to your
opinion
which
party do
you think
will win
the
election
On average how many hours of Internet use during a week 1 0182 0121 0175 0174 0165 0119 009 0084 0104 -0034 -0051
Do you use Facebook 0182 1 0053 0946 0089 0075 0266 0099 0068 0247 -0015 -0033
Do you use Twiterin 0121 0053 1 0137 021 016 0088 0173 0058 0103 -0029 0004
Do you use Facebook Twiteri0175 0946 0137 1 0112 0095 0263 0121 0087 0263 -0029 -0043
Are you part of the blog 0174 0089 021 0112 1 0318 0119 0092 0045 0105 0018 -0025
Do you use LinkedIn 0165 0075 016 0095 0318 1 0102 0075 0094 0102 -0042 -0049
If you have an account on Facebook have you done Like for your party 0119 0266 0088 0263 0119 0102 1 0389 0245 0923 -0314 -0302
If you have an account on Facebook Twiter have you made the web Share your party 009 0099 0173 0121 0092 0075 0389 1 0399 0447 -0221 -0183
If you have an account on Facebook Twiter have you called your friends to vote for your favorite party 0084 0068 0058 0087 0045 0094 0245 0399 1 0388 -0163 -0143
Have you made Like Share Call for your Party0104 0247 0103 0263 0105 0102 0923 0447 0388 1 -0308 -0313
Which political party do you think has better organized the electoral campaign until now -0034 -0015 -0029 -0029 0018 -0042 -0314 -0221 -0163 -0308 1 0644
According to your opinion which party do you think will win the election-0051 -0033 0004 -0043 -0025 -0049 -0302 -0183 -0143 -0313 0644 1
Initial Extraction
On average how many hours of Internet use during a week 1 0279
Do you use Facebook 1 0955
Do you use Twiter 1 0323
Do you use facebookTwiterin 1 0943
Are you part of the Blogs 1 0544
Do you have a Linkedin account 1 0506
If you have a fb Twiter account did u klik like to your favorite party post 1 073
If you have an account on Facebook Twiter have you made the web Share your party 1 055
If you have a fb Twiter account did you invite friends to voto for your favorite poltical Party 1 0453
Did u make like share invite for your favorite Party 1 0823
Which political party do you think better organized the electoral campaign so far 1 0789
According to your opinion which party do you think will win the election 1 0808
Copyright copy2014 by International Journal of Sales Retailing and Marketing Vol 3 No 1 2014
78 DIGITAL MEDIA amp POLITICAL MARKETING IN ALBANIA
Table 7 Total Variance Explained
Extraction Method Principal Component Analysis
Table 8
Extraction Method Principal Component Analysis
a 4 components extracted
Table 8 presents the weight of these four main
components showing once again the weak link
between variables As to the manner of
obtaining information about political parties
associated with the program activities etc
Table 9 shows that respondents receive more
information through the social network
Facebook that has high correlation with Internet
use variable value 066 Also the correlation
between access to information through the
media like radio or television has low value
which means that although it can see or hear
the various programs they are much less
interested to hear or see programs on political
campaign concluding that a very small
proportion of young people are mainly those
who follow political information and most are
those who are actively involved in youth of
political parties or those who directly participate
in staff close candidates for deputies
Component Extractio
n Sums
of
Squared
Loadings
Total
of
Variance
Cumulati
ve Total
of
Variance
Cumulati
ve
1 3224 26865 26865 3224 26865 26865
2 1872 15603 42468
3 1432 11937 54406 1432 11937 54406
4 1175 9789 64194 1175 9789 64194
5 0893 7444 71638
6 0883 7359 78997
7 0822 6847 85844
8 0671 5588 91432
9 0563 4694 96126
10 0352 2933 9906
11 0067 0555 99615
12 0046 0385 100
Initial Eigenvalues
1872
Initial Extraction
On average how many hours of Internet use during a week 1 0279
Do you use Facebook 1 0955
Do you use Twiter 1 0323
Do you use facebookTwiterin 1 0943
Are you part of the Blogs 1 0544
Do you have a Linkedin account 1 0506
If you have a fb Twiter account did u klik like to your favorite party post 1 073
If you have an account on Facebook Twiter have you made the web Share your party 1 055
If you have a fb Twiter account did you invite friends to voto for your favorite poltical Party 1 0453
Did u make like share invite for your favorite Party 1 0823
Which political party do you think better organized the electoral campaign so far 1 0789
According to your opinion which party do you think will win the election 1 0808
Copyright copy2014 by International Journal of Sales Retailing and Marketing Vol 3 No 1 2014
79 DIGITAL MEDIA amp POLITICAL MARKETING IN ALBANIA
This fact also support the values expressed in
Tables 10 and 11 for weight and adjusting the
variables where higher values are those using
the Internet and social network Facebook value
respectively 082 and 079 while other factors
are presented in low values Table 11 also shows
that only 6 of the 12 variables taken proper
review variances occupy 67 of their total
values of which are presented in Table 12
distributed
Table 9 Correlation Matrix
Correlati
on Matrix
Informed
about
politics
through
Internet
Informed
about
politics
through
Informed
about
politics
through
magazine
s
Informed
about
politics
through
Twiter
Informed
about
politics
through
Televisio
n
Informaci
onin per
politiken
e merrni
Nepermje
t Radios
Informed
about
politics
through
Radio
Informed
about
politics
through
friends
If you
are
informed
through
television
the
informati
on gained
from TV
Klan
seems to
you to be
realistic
If you
are
informed
through
television
the
informati
on gained
from
NEWS
24 seems
to you to
be
realistic
Nese
informaci
onin per
politiken
e merrni
nepermje
t medias
vizive a
ju duket
realist
informaci
oni ne
Ora
News
If you
are
informed
through
television
the
informati
on gained
fromTop -
Channel
seems to
you to be
realistic
If you
are
informed
through
television
the
informati
on gained
from
TVSH
seems to
you to be
realistic
If you
are
informed
through
television
the
informati
on gained
from
UFO TV
seems to
you to be
realistic
Which
political
party do
you think
better
organized
the
electoral
campaign
until
now
Accordin
g to your
opinion
which
party do
you think
will win
the
election
Informed about politics through Internet1 0668 0185 0195 0233 0158 0231 0307 0139 0158 0117 0124 0067 0119 -0149 -0169
Informed about politics through Facebook0668 1 0131 021 0207 0185 0274 0359 0172 0174 0173 0152 0081 012 -0146 -0157
Informed about politics through magazines0185 0131 1 0038 0432 0175 0223 0207 0189 0194 0231 0067 0237 0214 -0128 -0092
Informed about politics through Twiter0195 021 0038 1 -0195 0365 0076 0127 0165 0158 014 0075 0059 0093 -0025 0008
Informed about politics through Television0233 0207 0432 -0195 1 0073 0299 02 012 0153 0171 02 015 014 -0101 -0141
Informed about politics through Radio0158 0185 0175 0365 0073 1 0211 025 0169 0221 0208 0153 0122 0182 -0005 -0002
Informed about politics through Familiars0231 0274 0223 0076 0299 0211 1 0612 025 02 0231 013 0115 0175 -0176 -017
Informed about politics through friends0307 0359 0207 0127 02 025 0612 1 0186 0169 0218 0088 0091 019 -0153 -0167
If you are informed through television the information gained from TV Klan seems to you to be realistic0139 0172 0189 0165 012 0169 025 0186 1 0347 0334 0034 0415 0213 -0068 -0048
If you are informed through television the information gained from NEWS 24 seems to you to be realistic0158 0174 0194 0158 0153 0221 02 0169 0347 1 0683 0321 0247 0249 -0002 -0028
If you are informed through television the information gained from Ora News seems to you to be realistic0117 0173 0231 014 0171 0208 0231 0218 0334 0683 1 0217 0297 0324 -0007 -0025
If you are informed through television the information gained fromTop -Channel seems to you to be realistic0124 0152 0067 0075 02 0153 013 0088 0034 0321 0217 1 0032 0042 -0042 -0084
If you are informed through television the information gained from TVSH seems to you to be realistic0067 0081 0237 0059 015 0122 0115 0091 0415 0247 0297 0032 1 0494 -0058 -0033
If you are informed through television the information gained from UFO TV seems to you to be realistic0119 012 0214 0093 014 0182 0175 019 0213 0249 0324 0042 0494 1 -0004 -0005
Which political party do you think better organized the electoral campaign until now-0149 -0146 -0128 -0025 -0101 -0005 -0176 -0153 -0068 -0002 -0007 -0042 -0058 -0004 1 0644
According to your opinion which party do you think will win the election-0169 -0157 -0092 0008 -0141 -0002 -017 -0167 -0048 -0028 -0025 -0084 -0033 -0005 0644 1
Copyright copy2014 by International Journal of Sales Retailing and Marketing Vol 3 No 1 2014
80 DIGITAL MEDIA amp POLITICAL MARKETING IN ALBANIA
Table 10 Communalities
Extraction Method Principal Component Analysis
Table 11 Total Variance Explained
Extraction Method Principal Component Analysis
Initial
Extractio
n
Informed about politics through Internet 1 0827
Informed about politics through Facebook 1 0794
Informed about politics through magazines 1 0432
Informed about politics through Twiter 1 0655
Informed about politics through Television 1 0701
Informed about politics through Radio 1 0461
Informed about politics through Familiars 1 0753
Informed about politics through friends 1 0737
If you are informed through television the information gained from TV Klan seems to you to be realistic 1 045
If you are informed through television the information gained from NEWS 24 seems to you to be realistic1 075
If you are informed through television the information gained from Ora News seems to you to be realistic1 0681
If you are informed through television the information gained fromTop -Channel seems to you to be realistic1 0612
If you are informed through television the information gained from TVSH seems to you to be realistic 1 0711
If you are informed through television the information gained from UFO TV seems to you to be realistic 1 0534
Which political party do you think better organized the electoral campaign until now 1 082
According to your opinion which party do you think will win the election 1 0814
Component Extractio
n Sums
of
Squared
Loadings
Total
of
Variance
Cumulati
ve Total
of
Variance
Cumulati
ve
1 3774 2359 2359 3774 2359 2359
2 1909 11934 35524
3 1505 9405 44929 1505 9405 44929
4 1282 8011 5294 1282 8011 5294
5 1206 754 6048 1206 754 6048
6 1055 6595 67075 1055 6595 67075
7 0948 5927 73001
8 0812 5073 78075
9 0719 4493 82568
10 0585 3656 86224
11 0465 2905 89129
12 0414 2587 91716
13 0367 2294 9401
14 0346 2163 96172
15 0326 2039 98212
16 0286 1788 100
Initial Eigenvalues
1909
Copyright copy2014 by International Journal of Sales Retailing and Marketing Vol 3 No 1 2014
81 DIGITAL MEDIA amp POLITICAL MARKETING IN ALBANIA
Table 12 Component Matrix
Extraction Method Principal Component Analysis
6 components extracted
CONCLUSIONS
Political marketing is not only the elections
campaign The election campaign is the period
of emergence and implementation of marketing
strategy suitable constraint to growth target
electorate
Undoubtedly the implementation of modern
marketing strategies as in business as well as in
the field of Political Marketing depends on the
economic power of the political entity Even if
implementing with specialists the most
sophisticated and modern one campaign it
could not be enough to have the required
success in the elections
If the political Parties will not take in
consideration the campaign finance electoral
system legal framework election
administration Postelection period socio-
economic factors of the country regularly study
segments of the electorate whether there
would not operate in a social democratic system
inside and outside the Political Party political
marketing or other marketing techniques surely
will fail
As mentioned in the introduction of the paper
also after analyzing the survey conducted during
electoral campaigns marketing strategies
interaction in Albanian political market are
required
Note that this study excludes the impact of
external variables such as economic level
demographic composition social factors
relationship with the previous election history
etc
Despite the limitations of the research
mentioned above and the following set of
answers at the top of the paper we can
conclude
New forms and techniques of digital media has
been implanted from the political Parties in
2013 Election Campaign Data shows that more
and more the Digitalization of the campaign will
increase and new and more sophisticated
techniques would be elaborate and implement
Conclusions drawn through the final reports that
the digital media and social media applications
as part of marketing budget has to consider also
advertising spots rallies promotional products
1 2 3 4 5 6
Informed about politics through Internet 0533 -0367 0354 017 0095 0495
Informed about politics through Facebook 0565 -0341 0396 0145 0075 0418
Informed about politics through magazines 0493 -0006 -0328 0252 0128 0031
Informed about politics through Twiter 0291 0119 0622 -0405 0064 -0028
Informed about politics through Television 0454 -018 -0411 0532 -0066 0086
Informed about politics through Radio 0446 0142 0395 -0102 0041 -0273
Informed about politics through Familiars 0603 -0235 0001 0194 0146 -0525
Informed about politics through friends 0598 -0269 0154 0164 0219 -0456
If you are informed through television the information gained from TV Klan seems to you to be realistic0525 0277 -0102 -0238 0174 0028
If you are informed through television the information gained from NEWS 24 seems to you to be realistic06 0409 -0009 -007 -0466 0013
If you are informed through television the information gained from Ora News seems to you to be realistic0618 0426 -008 -0069 -0325 -0036
If you are informed through television the information gained fromTop -Channel seems to you to be realistic0328 0027 0076 0147 -069 002
If you are informed through television the information gained from TVSH seems to you to be realistic 0463 0389 -0358 -0237 0332 0226
If you are informed through television the information gained from UFO TV seems to you to be realistic0481 0352 -0208 -0109 0333 0118
Which political party do you think better organized the electoral campaign until now -0266 0612 0304 0519 011 0014
According to your opinion which party do you think will win the election -0275 0624 0305 047 0184 0
Component
Copyright copy2014 by International Journal of Sales Retailing and Marketing Vol 3 No 1 2014
82 DIGITAL MEDIA amp POLITICAL MARKETING IN ALBANIA
posters leaflets banners city light meetings
concerts etc
The final Reports of Parties and other interested
institutions and the deep analyses should offer
an accurate image
Political parties one shall be give due
importance to all public and certain market
segmentation but always in coherence with
socio-political system of Albania and in mean
time to stay in contact with the electorate also
in post election period
REFERENCES
Harris P 2001To Spin or not to Spin that is the
Question The Emergence of Modern
PoliticalMarketing The Marketing Review 2000
1 pages
wwcecgocal
OSCEODIHR Election Observation Mission Final
Report
httpwwweastjournalnetalbania-tony-blair-
torna-a-casa-gli-affari-delle-societa-di-
consulenza-nei-balcani33000
Electoral Code of Albania
wwwbuddecomauResearchGlobal-Digital-
Media-The-Dynamic-Digital-IPTV-and-Smart-
TVMarketshtml
httpwwwsocialbakerscomfacebook-
statisticsalbania
Fjerza O Hysi (Panajoti)V 2013 Authors survey
statistical methods and data analyze


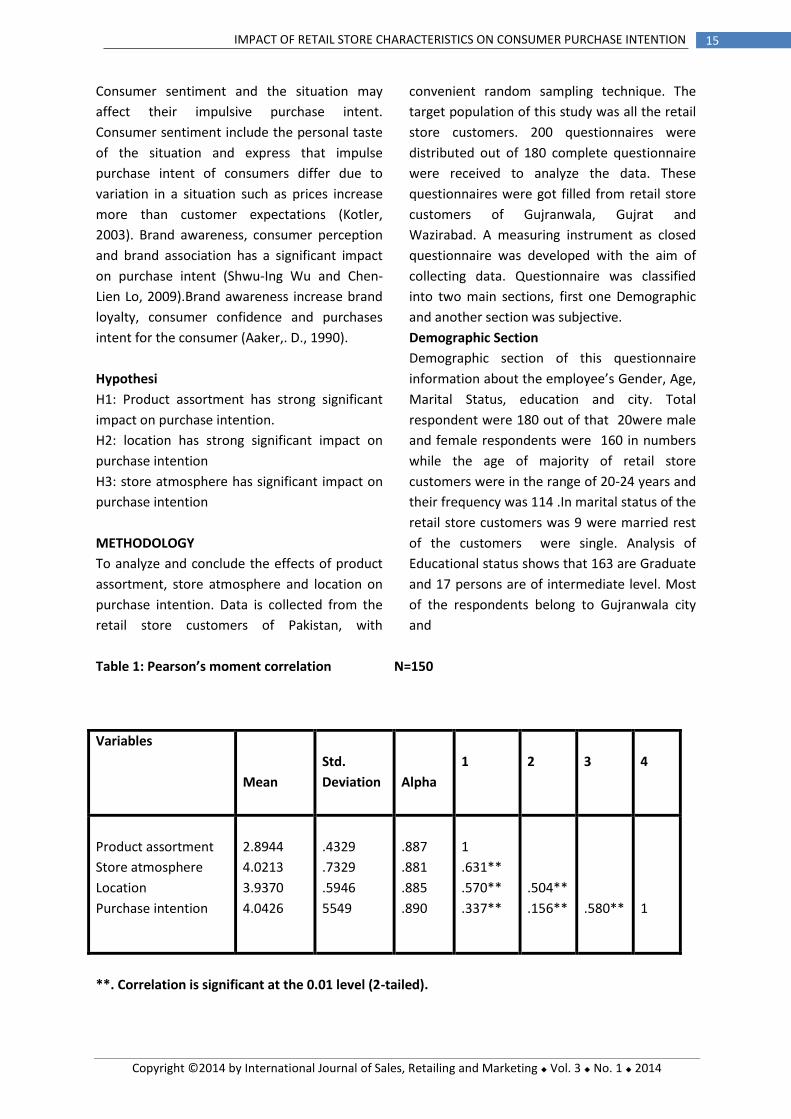


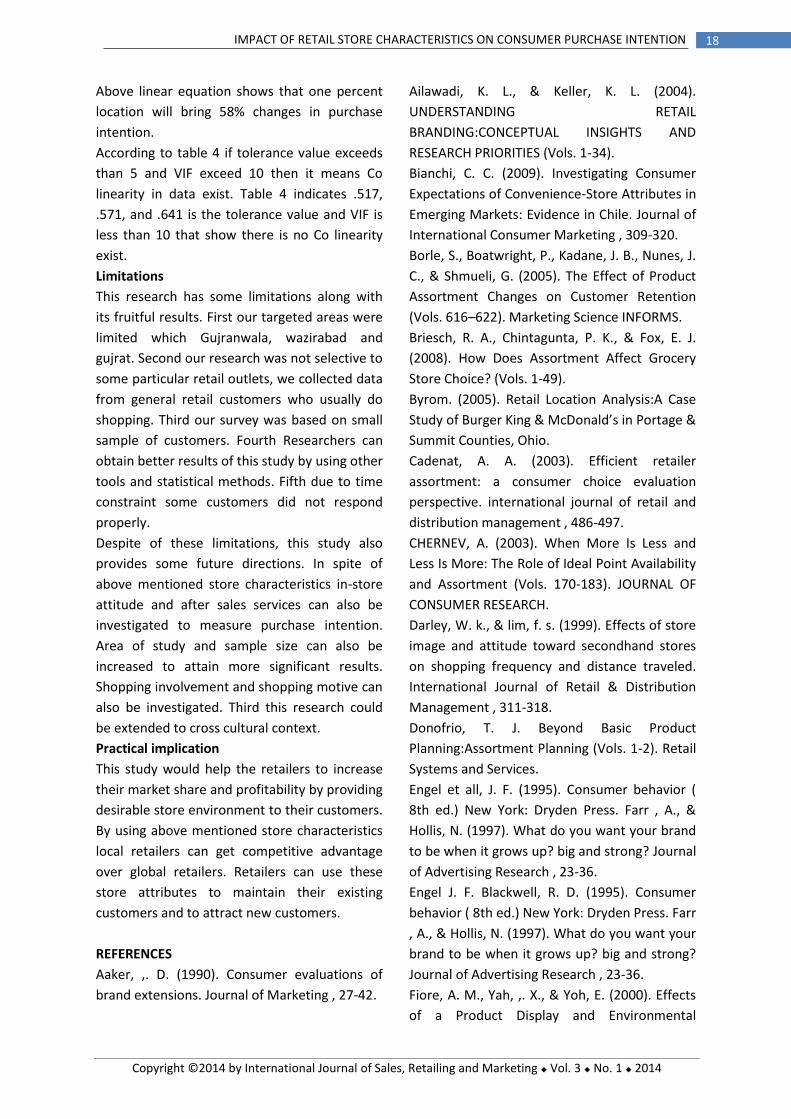


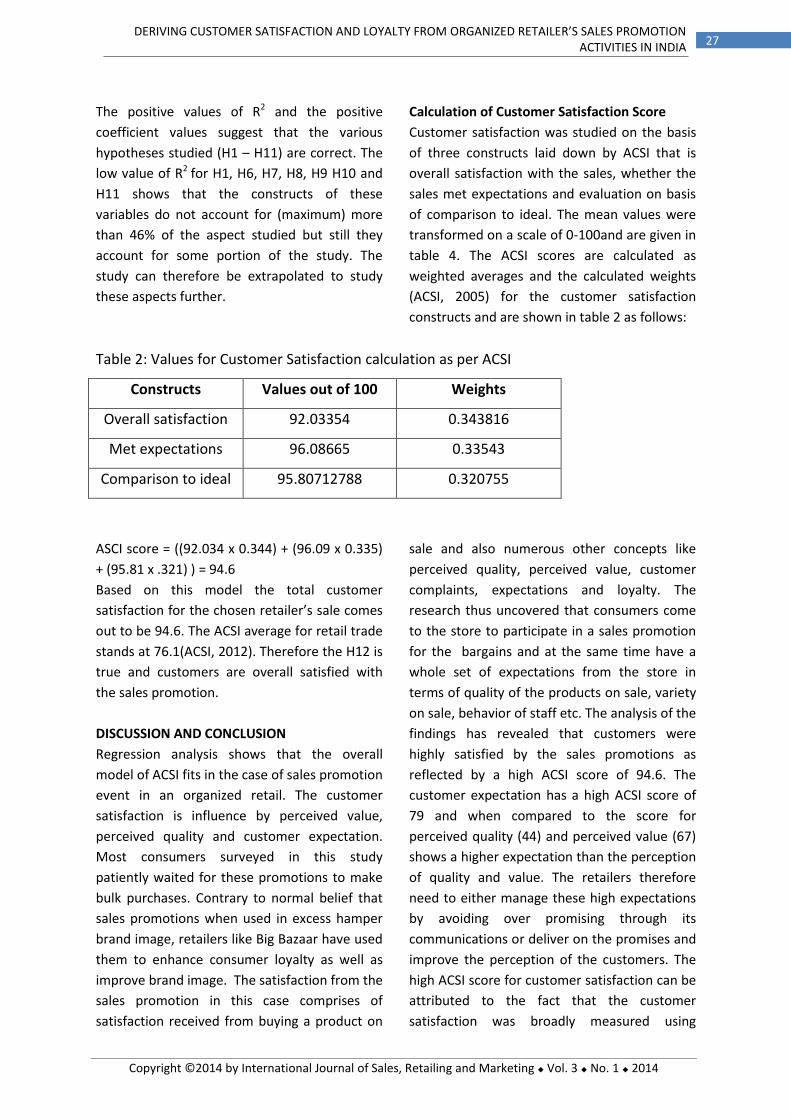


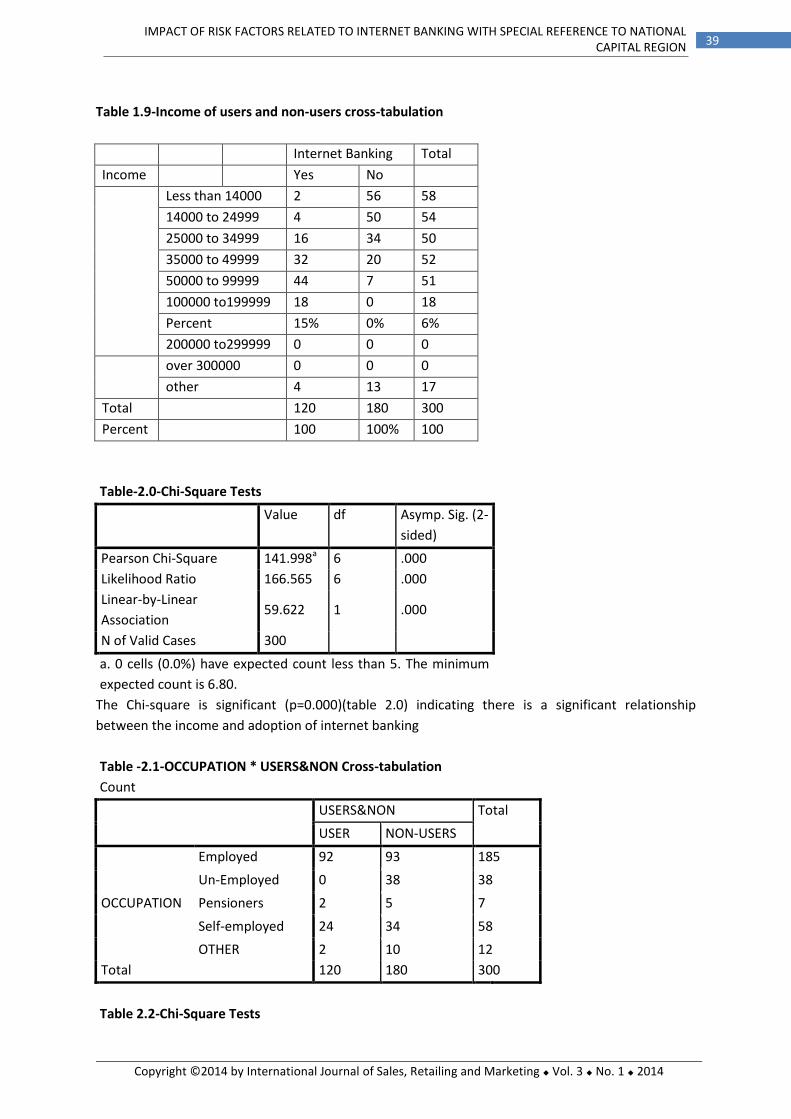


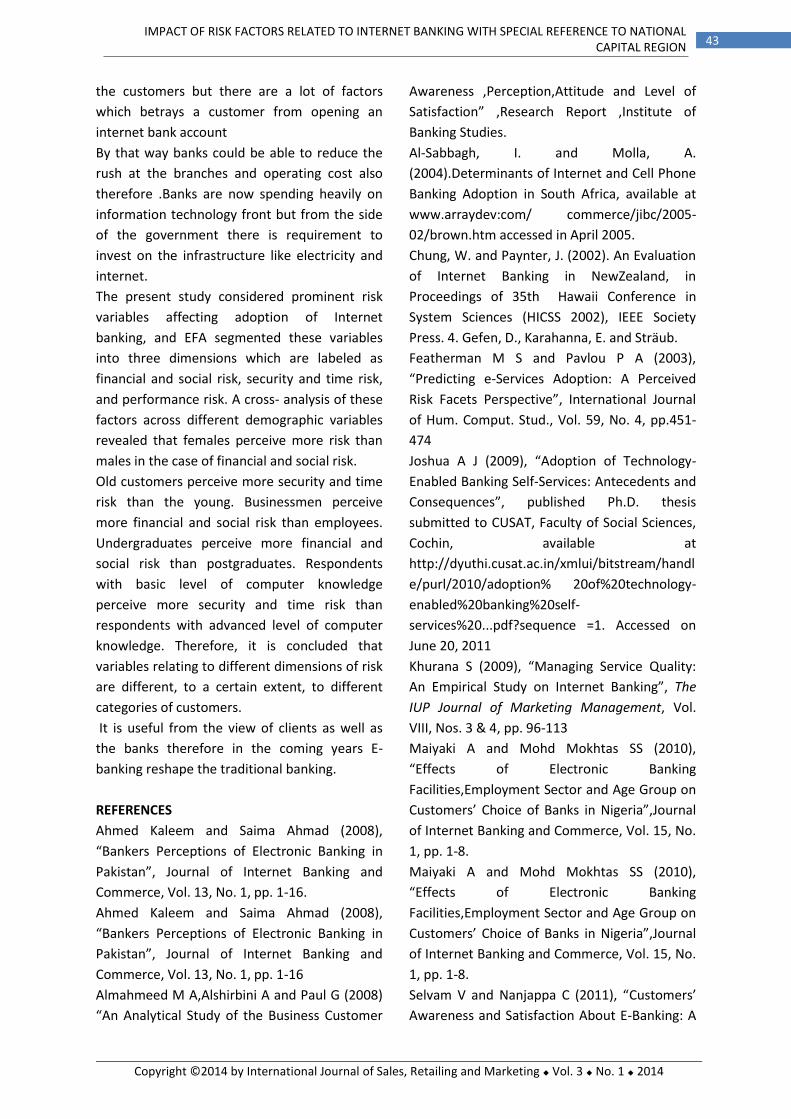


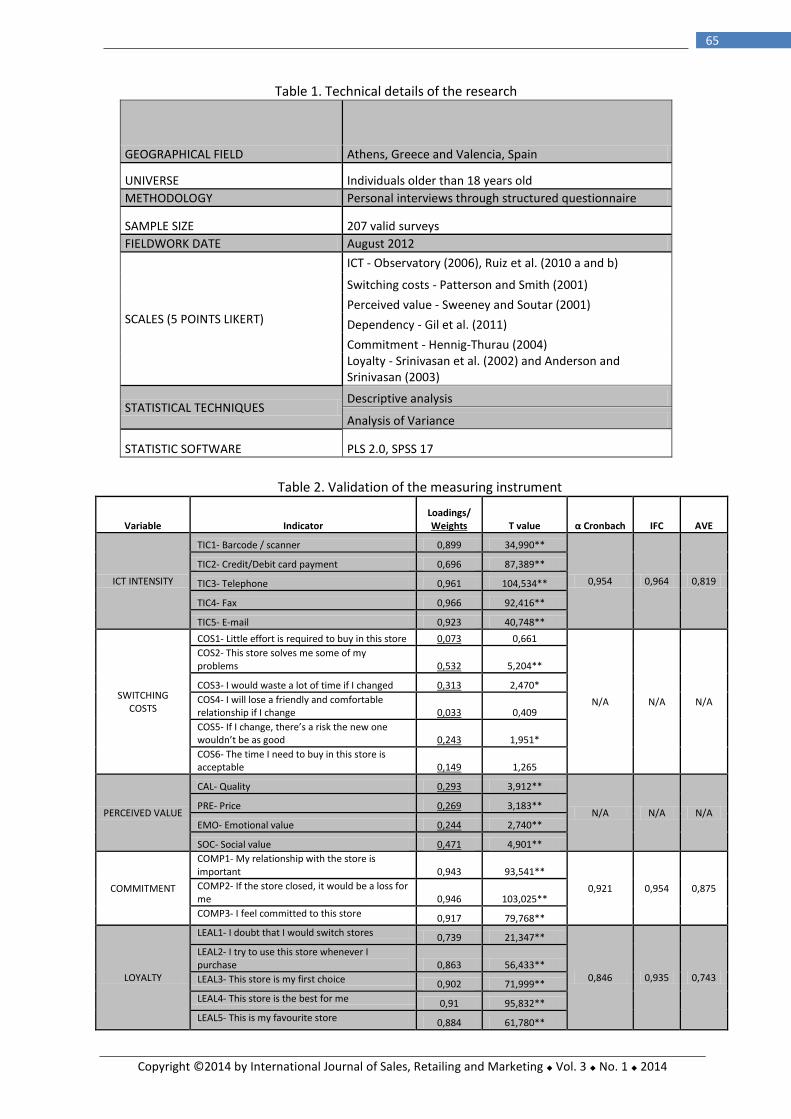
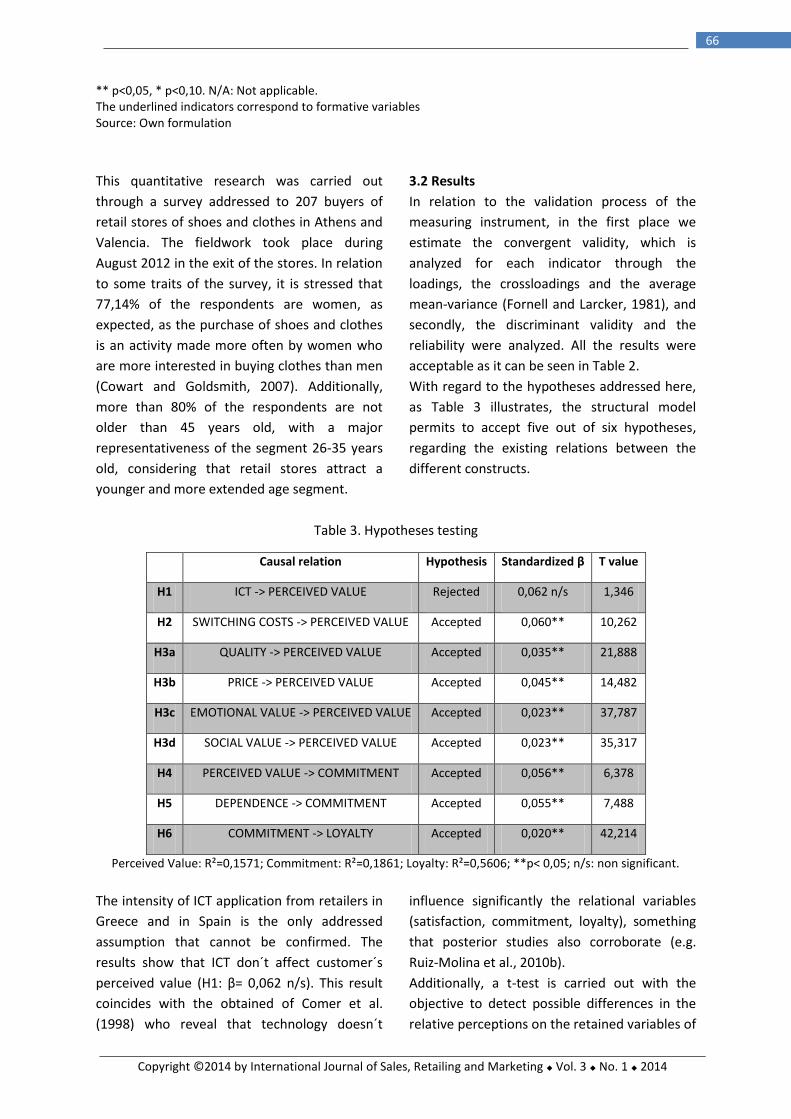

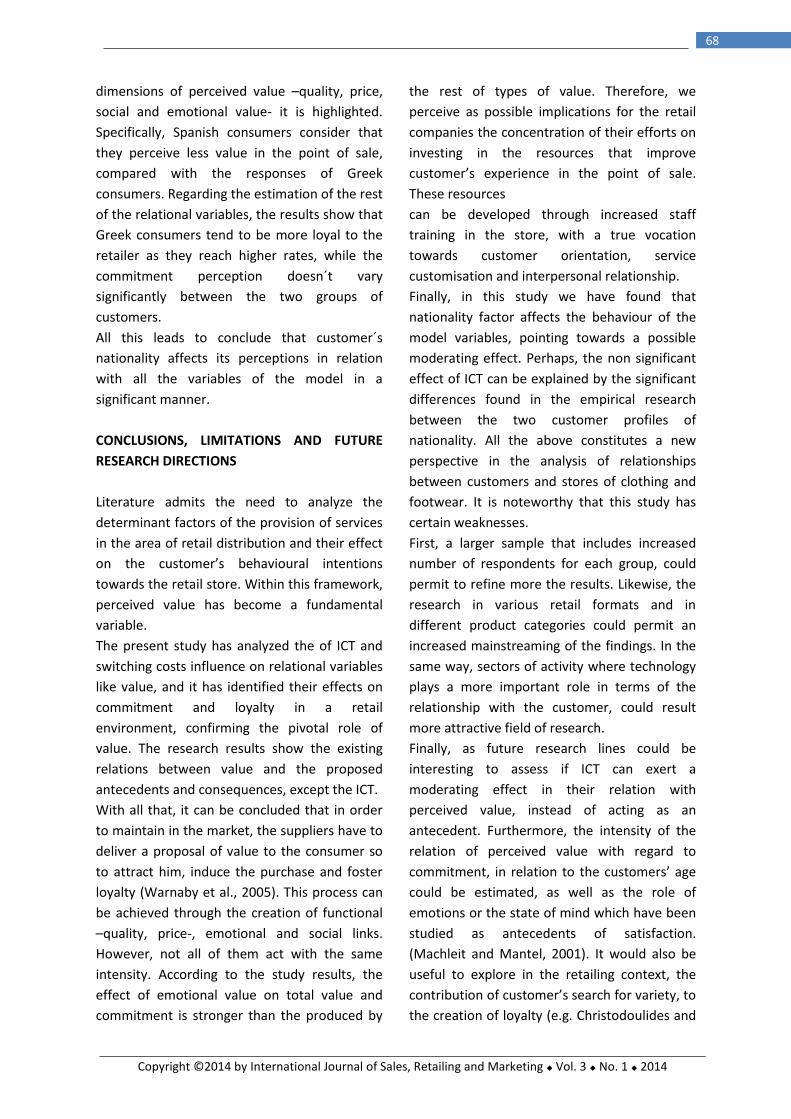


![Challenges of Transformative-Strategic Leadership in … ijsrm.pdf · DOI: 10.18535/ijsrm/v5i8.10 Peter Njuguna Waichungo, IJSRM Volume 5 Issue 08 August 2017 [] Page 6639 world](https://img.pdfslide.net/doc/110x75/5ac4ab557f8b9a220b8cefb0/challenges-of-transformative-strategic-leadership-in-ijsrmpdfdoi-1018535ijsrmv5i810.jpg)