Embed Size (px)
DESCRIPTION
Ilities Tradespace and Affordability Analysis Barry Boehm, USC. Outline. Context: DoD -Stevens-USC SERC Ilities Tradespace and Affordability Analysis Program ( iTAP ) Ilities Tradespace and Affordability Analysis Affordability and Cost Analysis Cost-Schedule Tradespace Analysis. - PowerPoint PPT Presentation
Citation preview

Ilities Tradespace and Affordability Analysis
Barry Boehm, USC
10-22-2013 1

Outline
• Context: DoD-Stevens-USC SERC Ilities Tradespace and Affordability Analysis Program (iTAP)
• Ilities Tradespace and Affordability Analysis
• Affordability and Cost Analysis
• Cost-Schedule Tradespace Analysis
10-22-2013 2
Context: SERC iTAP Initiative Elements
• Tradespace and affordability analysis foundations– More precise ility definitions and relationships– Stakeholder value-based, means-ends relationships– Ility strategy effects, synergies, conflicts– U. Virginia, MIT, USC
• Next-generation system cost-schedule estimation models– Initially for full-coverage space systems (COSATMO)– Extendable to other domains– USC, AFIT, GaTech, NPS
• Applied iTAP methods, processes, and tools (MPTs)– For concurrent cyber-physical-human systems– Experimental MPT piloting, evolution, improvement– Wayne State, AFIT, GaTech, NPS, Penn State, USC
10-22-2013 3
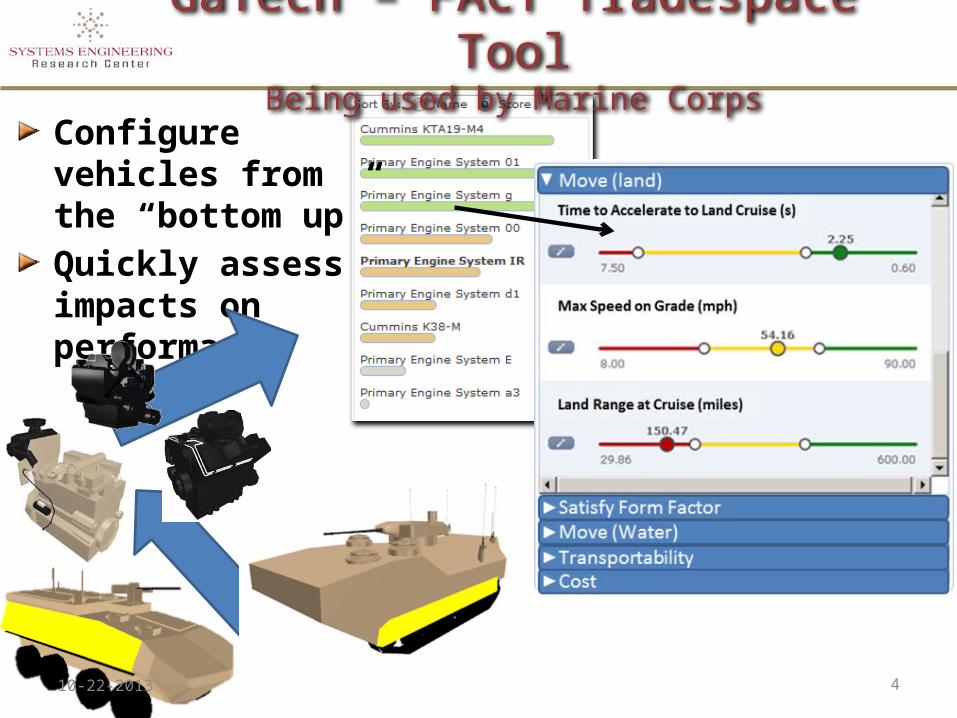
GaTech – FACT Tradespace ToolBeing used by Marine Corps
4
Configure vehicles from the “bottom up”Quickly assess impacts on performance
10-22-2013
5
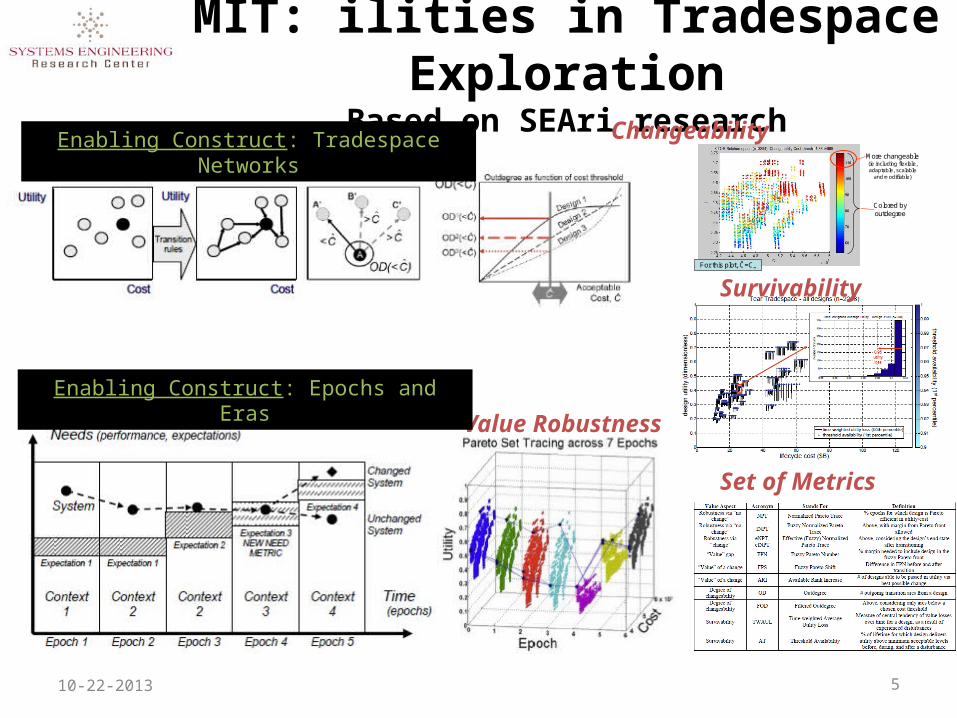
MIT: ilities in Tradespace ExplorationBased on SEAri research
For this plot, Ĉ=C∞
More changeable(ie including flexible, adaptable, scalable
and modifiable)
Colored by outdegree
Enabling Construct: Tradespace Networks Changeability
Survivability
Value Robustness
Enabling Construct: Epochs and Eras
Set of Metrics
10-22-2013
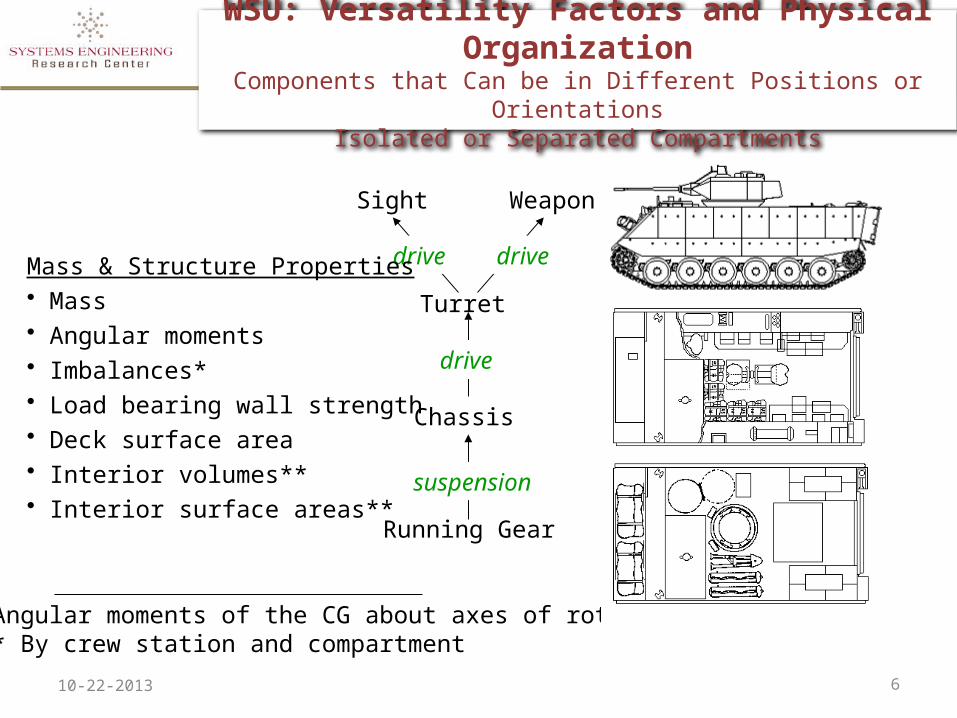
WSU: Versatility Factors and Physical OrganizationComponents that Can be in Different Positions or Orientations
Isolated or Separated Compartments
Running Gear
Chassis
Turret
Sight Weapon
suspension
drive
drivedriveMass & Structure Properties• Mass • Angular moments• Imbalances*• Load bearing wall strength• Deck surface area• Interior volumes**• Interior surface areas**
*Angular moments of the CG about axes of rotation** By crew station and compartment
10-22-2013 6

Outline
• Context: DoD-Stevens-USC SERC Ilities Tradespace and Affordability Analysis Program (iTAP)
• Ilities Tradespace and Affordability Analysis
• Affordability and Cost Analysis
• Cost-Schedule Tradespace Analysis
10-22-2013 7
Ilities Tradespace and Affordability Analysis
• Critical nature of the ilities– Major source of project overruns, failures– Significant source of stakeholder value conflicts– Poorly defined, understood– Underemphasized in project management
• Challenges for cyber-physical-human systems• SERC Foundations efforts
– Stakeholder value-based, means-ends hierarchy– Formal analysis of ility definitions and relations– Architecture strategy synergies and conflicts
10-22-2013 8

Importance of ility TradeoffsMajor source of DoD system overruns
• System ilities have systemwide impact– System elements generally just have local impact
• ilities often exhibit asymptotic behavior– Watch out for the knee of the curve
• Best architecture is a discontinuous function of ility level– “Build it quickly, tune or fix it later” highly risky– Large system example below
10-22-2013 9
10-22-201310
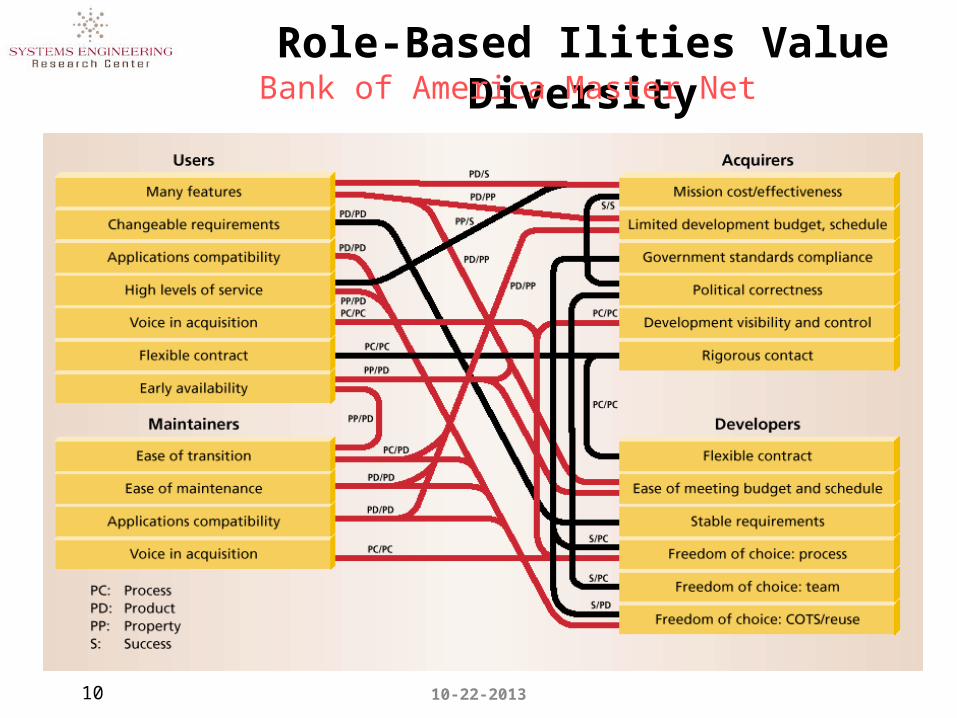
Role-Based Ilities Value DiversityBank of America Master Net
Example of Current Practice
• “The system shall have a Mean Time Between Failures of 10,000 hours”
• What is a “failure?”– 10,000 hours on liveness– But several dropped or garbled messages per hour?
• What is the operational context?– Base operations? Field operations? Conflict operations?
• Most management practices focused on functions– Requirements, design reviews; traceability matrices; work
breakdown structures; data item descriptions; earned value management
• What are the effects on other –ilities?– Cost, schedule, performance, maintainability?
10-22-2013 11
10-22-2013 12
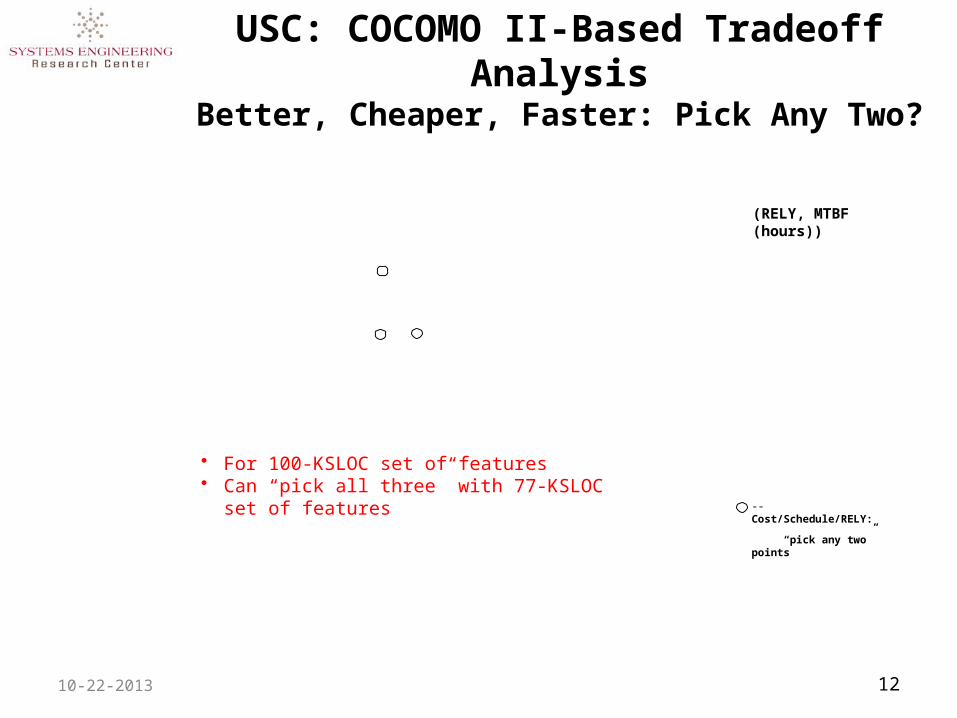
USC: COCOMO II-Based Tradeoff AnalysisBetter, Cheaper, Faster: Pick Any Two?
-- Cost/Schedule/RELY:
“pick any two” points
(RELY, MTBF (hours))
• For 100-KSLOC set of features• Can “pick all three” with 77-KSLOC set of features

Ilities Tradespace and Affordability Analysis
• Critical nature of the ilities– Major source of project overruns, failures– Significant source of stakeholder value conflicts– Poorly defined, understood– Underemphasized in project management
• Challenges for cyber-physical-human systems• SERC Foundations efforts
– Stakeholder value-based, means-ends hierarchy– Formal analysis of ility definitions and relations– Architecture strategy synergies and conflicts
10-22-2013 13

Importance of Cyber-Physical Systems Major gap in tradespace analysis capabilities
• Current ERS, DARPA tradespace research focused on physical system tradeoffs– Range, payload, size, weight, lethality, power and fuel
consumption, communications bandwidth, etc.– Some focus on physical modularity, composability
• Current cyber tradespace research focused on software, computing, human factors tradeoffs– security, safety, interoperability, usability, flexibility,
adaptability, dependability, response time, throughput, etc.
• Gaps in capabilities for co-design of hardware, software, and human factors; integration of tradespace analyses
10-22-2013 14
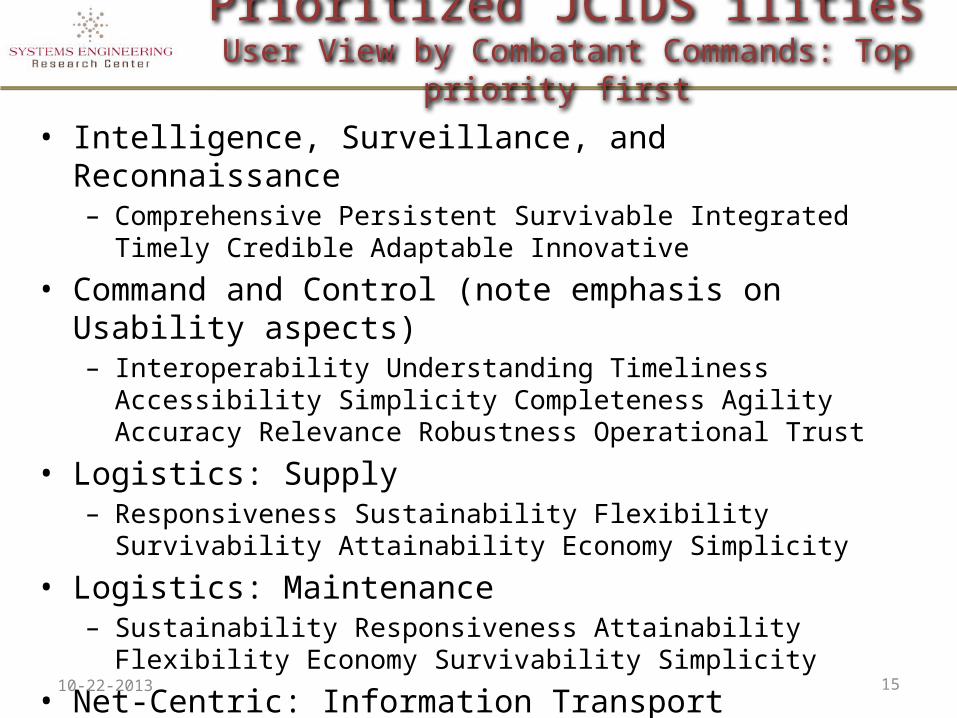
Prioritized JCIDS ilitiesUser View by Combatant Commands: Top priority first
• Intelligence, Surveillance, and Reconnaissance– Comprehensive Persistent Survivable Integrated Timely Credible
Adaptable Innovative
• Command and Control (note emphasis on Usability aspects)– Interoperability Understanding Timeliness Accessibility Simplicity
Completeness Agility Accuracy Relevance Robustness Operational Trust
• Logistics: Supply– Responsiveness Sustainability Flexibility Survivability Attainability Economy
Simplicity
• Logistics: Maintenance– Sustainability Responsiveness Attainability Flexibility Economy Survivability
Simplicity
• Net-Centric: Information Transport– Accessible Capacity Accurate Timely Throughput Expeditionary Latency
10-22-2013 15
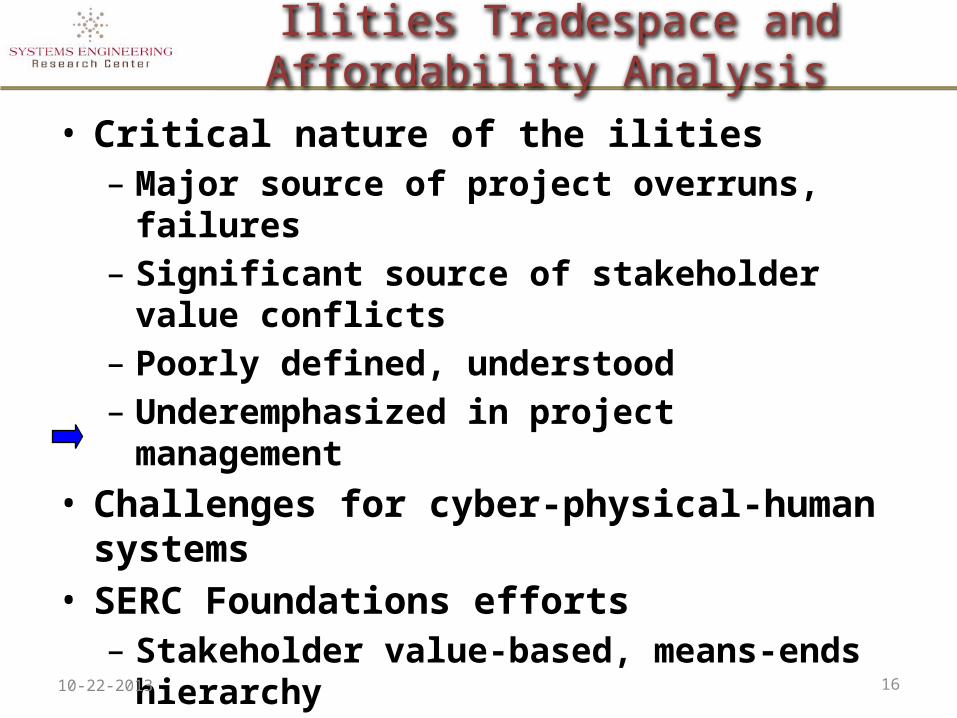
Ilities Tradespace and Affordability Analysis
• Critical nature of the ilities– Major source of project overruns, failures– Significant source of stakeholder value conflicts– Poorly defined, understood– Underemphasized in project management
• Challenges for cyber-physical-human systems• SERC Foundations efforts
– Stakeholder value-based, means-ends hierarchy– Formal analysis of ility definitions and relations– Architecture strategy synergies and conflicts
10-22-2013 16
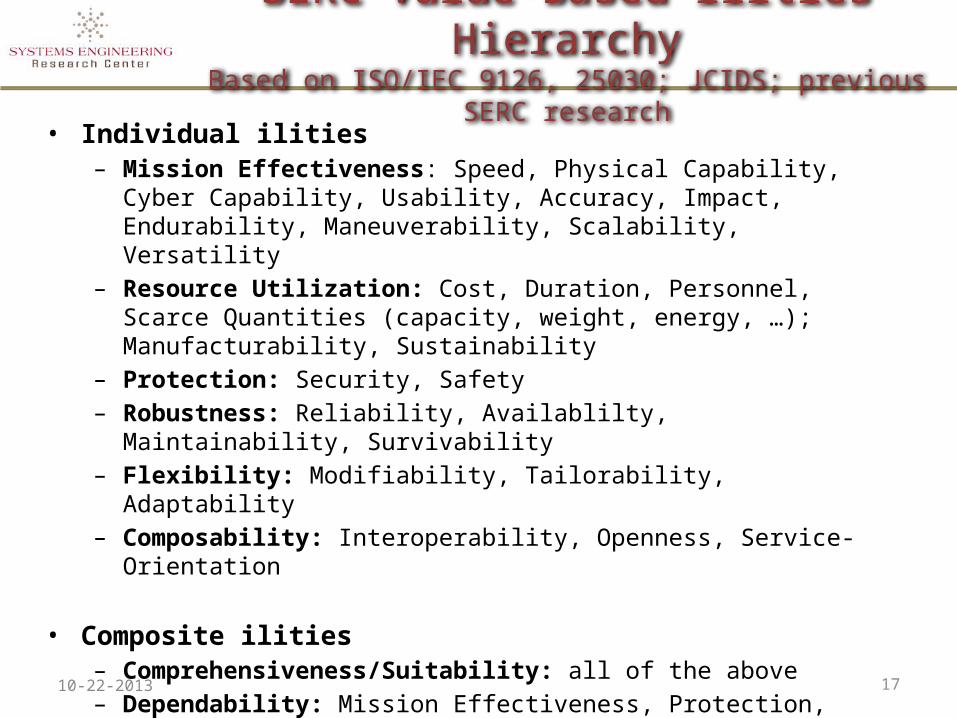
SERC Value-Based ilities HierarchyBased on ISO/IEC 9126, 25030; JCIDS; previous SERC research
• Individual ilities– Mission Effectiveness: Speed, Physical Capability, Cyber Capability, Usability,
Accuracy, Impact, Endurability, Maneuverability, Scalability, Versatility– Resource Utilization: Cost, Duration, Personnel, Scarce Quantities (capacity,
weight, energy, …); Manufacturability, Sustainability– Protection: Security, Safety– Robustness: Reliability, Availablilty, Maintainability, Survivability– Flexibility: Modifiability, Tailorability, Adaptability– Composability: Interoperability, Openness, Service-Orientation
• Composite ilities– Comprehensiveness/Suitability: all of the above– Dependability: Mission Effectiveness, Protection, Robustness– Resilience: Protection, Robustness, Flexibility– Affordability: Mission Effectiveness, Resource Utilization
10-22-2013 17
1810-22-2013
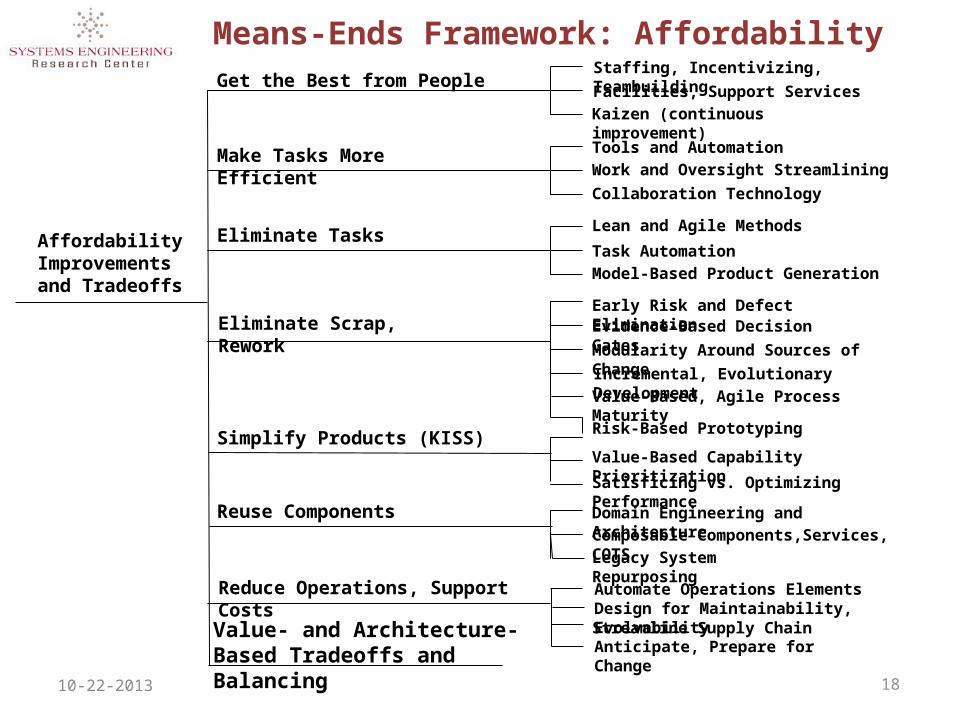
Legacy System Repurposing
Eliminate Tasks
Eliminate Scrap, Rework
Staffing, Incentivizing, Teambuilding
Kaizen (continuous improvement)
Work and Oversight Streamlining
Collaboration Technology
Early Risk and Defect Elimination
Modularity Around Sources of Change
Incremental, Evolutionary Development
Risk-Based Prototyping
Satisficing vs. Optimizing Performance
Value-Based Capability Prioritization
Composable Components,Services, COTS
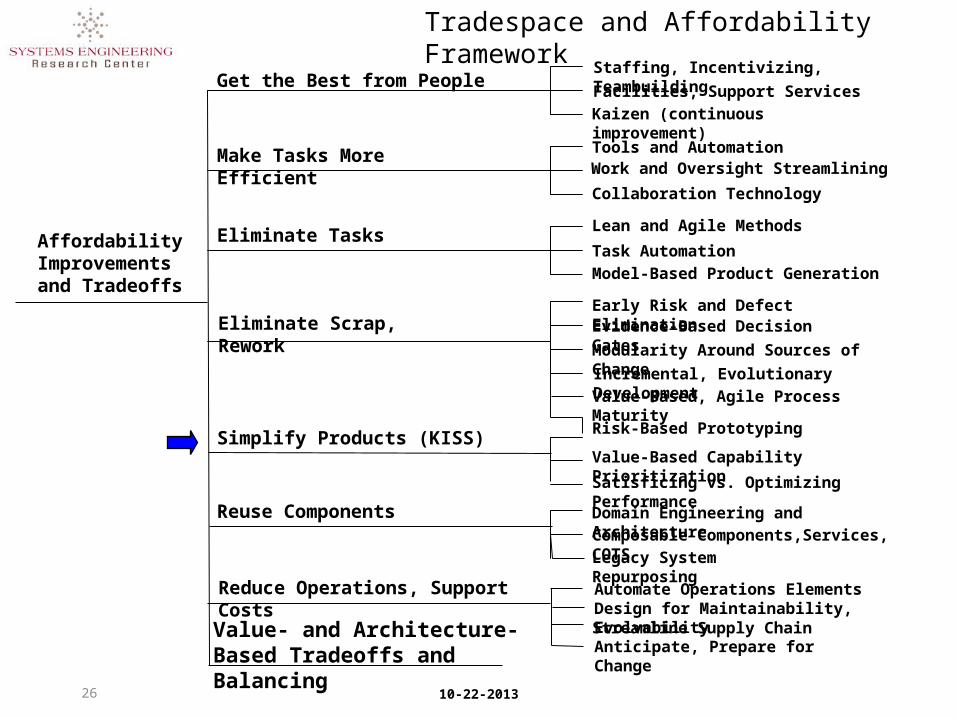
Affordability Improvements and Tradeoffs
Get the Best from People
Make Tasks More Efficient
Simplify Products (KISS)
Reuse Components
Facilities, Support Services
Tools and Automation
Lean and Agile Methods
Evidence-Based Decision Gates
Domain Engineering and Architecture
Task Automation
Model-Based Product Generation
Value-Based, Agile Process Maturity
Means-Ends Framework: Affordability
Reduce Operations, Support Costs
Streamline Supply ChainDesign for Maintainability, EvolvabilityAutomate Operations Elements
Anticipate, Prepare for ChangeValue- and Architecture-Based Tradeoffs and Balancing

Architecture Strategy Synergy-Conflict Matrix
10-22-2013 19

Software Development Cost vs. Quality
0.8
VeryLow
Low Nominal HighVeryHigh
0.9
1.0
1.1
1.2
1.3
1.4
1.10
1.0
0.92
1.26
0.82
Relative Cost to Develop
COCOMO II RELY Rating
MTBF (hours) 1 10 300 10,000 300,000
10-22-2013 20
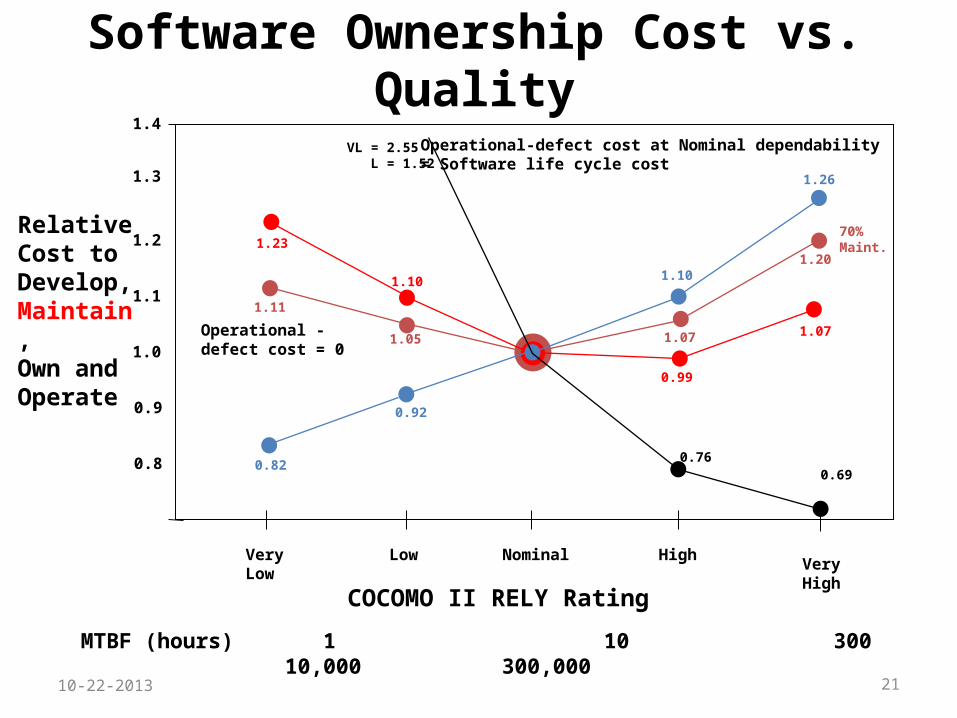
Software Ownership Cost vs. Quality
0.8
VeryLow
Low Nominal HighVeryHigh
0.9
1.0
1.1
1.2
1.3
1.4
1.10
0.92
1.26
0.82
Relative Cost to Develop, Maintain,Own andOperate
COCOMO II RELY Rating
1.23
1.10
0.99
1.07
1.11
1.05
70% Maint.
1.07
1.20
0.760.69
VL = 2.55 L = 1.52
Operational-defect cost at Nominal dependability= Software life cycle cost
Operational -defect cost = 0
MTBF (hours) 1 10 300 10,000 300,000
10-22-2013 21
Outline
• Context: DoD-Stevens-USC SERC Ilities Tradespace and Affordability Analysis Program (iTAP)
• Ilities Tradespace and Affordability Analysis
• Affordability and Cost Analysis
• Cost-Schedule Tradespace Analysis
10-22-2013 22

10-22-201323
Legacy System Repurposing
Eliminate Tasks
Eliminate Scrap, Rework
Staffing, Incentivizing, Teambuilding
Kaizen (continuous improvement)
Work and Oversight Streamlining
Collaboration Technology
Early Risk and Defect Elimination
Modularity Around Sources of Change
Incremental, Evolutionary Development
Risk-Based Prototyping
Satisficing vs. Optimizing Performance
Value-Based Capability Prioritization
Composable Components,Services, COTS
Affordability Improvements and Tradeoffs
Get the Best from People
Make Tasks More Efficient
Simplify Products (KISS)
Reuse Components
Facilities, Support Services
Tools and Automation
Lean and Agile Methods
Evidence-Based Decision Gates
Domain Engineering and Architecture
Task Automation
Model-Based Product Generation
Value-Based, Agile Process Maturity
Affordability and Tradespace Framework
Reduce Operations, Support Costs
Streamline Supply ChainDesign for Maintainability, EvolvabilityAutomate Operations Elements
Anticipate, Prepare for ChangeValue- and Architecture-Based Tradeoffs and Balancing
24
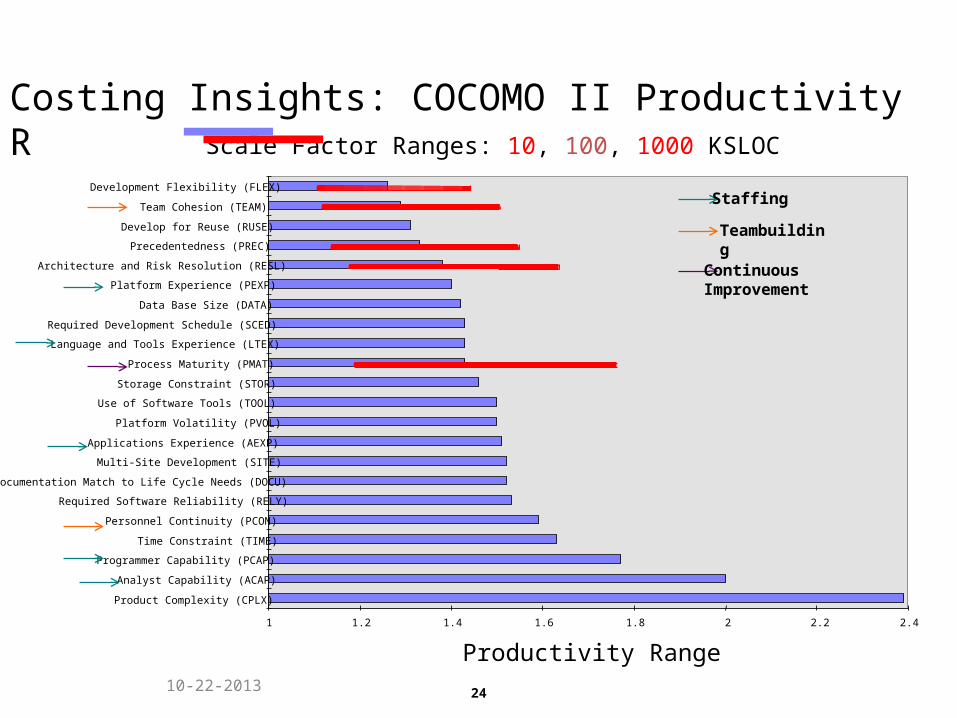
Costing Insights: COCOMO II Productivity Ranges
Productivity Range
1 1.2 1.4 1.6 1.8 2 2.2 2.4
Product Complexity (CPLX)
Analyst Capability (ACAP)
Programmer Capability (PCAP)
Time Constraint (TIME)
Personnel Continuity (PCON)
Required Software Reliability (RELY)
Documentation Match to Life Cycle Needs (DOCU)
Multi-Site Development (SITE)
Applications Experience (AEXP)
Platform Volatility (PVOL)
Use of Software Tools (TOOL)
Storage Constraint (STOR)
Process Maturity (PMAT)
Language and Tools Experience (LTEX)
Required Development Schedule (SCED)
Data Base Size (DATA)
Platform Experience (PEXP)
Architecture and Risk Resolution (RESL)
Precedentedness (PREC)
Develop for Reuse (RUSE)
Team Cohesion (TEAM)
Development Flexibility (FLEX)
Scale Factor Ranges: 10, 100, 1000 KSLOC
10-22-2013
Staffing
Teambuilding
Continuous Improvement
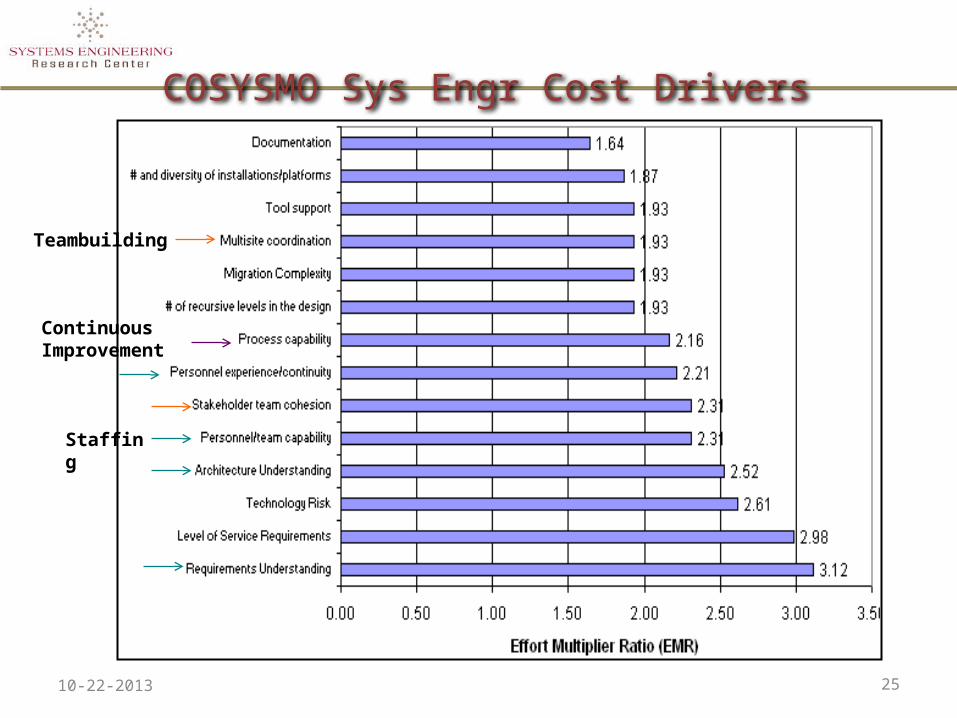
COSYSMO Sys Engr Cost Drivers
2510-22-2013
Teambuilding
Staffing
Continuous Improvement
10-22-201326
Legacy System Repurposing
Eliminate Tasks
Eliminate Scrap, Rework
Staffing, Incentivizing, Teambuilding
Kaizen (continuous improvement)
Work and Oversight Streamlining
Collaboration Technology
Early Risk and Defect Elimination
Modularity Around Sources of Change
Incremental, Evolutionary Development
Risk-Based Prototyping
Satisficing vs. Optimizing Performance
Value-Based Capability Prioritization
Composable Components,Services, COTS
Affordability Improvements and Tradeoffs
Get the Best from People
Make Tasks More Efficient
Simplify Products (KISS)
Reuse Components
Facilities, Support Services
Tools and Automation
Lean and Agile Methods
Evidence-Based Decision Gates
Domain Engineering and Architecture
Task Automation
Model-Based Product Generation
Value-Based, Agile Process Maturity
Tradespace and Affordability Framework
Reduce Operations, Support Costs
Streamline Supply ChainDesign for Maintainability, EvolvabilityAutomate Operations Elements
Anticipate, Prepare for ChangeValue- and Architecture-Based Tradeoffs and Balancing

10-22-201327
Value-Based Testing: Empirical Data and ROI— LiGuo Huang, ISESE 2005
-1.5
-1
-0.5
0
0.5
1
1.5
2
0 10 20 30 40 50 60 70 80 90 100
% Tests Run
Re
turn
On
In
ve
stm
en
t (R
OI)
Value-Neutral ATG Testing Value-Based Pareto Testing
% of Valuefor
CorrectCustomer
Billing
Customer Type
100
80
60
40
20
5 10 15
Automated test generation (ATG) tool
- all tests have equal value
Bullock data– Pareto distribution% of
Valuefor
CorrectCustomer
Billing
Customer Type
100
80
60
40
20
5 10 15
Automated test generation (ATG) tool
- all tests have equal value
% of Valuefor
CorrectCustomer
Billing
Customer Type
100
80
60
40
20
5 10 15
Automated test generation (ATG) tool
- all tests have equal value
Bullock data– Pareto distribution
(a)
(b)
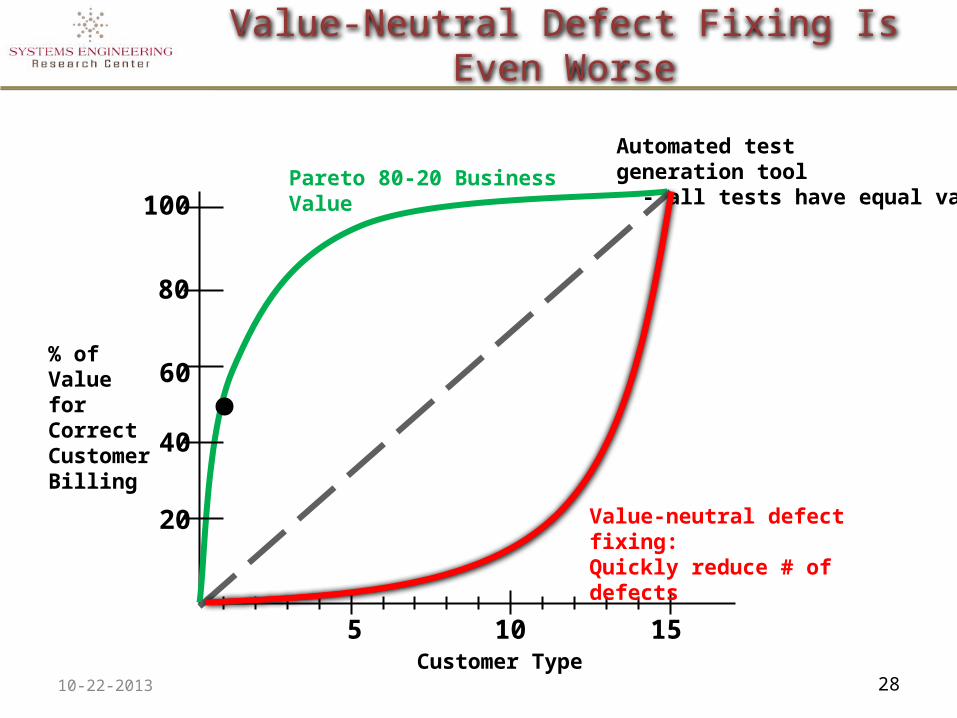
Value-Neutral Defect Fixing Is Even Worse
% of Valuefor CorrectCustomerBilling
Customer Type
100
80
60
40
20
5 10 15
Automated test generation tool - all tests have equal value
Value-neutral defect fixing:Quickly reduce # of defects
Pareto 80-20 Business Value
10-22-2013 28
Outline
• Context: DoD-Stevens-USC SERC Ilities Tradespace and Affordability Analysis Program (iTAP)
• Ilities Tradespace and Affordability Analysis
• Affordability and Cost Analysis
• Cost-Schedule Tradespace Analysis
10-22-2013 29
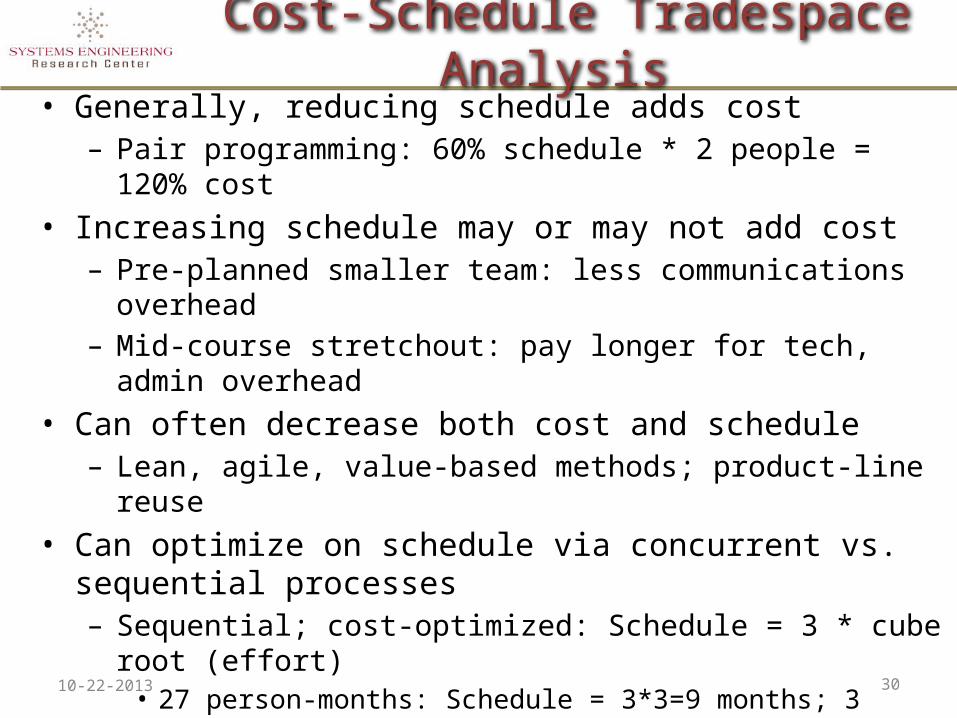
Cost-Schedule Tradespace Analysis • Generally, reducing schedule adds cost
– Pair programming: 60% schedule * 2 people = 120% cost• Increasing schedule may or may not add cost
– Pre-planned smaller team: less communications overhead– Mid-course stretchout: pay longer for tech, admin overhead
• Can often decrease both cost and schedule– Lean, agile, value-based methods; product-line reuse
• Can optimize on schedule via concurrent vs. sequential processes– Sequential; cost-optimized: Schedule = 3 * cube root (effort)
• 27 person-months: Schedule = 3*3=9 months; 3 personnel– Concurrent, schedule-optimized: Schedule = square root (effort)
• 27 person-months: Schedule = 5.5 months; 5.4 personnel
• Can also accelerate agile square root schedule– SERC Expediting SysE study: product, process, people, project, risk
10-22-2013 30
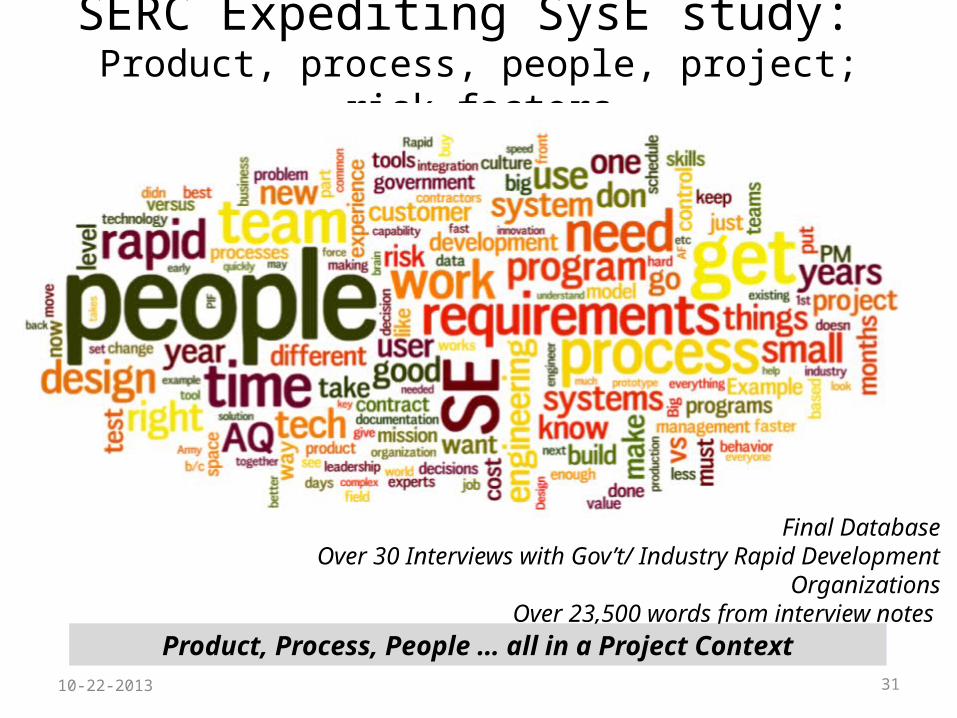
SERC Expediting SysE study: Product, process, people, project; risk factors
Final DatabaseOver 30 Interviews with Gov’t/ Industry Rapid Development
OrganizationsOver 23,500 words from interview notes
Product, Process, People … all in a Project Context10-22-2013 31
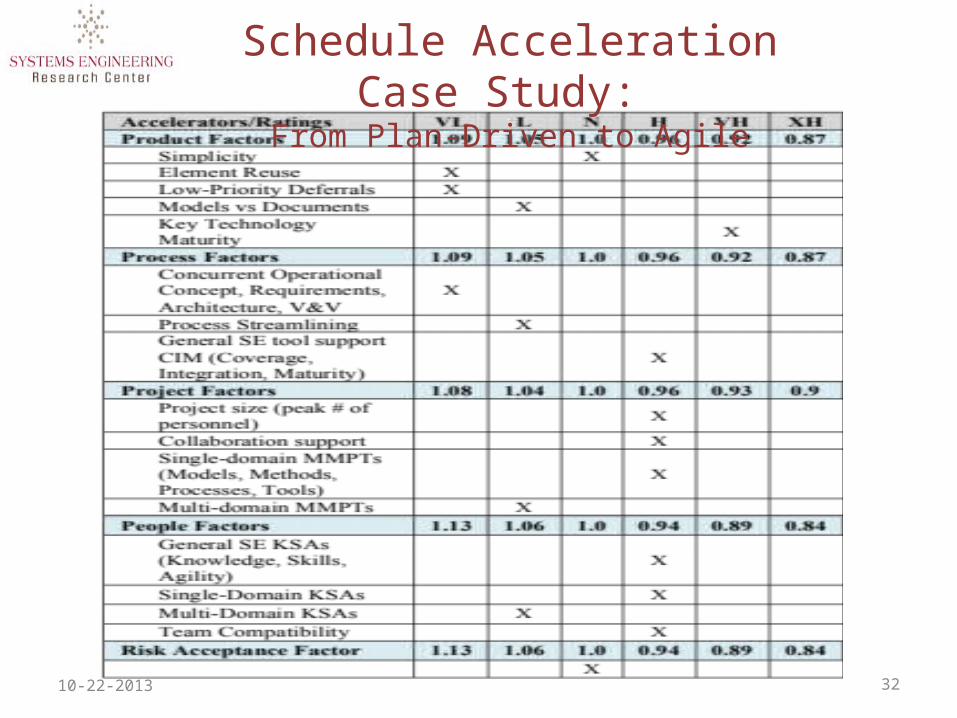
Schedule Acceleration Case Study: From Plan-Driven to Agile
10-22-2013 32
10-22-2013 33
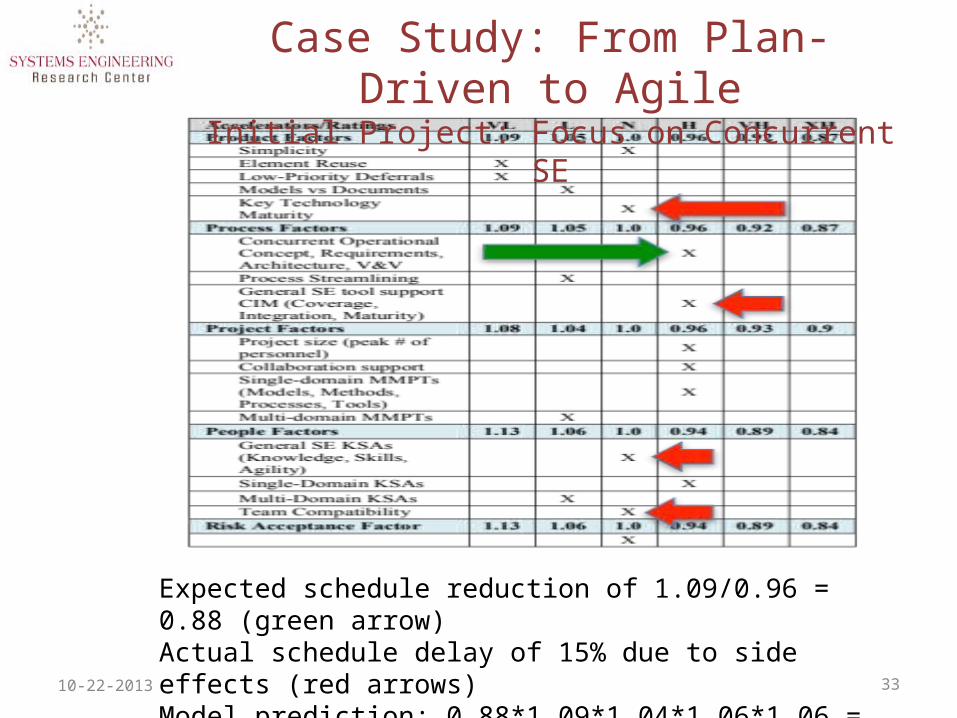
Case Study: From Plan-Driven to AgileInitial Project: Focus on Concurrent SE
Expected schedule reduction of 1.09/0.96 = 0.88 (green arrow)Actual schedule delay of 15% due to side effects (red arrows)Model prediction: 0.88*1.09*1.04*1.06*1.06 = 1.13
10-22-2013 34
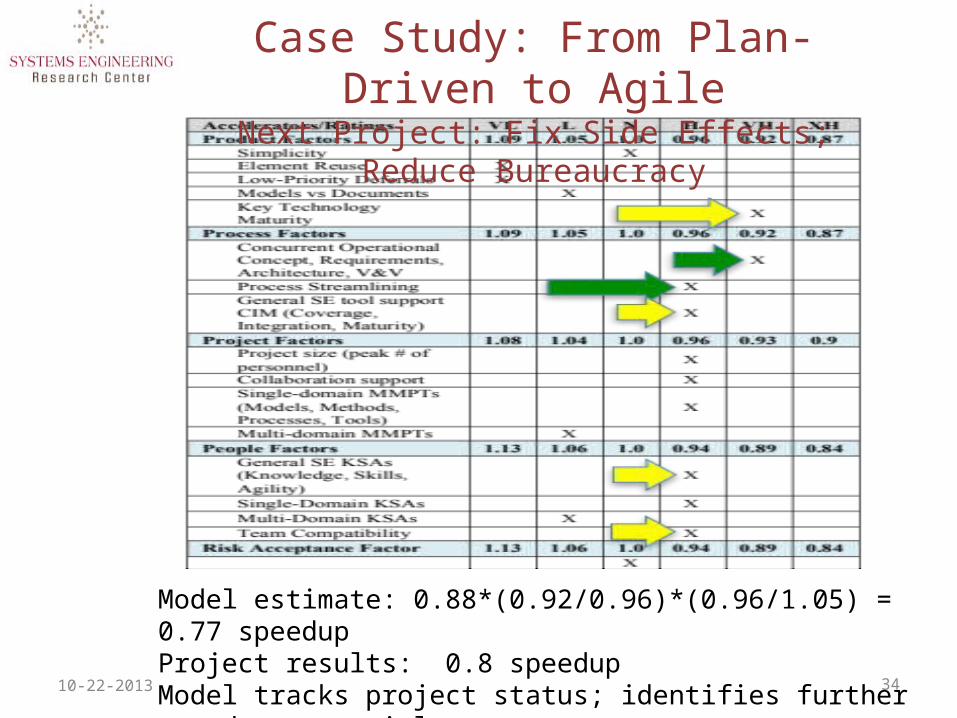
Case Study: From Plan-Driven to AgileNext Project: Fix Side Effects; Reduce Bureaucracy
Model estimate: 0.88*(0.92/0.96)*(0.96/1.05) = 0.77 speedupProject results: 0.8 speedupModel tracks project status; identifies further speedup potential
BACKUP CHARTS
10-22-2013 35

CORADMO-SE Rating Scales, Schedule Multipliers
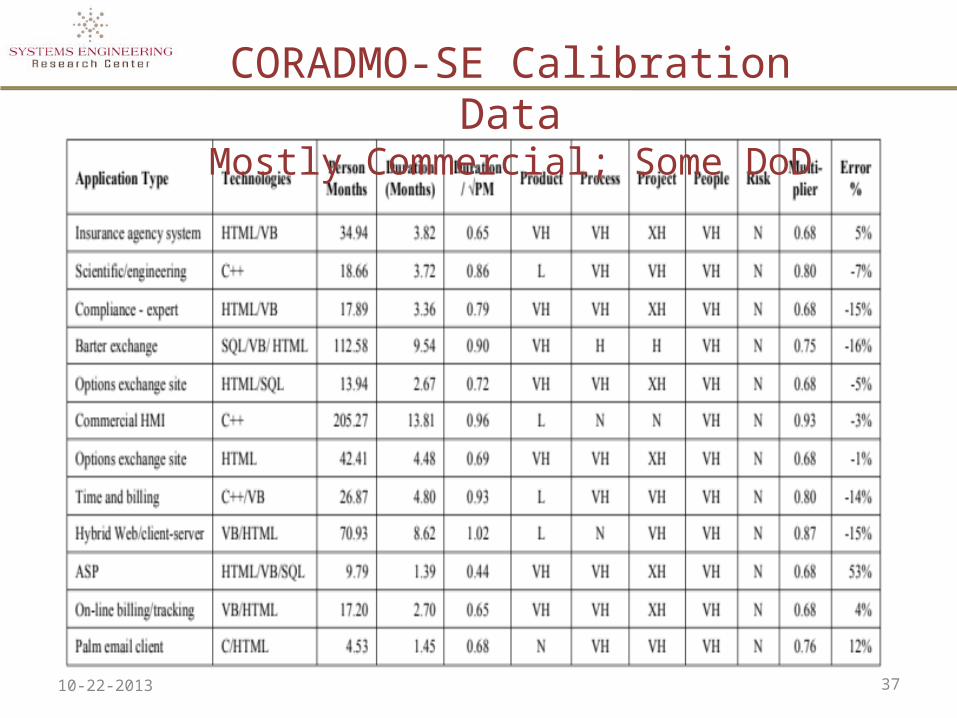
CORADMO-SE Calibration DataMostly Commercial; Some DoD
10-22-2013 37