Embed Size (px)
Citation preview

Health Consultation Exposure Investigation Report
ILLINOIS BEACH STATE PARK
ZION, LAKE COUNTY, ILLINOIS
EPA FACILITY ID: ILD984840140
OCTOBER 19, 2007
U.S. DEPARTMENT OF HEALTH AND HUMAN SERVICES Public Health Service
Agency for Toxic Substances and Disease Registry Division of Health Assessment and Consultation
Atlanta, Georgia 30333
Health Consultation: A Note of Explanation
An ATSDR health consultation is a verbal or written response from ATSDR to a specific request for information about health risks related to a specific site, a chemical release, or the presence of hazardous material. In order to prevent or mitigate exposures, a consultation may lead to specific actions, such as restricting use of or replacing water supplies; intensifying environmental sampling; restricting site access; or removing the contaminated material.
In addition, consultations may recommend additional public health actions, such as conducting health surveillance activities to evaluate exposure or trends in adverse health outcomes; conducting biological indicators of exposure studies to assess exposure; and providing health education for health care providers and community members. This concludes the health consultation process for this site, unless additional information is obtained by ATSDR which, in the Agency’s opinion, indicates a need to revise or append the conclusions previously issued.
You May Contact ATSDR TOLL FREE at 1-888-42ATSDR
or Visit our Home Page at: http://www.atsdr.cdc.gov
HEALTH CONSULTATION
Exposure Investigation Report
ILLINOIS BEACH STATE PARK
ZION, LAKE COUNTY, ILLINOIS
EPA FACILITY ID: ILD984840140
Prepared by:
James T. Durant, MSPH CIH Exposure Investigations and Site Assessment Branch Agency for Toxic Substances and Disease Registry

Illinois Beach State Park – Exposure Investigation Report
Executive Summary Background The Adeline Jay Geo-Karis Illinois Beach State Park (IBSP) consists
of 6.5 miles of Lake Michigan shoreline in the city of Zion, Lake County, Illinois. It is bordered by the Wisconsin state line to the north, Lake Michigan to the east, the town of Zion to the west, and the Johns-Manville National Priorities List (NPL) hazardous waste site to the south. The Park encompasses 4,160 acres and receives an average of approximately 1.7 million visitors per year. Recreational activities available include camping, swimming, fishing, hiking, bicycling, and picnicking. The Park is a unique natural resource with the only remaining Lake Michigan beach ridge shoreline left in the state
Asbestos and IBSP
In late 1997, pieces of transite pipe, siding, and roofing materials suspected of containing asbestos were found scattered along the beach. In February 1998, Illinois Department of Natural Resources collected two bulk samples of the material and found they contained asbestos fibers. Following this discovery, Illinois Department of Natural Resources began an investigation to determine the extent and possible source of contamination of asbestos-containing material (ACM). Potential sources include:
•Former beachfront homes that have since washed into Lake Michigan. Much of the material found at the Park is common construction material used in the past. One estimate indicated that 129 homes were ultimately destroyed by erosion. Building materials and infrastructure materials from that erosion may be contributing to ACM on the beach.
• The Johns-Manville site immediately south of the Park. This plant manufactured a variety of roofing, flooring, wall covering, and insulating materials from1922 - 1988. The raw materials used at Johns-Manville include Portland cement, asphalt, paper, and asbestos. A 150-acre parcel of the property was used for disposal of asbestos containing material (ACM) and was placed on the NPL in 1983.
• Several sources of nourishment sand have been used at the beach. Currently, IBSP requires 80,000 – 100,000 cubic yards of sand per year to prevent erosion, particularly to the North Unit beaches.
• A former rifle range in the Camp Logan area. The rifle range was built for the 1959 Pan American games and contained a large berm built with factory waste material donated by Johns-Manville. Wave action may have destroyed this berm that also potentially contained ACM.
i

Illinois Beach State Park – Exposure Investigation Report
Past studies In 2000, the Illinois Department of Public Health (IDPH) published a Public Health Assessment of IBSP. The report concluded that there was no apparent public health hazard at IBSP. However, it was recommended that warning signs and flyers be posted to alert the public about the possible presence of asbestos materials on the beach, and continuation of periodic beach inspection and ACM removal.
In 2005, the Center for Excellence in Environmental Health at the University of Illinois at Chicago (UIC) School of Public Health published an evaluation of IBSP. The UIC study evaluated the levels of asbestos in various beach areas at IBSP, comparing the results to other beaches on the southwestern shoreline of Lake Michigan. Results of this study found statistically elevated levels of asbestos structures releasable from the sand in IBSP North unit sand relative to other background beaches. However, the estimated levels of asbestos exposure were below the risk levels used by EPA as a threshold for taking action.
Why did ATSDR do this Exposure Investigation (EI)?
Past studies of IBSP have found asbestos-containing material and asbestos fibers in beach sands. Current assessment methodology recommends that activity-based sampling be performed to assess potential exposure levels. This Exposure Investigation (EI) was conducted jointly with the Illinois Department of Natural Resources (IDNR) to estimate potential exposure levels to individuals who utilize the beach areas at IBSP by measuring exposure during simulated activities.
What activities were simulated?
We collected samples simulating construction of sand castles using dry sand and beach maintenance activities. We also sampled at reference stations inside the park boundary, but away from beach areas. Sand castle construction with dry sand was chosen as a representative activity because it involved close exposures to the breathing zone and manipulation of the sand. The beach maintenance activity was chosen because it represented the most intense manipulation of the sand.
What are the results of the EI?
ATSDR found that simulated sand castle building did not result in air levels of asbestos greater than the reference stations. Simulated beach maintenance activities (a tractor was used to drag a grating across the beach) resulted in slight elevations in asbestos levels compared to the reference stations. The reference stations were located in areas of the park away from the beach where no activities were expected to create airborne asbestos structures. None of the airborne asbestos samples detected chrysotile, which is the predominant type of asbestos found in the asbestos containing debris washing up on shore. Most of the
ii
Illinois Beach State Park – Exposure Investigation Report
What are the conclusions of the EI?
asbestos detected was not the regulated varieties used or found in commercial products, i.e., chrysotile, amosite, crocidolite, and fibrous varieties of tremolite, actinolite and anthophyllite.
The activities simulated at the beaches at IBSP pose no apparent public health hazard. Further activity sampling would help confirm this conclusion. Although an activist group has called for the closure of the park to protect public health, the weight of evidence of several previous studies, in addition to this EI, does not indicate that such an action is justified. There are significant health benefits to the community through the use of this valuable resource.
What specific recommendations have been made?
The IDNR should continue efforts to remove asbestos containing materials from the beach and continue educational activities to help visitors identify and avoid asbestos containing material. As an additional precaution to reduce releases during any beach maintenance activities (i.e., surface grading), intensive disturbances of the sand should be conducted during conditions when the sand surface is wet or when the beach area being maintained is closed to the public.
What are the uncertainties that may affect ATSDR’s conclusions?
The activity-based sampling conducted during this investigation reflected typical activities that children may engage in at the beach, as well as beach maintenance activities that would represent worst-case worker exposures that are unlikely to reflect actual conditions. A review of the EI report by the EPA Technical Review Workgroup for Asbestos acknowledged that the range of potential exposures had been evaluated. However, they recommended additional sampling using a scenario that may reflect intensive recreational activities, to better characterize actual exposures.
iii
Illinois Beach State Park – Exposure Investigation Report
Table of Contents Executive Summary ......................................................................................................................... i Table of Contents........................................................................................................................... iv Objectives and Rationale .................................................................................................................1 Background......................................................................................................................................1 Methods............................................................................................................................................2
Location Selection 3 Environmental Sampling .............................................................................................................4
Data Collection/Sampling Procedures 4 Activity descriptions 4 Laboratory Analytic Procedures 5
Methods for Measuring Asbestos Content...................................................................................6 Asbestos Health Effects and Toxicity..........................................................................................7
Current Standards, Regulations, and Recommendations for Asbestos........................................9 Results............................................................................................................................................10
Asbestos Analysis- Air Samples................................................................................................10 Asbestos Analysis- Bulk Samples .............................................................................................11 Moisture Analysis ......................................................................................................................11
Discussion......................................................................................................................................12 Limitations and Uncertainties....................................................................................................13 Application of IRIS Inhalation Unit Risk Factor and use of draft Superfund Methodology.....13
Activities Simulated 14 Sources of Amphibole Asbestos 14
Child Health Considerations ..........................................................................................................15 Conclusions....................................................................................................................................15 Recommendations..........................................................................................................................15 Authors, Technical Advisors .........................................................................................................17 References......................................................................................................................................18 Appendix A Figures.......................................................................................................................21 Appendix B Tables ........................................................................................................................28 Appendix C Exposure Investigation Meteorological Data ............................................................37 Appendix D PSI Sample Collection Details ..................................................................................43 Appendix E Exposure Investigation Protocol................................................................................45 Appendix F: ATSDR Responses to EPA TRW Comments...........................................................65
iv
Illinois Beach State Park – Exposure Investigation Report
Objectives and Rationale In June of 2005, ATSDR was asked by the Great Lakes Center for Excellence in Environmental Health at the University of Illinois-Chicago (UIC) School of Public Health to comment on their draft report, Illinois State Beach Park (IBSP): Determination of Asbestos Contamination in Beach Nourishment Sand, Interim Report [1]. The UIC study evaluated the levels of asbestos in various beach areas at IBSP, comparing the results to other beaches on the southwestern shoreline of Lake Michigan. Sample preparation and analysis was performed using the Superfund Method for the Determination of Releasable Asbestos in Soils and Bulk Materials (EPA 540-R-97-028, 1997) as modified by the Draft Elutriator Method for the Determination of Asbestos in Soils and Bulk Material [2,3]. This method analyzes the abundance of asbestos structures per gram of airborne particulate matter up to 10 micrometers in size (PM10) in the sample material. Results of this study found statistically elevated levels of asbestos structures releasable from the sand in IBSP North unit sand relative to other background beaches. However, the estimated levels of asbestos exposure were below the risk levels used by EPA as a threshold for taking action. Overall, ATSDR scientists agreed with the conclusions of the risk assessment, however, ATSDR reviewers felt that there were some uncertainties in the exposure assessment. They recommended activity-based sampling to confirm the elutriator findings and to better refine the types of activity releasing fibers to the air.
Illinois Department of Natural Resources (IDNR) requested the support of ATSDR in planning for an activity-based sampling effort at the IBSP. This investigation represented an opportunity for ATSDR to work collaboratively with the IDNR and the Illinois Department of Public Health to help address the issues raised by ATSDR’s review of the UIC report.
Background
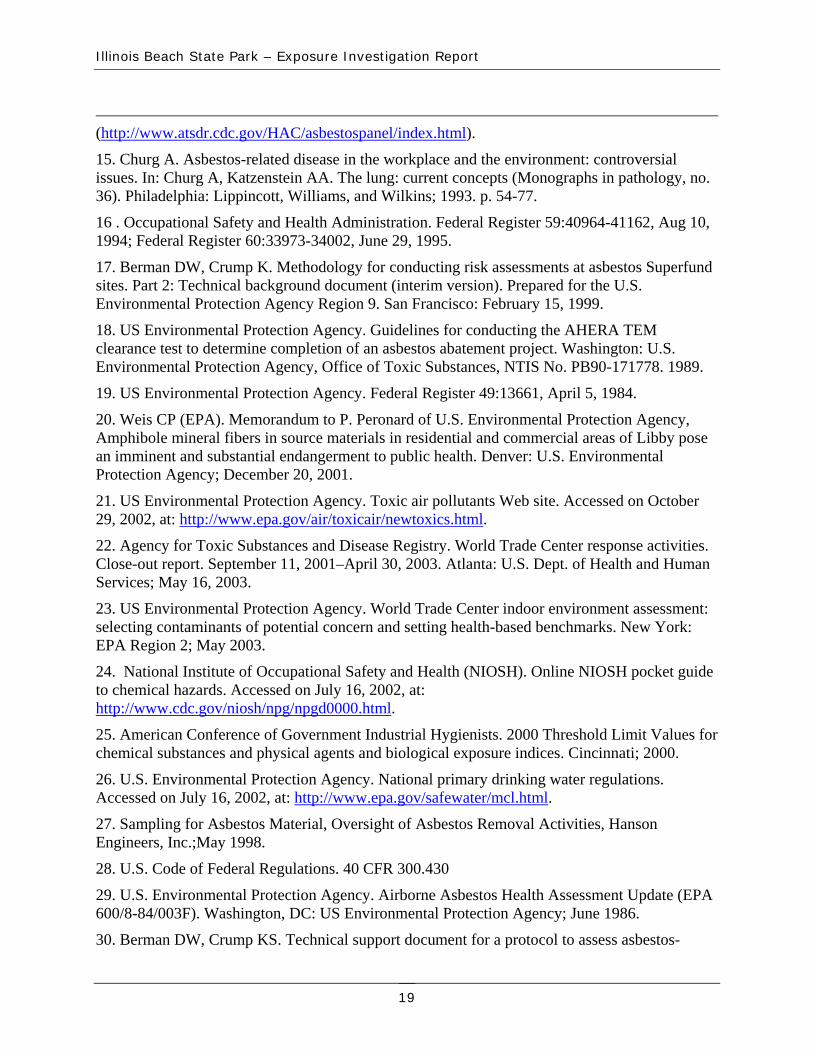
Illinois Beach State Park consists of 6.5 miles of Lake Michigan shoreline in the city of Zion, Lake County, Illinois. It is bordered by the Wisconsin state line to the north, Lake Michigan to the east, the town of Zion to the west, and the Johns-Manville National Priorities List (NPL) hazardous waste site to the south [1]. 1The Park encompasses 4,160 acres and receives an average of approximately 1.7 million visits a year (Patrick Giordano, Illinois Department of Natural Resources, Personal Communication). Recreational activities available include camping, swimming, fishing, hiking, bicycling, and picnicking [1]. Facilities within and near the park boundaries include the North Point Marina, a 244-unit campground, two major public swimming areas, several inland fishing ponds, a visitor center, the Commonwealth Edison Power Plant, and the Illinois Beach Resort and Conference Center (Appendix A) [1]. Besides seasonal tourism, the park holds special events that draw visitors, including the In-Campground Camper Show in May and the National Jet Ski Championships in July [1]. A map of the Park is shown in Figure 1, Appendix A.
The park is a unique natural resource with the only remaining Lake Michigan beach ridge shoreline left in the state [1]. Glacial advance and retreat created the area that left dunes, swales, marshes, and a variety of wildlife and vegetation in the area [1]. Before becoming a state park, the area was used for military training [1]. In 1948, the State of Illinois acquired the first parcels of what is now Illinois Beach State Park [1].
1

Illinois Beach State Park – Exposure Investigation Report
In late 1997, pieces of transite pipe, siding, and roofing materials suspected of containing asbestos were found scattered along the beach [1]. In February 1998, Illinois Department of Natural Resources collected two bulk samples of the material and found they contained asbestos fibers. Following this discovery, Illinois Department of Natural Resources began an investigation to determine the extent and possible source of asbestos contamination. Potential sources include:
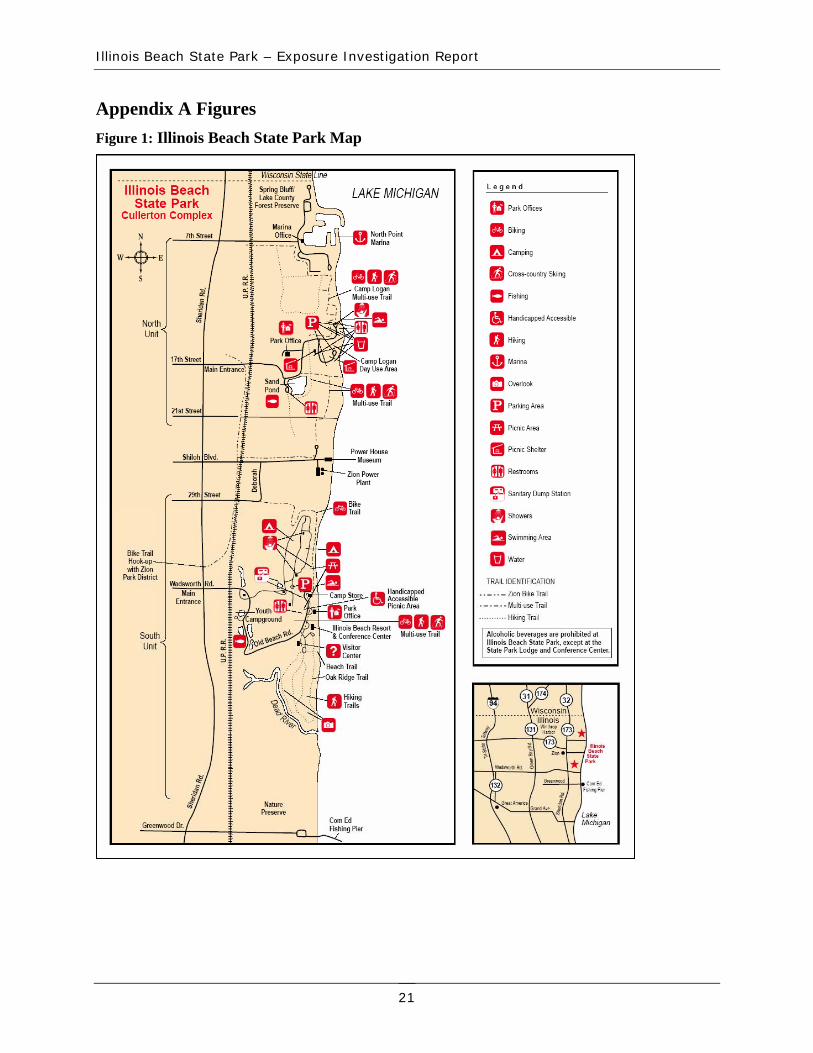
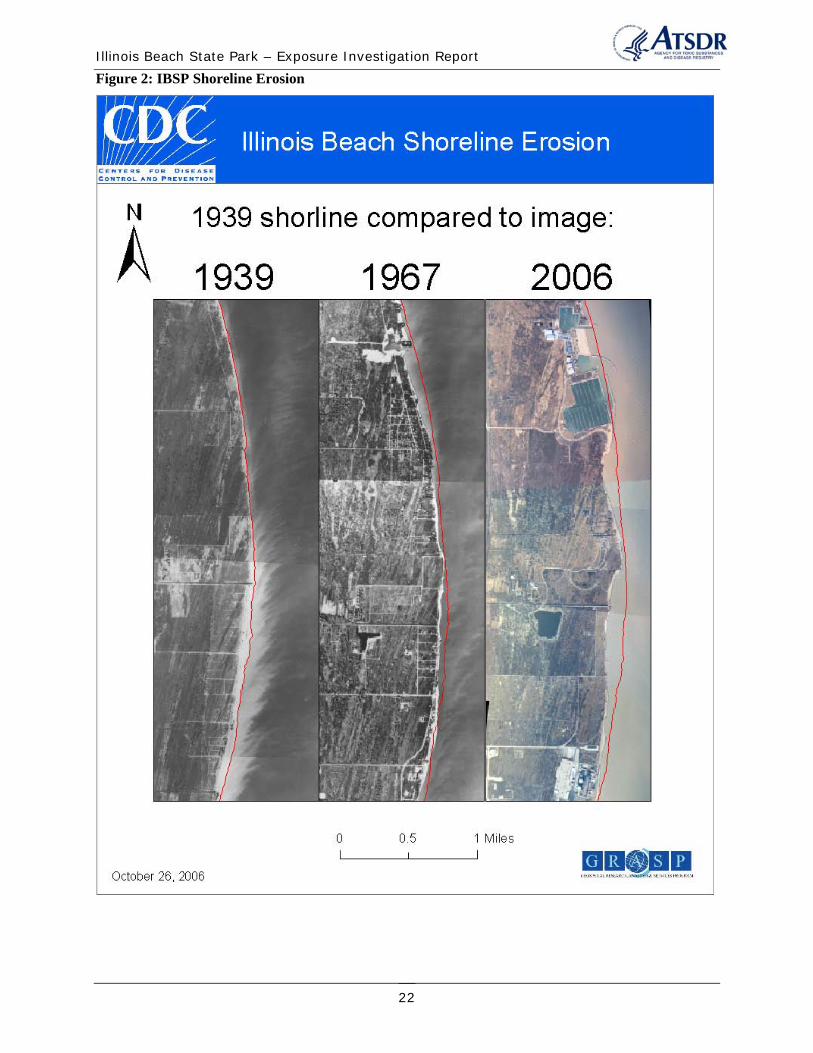
• Former beachfront homes that have since washed into Lake Michigan. Much of the material found at the Park is common construction material used in the past. According to historical maps, the present lakeshore contained about 129 homes that wave action destroyed and washed into the lake [1] (Appendix A, Figures 2 and 3).
• The Johns-Manville site immediately south of the Park. This plant manufactured a variety of roofing, flooring, wall covering, and insulating materials from1922 - 1988. The raw materials used at Johns-Manville include Portland cement, asphalt, paper, and asbestos. A 150-acre parcel of the property was used for disposal of asbestos containing material (ACM) and was placed on the NPL in 1983 [4].
• Several sources of nourishment sand have been used at the beach. Currently, IBSP requires 80,000 – 100,000 cubic yards of sand per year to prevent erosion, particularly to the North Unit beaches [1]. The tests for asbestos in the wide variety of past and potential sources of nourishment sand for IBSP has previously been reviewed [1]. In general, some of these sand sources have been visually inspected for asbestos containing materials or tested for asbestos using either polarized light microscopy or with transmission electron microscopy [1]. Asbestos was detected in some of these samples at low levels.
• A former rifle range in the Camp Logan area. The rifle range was built for the 1959 Pan American games and contained a large berm built with factory waste material donated by Johns-Manville. Wave action may have destroyed this berm that also potentially contained ACM.
Methods A. Exposure Investigation Design Monitoring was intended to characterize the potential for exposure during specific-case scenarios to airborne asbestos fibers at the Illinois Beach State Park. This was accomplished by collecting personal air samples of persons mimicking activities that normally occur at the beach. The specific-case scenarios for exposure activities were selected so that they would generate varying degrees of potential exposures. Sand castle building and beach maintenance were selected because they represent the upper bound of exposure activities. Sand castle building represents a high exposure activity for children and beach maintenance represents the maximum beach disturbance of all human activities. The specific-case scenarios conducted are shown on Appendix B, Table 1.
2
Illinois Beach State Park – Exposure Investigation Report
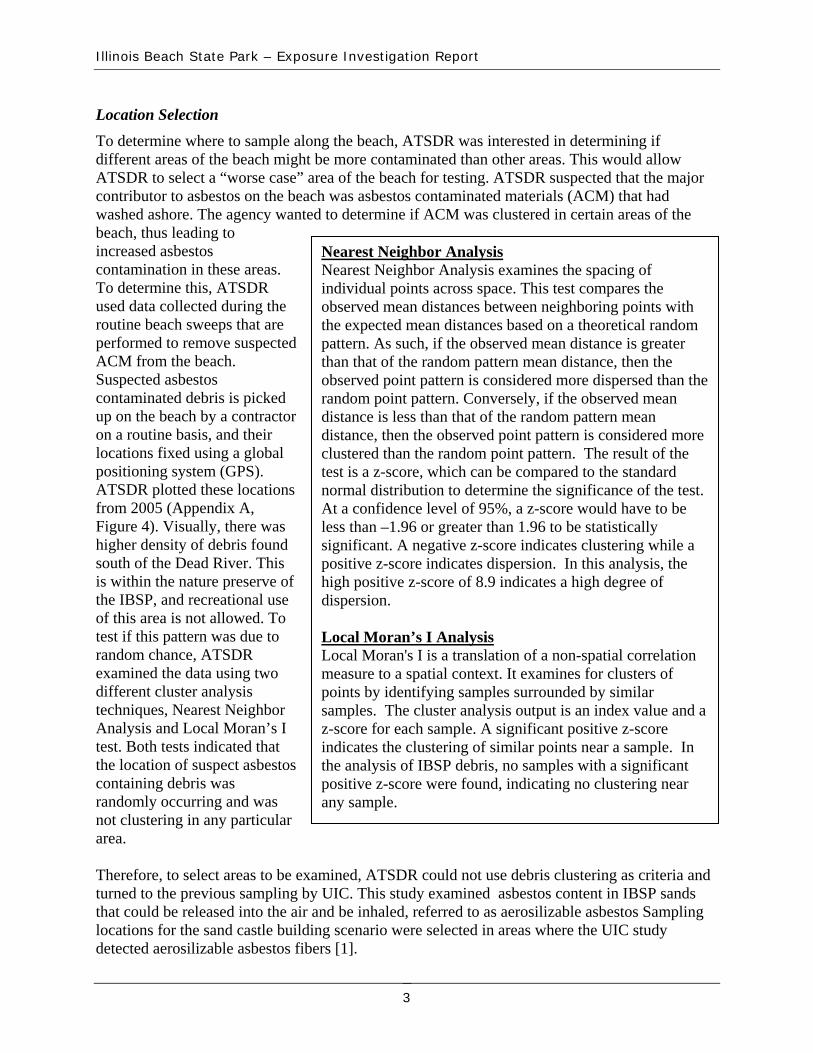
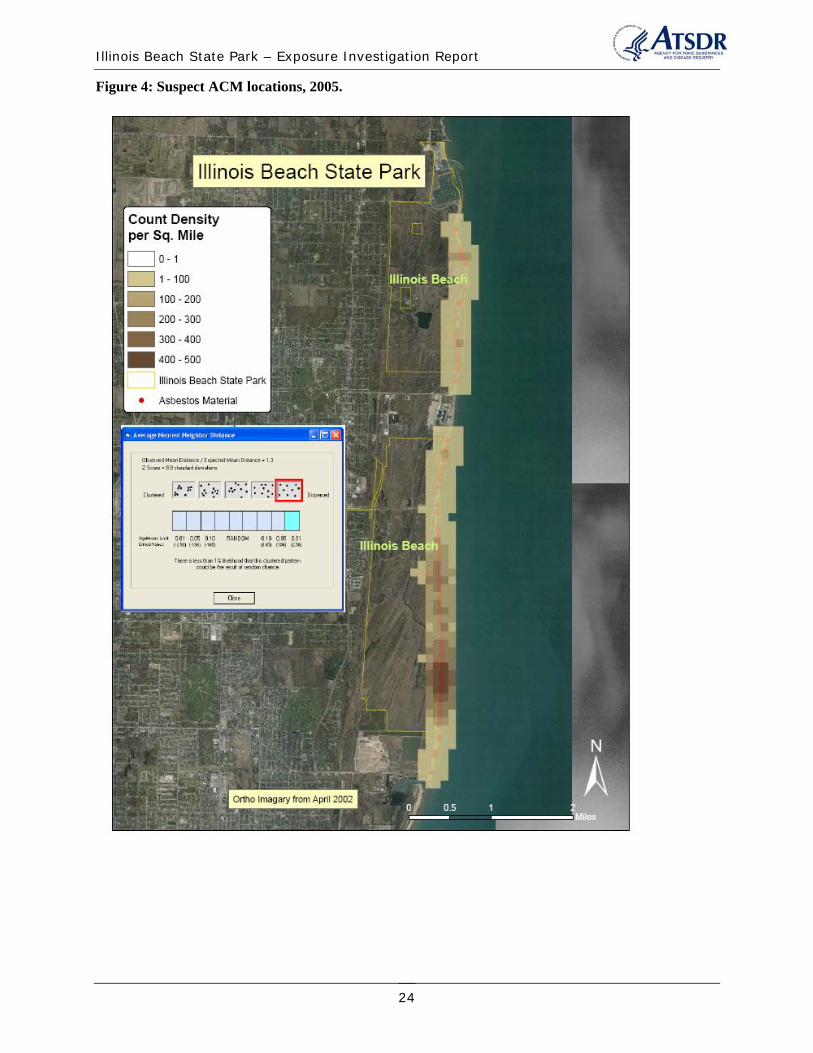
Location Selection To determine where to sample along the beach, ATSDR was interested in determining if different areas of the beach might be more contaminated than other areas. This would allow ATSDR to select a “worse case” area of the beach for testing. ATSDR suspected that the major contributor to asbestos on the beach was asbestos contaminated materials (ACM) that had washed ashore. The agency wanted to determine if ACM was clustered in certain areas of the beach, thus leading to increased asbestos Nearest Neighbor Analysis contamination in these areas. Nearest Neighbor Analysis examines the spacing of To determine this, ATSDR individual points across space. This test compares the used data collected during the observed mean distances between neighboring points with routine beach sweeps that are the expected mean distances based on a theoretical random performed to remove suspected pattern. As such, if the observed mean distance is greater ACM from the beach. than that of the random pattern mean distance, then the Suspected asbestos observed point pattern is considered more dispersed than the contaminated debris is picked random point pattern. Conversely, if the observed mean up on the beach by a contractor distance is less than that of the random pattern mean on a routine basis, and their distance, then the observed point pattern is considered more locations fixed using a global clustered than the random point pattern. The result of the positioning system (GPS). test is a z-score, which can be compared to the standard ATSDR plotted these locations normal distribution to determine the significance of the test. from 2005 (Appendix A, At a confidence level of 95%, a z-score would have to be Figure 4). Visually, there was less than –1.96 or greater than 1.96 to be statistically higher density of debris found significant. A negative z-score indicates clustering while a south of the Dead River. This positive z-score indicates dispersion. In this analysis, the is within the nature preserve of high positive z-score of 8.9 indicates a high degree of the IBSP, and recreational use dispersion. of this area is not allowed. To test if this pattern was due to Local Moran’s I Analysis random chance, ATSDR Local Moran's I is a translation of a non-spatial correlation examined the data using two measure to a spatial context. It examines for clusters of different cluster analysis points by identifying samples surrounded by similar techniques, Nearest Neighbor samples. The cluster analysis output is an index value and a Analysis and Local Moran’s I z-score for each sample. A significant positive z-score test. Both tests indicated that indicates the clustering of similar points near a sample. In the location of suspect asbestos the analysis of IBSP debris, no samples with a significant containing debris was positive z-score were found, indicating no clustering near randomly occurring and was any sample. not clustering in any particular area.
Therefore, to select areas to be examined, ATSDR could not use debris clustering as criteria and turned to the previous sampling by UIC. This study examined asbestos content in IBSP sands that could be released into the air and be inhaled, referred to as aerosilizable asbestos Sampling locations for the sand castle building scenario were selected in areas where the UIC study detected aerosilizable asbestos fibers [1].
3
Illinois Beach State Park – Exposure Investigation Report
Environmental Sampling Licensed contractors or employees working for the state of Illinois collected activity-based samples, using procedures consistent with the site Health and Safety Plan. These individuals replicated activities that will normally occur by beach-goers at Illinois Beach State Park. Efforts were made to reduce potential exposure to the public by conducting the sampling in the late spring during weekday hours, or during the summer after the park had closed.
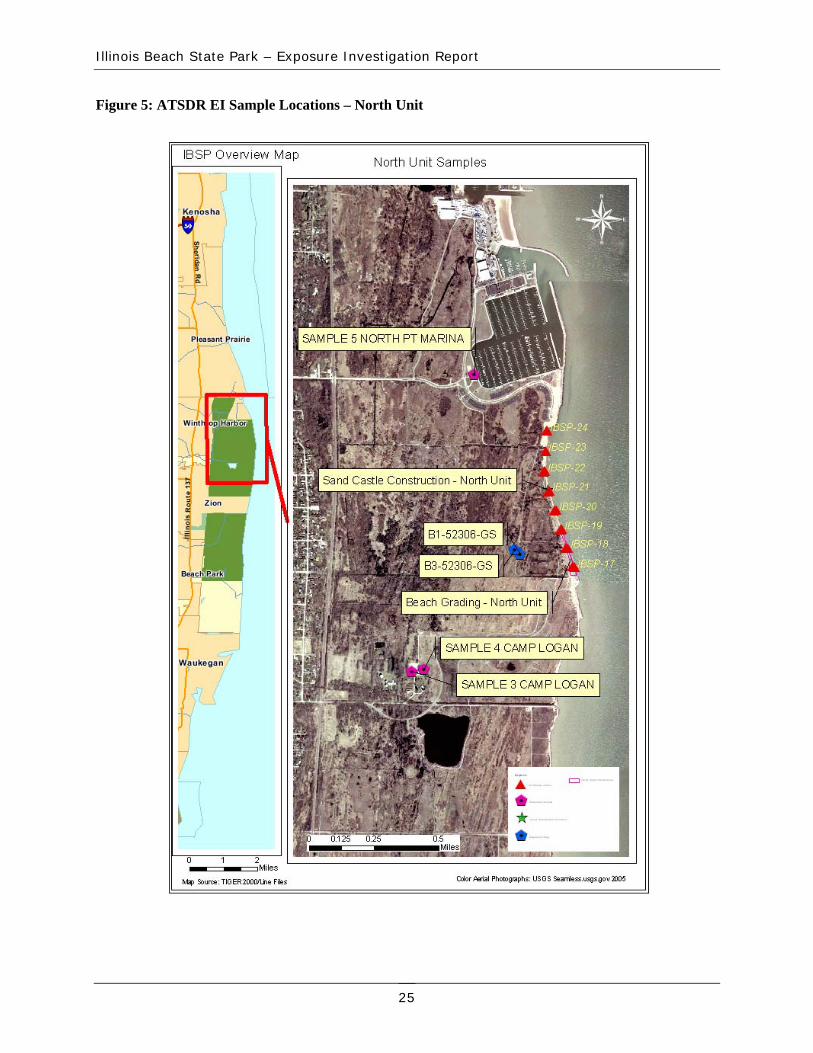
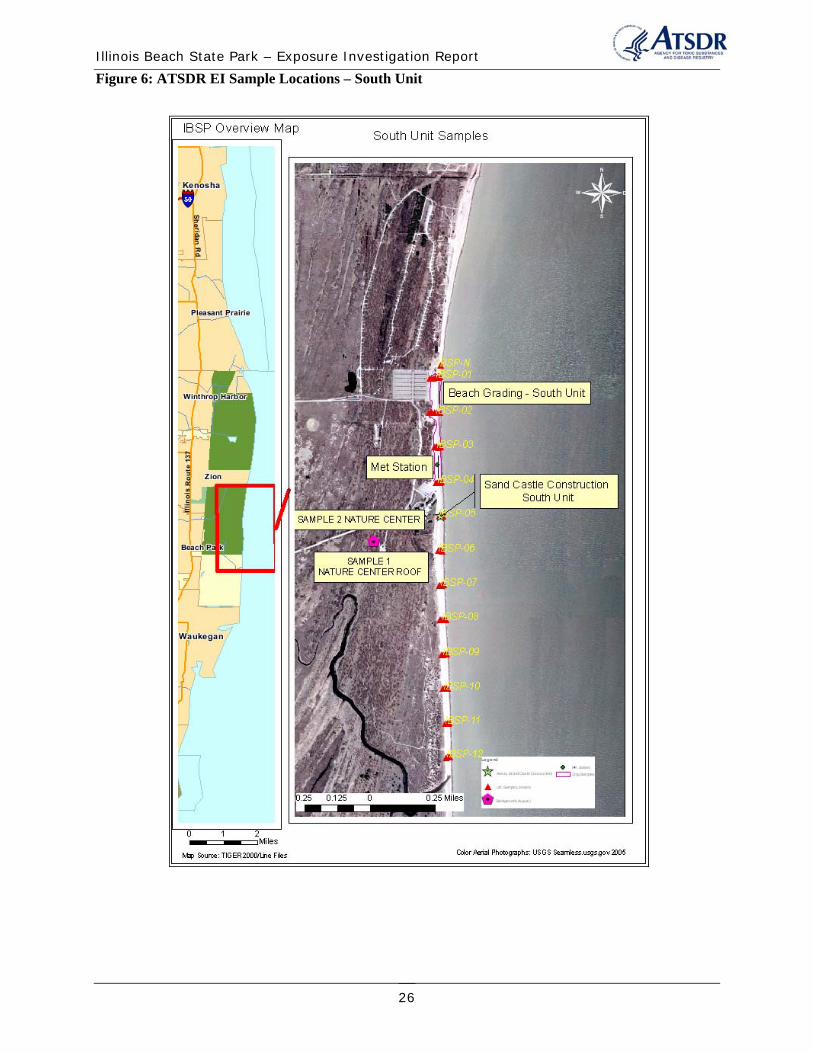
Data Collection/Sampling Procedures The sand castle scenarios lasted approximately 4 hours at each location. Wind speed and direction were noted from the National Climate Data Center meteorological station at Waukegan/Chicago regional airport (WBAN #14880). Data from the Waukegan/Chicago meteorological station is presented in Appendix D. ATSDR also utilized an on site meteorological station. To minimize the effects of high humidity or elevated soil moisture content, all activities were conducted at least 24 hours after a measurable rain event. Sample locations for air samples are shown in Appendix A, Figures 5 and 6.
Sampling procedures are outlined in the attached Exposure Investigation Protocol and Project Execution Manual. This manual is attached as part of the EI Protocol in Appendix E.
Activity descriptions Sandcastle building and/or digging in the sand was performed to mimic what a child might be exposed to while playing in the sand. Two general sampling areas were selected based on UIC study locations where levels of aerosolizable asbestos were detected. One area was located at UIC sample location IBSP-05S in the South Unit, the other location was between UIC sample locations IBSP-21A and IBSP-23A in the North Unit (sample locations shown relative to UIC locations in Appendix A, Figures 5 and 6). At each area, four sample locations were selected. Two locations were within 10 feet of the surfline and two locations in dryer sand away from the surf. Study subjects used typical beach sized tools and pails to disturb the sand by digging and piling the sand within the area. Sample cassettes were located within the breathing zone of each subject. The sampling period was divided into equal sub-periods to facilitate having the participant face each compass direction for an equal amount of time during the activity. This approach was designed to average the effect of wind direction on potential exposure. Random head and body movement during the activity should have further mitigated the impact of wind direction on exposure. Participants turned every 15 minutes for the entire sampling period.
According to Illinois Department of Natural Resources officials, employees may engage in beach maintenance activities that involve using a grader. This activity was monitored to determine if bystanders could be potentially exposed to and to characterize the maximum possible release of asbestos from the sand. For this monitoring, sampling pumps were used to collect air samples on the grader, with samplers located at approximately four feet in height. Four duplicate samples were collected simultaneously. Two samplers were set to collect air at 3 liters per minute (lpm), and two were set to collect air at 4 lpm. Sample cassettes were placed at approximately 4 feet in height behind the grader.
4
Illinois Beach State Park – Exposure Investigation Report
Laboratory Analytic Procedures
Air Samples
Analysis of air samples was performed by transmission electron microscopy (TEM). The specific methodology used was the International Standards Organization (ISO) method 10312, Phase Contrast Microscopy equivalents (PCMe) section [5]. The samples were analyzed with a sensitivity of 0.0005 asbestos fibers per cubic centimeter (f/cc). From the TEM analysis, phase contrast microscopy equivalents (PCMe) were calculated by counting asbestos structures that would have been counted had the sample been analyzed using phase contrast microscopy methods (see discussion of Methods of Measuring Asbestos Content, below). The ISO PCMe method was modified to include structures of all diameters greater than 0.25 micrometers and greater than 5 micrometers in length with an aspect ratio of 3:1. This modification was made to make the fiber counts equivalent to phase contrast microscopy measurements, which is what the EPA unit inhalation risk factor is based on [6].
Sand Bulk Samples – asbestos analysis
ATSDR uses soil sampling and bulk sampling to indicate the presence/absence of asbestos, mineralogical determination, and as an indicator of the fiber size distribution that has a potential to be (re)entrained into air. The lack of asbestos in a soil sample does not indicate the absence of risk, but is utilized as part of the overall site description. Over the last decade it has become more apparent in the asbestos risk community that fiber size plays a vital role in asbestos toxicity [7]. Current methods, such as the CARB 435 method and the Libby method, require soil samples to be ground to provide an appropriate size for microscopic evaluation. It is ATSDR's concern that grinding may alter fiber size and prevent the health assessor from determining if long fibers exist in the medium. ATSDR has recently used the “Comprehensive Soil Method” to analyze soil samples because it requires sieving rather than grinding in the sample prep. Sieving should leave longer fibers intact (results from Ambler, AK indicate this is the case [8]. The “Comprehensive Soil Method” is based mainly on the U.S. Environmental Protection Agency, The Protocol for Screening Soil and Sediment Samples for Asbestos Content Used by the US Environmental Protection Agency, Region 1 Laboratory [9] in addition, the method uses the TEM counting methods of ISO 10312 [5] and similar separation techniques of the Research Method for Sampling and Analysis of Fibrous Amphibole in Vermiculite Attic Insulation [10]. This method employs Phase Light Microscopy (PLM) for the majority of the bulk samples and TEM if no asbestos is found under PLM. Laboratory results with spiked samples indicate detection levels of approximately 0.1%. It should be noted that ATSDR uses soil data to screen and characterize environments in which the agency is looking for pathways of inhalation exposure to asbestos. ATSDR does not currently calculate asbestos health risks using soil samples.
The samples were examined under an Olympus SX-40 stereomicroscope at magnifications from 7 to 40 times. A representative portion of each sample amounting to approximately ¼ of the sample volume was poured into plastic laboratory sample trays. Tweezers, needles, and spatulas were used to carefully examine the sand under the stereomicroscope to detect any visible fibrous components. If fibrous components had been found, polarized light microscopy would have been used to identify the fiber type.
To determine the detection limit for this method when used with a sand matrix a control spiked sample (0.1% chrysotile) was prepared. A 4.4995 gram portion of a sample was weighed and
5
Illinois Beach State Park – Exposure Investigation Report
spiked with 0.005 grams of reference chrysotile that had been processed to reduce fiber length. Fiber length was reduced to simulate what was expected to be found in the environmental samples, and because shorter fibers are harder to detect microscopically. A suspension was prepared with the asbestos and dispersant which was then mildly sonicated to disperse the asbestos fibers. The sand and the chrysotile suspension were then combined and thoroughly mixed, and then dried and analyzed. Chrysotile was easily detected in the 0.1% chrysotile mixture by weight by the above method.
To detect asbestos fibers too small to be found by light microscope inspection, each sample was prepared for TEM analysis. Sand grains are too large to be put into suspension, so a rinse procedure was used to collect the fine fraction of particles associated with the sand, following the rinse procedure outlined in The Protocol for Screening Soil and Sediment Samples for Asbestos Content Used by the US Environmental Protection Agency, Region 1 Laboratory [9]. A representative five gram portion of each sample was obtained by the cone and quarter method. The subsample was rinsed using 100 milliliter (ml) of deionized water and a 250 micrometer (μm) sieve. A known portion of the rinse suspension was then filtered through a 0.2 μm, 47 mm diameter polycarbonate filter and prepared for TEM analysis.
Sand Bulk Samples – Solids Analysis
To determine the moisture content of the sand, samples were submitted to EPA Chicago Regional Laboratory for analysis of percent total solids, using the Standard Operating Procedure AIG0919 (Revision 2).
Methods for Measuring Asbestos Content Asbestos is a general name applied to a group of silicate minerals consisting of thin, separable fibers in substantially parallel sides. Asbestos minerals fall into two groups, serpentine and amphibole. Serpentine asbestos has relatively long and flexible crystalline fibers; this class includes chrysotile, the predominant type of asbestos used commercially. Fibrous amphibole minerals are brittle and have a rod- or needle-like shape. Amphibole minerals regulated as asbestos by OSHA include five classes: crocidolite, amosite, and the fibrous forms of tremolite, actinolite, and anthophyllite. Other unregulated amphibole minerals, including winchite, richterite, and others, can also exhibit fibrous asbestiform properties [11].
Asbestos fibers do not have any detectable odor or taste. They do not dissolve in water or evaporate into the air, although individual asbestos fibers can easily be suspended in the air. Asbestos fibers do not move through soil. They are resistant to heat, fire, chemical and biological degradation. As such, they can remain virtually unchanged in the environment over long periods of time.
The following sections provide an overview of several concepts relevant to the evaluation of asbestos exposure, including analytical techniques, toxicity and health effects, and the current regulations concerning asbestos in the environment.
A number of different analytical methods are used to evaluate asbestos content in air, soil, and other bulk materials. Each method varies in its ability to measure fiber characteristics such as length, width, and mineral type.
6

Illinois Beach State Park – Exposure Investigation Report
Phase-Contrast Microscopy (PCM): For air sampling required for worker protection, fiber quantification is traditionally done through PCM by counting fibers with lengths greater than 5 micrometers (>5 µm) and with an aspect ratio (length to width) greater than 3:1 [12]. This is the standard method by which workplace regulatory limits were developed. Disadvantages of this method include the inability to detect fibers less than 0.25 (<0.25) µm in diameter and the inability to distinguish between asbestos and non-asbestos fibers [11].
Polarized Light Microscopy (PLM): Asbestos content in soil and bulk material samples is commonly determined using PLM, a method which uses polarized light to compare refractive indices of minerals and can distinguish between asbestos and non-asbestos fibers and between different types of asbestos. The PLM method can detect fibers with lengths greater than approximately 1 µm (~1 µm), widths greater than ~0.25 µm, and aspect ratios (length-to-width ratios) greater than 3. Detection limits for PLM methods are typically 0.25%–1% asbestos.
Scanning Electron Microscopy (SEM): SEM and, more commonly, transmission electron microscopy (TEM) are more sensitive methods that can detect smaller fibers than light microscopic techniques. TEM allows the use of electron diffraction and energy-dispersive x-ray methods, which give information on crystal structure and elemental composition, respectively. This information can be used to determine the elemental composition of the visualized fibers. SEM does not allow measurement of electron diffraction patterns. One disadvantage of electron microscopic methods is that determining asbestos concentration in soil and other bulk material is difficult [11].
Transmission Electron Microscopy (TEM): Some older TEM measurements are given in mass of asbestos per volume of air (e.g. micrograms /cubic meter (µg/m3)). To estimate fiber concentration, these values were sometimes multiplied by conversion factors to give PCM equivalent fiber concentrations. The correlation between PCM fiber counts and TEM mass measurements is very poor. A conversion between TEM mass and PCM fiber count of 30 micrograms per cubic meter per fiber per cubic centimeter (µg/m3)/(f/cc) was adopted as a conversion factor, but this value is highly uncertain because it represents an average of conversions ranging from 5 to 150 (µg/m3)/(f/cc) [6]. The correlation between PCM fiber counts and TEM fiber counts is also very uncertain, and no generally applicable conversion factor exists for these two measurements [6].
The ISO 10312 method, which was used in this exposure investigation, determines and counts the types(s) of asbestos structures present, but sometimes can not discriminate between individual fibers of amphibole and non-asbestos analogues of the same amphibole mineral. The method is defined for polycarbonate capillan/pre filters or cellulose ester (either mixed esters of cellulose or cellulose nitrate) filters through which a known volume of air has been drawn. The method is suitable for determination of asbestos in both exterior and building atmospheres. For risk assessment purposes using the EPA Integrated Risk Information System (IRIS) risk model, only structures meeting the IRIS definition (i.e. all structures with a length greater than 5 micrometers, an aspect ration of 3:1, and a width greater than 0.25 micrometers) were counted to result in a Phase Contrast Microscopy equivalent concentration.
Asbestos Health Effects and Toxicity Breathing any type of asbestos increases the risk of the following health effects:
7

Illinois Beach State Park – Exposure Investigation Report
Malignant mesothelioma— cancer of the membrane (pleura) that encases the lungs and lines the chest cavity. This cancer can spread to tissues surrounding the lungs or other organs. The great majority of mesothelioma cases are attributable to asbestos exposure [11].
Lung cancer—cancer of the lung tissue, also known as bronchogenic carcinoma. The exact mechanism relating asbestos exposure with lung cancer is not completely understood. The combination of tobacco smoking and asbestos exposure greatly increases the risk of developing lung cancer [11].
Laryngeal cancer—cancer of the larynx (voice box). In 2006, the Institute of Medicine found sufficient evidence of an association between laryngeal cancer and asbestos exposure [13].
Non-cancer effects—these include asbestosis, scarring, and reduced lung function caused by asbestos fibers lodged in the lung; pleural plaques, localized or diffuse areas of thickening of the pleura; pleural thickening, extensive thickening of the pleura which may restrict breathing; pleural calcification, calcium deposition on pleural areas thickened from chronic inflammation and scarring; and pleural effusions, fluid buildup in the pleural space between the lungs and the chest cavity [11].
Not enough evidence is available to determine whether inhalation of asbestos increases the risk of cancers at sites other than the lungs, pleura, larynx, and abdominal cavity [11].
Ingestion of asbestos causes little or no risk of non-cancer effects. However, some evidence indicates that acute oral exposure might induce precursor lesions of colon cancer and that chronic oral exposure might lead to an increased risk of gastrointestinal tumors [11].
ATSDR considers the inhalation route of exposure to be the most significant in the current evaluation. Exposure scenarios that are protective of the inhalation route of exposure should be protective of dermal and oral exposures.
The scientific community generally accepts the correlations of asbestos toxicity with fiber length as well as fiber mineralogy. Fiber length may play an important role in clearance and mineralogy may affect both biopersistence and surface chemistry. ATSDR, responding to concerns about asbestos fiber toxicity from the World Trade Center disaster, held an expert panel meeting to review fiber size and its role in fiber toxicity in December 2002 [14]. The panel concluded that fiber length plays an important role in toxicity. Fibers with lengths <5 micrometers are unlikely to cause cancer in humans. However, fibers <5 micrometers in length may play a role in asbestosis when exposure duration is long and fiber concentrations are high. More information is needed to definitively reach this conclusion. Currently, EPA’s IRIS considers potent fibers as those having greater than 5 micrometers in length [6]. Shorter fibers are assumed to contribute nothing to quantitative cancer risk when using the IRIS potency factor [6].
In accordance with these concepts, it has been suggested that amphibole asbestos is more toxic than chrysotile asbestos, mainly because physical differences allow chrysotile to break down and to be cleared from the lung, whereas amphibole is not removed and builds up to high levels in lung tissue [15]. Some researchers believe the resulting increased duration of exposure to amphibole asbestos significantly increases the risk of mesothelioma and, to a lesser extent, asbestosis and lung cancer [15]. However, OSHA continues to regulate chrysotile and amphibole asbestos as one substance, as both types increase the risk of disease [16]. Currently, EPA’s IRIS assessment of asbestos also currently treats mineralogy as equipotent [6].
8
Illinois Beach State Park – Exposure Investigation Report
Evidence suggesting that the different types of asbestos fibers vary in carcinogenic potency and site specificity is limited by the lack of information on fiber exposure by mineral type. Other data indicate that differences in fiber size distribution and other process differences can contribute at least as much as fiber type to the observed variation in risk [17].
Counting fibers using the regulatory definitions (see below) does not adequately describe risk of health effects. Fiber size, shape, and composition contribute collectively to risks in ways that are still being elucidated. For example, shorter fibers (<5 μm) appear to deposit preferentially in the deep lung, but longer fibers (>5 μm) may disproportionately increase the risk of mesothelioma [11,17]. Some of the unregulated amphibole minerals, such as the winchite (from Libby, MT), can exhibit asbestiform characteristics and contribute to risk. Fiber diameters greater than 2–5 µm are considered above the upper limit of respirability and thus do not contribute significantly to risk. Methods are being developed to assess the risks posed by varying types of asbestos and are currently awaiting peer review [17].
Current Standards, Regulations, and Recommendations for Asbestos In industrial applications, asbestos-containing materials are defined as any material with >1% bulk concentration of asbestos [16,18,19]. It is important to note that 1% is not a health-based level, but instead represents the practical detection limit in the 1970s when OSHA regulations were created. Studies have shown that disturbing soil containing <1% asbestos, however, can suspend fibers at levels of health concern [20].
Friable asbestos (asbestos which is crumbly and can be broken down to release fibers into the air) is listed as a hazardous air pollutant on EPA’s Toxic Release Inventory [21]. This classification requires companies that release friable asbestos at concentrations >0.1% to report the release under Section 313 of the Emergency Planning and Community Right-to-Know Act.
OSHA’s permissible exposure limit (PEL) is 0.1 f/cc for asbestos fibers with lengths >5 µm and with an aspect ratio (length:width) >3:1, as determined by PCM [16]. This value represents a time-weighted average (TWA) exposure level based on 8 hours per day for a 40-hour work week. In addition, OSHA has defined an “excursion limit,” which stipulates that no worker should be exposed in excess of 1 f/cc as averaged over a sampling period of 30 minutes [16]. Historically, the OSHA PEL has steadily decreased from an initial standard of 12 f/cc established in 1971. The PEL levels prior to 1983 were determined on the basis of empirical worker health observations, while the levels set from 1983 forward employed some form of quantitative risk assessment. ATSDR does not, however, support using the PEL for evaluating exposure for community members, because the PEL was developed as an occupational exposure for adult workers.
In response to the World Trade Center disaster in 2001 and an immediate concern about asbestos levels in buildings in the area, the Department of Health and Human Services, EPA, and the Department of Labor formed the Environmental Assessment Working Group. This work group was made up of ATSDR, EPA, CDC’s National Center for Environmental Health, the National Institute for Occupational Safety and Health (NIOSH), the New York City Department of Health and Mental Hygiene, the New York State Department of Health, OSHA, and other state, local, and private entities. The work group set a re-occupation level of 0.01 f/cc after cleanup. Continued monitoring was also recommended to limit long-term exposure at this level [22]. In
9
Illinois Beach State Park – Exposure Investigation Report
2002, a multiagency task force headed by EPA was formed specifically to evaluate indoor environments for the presence of contaminants that might pose long-term health risks to residents in Lower Manhattan. The task force, which included staff from ATSDR, developed a health-based benchmark of 0.0009 f/cc for indoor air. This benchmark was developed to be protective under long-term continuous residential exposure scenarios (i.e. 30 years, 24 hours per day), and it is based on risk-based criteria that include conservative exposure assumptions and the current EPA cancer slope factor. Therefore, this benchmark may not be appropriately applied to non-residential settings, such as IBSP. The 0.0009 f/cc benchmark for indoor air was formulated on the basis of chrysotile fibers and is therefore most appropriately applied to airborne chrysotile fibers [23].
NIOSH has set a recommended exposure limit of 0.1 f/cc for asbestos fibers longer than 5 µm. This limit is a TWA for up to a 10-hour workday in a 40-hour work week [24]. The American Conference of Government Industrial Hygienists has also adopted a TWA of 0.1 f/cc as its Threshold Limit Value ® [25].
EPA has set a maximum contaminant level (MCL) for asbestos fibers in water of 7,000,000 fibers longer than 10 µm per liter, on the basis of an increased risk of developing benign intestinal polyps [26]. Many states use the same value as a human health water quality standard for surface water and groundwater.
Asbestos is a known human carcinogen. EPA’s IRIS model calculated an inhalation unit risk for cancer of 0.23 per f/cc of asbestos [6]. This value estimates additive risk of lung cancer and mesothelioma using a relative risk model for lung cancer and an absolute risk model for mesothelioma.
This quantitative risk model has significant limitations. First, the unit risks were based on measurements with phase contrast microscopy and therefore cannot be applied directly to measurements made with other analytical techniques. Second, the unit risk should not be used if the air concentration exceeds 0.04 f/cc because the slope factor above this concentration might differ from that stated [6]. Perhaps the most significant limitation is that the model does not consider mineralogy, fiber-size distribution, or other physical aspects of asbestos toxicity. EPA is in the process of updating their asbestos quantitative risk methodology given the limitations of the IRIS model currently used and the knowledge gained since this model was implemented in 1986.
Results Asbestos Analysis- Air Samples Phase contrast microscopy equivalent (PCMe) asbestos air sampling results are shown in Appendix B, Table 2. Details of mineralogy, structure types and dimensions are detailed in Appendix B, Table 3 and Appendix A, Figure 7. For sand castle playing, a single amphibole fiber was detected in sample 04 523806-TL. Counting this fiber as a PCMe fiber, this single fiber results in an air concentration of <0.0027 f/cc. The results are reported as “less than” because under ISO 10312, when 1 to 3 structures are counted, the result shall be reported as less than the corresponding one-sided upper 95% confidence limit for the Poisson distribution (1 structure – 4.74 times the analytical sensitivity, 2 structures – 6.30 times the analytical sensitivity).
10
Illinois Beach State Park – Exposure Investigation Report
Therefore, this concentration should only be regarded as an upper estimate of the actual concentration. All eight sand castle building samples were used to calculate an “average” exposure for sand castle building, with values for non-detect samples set at the analytical sensitivity level of 0.0005 f/cca. Asbestos concentrations around the beach dragging activity were higher than for the sand castle building activity, presumably due to the more intensive disturbance of the sand surface. For the South Unit, the total PCMe fiber concentrations were 0.0031 f/cc and 0.0036 f/cc. For the North Unit, the beach dragging results were higher than the south unit, with concentrations ranging from non-detect to 0.014 f/cc.
Asbestos Analysis- Bulk Samples Asbestos structures were not detected using the stereomicroscopic screening method described in Laboratory Analytic Procedures, above, with a detection limit of 0.1% by weight. Using the modified TEM method, some asbestos structures were detected:
Sample #1. The sample was composed of approximately 100% soil minerals (quartz, garnet, magnetite, and other minerals). No asbestos was detected by light microscopy. Three amphibole fibers were found using TEM, with spectra generally consistent with amosite, crocidolite, anthophyllite, tremolite, and actinolite. However, the spectra of these amphibole fibers were not completely consistent with the National Institute of Standards and Technology standard reference amphibole asbestos fibers.
Sample #2. The sample was composed of approximately 100% soil minerals (quartz, garnet, magnetite, and other minerals). No asbestos was detected by light microscopy. The detection limit for light microscopy was determined to be less than 0.1%. A chrysotile fiber was detected by TEM analysis. Two amphibole fibers were detected, with spectra generally consistent with amosite, crocidolite, anthophyllite, tremolite, and actinolite. However, the spectra of these amphibole fibers were not completely consistent with the National Institute of Standards and Technology standard reference amphibole asbestos fibers.
Sample #3. The sample was composed of approximately 100% soil minerals (quartz, garnet, magnetite, and other minerals). No asbestos was detected by light microscopy. A chrysotile fiber bundle was detected by TEM analysis. Two amphibole fibers were detected, with spectra generally consistent with amosite, crocidolite, anthophyllite, tremolite, and actinolite. However, the spectra of these amphibole fibers were not completely consistent with the National Institute of Standards and Technology standard reference amphibole asbestos fibers.
Sample #4. The sample was composed of approximately 100% soil minerals (quartz, garnet, magnetite, and other minerals). No asbestos was detected by light microscopy. No fibrous minerals were detected by TEM analysis.
Moisture Analysis The results for the analysis of percent solids and moisture are shown in Appendix B, Table 5.
a EPA’s Technical Review Workgroup recommended using ATSM D 6620-00. Practice for Asbestos Detection Limit Based on Counts for these data. This method would have resulted in assumed concentrations less than what ATSDR originally used. Given the uncertainty in the overall risk analysis, ATSDR elected to use the more conservative (higher) exposure estimates. Either method would have resulted in the same overall conclusion.
11
Illinois Beach State Park – Exposure Investigation Report
Some of the samples are labeled with a “J” flag, or estimated value, due to the fact that the holding times were exceeded at the laboratory. However, since these samples were held in a sealed container at -1.4° C, it is unlikely that the delay in the analysis resulted in a significant impact on the results of the soil moisture analysis.
Discussion Previous limited studies characterizing the content of the ACM found at IBSP has found chrysotile and crocidolite asbestos (Table 6) [27]. The material (pipe) is the predominant form ofsuspect ACM found on the beach (approximately 72.4%) [1]. Air samples during our simulated activities detected neither chrysotile nor crocidolite, even under the aggressive conditions during the simulation of beach maintenance activities. The predominant amphibole asbestos that was detected was not a regulated variety of asbestos (approximately 97% of all asbestos structures). Electron dispersive spectroscopy (EDS) found a spectra that contained small to moderate aluminum peaks and occasionally small potassium and titanium peaks that were not consistent with National Institute of Standards and Technology standard reference amphibole fibers. Two fibers in the air samples were tremolite-actinolite solution series. Asbestos in bulk samples could only be detected using TEM. Most of the asbestos detected in the bulk samples (78%) was amphibole that was similar to what was detected in the air samples. Some chrysotile was found (22% of structures).
The monitoring results of the sand castle playing scenarios failed to produce asbestos levels higher than reference stations. ATSDR used EPA’s asbestos risk model, developed in 1986, to estimate risks posed by exposures from the different activities at IBSP. The 1986 EPA risk model uses a single slope factor which, when multiplied by the lifetime average asbestos fiber exposure, predicts the increased risk of developing cancer (lung cancer and mesothelioma). To estimate the average lifetime asbestos fiber exposure, assumptions must be made regarding the frequency and duration a person would engage in activities at IBSP. In the risk assessment conducted by UIC, exposure frequency was assumed to be from 2 to 4 hours per day, occurring 25 to 50 days per year for 70 years [1]. ATSDR was unable to locate other published exposure factors for the amount of time people recreate on the beach. However, the EPA exposure factors handbook recommends the following exposure factors that are similar to the scenarios evaluated at IBSP:
Swimming: 60 minutes per day (50th percentile) to 180 minutes per day (90th percentile). Recommended frequency is one day per month.
24 hour cumulative number of minutes per day spent at Pool/River/Lake: 150 minutes (50th
percentile) to 480 minutes (90th percentile). Exposure factor handbook does not describe frequency of activity
Number of Minutes Spent Playing on Sand, Gravel, Dirt, or Grass When Fill Dirt Was Present: 0 minutes (50th percentile) to 120 minutes (90th percentile). Exposure factors handbook does not describe frequency of activity.
Given the above data, the assumed exposure factors in the UIC report appear slightly over conservative in regard to frequency and duration people may routinely visit the park and engage
12
Illinois Beach State Park – Exposure Investigation Report
in activities that disturb sand. Therefore, ATSDR assumes the same exposure variables for sand castle building (Table 7) [1]. Average lifetime fiber concentration was calculated using the following formula (Table 8):
f hr / day days / year yr durationAvg fiber conc, ( cc) = fiber conc for activity × 24hr / day
× 365 days / year
× 70 − yr lifetime
Calculated risks from average and reasonable maximum exposure for both sand castle building and beach dragging are within the acceptable lifetime risk range of 1 in 1,000,000 to 1 in 10,000 [28], that EPA uses for making clean-up decisions (Table 9).
The beach grading activity was expected to represent a worst-case exposure scenario, given the fact that it was a fairly intrusive disturbance of the sand surface that would not occur under routine conditions. Since this is also an activity that is not currently being conducted, it is considered to be a more theoretical situation than one that would actually occur. The results of this beach maintenance activity sampling indicated that asbestos fibers could be detected in the air behind the grading device. However, these were also very low levels (non-detect to 0.014 f/cc), below the occupational standards for workers. According to park employees, beach grading occurred from Labor Day until Memorial Day, and it lasted from three to four hours per day. ATSDR calculated approximate risk levels between 6.5 in 1,000,000 to 2.62 in 100,000 (Table 9). However, IDNR has not conducted beach grading activities for several years. In addition, the estimated air concentrations are unlikely to represent actual exposure conditions since the pumps were continuously sampling air behind the grading device. Concentrations at any stationary point even within the graded area are likely to be significantly lower than that measured with this sampling approach.
Based on the bulk analysis of sand samples collected, the sand does not appear to pose a significant source of asbestos fibers. A combination of both PLM and TEM was used to analyze the bulk sand samples that were collected. As previously discussed, TEM is far more sensitive than PLM. However, the disadvantage is that it only looks at a very small portion of the sample, whereas PLM can examine larger amounts of material at lower detection limits. While TEM did detect asbestos fibers in 3 of the bulk samples, the level was not high enough (0.1%) to accurately quantify.
Limitations and Uncertainties
The following areas significantly impact the certainty of this exposure investigation:
Application of IRIS Inhalation Unit Risk Factor and use of draft Superfund Methodology The IRIS inhalation unit risk factor was based on a large number of studies of occupationally-exposed workers that conclusively demonstrated the relationship between asbestos exposure and lung cancer or mesothelioma. These results have been corroborated by animal studies using adequate numbers of animals. The quantitative estimate is limited by uncertainty in the exposure estimates, which results from a lack of data on early exposure in the occupational studies and the uncertainty of conversions between various analytical measurements for asbestos. Furthermore, these exposures in the occupational cohorts were orders of magnitude higher than what was seen
13
Illinois Beach State Park – Exposure Investigation Report
in the activity samples collected at IBSP. Uncertainty also arises in extrapolation from occupational cohorts, made up of generally healthy workers, to the general population, which can include sensitive populations (e.g., elderly, children). Therefore, when EPA derived the slope factor, it stated that the numerical estimates of risk derived from the IRIS asbestos inhalation unit risk factor should be considered to have an approximately ten fold uncertainty [29].
As previously noted, EPA is in the process of updating their asbestos quantitative risk methodology given the limitations of the IRIS model currently used and the knowledge gained since this model was implemented in 1986. The predominance of amphibole asbestos warrants consideration of use of alternative methods of toxicity assessment than the standard IRIS model [17,30]. A draft model for quantifying carcinogenic health risks associated with amphibole asbestos has been developed, although it has not been formally accepted through the EPA review process [6]. The latest peer review of the draft Superfund protocol recommended that additional analyses underpinning the document, preparation of documentation, and further review be carried out in an open and transparent manner [31]. ATSDR therefore at this time has not elected to utilize this assessment methodology. However, as noted in the UIC report, there is a correlation between the protocol structures and PCM structures [1]. Therefore, use of the draft Superfund methodology would not alter conclusions about the sand castle scenario and grading the South Unit beach maintenance being similar to the samples collected at the reference stations. However, the draft Superfund methodology would likely result in higher estimates of risk for the North Unit beach maintenance because of the presence of amphibole asbestos. This supports ATSDR’s recommendation that, for the IBSP North Unit, beach maintenance activities that would disturb the sand to a similar level as beach grading be performed when the area is closed to visitors or the sand is appreciably wet.
Activities Simulated As noted in the amended protocol in Appendix E, an activity scenario was not performed because of the technical limitation of the personal sampling pumps to collect adequate sample volumes to obtain the necessary sensitivity for these sampling events. A smaller sampling volume would have affected the sensitivity and representativeness of the samples collected. Therefore, ATSDR shifted its focus to collecting and analyzing samples from the most aggressive scenario possible (beach maintenance activities) and on activities that involved manipulation of sand with the breathing zone proximate to the area being disturbed (sand castle construction). The sand castle construction did not involve the personnel moving extensively, so AC powered pumps could be used for this sampling event and a sufficient volume of air collected for analysis. While these scenarios bracketed the range of potential activities on the beach, further sampling would help completely characterize exposure at IBSP.
Sources of Amphibole Asbestos At this time, the source of the other amphibole is not known. While it is possible that it is coming from an anthropogenic source, the lack of chrysotile and crocidolite (which was found in the majority of ACM materials on the beach) tends to discount this hypothesis. Further scientific study of this issue would help with both the public perception of the problem and any possible risk management decisions for the IBSP.
14
Illinois Beach State Park – Exposure Investigation Report
Child Health Considerations ATSDR recognizes that infants and children may be more vulnerable than adults to exposure in communities faced with environmental contamination. Because children depend completely on adults for risk identification and management decisions, ATSDR is committed to evaluating their special interests.
The effects of asbestos on children are thought to be similar to the effects on adults. However, children could be especially vulnerable to asbestos exposures due to the following factors.
• Children are more likely to disturb soil or indoor dust while playing. • Children are closer to the ground and thus more likely to breathe contaminated soil or
dust. • Children could be more at risk than people exposed later in life because of the long
latency period between exposure and onset of asbestos-related respiratory disease.
The most at-risk children are those who would encounter asbestos in playing in soils. This issue is addressed by monitoring the sand castle building activity, and using an adjusted slope factor to account for the longer latency time for childhood exposure.
Conclusions ATSDR used activity-based sampling scenarios to evaluate potential exposures, representing both a routine recreational use and aggressive sand disturbance. The activities ATSDR simulated for children playing in the sand did not detect asbestos and therefore would pose no apparent public health hazard. At the IBSP North Unit, the beach grading activity resulted in an aggressive disturbance of the beach surface did result in a measurable dispersion of asbestos fibers into the air. This activity scenario was not intended to estimate levels of exposure, but rather to estimate the maximal dispersion from the sand surface into the air. In addition, since beach grading has not been conducted at IBSP for several years, these potential exposure levels do not represent a realistic exposure for recreational users of the park
However, these levels of asbestos fibers do not appear to be coming from the debris washing up on the shoreline. There is, however, some uncertainty with this conclusion because of limitations in the number of activities simulated.
Recommendations In light of the uncertainties related to quantitative risk and the weight of the evidence regarding health effects associated with some asbestos exposures, ATSDR recommends several precautionary actions to reduce potential exposures and increase public awareness:
1) Since the shoreline is a dynamic environment, ACM is likely to continue to wash up onto the shoreline. Efforts to remove ACM from the beach should be continued by IDNR.
2) In spite of efforts to remove ACM from the shoreline, the public may still encounter ACM. Therefore it is important that signs warning of asbestos contamination on the beach at IBSP continue to be maintained. Educational materials about the contamination should continue to be
15

Illinois Beach State Park – Exposure Investigation Report
made available to park visitors to help them visibly identify materials and to avoid disturbing them.
3) As a precaution to reduce releases during beach maintenance activities, intensive disturbances of the sand should be conducted during conditions when the sand surface is wet or when the park area being maintained is closed to the public. Because of the potential for fibers to be released during heavy disturbances of sand on the North Unit, IDNR should assess the potential hazard to its workers and take appropriate measures (e.g. keeping sand wet, personal protective equipment etc.) as the hazards warrant.
4) A review of the EI report by the EPA Technical Review Workgroup for Asbestos acknowledged that the range of potential exposures had been evaluated. However, they recommended additional sampling using scenarios that may reflect intensive recreational activities, to better characterize actual exposures. ATSDR supports this recommendation and has participated in the planning and implementation of sampling conducted by EPA’s Environmental Response Team, coordinated with EPA-Region 5 Superfund Program during September 2007. A review of the results of this sampling will be included in a follow-up assessment.
16
Illinois Beach State Park – Exposure Investigation Report
Authors, Technical Advisors James T. Durant, MSPH CIH Environmental Health Scientist ATSDR, Exposure Investigation and Site Assessment Branch
John Wheeler, PhD, DABT Senior Toxicologist ATSDR, Exposure Investigation and Site Assessment Branch
Mark Johnson, PhD, DABT Senior Regional Representative ATSDR, Division of Regional Operations, Region V
17
Illinois Beach State Park – Exposure Investigation Report
References
1. University of Illinois at Chicago. Illinois Beach State Park (IBSP): Determination of Asbestos Contamination in Beach Nourishment Sand, Interim Report of Findings, June 6, 2005.
2. U.S. Environmental Protection Agency. Superfund Method for the Determination of Releasable Asbestos in Soils and Bulk Materials. EPA 540-R-97-028. Washington D.C. ;1997.
3. Berman DW and Kolk A. Draft Modified Elutriator Method for the Determination of Asbestos in Soils and Bulk Material. Albany, CA: Aeolus, Inc.; May 23, 2000.
4. US Environmental Protection Agency. Second Five Year Review Report for Johns-Manville Site, Waukegan, Lake County, Illinois. Chicago: U.S. Environmental Protection Agency Region 5; May 2003.
5. International Organization for Standardization. Ambient air- Determination of asbestos fibers – direct transfer transmission electron microscopy method (ISO 10312:1995(E). Geneva, Switzerland: International Organization of Standardization; 1995.
6 US Environmental Protection Agency. Integrated risk information system (for asbestos). Accessed on October 25,2006, at: http://www.epa.gov/iris/subst/0371.htm.
7. Berman DW, Crump KS, Chatfield EJ, Davis JMG, Jones AD. The sizes, shapes, and mineralogy of asbestos structures that induce lung tumors or mesothelioma in AF/HAN rats following inhalation. Risk Analysis 1995; 15(2):181–95.
8. Agency for Toxic Substances and Disease Registry. Exposure Investigation Report: Ambler Gravel Pit. Atlanta, GA: US Department of Health and Human Services; June 2007.
9 US Environmental Protection Agency Region 1- Office of Environmental Evaluation & Measurement. The Protocol for Screening Soil and Sediment Samples for Asbestos Content Used by the US Environmental Protection Agency, Region 1 Laboratory. Lexington, MA: US Environmental Protection Agency; December 1997.
10. US Environmental Protection Agency. Research Method for Sampling and Analysis of Fibrous Amphibole in Vermiculite Attic Insulation (EPA 600/R-04/004). Washington, DC: US Environmental Protection Agency; January 2004.
11. Agency for Toxic Substances and Disease Registry. Toxicological profile for asbestos (update). Atlanta: U.S. Department of Health and Human Services; September 2001.
12. NIOSH Method 7400, Issue 2. Fibers - method 7400. In: NIOSH manual of analytical methods. Cincinnati, OH: U.S. Department of Health and Human Services, Public Health Service, Centers for Disease Control, National Institute for Occupational Safety and Health. Revision 2. August 15, 1994.
13. National Academy of Science, Institute of Medicine. Asbestos: Selected Cancers. Washington, DC: National Academies Press; 2006.
14. Agency for Toxic Substances and Disease Registry. Report on the expert panel on health effects of asbestos and synthetic vitreous fibers: the influence of fiber length. Atlanta: U.S. Department of Health and Human Services; 2003. Available at:
18
Illinois Beach State Park – Exposure Investigation Report
(http://www.atsdr.cdc.gov/HAC/asbestospanel/index.html).
15. Churg A. Asbestos-related disease in the workplace and the environment: controversial issues. In: Churg A, Katzenstein AA. The lung: current concepts (Monographs in pathology, no. 36). Philadelphia: Lippincott, Williams, and Wilkins; 1993. p. 54-77.
16 . Occupational Safety and Health Administration. Federal Register 59:40964-41162, Aug 10, 1994; Federal Register 60:33973-34002, June 29, 1995.
17. Berman DW, Crump K. Methodology for conducting risk assessments at asbestos Superfund sites. Part 2: Technical background document (interim version). Prepared for the U.S. Environmental Protection Agency Region 9. San Francisco: February 15, 1999.
18. US Environmental Protection Agency. Guidelines for conducting the AHERA TEM clearance test to determine completion of an asbestos abatement project. Washington: U.S. Environmental Protection Agency, Office of Toxic Substances, NTIS No. PB90-171778. 1989.
19. US Environmental Protection Agency. Federal Register 49:13661, April 5, 1984.
20. Weis CP (EPA). Memorandum to P. Peronard of U.S. Environmental Protection Agency, Amphibole mineral fibers in source materials in residential and commercial areas of Libby pose an imminent and substantial endangerment to public health. Denver: U.S. Environmental Protection Agency; December 20, 2001.
21. US Environmental Protection Agency. Toxic air pollutants Web site. Accessed on October 29, 2002, at: http://www.epa.gov/air/toxicair/newtoxics.html.
22. Agency for Toxic Substances and Disease Registry. World Trade Center response activities. Close-out report. September 11, 2001–April 30, 2003. Atlanta: U.S. Dept. of Health and Human Services; May 16, 2003.
23. US Environmental Protection Agency. World Trade Center indoor environment assessment: selecting contaminants of potential concern and setting health-based benchmarks. New York: EPA Region 2; May 2003.
24. National Institute of Occupational Safety and Health (NIOSH). Online NIOSH pocket guide to chemical hazards. Accessed on July 16, 2002, at: http://www.cdc.gov/niosh/npg/npgd0000.html.
25. American Conference of Government Industrial Hygienists. 2000 Threshold Limit Values for chemical substances and physical agents and biological exposure indices. Cincinnati; 2000.
26. U.S. Environmental Protection Agency. National primary drinking water regulations. Accessed on July 16, 2002, at: http://www.epa.gov/safewater/mcl.html.
27. Sampling for Asbestos Material, Oversight of Asbestos Removal Activities, Hanson Engineers, Inc.;May 1998.
28. U.S. Code of Federal Regulations. 40 CFR 300.430
29. U.S. Environmental Protection Agency. Airborne Asbestos Health Assessment Update (EPA 600/8-84/003F). Washington, DC: US Environmental Protection Agency; June 1986.
30. Berman DW, Crump KS. Technical support document for a protocol to assess asbestos
19

Illinois Beach State Park – Exposure Investigation Report
related risk (final draft). Prepared for EPA Office of Solid Waste and Emergency Response. Washington October 2003.
31. US Environmental Protection Agency. Report on the peer consultation workshop to discuss a proposed protocol to assess asbestos-related risk. Prepared for EPA by Eastern Research Group, Inc. Washington: EPA Office of Solid Waste and Emergency Response; May 30 2003.
20
Illinois Beach State Park – Exposure Investigation Report
Appendix A Figures Figure 1: Illinois Beach State Park Map
21
Illinois Beach State Park – Exposure Investigation Report
Figure 2: IBSP Shoreline Erosion
22
Illinois Beach State Park – Exposure Investigation Report
Figure 3: Houses near shoreline, IBSP
23
Illinois Beach State Park – Exposure Investigation Report
Figure 4: Suspect ACM locations, 2005.
24
Illinois Beach State Park – Exposure Investigation Report
Figure 5: ATSDR EI Sample Locations – North Unit
25
Illinois Beach State Park – Exposure Investigation Report
Figure 6: ATSDR EI Sample Locations – South Unit
26

Illinois Beach State Park – Exposure Investigation Report
Figure 7: Air Sample Structure Dimensions
0
0.5
1
1.5
2
2.5
3
3.5
Wid
th (m
icro
met
ers)
0 5 10 15 20 25 30 35
Length (micrometers)
27
Illinois Beach State Park – Exposure Investigation Report
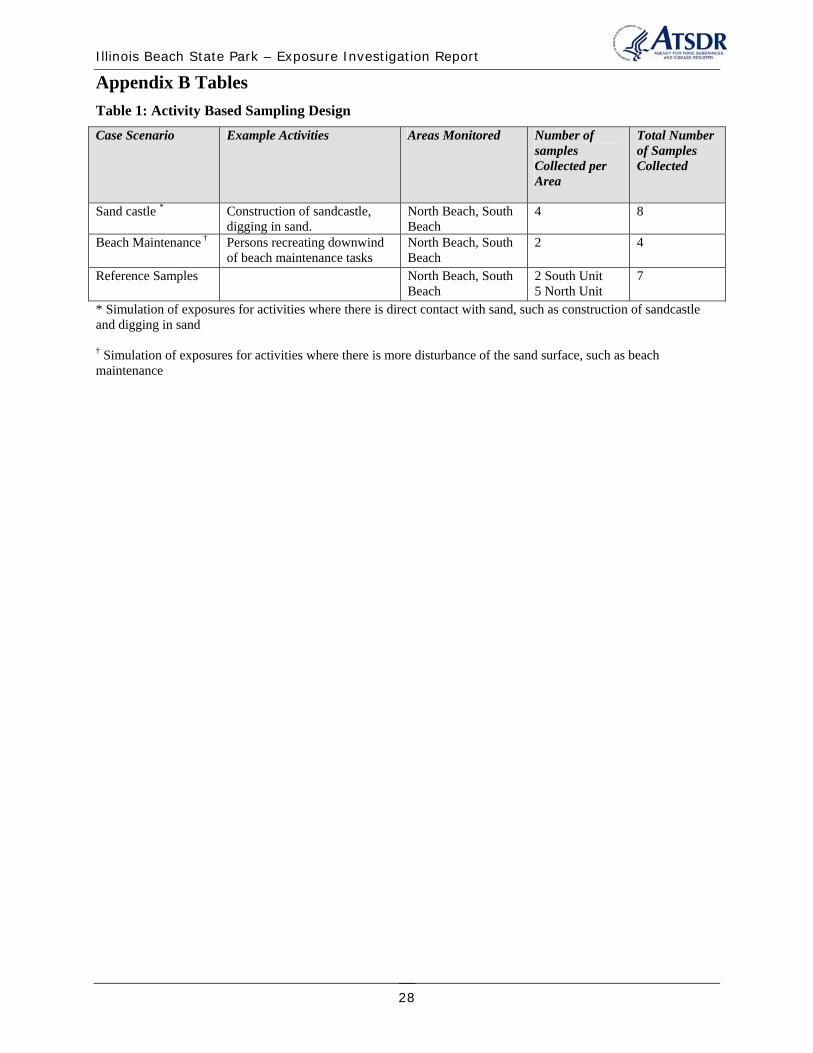
Appendix B Tables Table 1: Activity Based Sampling Design
Case Scenario Example Activities Areas Monitored Number of samples Collected per Area
Total Number of Samples Collected
Sand castle * Construction of sandcastle, digging in sand.
North Beach, South Beach
4 8
Beach Maintenance † Persons recreating downwind of beach maintenance tasks
North Beach, South Beach
2 4
Reference Samples North Beach, South Beach
2 South Unit 5 North Unit
7
* Simulation of exposures for activities where there is direct contact with sand, such as construction of sandcastle and digging in sand
† Simulation of exposures for activities where there is more disturbance of the sand surface, such as beach maintenance
28

Illinois Beach State Park – Exposure Investigation Report
Table 2: Activity Sampling Results
Sample ID Activity Type Air Volume (l)
Grid Openings counted
Number of Asbestos PCMe* Structures detected
Combined Asbestos Concentration (f/cc, PCMe, includes other amphibole asbestos)
01 522306-TL Blank 0 36 0 n/a 02 523806-TL Blank 0 36 0 n/a B1-52306-GS Reference – May
2006 2,935 36 0 Non-detect (<0.0004)
B3-52306-GS Reference – May 2006
2,903 36 1 <0.0027 § (OA)
03 523806-TL Sand Castle 2,411 36 0 Non-detect (<0.0005) 04 523806-TL Construction – 2,411 36 1 <0.0027 §
05 523806-TL South Unit 2,411 36 0 Non-detect (<0.0005) 06 523806-TL 2,411 36 0 Non-detect (<0.0005) 07 523806-TL Sand Castle 2,418 36 0 Non-detect (<0.0005) 08 523806-TL Construction – 2,418 36 0 Non-detect (<0.0005) 09 523806-TL North Unit 2,216 36 0 Non-detect (<0.0005) 10 523806-TL 2,418 36 0 Non-detect (<0.0005) D01 523806TL
Beach Grading – South Unit
332 252 2 (Trem/Act) 7 (OA)
<0.003 0.00036
D02 523806TL
332 252 1 (Trem/Act) 6 (OA)
<0.002 0.00031
Sample 1 Reference – 2,647 30 0 Non-detect (<0.0005) Sample 2 August 2006 2,606 30 0 Non-detect (<0.0005) Sample 3 2,585 31 1 (Trem/Act <0.002 Sample 4 2,544 31 0 Non-detect (<0.0005) Sample 5 2,504 32 0 Non-detect (<0.0005) Sample 6 Beach Grading – 173 450 26 (OA) 0.014 Sample 7 North Unit 173 450 1 (Trem/Act),
20 0.01
Sample 8 236 330 4 0.002 Sample 9 220 357 0 Non-detect (<0.0005) Sample 10 Blank 0 33 0 n/a Sample 11 Blank 0 33 0 n/a
* PCMe = Phase Contrast Microscopy Equivalent structures.‡OA = Other Amphiboles (other than amosite, crocidolite anthophyllite, tremolite, actinolite based on comparison with NIST standard spectra§According to ISO 10312, when 1 to 3 structures are counted, the result shall be reported as less than the corresponding one-sided upper 95% confidence limit for the Poisson distribution (1 structure – 4.74 times the analytical sensitivity, 2 structures – 6.30 times the analytical sensitivity).
29
Illinois Beach State Park – Exposure Investigation Report
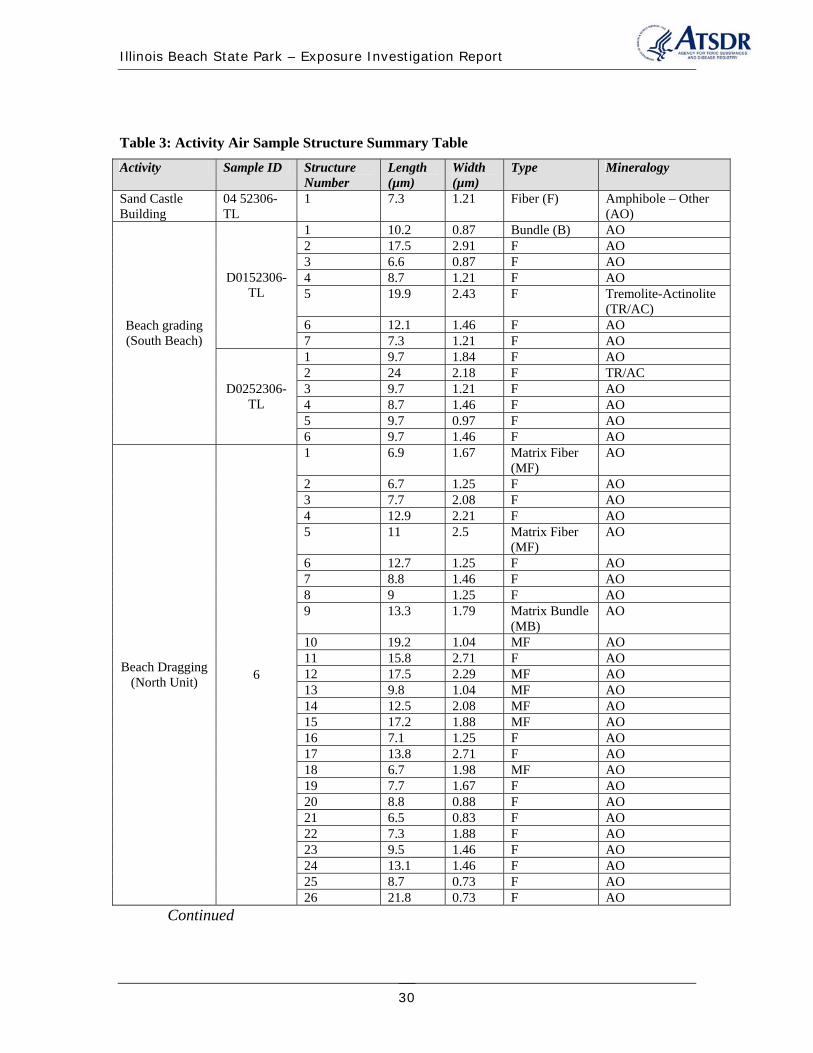
Table 3: Activity Air Sample Structure Summary Table
Activity Sample ID Structure Number
Length (µm)
Width (µm)
Type Mineralogy
Sand Castle Building
04 52306TL
1 7.3 1.21 Fiber (F) Amphibole – Other (AO)
1 10.2 0.87 Bundle (B) AO 2 17.5 2.91 F AO 3 6.6 0.87 F AO
D0152306 4 8.7 1.21 F AO TL 5 19.9 2.43 F Tremolite-Actinolite
(TR/AC) Beach grading 6 12.1 1.46 F AO (South Beach) 7 7.3 1.21 F AO
1 9.7 1.84 F AO 2 24 2.18 F TR/AC
D0252306 3 9.7 1.21 F AO TL 4 8.7 1.46 F AO
5 9.7 0.97 F AO 6 9.7 1.46 F AO 1 6.9 1.67 Matrix Fiber
(MF) AO
2 6.7 1.25 F AO 3 7.7 2.08 F AO 4 12.9 2.21 F AO 5 11 2.5 Matrix Fiber
(MF) AO
6 12.7 1.25 F AO 7 8.8 1.46 F AO 8 9 1.25 F AO 9 13.3 1.79 Matrix Bundle
(MB) AO
10 19.2 1.04 MF AO
Beach Dragging (North Unit) 6
11 15.8 2.71 F AO 12 17.5 2.29 MF AO 13 9.8 1.04 MF AO 14 12.5 2.08 MF AO 15 17.2 1.88 MF AO 16 7.1 1.25 F AO 17 13.8 2.71 F AO 18 6.7 1.98 MF AO 19 7.7 1.67 F AO 20 8.8 0.88 F AO 21 6.5 0.83 F AO 22 7.3 1.88 F AO 23 9.5 1.46 F AO 24 13.1 1.46 F AO 25 8.7 0.73 F AO 26 21.8 0.73 F AO
Continued
30
Illinois Beach State Park – Exposure Investigation Report
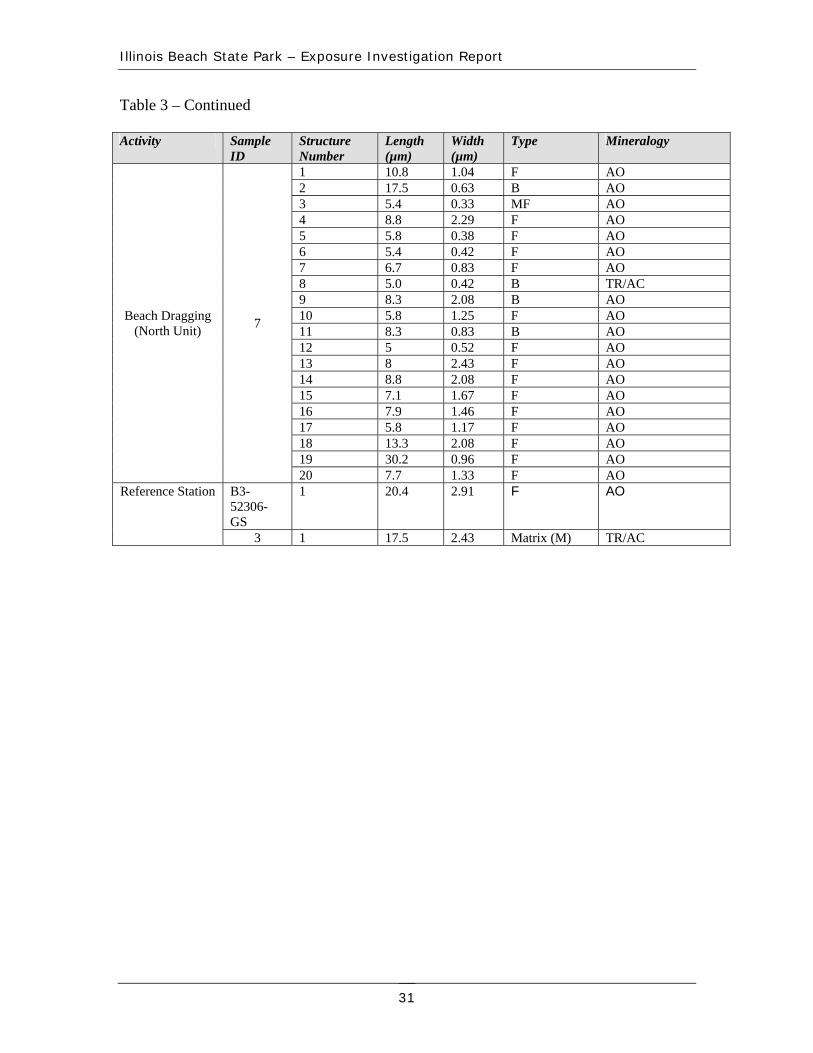
Table 3 – Continued
Activity Sample ID
Structure Number
Length (µm)
Width (µm)
Type Mineralogy
1 10.8 1.04 F AO 2 17.5 0.63 B AO 3 5.4 0.33 MF AO 4 8.8 2.29 F AO 5 5.8 0.38 F AO 6 5.4 0.42 F AO 7 6.7 0.83 F AO 8 5.0 0.42 B TR/AC 9 8.3 2.08 B AO
Beach Dragging 7 10 5.8 1.25 F AO (North Unit) 11 8.3 0.83 B AO
12 5 0.52 F AO 13 8 2.43 F AO 14 8.8 2.08 F AO 15 7.1 1.67 F AO 16 7.9 1.46 F AO 17 5.8 1.17 F AO 18 13.3 2.08 F AO 19 30.2 0.96 F AO 20 7.7 1.33 F AO
Reference Station B352306GS
1 20.4 2.91 F AO
3 1 17.5 2.43 Matrix (M) TR/AC
31

Illinois Beach State Park – Exposure Investigation Report
Table 4: Sand Bulk Analysis Structure Table
Sample ID Structure Number Length (µm) Width (µm) Type Mineralogy #3 1 1.1 0.21 Bundle (B) Chrysotile (C)
2 12.6 0.29 Fiber (F) Amphibole – Other (AO)
3 3.4 0.15 F AO #1 1 3.2 0.73 F AO
2 2.2 0.29 F AO 3 3.4 0.29 F AO
#2 1 3.9 0.15 F AO 2 2.4 0.73 F AO 3 8.7 0.05 F C
32
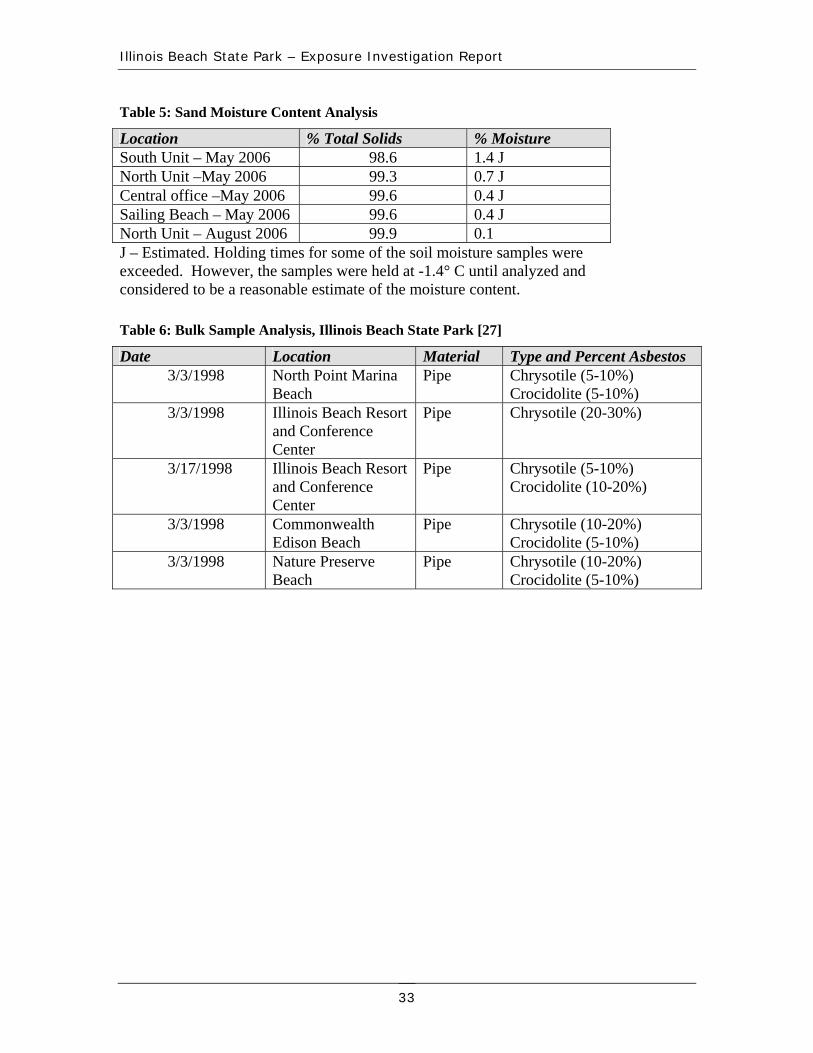
Illinois Beach State Park – Exposure Investigation Report
Table 5: Sand Moisture Content Analysis
Location % Total Solids % Moisture South Unit – May 2006 98.6 1.4 J North Unit –May 2006 99.3 0.7 J Central office –May 2006 99.6 0.4 J Sailing Beach – May 2006 99.6 0.4 J North Unit – August 2006 99.9 0.1 J – Estimated. Holding times for some of the soil moisture samples were exceeded. However, the samples were held at -1.4° C until analyzed and considered to be a reasonable estimate of the moisture content.
Table 6: Bulk Sample Analysis, Illinois Beach State Park [27]
Date Location Material Type and Percent Asbestos 3/3/1998 North Point Marina
Beach Pipe Chrysotile (5-10%)
Crocidolite (5-10%) 3/3/1998 Illinois Beach Resort
and Conference Center
Pipe Chrysotile (20-30%)
3/17/1998 Illinois Beach Resort and Conference Center
Pipe Chrysotile (5-10%) Crocidolite (10-20%)
3/3/1998 Commonwealth Edison Beach
Pipe Chrysotile (10-20%) Crocidolite (5-10%)
3/3/1998 Nature Preserve Beach
Pipe Chrysotile (10-20%) Crocidolite (5-10%)
33
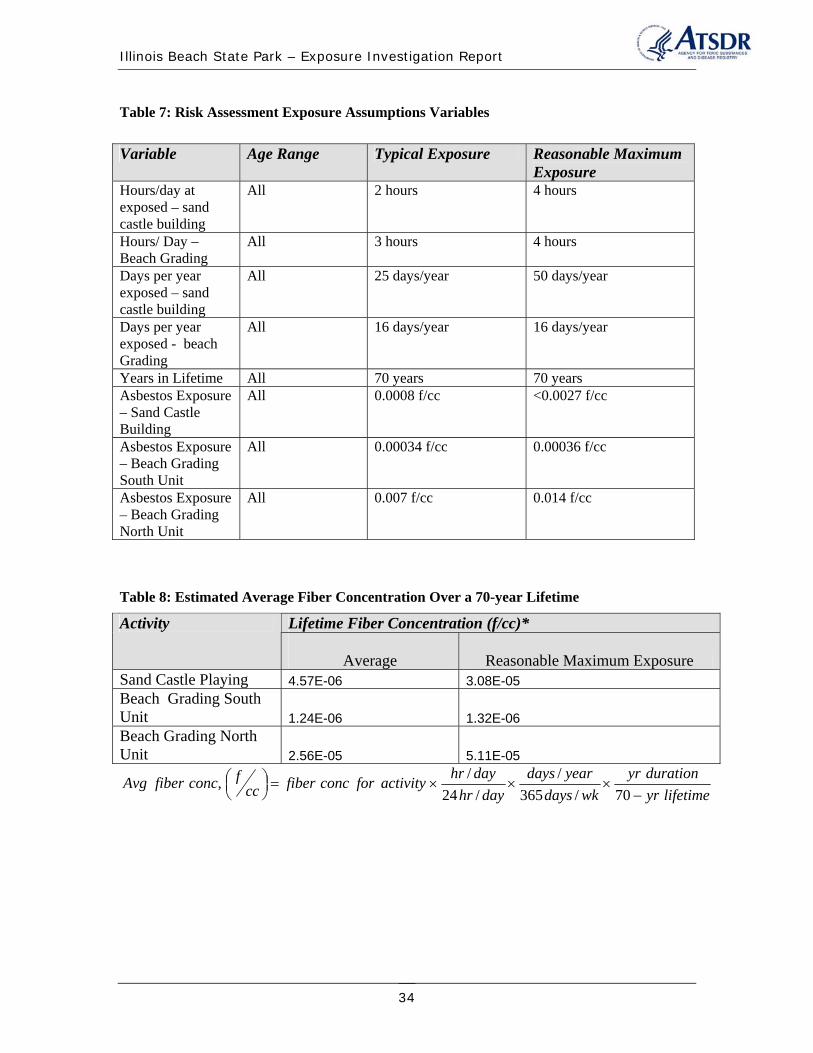
Illinois Beach State Park – Exposure Investigation Report
Table 7: Risk Assessment Exposure Assumptions Variables
Variable Age Range Typical Exposure Reasonable Maximum Exposure
Hours/day at exposed – sand castle building
All 2 hours 4 hours
Hours/ Day – Beach Grading
All 3 hours 4 hours
Days per year exposed – sand castle building
All 25 days/year 50 days/year
Days per year exposed - beach Grading
All 16 days/year 16 days/year
Years in Lifetime All 70 years 70 years Asbestos Exposure – Sand Castle Building
All 0.0008 f/cc <0.0027 f/cc
Asbestos Exposure – Beach Grading South Unit
All 0.00034 f/cc 0.00036 f/cc
Asbestos Exposure – Beach Grading North Unit
All 0.007 f/cc 0.014 f/cc
Table 8: Estimated Average Fiber Concentration Over a 70-year Lifetime
Activity Lifetime Fiber Concentration (f/cc)*
Average Reasonable Maximum Exposure Sand Castle Playing 4.57E-06 3.08E-05 Beach Grading South Unit 1.24E-06 1.32E-06 Beach Grading North Unit 2.56E-05 5.11E-05
hr / day days / year hr / day days / wk
yr durationfAvg fiber conc,⎛⎜⎝
⎞⎟⎠= fiber conc for activity × × ×cc 24 365 70−yr lifetime
34
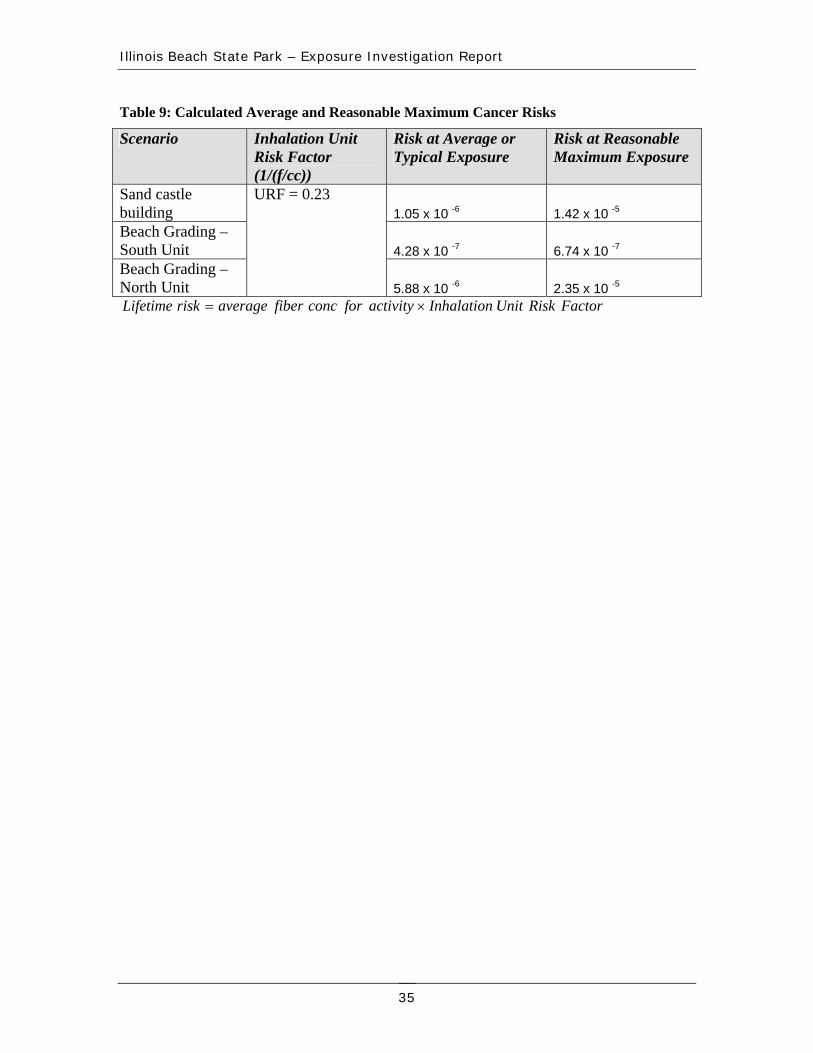
Illinois Beach State Park – Exposure Investigation Report
Table 9: Calculated Average and Reasonable Maximum Cancer Risks
Scenario Inhalation Unit Risk Factor (1/(f/cc))
Risk at Average or Typical Exposure
Risk at Reasonable Maximum Exposure
Sand castle building
URF = 0.23 1.05 x 10 -6 1.42 x 10 -5
Beach Grading – South Unit 4.28 x 10 -7 6.74 x 10 -7
Beach Grading – North Unit 5.88 x 10 -6 2.35 x 10 -5
Lifetime risk = average fiber conc for activity × Inhalation Unit Risk Factor
35

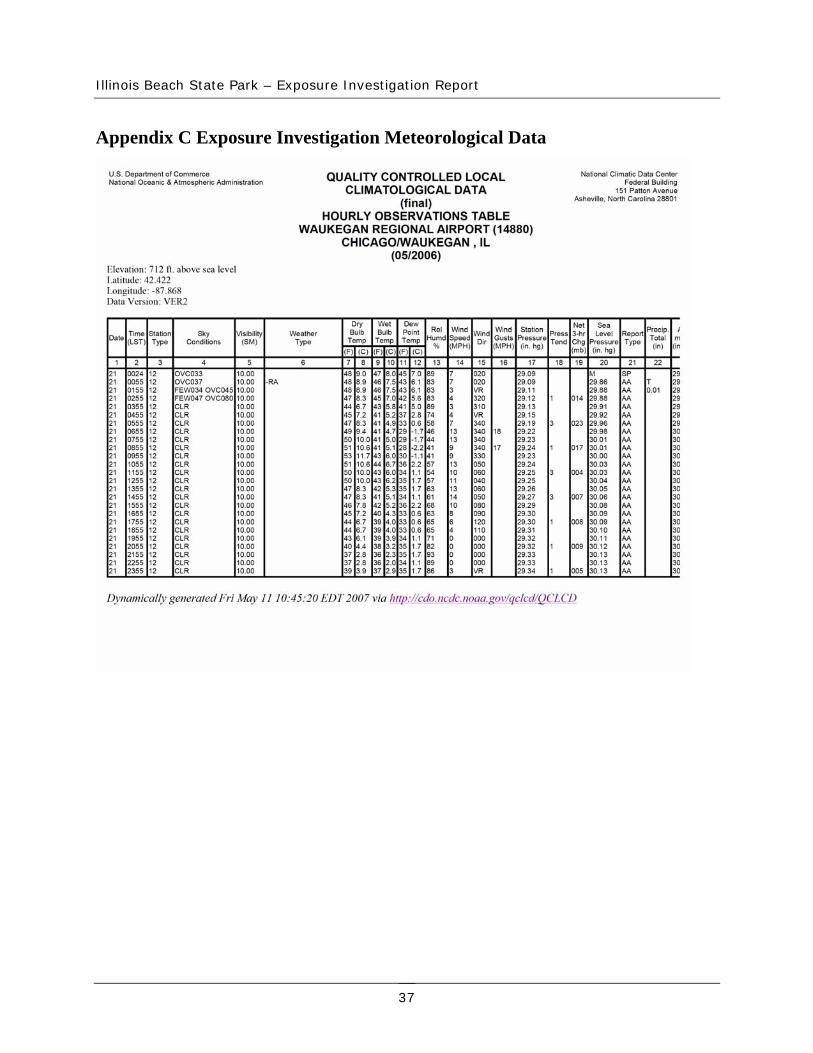
Illinois Beach State Park – Exposure Investigation Report
Appendix C Exposure Investigation Meteorological Data
37
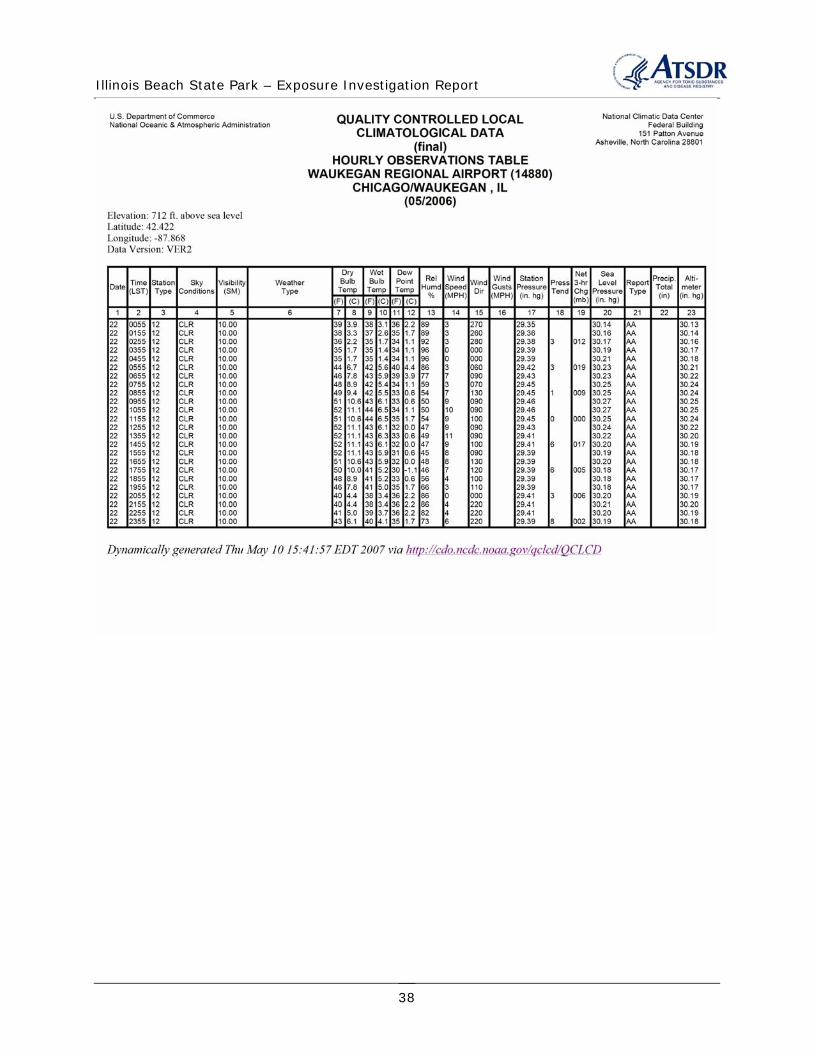
Illinois Beach State Park – Exposure Investigation Report
38
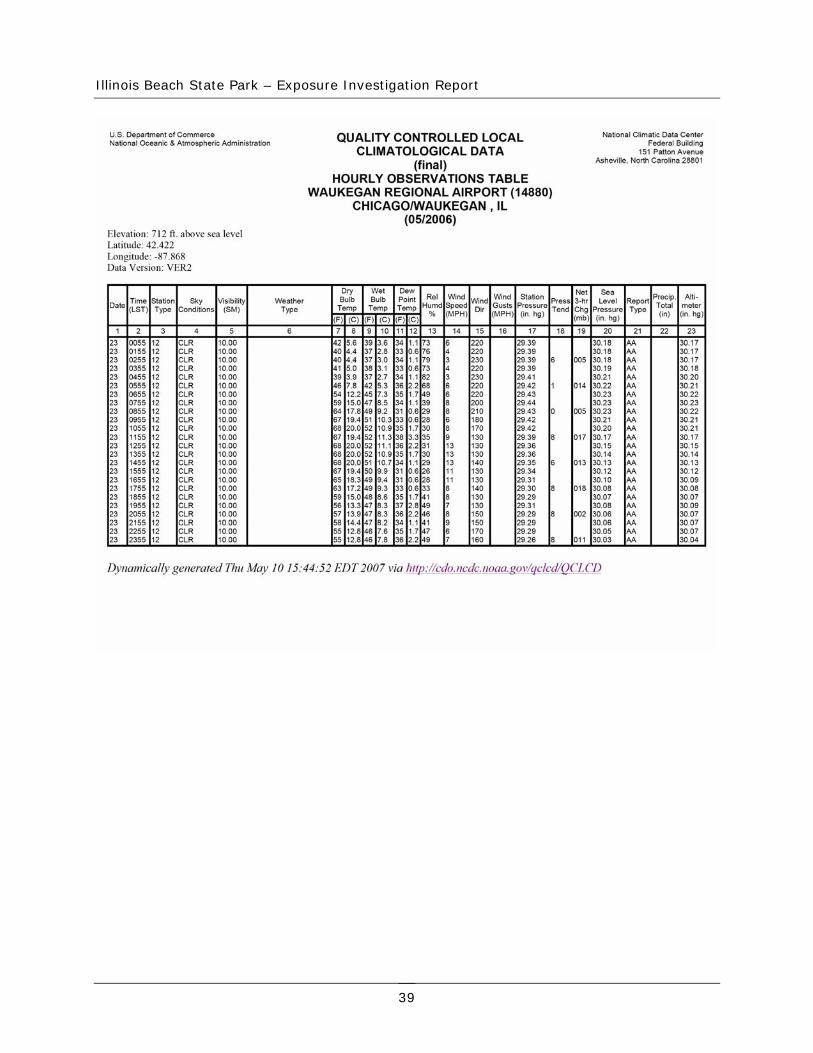
Illinois Beach State Park – Exposure Investigation Report
39

Illinois Beach State Park – Exposure Investigation Report
40
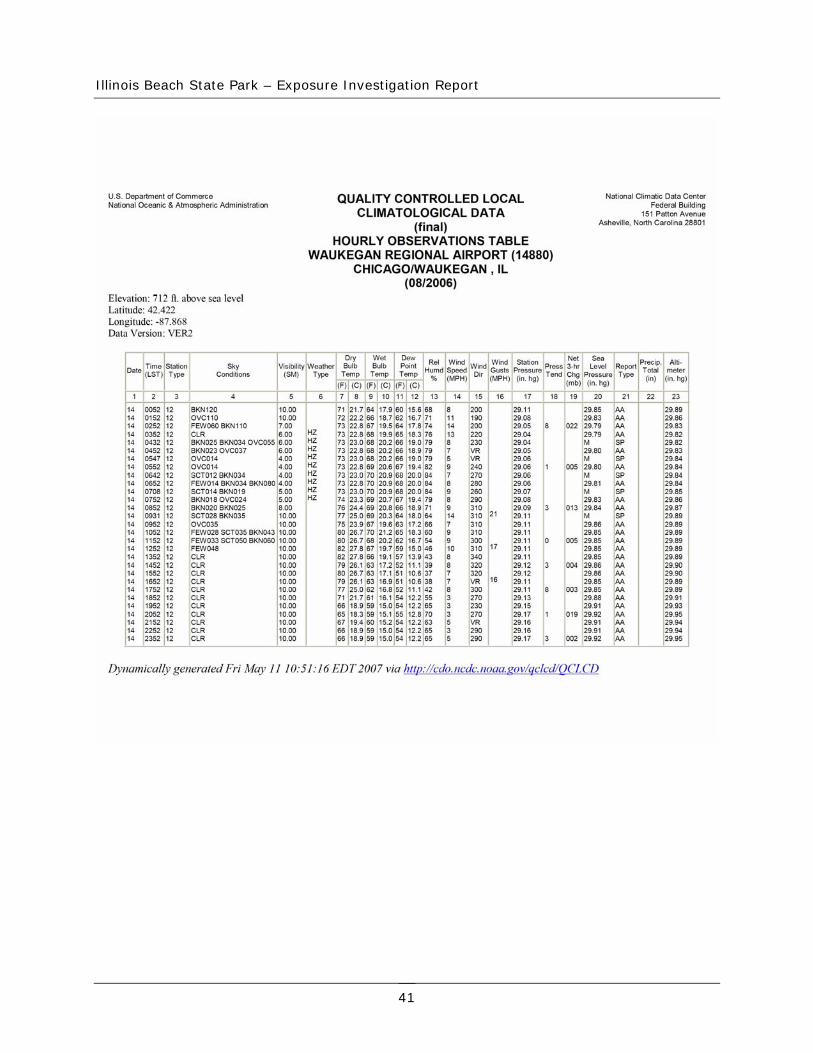
Illinois Beach State Park – Exposure Investigation Report
41
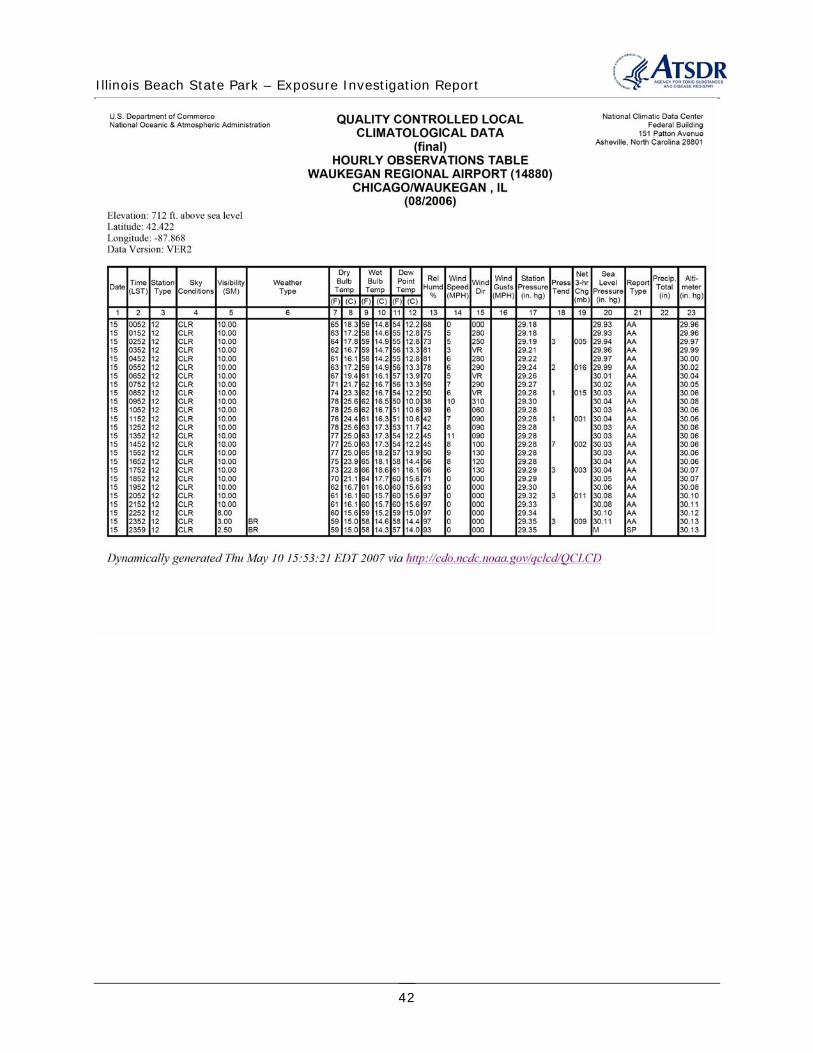
Illinois Beach State Park – Exposure Investigation Report
42

Illinois Beach State Park – Exposure Investigation Report
Appendix D PSI Sample Collection Details
May 22, 2006 Sampling
43
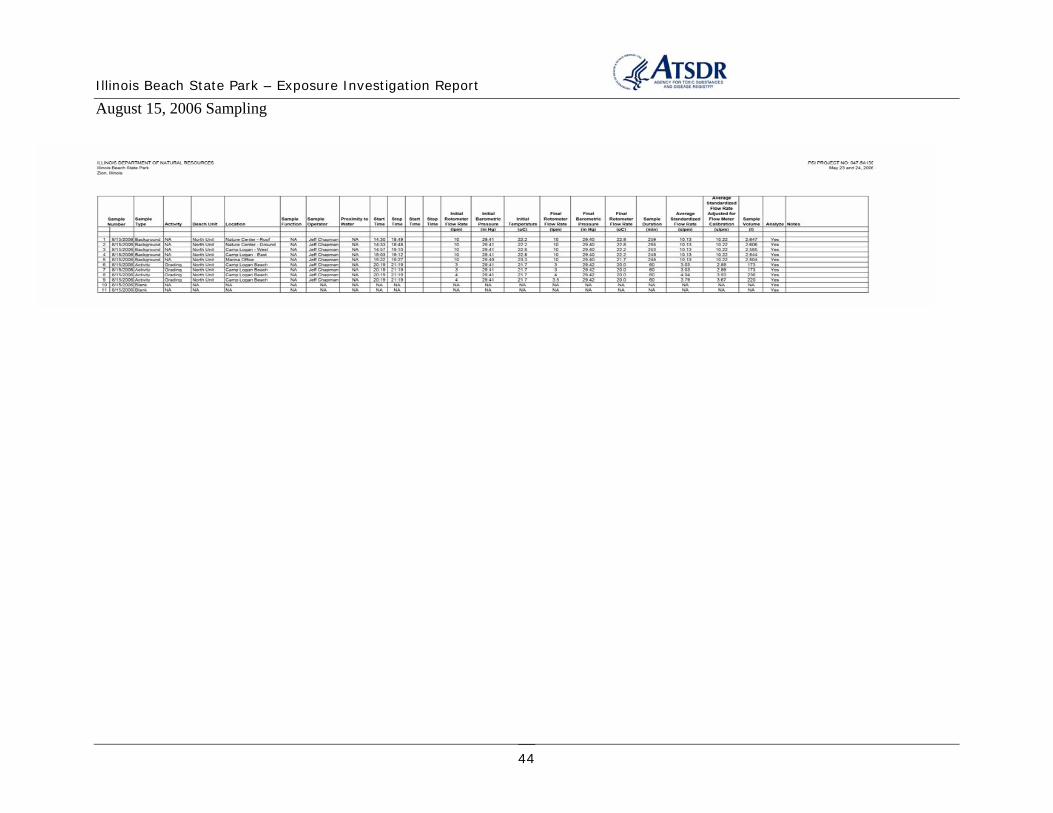
Illinois Beach State Park – Exposure Investigation Report
August 15, 2006 Sampling
44

Illinois Beach State Park – Exposure Investigation Report
Appendix E Exposure Investigation Protocol
Amended Exposure Investigation Protocol for Illinois Beach State Park
August 2006
A604
Prepared by
James Durant, ATSDR
45
Illinois Beach State Park – Exposure Investigation Report
Table of Contents
I. Project overview A. Summary B. Investigators and collaborators
II. Introduction A. Background B. Justification for the exposure investigation C. Objectives
III. Methods A. Exposure investigation design B. Exposure investigation population C. Data collection/sampling procedures D. Data analysis E. Records management F. Fieldwork coordination G. Quality assurance
IV. Community involvement V. Risk/Benefit information
VI. Informed consent procedures VII. Procedures for notifying participants of individual and overall results
VIII. Assurances of confidentiality IX. Estimated time frame X. Projected budget and source of funding
XI. References XII. Appendices
46

Illinois Beach State Park – Exposure Investigation Report
I. PROJECT OVERVIEW
A. Summary This Exposure Investigation will be conducted jointly with the Illinois Department of Natural Resources to examine plausible asbestos exposure to users of the Illinois Beach State Park (IBSP). Past studies of IBSP have found asbestos-containing material and asbestos fibers in beach sands, contributed by a variety of possible sources. This Exposure Investigation has been developed to address uncertainties regarding actual exposure levels to individuals who utilize the beach areas at IBSP. Historical sampling efforts include data collected in 1998 by the Illinois Department of Natural Resources that was evaluated in an ATSDR Public Health Assessment authored by the Illinois Dept. of Public Health (IDPH) [1]. More recently, the University of Illinois-Chicago (UIC) School of Public Health conducted beach sampling and risk assessment at IBSP. In a review of the draft UIC report, ATSDR recommended that activity-based exposure sampling be performed at the beach to more directly evaluate the levels of asbestos exposure for recreational users at IBSP. The EI is being conducted as a collaboration between ATSDR and Illinois Department of Natural Resources to evaluate that exposure.
An initial Exposure Investigation protocol was approved in May, 2006. Initial sampling was conducted on May 26, 2006. Sampling was stopped because of rain on May 27, 2006, which violated protocol. Samples were analyzed at MVA, Inc. laboratory in Duluth, GA (Table 1).
Table 1, EI Results, May 2006 Sample ID Activity Type Air Volume (l) Asbestos
Concentration (s/cc, PCMe)*
Other Amphiboles
01 522306-TL Blank 0 NAD†
02 523806-TL Blank 0 NAD†
03 523806-TL Sand Castle 2,411 NAD† (AS =0.0005) 04 523806-TL Construction 2,411 NAD† (AS =0.0005) OA‡ 1 structure 05 523806-TL 2,411 NAD† (AS =0.0005) 06 523806-TL 2,411 NAD† (AS =0.0005) 07 523806-TL 2,418 NAD† (AS =0.0005) 08 523806-TL 2,418 NAD† (AS =0.0005) 09 523806-TL 2,216 NAD† (AS =0.0005) 10 523806-TL 2,418 NAD† (AS =0.0005) D01 523806-TL Beach Grading 332 <0.003 Trem/Act§ OA‡ 7 structures D02 523806-TL 332 <0.002 Trem/Act§ OA‡ 6 structures B1-52306-GS Background 2,935 NAD† (AS =0.0004) B3-52306-GS 2,903 NAD† (AS =0.0004) OA‡ 1 structure *s/cc, PCMe= structure/cc, PCMe = Phase Contrast Microscopy Equivalent structures.
†NAD = No asbestos detected (chrysotile, amosite, crocidolite, anthophyllite, tremolite, actinolite). (AS= Analytical Sensitivity)
‡OA = Other Amphibole present in sample Other than amosite, crocidolite anthophyllite, tremolite, actinolite based on comparison with NIST standard spectra
§According to ISO 10312, when 1 to 3 structures are counted, the result shall be reported as less than the corresponding one-sided upper 95% confidence limit for the Poisson distribution (1 structure – 4.74 times the analytical sensitivity, 2 structures – 6.30 times the analytical sensitivity).
47
Illinois Beach State Park – Exposure Investigation Report
Based on the analytic results and field experiences of this sampling event, the Exposure Investigation protocol was modified for the remaining samples in the following manner (sampling planned for August, 2006):
1. Elimination of sports activity scenario because sand castle building scenario results did not detect airborne asbestos above background. Additionally, higher volume personal sampling pumps that were proposed in the original protocol failed to obtain the required 10 liters per minute (lpm) flow rate required to collect the 2,400 liter air sample. Use of stationary sampling pumps is not feasible for this activity.
2. Because of the failure of the battery powered high volume personal samplers to obtain the required flow rate, standard personal sampling pumps will be used at 4 lpm to collect approximately 350 liters of air during the beach grading activity scenario. To obtain the analytical sensitivity of 0.0005 structures per cubic centimeter (s/cc), the laboratory will count 7 times the number of grid openings as previously proposed.
3. Because of the failure of the battery powered high volume personal samplers in the field, AC powered sampling pumps will be used to collect background samples.
4. Eliminate performing sand castle building at a third beach area because results are likely to be non-detect because previous sampling did not detect asbestos above background.
B. Investigators and Roles
Agency for Toxic Substances and Disease Registry
Division of Health Assessment and Consultation (EICB) and Division of Regional Operations (DRO) – Region V
• EICB and DRO will assist in development of activity based sampling protocol.
• EICB will fund the ISO-10312 asbestos analysis.
• EICB will fund analytical costs for up to approximately $26,400 in FY 2006. Payment of the laboratory will be arranged through EICB’s mission support contractor or through inter-agency agreement with Federal Occupational Health.
• EICB will assist Illinois by providing our interpretation of the public health significance of the sampling results.
• DRO will assist in obtaining analysis of composite sand samples for moisture by the EPA Region V Labs.
48

Illinois Beach State Park – Exposure Investigation Report
Primary Contact Persons: James Durant, John Wheeler, Mark Johnson.
Illinois Department of Natural Resources
• Collection of activity based samples at Illinois Beach State Park
• Fieldwork coordination and direction of contractors retained by Illinois
Primary Contact Person: Patrick Giordano
Illinois Department of Public Health
• Provides technical input in exposure investigation protocol
• Assists with interpretation of results and long term environmental public health support for IBSP
II. INTRODUCTION A. Background
Illinois Beach State Park consists of 6.5 miles of Lake Michigan shoreline in the city of Zion, Lake County, Illinois. It is bordered by the Wisconsin state line to the north, Lake Michigan to the east, the town of Zion to the west, and the Johns-Manville National Priorities List (NPL) hazardous waste site to the south [1]. The Park encompasses 4,160 acres of shoreline and received approximately 2.75 million visitors in 1998 [1]. Recreational activities available include camping, swimming, fishing, hiking, bicycling, and picnicking [1]. Structures within the Park boundaries include the North Point Marina, a 244-unit campground, two major public swimming areas, several inland fishing ponds, a visitor center, the Commonwealth Edison Power Plant, and the Illinois Beach Resort and Conference Center [1]. Besides seasonal tourism, the Park holds special events that draw visitors, including the In-Campground Camper Show in May and the National Jet Ski Championships in July [1]. A map of the Park is shown in Figure 1, Appendix A.
The Park is considered a natural resource with the only remaining Lake Michigan beach ridge shoreline left in the state [1]. Glacial advance and retreat created the area that left dunes, swales, marshes, and a variety of wildlife and vegetation in the area [1]. Before becoming a state park, the area was used for military training [1]. In 1948, the state of Illinois acquired the first parcels of what is now Illinois Beach State Park [1].
In late 1997, pieces of transite pipe, siding, and roofing materials suspected of containing asbestos were found scattered along the beach [1]. In February 1998, Illinois Department of Natural Resources collected two bulk samples of the material and found they contained asbestos
49

Illinois Beach State Park – Exposure Investigation Report
fibers. Following this discovery, Illinois Department of Natural Resources began an investigation to determine the extent and possible source of asbestos contamination. Potential sources include:
• Former beachfront homes that have since washed into Lake Michigan. Much of the material found at the Park is common construction material used in the past. According to historical maps, the present lakeshore contained about 232 homes that wave action destroyed and washed into the lake. Recent excavations also uncovered an old transite sewer line near the lodge.
• The Johns-Manville site immediately south of the Park. This plant manufactured a variety of roofing, flooring, wall covering, and insulating materials from1922 - 1988. The raw materials used at Johns-Manville include Portland cement, asphalt, paper, and asbestos. A 150-acre parcel of the property was used for disposal of asbestos containing material (ACM) and was placed on the NPL in 1983 [2].
• Several sources of nourishment sand have been used at the beach. Currently, IBSP requires 80,000 – 100,000 cubic yards of sand per year to prevent erosion, particularly to the North Unit beaches [1]. The tests for asbestos in the wide variety of past and potential sources of nourishment sand for IBSP has previously been reviewed [1]. In general, some of these sand sources have been visually inspected for asbestos containing materials or tested for asbestos using either polarized light microscopy or with transmission electron microscopy [1]. Asbestos was detected in some of these samples at generally low levels.
• A former rifle range in the Camp Logan area. The rifle range was built for the 1959 Pan American games and contained a large berm built with factory waste material donated by Johns-Manville. Wave action may have destroyed this berm that also potentially contained ACM.
B. Justification for the exposure investigation In May 2000, IDPH under cooperative agreement with ATSDR, published a PHA for this site, and found that the site posed no apparent public health hazard, because air sampling data did not detect asbestos [1]. This PHA is available online at: http://www.atsdr.cdc.gov/HAC/PHA/illinoisbeach/ibp_toc.html.
In June of 2005, ATSDR was asked by the Great Lakes Center for Excellence in Environmental Health at the University of Illinois-Chicago (UIC) School of Public Health to comment on their draft report, Illinois State Beach Park (IBSP): Determination of Asbestos Contamination in Beach Nourishment Sand, Interim Report [3]. The UIC study evaluated the levels of asbestos in various beach areas at IBSP, comparing the results to other beaches on the southwestern shoreline of Lake Michigan. Sample preparation and analysis was performed using the Superfund Method for the Determination of Releasable Asbestos in Soils and Bulk Materials (EPA 540-R-97-028, 1997) as modified by Draft Elutriator Method for the Determination of Asbestos in Soils and Bulk Material [4,5]. This method analyzes the abundance of asbestos structures per gram of PM10 in the sample material. Results of this study found statistically elevated levels of asbestos structures releasable from the sand in IBSP North unit sand relative to other background beaches. However, the estimated levels of asbestos exposure were significantly below the risk levels used by EPA as a threshold for taking action.
50

Illinois Beach State Park – Exposure Investigation Report
Overall, ATSDR scientists agreed with the conclusions of the risk assessment that asbestos in the beach did not appear to represent a public health hazard. However, ATSDR reviewers felt that there were some uncertainties in the exposure assessment, and recommended activity-based sampling to more directly evaluate the levels of asbestos exposure for people using the beach.
Illinois Department of Natural Resources has requested the support of ATSDR in planning for an activity-based sampling effort at the IBSP. This assessment represents an opportunity for ATSDR to work collaboratively with the State of Illinois, Illinois Department of Natural Resources and the Illinois Department of Public Health to help address the issues raised by ATSDR review of the UIC report.
C. Objectives The intent of this Exposure Investigation is to more directly estimate the levels of exposure and health implications of that exposure for recreational users of the beach facilities. The sampling will consist of activities with varying potential for exposure to asbestos fibers that may be present in the sand.
D. Previous Sampling Results
Contractors for DNR collected air sampling of sand castle building
III. METHODS A. Exposure investigation design The purpose of this type of monitoring is intended to identify a potential for exposure during specific-case scenarios to airborne asbestos fibers at the Illinois Beach State Park. This will be accomplished by collecting personal air samples of persons mimicking activities that normally occur at the beach. The specific-case scenarios for exposure are selected to involve activities that would generate a varying degree of potential exposure due to the typical level of disturbance of the sand and the proximity to the source of sand. The specific-case scenarios planned are shown on Table 2, below. Additionally, the samples will be collected during periods when the park is closed (after 8 PM). IDNR Police will provide security to ensure that unauthorized persons will not be on the beach during testing.
Table 2, Specific Case Scenarios Case Scenario Example Activities Number of
samples planned per area
Sand Castle Building (North Beach and South Beach)
Construction of sandcastle, digging in sand. 4
Beach Maintenance
Dragging of grading over beach 2
51
Illinois Beach State Park – Exposure Investigation Report
Additionally, 5 ambient air samples will be collected on the beach to determine what typical background levels will be at the beach. The cassettes will be at approximately 4 feet in height for these samples. Sample pumps for these samples will be collected with similar flow rate and duration as the case specific scenarios. These samples will be located in areas that will not be influenced by the activities being monitored.
Presumed asbestos contaminated debris is picked up on the beach by a contractor on a routine basis, and their locations fixed using a global positioning system (GPS). ATSDR plotted these locations from 2005 and examined the data using two different cluster analysis techniques, Nearest Neighbor Analysis and Local Moran’s I test. Nearest Neighbor Analysis examines the spacing of individual points across space. This test compares the observed mean distances between neighboring points with the expected mean distances based on a theoretical random pattern. As such, if the observed mean distance is greater than that of the random pattern mean distance, then the observed point pattern is considered more dispersed than the random point pattern. Conversely, if the observed mean distance is less than that of the random pattern mean distance, then the observed point pattern is considered more clustered than the random point pattern. The result of the test is a z-score, which can be compared to the standard normal distribution to determine the significance of the test. At a confidence level of 95%, a z-score would have to be less than –1.96 or greater than 1.96 to be statistically significant. A negative z-score indicates clustering while a positive z-score indicates dispersion. In this analysis, the high positive z-score of 8.9 indicates that a high degree of dispersion. Local Moran's I is a translation of a non-spatial correlation measure to a spatial context. It examines for clusters of points by identifying samples surrounded by similar samples. The cluster analysis output is an index value and a z-score for each sample. A significant positive z-score indicates the clustering of similar points near a sample. In the analysis of IBSP debris, no samples with a significant positive z-score where found, indicating no clustering near any sample. The UIC study examined aerosilizable asbestos content in IBSP sands. Therefore, sampling locations will be selected in areas where the UIC study detected aerosilizable asbestos.
Activity descriptions: Available analysis indicate that while exposure to asbestos is possible in these activities, it is likely that even under worst case situations to be well below 1 in 1,000,000 lifetime risk range [1].
Should a relief participant be needed, the participant will stop the activity, remove the sampling equipment, and pass it to the relief participant. The original participant will assist the relief participant with donning and adjusting the backpack or belt. The exchange is anticipated to take less than 60 seconds, therefore the sampling pumps and event time clock will not be halted during the exchange. If the exchange requires more than 60 seconds, the pump and event clock will be stopped until activity is re-initiated.
1) Sandcastle building and/or digging in the sand will be performed to mimic what a child might be exposed to while playing in the sand. Five sampling locations will be selected for each 100 ft2
study area (10’ x 10’). Generally, it is expected that sand castle construction will occur near the surfline. Therefore, two locations will be selected randomly within 10 feet of the surfline. Three
52
Illinois Beach State Park – Exposure Investigation Report
locations will selected randomly in dryer sand away from the surf to evaluate the impact of distance from the water on fiber release. Study subjects will use typical beach sized tools and pails to disturb the sand by digging and piling the sand within the area.
The sampling period will be divided into equal sub-periods to facilitate having the participant face each compass direction for an equal amount of time during the activity. This approach is designed to mitigate the effect of wind direction on potential exposure. Random head and body movement during the activity should further mitigate the impact of wind direction on exposure. Ideally, the participants will face each compass direction at least twice during the sampling event. For example, during the four - hour or 240 -minute event, the participant might face North for 15 minutes, rotate to the East for 15 minutes, then South for 15 minutes, then West for 15 minutes and return to the North to repeat the cycle. The participant has the option of stopping for water or rest, as needed. Rest periods longer than 1 minute will be noted.
The event participant will be fitted with a personal sampling pump; the inlet to the filter will be at a height of approximately 1 to 3 feet above the ground to simulate a child’s breathing zone. The actual pump unit will be placed near the participant and a long hose used to connect the pump to the sample filter. In this activity or simulation a participant should sit on the ground while digging or scraping the top 2 to 6 inches of surface soil, placing it in a small bucket or pail and dumping it back on the ground. The activity will be paced such that soil will be placed in the bucket and dumped approximately every 2-5 minutes, regardless of the amount of material in the bucket. The bucket should be emptied rapidly from a height of approximately 12 inches.
2) Beach maintenance. According to Illinois Department of Natural Resources officials, employees may engage in beach maintenance activities that involve using a grader. These activities will be monitored to simulate what bystanders could be potentially exposed to. For this monitoring, sampling pumps will be used to collect air samples on the grader, with samplers located at approximately four feet in height. Four duplicate samples will be collected simultaneously. Two samplers will be collected at 3 liters per minute (lpm), and 2 will be collected at 4 lpm. The laboratory will be instructed to analyze the 4 lpm. The 3 lpm samples will be archived and saved in case the 4 lpm samples are overloaded.
Study areas: 1) Center Area (Illinois Beach Resort and Conference Center, Park Office and Camp Store). According to officials, this is the area that is frequented by the majority of persons who use the park for the activities simulated in this exposure investigation. Locations of the specific case scenario activities will be selected randomly, since no statistical pattern of debris found on the beaches (Figure 2). Aerosolized asbestos was detected in only 1 out 12 elutriator samples from the UIC report [1].
2) North Point Marina Beach. This beach is located south of the North Point Marina. According to officials, this area also is frequently used for recreational activities. UIC did not sample this beach, however, bottom sands from the North Point Marina were sampled [1]. Aerosolized asbestos was detected in UIC elutriator samples of lake bottom sands of the North Point Marina 9 of 12 times [1]. This sand is dredged and fed through a slurry pipe into shallow water south of
53
Illinois Beach State Park – Exposure Investigation Report
the marina [1]. Littoral transport moves this sand southward along the state park shore [1]. Locations of activities will be selected randomly at this beach.
3) North Unit Beaches. Aerosolized asbestos was found in 7 of 12 elutriator samples in the UIC report [1]. However, these beaches are more rocky and narrow as compared to the Center Area Beach [1]. However, some recreational activity does occur in these areas (see Figure 1). Selection of locations for the case specific scenarios will be based on the UIC data or randomly selected on beaches potentially usable for sand castle building or sports activities.
B. Exposure investigation population The study will not be collecting samples on exposed populations. Only licensed contractors or employees working for the state of Illinois will be utilized to collect activity-based samples. They will be replicating many activities that will normally occur by beach-goers at Illinois Beach State Park.
C. Data collection/sampling procedures Sampling procedures are outlined in the attached Project Execution Manual. This manual is attached in Appendix B.
The specific case scenarios are planned to last a minimum of 4 hours each. Locations of the activities will be referenced using a GPS. Wind speed and direction will be noted from the National Climate Data Center meteorological station at Waukegan/Chicago regional airport (WBAN #14880). ATSDR will provide an on site meteorological station. To minimize the effects of increased humidity or soil moisture content, all activities will be conducted at least 24 hours after a measurable rain event.
All sampling for airborne asbestos fibers will be performed by PSI technicians licensed as Air Sampling Professionals (ASP) with the Illinois Department of Public Health. The ASP will also act as a person monitored. The monitored personnel will engage in activities consistent with normal and typical use of the beach facilities, as outlined in Table 1.
D. Data Analysis Analysis of filters will use the ISO 10312 method. ISO 10312 methodology uses transmission electron microscopy (TEM). ISO 10312 provides the most complete information on types and sizes of asbestos structures than any other TEM method [6]. A analytic sensitivity of 0.0005 asbestos structures/cc was selected by ATSDR for the purposes of this study. The definition of an asbestos structure is the Phase Contrast Microscopy- Equivalent (PCMe), which is a fiber > 5 microns in length, >0.25 microns in width, with an aspect ratio of 3:1. The cassettes will be archived for 6 months to allow for future additional analysis, if needed.
Because of the uncertainties of using soil data to estimate health hazards from inhalation of asbestos fibers, this protocol focuses on the collection of appropriate air data through activity-based sampling. Air results will be examined with risk-models to determine the cancer risk associated with the asbestos air level. The appropriate risk model used will be determined by the
54
Illinois Beach State Park – Exposure Investigation Report
mineralogy and length of the asbestos structures detected in the samples. Possible models include the EPA IRIS model, and the Berman-Crump (B-C) protocol model.
Composite sand samples (0-3” in depth) will be obtained and analyzed for moisture content. Arrangement for this will be made by ATSDR-DRO.
E. Records management The contractor will provide Illinois Department of Natural Resources with a summary report, which will include a description of sample activities documentation. Data will be provided in a matrix format indicating the sample information for each sampling event. Field data sheets, calibration logs, chains-of custody will also be provided. ATSDR will be providing Illinois Department of Natural Resources with analytical results. Additionally, ATSDR will provide an Exposure Investigation Report. This report will summarize the overall sampling activity, results and the public health interpretation of the results.
F. Fieldwork Coordination Sampling activities will be coordinated by Illinois Department of Natural Resources. The protocol used is attached is Appendix B. ATSDR will also be present to collect the sample cassettes, and ship them to the designated laboratory.
G. Quality assurance While this protocol only calls for a limited number of samples to be collected, the samples represent activities that have the potential to release any asbestos fibers in the sand. These data, combined with previous work at IBSP, will allow ATSDR to make a professional judgment on the public health significance of asbestos contamination at IBSP. ATSDR will delegate an ABIH Certified Industrial Hygienist (CIH) or other person qualified to observe the monitoring to ensure that monitoring protocol is executed. To ensure that potential asbestos releases from the sand is not reduced by soil moisture, samples will not be collected unless there is at least a 24 hour period without a measurable rain at the sampling site, as gauged by the Waukegan/Chicago regional airport.
Laboratory analysis will be arranged with a laboratory NVLAB certified or equivalent and proficient in ISO 10312 methodology.
55
Illinois Beach State Park – Exposure Investigation Report
IV. COMMUNITY INVOLVEMENT Communications about this Exposure Investigation will be coordinated between ATSDR’s Exposure Investigation Team, Illinois Department of Natural Resources, IDPH, ATSDR Division of Regional Operations - Chicago, and US EPA Region 5.
V. RISK/BENEFIT INFORMATION The benefit of doing this sampling is that it will provide Illinois and ATSDR the ability to address this existing exposure uncertainty and provide a more accurate interpretation of the public health significance of asbestos contamination at Illinois Beach State Park.
VI. INFORMED CONSENT PROCEDURES No informed consent procedures are planned for this exposure investigation. The purpose of the exposure investigation is to collect environmental samples while contractors and employees of Illinois perform routine activities that are carried out by the visitors of IBSP on a daily basis.
VII. PROCEDURES FOR NOTIFYING PARTICIPANTS OF INDIVIDUAL AND OVERALL RESULTS The community will be notified through ATSDR regional office, press release, and release of an Exposure Investigation Report.
VIII. ASSURANCES OF CONFIDENTIALITY No Medical data will be collected because samples are strictly environmental.
VIII. ESTIMATED TIME FRAME May, August 2006 Collect samples June, September 2006 Analysis of samples September-November 2006 Preparation and clearance of reports November-December 2006 Release of reports
IX. PROJECTED BUDGET AND SOURCE OF FUNDING ATSDR’s cost is only for laboratory sample analysis. Estimated cost is for approximately 50 samples and 10 blanks at $400 / sample or $24,000. The analysis of the four bulk samples of sand by PLM and TEM will be $600 / samples or $2,400. The funds will be allocated from the EI section, EICB, ATSDR.
56
Illinois Beach State Park – Exposure Investigation Report
X. REFERENCES
1. Illinois Department of Public Health, under cooperative agreement with Agency for Toxic Substances and Disease Registry. Public Health Assessment for Illinois Beach State Park, CERCLIS No. ILD984840140. Atlanta: US Department of Health and Human Services; June 16, 2000.
2. U.S. Environmental Protection Agency. Second Five Year Review Report for Johns-Manville Site, Waukegan, Lake County, Illinois. Chicago: U.S. Environmental Protection Agency Region 5; May 2003.
3. University of Illinois at Chicago. Illinois Beach State Park (IBSP): Determination of Asbestos Contamination in Beach Nourishment Sand, Interim Report of Findings, June 6, 2005.
4. U.S. Environmental Protection Agency. Superfund Method for the Determination of Releasable Asbestos in Soils and Bulk Materials. EPA 540-R-97-028. Washington D.C. ;1997
5. Berman DW and Kolk A. Draft Modified Elutriator Method for the Determination of Asbestos in Soils and Bulk Material. Albany, CA: Aeolus, Inc.; May 23, 2000.
6. Millette, JR, Boltin R, Bandli. Notes on the Fundamentals of Asbestos Analysis by Light and Electron Microscopy. Norcross, GA: MVA Inc., 2003, August.
57

Illinois Beach State Park – Exposure Investigation Report
XI. APPENDICES Appendix A - Figures
Figure 1, Illinois Beach State Park Map (from http://dnr.state.il.us/lands/Landmgt/PDF%27s/illinoisbeach.pdf)
58

Illinois Beach State Park – Exposure Investigation Report
Figure 2, Cluster Analysis of Debris at IBSP
59

Illinois Beach State Park – Exposure Investigation Report
Appendix B, PSI Sampling Protocol
ACTIVITY BASED ASBESTOS AIR MONITORING AIR SAMPLING PROCEEDURES
Professional Service Industries, Inc. (PSI) has been retained by the Illinois Department of Natural Resources under PSI Proposal No. 047-5A0106 Rev 5, dated April 28, 2006, to provide air monitoring for asbestos fibers in support of the “Exposure Investigation Protocol for Illinois Beach State Park”, dated April 2006 as prepared by the Agency for Toxic Substances and Disease Registry (ATSDR).
Provided below is a summary of sampling procedures to be performed by PSI.
1. Sample Procedure
All sampling for airborne asbestos will be performed by PSI technicians licensed as Air Sampling Professionals (ASP) with the Illinois Department of Public Health (IDPH). The ASP will engage in activities, while being monitored, as prescribed by ATSDR. These activities may include walking along the beach, reading in the sand, digging in the sand, visiting concession stands, playing catch, etc. The locations for performance of beach activities and monitoring will be selected by ATSDR.
Each sample cassette will be placed in the approximate breathing zone of the person monitored. Each sample collected will be operated for approximately four (4) hours at approximately (10) liters per minute in order to achieve an approximate sample volume of 2,400 liters.
The ASP will document the GPS location where sampling is performed, the nature of each activity and the time duration each activity is performed. PSI understands that weather information will be obtained from Waukegan Airport.
2. Sample Equipment
Sampling will be performed using personal sampling pumps and a 0.8 μm Mixed Cellulose Ester (MCE) filter cassette. Sampling will be performed using an SKC Leland Legacy personal sample pump, or equivalent.
3. Equipment Calibration
The sample equipment will be calibrated in the field prior to and at the conclusion of each test event. Calibration will be performed using a field rotometer. The rotometer will be calibrated in the laboratory against a primary standard prior to and at the conclusion of the project.
60
Illinois Beach State Park – Exposure Investigation Report
Calibration of equipment and calculation of sample volumes and flow rates will consider initial and final temperature and barometric pressure both in the field and laboratory. Sample calculations are provided below for reference.
61
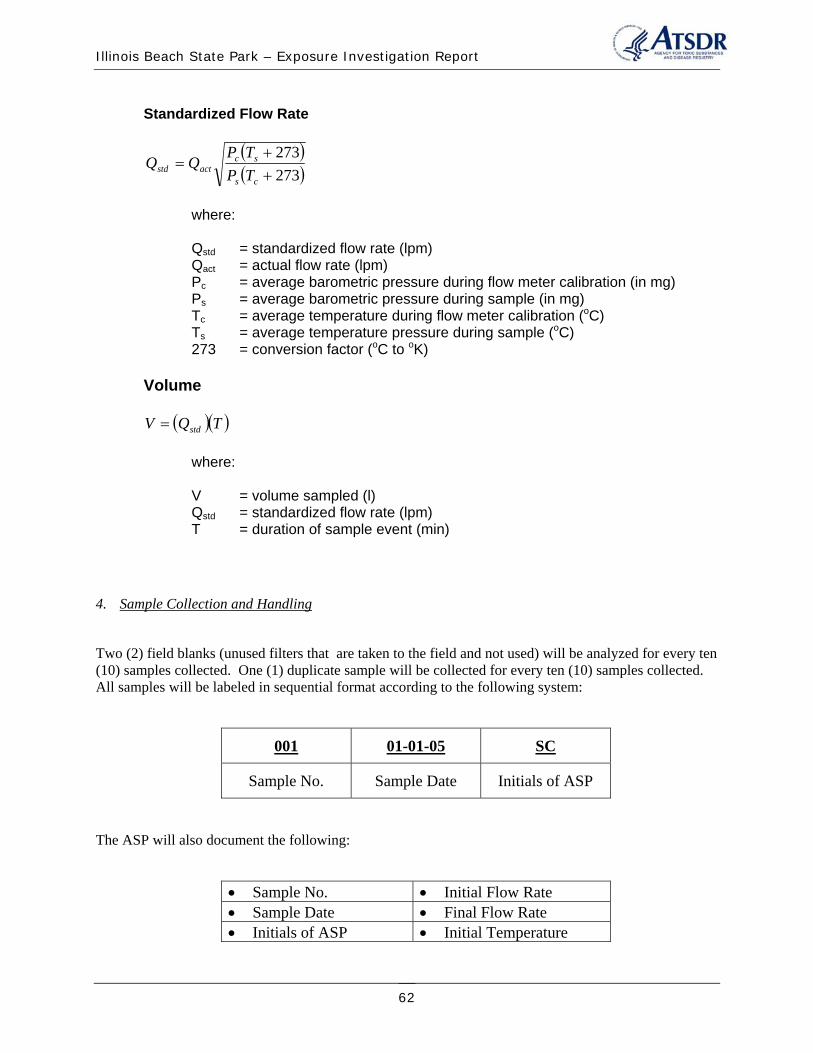
Illinois Beach State Park – Exposure Investigation Report
Standardized Flow Rate
P (T + 273)c sQstd = Qact P (T + 273)s c
where:
Qstd = standardized flow rate (lpm) Qact = actual flow rate (lpm) Pc = average barometric pressure during flow meter calibration (in mg) Ps = average barometric pressure during sample (in mg) Tc = average temperature during flow meter calibration (oC) Ts = average temperature pressure during sample (oC) 273 = conversion factor (oC to oK)
Volume
= (Qstd )( )V T
where:
V = volume sampled (l) Qstd = standardized flow rate (lpm) T = duration of sample event (min)
4. Sample Collection and Handling
Two (2) field blanks (unused filters that are taken to the field and not used) will be analyzed for every ten (10) samples collected. One (1) duplicate sample will be collected for every ten (10) samples collected. All samples will be labeled in sequential format according to the following system:
001 01-01-05 SC
Sample No. Sample Date Initials of ASP
The ASP will also document the following:
• Sample No. • Initial Flow Rate • Sample Date • Final Flow Rate • Initials of ASP • Initial Temperature
62
Illinois Beach State Park – Exposure Investigation Report
• Start Time • Final Temperature • Stop Time • Initial
Pressure Barometric
• Initial Flow Rate • Final Pressure
Barometric
All samples will be shipped under chains-of-custody to ATSDR. The chains-of-custody shall include the above information, along with requested turn-around-time for sample analysis, the requested analysis, contact information and signature of the ASP.
5. Reporting
PSI will provide three (3) copies of a summary report including a description of sample activities documentation. Data will be provided in a matrix format indicating the sample information for each sampling event. Field data sheets, calibration logs and chains-of custody will also be provided.
PSI understands that analytical results will be presented separately to the Illinois Department of Natural Resources by ATSDR, and therefore will not be included in the report generated by PSI. The report will not provide conclusions or risk calculations based on sample results.
6. Safety
Each individual participating in the project shall be informed of the nature of the project and its purpose as well as the nature of asbestos and the hazards associated with exposure. Results will be available for individuals participating in the study as they become available.
During the summer of 2005, PSI performed seventeen (17) separate beach investigations under PSI Project No. 047-5A086. The beach investigations included visual observation for bulk material suspected of containing asbestos. PSI personnel were monitored using personal sampling equipment during each investigation. Each sample analyzed indicated an airborne fiber count that was <0.01 f/cc.
Based on this data, it is not anticipated that the exposure level shall exceed the OSHA permissible exposure limit of 0.1 f/cc. Therefore, personal protective equipment for airborne asbestos fibers shall not be required. However, the PSI individuals participating in the project shall be informed of the concerns regarding asbestos, be appropriately trained according to Illinois Department of Public Health regulations. If the PSI individuals participating in the project request PPE, it will be provided.
Illinois Department of Natural Resources is responsible for the training, equipment and safety of its own employees.
63

Illinois Beach State Park – Exposure Investigation Report
64
Illinois Beach State Park – Exposure Investigation Report
Appendix F: ATSDR Responses to EPA TRW Comments.
65
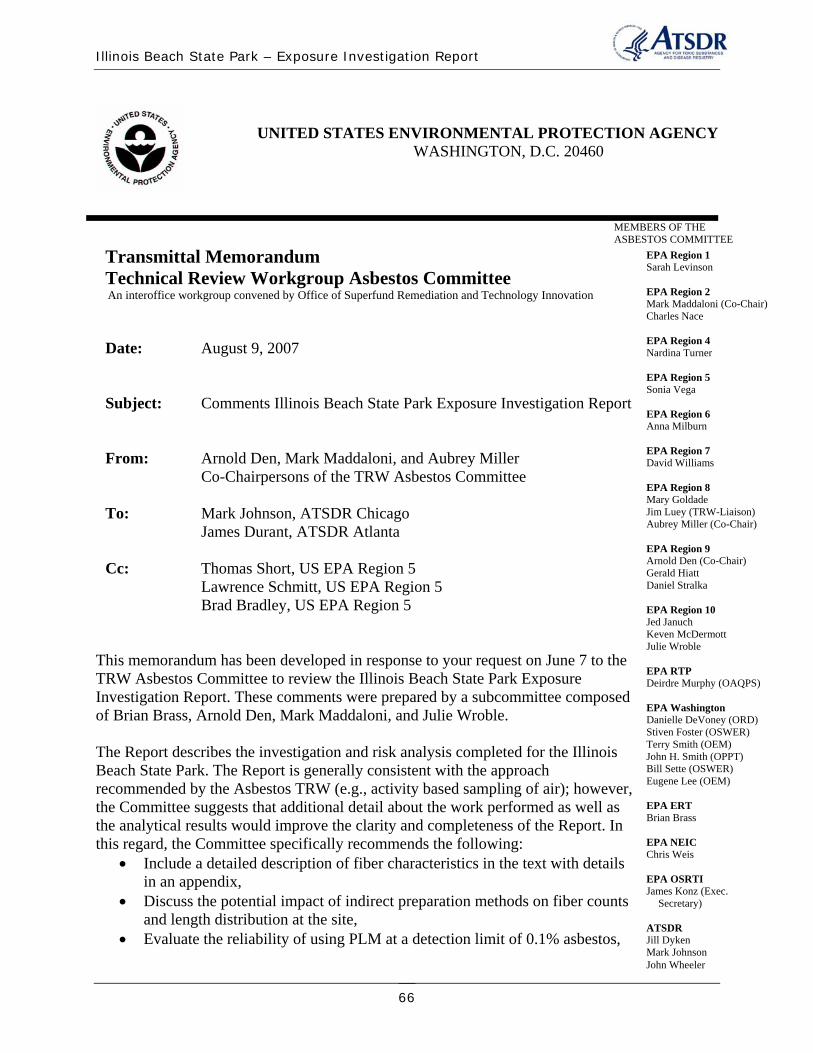
Illinois Beach State Park – Exposure Investigation Report
UNITED STATES ENVIRONMENTAL PROTECTION AGENCY WASHINGTON, D.C. 20460
MEMBERS OF THE ASBESTOS COMMITTEE
Transmittal MemorandumTechnical Review Workgroup Asbestos CommitteeAn interoffice workgroup convened by Office of Superfund Remediation and Technology Innovation
Date: August 9, 2007
Subject: Comments Illinois Beach State Park Exposure Investigation Report
From: Arnold Den, Mark Maddaloni, and Aubrey Miller Co-Chairpersons of the TRW Asbestos Committee
To: Mark Johnson, ATSDR Chicago James Durant, ATSDR Atlanta
Cc: Thomas Short, US EPA Region 5 Lawrence Schmitt, US EPA Region 5 Brad Bradley, US EPA Region 5
This memorandum has been developed in response to your request on June 7 to the TRW Asbestos Committee to review the Illinois Beach State Park Exposure Investigation Report. These comments were prepared by a subcommittee composed of Brian Brass, Arnold Den, Mark Maddaloni, and Julie Wroble.
The Report describes the investigation and risk analysis completed for the Illinois Beach State Park. The Report is generally consistent with the approach recommended by the Asbestos TRW (e.g., activity based sampling of air); however, the Committee suggests that additional detail about the work performed as well as the analytical results would improve the clarity and completeness of the Report. In this regard, the Committee specifically recommends the following:
• Include a detailed description of fiber characteristics in the text with details in an appendix,
• Discuss the potential impact of indirect preparation methods on fiber counts and length distribution at the site,
• Evaluate the reliability of using PLM at a detection limit of 0.1% asbestos,
EPA Region 1 Sarah Levinson
EPA Region 2 Mark Maddaloni (Co-Chair) Charles Nace
EPA Region 4 Nardina Turner
EPA Region 5 Sonia Vega
EPA Region 6 Anna Milburn
EPA Region 7 David Williams
EPA Region 8 Mary Goldade Jim Luey (TRW-Liaison) Aubrey Miller (Co-Chair)
EPA Region 9 Arnold Den (Co-Chair) Gerald Hiatt Daniel Stralka
EPA Region 10 Jed Januch Keven McDermott Julie Wroble
EPA RTP Deirdre Murphy (OAQPS)
EPA Washington Danielle DeVoney (ORD)Stiven Foster (OSWER) Terry Smith (OEM) John H. Smith (OPPT)Bill Sette (OSWER) Eugene Lee (OEM)
EPA ERT Brian Brass
EPA NEIC Chris Weis
EPA OSRTI James Konz (Exec.
Secretary)
ATSDR Jill Dyken Mark Johnson John Wheeler
66
Illinois Beach State Park – Exposure Investigation Report
• Include alternative, additional exposure scenarios that reflect a larger portion of the reasonable anticipated exposures,
• Rename “background” to call it reference concentration, • Expand the uncertainty section, • Clarify the risk communication issues.
In general, the Committee would have greater confidence in the risk estimates if they were to include a greater array of common activities that might be expected to release many fibers into the air and that might involve longer duration exposures (e.g., volleyball, ATV riding, or extended child’s play [including filling and dumping a bucket of dry sand in addition to sand castles]; an 8 hour sunbathing scenario next to a 2 hour frisbee scenario; 24 hour samples on windy day). In the absence of quantitative risk estimates considering this broader array of exposure scenarios, the Committee recommends using a semi-quantitative approach to compare airborne asbestos exposures associated with various activities to a reference airborne asbestos concentration.
The detailed comments of the Committee are presented below. Feel free to contact the Committee with any further questions.
1. Page 5, 1st paragraph: This Report clarifies the counting criteria used for fiber diameter and, while implied through citation of the ISO 10312 method, it would be informative if the report also clearly states the length and aspect ratio rules applied. The PCME definition used by the Committee is based on IRIS and includes fibers that are greater than 5 µm in length, aspect ratio of greater than or equal to 3:1, and a width greater than 0.25 µm. It may be informative to include the counting sheets as an appendix to the Report. Also, the presence of many thin or short fibers would be worth noting and discussing in the uncertainty section of the Report.
2. Page 5, 4th paragraph: The Committee does not generally recommend that the PLM method be used to artificially report low analytical method detection limits (MDL) at 0.1%, when the point-counting protocol is employed. The reason for this is that MDLs established for point-counting PLM methods are mere calculations, and may not have been verified though empirical evaluations of standards to obtain the measurement error (or error bars) around the MDL. The MDL calculation equals the inverse of the number of nodes counted and multiplied by 100 to obtain percent. The standard approach for most published methods is to count 400 nodes, resulting in a calculated MDL of 0.25% (MDL=1/400 * 100%). Given this calculation, some have surmised that simply increasing the number of nodes observed from 400 to 1000 results in an MDL of 0.1%. As mentioned above, this is often done without including an understanding of the error bars about the MDL. That is, taking the measurement uncertainty into account, is a 0.1% (1000 nodes) really 0.25% or something else? We don’t know. However, the approach to confirm the PLM’s sensitivity and selectivity for chrysotile using standards of known mass (weight percent) as described in this section of the Report seems quite appropriate with a couple of caveats. First, as written, it appears that a single sample was analyzed one time to determine the MDL for chrysotile. If this is not the case, the Committee suggests augmenting this section of the Report to clarify the approach. Specifically, the Committee would like to know if replicate analyses were performed with at least 2 concentration levels (e.g., a blank and the 0.1% spiked sample) and whether the study
67
Illinois Beach State Park – Exposure Investigation Report
was performed blind to the analyst. Replicate analyses carried out for at least 2 concentration levels under conditions that are blind to the analyst will allow for measurement error bars to be generated and presented. Second, while the PLM method employed uses visual area estimation resulting in units of area percent, we recognize that use of a reference material of known weight percent allows you to use visual area estimation to approximate the weight percent of chrysotile. The Committee recommends that the text be clarified to explain the use of weight percent units while employing an area estimation method.
3. Page 5: 4th paragraph: Appropriately, steps were taken to concentrate the asbestos fibers, reduce the soil matrix interferences, and increase the sample homogeneity. Use of the Region 1 soil method (developed by Scott Clifford a chemist with EPA Region 1) without verification using replicate analyses of site-specific reference materials, however, would put into question the quantitative accuracy of the analytical results. The Report (page 10) appropriately appears to use these TEM data qualitatively (i.e., to indicate presence or absence of asbestos) and does not produce concentration values for the asbestos levels in bulk samples. It is important to note that the Region 1 soil preparation method differs from that used by other sites (e.g., CARB 435—which employs a grinding step to homogenize the sample) and, thus, if quantitative results were reported for the Region 1 method used here, the results could not be compared to data from other sites. As such, if future work were to be performed at this site and quantitative data were desired for new bulk samples, the Committee recommends a method such as the CARB 435, until or unless method validation proves the Region 1 approach a quantitative tool.
4. Page 5, 5th paragraph: The Committee recommends including a statement indicating that TEM data generated for the bulk samples is only to be used qualitatively—to indicate presence or absence of asbestos fibers—and that asbestos concentrations cannot be generated using this approach.
5. Page 6, 2nd complete paragraph: This section is titled data analysis procedures, but includes definitions of asbestos structures and does not describe how the fibers observed via microscopy were classified for the purpose of characterizing exposures at this site. EPA (AHERA, NESHAPS, CERCLA, IRIS) asbestos definitions differ from OSHA’s definition. What did the lab count? Asbestiform structures (which would be contrary to NIOSH and EPA policy) or all structures that meet a specified size limit. Because IRIS was used in the risk calculations, the lab should have counted all structures (both asbestiform and non-asbestiform that met the IRIS definition).
6. Page 7, 2nd paragraph: The TEM description is awkward and does not represent what is done using ISO 10312. The TEM/PCM conversion discussion comes from the Nicholson (1986) asbestos update document which attempted to relate the old PCM counts to TEM counts. When using ISO 10312, all structures are counted and recorded and then the lab or the investigator bins the counts according to specified size categories, AHERA fibers, PCME fibers etc.
7. Page 7, 4th paragraph – The text here needs to recognize the more recent information on this point than that in the 2001 Agency for Toxic Substances and Disease Registry toxicological profile for asbestos (cited here). Specifically, the 2006 National Academy Institute of Medicine report concluded that asbestos causes laryngeal cancer (National Academy Institute of Medicine, 2006).
68
Illinois Beach State Park – Exposure Investigation Report
8. Page 8, 2nd paragraph: The statement that IRIS treats mineralogy and fiber length as equipotent should be clarified. IRIS considers potent fibers as those greater than 5 microns in length. Shorter fibers are assumed to contribute nothing to quantitative cancer risk derived using the IRIS potency.
9. Page 8, 5th paragraph: Remove the word amphibole from the last sentence. Similar results have been observed at Swift Creek with chrysotile fibers.
10. Page 9, 2nd paragraph: It might be helpful in explaining the risk numbers to indicate that the 0.0009 PCME f/cc correlates with a 10-4 cancer risk for an exposure period of 30 years (24 hours per day).
11. Page 10, 1st full paragraph: Add 2 to the end of the first sentence. The Committee recommends including an appendix with the raw fiber dimension data for fibers that were detected. Some discussion of the range of fibers detected should be included in the text for completeness. How were other amphiboles characterized? Was any mineralogy given or did the lab report these as OA? For those grids where 1-3 fibers were counted, ISO recommends using a Poisson distribution (which results in a less than number that cannot be used in a risk calculation). Regions 8, 9, and 10 use an alternative ASTM approach to calculate EPCs (ASTM D 6620-00). For grids where only 1-3 fibers are calculated, calculate the number of fibers by multiplying the number of fibers observed by the analytical sensitivity to produce a number that can be used in a risk calculation. Also, for non-detects use 0 (rather than half the detection limit). While this alternative method may have statistical limitations, it is the approach that is being used by Regions 8, 9, and 10. Another approach (perhaps for future assessments) would be to specify in the counting criteria to count at least 4 PCME fibers.
12. Page 10, last paragraph: The second sentence regarding Sample #1 should be clarified that amphibole fibers were found using TEM.
13. Page 12, equation: While the net result is the same, the Committee typically recommends that a time-weighting factor (TWF) be calculated for each activity, multiplied by the fiber concentration, and then multiplied by the potency factor to estimate risk. Calculating an activity-specific TWF allows you to compare the relative risk for different activities. Also, the activities as described may not be the most conservative for exposures occurring at the beach. If someone spends the entire day at the beach, their exposure and risk could be greater than someone making sand castles for 2-4 hours. Other factors, such as people walking on the beach, playing games, and wind speed could influence the release of asbestos fibers from sand. How does releasability from grading compare to releasability related to other combined activities at a beach crowded with people? Please provide more detail on the playing in sand activity; the high-end exposure may not have been adequately captured by the sand castle scenario (e.g., although the sand moisture content was provided in Table 3 of the Report, quartz or silica sand has a very low moisture holding capacity and a visual/tactile description of the sand would have been beneficial in understanding the water saturation level of the sand [description per NebGuide G84-690, Estimating Soil Moisture by Appearance and Feel]).
14. Page 13, indented text: The Committee has some hesitation about the level of confidence projected by the report, given the number of data points used to inform the decision: eight sand-castle, four maintenance, and seven background samples. While there may be uncertainty in the risk calculations associated with the limited number of samples
69
Illinois Beach State Park – Exposure Investigation Report
collected, the Committee believes that the number of samples can reasonably support conclusions about whether ABS results are higher or lower than background. The actual exposures to individuals at the beach could be higher or lower than the estimates reported in this assessment. Given the limited sampling that was conducted, both temporally and spatially, it’s hard to determine whether the high end exposure was captured. Still, this information is useful in moving ahead in making decisions about management of this site.
15. In addition, the Committee recommends that a discussion of Nicholson's comments regarding the fairly large uncertainty of applying the risk estimates to non-occupational cohorts, including children, as well as the uncertainty surrounding high-level episodic exposures be included in a discussion of the risk assessment uncertainty.
16. Pg 14: From a risk communications viewpoint the recommendations contradict the conclusions. If the conclusion is no risk or public health hazard, then why all the precautions? It may help to address this point by adding a sentence in the conclusions or recommendations sentence to the effect of “In light of uncertainties related to quantitative risk and the weight of the evidence regarding health effects associated with some asbestos exposures, ATSDR recommends several precautionary actions to reduce public exposures and raise awareness of potential hazards”. The Committee recommends explaining the tide/wave effects and long shore currents that can uncover or deposit ACM on the beach. The reason for ATSDR’s recommended precautions appear to be related to this deposition and unearthing of ACM associated with wave action and currents. Additionally, weathering of ACM will influence the releasability of asbestos from ACM as the matrix breaks down. Finally, while every reasonable effort may be made to remove visible ACM from the beach, the beach is a dynamic environment and at times pieces of ACM may appear on the beach.
17. Figures in Appendix A: These are very helpful. They support the text in the Report and allow the reader to visualize the beach dynamics and sampling strategy.
18. Table 2: The detailed analytical results should be included in an appendix and additional descriptive information about the other types of fibers observed (besides just PCME fibers) should be included in the text. The information as presented in this table is very limited. Are the fibers that have been included in this analysis matrix fibers, bundles, or individual fibers? What else was observed that may provide information about the presence of asbestos at this site? In addition, the Committee recommends that the name and location of the laboratory (laboratories) conducting the analysis be included along with a statement addressing NVLAP (or equivalent) accreditation.
19. The Committee also recommends softening the language concerning background sampling. For air samples, background sampling typically involves the collection of many days of exposure (to include seasonal variation). The Report indicates that samples were collected for only a few days and only a few hours each day (volume collected ranged from 2500 liters to 3000 liters); hence, these are not likely to be representative of what would be considered background air samples. For example, the California Air Resources Board (CARB) runs their high volume samplers for 23 hours a day and sample 14,000 liters of air to establish a background. The use of the term “background” is a concern, the Committee recommends renaming the sample (perhaps as reference samples) to avoid the term “background”.
20. The Report indicates that the personnel sampling pumps could not maintain the flow rates needed to collect the sample volumes specified in the Sampling Plan (ten liters per
70

Illinois Beach State Park – Exposure Investigation Report
minute for 4 hours), yet the sand-castle building personnel samples collected in excess of 2400 liters. It is unclear whether personal sampling was conducted or if fixed location samples with a more robust sampling pump were used. The Report also mentions the SKC Leland Legacy as the sampling pump to be used. The Committee’s experience suggests that this pump can not maintain a flow rate of 10 liters per minute with a 25 millimeter, 0.8 micron mixed cellulose ester asbestos cassette due to the high backpressure associated with these cassettes.
21. The sample volumes for the beach maintenance were very low which required that over 200 Grid Openings be counted. Analysis fatigue can occur with this number of GOs. Generally, the Committee does not recommend more than 100 GOs, and 30 GOs or fewer is preferred. This is just a general comment and does not materially impact the Report.
22. Table 4: The exposure factors appear to be fairly limited. Given the location of this site, are there individuals that potentially visit more than 50 days per year? Also, are sand castle builders and graders the most exposed individuals? Some additional discussion on these points would be useful.
23. Appendix C: Some of the discussion in this Appendix should be moved to the body of the Report, including explanation of cancelled ABS activities, some data tables, etc. This will make the Report more transparent from a risk communication standpoint.
References: ASTM D 6620-00. Practice for Asbestos Detection Limit Based on Counts (2001).
Nicholson, W.J. (1986). Airborne Asbestos Health Assessment Update. EPA/600/8-84/003F.
National Academy Institute of Medicine. (2006). Asbestos: Selected Cancers. Committee on Asbestos: Selected Health Effects. Board on Population Health and Public Health Practice (BPH). ISBN-10: 0-309-10169-7. National Academies Press. http://www.nap.edu/catalog.php?record_id=11665.
71

Illinois Beach State Park – Exposure Investigation Report
ATSDR response to general comments:
ATSDR appreciates the timely input from TRW regarding this site. Additional detail about the analytical work and activities performed have been provided in the document, such as:
Details describing the asbestos structure mineralogy and morphology characteristics were added (Appendix A, Figure 5 and Appendix B, Tables 3 and 4).
• We expanded discussion of the bulk sand preparation methodology and detection limits. • We renamed “background” concentrations to reference concentrations. • We expanded the uncertainty section per TRW comments. • We also clarified the risk communication issues and added a new executive summary.
We did not include alternative scenarios as EPA Region V has requested the Environmental Response Team (ERT) to collect additional activity based sampling at the Illinois Beach State Park (IBSP). EPA Region V has requested ATSDR to evaluate these sampling results when available.
Responses to specific comments from TRW:
Comment 1
The counting rules description was clarified. Detailed results of the structures identified are shown in Appendix B, Tables 3 and 4.
Comment 2 ATSDR clarified the text and discussion of the bulk sand analysis for these issues. While the detection limit reported was low, ATSDR did not use these results to make a health decision. Instead, our objective was to attempt to identify additional asbestos structures and their characteristics.
Comment 3 ATSDR concurs that the soil sample results should not be compared with other data utilizing the CARB 435 methodology. As part of the additional sampling done at this site, ERT will be collecting bulk samples for analysis following CARB method 435.
Comment 4 ATSDR included language regarding the qualitative nature of the evaluation of the bulk sand samples (page 5 last paragraph).
Comment 5 This section was moved into the “Methods of Measuring Asbestos” section and the exact definition of what was counted was included. All structures meeting the IRIS definition were counted, whether asbestiform or non-asbestiform mineral.
72
Illinois Beach State Park – Exposure Investigation Report
Comment 6 ATSDR included additional discussion of ISO 10312 methodology (Page 7 paragraph 6).
Comment 7 ATSDR now includes the reference to IOM 2006 report associating laryngeal cancer with asbestos exposure.
Comment 8 ATSDR revised this section to clarify that IRIS treats fibers greater than 5 microns as equipotent, and fibers less than 5 microns as non-potent.
Comment 9 ATSDR adjusted the language accordingly to indicate that soils containing less than 1% of asbestos can create levels of health concern when disturbed.
Comment 10 The recommended change has been made.
Comment 11 Raw fiber dimensions are included in Appendix B, Tables 3 and 4. Regarding the suggested ASTM method to estimate probable concentrations, utilization of the ASTM procedure would yield lower average concentrations than the approach ATSDR elected to follow (utilizing the Poisson distribution to estimate upper bounds of confidence when the structure counts were below 3). Likewise, ATSDR has also elected to treat non-detects as being at the limit of analytical sensitivity. These decisions were made because of the screening nature of the study. It is ATSDR’s understanding that the current work that ERT has begun at IBSP specifies that a minimum of 4 structures per sample will be counted.
Comment 12 The recommended change has been made.
ATSDR Response to comment 13 ATSDR modified the tables to include an overall time weighting factor (TWF) as recommended. It is ATSDR’s opinion that the grading activity, which occurred in August simulated the worst case scenario regarding the disturbance of the sand. This is supported by the fact the filters were approaching the overloaded conditions in the short duration of the sampling period. Tactile inspection of the sand indicated that it contained a low percentage of moisture as it did not clump and poured through the hand very easily. Additional details about the sand castle activity have been provided. Additionally, ERT has also replicated sand castle/playing in sand in their activity based sampling.
ATSDR Response to comment 14 ATSDR agrees that further sampling will increase our confidence in our estimates of exposure and risk at IBSP. EPA Region V has initiated additional sampling at the IBSP. Our confidence in
73
Illinois Beach State Park – Exposure Investigation Report
our initial conclusions is based on the results of the beach dragging activity, which produced a significant visual release of dust on the beach. Since ATSDR has been asked by EPA Region V to assess the results of the current ERT conducted activity sampling, we have limited our conclusions about the site until we have reviewed the newer data.
ATSDR Response to comment 15 Additional discussion per Nicholson’s 1986 Health Assessment has been added on page 14 and 15.
ATSDR Response to comment 16 Although the conclusions are that the conditions at the beach do not pose a public health hazard, the presence of ACM on the beach needs to be acknowledged as material that people should avoid contacting. The recommended statements regarding public health messages and the mechanism of deposition of ACM on the beach will be inserted into the text.
ATSDR Response to comment 17 We appreciate the compliment. It has been shared with staff who contributed to the development of these figures.
ATSDR Response to comment 18 See response to general comments. The laboratory information is now provided.
ATSDR Response to comment 19 The recommended change has been made.
ATSDR Response to comment 20 The Leland Legacy pump was not capable of performing to the flow rate indicated. Therefore, activities planned that utilized this pump were dropped from the protocol. The types of activities planned are not being conducted by ERT.
ATSDR Response to comment 21 The high number of GO’s counted was a result of the heavy loading of the cassettes by dust during the beach dragging scenarios. ATSDR concurs that it is not desirable to obtain a lower detection limit by increasing the number of GO’s counted. However, increasing sample duration or volume would have resulted in overloaded cassettes and necessitated indirect preparation of the air samples, which would have resulted in increased uncertainty in the results.
ATSDR Response to comment 22 ATSDR did not have any use survey information to document specific values for frequency of use. However, given the fact that a majority of visitors to the beach area would be during the summer months, a frequency of 50 days per year would be considered to be an upper end estimate for exposure frequency. The sand castle building scenario was intended to reflect typical activity that young children would be engaged in at the beach. The beach grading scenario continuously sampled the air behind the grading device. Therefore, it did not directly access potential exposure to the worker driving the tractor. Since the device was continuously moving, the estimated air concentration did not reflect a realistic exposure concentration that
74
Illinois Beach State Park – Exposure Investigation Report
anyone would be likely to experience. Further description of these points will be included in the text.
ATSDR Response to comment 23 To reduce confusion about the sampling, Appendix C will be the final protocol that was actually implemented. The most significant difference was the elimination of several ABS activities that could not be conducted due to technical constraints with the available sampling equipment. A discussion of this modification will be inserted into the main text. These eliminated ABS activities were the focus on the follow-up sampling conducted by USEPA in September 2007.
75