Embed Size (px)
Citation preview
ILLINOIS HOUSING DEVELOPMENT AUTHORITY
(A Component Unit of the State of Illinois)
Financial Statements
June 30, 2019
(With Independent Auditors’ Report Thereon)
Performed as Special Assistant Auditors for the Auditor General,
State of Illinois
ILLINOIS HOUSING DEVELOPMENT AUTHORITY
(A Component Unit of the State of Illinois)
Table of Contents
Page(s)
Agency Officials 1
Financial Statement Report:
Summary 2
Independent Auditors’ Report 3–5
Management’s Discussion and Analysis (Unaudited) 6–16
Basic Financial Statements:
Government-Wide Financial Statements:
Statement of Net Position 17–18
Statement of Activities 19
Fund Financial Statements:
Balance Sheet – Governmental Funds 20
Statement of Revenues, Expenditures, and Changes in Fund Balances –
Governmental Funds 21
Statement of Net Position – Proprietary Funds 22–23
Statement of Revenues, Expenses, and Changes in Fund Net Position – Proprietary
Funds 24
Statement of Cash Flows – Proprietary Funds 25–26
Notes to Financial Statements 27-72
Supplementary Information:
Nonmajor Governmental Funds:
Combining Balance Sheet 73
Combining Statement of Revenues, Expenditures, and Changes in Fund Balances 74
Mortgage Loan Program Fund:
Combining Schedule of Net Position 75
Combining Schedule of Revenues, Expenses, and Changes in Fund Net Position 76
Combining Schedule of Cash Flows 77
Single Family Program Fund:
Combining Schedule of Net Position 78
Combining Schedule of Revenues, Expenses, and Changes in Fund Net Position 79
Combining Schedule of Cash Flows 80
ILLINOIS HOUSING DEVELOPMENT AUTHORITY
(A Component Unit of the State of Illinois)
Table of Contents
Page(s)
Nonmajor Proprietary Fund - IHDA Dispositions LLC:
Combining Schedule of Net Position 81
Combining Schedule of Revenues, Expenses, and Changes in Fund Net Position 82
Combining Schedule of Cash Flows 83
ILLINOIS HOUSING DEVELOPMENT AUTHORITY
(A Component Unit of the State of Illinois)
1
Agency Officials
Executive Director (11/12/19) Kristin Faust
Executive Director (2/22/16 – 8/15/19) Audra Hamernik
Assist. Executive Director/Chief of Staff Debra Olson
General Counsel Maureen G. Ohle
Chief Financial Officer (10/19/19) Tracy Grimm (Acting)
Chief Financial Officer (4/21/14 – 10/18/19) Nandini Natarajan
Controller (1/22/19) Timothy J. Hicks
Controller (6/20/16 – 1/21/19) Vanessa Boykin (Acting)
Chief Internal Auditor Kevin O’Connor
Agency Officials are located at:
111 E. Wacker Drive, Suite 1000
Chicago, Illinois 60601
ILLINOIS HOUSING DEVELOPMENT AUTHORITY
(A Component Unit of the State of Illinois)
Financial Statement Report
2
Summary
The audit of the accompanying financial statements of the Illinois Housing Development Authority (A Component
Unit of the State of Illinois) was performed by KPMG LLP.
Based on their audit, the auditors expressed unmodified opinions on the Authority’s basic financial statements.
3
Independent Auditors’ Report
The Honorable Frank J. Mautino
Auditor General of the State of Illinois
and
The Board of Directors
Illinois Housing Development Authority:
Report on the Financial Statements
As Special Assistant Auditors for the Auditor General of the State of Illinois, we have audited the accompanying
financial statements of the governmental activities, the business-type activities, each major fund, and the
aggregate remaining fund information of the Illinois Housing Development Authority (the Authority), a
component unit of the State of Illinois, as of and for the year ended June 30, 2019, and the related notes to the
financial statements, which collectively comprise the Authority’s basic financial statements as listed in the table
of contents.
Management’s Responsibility for the Financial Statements
Management is responsible for the preparation and fair presentation of these financial statements in
accordance with U.S. generally accepted accounting principles; this includes the design, implementation, and
maintenance of internal control relevant to the preparation and fair presentation of financial statements that are
free from material misstatement, whether due to fraud or error.
Auditors’ Responsibility
Our responsibility is to express opinions on these financial statements based on our audit. We conducted our
audit in accordance with auditing standards generally accepted in the United States of America. Those
standards require that we plan and perform the audit to obtain reasonable assurance about whether the
financial statements are free from material misstatement.
An audit involves performing procedures to obtain audit evidence about the amounts and disclosures in the
financial statements. The procedures selected depend on the auditors’ judgment, including the assessment of
the risks of material misstatement of the financial statements, whether due to fraud or error. In making those
risk assessments, the auditor considers internal control relevant to the entity’s preparation and fair presentation
of the financial statements in order to design audit procedures that are appropriate in the circumstances, but
not for the purpose of expressing an opinion on the effectiveness of the entity’s internal control. Accordingly, we
express no such opinion. An audit also includes evaluating the appropriateness of accounting policies used and
the reasonableness of significant accounting estimates made by management, as well as evaluating the overall
presentation of the financial statements.
KPMG LLP is a Delaware limited liability partnership and the U.S. member firm of the KPMG network of independent member firms affiliated with KPMG International Cooperative (“KPMG International”), a Swiss entity.
KPMG LLPAon CenterSuite 5500200 E. Randolph StreetChicago, IL 60601-6436
4
We believe that the audit evidence we have obtained is sufficient and appropriate to provide a basis for our
audit opinions.
Opinions
In our opinion, the financial statements referred to above present fairly, in all material respects, the respective
financial position of the governmental activities, the business-type activities, each major fund, and the
aggregate remaining fund information of the Illinois Housing Development Authority, a component unit of the
State of Illinois, as of June 30, 2019, and the respective changes in financial position and, where applicable,
cash flows thereof for the year then ended in accordance with U.S. generally accepted accounting principles.
Other Matters
Report on Summarized Comparative Information
We have previously audited the Authority’s June 30, 2018 financial statements, and we expressed unmodified
audit opinions on those audited financial statements in our report dated January 21, 2019. In our opinion, the
summarized comparative information presented within note 8 to the financial statements as of June 30, 2018 is
consistent, in all material respects, with the audited financial statements from which it has been derived.
Required Supplementary Information
U.S. generally accepted accounting principles require that the management’s discussion and analysis on
pages 6 through 16 be presented to supplement the basic financial statements. Such information, although not
a part of the basic financial statements, is required by the Governmental Accounting Standards Board who
considers it to be an essential part of financial reporting for placing the basic financial statements in an
appropriate operational, economic, or historical context. We have applied certain limited procedures to the
required supplementary information in accordance with auditing standards generally accepted in the United
States of America, which consisted of inquiries of management about the methods of preparing the information
and comparing the information for consistency with management’s responses to our inquiries, the basic
financial statements, and other knowledge we obtained during our audit of the basic financial statements. We
do not express an opinion or provide any assurance on the information because the limited procedures do not
provide us with sufficient evidence to express an opinion or provide any assurance.
Supplementary Information
Our audit was conducted for the purpose of forming opinions on the financial statements that collectively
comprise the Authority’s basic financial statements. The supplementary information on pages 73 through 83 are
presented for purposes of additional analysis and are not a required part of the basic financial statements. The
supplementary information is the responsibility of management and was derived from and relates directly to the
underlying accounting and other records used to prepare the basic financial statements. Such information has
been subjected to the auditing procedures applied in the audit of the basic financial statements and certain
additional procedures, including comparing and reconciling such information directly to the underlying
5
accounting and other records used to prepare the basic financial statements or to the basic financial statements
themselves, and other additional procedures in accordance with auditing standards generally accepted in the
United States of America. In our opinion, the supplementary information is fairly stated, in all material respects,
in relation to the basic financial statements as a whole.
Chicago, Illinois
February 7, 2020
ILLINOIS HOUSING DEVELOPMENT AUTHORITY
(A Component Unit of the State of Illinois)
Management’s Discussion and Analysis
June 30, 2019
(Unaudited)
6 (Continued)
This Section of the Illinois Housing Development Authority’s (the Authority) annual financial report presents
management’s discussion and analysis of the Authority’s financial performance during the fiscal year that ended
on June 30, 2019. Please read it in conjunction with the Authority’s financial statements, which follow this
section.
Financial Highlights
Net position of the Authority increased $134.3 million, to $1,254.4 million as of June 30, 2019, from an
increase in the Authority’s governmental activities ($64.5 million) and an increase in business-type activities
($69.8 million).
The increase in net position of the Authority’s governmental activities increased $187.1 million from the prior
year primarily due to higher federal revenue ($142.6 million), lower grant disbursements ($33.2 million),
lower provision for estimated losses on program loans receivable ($20.4 million) offset by lower grants from
the State of Illinois ($10.4 million).
The increase in net position of the Authority’s business-type activities increased $33.6 million from the prior
year primarily due to increased investment income ($51.3 million), offset by lower interest earned on
program loans ($4.2 million), lower tax credit reservation and monitoring fees and other ($2.4 million), higher
salaries and benefits ($2.7 million), higher financing costs ($3.1 million) and lower provision for estimated
losses on program loans receivable and mortgage participation certificate program ($4.0 million)
Authority debt issuances during fiscal year 2019 totaled $1.5 billion. The Authority’s debt outstanding (net of
discounts and premiums) of $1.4 billion as of June 30, 2019 was $222.3 million above the amount
outstanding as of June 30, 2018.
The Authority issued three new series of fixed rate tax-exempt Revenue Bonds, and one new series of
variable rate tax-exempt Revenue Bonds, totaling $280.3 million, to fund its homeownership loan program.
The bonds are secured by Government National Mortgage Association (GNMA) certificates and Fannie Mae
(FNMA) MBS. To hedge the interest rate on the variable rate series, the Authority entered into a long-term
fixed payer interest rate swap with Bank of America N.A.
The Authority issued two new series of fixed rate tax-exempt Homeowner Mortgage Revenue Bonds, and
one new series of variable rate tax-exempt Homeowner Mortgage Revenue Bonds, totaling $120.6 million, to
economically refund prior series of bonds and fund its homeownership loan program. The bonds are secured
by GNMA certificates and FNMA MBS. To hedge the interest rate on the variable rate series, the Authority
entered into a long-term fixed payer interest rate swap with the Royal Bank of Canada.
The Authority issued two new series of variable rate short-term tax-exempt notes totaling $11.8 million to
finance the acquisition, rehabilitation, construction and equipping of a 123-unit residential development in
Chicago, Illinois. Both notes were directly purchased by PNC Bank, N.A.
The Authority sold beneficial ownership interest in 8 loans for $56.0 million to finance an affordable
multifamily development to the Federal Financing Bank (FFB), an arm of the United States Department of the
Treasury. The loans are insured under the FHA-HFA Risk Sharing Program.
ILLINOIS HOUSING DEVELOPMENT AUTHORITY
(A Component Unit of the State of Illinois)
Management’s Discussion and Analysis
June 30, 2019
(Unaudited)
7 (Continued)
Program loan originations for the year totaled $46.6 million and $31.7 million in the Authority’s governmental
and business-type activities, respectively, compared to fiscal year 2018 loan originations of $23.9 million and
$45.5 million, respectively.
During fiscal year 2019, the Authority has continued to boost home buying in the State, and particularly in ten
Illinois counties hardest hit by the foreclosure crisis. Using funds provided by the United States Department
of the Treasury’s Hardest Hit Fund (HHF) program, the Authority disbursed $27.7 million in down payment
assistance that helped 3,688 homebuyers buy their first home.
The Authority continued to offer the ACCESS down payment assistance programs, during the fiscal year,
that are available statewide, and come with an affordable, fixed interest rate and up to $10,000 to assist
eligible borrowers with their down payment and closing costs for the purchase of a new or existing home.
The source of down payment assistance funds, based on program structure and anticipated demand, include
the Authority’s Administrative Fund and excess revenues held under various Authority Bond Funds.
The Authority has continued to address foreclosure issues throughout the State and has disbursed $53.7
million in direct mortgage assistance, using funds provided by the United States Department of the
Treasury’s Hardest Hit Fund Program (HHF), that enabled 2,061 households avoid foreclosure on their
homes. The Authority disbursed approximately $11.8 million less in direct mortgage assistance in
comparison to fiscal year 2018, and the average amount of assistance per household increased from
$20,044 to $26,049 demonstrating the increasing need for such assistance throughout the State’s hardest hit
counties. Additionally, the Authority is one of two states in the nation to offer a refinance program that
enables existing homeowners with underwater mortgages to write down the balance on their first mortgage
loan and refinance their debt into an affordable loan with a smaller balance.
Overview of the Financial Statements
The financial statements consist of three parts – management’s discussion and analysis (this section), the basic
financial statements, and supplementary information. The basic financial statements include two kinds of
statements that present different views of the Authority:
The first two statements are government-wide financial statements that provide information about the
Authority’s overall financial position and operations. These statements, which are presented on the accrual
basis, consist of the statement of net position and the statement of activities.
The remaining statements are fund financial statements of the Authority’s thirteen governmental funds, for
which activities are funded from State appropriation (grants), U.S. Department of Housing & Urban
Development (HUD) and U.S. Treasury Programs, and which the Authority follows the modified accrual basis
of accounting, and four proprietary funds, which operate similar to business activities and for which the
Authority follows the accrual basis of accounting.
The basic financial statements also include notes to the financial statements that explain some of the
information in the government-wide and fund financial statements and provide more detailed data.
The remainder of this overview section of management’s discussion and analysis explains the structure and
contents of each of these statements. The prior year results referred to throughout this section for comparison
purposes are as previously reported.
ILLINOIS HOUSING DEVELOPMENT AUTHORITY
(A Component Unit of the State of Illinois)
Management’s Discussion and Analysis
June 30, 2019
(Unaudited)
8 (Continued)
The government-wide statements report information about the Authority as a whole using accounting methods
similar to those used by private sector companies. The statement of net position includes all of the Authority’s
assets, deferred outflows of resources, liabilities and deferred inflows of resources. All of the current year ’s
revenues and expenses are accounted for in the statement of activities regardless of when cash is received or
paid. Most of the Authority’s activities are business-type and are reported in its proprietary funds.
The fund financial statements provide more detailed information about the Authority’s most significant funds and
not the Authority as a whole. The Authority has two kinds of funds:
Governmental funds – The Authority has thirteen governmental funds. The Authority is the administrator of
these funds, the revenues of which are appropriated annually to the Illinois Department of Revenue except
for revenues received directly from HUD and the U.S. Treasury for the purpose of making housing grants
and loans. These fund statements focus on how cash and other financial assets flowing into the funds have
been used.
Proprietary funds – The Authority’s primary activities are in its four enterprise funds; which activities are
accounted for in a manner similar to businesses operating in the private sector. Funding has primarily arisen
through the issuances of bonds, both tax-exempt and taxable, the proceeds of which are primarily used to
make various types of loans to finance low and moderate-income housing. Funding from Nonmajor
Proprietary Fund - IHDA Dispositions LLC is primarily rental income collected by the property until such time
as disposition occurs. The net position of these funds represents accumulated earnings since their inception,
of which $244.0 million is unrestricted.
ILLINOIS HOUSING DEVELOPMENT AUTHORITY
(A Component Unit of the State of Illinois)
Management’s Discussion and Analysis
June 30, 2019
(Unaudited)
9 (Continued)
Financial Analysis of the Authority as a Whole
Net Position
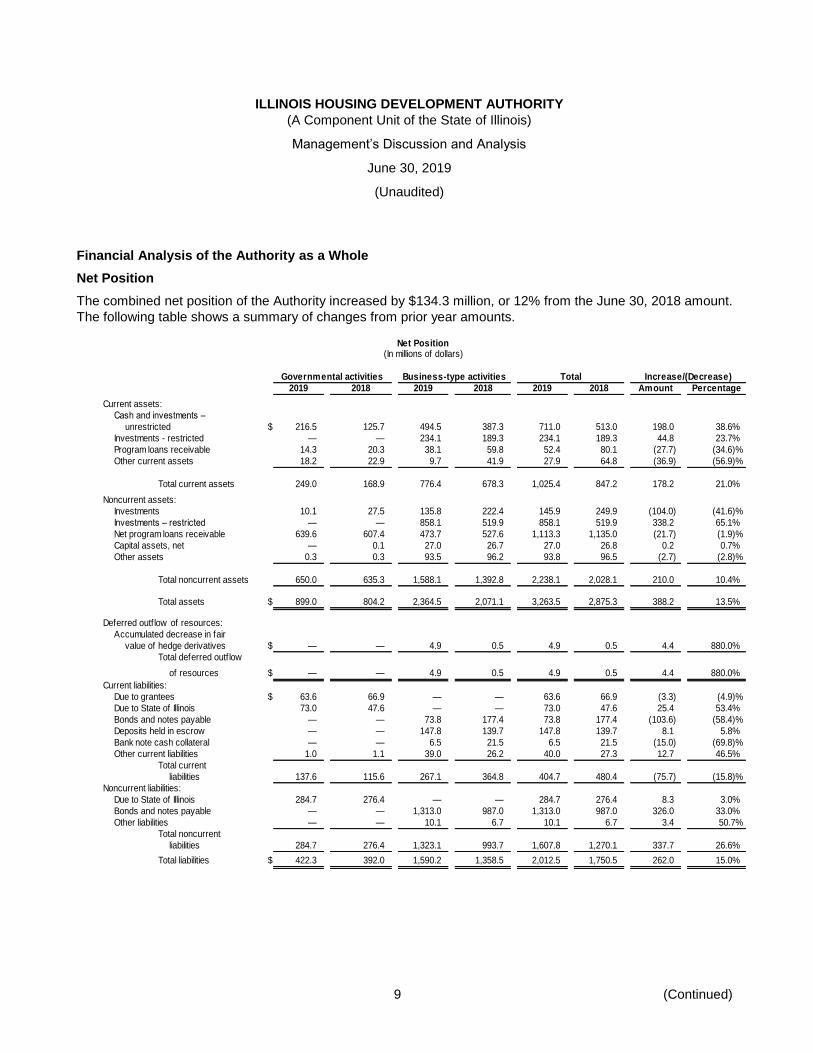
The combined net position of the Authority increased by $134.3 million, or 12% from the June 30, 2018 amount.
The following table shows a summary of changes from prior year amounts.
Net Position(In millions of dollars)
Governmental activities Business-type activities Total Increase/(Decrease)
2019 2018 2019 2018 2019 2018 Amount Percentage
Current assets:
Cash and investments –
unrestricted $ 216.5 125.7 494.5 387.3 711.0 513.0 198.0 38.6%
Investments - restricted — — 234.1 189.3 234.1 189.3 44.8 23.7%
Program loans receivable 14.3 20.3 38.1 59.8 52.4 80.1 (27.7) (34.6)%
Other current assets 18.2 22.9 9.7 41.9 27.9 64.8 (36.9) (56.9)%
Total current assets 249.0 168.9 776.4 678.3 1,025.4 847.2 178.2 21.0%
Noncurrent assets:
Investments 10.1 27.5 135.8 222.4 145.9 249.9 (104.0) (41.6)%
Investments – restricted — — 858.1 519.9 858.1 519.9 338.2 65.1%
Net program loans receivable 639.6 607.4 473.7 527.6 1,113.3 1,135.0 (21.7) (1.9)%
Capital assets, net — 0.1 27.0 26.7 27.0 26.8 0.2 0.7%
Other assets 0.3 0.3 93.5 96.2 93.8 96.5 (2.7) (2.8)%
Total noncurrent assets 650.0 635.3 1,588.1 1,392.8 2,238.1 2,028.1 210.0 10.4%
Total assets $ 899.0 804.2 2,364.5 2,071.1 3,263.5 2,875.3 388.2 13.5%
Deferred outf low of resources:
Accumulated decrease in fair
value of hedge derivatives $ — — 4.9 0.5 4.9 0.5 4.4 880.0%
Total deferred outf low
of resources $ — — 4.9 0.5 4.9 0.5 4.4 880.0%
Current liabilities:
Due to grantees $ 63.6 66.9 — — 63.6 66.9 (3.3) (4.9)%
Due to State of Illinois 73.0 47.6 — — 73.0 47.6 25.4 53.4%
Bonds and notes payable — — 73.8 177.4 73.8 177.4 (103.6) (58.4)%
Deposits held in escrow — — 147.8 139.7 147.8 139.7 8.1 5.8%
Bank note cash collateral — — 6.5 21.5 6.5 21.5 (15.0) (69.8)%
Other current liabilities 1.0 1.1 39.0 26.2 40.0 27.3 12.7 46.5%
Total current
liabilities 137.6 115.6 267.1 364.8 404.7 480.4 (75.7) (15.8)%
Noncurrent liabilities:
Due to State of Illinois 284.7 276.4 — — 284.7 276.4 8.3 3.0%
Bonds and notes payable — — 1,313.0 987.0 1,313.0 987.0 326.0 33.0%
Other liabilities — — 10.1 6.7 10.1 6.7 3.4 50.7%
Total noncurrent
liabilities 284.7 276.4 1,323.1 993.7 1,607.8 1,270.1 337.7 26.6%
Total liabilities $ 422.3 392.0 1,590.2 1,358.5 2,012.5 1,750.5 262.0 15.0%
ILLINOIS HOUSING DEVELOPMENT AUTHORITY
(A Component Unit of the State of Illinois)
Management’s Discussion and Analysis
June 30, 2019
(Unaudited)
10 (Continued)
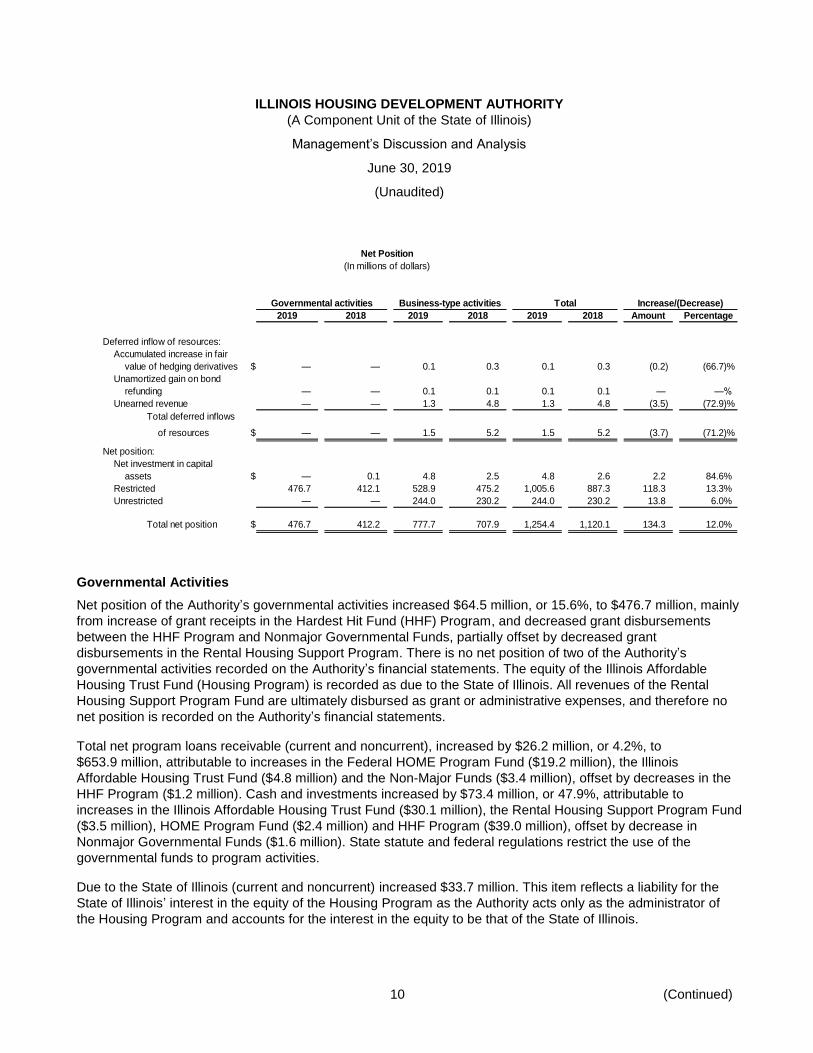
Net Position
(In millions of dollars)
Governmental activities Business-type activities Total Increase/(Decrease)
2019 2018 2019 2018 2019 2018 Amount Percentage
Deferred inflow of resources:
Accumulated increase in fair
value of hedging derivatives $ — — 0.1 0.3 0.1 0.3 (0.2) (66.7)%
Unamortized gain on bond
refunding — — 0.1 0.1 0.1 0.1 — —%
Unearned revenue — — 1.3 4.8 1.3 4.8 (3.5) (72.9)%
Total deferred inflows
of resources $ — — 1.5 5.2 1.5 5.2 (3.7) (71.2)%
Net position:
Net investment in capital
assets $ — 0.1 4.8 2.5 4.8 2.6 2.2 84.6%
Restricted 476.7 412.1 528.9 475.2 1,005.6 887.3 118.3 13.3%
Unrestricted — — 244.0 230.2 244.0 230.2 13.8 6.0%
Total net position $ 476.7 412.2 777.7 707.9 1,254.4 1,120.1 134.3 12.0%
Governmental Activities
Net position of the Authority’s governmental activities increased $64.5 million, or 15.6%, to $476.7 million, mainly
from increase of grant receipts in the Hardest Hit Fund (HHF) Program, and decreased grant disbursements
between the HHF Program and Nonmajor Governmental Funds, partially offset by decreased grant
disbursements in the Rental Housing Support Program. There is no net position of two of the Authority’s
governmental activities recorded on the Authority’s financial statements. The equity of the Illinois Affordable
Housing Trust Fund (Housing Program) is recorded as due to the State of Illinois. All revenues of the Rental
Housing Support Program Fund are ultimately disbursed as grant or administrative expenses, and therefore no
net position is recorded on the Authority’s financial statements.
Total net program loans receivable (current and noncurrent), increased by $26.2 million, or 4.2%, to
$653.9 million, attributable to increases in the Federal HOME Program Fund ($19.2 million), the Illinois
Affordable Housing Trust Fund ($4.8 million) and the Non-Major Funds ($3.4 million), offset by decreases in the
HHF Program ($1.2 million). Cash and investments increased by $73.4 million, or 47.9%, attributable to
increases in the Illinois Affordable Housing Trust Fund ($30.1 million), the Rental Housing Support Program Fund
($3.5 million), HOME Program Fund ($2.4 million) and HHF Program ($39.0 million), offset by decrease in
Nonmajor Governmental Funds ($1.6 million). State statute and federal regulations restrict the use of the
governmental funds to program activities.
Due to the State of Illinois (current and noncurrent) increased $33.7 million. This item reflects a liability for the
State of Illinois’ interest in the equity of the Housing Program as the Authority acts only as the administrator of
the Housing Program and accounts for the interest in the equity to be that of the State of Illinois.
ILLINOIS HOUSING DEVELOPMENT AUTHORITY
(A Component Unit of the State of Illinois)
Management’s Discussion and Analysis
June 30, 2019
(Unaudited)
11 (Continued)
Business-type Activities
Net position of the Authority’s business-type activities increased $69.8 million, or 9.9%, to $777.7 million. Net
program loans receivable (current and noncurrent) decreased $75.5 million, or 12.9%, to $511.8 million from
decreases in the Single-Family Program Fund ($23.8 million), Mortgage Loan Program Fund ($43.7 million) and
Administrative Fund ($8.0 million) due to loan repayments exceeding loan originations. The decrease in program
loans receivable in the Single-Family Program Fund was due to Illinois whole loans being packaged into GNMA
certificates and MBSs.
Cash and investments (current and noncurrent) increased $403.7 million, or 30.6%, from increases in the
Mortgage Loan Program Fund ($33.7 million), Single Family Program Fund ($379.9) offset by a decrease in the
Administrative Fund ($9.9 million).
Total bonds and notes payable (current and noncurrent) increased $222.3 million, or 19.1%, from increases in
the Single-Family Program Fund ($320.4 million), offset by a decrease of ($57.8 million) in the Mortgage Loan
Program Fund and Administrative Fund ($40.3 million).
Deposits held in escrow increased $8.0 million, or 5.7% due to higher required funding levels.
Bank note cash collateral decreased $15 million and represents amounts held on behalf of the purchaser of
Authority issued short-term tax-exempt direct bank notes. The Authority repaid $21.5 million of outstanding
collateral notes and issued $6.5 million during the fiscal year.
Restricted net position of the Authority’s business-type activities increased $53.7 million, or 11.3%, of which
$55.7 million were from net increases within the Authority’s Mortgage Loan Program Fund and Single-Family
Program Fund (Bond Funds). The net position of the Authority’s Bond Funds is classified as restricted, except for
a $3.1 million net position invested in capital assets within the Mortgage Loan Program Fund. The remaining
restricted increases in net position were from the FAF program, earnings of which are recorded in the Authority’s
Administrative Fund.
Statement of Activities
The statement of activities shows the sources of the Authority’s changes in net position as they arise through its
various programs and functions.
The governmental activities consist of programs recorded in four major governmental funds: the Illinois
Affordable Housing Trust Fund, the HOME Program Fund, the Rental Housing Support Program Fund and the
Hardest Hit Fund. Other programs are recorded in Nonmajor Governmental Funds and consist of the Foreclosure
Prevention Program Fund, the Community Development Block Grant Fund, the American Recovery and
Reinvestment Act (ARRA) Fund, the Foreclosure Prevention Graduated Program Fund, the Build Illinois Bond
Program Fund, the Neighborhood Stabilization Program Fund, the Abandoned Property Program Fund, the
National Housing Trust Fund and the Section 811 Project Rental Assistance Demonstration Program Fund.
ILLINOIS HOUSING DEVELOPMENT AUTHORITY
(A Component Unit of the State of Illinois)
Management’s Discussion and Analysis
June 30, 2019
(Unaudited)
12 (Continued)
The business-type activities consist of two housing lending programs, the results of which are primarily recorded
within the funds comprising the two major bond funds (the Mortgage Loan Program Fund and the Single Family
Program Fund), Nonmajor Proprietary Fund - IHDA Dispositions LLC, which maintains and operates rental
properties until such time as disposition occurs, and programs recorded in the Authority’s Administrative Fund,
which include federal assistance activities that involve the allocation of various federal subsidy funds directly to
certain of the Authority’s borrowers, tax credit authorization and monitoring, and the Financial Adjustment Factor
(FAF) lending program.
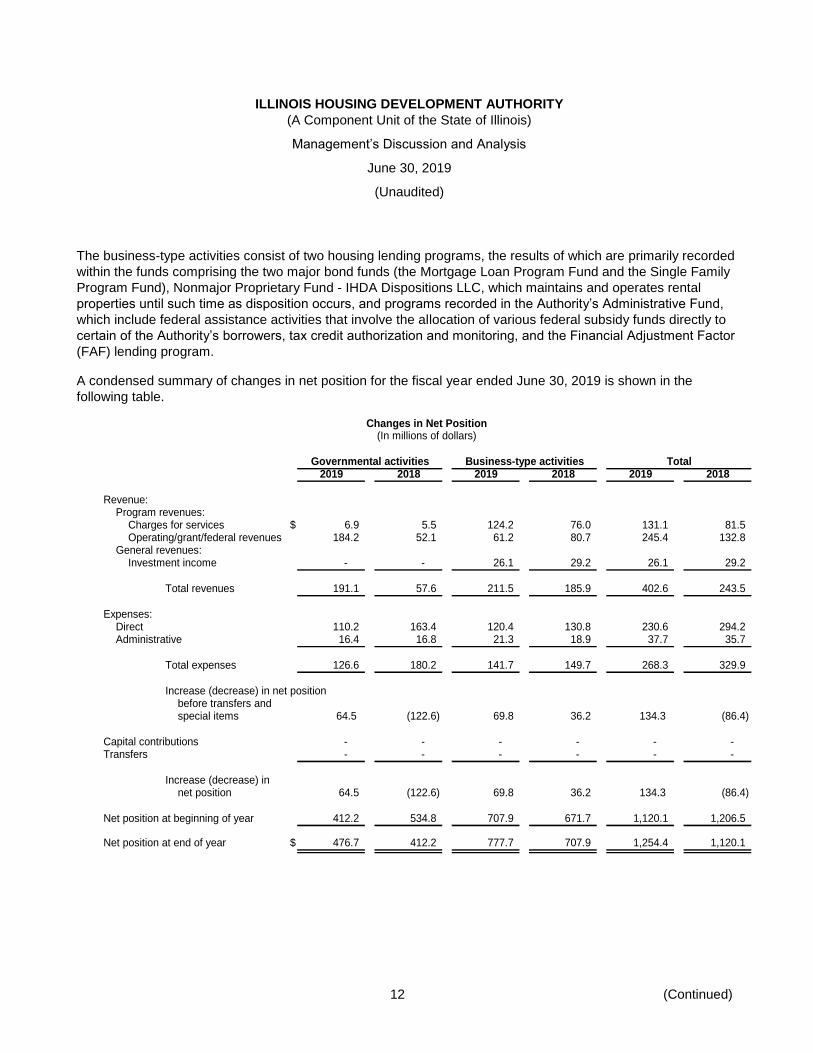
A condensed summary of changes in net position for the fiscal year ended June 30, 2019 is shown in the
following table.
Changes in Net Position(In millions of dollars)
Governmental activities Business-type activities Total2019 2018 2019 2018 2019 2018
Revenue:Program revenues:
Charges for services $ 6.9 5.5 124.2 76.0 131.1 81.5Operating/grant/federal revenues 184.2 52.1 61.2 80.7 245.4 132.8
General revenues:Investment income - - 26.1 29.2 26.1 29.2
Total revenues 191.1 57.6 211.5 185.9 402.6 243.5
Expenses:Direct 110.2 163.4 120.4 130.8 230.6 294.2Administrative 16.4 16.8 21.3 18.9 37.7 35.7
Total expenses 126.6 180.2 141.7 149.7 268.3 329.9
Increase (decrease) in net positionbefore transfers andspecial items 64.5 (122.6) 69.8 36.2 134.3 (86.4)
Capital contributions - - - - - - Transfers - - - - - -
Increase (decrease) innet position 64.5 (122.6) 69.8 36.2 134.3 (86.4)
Net position at beginning of year 412.2 534.8 707.9 671.7 1,120.1 1,206.5
Net position at end of year $ 476.7 412.2 777.7 707.9 1,254.4 1,120.1
ILLINOIS HOUSING DEVELOPMENT AUTHORITY
(A Component Unit of the State of Illinois)
Management’s Discussion and Analysis
June 30, 2019
(Unaudited)
13 (Continued)
Governmental Activities
Revenues of the Authority’s governmental activities increased $133.5 million from the prior year, primarily due to
increases in HHF ($127.8 million), HOME Program Fund ($14.7 million) and offset by decreases in Rental
Housing Support Program Fund ($7.4 million) and in Nonmajor Governmental Funds ($2.9 million).
Direct expenses of the Authority’s governmental activities decreased $53.2 million from the prior year, primarily
due to decreases in HHF ($25.2 million), Nonmajor Governmental Funds ($4.3 million), the HOME program Fund
($17.4 million), and the Rental Housing Support Program Fund ($7.7 million), offset by increases in the Illinois
Affordable Housing Trust Fund ($0.5 million). Administrative expenses decreased $0.4 million.
Business-Type Activities
Revenues of the Authority’s business-type activities increased $25.6 million from the prior year from increases in
charges for services ($48.1 million), lower operating grant/federal revenues ($19.5 million) and lower investment
income ($3.0 million). Charges for services mainly consist of interest income on program loans ($25.9 million),
program investment income ($62.5 million), servicing and development fees ($11.8 million), tax credit reservation
and monitoring fees ($6.4 million) and other income ($16.9 million). Program investment income is that income
earned within the Authority’s bond funds, the investments and income of which is restricted to those funds. Such
income increased by $54.3 million from the prior year due primarily to increase an in investments and in the fair
value of investments.
Direct expenses of the Authority’s business-type activities, which consist primarily of interest expense
($34.5 million) on Authority debt incurred to fund its various lending programs and the pass-through of federal
assistance programs’ funds ($60.7 million), decreased $10.4 million from the prior year, due mainly to lower
federal assistance ($19.3 million), lower provision for estimated losses on program loans receivable ($2.5
million), lower change in accrual for estimated losses on mortgage participation certificate program ($1.7 million),
partially offset by higher salaries and benefits ($2.7 million), financing costs ($3.1 million), program grants ($4.3
million), Mortgage Loan Program Fund and Single Family Program Fund financing costs ($1.3 million), other
general and administrative $0.8 million), professional fees ($0.6 million) and increased provision for estimated
losses on real estate held for sale ($0.1 million).
Program revenues of Multi-Family Mortgage Loan Programs exceeded direct expenses by $25.9 million (See the
Statement of Activities). The Authority’s business-type activities also generated $26.1 million of unrestricted
investment income, which was used primarily to fund and finance single family loans through the use of FNMA
MBSs and GNMA certificates, and to partially offset its administrative costs, and thus provided most of the
Authority’s increase in net position.
ILLINOIS HOUSING DEVELOPMENT AUTHORITY
(A Component Unit of the State of Illinois)
Management’s Discussion and Analysis
June 30, 2019
(Unaudited)
14 (Continued)
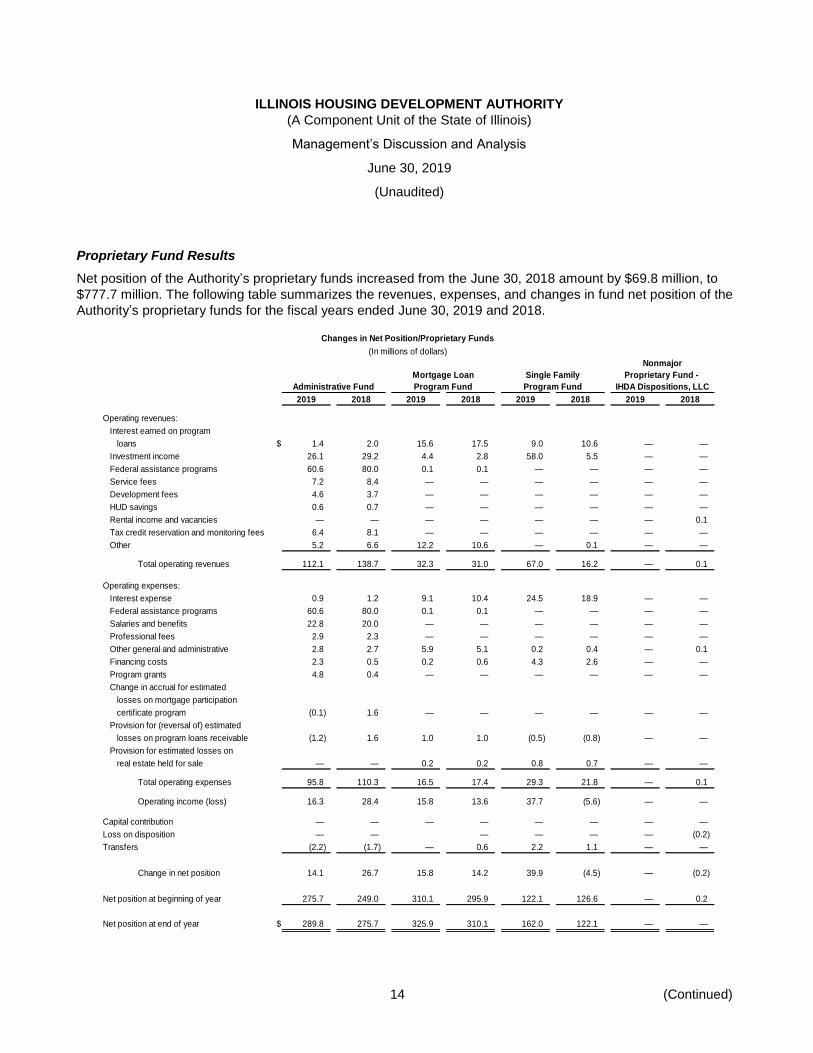
Proprietary Fund Results
Net position of the Authority’s proprietary funds increased from the June 30, 2018 amount by $69.8 million, to
$777.7 million. The following table summarizes the revenues, expenses, and changes in fund net position of the
Authority’s proprietary funds for the fiscal years ended June 30, 2019 and 2018.
Changes in Net Position/Proprietary Funds
(In millions of dollars)
Nonmajor
Mortgage Loan Single Family Proprietary Fund -
Administrative Fund Program Fund Program Fund IHDA Dispositions, LLC
2019 2018 2019 2018 2019 2018 2019 2018
Operating revenues:
Interest earned on program
loans $ 1.4 2.0 15.6 17.5 9.0 10.6 — —
Investment income 26.1 29.2 4.4 2.8 58.0 5.5 — —
Federal assistance programs 60.6 80.0 0.1 0.1 — — — —
Service fees 7.2 8.4 — — — — — —
Development fees 4.6 3.7 — — — — — —
HUD savings 0.6 0.7 — — — — — —
Rental income and vacancies — — — — — — — 0.1
Tax credit reservation and monitoring fees 6.4 8.1 — — — — — —
Other 5.2 6.6 12.2 10.6 — 0.1 — —
Total operating revenues 112.1 138.7 32.3 31.0 67.0 16.2 — 0.1
Operating expenses:
Interest expense 0.9 1.2 9.1 10.4 24.5 18.9 — —
Federal assistance programs 60.6 80.0 0.1 0.1 — — — —
Salaries and benefits 22.8 20.0 — — — — — —
Professional fees 2.9 2.3 — — — — — —
Other general and administrative 2.8 2.7 5.9 5.1 0.2 0.4 — 0.1
Financing costs 2.3 0.5 0.2 0.6 4.3 2.6 — —
Program grants 4.8 0.4 — — — — — —
Change in accrual for estimated
losses on mortgage participation
certificate program (0.1) 1.6 — — — — — —
Provision for (reversal of) estimated
losses on program loans receivable (1.2) 1.6 1.0 1.0 (0.5) (0.8) — —
Provision for estimated losses on
real estate held for sale — — 0.2 0.2 0.8 0.7 — —
Total operating expenses 95.8 110.3 16.5 17.4 29.3 21.8 — 0.1
Operating income (loss) 16.3 28.4 15.8 13.6 37.7 (5.6) — —
Capital contribution — — — — — — — —
Loss on disposition — — — — — — (0.2)
Transfers (2.2) (1.7) — 0.6 2.2 1.1 — —
Change in net position 14.1 26.7 15.8 14.2 39.9 (4.5) — (0.2)
Net position at beginning of year 275.7 249.0 310.1 295.9 122.1 126.6 — 0.2
Net position at end of year $ 289.8 275.7 325.9 310.1 162.0 122.1 — —
ILLINOIS HOUSING DEVELOPMENT AUTHORITY
(A Component Unit of the State of Illinois)
Management’s Discussion and Analysis
June 30, 2019
(Unaudited)
15 (Continued)
Net position of the Administrative Fund increased $14.1 million, compared to the prior year increase of
$26.7 million. Administrative Fund operating income was $16.3 million, a decrease of $12.1 million from the prior
year, and net transfers out were $2.2 million compared to $1.7 million in the prior year. The fiscal year 2019
decrease in operating earnings was primarily from decreases in investment income ($3.0 million), higher salaries
and benefits ($2.8 million), higher general and administrative expenses ($0.1 million) and decreased accrual for
estimated losses in the mortgage participation certificate program ($1.7 million), partially offset by lower fees and
other income ($3.7 million).
Net position of the Mortgage Loan Program Fund increased $15.8 million, compared to a prior year increase of
$14.2 million. Operating income was higher than the prior year ($2.3 million), mainly due to increased general
and administrative expenses ($0.9 million), lower interest expense ($1.3 million) and decreased financing costs
($0.3 million), partially offset by an increase in the provision for estimated losses on program loans receivable
($0.01 million).
Net position of the Single-Family Program Fund increased $39.9 million, compared to a prior year decrease of
$4.5 million. Operating income was $43.2 million higher than prior year, primarily due to higher investment
income ($52.5 million), lower other income ($0.1 million), decreased interest earned on program loans
($1.6 million) partially offset by higher interest expense ($5.6 million), an increase in provision for estimated
losses on real estate held for sale ($0.1 million) and higher financing costs ($1.7 million).
Net position of the Nonmajor Proprietary Fund - IHDA Dispositions LLC is $0, as the property was sold during the
fiscal year.
Authority Debt
Authority gross debt issuances during fiscal year 2019 totaled $1.5 billion with the issuance of Revenue Bonds
($280.3 million), premium on Revenue Bonds ($11.1 million), Homeowner Mortgage Revenue Bonds ($120.6
million), and premium on Homeowner Mortgage Revenue Bonds ($2.5 million) within the Single Family Program
Fund, and direct bank notes ($11.8 million) and Federal Home Loan Bank Advances ($1.0 billion) within the
Administrative Fund. Debt retirements within the Mortgage Loan Program, Single Family Program and
Administrative Funds were $57.8 million, $94.0 million and $1.1 billion, respectively. Total bonds and notes
payable increased $222.3 million. For additional information, see note 8, Bonds and Notes Payable in the Notes
to the Financial Statements.
As of July 1, 2018, the Authority’s Issuer Credit Ratings were A1 (Stable) by Moody’s Investors Service,
AA- (Stable) by Standard and Poor’s and AA- (Stable) by Fitch Ratings.
The Authority’s Issuer Credit Ratings by Moody’s Investors Service, Standard and Poor’s and Fitch Ratings
remain unchanged.
Economic Factors
During fiscal year 2019, tax-exempt bond rates were favorable for new issuance, which provided the Authority an
opportunity to issue fixed rate long-term bonds in the Single-Family Program in the amount of $400.9 million. The
Authority correspondingly issued variable-rate short-term notes in support of its Multifamily program in the amount
of $11.8 million.
ILLINOIS HOUSING DEVELOPMENT AUTHORITY
(A Component Unit of the State of Illinois)
Management’s Discussion and Analysis
June 30, 2019
(Unaudited)
16
Economic refunding of prior bonds was attractive as well due to historically low interest rates. The Authority
optionally redeemed and refunded $23.1 million of bonds issued under the Mortgage Loan Program Fund.
During fiscal year 2019, the Authority continued to finance its activity relating to homeownership in the State of
Illinois through the sale of mortgage-backed securities to the secondary market. The Authority uses forward
commitments to lock in the price of securities related to secondary market sales.
Contacting the Authority’s Financial Management
This financial report is designed to provide the citizens of Illinois, our constituents and investors with a general
overview of the Authority’s finances and to demonstrate the Authority’s financial accountability over its resources.
If you have questions about this report or need additional financial information, contact the Controller at the
Illinois Housing Development Authority, 111 E. Wacker Drive, Suite 1000, Chicago, IL 60601 or visit our web site
at: www.ihda.org.
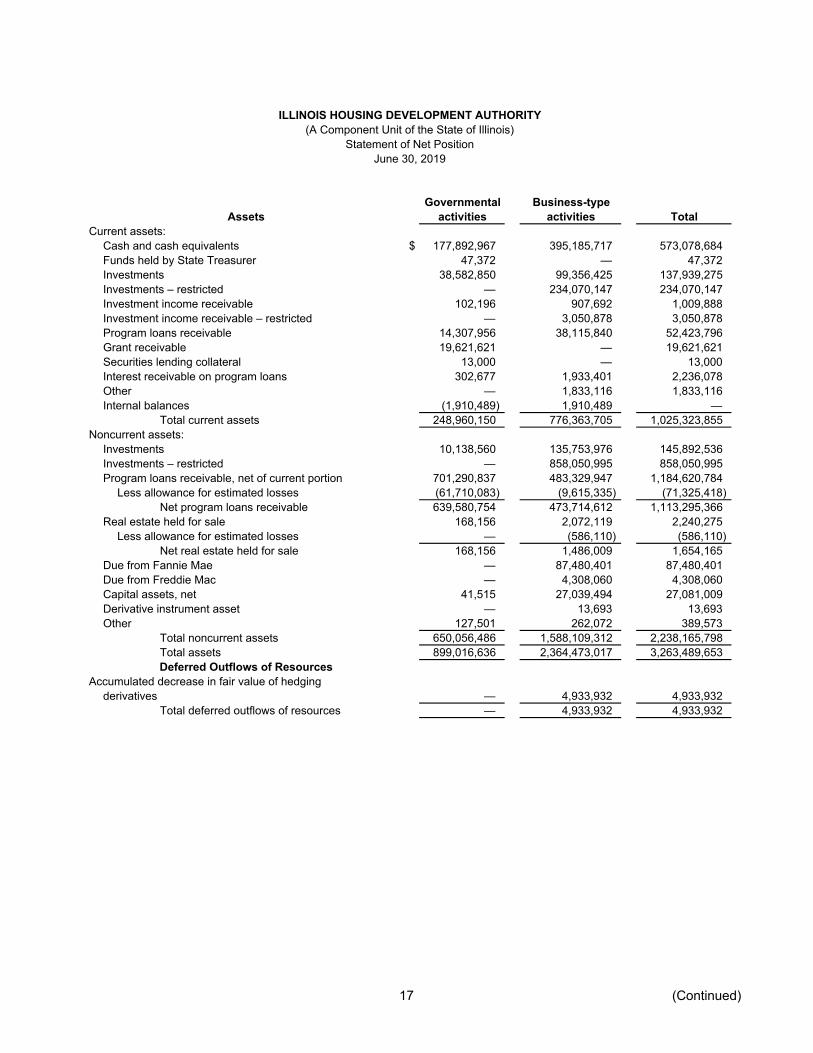
ILLINOIS HOUSING DEVELOPMENT AUTHORITY(A Component Unit of the State of Illinois)
Statement of Net PositionJune 30, 2019
Governmental Business-typeAssets activities activities Total
Current assets:Cash and cash equivalents $ 177,892,967 395,185,717 573,078,684 Funds held by State Treasurer 47,372 — 47,372 Investments 38,582,850 99,356,425 137,939,275 Investments – restricted — 234,070,147 234,070,147 Investment income receivable 102,196 907,692 1,009,888 Investment income receivable – restricted — 3,050,878 3,050,878 Program loans receivable 14,307,956 38,115,840 52,423,796 Grant receivable 19,621,621 — 19,621,621 Securities lending collateral 13,000 — 13,000 Interest receivable on program loans 302,677 1,933,401 2,236,078 Other — 1,833,116 1,833,116 Internal balances (1,910,489) 1,910,489 —
Total current assets 248,960,150 776,363,705 1,025,323,855 Noncurrent assets:
Investments 10,138,560 135,753,976 145,892,536 Investments – restricted — 858,050,995 858,050,995 Program loans receivable, net of current portion 701,290,837 483,329,947 1,184,620,784
Less allowance for estimated losses (61,710,083) (9,615,335) (71,325,418) Net program loans receivable 639,580,754 473,714,612 1,113,295,366
Real estate held for sale 168,156 2,072,119 2,240,275 Less allowance for estimated losses — (586,110) (586,110)
Net real estate held for sale 168,156 1,486,009 1,654,165 Due from Fannie Mae — 87,480,401 87,480,401 Due from Freddie Mac — 4,308,060 4,308,060 Capital assets, net 41,515 27,039,494 27,081,009 Derivative instrument asset — 13,693 13,693 Other 127,501 262,072 389,573
Total noncurrent assets 650,056,486 1,588,109,312 2,238,165,798 Total assets 899,016,636 2,364,473,017 3,263,489,653 Deferred Outflows of Resources
Accumulated decrease in fair value of hedgingderivatives — 4,933,932 4,933,932
Total deferred outflows of resources — 4,933,932 4,933,932
17 (Continued)
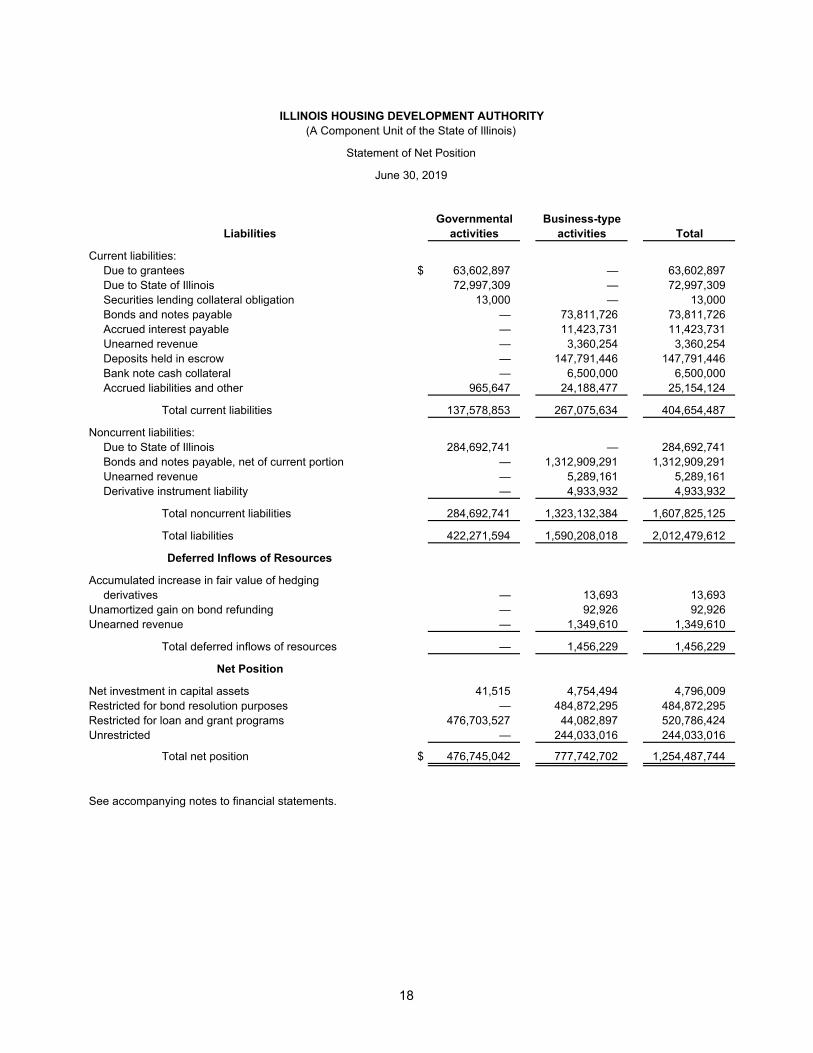
ILLINOIS HOUSING DEVELOPMENT AUTHORITY(A Component Unit of the State of Illinois)
Statement of Net Position
June 30, 2019
Governmental Business-typeLiabilities activities activities Total
Current liabilities:Due to grantees $ 63,602,897 — 63,602,897 Due to State of Illinois 72,997,309 — 72,997,309 Securities lending collateral obligation 13,000 — 13,000 Bonds and notes payable — 73,811,726 73,811,726 Accrued interest payable — 11,423,731 11,423,731 Unearned revenue — 3,360,254 3,360,254 Deposits held in escrow — 147,791,446 147,791,446 Bank note cash collateral — 6,500,000 6,500,000 Accrued liabilities and other 965,647 24,188,477 25,154,124
Total current liabilities 137,578,853 267,075,634 404,654,487
Noncurrent liabilities:Due to State of Illinois 284,692,741 — 284,692,741 Bonds and notes payable, net of current portion — 1,312,909,291 1,312,909,291 Unearned revenue — 5,289,161 5,289,161 Derivative instrument liability — 4,933,932 4,933,932
Total noncurrent liabilities 284,692,741 1,323,132,384 1,607,825,125
Total liabilities 422,271,594 1,590,208,018 2,012,479,612
Deferred Inflows of Resources
Accumulated increase in fair value of hedgingderivatives — 13,693 13,693
Unamortized gain on bond refunding — 92,926 92,926 Unearned revenue — 1,349,610 1,349,610
Total deferred inflows of resources — 1,456,229 1,456,229
Net Position
Net investment in capital assets 41,515 4,754,494 4,796,009 Restricted for bond resolution purposes — 484,872,295 484,872,295 Restricted for loan and grant programs 476,703,527 44,082,897 520,786,424 Unrestricted — 244,033,016 244,033,016
Total net position $ 476,745,042 777,742,702 1,254,487,744
See accompanying notes to financial statements.
18
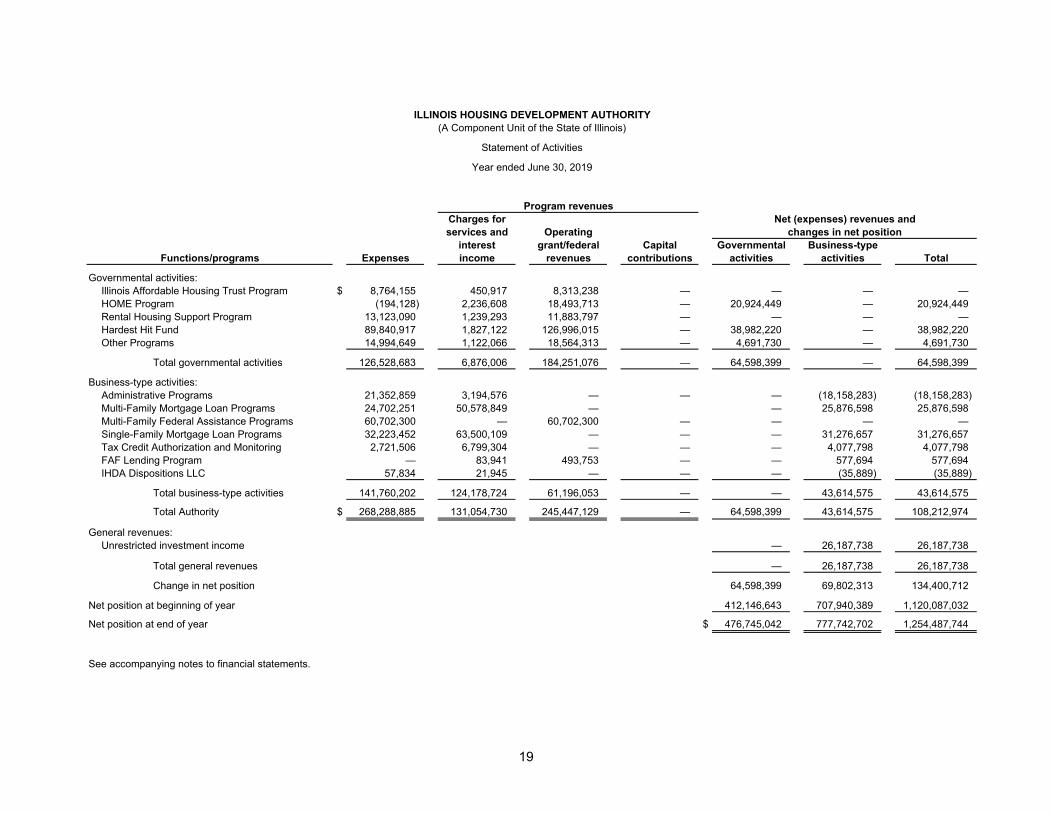
ILLINOIS HOUSING DEVELOPMENT AUTHORITY(A Component Unit of the State of Illinois)
Statement of Activities
Year ended June 30, 2019
Program revenuesCharges for Net (expenses) revenues andservices and Operating changes in net position
interest grant/federal Capital Governmental Business-typeFunctions/programs Expenses income revenues contributions activities activities Total
Governmental activities:Illinois Affordable Housing Trust Program $ 8,764,155 450,917 8,313,238 — — — — HOME Program (194,128) 2,236,608 18,493,713 — 20,924,449 — 20,924,449 Rental Housing Support Program 13,123,090 1,239,293 11,883,797 — — — — Hardest Hit Fund 89,840,917 1,827,122 126,996,015 — 38,982,220 — 38,982,220 Other Programs 14,994,649 1,122,066 18,564,313 — 4,691,730 — 4,691,730
Total governmental activities 126,528,683 6,876,006 184,251,076 — 64,598,399 — 64,598,399
Business-type activities:Administrative Programs 21,352,859 3,194,576 — — — (18,158,283) (18,158,283) Multi-Family Mortgage Loan Programs 24,702,251 50,578,849 — — 25,876,598 25,876,598 Multi-Family Federal Assistance Programs 60,702,300 — 60,702,300 — — — — Single-Family Mortgage Loan Programs 32,223,452 63,500,109 — — — 31,276,657 31,276,657 Tax Credit Authorization and Monitoring 2,721,506 6,799,304 — — — 4,077,798 4,077,798 FAF Lending Program — 83,941 493,753 — — 577,694 577,694 IHDA Dispositions LLC 57,834 21,945 — — — (35,889) (35,889)
Total business-type activities 141,760,202 124,178,724 61,196,053 — — 43,614,575 43,614,575
Total Authority $ 268,288,885 131,054,730 245,447,129 — 64,598,399 43,614,575 108,212,974
General revenues:Unrestricted investment income — 26,187,738 26,187,738
Total general revenues — 26,187,738 26,187,738
Change in net position 64,598,399 69,802,313 134,400,712
Net position at beginning of year 412,146,643 707,940,389 1,120,087,032
Net position at end of year $ 476,745,042 777,742,702 1,254,487,744
See accompanying notes to financial statements.
19
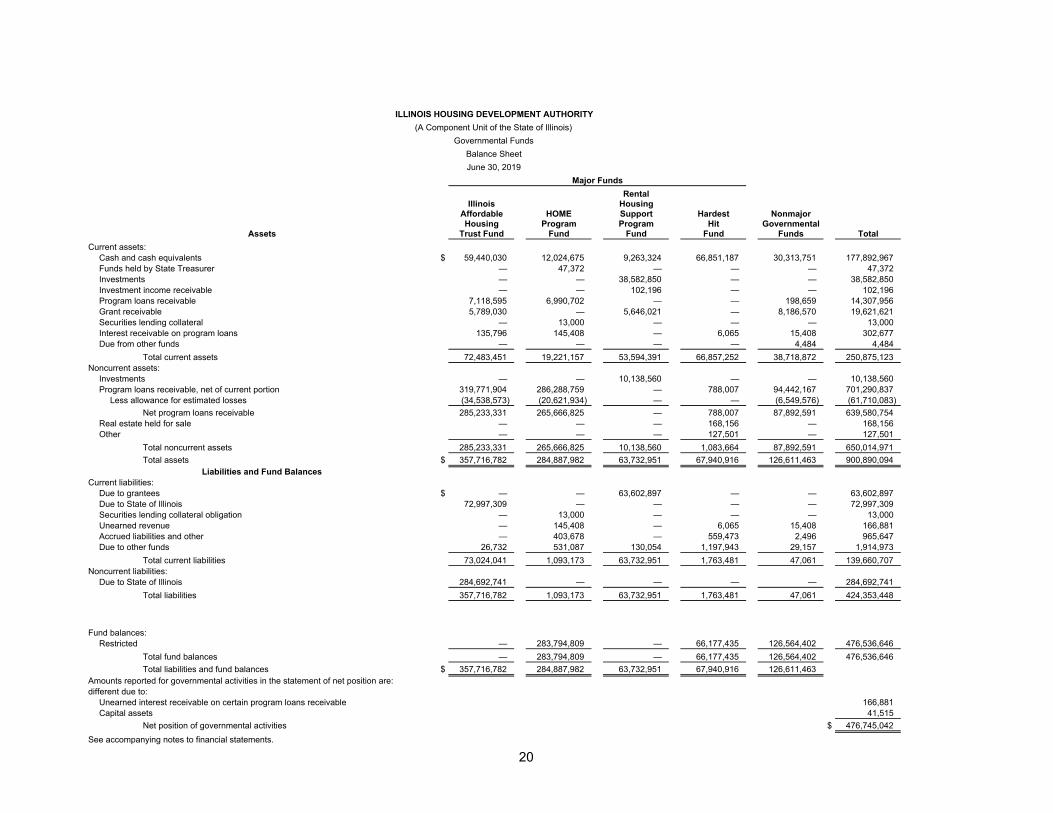
ILLINOIS HOUSING DEVELOPMENT AUTHORITY(A Component Unit of the State of Illinois)
Governmental FundsBalance SheetJune 30, 2019
Major FundsRental
Illinois HousingAffordable HOME Support Hardest NonmajorHousing Program Program Hit Governmental
Assets Trust Fund Fund Fund Fund Funds TotalCurrent assets:
Cash and cash equivalents $ 59,440,030 12,024,675 9,263,324 66,851,187 30,313,751 177,892,967 Funds held by State Treasurer — 47,372 — — — 47,372 Investments — — 38,582,850 — — 38,582,850 Investment income receivable — — 102,196 — — 102,196 Program loans receivable 7,118,595 6,990,702 — — 198,659 14,307,956 Grant receivable 5,789,030 — 5,646,021 — 8,186,570 19,621,621 Securities lending collateral — 13,000 — — — 13,000 Interest receivable on program loans 135,796 145,408 — 6,065 15,408 302,677 Due from other funds — — — — 4,484 4,484
Total current assets 72,483,451 19,221,157 53,594,391 66,857,252 38,718,872 250,875,123 Noncurrent assets:
Investments — — 10,138,560 — — 10,138,560 Program loans receivable, net of current portion 319,771,904 286,288,759 — 788,007 94,442,167 701,290,837
Less allowance for estimated losses (34,538,573) (20,621,934) — — (6,549,576) (61,710,083) Net program loans receivable 285,233,331 265,666,825 — 788,007 87,892,591 639,580,754
Real estate held for sale — — — 168,156 — 168,156 Other — — — 127,501 — 127,501
Total noncurrent assets 285,233,331 265,666,825 10,138,560 1,083,664 87,892,591 650,014,971 Total assets $ 357,716,782 284,887,982 63,732,951 67,940,916 126,611,463 900,890,094
Liabilities and Fund BalancesCurrent liabilities:
Due to grantees $ — — 63,602,897 — — 63,602,897 Due to State of Illinois 72,997,309 — — — — 72,997,309 Securities lending collateral obligation — 13,000 — — — 13,000 Unearned revenue — 145,408 — 6,065 15,408 166,881 Accrued liabilities and other — 403,678 — 559,473 2,496 965,647 Due to other funds 26,732 531,087 130,054 1,197,943 29,157 1,914,973
Total current liabilities 73,024,041 1,093,173 63,732,951 1,763,481 47,061 139,660,707 Noncurrent liabilities:
Due to State of Illinois 284,692,741 — — — — 284,692,741 Total liabilities 357,716,782 1,093,173 63,732,951 1,763,481 47,061 424,353,448
Fund balances:Restricted — 283,794,809 — 66,177,435 126,564,402 476,536,646
Total fund balances — 283,794,809 — 66,177,435 126,564,402 476,536,646 Total liabilities and fund balances $ 357,716,782 284,887,982 63,732,951 67,940,916 126,611,463
Amounts reported for governmental activities in the statement of net position are:different due to:
Unearned interest receivable on certain program loans receivable 166,881 Capital assets 41,515
Net position of governmental activities $ 476,745,042 See accompanying notes to financial statements.
20
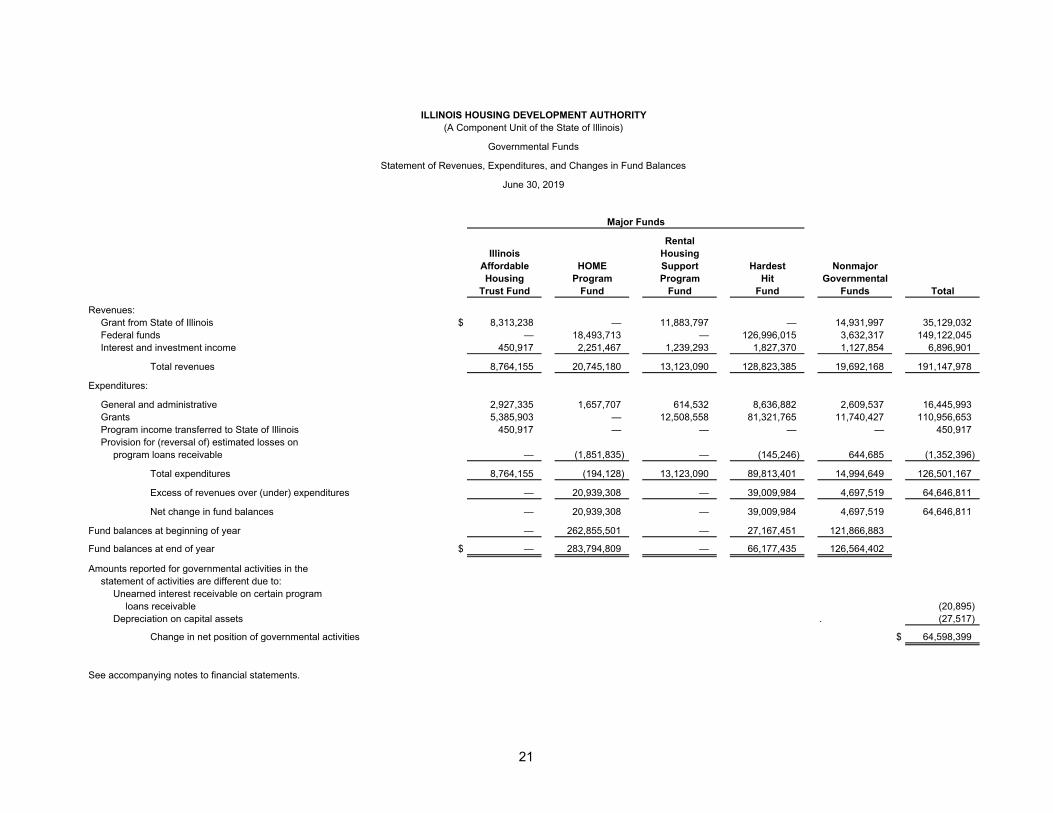
ILLINOIS HOUSING DEVELOPMENT AUTHORITY(A Component Unit of the State of Illinois)
Governmental Funds
Statement of Revenues, Expenditures, and Changes in Fund Balances
June 30, 2019
Major Funds
RentalIllinois Housing
Affordable HOME Support Hardest NonmajorHousing Program Program Hit Governmental
Trust Fund Fund Fund Fund Funds Total
Revenues:Grant from State of Illinois $ 8,313,238 — 11,883,797 — 14,931,997 35,129,032 Federal funds — 18,493,713 — 126,996,015 3,632,317 149,122,045 Interest and investment income 450,917 2,251,467 1,239,293 1,827,370 1,127,854 6,896,901
Total revenues 8,764,155 20,745,180 13,123,090 128,823,385 19,692,168 191,147,978
Expenditures:
General and administrative 2,927,335 1,657,707 614,532 8,636,882 2,609,537 16,445,993 Grants 5,385,903 — 12,508,558 81,321,765 11,740,427 110,956,653 Program income transferred to State of Illinois 450,917 — — — — 450,917 Provision for (reversal of) estimated losses on
program loans receivable — (1,851,835) — (145,246) 644,685 (1,352,396)
Total expenditures 8,764,155 (194,128) 13,123,090 89,813,401 14,994,649 126,501,167
Excess of revenues over (under) expenditures — 20,939,308 — 39,009,984 4,697,519 64,646,811
Net change in fund balances — 20,939,308 — 39,009,984 4,697,519 64,646,811
Fund balances at beginning of year — 262,855,501 — 27,167,451 121,866,883
Fund balances at end of year $ — 283,794,809 — 66,177,435 126,564,402
Amounts reported for governmental activities in thestatement of activities are different due to:
Unearned interest receivable on certain programloans receivable (20,895)
Depreciation on capital assets . (27,517)
Change in net position of governmental activities $ 64,598,399
See accompanying notes to financial statements.
21
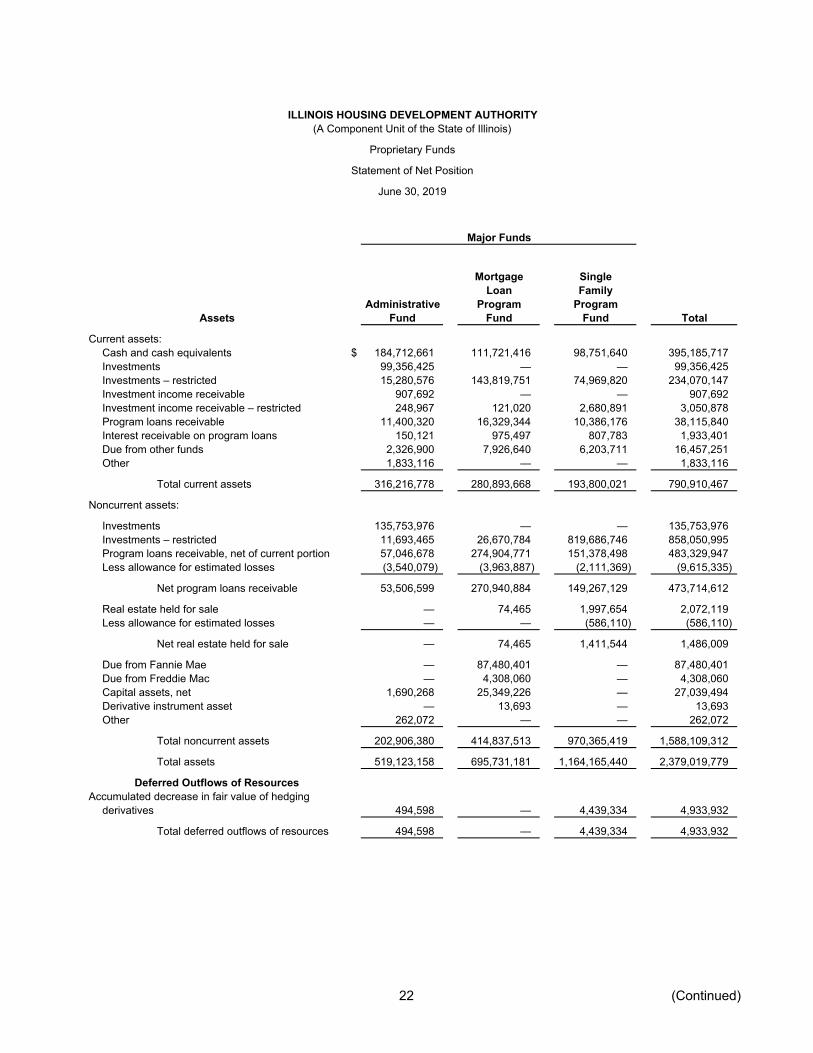
ILLINOIS HOUSING DEVELOPMENT AUTHORITY(A Component Unit of the State of Illinois)
Proprietary Funds
Statement of Net Position
June 30, 2019
Major Funds
Mortgage SingleLoan Family
Administrative Program ProgramAssets Fund Fund Fund Total
Current assets:Cash and cash equivalents $ 184,712,661 111,721,416 98,751,640 395,185,717 Investments 99,356,425 — — 99,356,425 Investments – restricted 15,280,576 143,819,751 74,969,820 234,070,147 Investment income receivable 907,692 — — 907,692 Investment income receivable – restricted 248,967 121,020 2,680,891 3,050,878 Program loans receivable 11,400,320 16,329,344 10,386,176 38,115,840 Interest receivable on program loans 150,121 975,497 807,783 1,933,401 Due from other funds 2,326,900 7,926,640 6,203,711 16,457,251 Other 1,833,116 — — 1,833,116
Total current assets 316,216,778 280,893,668 193,800,021 790,910,467
Noncurrent assets:
Investments 135,753,976 — — 135,753,976 Investments – restricted 11,693,465 26,670,784 819,686,746 858,050,995 Program loans receivable, net of current portion 57,046,678 274,904,771 151,378,498 483,329,947 Less allowance for estimated losses (3,540,079) (3,963,887) (2,111,369) (9,615,335)
Net program loans receivable 53,506,599 270,940,884 149,267,129 473,714,612
Real estate held for sale — 74,465 1,997,654 2,072,119 Less allowance for estimated losses — — (586,110) (586,110)
Net real estate held for sale — 74,465 1,411,544 1,486,009
Due from Fannie Mae — 87,480,401 — 87,480,401 Due from Freddie Mac — 4,308,060 — 4,308,060 Capital assets, net 1,690,268 25,349,226 — 27,039,494 Derivative instrument asset — 13,693 — 13,693 Other 262,072 — — 262,072
Total noncurrent assets 202,906,380 414,837,513 970,365,419 1,588,109,312
Total assets 519,123,158 695,731,181 1,164,165,440 2,379,019,779
Deferred Outflows of ResourcesAccumulated decrease in fair value of hedging
derivatives 494,598 — 4,439,334 4,933,932
Total deferred outflows of resources 494,598 — 4,439,334 4,933,932
22 (Continued)
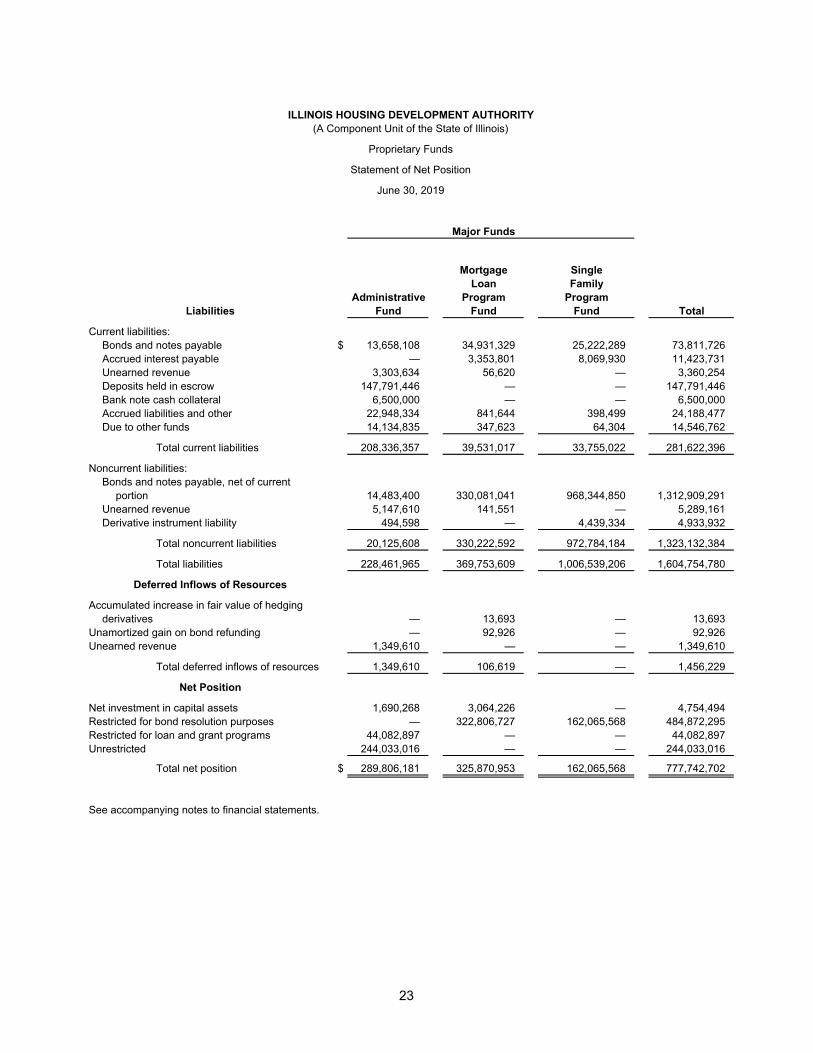
ILLINOIS HOUSING DEVELOPMENT AUTHORITY(A Component Unit of the State of Illinois)
Proprietary Funds
Statement of Net Position
June 30, 2019
Major Funds
Mortgage SingleLoan Family
Administrative Program ProgramLiabilities Fund Fund Fund Total
Current liabilities:Bonds and notes payable $ 13,658,108 34,931,329 25,222,289 73,811,726 Accrued interest payable — 3,353,801 8,069,930 11,423,731 Unearned revenue 3,303,634 56,620 — 3,360,254 Deposits held in escrow 147,791,446 — — 147,791,446 Bank note cash collateral 6,500,000 — — 6,500,000 Accrued liabilities and other 22,948,334 841,644 398,499 24,188,477 Due to other funds 14,134,835 347,623 64,304 14,546,762
Total current liabilities 208,336,357 39,531,017 33,755,022 281,622,396
Noncurrent liabilities:Bonds and notes payable, net of current
portion 14,483,400 330,081,041 968,344,850 1,312,909,291 Unearned revenue 5,147,610 141,551 — 5,289,161 Derivative instrument liability 494,598 — 4,439,334 4,933,932
Total noncurrent liabilities 20,125,608 330,222,592 972,784,184 1,323,132,384
Total liabilities 228,461,965 369,753,609 1,006,539,206 1,604,754,780
Deferred Inflows of Resources
Accumulated increase in fair value of hedgingderivatives — 13,693 — 13,693
Unamortized gain on bond refunding — 92,926 — 92,926 Unearned revenue 1,349,610 — — 1,349,610
Total deferred inflows of resources 1,349,610 106,619 — 1,456,229
Net Position
Net investment in capital assets 1,690,268 3,064,226 — 4,754,494 Restricted for bond resolution purposes — 322,806,727 162,065,568 484,872,295 Restricted for loan and grant programs 44,082,897 — — 44,082,897 Unrestricted 244,033,016 — — 244,033,016
Total net position $ 289,806,181 325,870,953 162,065,568 777,742,702
See accompanying notes to financial statements.
23
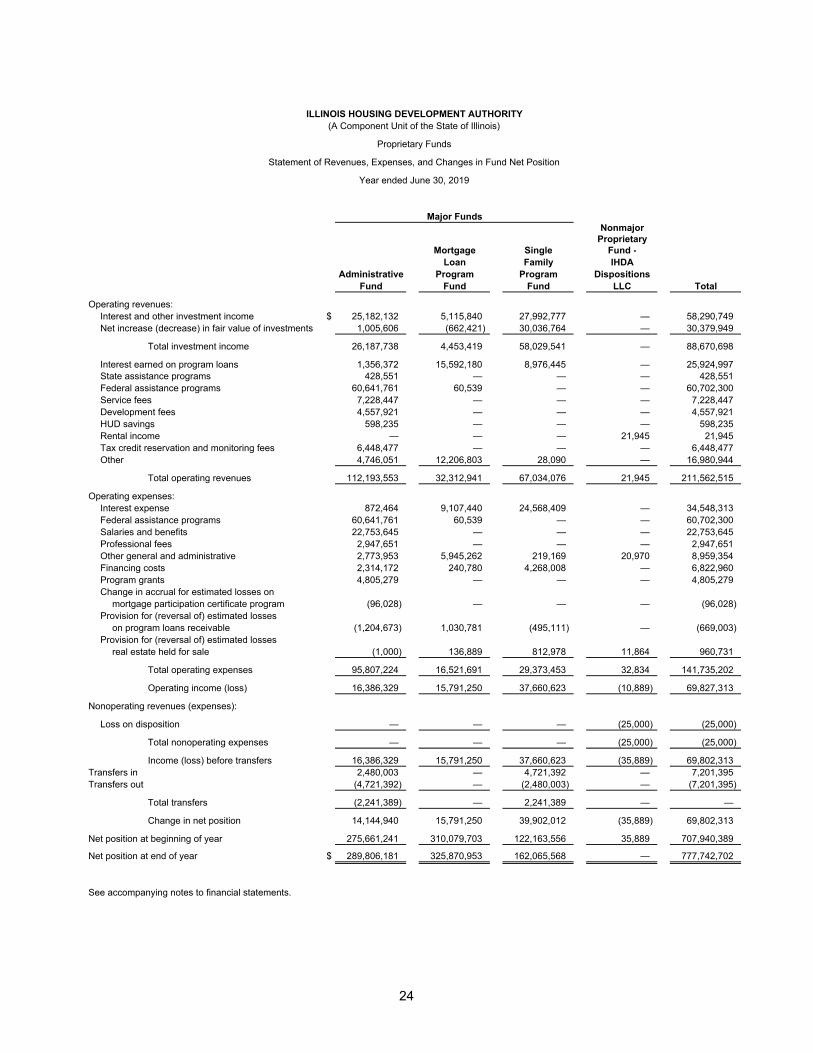
ILLINOIS HOUSING DEVELOPMENT AUTHORITY(A Component Unit of the State of Illinois)
Proprietary Funds
Statement of Revenues, Expenses, and Changes in Fund Net Position
Year ended June 30, 2019
Major FundsNonmajor
ProprietaryMortgage Single Fund -
Loan Family IHDAAdministrative Program Program Dispositions
Fund Fund Fund LLC Total
Operating revenues:Interest and other investment income $ 25,182,132 5,115,840 27,992,777 — 58,290,749 Net increase (decrease) in fair value of investments 1,005,606 (662,421) 30,036,764 — 30,379,949
Total investment income 26,187,738 4,453,419 58,029,541 — 88,670,698
Interest earned on program loans 1,356,372 15,592,180 8,976,445 — 25,924,997 State assistance programs 428,551 — — — 428,551 Federal assistance programs 60,641,761 60,539 — — 60,702,300 Service fees 7,228,447 — — — 7,228,447 Development fees 4,557,921 — — — 4,557,921 HUD savings 598,235 — — — 598,235 Rental income — — — 21,945 21,945 Tax credit reservation and monitoring fees 6,448,477 — — — 6,448,477 Other 4,746,051 12,206,803 28,090 — 16,980,944
Total operating revenues 112,193,553 32,312,941 67,034,076 21,945 211,562,515
Operating expenses:Interest expense 872,464 9,107,440 24,568,409 — 34,548,313 Federal assistance programs 60,641,761 60,539 — — 60,702,300 Salaries and benefits 22,753,645 — — — 22,753,645 Professional fees 2,947,651 — — — 2,947,651 Other general and administrative 2,773,953 5,945,262 219,169 20,970 8,959,354 Financing costs 2,314,172 240,780 4,268,008 — 6,822,960 Program grants 4,805,279 — — — 4,805,279 Change in accrual for estimated losses on
mortgage participation certificate program (96,028) — — — (96,028) Provision for (reversal of) estimated losses
on program loans receivable (1,204,673) 1,030,781 (495,111) — (669,003) Provision for (reversal of) estimated losses
real estate held for sale (1,000) 136,889 812,978 11,864 960,731
Total operating expenses 95,807,224 16,521,691 29,373,453 32,834 141,735,202
Operating income (loss) 16,386,329 15,791,250 37,660,623 (10,889) 69,827,313
Nonoperating revenues (expenses):
Loss on disposition — — — (25,000) (25,000)
Total nonoperating expenses — — — (25,000) (25,000)
Income (loss) before transfers 16,386,329 15,791,250 37,660,623 (35,889) 69,802,313 Transfers in 2,480,003 — 4,721,392 — 7,201,395 Transfers out (4,721,392) — (2,480,003) — (7,201,395)
Total transfers (2,241,389) — 2,241,389 — —
Change in net position 14,144,940 15,791,250 39,902,012 (35,889) 69,802,313
Net position at beginning of year 275,661,241 310,079,703 122,163,556 35,889 707,940,389
Net position at end of year $ 289,806,181 325,870,953 162,065,568 — 777,742,702
See accompanying notes to financial statements.
24
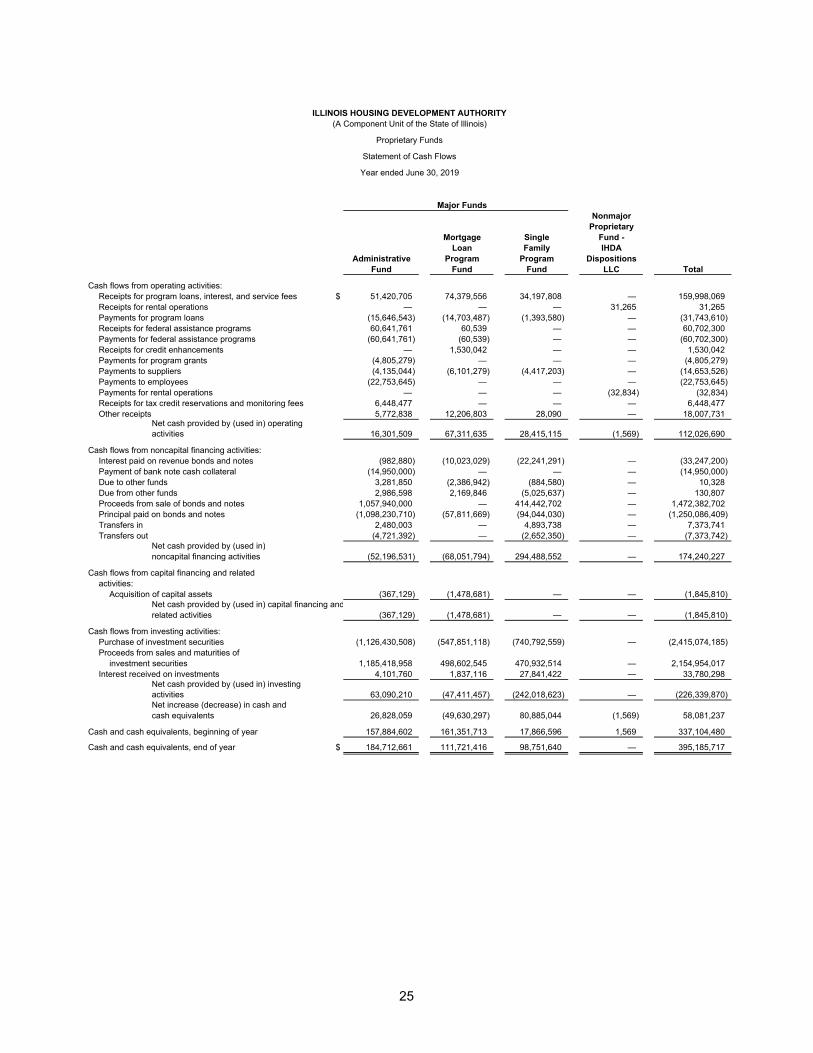
ILLINOIS HOUSING DEVELOPMENT AUTHORITY(A Component Unit of the State of Illinois)
Proprietary Funds
Statement of Cash Flows
Year ended June 30, 2019
Major FundsNonmajor
ProprietaryMortgage Single Fund -
Loan Family IHDAAdministrative Program Program Dispositions
Fund Fund Fund LLC Total
Cash flows from operating activities:Receipts for program loans, interest, and service fees $ 51,420,705 74,379,556 34,197,808 — 159,998,069 Receipts for rental operations — — — 31,265 31,265 Payments for program loans (15,646,543) (14,703,487) (1,393,580) — (31,743,610) Receipts for federal assistance programs 60,641,761 60,539 — — 60,702,300 Payments for federal assistance programs (60,641,761) (60,539) — — (60,702,300) Receipts for credit enhancements — 1,530,042 — — 1,530,042 Payments for program grants (4,805,279) — — — (4,805,279) Payments to suppliers (4,135,044) (6,101,279) (4,417,203) — (14,653,526) Payments to employees (22,753,645) — — — (22,753,645) Payments for rental operations — — — (32,834) (32,834) Receipts for tax credit reservations and monitoring fees 6,448,477 — — — 6,448,477 Other receipts 5,772,838 12,206,803 28,090 — 18,007,731
Net cash provided by (used in) operating activities 16,301,509 67,311,635 28,415,115 (1,569) 112,026,690
Cash flows from noncapital financing activities:Interest paid on revenue bonds and notes (982,880) (10,023,029) (22,241,291) — (33,247,200) Payment of bank note cash collateral (14,950,000) — — — (14,950,000) Due to other funds 3,281,850 (2,386,942) (884,580) — 10,328 Due from other funds 2,986,598 2,169,846 (5,025,637) — 130,807 Proceeds from sale of bonds and notes 1,057,940,000 — 414,442,702 — 1,472,382,702 Principal paid on bonds and notes (1,098,230,710) (57,811,669) (94,044,030) — (1,250,086,409) Transfers in 2,480,003 — 4,893,738 — 7,373,741 Transfers out (4,721,392) — (2,652,350) — (7,373,742)
Net cash provided by (used in)noncapital financing activities (52,196,531) (68,051,794) 294,488,552 — 174,240,227
Cash flows from capital financing and relatedactivities:
Acquisition of capital assets (367,129) (1,478,681) — — (1,845,810) Net cash provided by (used in) capital financing andrelated activities (367,129) (1,478,681) — — (1,845,810)
Cash flows from investing activities:Purchase of investment securities (1,126,430,508) (547,851,118) (740,792,559) — (2,415,074,185) Proceeds from sales and maturities of
investment securities 1,185,418,958 498,602,545 470,932,514 — 2,154,954,017 Interest received on investments 4,101,760 1,837,116 27,841,422 — 33,780,298
Net cash provided by (used in) investing activities 63,090,210 (47,411,457) (242,018,623) — (226,339,870) Net increase (decrease) in cash andcash equivalents 26,828,059 (49,630,297) 80,885,044 (1,569) 58,081,237
Cash and cash equivalents, beginning of year 157,884,602 161,351,713 17,866,596 1,569 337,104,480
Cash and cash equivalents, end of year $ 184,712,661 111,721,416 98,751,640 — 395,185,717
25
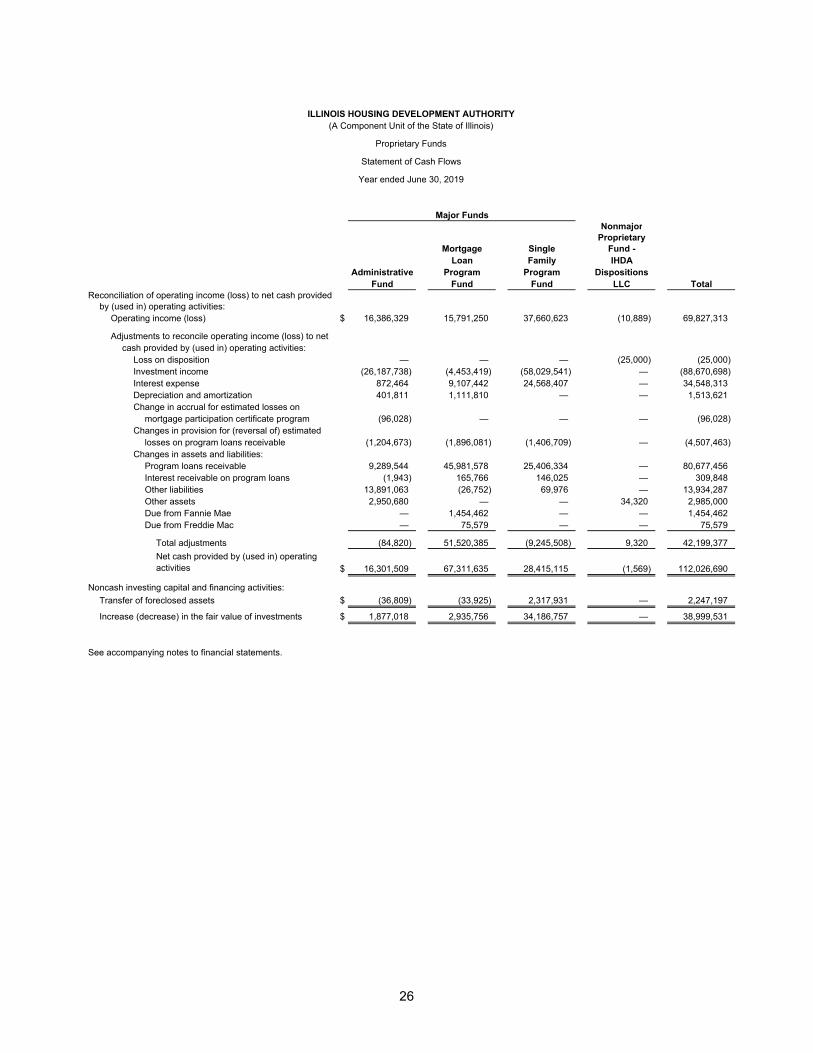
ILLINOIS HOUSING DEVELOPMENT AUTHORITY(A Component Unit of the State of Illinois)
Proprietary Funds
Statement of Cash Flows
Year ended June 30, 2019
Major FundsNonmajor
ProprietaryMortgage Single Fund -
Loan Family IHDAAdministrative Program Program Dispositions
Fund Fund Fund LLC TotalReconciliation of operating income (loss) to net cash provided
by (used in) operating activities:Operating income (loss) $ 16,386,329 15,791,250 37,660,623 (10,889) 69,827,313
Adjustments to reconcile operating income (loss) to netcash provided by (used in) operating activities:
Loss on disposition — — — (25,000) (25,000) Investment income (26,187,738) (4,453,419) (58,029,541) — (88,670,698) Interest expense 872,464 9,107,442 24,568,407 — 34,548,313 Depreciation and amortization 401,811 1,111,810 — — 1,513,621 Change in accrual for estimated losses on
mortgage participation certificate program (96,028) — — — (96,028) Changes in provision for (reversal of) estimated
losses on program loans receivable (1,204,673) (1,896,081) (1,406,709) — (4,507,463) Changes in assets and liabilities:
Program loans receivable 9,289,544 45,981,578 25,406,334 — 80,677,456 Interest receivable on program loans (1,943) 165,766 146,025 — 309,848 Other liabilities 13,891,063 (26,752) 69,976 — 13,934,287 Other assets 2,950,680 — — 34,320 2,985,000 Due from Fannie Mae — 1,454,462 — — 1,454,462 Due from Freddie Mac — 75,579 — — 75,579
Total adjustments (84,820) 51,520,385 (9,245,508) 9,320 42,199,377 Net cash provided by (used in) operating activities $ 16,301,509 67,311,635 28,415,115 (1,569) 112,026,690
Noncash investing capital and financing activities:Transfer of foreclosed assets $ (36,809) (33,925) 2,317,931 — 2,247,197
Increase (decrease) in the fair value of investments $ 1,877,018 2,935,756 34,186,757 — 38,999,531
See accompanying notes to financial statements.
26
ILLINOIS HOUSING DEVELOPMENT AUTHORITY
(A Component Unit of the State of Illinois)
Notes to the Financial Statements
June 30, 2019
27 (Continued)
(1) Authorizing Legislation
The Illinois Housing Development Authority (the Authority) is a body politic and corporate of the State of
Illinois (the State) created by the Illinois Housing Development Act, as amended (the Act), for the purposes
of assisting in the financing of decent, safe, and sanitary housing for persons and families of low and
moderate income in the State and assisting in the financing of residential mortgages in the State. To
accomplish its purposes, the Authority is authorized by the Act to make mortgage or other loans to nonprofit
corporations and limited profit entities for the acquisition, construction, or rehabilitation of dwelling
accommodations and to acquire, and to contract and enter into advance commitments to acquire, residential
mortgage loans from lending institutions. The Act also authorizes the Authority to issue its bonds and notes
to fulfill corporate purposes, including the financing of mortgage and construction loans, the acquisition of
residential mortgage loans and the making of loans for housing related commercial facilities. The Authority
has issued various bonds and notes to finance mortgage loans and construction loans, to purchase
residential mortgage loans from lending institutions, and to make loans to private lending institutions for
making new residential mortgage loans.
The bonds and notes outstanding as of June 30, 2019, as shown on the Authority’s financial statements
consist of both general and special limited obligations of the Authority (see note 8). The full faith and credit of
the Authority are pledged for payment of general obligation bonds and notes. The Authority has the power
under the Act to have up to $3.6 billion of general and special limited obligation bonds and notes
outstanding, excluding those issued to refund outstanding bonds and notes. At June 30, 2019, amounts
outstanding against this limitation were approximately $2.5 billion.
(2) Summary of Significant Accounting Policies
The following summarizes the significant accounting policies of the Authority:
(a) Reporting Entity
As defined by U.S. generally accepted accounting principles established by the Governmental
Accounting Standards Board (GASB), the financial reporting entity consists of the primary government,
as well as its component units, which are legally separate organizations for which the elected officials of
the primary government are financially accountable. Financial accountability is defined as:
(a) Appointment of a voting majority of the component unit’s board, and either a) the ability of the
primary government to impose its will, or b) the possibility that the component unit will provide a
financial benefit to or impose a financial burden on the primary government; or
(b) Fiscal dependency on the primary government.
For financial reporting purposes, the Authority is a component unit of the State of Illinois. The Authority
has one component unit, the IHDA Dispositions LLC (the LLC). Separate financial statements are not
prepared for the LLC.
The LLC was organized on September 25, 2012 as a member-managed limited liability company under
the Illinois Limited Liability Company Act. The LLC was organized by, and is a component unit of, the
Authority, a body politic and corporate of the State of Illinois. The sole member of the LLC is the
Authority. To the extent provided by the Illinois Limited Liability Company Act, the Authority’s liability is
limited. The LLC maintains, improves and disposes of multi-family properties, acquired through
ILLINOIS HOUSING DEVELOPMENT AUTHORITY
(A Component Unit of the State of Illinois)
Notes to the Financial Statements
June 30, 2019
28 (Continued)
foreclosure or deed-in-lieu of foreclosure, that are owned by single asset entity LLC’s of which the LLC
will be the sole member. Since the LLC qualifies as a disregarded entity-single member LLC, income
from the LLC would pass through to the 100% owner, the Authority.
With the creation of the LLC, a separate legal entity of the Authority, the criteria for reporting component
units was considered. Under Generally Accepted Accounting Principles (GAAP), a component unit can
be reported as a discretely presented or blended component unit of the primary government. In
considering the criteria of both presentations, the Authority found the LLC to be a component unit of the
Authority and should be reported as a blended component unit based on the following criteria defined as:
(a) The Authority and the LLC share a common governing body. GAAP requires that the boards be
“substantively the same” need not be identical and there is sufficient representation whereas the
voting majority of the component unit’s board also functions as a voting majority of the primary
government’s board.
(b) There is an exclusive or almost exclusive benefit or burden to the Authority, as the LLC
(1) provides service entirely or almost entirely to the primary government; or (2) otherwise
exclusively or almost exclusively benefits or burdens the primary government even though it does
not provide services directly to it.
(b) Basis of Presentation
Government-Wide Statements – The government-wide statement of net position and statement of
activities report the overall financial activity of the Authority. Eliminations have been made to help
minimize the double-counting of internal activities of the Authority. These statements distinguish between
the governmental and business-type activities of the Authority. Governmental activities generally are
financed through taxes, intergovernmental revenues, and other nonexchange transactions.
Business-type activities are financed in whole or in part by fees charged to external parties.
The statement of activities presents a comparison between direct expenses and program revenues for
the different business-type activities of the Authority and for each function of the Authority’s
governmental activities. Direct expenses are those that are clearly identifiable with a specific function.
Program revenues include (a) charges paid by the recipients for goods or services offered by the
programs, and (b) grants and contributions that are restricted to meeting the operational or capital
requirements of a particular program. Revenues that are not classified as program revenues are
presented as general revenues.
Fund Financial Statements – The fund financial statements provide information about the Authority’s
funds. Separate statements for each fund category, governmental and proprietary, are presented. The
emphasis on fund financial statements is on major and nonmajor governmental and proprietary
(enterprise) funds, each displayed in a separate column.
The Authority reports the following major governmental funds:
Illinois Affordable Housing Trust Fund
The Authority is designated administrator of the Illinois Affordable Housing Program (the Housing
Program). The program is funded by the Illinois Affordable Housing Trust Fund with funds generated
from a portion of the State real estate transfer tax collected by the Illinois Department of Revenue and
ILLINOIS HOUSING DEVELOPMENT AUTHORITY
(A Component Unit of the State of Illinois)
Notes to the Financial Statements
June 30, 2019
29 (Continued)
held within the State Treasury. The funds are appropriated annually to the Illinois Department of
Revenue by the General Assembly. In accordance with State statute, the Authority makes grants and low
or no interest mortgages or other loans, some with deferred repayment terms, to acquire, construct,
rehabilitate, develop, operate, insure, and retain affordable single family and Multi-Family housing for low
and very low income households.
As the administrator of the Housing Program, the Authority considers the interest in equity of the Housing
Program to be that of the State of Illinois and the Authority records a liability to the State of Illinois for
their equity share. Additionally, the Authority records amounts received to administer the Housing
Program as grant revenue.
HOME Program Fund
The Authority is the designated program administrator and the Participating Jurisdiction for the federally
funded HOME Investment Partnerships Program (the HOME Program) for the State of Illinois. HOME
funds are utilized for a variety of housing activities, according to local housing needs. Eligible uses of
funds include tenant-based rental assistance; housing rehabilitation; assistance to homebuyers; and new
construction of housing. HOME funding may also be used for site acquisition, site improvements,
demolition, relocation, and other necessary and reasonable activities related to the development of non-
luxury housing.
Rental Housing Support Program Fund
The Authority is designated administrator of the Rental Housing Support Program (the Support
Program). The program is funded by a surcharge for the recording of any real estate-related document.
The funds are appropriated to the Illinois Department of Revenue by the General Assembly. The
Authority awards funds to local administering agencies, which will contract with local landlords to make
rental units affordable to households who earn less than 30% of the area median income.
As the administrator of the Support Program, the Authority initially records amounts received as revenue
and a due to grantee liability is recorded. As funds are disbursed from the program, the Authority
reduces the liability.
Hardest Hit Fund
The Authority is designated program administrator for the Hardest Hit Fund (HHF) for grants
appropriated to the State of Illinois by the United States Department of the Treasury (the Treasury) as
authorized by the Emergency Economic Stabilization Act of 2008 (Public Law 110-343), as amended, as
the same may be amended from time to time (EESA). The funds are used to help prevent foreclosure
and stabilize housing markets through programs that provide interim mortgage payment assistance and
principal reduction for distressed homeowners, down payment assistance for homebuyers in targeted
areas, and assistance to demolish vacant, blighted structures.
The Authority reports the following major proprietary funds:
Administrative Fund
Development fee and financing fee income related to Multi-Family mortgage loans, income from service
fees, and operating expenses of the Authority are accounted for in the Administrative Fund. In addition,
the Administrative Fund has provided for supplemental financing of certain developments through
ILLINOIS HOUSING DEVELOPMENT AUTHORITY
(A Component Unit of the State of Illinois)
Notes to the Financial Statements
June 30, 2019
30 (Continued)
residual income loans and below market financing for various developments through the Authority’s
Housing Partnership Program (see note 5), and its lending program in conjunction with a debt service
savings sharing agreement (the FAF Savings Program) with the United States Department of Housing
and Urban Development (HUD) (see note 13).
The Administrative Fund’s net position that is classified as restricted by contractual agreement for loan
and grant programs consist of the FAF Savings Program and income from insurance proceeds that was
required to be disbursed as a loan to Lake Grove Village (ML-248).
Mortgage Loan Program Fund
The Mortgage Loan Program Fund accounts for the financing of low and moderate income housing
developments from the proceeds of Housing Bonds, Multifamily Initiative Bonds, Multifamily Revenue
Bonds and Affordable Housing Program Trust Fund Bonds, and for the retirement of such obligations.
The Authority holds first mortgage liens on such developments. Affordable Housing Program Trust Fund
Bond accounts include a transfer of funds from the Illinois Affordable Housing Trust Fund.
Single Family Program Fund
The Single-Family Program Fund accounts for the proceeds of Homeowner Mortgage Revenue Bonds,
Housing Revenue Bonds, Revenue Bonds and Residential Mortgage Revenue Bonds issued to provide
funds for the purchase from lending institutions of mortgage loans on owner-occupied, one to four unit
dwellings acquired by eligible buyers.
The use of tax-exempt financing to provide eligible borrowers with affordable-rate mortgage loans
involves federal restrictions on expenses chargeable to the program. Unless described otherwise in the
indenture, any expenses incurred in the program in excess of such maximum amounts are absorbed by
the Administrative Fund.
(c) Basis of Accounting
The government-wide and proprietary fund financial statements are reported using the economic
resources measurement focus and the accrual basis of accounting. Revenues are recorded when
earned and expenses are recorded at the time liabilities are incurred, regardless of when the related
cash flow takes place. Nonexchange transactions, in which the Authority receives value without directly
giving equal value in exchange, include federal and state grant revenue. Revenue from these sources is
recognized in the fiscal year in which all eligibility requirements have been met.
Governmental funds are reported using the current financial resources measurement focus and the
modified accrual basis of accounting. Revenues are recognized as soon as they are both measurable
and available. Revenues are considered to be available when they are collectible within the current
period or soon enough thereafter to pay liabilities of the current period. For this purpose, the Authority
considers revenues to be available if they are collected within 60 days of the end of the current fiscal
year.
Separate fund financial statements are provided for governmental and proprietary funds. Major
governmental and proprietary funds are reported as separate columns in the fund financial statements.
ILLINOIS HOUSING DEVELOPMENT AUTHORITY
(A Component Unit of the State of Illinois)
Notes to the Financial Statements
June 30, 2019
31 (Continued)
The accounting policies and financial reporting practices of the Authority conform to GAAP, as
promulgated in pronouncements of GASB.
(d) Fund Balances
In the fund financial statements, governmental funds report fund balances in the following categories:
Nonspendable – This consists of amounts that cannot be spent because they are either a) not in
spendable form, or b) legally or contractually required to be maintained intact.
Restricted – This consists of amounts that are restricted to specific purposes, that is, when
constraints placed on the use of resources are either: a) externally imposed by creditors, grantors,
contributors, or laws or regulations of other governments, or b) imposed by law through constitutional
provisions or enabling legislation.
Committed – This consists of amounts constrained by limitations that the Authority imposes upon
itself through resolution by its board of directors. The commitment amount will be binding unless
removed or amended in the same manner.
Assigned – This consists of net amounts that are constrained by the Authority’s intent to be used for
specific purposes, but that are neither restricted nor committed.
Unassigned – This consists of residual deficit fund balances.
In instances where restricted, committed, and assigned fund balances are available for use, the
Authority’s policy is to use restricted resources first, followed by committed resources, then assigned
resources, as needed. Currently, all of the Authority’s governmental funds fund balances are restricted.
(e) Net Position
In the government-wide and proprietary fund financial statements, net position is displayed in the
following components:
Net Investment in Capital Assets – This consists of capital assets, net of accumulated depreciation
and related debt.
Restricted – This consists of net position that is legally restricted by outside parties or by law
through constitutional provisions or enabling legislation.
All net position of the governmental activities column of the government-wide financial statements is
restricted with respect to the use of cash, investments and loan amounts that are to be repaid to the
Authority. (See note 5 for schedules of aging for the loans made under these programs.)
The use of assets of each of the proprietary fund program funds is restricted by the related bond and
note resolutions of the Authority. Certain amounts in the above program funds are considered
subject to the restriction that they be applied to the financing of housing for the respective program
purposes or to the retirement of obligations issued for such purposes; these amounts may include
certain investment earnings attributable to the respective fund net position. When both restricted and
ILLINOIS HOUSING DEVELOPMENT AUTHORITY
(A Component Unit of the State of Illinois)
Notes to the Financial Statements
June 30, 2019
32 (Continued)
unrestricted resources are available for use, generally it is the Authority’s policy to use restricted
resources first, then unrestricted resources when they are needed.
Unrestricted – This consists of net position that does not meet the criteria of the two preceding
categories.
Designations of net position represents tentative plans by the Authority for financial resource utilization in
a future period as documented in the minutes or budgeting process for a succeeding year. Such plans
are subject to change from original authorizations and may never result in expenditures.
A portion of the Authority’s Administrative Fund unrestricted net position as of June 30, 2019 is
designated as follows:
Homeownership Mortgage Loan Program $ 65,000,000
Provide funds to support Single Family Homeownership in the
State of Illinois through second lien position loans and/or grants
Multi-Family Mortgage Loan Program 25,000,000
To pay possible losses arising in the Multi-Family Program
attributable, but not limited to, delinquencies or defaults on
uninsured or unsubsidized loans
Homeownership Mortgage Loan Program 5,000,000
To pay possible losses arising in the Homeownership Program
attributable, but not limited to, delinquencies or defaults on
uninsured or unsubsidized loans
Homeownership Mortgage Loan Program 105,000,000
Provide funds to purchase homeownership mortgage loans and/or
mortgage-backed securities under the Program which may eventually
be purchased with proceeds from future issuances of Authority debt
or sold in the secondary market
Multi-Family Mortgage Loan Program 10,000,000
Provide funds to finance Multi-Family loans originated under
the Program
Provide funds for the Authority's planned technology enhancements 10,000,000
$ 220,000,000
The designations of the Administrative Fund unrestricted net position may be amended or rescinded by
the board members of the Authority.
(f) Use of Estimates
The preparation of financial statements in conformity with GAAP requires management to use estimates
and assumptions that affect the reported amounts of assets and liabilities at the date of the financial
statements and the reported amounts of revenues, expenses, and expenditures during the reporting
period. Actual results could differ from the estimates.
(g) Deferred Inflow/Outflow of Resources
A deferred inflow of resources is defined as an acquisition of net position by the government that is
applicable to a future reporting period and a deferred outflow of resources is defined as a consumption of
net position by the government that is applicable to a future reporting period. A deferred inflow of
ILLINOIS HOUSING DEVELOPMENT AUTHORITY
(A Component Unit of the State of Illinois)
Notes to the Financial Statements
June 30, 2019
33 (Continued)
resources has a negative impact on net position similar to liabilities but is required to be reported within
the statement of net position in a separate section following liabilities. A deferred outflow of resources
has a positive effect on net position similar to assets but is required to be reported in the statement of net
position in a separate section following assets.
Deferred outflows/inflows of resources include: (i) unamortized losses/gains on bond refundings, which
are deferred and amortized over the shorter of the remaining life of the old debt or the life of the new
debt, (ii) amounts reported as accumulated decrease/increase in fair value of hedging derivatives, which
represent the anticipated future utilization of the net position of interest rate swap agreements deemed to
be effective hedging derivatives, and (iii) unearned revenue for fees earned from the buy down of
homeowner mortgage interest rates to below market levels and amortized over the forgivable loan period
of the down payment assistance provided.
(h) Risks and Uncertainties
The Authority invests in various investment securities. Investment securities are exposed to various risks
such as interest rate, market, and credit risks. Due to the level of risk associated with certain investment
securities, it is at least reasonably possible that changes in the values of investment securities will occur
in the near term. Such changes could materially affect the amounts reported in the financial statements.
The allowances for estimated losses on loans are reported based on certain assumptions pertaining to
the Authority’s periodic review and evaluation of the loan portfolio, which is subject to change. Due to
uncertainties inherent in the estimations and assumptions process, it is at least reasonably possible that
changes in these estimates and assumptions in the near term would be material to the financial
statements.
(i) Cash and Cash Equivalents
For purposes of the statement of cash flows, the Authority considers all cash, certificates of deposits,
time deposits, and short-term repurchase agreements with original maturity dates of three months or less
from date of purchase to be cash equivalents.
(j) Investments
Investments of the Authority are reported at fair value. Fair value is determined by reference to public
market prices and quotations from a securities pricing service. The Authority records investment
transactions based on trade date.
The investment of funds is restricted by various bond and note resolutions of the Authority and the Act,
generally, to direct obligations of the United States government; specific bank obligations, certain of
which are fully secured as required by the bond and note resolutions; and obligations of other
governmental entities that meet defined standards. The type of collateral instruments that secure the
demand repurchase agreements held by the Authority is subject to the same restrictions described
above. Generally, collateral instruments are held by third-party institutions.
(k) Program Loans Receivable
Program loans receivable include mortgage loans receivable, advances receivable, and residual income
loans receivable. Mortgage loans receivable include certain amounts of interest and fees that have been
charged by the Authority and added to the loan balance. The due dates for advances and residual
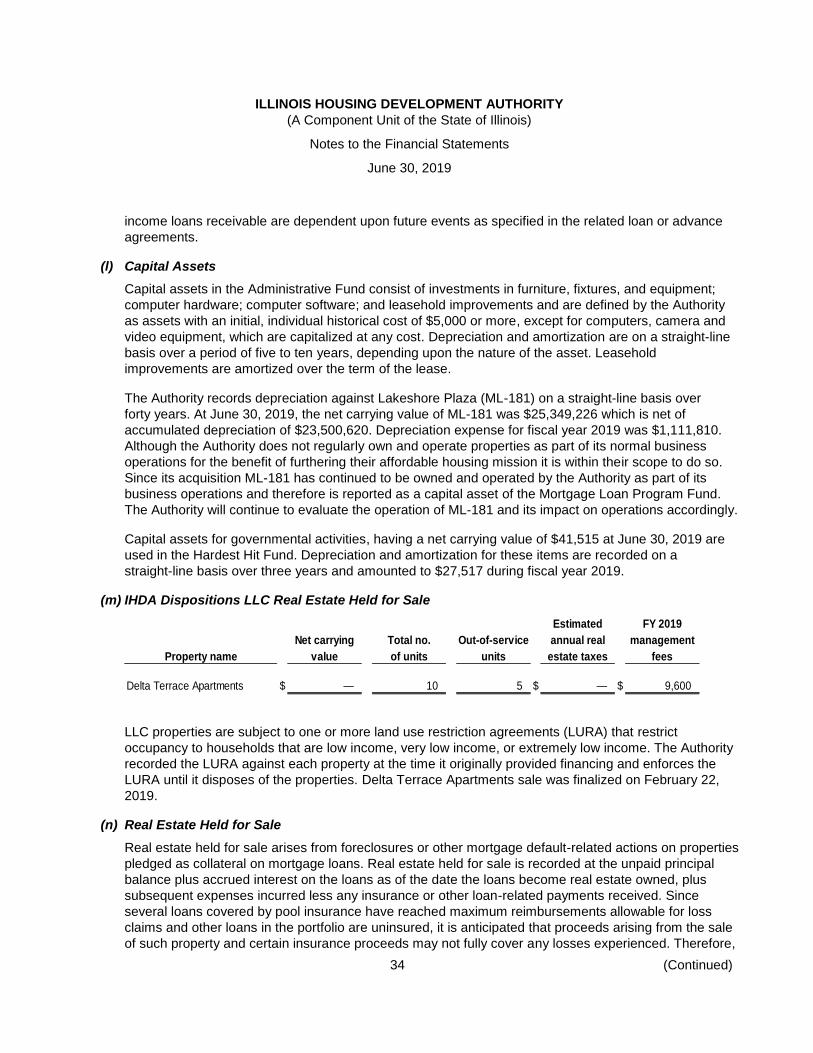
ILLINOIS HOUSING DEVELOPMENT AUTHORITY
(A Component Unit of the State of Illinois)
Notes to the Financial Statements
June 30, 2019
34 (Continued)
income loans receivable are dependent upon future events as specified in the related loan or advance
agreements.
(l) Capital Assets
Capital assets in the Administrative Fund consist of investments in furniture, fixtures, and equipment;
computer hardware; computer software; and leasehold improvements and are defined by the Authority
as assets with an initial, individual historical cost of $5,000 or more, except for computers, camera and
video equipment, which are capitalized at any cost. Depreciation and amortization are on a straight-line
basis over a period of five to ten years, depending upon the nature of the asset. Leasehold
improvements are amortized over the term of the lease.
The Authority records depreciation against Lakeshore Plaza (ML-181) on a straight-line basis over
forty years. At June 30, 2019, the net carrying value of ML-181 was $25,349,226 which is net of
accumulated depreciation of $23,500,620. Depreciation expense for fiscal year 2019 was $1,111,810.
Although the Authority does not regularly own and operate properties as part of its normal business
operations for the benefit of furthering their affordable housing mission it is within their scope to do so.
Since its acquisition ML-181 has continued to be owned and operated by the Authority as part of its
business operations and therefore is reported as a capital asset of the Mortgage Loan Program Fund.
The Authority will continue to evaluate the operation of ML-181 and its impact on operations accordingly.
Capital assets for governmental activities, having a net carrying value of $41,515 at June 30, 2019 are
used in the Hardest Hit Fund. Depreciation and amortization for these items are recorded on a
straight-line basis over three years and amounted to $27,517 during fiscal year 2019.
(m) IHDA Dispositions LLC Real Estate Held for Sale
Estimated FY 2019
Net carrying Total no. Out-of-service annual real management
Property name value of units units estate taxes fees
Delta Terrace Apartments $ — 10 5 $ — $ 9,600
LLC properties are subject to one or more land use restriction agreements (LURA) that restrict
occupancy to households that are low income, very low income, or extremely low income. The Authority
recorded the LURA against each property at the time it originally provided financing and enforces the
LURA until it disposes of the properties. Delta Terrace Apartments sale was finalized on February 22,
2019.
(n) Real Estate Held for Sale
Real estate held for sale arises from foreclosures or other mortgage default-related actions on properties
pledged as collateral on mortgage loans. Real estate held for sale is recorded at the unpaid principal
balance plus accrued interest on the loans as of the date the loans become real estate owned, plus
subsequent expenses incurred less any insurance or other loan-related payments received. Since
several loans covered by pool insurance have reached maximum reimbursements allowable for loss
claims and other loans in the portfolio are uninsured, it is anticipated that proceeds arising from the sale
of such property and certain insurance proceeds may not fully cover any losses experienced. Therefore,
ILLINOIS HOUSING DEVELOPMENT AUTHORITY
(A Component Unit of the State of Illinois)
Notes to the Financial Statements
June 30, 2019
35 (Continued)
the Authority has established a provision for estimated losses on real estate held for sale based on a
periodic review of such conditions which considers factors as interest costs, holding costs, sales
proceeds, mortgage insurance and pool insurance recoveries to estimate losses.
(o) Bond Premium/Discount, Issuance Costs and Gain/Loss on Refunding
Premium/discount on bonds is netted with bonds payable and amortized using a method approximating
the effective interest method over the life of the bonds. Debt issuance costs are recorded as an expense
in the period incurred. Unamortized gains and losses on refunding are reported as deferred inflows and
outflows of resources, respectively, and are amortized over the shorter of the life of the old or new debt
as a component of interest expense.
(p) Operations
Proprietary funds loan origination fees, development fee, and financing fee income are recognized as
revenue in the period received. Fees earned on loans, which the Authority does not directly originate,
such as loans financed through other financings (see note 8(f)), are recognized as income in the
Administrative Fund generally at the time of initial closing.
Proprietary funds annual service fees charged by the Authority to loan recipients, which are deposited in
the respective program funds or added to program loans receivable, are recorded as income in the
Administrative Fund through interfund accounts.
Proprietary funds rental revenue, reported in the LLC, is principally derived from one-year leases on
apartment units, which are accounted for as operating leases. Accordingly, rental revenue is recognized
when the rentals become due. Rentals received in advance are accounted for as prepaid rent.
Proprietary funds operating expenses include general and administrative expenses of the Authority;
salaries and benefits; costs and expenses incurred in connection with the amortization, issuance, and
sale of certain bonds and notes; fees and expenses of trustees and depository and paying agents; and
costs related to analyses, surveys, appraisals, and other matters pertaining to maintenance and
evaluation of program loans receivable. Operating costs and expenses are charged to expense as
incurred.
Proprietary funds operating revenues, such as charges for services, result from exchange transactions
associated with the principal activity of the fund including interest income, service fees, and development
fees. Exchange transactions are those in which each party receives and gives up essentially equal
values.
A portion of the Authority’s operating expenses of administering the Illinois Affordable Housing Trust
Fund, HOME Program, Rental Housing Support Program, HHF, and Nonmajor Governmental Funds are
recorded within these governmental funds. Similarly, other related special assistance programs and
resolutions of various bond programs allow for these program accounts to record a certain level of
operating expenses. Expenses in excess of the allowable ceilings set forth in the resolutions are charged
to the Administrative Fund.
Direct expenses as shown in the statement of activities include allocations of Administrative Fund
expenses of Authority departments directly involved in the production or monitoring activities associated
with the programs, as well as certain costs, both internally and externally incurred, associated with these
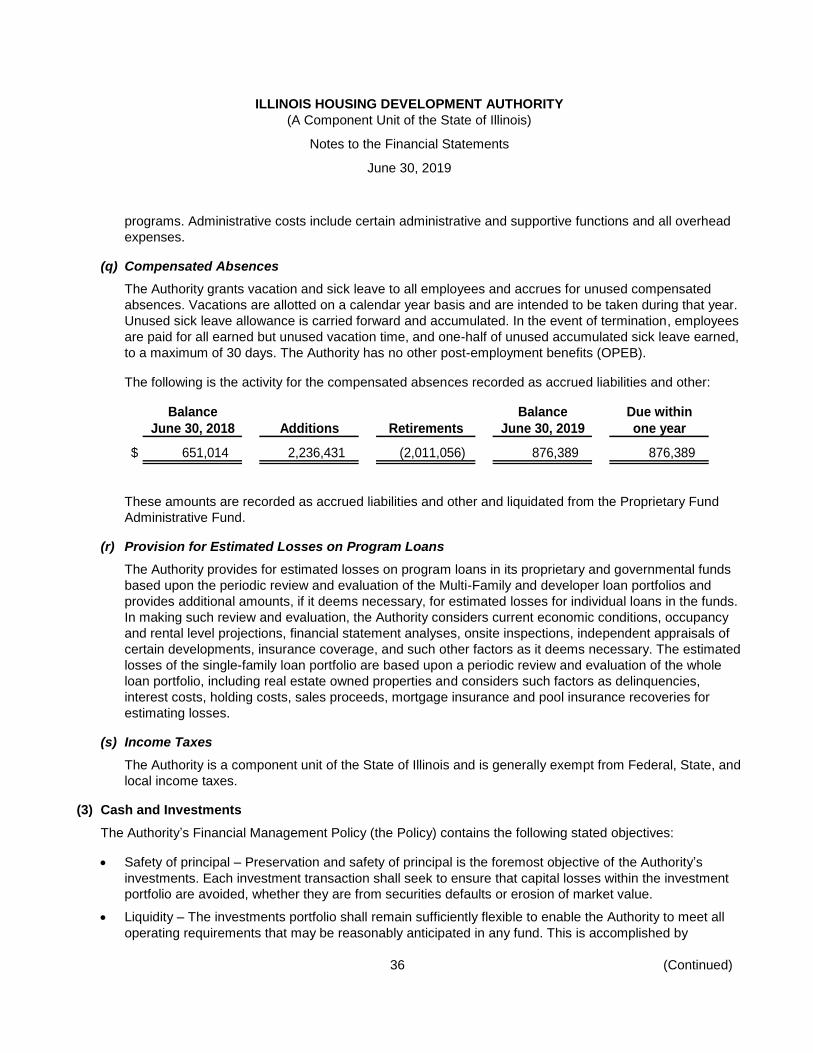
ILLINOIS HOUSING DEVELOPMENT AUTHORITY
(A Component Unit of the State of Illinois)
Notes to the Financial Statements
June 30, 2019
36 (Continued)
programs. Administrative costs include certain administrative and supportive functions and all overhead
expenses.
(q) Compensated Absences
The Authority grants vacation and sick leave to all employees and accrues for unused compensated
absences. Vacations are allotted on a calendar year basis and are intended to be taken during that year.
Unused sick leave allowance is carried forward and accumulated. In the event of termination, employees
are paid for all earned but unused vacation time, and one-half of unused accumulated sick leave earned,
to a maximum of 30 days. The Authority has no other post-employment benefits (OPEB).
The following is the activity for the compensated absences recorded as accrued liabilities and other:
Balance Balance Due within
June 30, 2018 Additions Retirements June 30, 2019 one year
$ 651,014 2,236,431 (2,011,056) 876,389 876,389
These amounts are recorded as accrued liabilities and other and liquidated from the Proprietary Fund
Administrative Fund.
(r) Provision for Estimated Losses on Program Loans
The Authority provides for estimated losses on program loans in its proprietary and governmental funds
based upon the periodic review and evaluation of the Multi-Family and developer loan portfolios and
provides additional amounts, if it deems necessary, for estimated losses for individual loans in the funds.
In making such review and evaluation, the Authority considers current economic conditions, occupancy
and rental level projections, financial statement analyses, onsite inspections, independent appraisals of
certain developments, insurance coverage, and such other factors as it deems necessary. The estimated
losses of the single-family loan portfolio are based upon a periodic review and evaluation of the whole
loan portfolio, including real estate owned properties and considers such factors as delinquencies,
interest costs, holding costs, sales proceeds, mortgage insurance and pool insurance recoveries for
estimating losses.
(s) Income Taxes
The Authority is a component unit of the State of Illinois and is generally exempt from Federal, State, and
local income taxes.
(3) Cash and Investments
The Authority’s Financial Management Policy (the Policy) contains the following stated objectives:
Safety of principal – Preservation and safety of principal is the foremost objective of the Authority’s
investments. Each investment transaction shall seek to ensure that capital losses within the investment
portfolio are avoided, whether they are from securities defaults or erosion of market value.
Liquidity – The investments portfolio shall remain sufficiently flexible to enable the Authority to meet all
operating requirements that may be reasonably anticipated in any fund. This is accomplished by
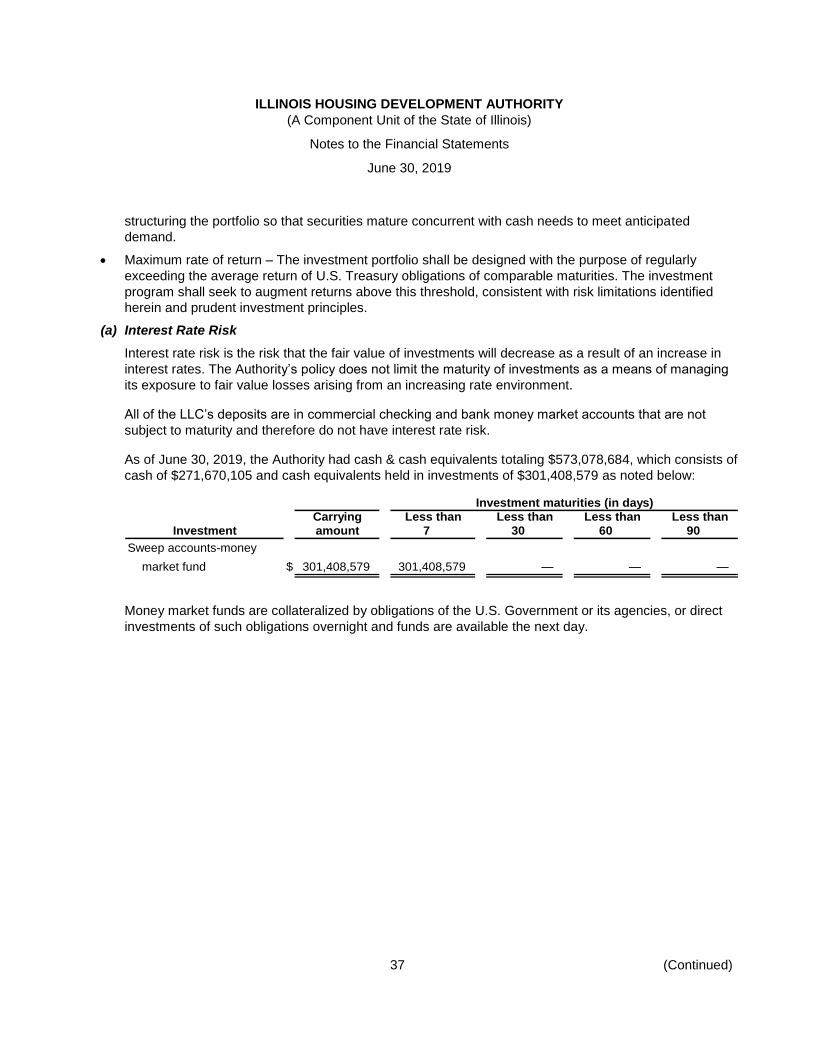
ILLINOIS HOUSING DEVELOPMENT AUTHORITY
(A Component Unit of the State of Illinois)
Notes to the Financial Statements
June 30, 2019
37 (Continued)
structuring the portfolio so that securities mature concurrent with cash needs to meet anticipated
demand.
Maximum rate of return – The investment portfolio shall be designed with the purpose of regularly
exceeding the average return of U.S. Treasury obligations of comparable maturities. The investment
program shall seek to augment returns above this threshold, consistent with risk limitations identified
herein and prudent investment principles.
(a) Interest Rate Risk
Interest rate risk is the risk that the fair value of investments will decrease as a result of an increase in
interest rates. The Authority’s policy does not limit the maturity of investments as a means of managing
its exposure to fair value losses arising from an increasing rate environment.
All of the LLC’s deposits are in commercial checking and bank money market accounts that are not
subject to maturity and therefore do not have interest rate risk.
As of June 30, 2019, the Authority had cash & cash equivalents totaling $573,078,684, which consists of
cash of $271,670,105 and cash equivalents held in investments of $301,408,579 as noted below:
Investment maturities (in days)Carrying Less than Less than Less than Less than
Investment amount 7 30 60 90
Sweep accounts-money
market fund $ 301,408,579 301,408,579 — — —
Money market funds are collateralized by obligations of the U.S. Government or its agencies, or direct
investments of such obligations overnight and funds are available the next day.
ILLINOIS HOUSING DEVELOPMENT AUTHORITY
(A Component Unit of the State of Illinois)
Notes to the Financial Statements
June 30, 2019
38 (Continued)
As of June 30, 2019, the Authority had the following investments:
Investment maturities (in years)
Carrying Less than More than
Investment amount 1 1–5 6–10 10
Certificate of Deposit $ 6,600,716 6,600,716 — — —
Commercial Paper 281,592,542 281,592,542 — — —
Federal Home Loan Bank Bonds 51,940,402 20,123,572 31,816,830 — —
Federal Farm Credit Bank Bonds 25,721,234 5,883,871 19,837,363 — —
Federal Home Loan Mortgage
Corp. 71,649,843 18,869,460 51,193,161 — 1,587,222
Federal National Mortgage Assn.
Benchmark Notes 1,669,473 — — 1,669,473 —
Federal Home Loan Bank
Discount Notes 20,901,468 20,901,468 — — —
Government National Mortgage
Association 552,629,151 — — — 552,629,151
Federal National Mortgage Assn. 334,199,327 11,558,112 24,124,544 10,156,584 288,360,087
Municipal Bonds 251,380 251,380 — — —
U.S. Treasury Bills 123,609 123,609 — — —
U.S. Treasury Strips 1,536,881 — — 1,448,683 88,198
U.S. Treasury Bonds 5,779,707 159,319 5,620,388 — —
U.S. Treasury Notes 21,357,220 5,945,373 15,411,847 — —
$ 1,375,952,953 372,009,422 148,004,133 13,274,740 842,664,658
(b) Credit Risk
Credit risk is the risk the Authority will not recover its investments due to the inability of the counterparty
to fulfill its obligation. Statutes of the State and resolutions of the Authority authorize the Authority to
invest in obligations of the U.S. Government, agencies, and instrumentalities of the U.S. Government,
demand repurchase agreements, and other banking arrangements. The Authority may also invest its
funds in such investments as may be lawful for fiduciaries in the State. All funds are held outside of the
State Treasury in various banks and financial institutions, except for approximately $47,372 for the
HOME Program Fund.
The Authority’s investments in U.S. Government and Agency Obligations are rated Aaa by Moody’s
and/or AA+ by Standard & Poor’s.
(c) Custodial Credit Risk
The custodial credit risk for deposits is the risk that, in the event of the failure of a depository financial
institution, the Authority will not be able to recover deposits or will not be able to recover collateral
securities that are in the possession of an outside party. The custodial credit risk for investments is the
risk that, in the event of the failure of the counterparty to a transaction, the Authority will not be able to
recover the value of investment or collateral securities that are in the possession of an outside party.
The Authority’s cash carrying value balance totaled $271,670,105 at June 30, 2019, and the cash bank
balance totaled $271,686,188, which was fully insured or collateralized. Additionally, the Authority’s cash
equivalents at June 30, 2019, consisted of sweep accounts, held in the Authority’s name, with the funds
in these accounts invested in money market funds that invest in U.S. Treasury securities, or were held in
ILLINOIS HOUSING DEVELOPMENT AUTHORITY
(A Component Unit of the State of Illinois)
Notes to the Financial Statements
June 30, 2019
39 (Continued)
accounts that were either FDIC insured or collateralized with U.S. government obligations. The
Authority’s investments at June 30, 2019 were held in the Authority’s name in separate Authority
custodial accounts. Collateral is pledged in the Authority’s name and consists of U.S. Treasury
obligations.
(d) Concentration of Credit Risk
Concentration of credit risk is the risk of loss attributed to the magnitude of investment in any one single
issuer. The Authority’s policy does not limit the amounts the Authority may invest in any one issuer. The
Authority is considered to have a concentration of credit risk if its investments in any one single issuer
(other than securities explicitly guaranteed by the U.S. government) are greater than 5% of total
investments. Investments which comprise more than 5% of the Authority’s investments as of June 30,
2019 are as follows:
Federal Home Loan Bank $ 144,491,713
Federal National Mortgage Association 335,868,800
(e) Forward Commitments
The Authority sells forward commitments to deliver Government National Mortgage Association (GNMA)
certificates and Fannie Mae (FNMA) mortgage-backed securities (MBS). Commitments are sold as
mortgage loan reservations are taken to hedge against market fluctuations prior to loan origination and
securitization. The Authority is subject to market value fluctuations in the event that mortgage loans are
not originated as expected and the committed securities cannot be delivered. A net decrease in fair value
of $65,433 on these forward commitments, classified as investment derivative instruments, has been
recorded in investment income in the Administrative Fund for the year ended June 30, 2019. In addition,
$647,682 of forward commitments is recorded on the statement of net position as accrued liabilities and
other current liabilities at June 30, 2019.
ILLINOIS HOUSING DEVELOPMENT AUTHORITY
(A Component Unit of the State of Illinois)
Notes to the Financial Statements
June 30, 2019
40 (Continued)
The Authority is subject to credit risk with respect to counterparties for the forward commitment
contracts, summarized below with their credit ratings as of June 30, 2019.
Number of
Counterparty Rating (1)
Contracts Par Amount
Bank of New York Mellon AA-/A-1+ (Stable);
Aa1(cr)/P-1(cr) (Stable) 9 $ 30,122,213
Citigroup Global Markets BBB+/A-2 (Stable);
A3 / (Stable) 22 37,120,889
Jefferies LLC BBB-/BBB – (Stable);
Baa3/Baa3 (Stable) 9 18,888,231
Morgan Stanley BBB+ (Stable);
A3 / P-2 (Stable) 20 8,636,749
Piper Jaffray BBB+ / A-2 (Stable)
A3 / P-2 (Stable) 4 7,100,000
Raymond James & Associates, Inc. BBB+ (Stable);
Baa1 (Stable) 13 19,258,649
Fannie Mae AA+u/A-1+u (Stable);
Aaa /P-1 (Stable) 17 32,796,833
Wells Fargo Securities, LLC A+ / A-1 (Stable);
Aa1(cr)/P-1(cr) (Neg) 13 25,467,482
Total forward
commitments 107 $ 179,391,046
(1) S&P; Moody's
(f) Fair Value Measurements
GASB Statement No. 72 explains that the government could determine the market price of an asset in
one of three ways: 1) actual market transactions for identical or similar items (market approach); 2) the
current cost to replace the service capacity of an asset (cost approach); or 3) discounting the current
value of future cash flows (income approach). It also establishes a three-tier hierarchy of input quality as
follows:
Level 1 inputs are quoted prices in active markets for identical items;
Level 2 inputs are all inputs that are directly or indirectly observable, but not on Level 1; and
Level 3 inputs are all inputs that are unobservable.
The statement directs governments to maximize their use of observable inputs and to minimize the use
of unobservable inputs.
Fair value is most frequently applied to investments which GASB Statement No. 72 defines as a security
or other asset that (a) a government holds primarily for the purpose of income or profit and (b) has a
present service capacity based solely on its ability to generate cash or to be sold to generate cash.
ILLINOIS HOUSING DEVELOPMENT AUTHORITY
(A Component Unit of the State of Illinois)
Notes to the Financial Statements
June 30, 2019
41 (Continued)
The Authority categorizes its fair value measurements within the fair value hierarchy established by
GAAP. The hierarchy is based on the valuation inputs used to measure the fair value of the asset.
Level 1 inputs are quoted prices in active markets for identical assets; Level 2 inputs are significant other
observable inputs; Level 3 inputs are significant unobservable inputs.
The following is a description of the valuation methods and assumptions used by the Authority to
estimate the fair value of its financial instruments. There have been no changes in the methods and
assumptions used at June 30, 2019. The Authority management believes its valuation methods are
appropriate and consistent with other market participants. The use of different methodologies or
assumptions to determine the fair value of certain financial instruments could result in a different fair
value measurement at the reporting date.
Investments classified in Level 1 of the fair value hierarchy are valued using prices quoted in active
markets for those securities. Agency securities classified in Level 2 of the fair value hierarchy are valued
using prices quoted in active markets for similar securities.
Derivative instruments classified in Level 2 of the fair value hierarchy are valued using a market
approach that considers benchmark interest rates and foreign exchange rates.
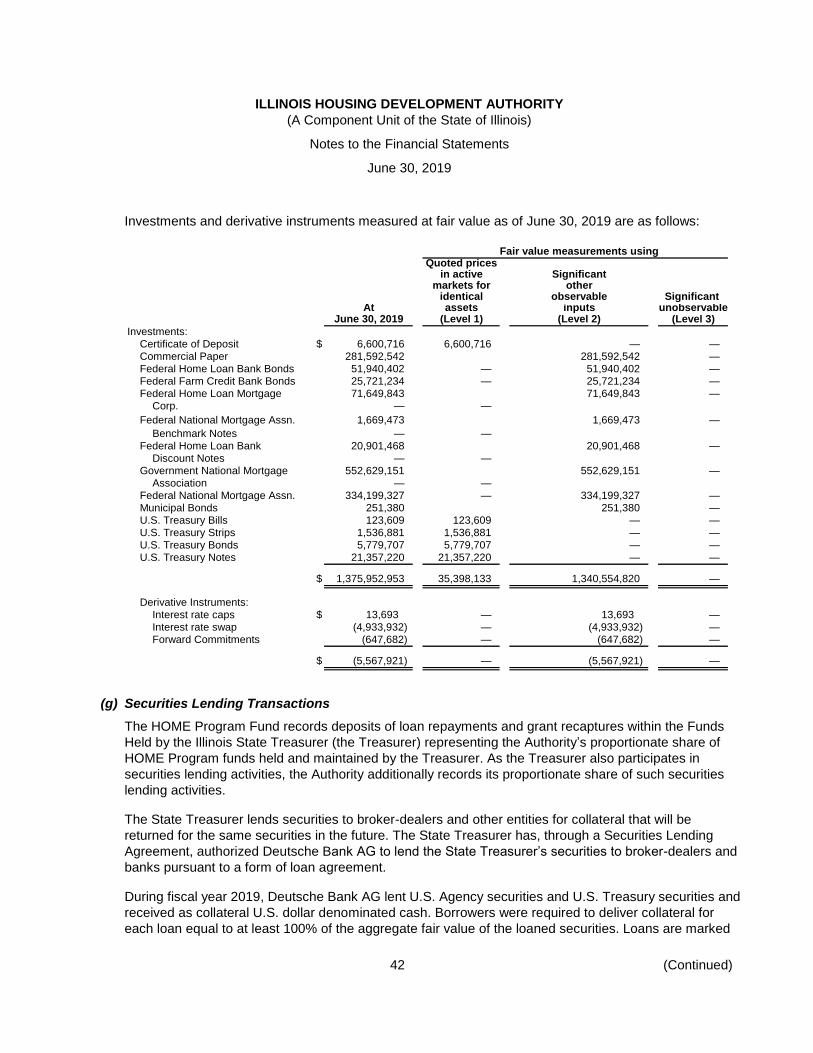
ILLINOIS HOUSING DEVELOPMENT AUTHORITY
(A Component Unit of the State of Illinois)
Notes to the Financial Statements
June 30, 2019
42 (Continued)
Investments and derivative instruments measured at fair value as of June 30, 2019 are as follows:
Fair value measurements usingQuoted prices
in active Significantmarkets for other
identical observable Significant At assets inputs unobservable
June 30, 2019 (Level 1) (Level 2) (Level 3)
Investments:
Certificate of Deposit $ 6,600,716 6,600,716 — —
Commercial Paper 281,592,542 281,592,542 —
Federal Home Loan Bank Bonds 51,940,402 — 51,940,402 —
Federal Farm Credit Bank Bonds 25,721,234 — 25,721,234 —
Federal Home Loan Mortgage 71,649,843 71,649,843 —
Corp. — —
Federal National Mortgage Assn. 1,669,473 1,669,473 —
Benchmark Notes — —
Federal Home Loan Bank 20,901,468 20,901,468 —
Discount Notes — —
Government National Mortgage 552,629,151 552,629,151 —
Association — —
Federal National Mortgage Assn. 334,199,327 — 334,199,327 —
Municipal Bonds 251,380 251,380 —
U.S. Treasury Bills 123,609 123,609 — —
U.S. Treasury Strips 1,536,881 1,536,881 — —
U.S. Treasury Bonds 5,779,707 5,779,707 — —
U.S. Treasury Notes 21,357,220 21,357,220 — —
$ 1,375,952,953 35,398,133 1,340,554,820 —
Derivative Instruments:
Interest rate caps $ 13,693 — 13,693 —
Interest rate swap (4,933,932) — (4,933,932) —
Forward Commitments (647,682) — (647,682) —
$ (5,567,921) — (5,567,921) —
(g) Securities Lending Transactions
The HOME Program Fund records deposits of loan repayments and grant recaptures within the Funds
Held by the Illinois State Treasurer (the Treasurer) representing the Authority’s proportionate share of
HOME Program funds held and maintained by the Treasurer. As the Treasurer also participates in
securities lending activities, the Authority additionally records its proportionate share of such securities
lending activities.
The State Treasurer lends securities to broker-dealers and other entities for collateral that will be
returned for the same securities in the future. The State Treasurer has, through a Securities Lending
Agreement, authorized Deutsche Bank AG to lend the State Treasurer’s securities to broker-dealers and
banks pursuant to a form of loan agreement.
During fiscal year 2019, Deutsche Bank AG lent U.S. Agency securities and U.S. Treasury securities and
received as collateral U.S. dollar denominated cash. Borrowers were required to deliver collateral for
each loan equal to at least 100% of the aggregate fair value of the loaned securities. Loans are marked
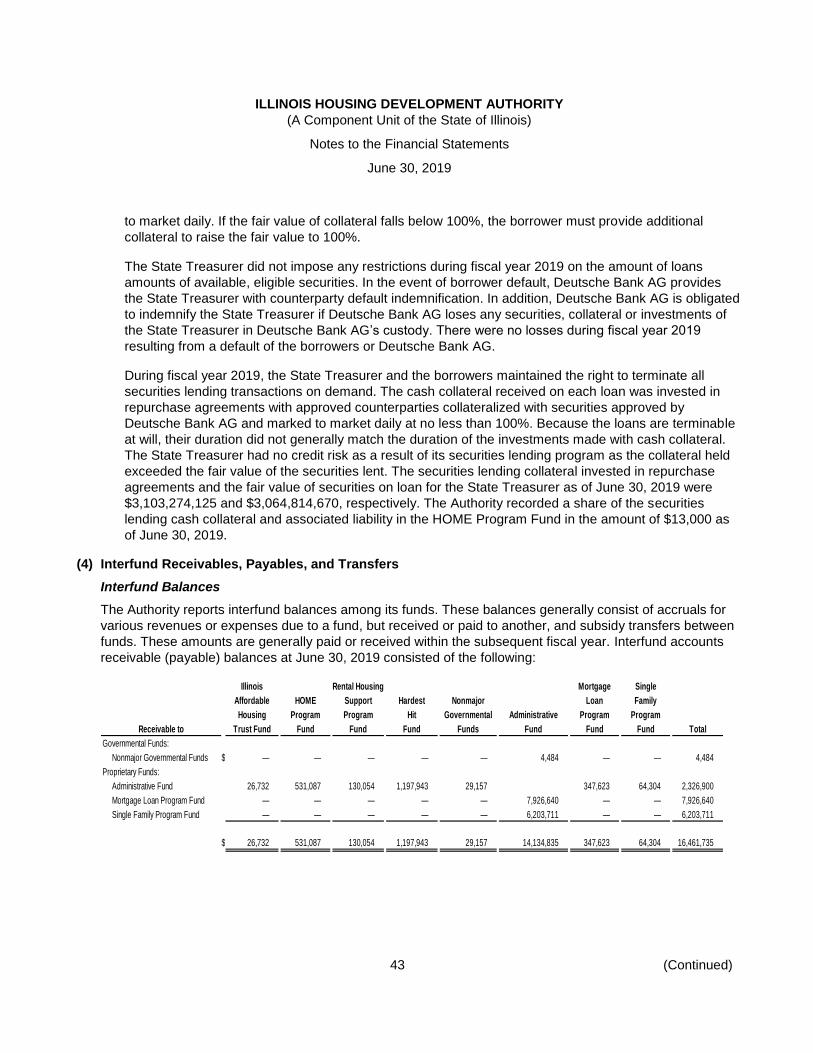
ILLINOIS HOUSING DEVELOPMENT AUTHORITY
(A Component Unit of the State of Illinois)
Notes to the Financial Statements
June 30, 2019
43 (Continued)
to market daily. If the fair value of collateral falls below 100%, the borrower must provide additional
collateral to raise the fair value to 100%.
The State Treasurer did not impose any restrictions during fiscal year 2019 on the amount of loans
amounts of available, eligible securities. In the event of borrower default, Deutsche Bank AG provides
the State Treasurer with counterparty default indemnification. In addition, Deutsche Bank AG is obligated
to indemnify the State Treasurer if Deutsche Bank AG loses any securities, collateral or investments of
the State Treasurer in Deutsche Bank AG’s custody. There were no losses during fiscal year 2019
resulting from a default of the borrowers or Deutsche Bank AG.
During fiscal year 2019, the State Treasurer and the borrowers maintained the right to terminate all
securities lending transactions on demand. The cash collateral received on each loan was invested in
repurchase agreements with approved counterparties collateralized with securities approved by
Deutsche Bank AG and marked to market daily at no less than 100%. Because the loans are terminable
at will, their duration did not generally match the duration of the investments made with cash collateral.
The State Treasurer had no credit risk as a result of its securities lending program as the collateral held
exceeded the fair value of the securities lent. The securities lending collateral invested in repurchase
agreements and the fair value of securities on loan for the State Treasurer as of June 30, 2019 were
$3,103,274,125 and $3,064,814,670, respectively. The Authority recorded a share of the securities
lending cash collateral and associated liability in the HOME Program Fund in the amount of $13,000 as
of June 30, 2019.
(4) Interfund Receivables, Payables, and Transfers
Interfund Balances
The Authority reports interfund balances among its funds. These balances generally consist of accruals for
various revenues or expenses due to a fund, but received or paid to another, and subsidy transfers between
funds. These amounts are generally paid or received within the subsequent fiscal year. Interfund accounts
receivable (payable) balances at June 30, 2019 consisted of the following:
Illinois Rental Housing Mortgage Single
Affordable HOME Support Hardest Nonmajor Loan Family
Housing Program Program Hit Governmental Administrative Program Program
Receivable to Trust Fund Fund Fund Fund Funds Fund Fund Fund Total
Governmental Funds:
Nonmajor Governmental Funds $ — — — — — 4,484 — — 4,484
Proprietary Funds:
Administrative Fund 26,732 531,087 130,054 1,197,943 29,157 347,623 64,304 2,326,900
Mortgage Loan Program Fund — — — — — 7,926,640 — — 7,926,640
Single Family Program Fund — — — — — 6,203,711 — — 6,203,711
$ 26,732 531,087 130,054 1,197,943 29,157 14,134,835 347,623 64,304 16,461,735
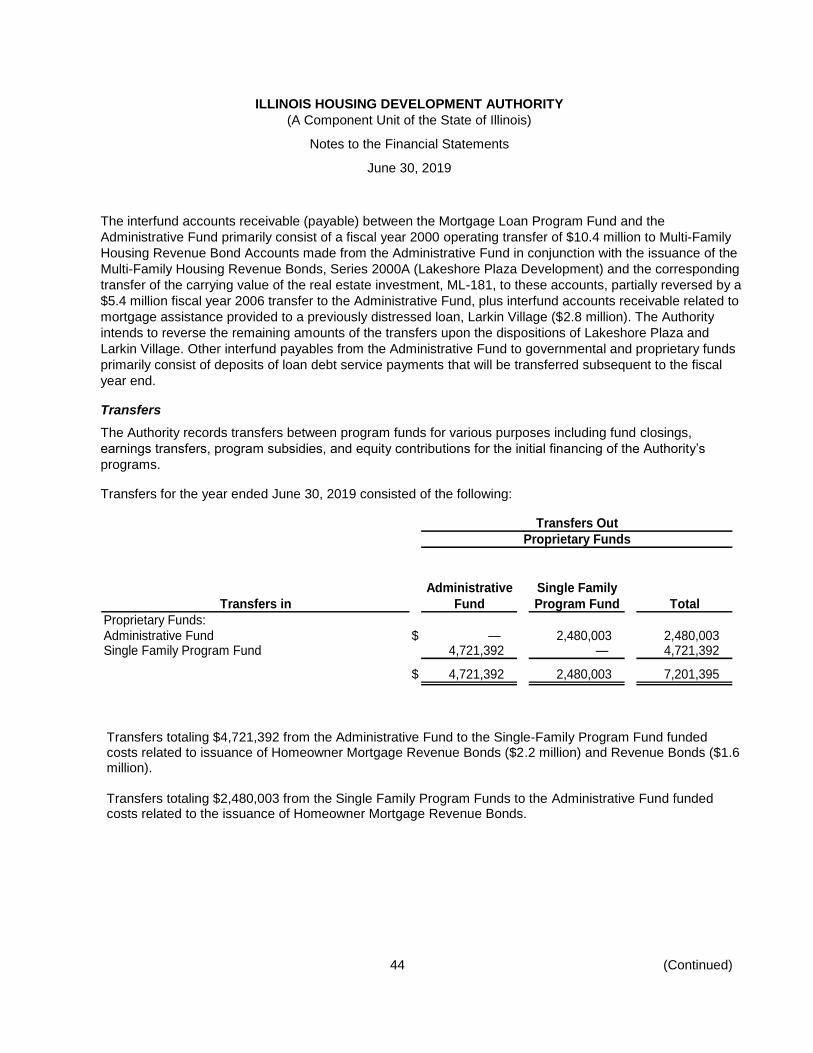
ILLINOIS HOUSING DEVELOPMENT AUTHORITY
(A Component Unit of the State of Illinois)
Notes to the Financial Statements
June 30, 2019
44 (Continued)
The interfund accounts receivable (payable) between the Mortgage Loan Program Fund and the
Administrative Fund primarily consist of a fiscal year 2000 operating transfer of $10.4 million to Multi-Family
Housing Revenue Bond Accounts made from the Administrative Fund in conjunction with the issuance of the
Multi-Family Housing Revenue Bonds, Series 2000A (Lakeshore Plaza Development) and the corresponding
transfer of the carrying value of the real estate investment, ML-181, to these accounts, partially reversed by a
$5.4 million fiscal year 2006 transfer to the Administrative Fund, plus interfund accounts receivable related to
mortgage assistance provided to a previously distressed loan, Larkin Village ($2.8 million). The Authority
intends to reverse the remaining amounts of the transfers upon the dispositions of Lakeshore Plaza and
Larkin Village. Other interfund payables from the Administrative Fund to governmental and proprietary funds
primarily consist of deposits of loan debt service payments that will be transferred subsequent to the fiscal
year end.
Transfers
The Authority records transfers between program funds for various purposes including fund closings,
earnings transfers, program subsidies, and equity contributions for the initial financing of the Authority’s
programs.
Transfers for the year ended June 30, 2019 consisted of the following:
Administrative Single Family
Transfers in Fund Program Fund Total
Proprietary Funds:Administrative Fund $ — 2,480,003 2,480,003 Single Family Program Fund 4,721,392 — 4,721,392
$ 4,721,392 2,480,003 7,201,395
Transfers Out
Proprietary Funds
Transfers totaling $4,721,392 from the Administrative Fund to the Single-Family Program Fund funded costs related to issuance of Homeowner Mortgage Revenue Bonds ($2.2 million) and Revenue Bonds ($1.6 million).
Transfers totaling $2,480,003 from the Single Family Program Funds to the Administrative Fund funded costs related to the issuance of Homeowner Mortgage Revenue Bonds.
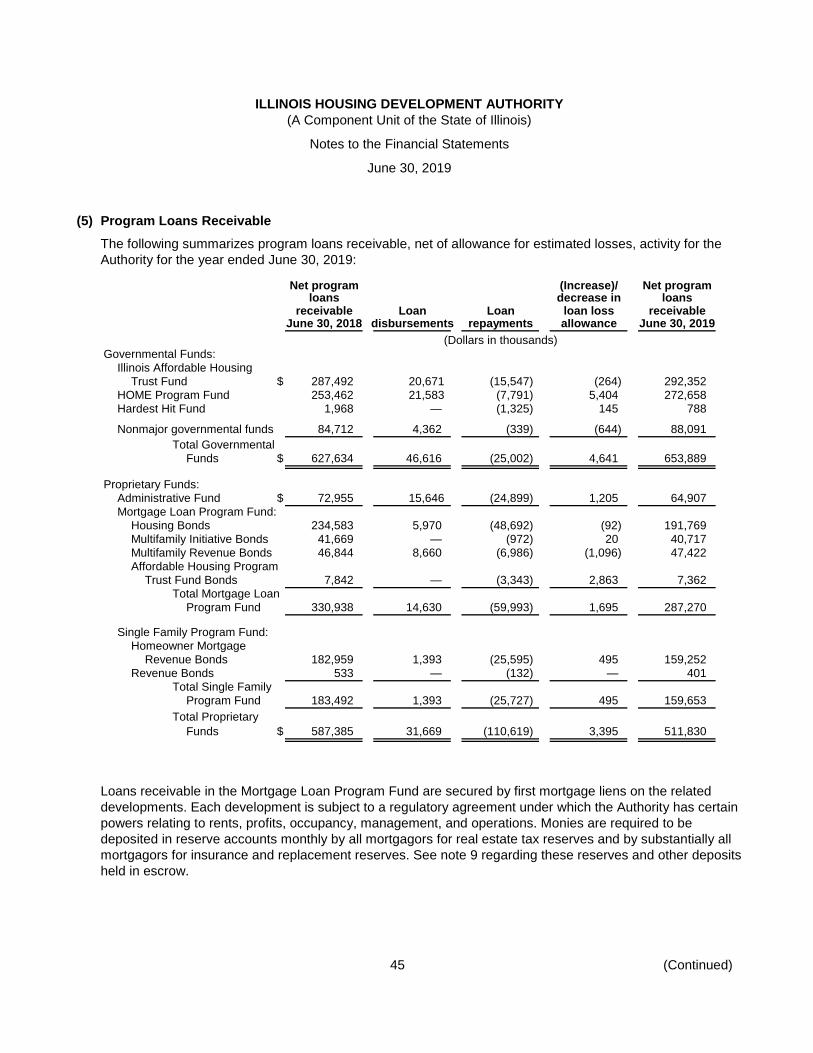
ILLINOIS HOUSING DEVELOPMENT AUTHORITY
(A Component Unit of the State of Illinois)
Notes to the Financial Statements
June 30, 2019
45 (Continued)
(5) Program Loans Receivable
The following summarizes program loans receivable, net of allowance for estimated losses, activity for the
Authority for the year ended June 30, 2019:
Net program (Increase)/ Net programloans decrease in loans
receivable Loan Loan loan loss receivableJune 30, 2018 disbursements repayments allowance June 30, 2019
(Dollars in thousands)
Governmental Funds:
Illinois Affordable Housing
Trust Fund $ 287,492 20,671 (15,547) (264) 292,352
HOME Program Fund 253,462 21,583 (7,791) 5,404 272,658
Hardest Hit Fund 1,968 — (1,325) 145 788
Nonmajor governmental funds 84,712 4,362 (339) (644) 88,091
Total Governmental
Funds $ 627,634 46,616 (25,002) 4,641 653,889
Proprietary Funds:
Administrative Fund $ 72,955 15,646 (24,899) 1,205 64,907
Mortgage Loan Program Fund:
Housing Bonds 234,583 5,970 (48,692) (92) 191,769
Multifamily Initiative Bonds 41,669 — (972) 20 40,717
Multifamily Revenue Bonds 46,844 8,660 (6,986) (1,096) 47,422
Affordable Housing Program
Trust Fund Bonds 7,842 — (3,343) 2,863 7,362
Total Mortgage Loan
Program Fund 330,938 14,630 (59,993) 1,695 287,270
Single Family Program Fund:
Homeowner Mortgage
Revenue Bonds 182,959 1,393 (25,595) 495 159,252
Revenue Bonds 533 — (132) — 401
Total Single Family
Program Fund 183,492 1,393 (25,727) 495 159,653
Total Proprietary
Funds $ 587,385 31,669 (110,619) 3,395 511,830
Loans receivable in the Mortgage Loan Program Fund are secured by first mortgage liens on the related
developments. Each development is subject to a regulatory agreement under which the Authority has certain
powers relating to rents, profits, occupancy, management, and operations. Monies are required to be
deposited in reserve accounts monthly by all mortgagors for real estate tax reserves and by substantially all
mortgagors for insurance and replacement reserves. See note 9 regarding these reserves and other deposits
held in escrow.
ILLINOIS HOUSING DEVELOPMENT AUTHORITY
(A Component Unit of the State of Illinois)
Notes to the Financial Statements
June 30, 2019
46 (Continued)
The ability of the mortgagors to make required payments on the mortgage loans receivable depends
principally upon the related developments achieving and sustaining sufficient occupancy and rental levels to
support such payments. With respect to most developments financed from proceeds of Housing Bonds, the
Authority, HUD, and the owners of the developments have entered into agreements whereby HUD will make,
under its Section 8 Program, housing assistance payments for the developments. With respect to a portion of
loans within its Housing Bond accounts, the Authority has made loans to finance developments entitled to
interest reduction payments by HUD under Section 236 of the National Housing Act for all or a portion of the
dwelling units in the developments. Such federal subsidies, together with the rents to be paid by the tenants,
are estimated by the Authority prior to its issuing an initial mortgage loan commitment, to provide sufficient
funds to pay the costs of operation, maintenance, administration, mortgage payments, and Authority fees
with respect to each of the developments.
At June 30, 2019, for loans financed under the Mortgage Loan Program Fund, two loans were in arrears in
amounts equal to more than three months debt service payments or required deposits to tax and insurance
and/or replacement reserves, totaling $357,013 and $620,432, respectively.
For certain past delinquencies, the related developments have not been able to generate net rental income
sufficient to pay scheduled debt service and reserve deposits in full. In the opinion of the Authority, these
deficiencies of net rental income have arisen for various reasons including (i) the existence of physical
defects in the development which have caused operational problems, (ii) higher than anticipated operating
expenses of the development, and (iii) depressed rental market conditions in the development’s local area.
In certain cases, cash deficiencies of developments, including certain developments as to which the related
mortgage loans are not delinquent as to scheduled debt service payments or required reserve deposits, have
been funded in part by advances from the owners of the respective developments. However, there generally
can be no assurance that the owners will make additional advances for this purpose. For certain mortgage
loans, the Authority holds reserve deposits and letters of credit that may be applied toward delinquencies.
The Authority has pursued actions available under the mortgage and regulatory agreements to cure certain
delinquencies. With respect to some developments, the need for capital improvements, repairs, marketing
campaigns and other expenditures may be indicated. Where necessary and appropriate, the Authority has
committed and/or advanced residual income loans from the Administrative Fund or mortgage loan increases
from the related program account to finance these expenditures. In certain instances, the Authority has
initiated actions to effect necessary changes in the management of the developments. In addition, the
Authority has, in some cases, filed suit against the applicable general contractors and/or bonding companies
seeking corrections of the development’s physical defects and has instituted foreclosure proceedings for
certain developments.
The Authority’s policy for converting mortgage loans, except for loans financed under the Single-Family
Mortgage Loan Program, to nonaccrual status is to discontinue the accrual of interest when a loan becomes
90 days past due. In addition, the Authority does not accrue interest income on loans in which payments are
to be made from residual receipts of the development. Payments on such loans are recognized only as
received. For loans receivable within the Single-Family Mortgage Loan Program, the Authority accrues
interest income on all loans unless they become real estate owned properties, at which time the accrual is
suspended.
ILLINOIS HOUSING DEVELOPMENT AUTHORITY
(A Component Unit of the State of Illinois)
Notes to the Financial Statements
June 30, 2019
47 (Continued)
The Authority does not accrue interest income on approximately $6.4 million of mortgage loans recorded in
the Administrative Fund. Payments made on such loans, which generally are payable from residual receipts,
if any, of the affected development funds, are recognized only as received. The annual amount of interest on
these loans is approximately $123,000.
The Authority, through its Housing Partnership Program, provides loans to not-for-profit organizations,
community groups and cities to finance the rehabilitation of existing housing and for the construction of new
housing for low and moderate income persons and families. The program’s activities are recorded in the
Administrative Fund. At June 30, 2019, there is one loan receivable under this program in the amount of
$84,539.
Under Section 542 (c) of the Housing and Community Development Act of 1992, HUD is permitted to provide
federal credit enhancement through the Federal Housing Administration (FHA) for loans for affordable
multifamily developments (FHA-HFA Risk Sharing Program). In June 1994, the Authority entered into a Risk
Sharing Agreement (the Agreement) with HUD that permitted the Authority to participate in the FHA-HFA
Risk Sharing Program, which has since been converted to a permanent program. Under this program, HUD
will insure certain mortgage loans on Multi-Family housing developments (the Risk Sharing Loans) through a
system of risk-sharing agreements. HUD has authorized the Authority to make an unlimited amount of loans
for such developments. Under the Agreement, the Authority will underwrite the Risk Sharing Loans following
its underwriting guidelines. HUD will insure the Risk Sharing Loans and will bear 10% to 90% of the loss as
elected by the Authority, in the event of a foreclosure. The Authority will bear the remainder of the risk. The
program’s service and insurance fee incomes are recorded in the Administrative Fund.
In fiscal year 2016, the Authority entered into a new financing agreement with the Federal Financing Bank
(FFB), an arm of the United States Department of Treasury, for selling beneficial ownership interests in
mortgage loans originated by housing finance agencies and insured under the FHA-HFA Risk Sharing
Program. The Authority sells beneficial ownership interest in its mortgages under this program to FFB.
Beneficial ownership interest in mortgage loans that the Authority sells to the FFB will be evidenced by
certificates of participation from the Authority. The monthly mortgage payments from the borrower will be
used to repay the interest to the FFB and principal payments will reflect the scheduled mortgage principal
payments. Through fiscal year 2019, the Authority sold beneficial ownership interests in loans for fourteen
affordable multifamily developments totaling $111.93 million to the FFB. For one of these developments as of
June 30, 2019, the Authority issued short-term tax-exempt direct bank notes in connection with the financing
of a construction loan in an amount of $6.5 million and $5.34 million. An amount equal to the principal
balance of the $6.5 million short-term note is being held as a restricted investment in the Administrative
Fund, with a corresponding liability to the bank reported as Bank Note Cash Collateral and is expected to
repay the purchaser of the note upon its maturity.
The Authority, as of June 30, 2019, has outstanding forty-three Risk Sharing Loans totaling $243,509,219
and elected that HUD assume 10% to 90% of the loss with respect to those loans. Three of these loans
totaling $16,721,365 were financed through the issuance of the Authority’s Housing Bonds, eight loans
totaling $40,994,535 were financed through the issuance of the Authority’s Multi-Family Initiative Bonds,
seven loans totaling $53,501,842 were financed through the issuance of the Authority’s Multifamily Revenue
Bonds and three loans totaling $12,336,070 were financed by the Administrative Fund. The remaining
twenty-two loans totaling $119,955,406 are not included in the Authority’s financial statements as the
Authority sold 100% participation interests in the loans to outside parties.
ILLINOIS HOUSING DEVELOPMENT AUTHORITY
(A Component Unit of the State of Illinois)
Notes to the Financial Statements
June 30, 2019
48 (Continued)
At June 30, 2019 for loans financed under the FHA-HFA Risk Sharing Program where the Authority sold
100% participation interests in the loans to outside parties, there were no amounts in arrears equal to more
than two months debt service payments or required deposits to tax and insurance and/or replacement
reserves.
As of June 30, 2019, for mortgage loans insured with Ambac Assurance Corporation (Ambac Loans) on
Multi-Family housing developments under the Authority’s Mortgage Participation Certificate Program, the
Authority has outstanding four Ambac Loans totaling $13,560,504. These loans are not included in the
Authority’s financial statements as the Authority sold 100% participation interests in the loans to outside
parties. Ambac has guaranteed repayment of principal and interest due on a timely or accelerated basis in
accordance with the agreement between the Authority and Ambac. The agreement allows (or provides) the
Authority to share its risk with Ambac on the aggregate loan portfolio after the satisfaction of certain
requirements and thresholds.
At June 30, 2019, for loans financed under the Mortgage Participation Certificate Program where the
Authority sold 100% participation interests in the loans to outside parties, one loan was in arrears in amounts
equal to more than three months debt service payments and required deposits to tax and insurance and/or
replacement reserves, totaling $9,061 and $152,541, respectively. The loss reserve for loans financed under
this program, totaling $2,233,549 as of June 30, 2019, is recorded in accrued liabilities (and other) is
recorded in the Administrative Fund.
With respect to the mortgage loans funded by the Homeowner Mortgage Revenue Bonds, a substantial
majority of all delinquent mortgage loans receivable at June 30, 2019, were covered by pool insurance
policies which provide for loss claim reimbursement up to an aggregate limit equal to 3.5% of the aggregate
original principal amount of mortgage loans so covered. With respect to these pool insurance policies, some
have reached the maximum reimbursements allowable for loss claims and as a result may not fully cover any
losses experienced, and therefore the Authority establishes a provision for estimated losses related to such
conditions.
The Authority has reviewed each program loan receivable, including those for developments in the
construction or rent-up phases, for the purpose of determining ultimate collectability. The Authority believes
that the allowances for estimated losses at June 30, 2019 in the accompanying financial statements are
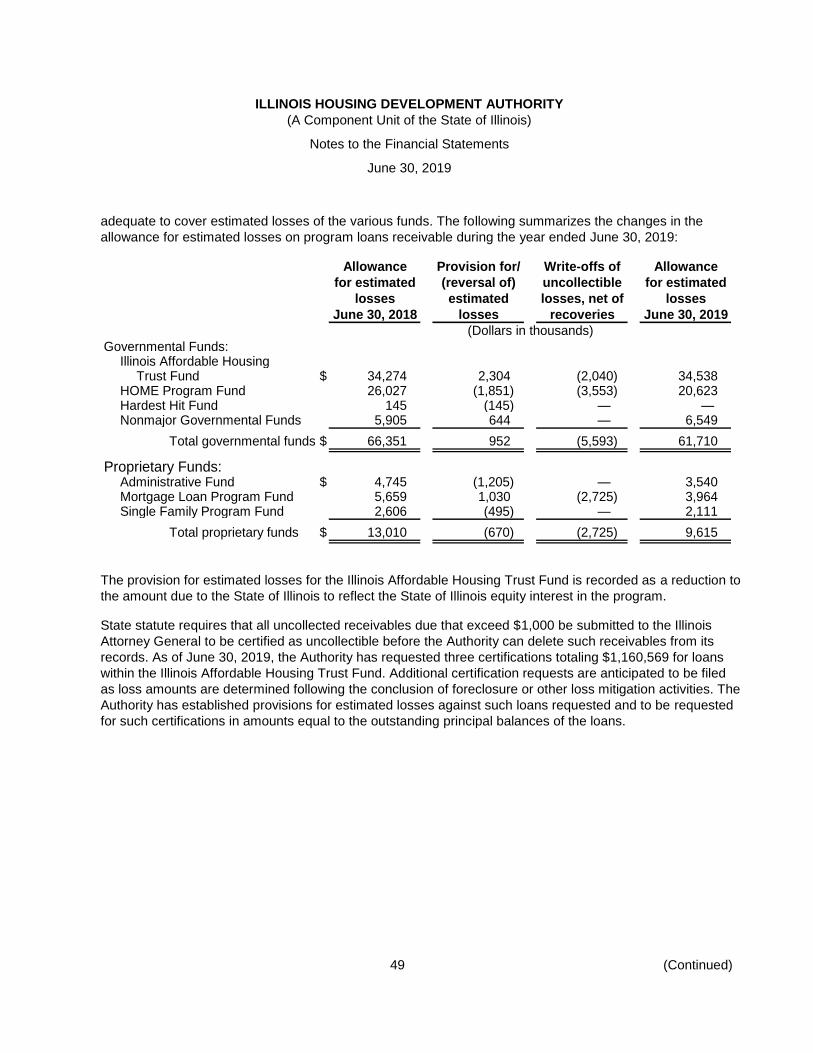
ILLINOIS HOUSING DEVELOPMENT AUTHORITY
(A Component Unit of the State of Illinois)
Notes to the Financial Statements
June 30, 2019
49 (Continued)
adequate to cover estimated losses of the various funds. The following summarizes the changes in the
allowance for estimated losses on program loans receivable during the year ended June 30, 2019:
Allowance Provision for/ Write-offs of Allowance
for estimated (reversal of) uncollectible for estimated
losses estimated losses, net of losses
June 30, 2018 losses recoveries June 30, 2019
(Dollars in thousands)
Governmental Funds:Illinois Affordable Housing
Trust Fund $ 34,274 2,304 (2,040) 34,538 HOME Program Fund 26,027 (1,851) (3,553) 20,623 Hardest Hit Fund 145 (145) — — Nonmajor Governmental Funds 5,905 644 — 6,549
Total governmental funds $ 66,351 952 (5,593) 61,710
Proprietary Funds:Administrative Fund $ 4,745 (1,205) — 3,540 Mortgage Loan Program Fund 5,659 1,030 (2,725) 3,964 Single Family Program Fund 2,606 (495) — 2,111
Total proprietary funds $ 13,010 (670) (2,725) 9,615
The provision for estimated losses for the Illinois Affordable Housing Trust Fund is recorded as a reduction to
the amount due to the State of Illinois to reflect the State of Illinois equity interest in the program.
State statute requires that all uncollected receivables due that exceed $1,000 be submitted to the Illinois
Attorney General to be certified as uncollectible before the Authority can delete such receivables from its
records. As of June 30, 2019, the Authority has requested three certifications totaling $1,160,569 for loans
within the Illinois Affordable Housing Trust Fund. Additional certification requests are anticipated to be filed
as loss amounts are determined following the conclusion of foreclosure or other loss mitigation activities. The
Authority has established provisions for estimated losses against such loans requested and to be requested
for such certifications in amounts equal to the outstanding principal balances of the loans.
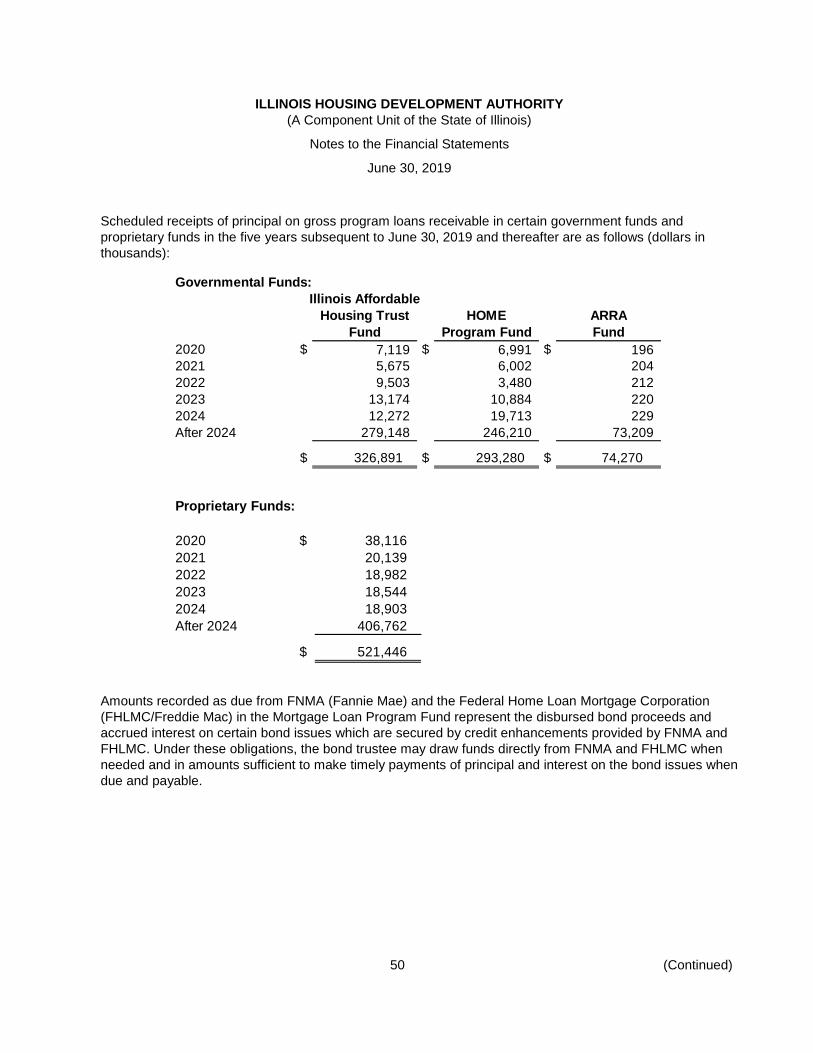
ILLINOIS HOUSING DEVELOPMENT AUTHORITY
(A Component Unit of the State of Illinois)
Notes to the Financial Statements
June 30, 2019
50 (Continued)
Scheduled receipts of principal on gross program loans receivable in certain government funds and
proprietary funds in the five years subsequent to June 30, 2019 and thereafter are as follows (dollars in
thousands):
Governmental Funds:
Illinois Affordable
Housing Trust HOME ARRA
Fund Program Fund Fund
2020 $ 7,119 $ 6,991 $ 196
2021 5,675 6,002 204
2022 9,503 3,480 212
2023 13,174 10,884 220
2024 12,272 19,713 229
After 2024 279,148 246,210 73,209
$ 326,891 $ 293,280 $ 74,270
Proprietary Funds:
2020 $ 38,116
2021 20,139
2022 18,982
2023 18,544
2024 18,903
After 2024 406,762
$ 521,446
Amounts recorded as due from FNMA (Fannie Mae) and the Federal Home Loan Mortgage Corporation
(FHLMC/Freddie Mac) in the Mortgage Loan Program Fund represent the disbursed bond proceeds and
accrued interest on certain bond issues which are secured by credit enhancements provided by FNMA and
FHLMC. Under these obligations, the bond trustee may draw funds directly from FNMA and FHLMC when
needed and in amounts sufficient to make timely payments of principal and interest on the bond issues when
due and payable.
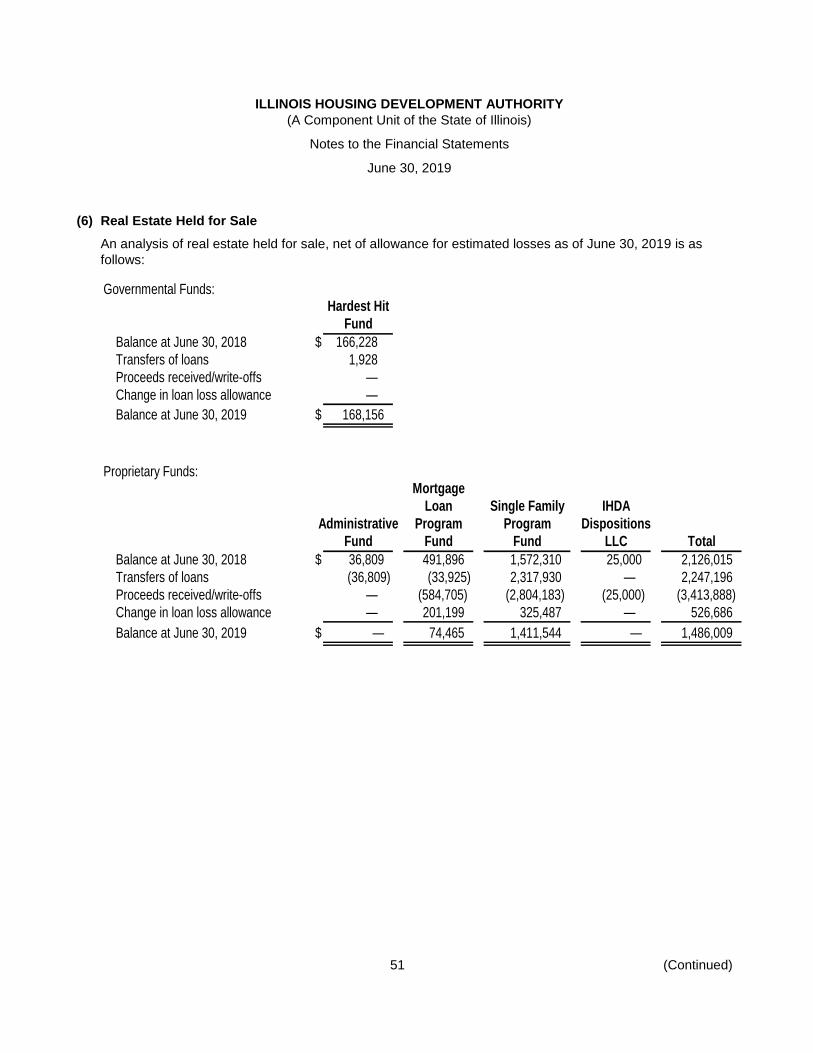
ILLINOIS HOUSING DEVELOPMENT AUTHORITY
(A Component Unit of the State of Illinois)
Notes to the Financial Statements
June 30, 2019
51 (Continued)
(6) Real Estate Held for Sale
An analysis of real estate held for sale, net of allowance for estimated losses as of June 30, 2019 is as
follows:
Governmental Funds:Hardest Hit
Fund
Balance at June 30, 2018 $ 166,228
Transfers of loans 1,928
Proceeds received/write-offs —
Change in loan loss allowance —
Balance at June 30, 2019 $ 168,156
Proprietary Funds:Mortgage
Loan Single Family IHDA
Administrative Program Program Dispositions
Fund Fund Fund LLC Total
Balance at June 30, 2018 $ 36,809 491,896 1,572,310 25,000 2,126,015
Transfers of loans (36,809) (33,925) 2,317,930 — 2,247,196
Proceeds received/write-offs — (584,705) (2,804,183) (25,000) (3,413,888)
Change in loan loss allowance — 201,199 325,487 — 526,686
Balance at June 30, 2019 $ — 74,465 1,411,544 — 1,486,009
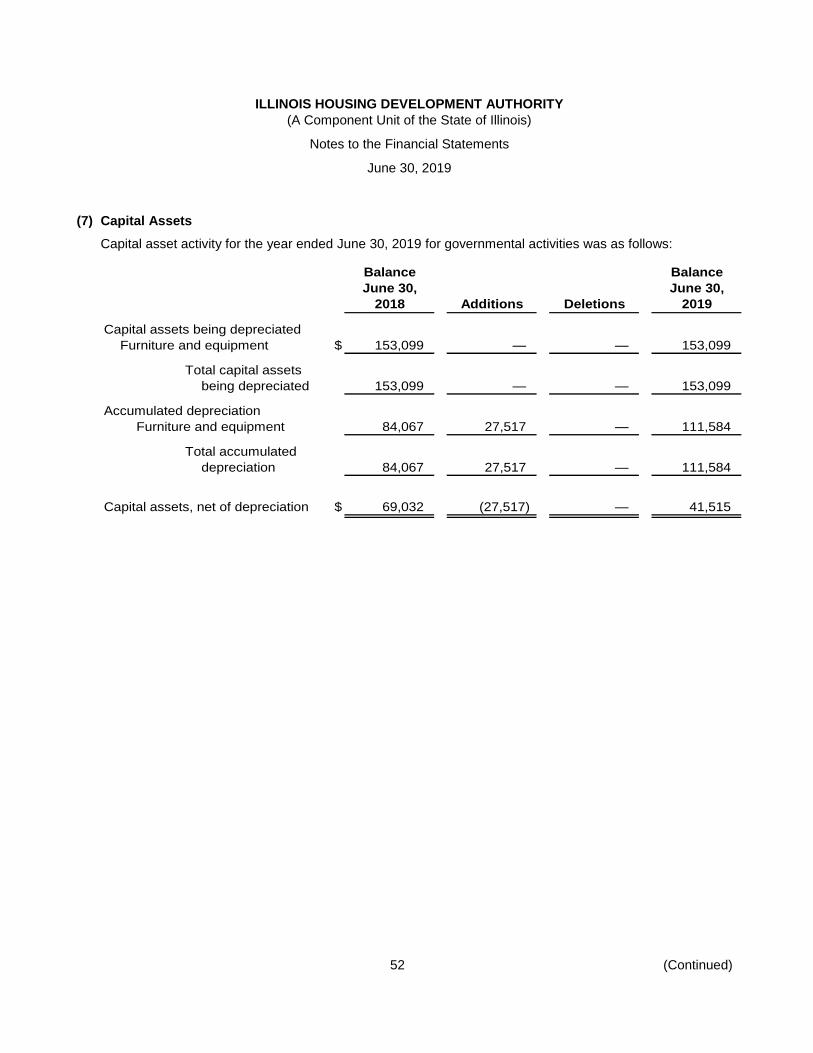
ILLINOIS HOUSING DEVELOPMENT AUTHORITY
(A Component Unit of the State of Illinois)
Notes to the Financial Statements
June 30, 2019
52 (Continued)
(7) Capital Assets
Capital asset activity for the year ended June 30, 2019 for governmental activities was as follows:
Balance Balance
June 30, June 30,
2018 Additions Deletions 2019
Capital assets being depreciated
Furniture and equipment $ 153,099 — — 153,099
Total capital assets
being depreciated 153,099 — — 153,099
Accumulated depreciation
Furniture and equipment 84,067 27,517 — 111,584
Total accumulated
depreciation 84,067 27,517 — 111,584
Capital assets, net of depreciation $ 69,032 (27,517) — 41,515
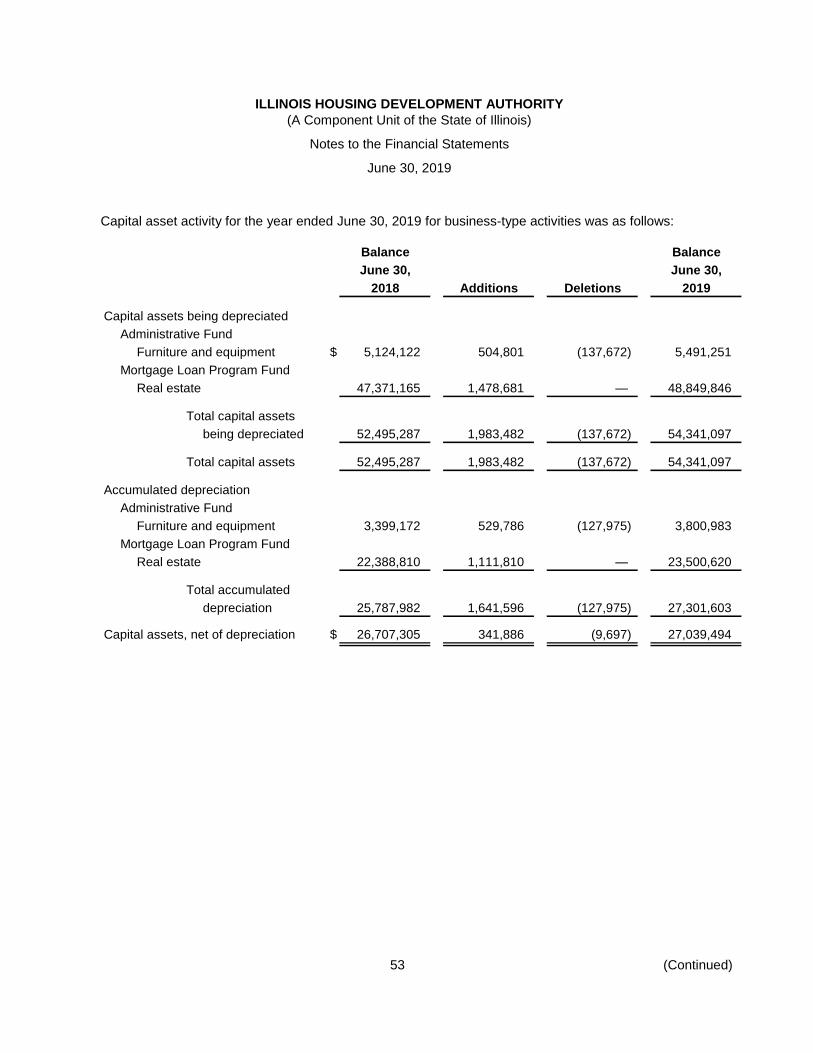
ILLINOIS HOUSING DEVELOPMENT AUTHORITY
(A Component Unit of the State of Illinois)
Notes to the Financial Statements
June 30, 2019
53 (Continued)
Capital asset activity for the year ended June 30, 2019 for business-type activities was as follows:
Balance Balance
June 30, June 30,
2018 Additions Deletions 2019
Capital assets being depreciated
Administrative Fund
Furniture and equipment $ 5,124,122 504,801 (137,672) 5,491,251
Mortgage Loan Program Fund
Real estate 47,371,165 1,478,681 — 48,849,846
Total capital assets
being depreciated 52,495,287 1,983,482 (137,672) 54,341,097
Total capital assets 52,495,287 1,983,482 (137,672) 54,341,097
Accumulated depreciation
Administrative Fund
Furniture and equipment 3,399,172 529,786 (127,975) 3,800,983
Mortgage Loan Program Fund
Real estate 22,388,810 1,111,810 — 23,500,620
Total accumulated
depreciation 25,787,982 1,641,596 (127,975) 27,301,603
Capital assets, net of depreciation $ 26,707,305 341,886 (9,697) 27,039,494
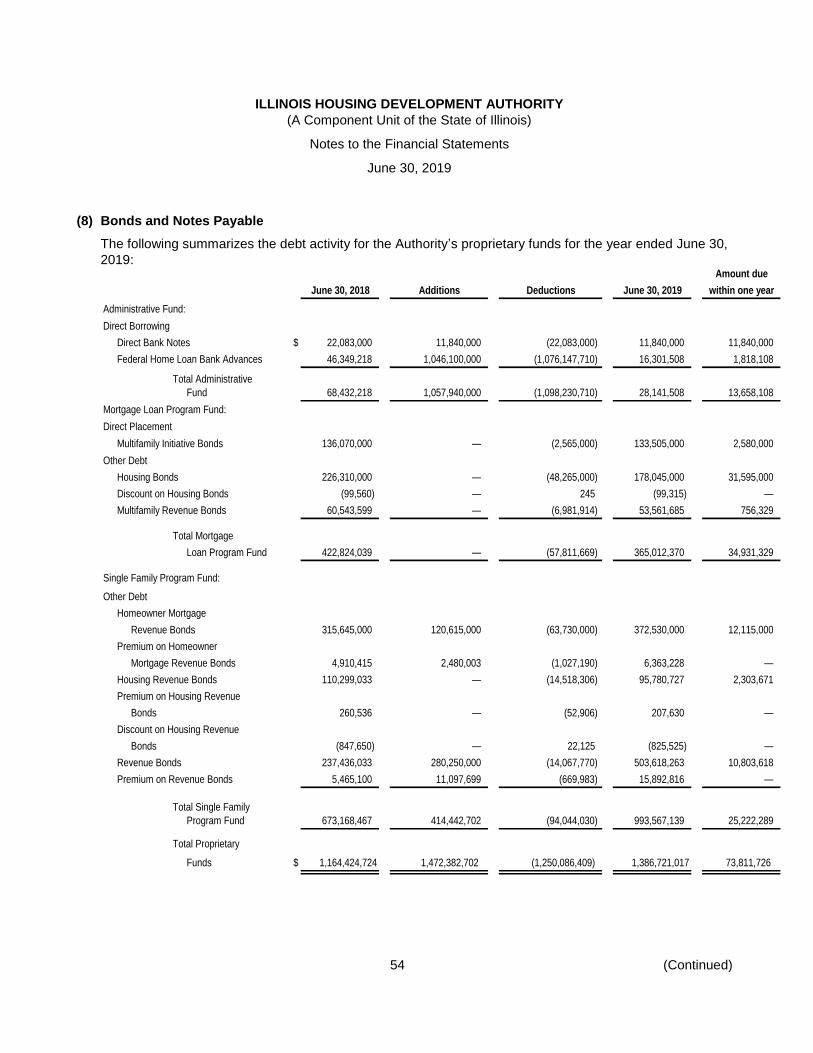
ILLINOIS HOUSING DEVELOPMENT AUTHORITY
(A Component Unit of the State of Illinois)
Notes to the Financial Statements
June 30, 2019
54 (Continued)
(8) Bonds and Notes Payable
The following summarizes the debt activity for the Authority’s proprietary funds for the year ended June 30,
2019:Amount due
June 30, 2018 Additions Deductions June 30, 2019 within one year
Administrative Fund:
Direct Borrowing
Direct Bank Notes $ 22,083,000 11,840,000 (22,083,000) 11,840,000 11,840,000
Federal Home Loan Bank Advances 46,349,218 1,046,100,000 (1,076,147,710) 16,301,508 1,818,108
Total Administrative
Fund 68,432,218 1,057,940,000 (1,098,230,710) 28,141,508 13,658,108
Mortgage Loan Program Fund:
Direct Placement
Multifamily Initiative Bonds 136,070,000 — (2,565,000) 133,505,000 2,580,000
Other Debt
Housing Bonds 226,310,000 — (48,265,000) 178,045,000 31,595,000
Discount on Housing Bonds (99,560) — 245 (99,315) —
Multifamily Revenue Bonds 60,543,599 — (6,981,914) 53,561,685 756,329
Total Mortgage
Loan Program Fund 422,824,039 — (57,811,669) 365,012,370 34,931,329
Single Family Program Fund:
Other Debt
Homeowner Mortgage
Revenue Bonds 315,645,000 120,615,000 (63,730,000) 372,530,000 12,115,000
Premium on Homeowner
Mortgage Revenue Bonds 4,910,415 2,480,003 (1,027,190) 6,363,228 —
Housing Revenue Bonds 110,299,033 — (14,518,306) 95,780,727 2,303,671
Premium on Housing Revenue
Bonds 260,536 — (52,906) 207,630 —
Discount on Housing Revenue
Bonds (847,650) — 22,125 (825,525) —
Revenue Bonds 237,436,033 280,250,000 (14,067,770) 503,618,263 10,803,618
Premium on Revenue Bonds 5,465,100 11,097,699 (669,983) 15,892,816 —
Total Single Family
Program Fund 673,168,467 414,442,702 (94,044,030) 993,567,139 25,222,289
Total Proprietary
Funds $ 1,164,424,724 1,472,382,702 (1,250,086,409) 1,386,721,017 73,811,726
ILLINOIS HOUSING DEVELOPMENT AUTHORITY
(A Component Unit of the State of Illinois)
Notes to the Financial Statements
June 30, 2019
55 (Continued)
Bonds and notes outstanding are general obligations (G.O.) of the Authority with the exception of
Homeowner Mortgage Revenue Bonds, Housing Revenue Bonds, Revenue Bonds, Multi-Family Initiative
Bonds and Multifamily Revenue Bonds, which are special limited obligations (S.L.O.) of the Authority. S.L.O.
bonds, other than Housing Revenue Bonds, Revenue Bonds, and specific series of Homeowner Mortgage
Revenue Bonds are payable from pledged property as defined in their respective general resolutions.
Housing Revenue Bonds, Revenue Bonds, and specific series of Homeowner Mortgage Revenue Bonds are
payable from pledged mortgage-backed securities. Certain issues of Multi-Family Initiative Bonds are credit
enhanced by FNMA and FHLMC. The Authority has also pledged its general obligation to the payment of the
Affordable Housing Program Trust Fund Bonds to a limited extent and amounts. Per GASB Statement No.
88 disclosure requirements, the Authority is required to disclose direct borrowings, direct placement of debt,
as well as other debt that it may hold. As seen in the table above, the Authority currently holds $28,141,508
in direct borrowings of debt, all within the Administrative fund. The Authority also holds $133,505,000 in
direct placements of debt, all within the Mortgage Loan Program fund. The remainder of debt held by the
Authority is classified as Other Debt, and is located within the Mortgage Loan Program Fund, $231,507,370,
and the Single-Family Program Fund, $993,567,139, for an Other Debt total of $1,225,074,509.
The Authority has pledged future mortgage loan and mortgage backed security revenues, net of specified
operating expenses, to repay outstanding principal $1.16 billion of S.L.O. bonds as noted in the following
schedules for the Mortgage Loan Program Fund and Single-Family Program Fund. The total principal and
interest remaining to be paid on the S.L.O. Bonds is $1.76 billion. For S.L.O. bonds payable from pledged
property, interest paid for the current year was $25.6 million, and total related mortgage loan principal and
interest received were $34.2 million and $13.7 million, respectively.
Bonds and notes outstanding at June 30, 2019 are as follows. Listed maturity dates are indicated as
calendar years. The June 30, 2018 amounts are shown for comparative purposes only.
The Authority’s outstanding obligations from direct borrowing relating to business-type activities contain
provisions declaring events of default based on nonpayment on monies owed, failure to meet certain
conditions under the governing documents, the Authority ceasing to be eligible as a housing associate under
the Act and other defined provisions within the applicable agreements. The lenders under each of the
agreements have rights of principal acceleration under the governing documents based on aforementioned
events of default. Subject to the provisions outlined within the respective agreements, additional remedies
and enforcement exist.
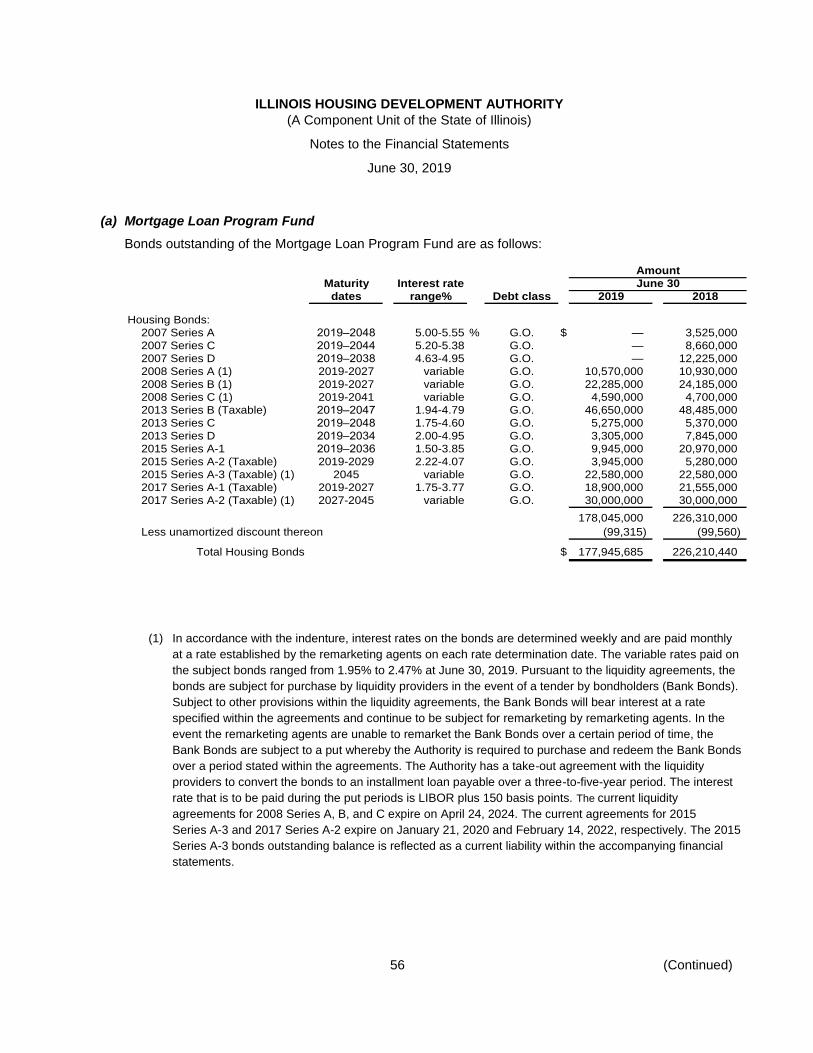
ILLINOIS HOUSING DEVELOPMENT AUTHORITY
(A Component Unit of the State of Illinois)
Notes to the Financial Statements
June 30, 2019
56 (Continued)
(a) Mortgage Loan Program Fund
Bonds outstanding of the Mortgage Loan Program Fund are as follows:
Amount
Maturity Interest rate June 30
dates range% Debt class 2019 2018
Housing Bonds:
2007 Series A 2019–2048 5.00-5.55 % G.O. $ — 3,525,000
2007 Series C 2019–2044 5.20-5.38 G.O. — 8,660,000
2007 Series D 2019–2038 4.63-4.95 G.O. — 12,225,000
2008 Series A (1) 2019-2027 variable G.O. 10,570,000 10,930,000
2008 Series B (1) 2019-2027 variable G.O. 22,285,000 24,185,000
2008 Series C (1) 2019-2041 variable G.O. 4,590,000 4,700,000
2013 Series B (Taxable) 2019–2047 1.94-4.79 G.O. 46,650,000 48,485,000
2013 Series C 2019–2048 1.75-4.60 G.O. 5,275,000 5,370,000
2013 Series D 2019–2034 2.00-4.95 G.O. 3,305,000 7,845,000
2015 Series A-1 2019–2036 1.50-3.85 G.O. 9,945,000 20,970,000
2015 Series A-2 (Taxable) 2019-2029 2.22-4.07 G.O. 3,945,000 5,280,000
2015 Series A-3 (Taxable) (1) 2045 variable G.O. 22,580,000 22,580,000
2017 Series A-1 (Taxable) 2019-2027 1.75-3.77 G.O. 18,900,000 21,555,000
2017 Series A-2 (Taxable) (1) 2027-2045 variable G.O. 30,000,000 30,000,000
178,045,000 226,310,000
Less unamortized discount thereon (99,315) (99,560)
Total Housing Bonds $ 177,945,685 226,210,440
(1) In accordance with the indenture, interest rates on the bonds are determined weekly and are paid monthly
at a rate established by the remarketing agents on each rate determination date. The variable rates paid on
the subject bonds ranged from 1.95% to 2.47% at June 30, 2019. Pursuant to the liquidity agreements, the
bonds are subject for purchase by liquidity providers in the event of a tender by bondholders (Bank Bonds).
Subject to other provisions within the liquidity agreements, the Bank Bonds will bear interest at a rate
specified within the agreements and continue to be subject for remarketing by remarketing agents. In the
event the remarketing agents are unable to remarket the Bank Bonds over a certain period of time, the
Bank Bonds are subject to a put whereby the Authority is required to purchase and redeem the Bank Bonds
over a period stated within the agreements. The Authority has a take-out agreement with the liquidity
providers to convert the bonds to an installment loan payable over a three-to-five-year period. The interest
rate that is to be paid during the put periods is LIBOR plus 150 basis points. The current liquidity
agreements for 2008 Series A, B, and C expire on April 24, 2024. The current agreements for 2015
Series A-3 and 2017 Series A-2 expire on January 21, 2020 and February 14, 2022, respectively. The 2015
Series A-3 bonds outstanding balance is reflected as a current liability within the accompanying financial
statements.
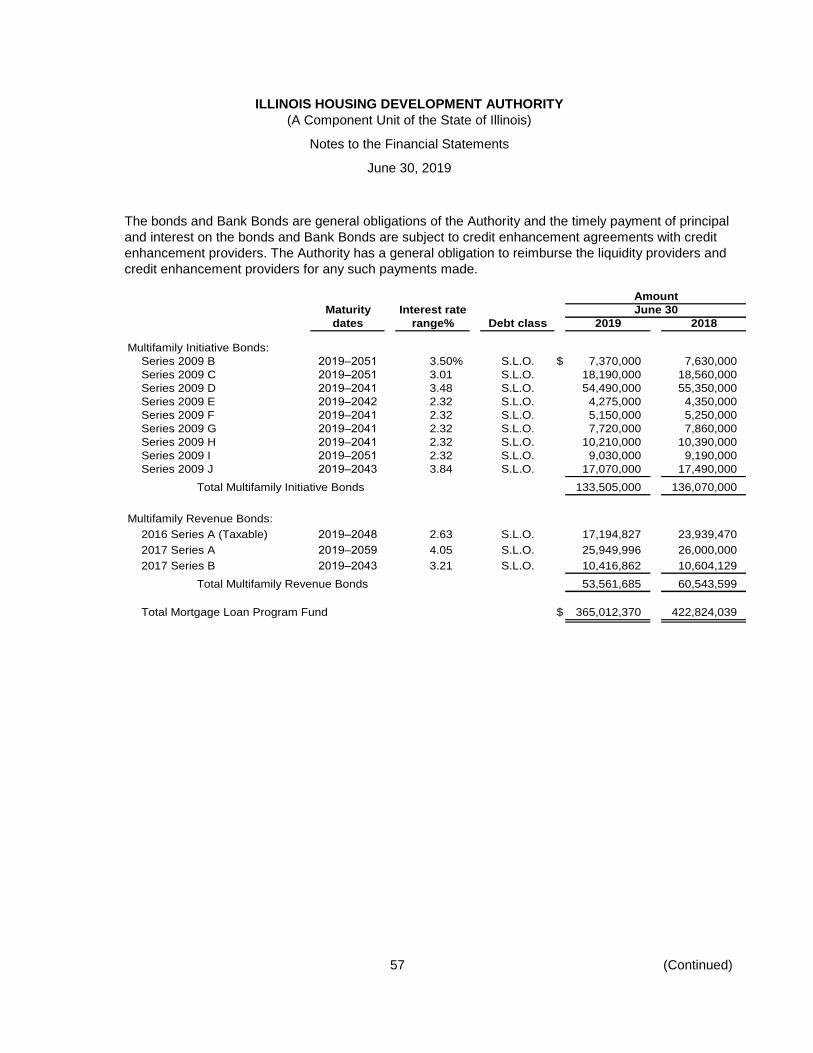
ILLINOIS HOUSING DEVELOPMENT AUTHORITY
(A Component Unit of the State of Illinois)
Notes to the Financial Statements
June 30, 2019
57 (Continued)
The bonds and Bank Bonds are general obligations of the Authority and the timely payment of principal
and interest on the bonds and Bank Bonds are subject to credit enhancement agreements with credit
enhancement providers. The Authority has a general obligation to reimburse the liquidity providers and
credit enhancement providers for any such payments made.
Amount
Maturity Interest rate June 30
dates range% Debt class 2019 2018
Multifamily Initiative Bonds:
Series 2009 B 2019–2051 3.50% S.L.O. $ 7,370,000 7,630,000
Series 2009 C 2019–2051 3.01 S.L.O. 18,190,000 18,560,000
Series 2009 D 2019–2041 3.48 S.L.O. 54,490,000 55,350,000
Series 2009 E 2019–2042 2.32 S.L.O. 4,275,000 4,350,000
Series 2009 F 2019–2041 2.32 S.L.O. 5,150,000 5,250,000
Series 2009 G 2019–2041 2.32 S.L.O. 7,720,000 7,860,000
Series 2009 H 2019–2041 2.32 S.L.O. 10,210,000 10,390,000
Series 2009 I 2019–2051 2.32 S.L.O. 9,030,000 9,190,000
Series 2009 J 2019–2043 3.84 S.L.O. 17,070,000 17,490,000
Total Multifamily Initiative Bonds 133,505,000 136,070,000
Multifamily Revenue Bonds:
2016 Series A (Taxable) 2019–2048 2.63 S.L.O. 17,194,827 23,939,470
2017 Series A 2019–2059 4.05 S.L.O. 25,949,996 26,000,000
2017 Series B 2019–2043 3.21 S.L.O. 10,416,862 10,604,129
Total Multifamily Revenue Bonds 53,561,685 60,543,599
Total Mortgage Loan Program Fund $ 365,012,370 422,824,039
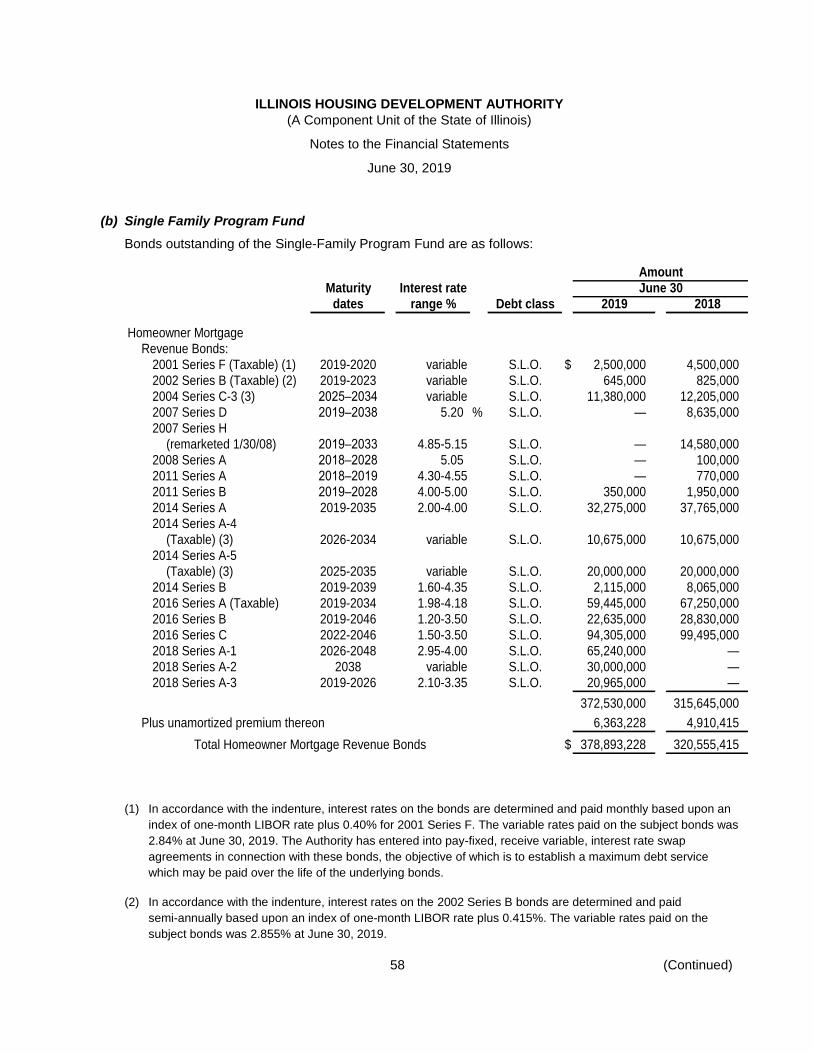
ILLINOIS HOUSING DEVELOPMENT AUTHORITY
(A Component Unit of the State of Illinois)
Notes to the Financial Statements
June 30, 2019
58 (Continued)
(b) Single Family Program Fund
Bonds outstanding of the Single-Family Program Fund are as follows:
Amount
Maturity Interest rate June 30
dates range % Debt class 2019 2018
Homeowner Mortgage
Revenue Bonds:
2001 Series F (Taxable) (1) 2019-2020 variable S.L.O. $ 2,500,000 4,500,000
2002 Series B (Taxable) (2) 2019-2023 variable S.L.O. 645,000 825,000
2004 Series C-3 (3) 2025–2034 variable S.L.O. 11,380,000 12,205,000
2007 Series D 2019–2038 5.20 % S.L.O. — 8,635,000
2007 Series H
(remarketed 1/30/08) 2019–2033 4.85-5.15 S.L.O. — 14,580,000
2008 Series A 2018–2028 5.05 S.L.O. — 100,000
2011 Series A 2018–2019 4.30-4.55 S.L.O. — 770,000
2011 Series B 2019–2028 4.00-5.00 S.L.O. 350,000 1,950,000
2014 Series A 2019-2035 2.00-4.00 S.L.O. 32,275,000 37,765,000
2014 Series A-4
(Taxable) (3) 2026-2034 variable S.L.O. 10,675,000 10,675,000
2014 Series A-5
(Taxable) (3) 2025-2035 variable S.L.O. 20,000,000 20,000,000
2014 Series B 2019-2039 1.60-4.35 S.L.O. 2,115,000 8,065,000
2016 Series A (Taxable) 2019-2034 1.98-4.18 S.L.O. 59,445,000 67,250,000
2016 Series B 2019-2046 1.20-3.50 S.L.O. 22,635,000 28,830,000
2016 Series C 2022-2046 1.50-3.50 S.L.O. 94,305,000 99,495,000
2018 Series A-1 2026-2048 2.95-4.00 S.L.O. 65,240,000 —
2018 Series A-2 2038 variable S.L.O. 30,000,000 —
2018 Series A-3 2019-2026 2.10-3.35 S.L.O. 20,965,000 —
372,530,000 315,645,000
Plus unamortized premium thereon 6,363,228 4,910,415
Total Homeowner Mortgage Revenue Bonds $ 378,893,228 320,555,415
(1) In accordance with the indenture, interest rates on the bonds are determined and paid monthly based upon an
index of one-month LIBOR rate plus 0.40% for 2001 Series F. The variable rates paid on the subject bonds was
2.84% at June 30, 2019. The Authority has entered into pay-fixed, receive variable, interest rate swap
agreements in connection with these bonds, the objective of which is to establish a maximum debt service
which may be paid over the life of the underlying bonds.
(2) In accordance with the indenture, interest rates on the 2002 Series B bonds are determined and paid
semi-annually based upon an index of one-month LIBOR rate plus 0.415%. The variable rates paid on the
subject bonds was 2.855% at June 30, 2019.
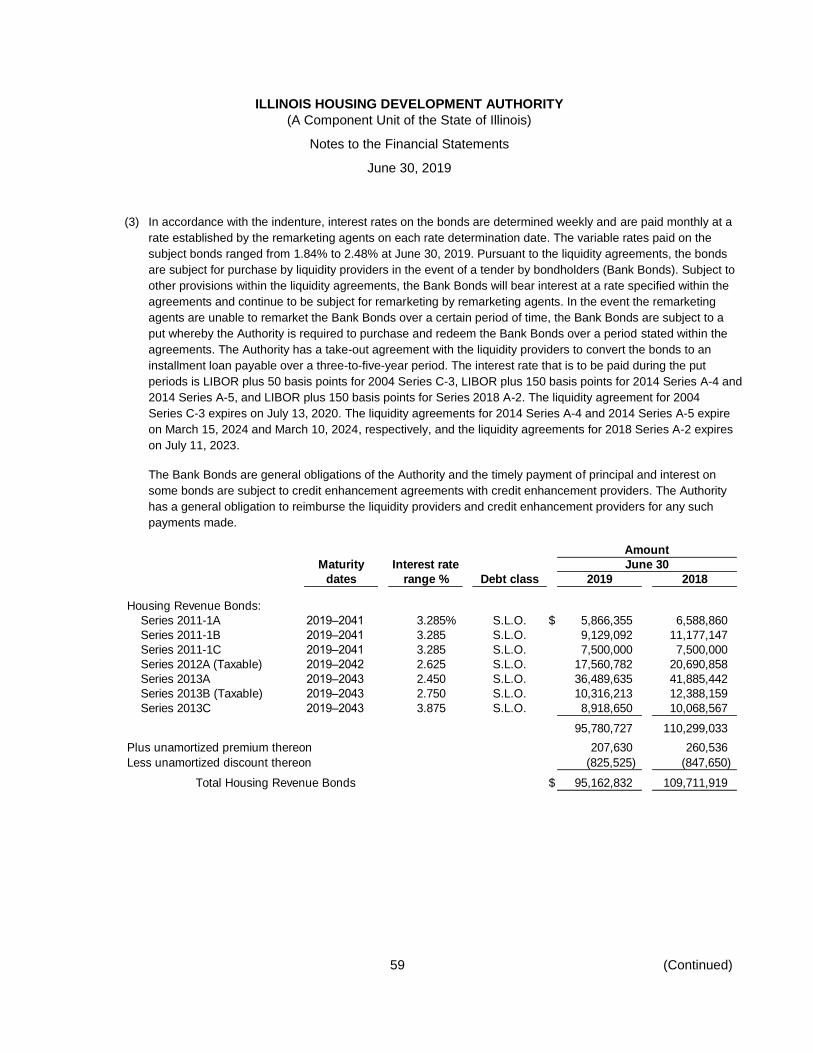
ILLINOIS HOUSING DEVELOPMENT AUTHORITY
(A Component Unit of the State of Illinois)
Notes to the Financial Statements
June 30, 2019
59 (Continued)
(3) In accordance with the indenture, interest rates on the bonds are determined weekly and are paid monthly at a
rate established by the remarketing agents on each rate determination date. The variable rates paid on the
subject bonds ranged from 1.84% to 2.48% at June 30, 2019. Pursuant to the liquidity agreements, the bonds
are subject for purchase by liquidity providers in the event of a tender by bondholders (Bank Bonds). Subject to
other provisions within the liquidity agreements, the Bank Bonds will bear interest at a rate specified within the
agreements and continue to be subject for remarketing by remarketing agents. In the event the remarketing
agents are unable to remarket the Bank Bonds over a certain period of time, the Bank Bonds are subject to a
put whereby the Authority is required to purchase and redeem the Bank Bonds over a period stated within the
agreements. The Authority has a take-out agreement with the liquidity providers to convert the bonds to an
installment loan payable over a three-to-five-year period. The interest rate that is to be paid during the put
periods is LIBOR plus 50 basis points for 2004 Series C-3, LIBOR plus 150 basis points for 2014 Series A-4 and
2014 Series A-5, and LIBOR plus 150 basis points for Series 2018 A-2. The liquidity agreement for 2004
Series C-3 expires on July 13, 2020. The liquidity agreements for 2014 Series A-4 and 2014 Series A-5 expire
on March 15, 2024 and March 10, 2024, respectively, and the liquidity agreements for 2018 Series A-2 expires
on July 11, 2023.
The Bank Bonds are general obligations of the Authority and the timely payment of principal and interest on
some bonds are subject to credit enhancement agreements with credit enhancement providers. The Authority
has a general obligation to reimburse the liquidity providers and credit enhancement providers for any such
payments made.
Amount
Maturity Interest rate June 30
dates range % Debt class 2019 2018
Housing Revenue Bonds:
Series 2011-1A 2019–2041 3.285% S.L.O. $ 5,866,355 6,588,860
Series 2011-1B 2019–2041 3.285 S.L.O. 9,129,092 11,177,147
Series 2011-1C 2019–2041 3.285 S.L.O. 7,500,000 7,500,000
Series 2012A (Taxable) 2019–2042 2.625 S.L.O. 17,560,782 20,690,858
Series 2013A 2019–2043 2.450 S.L.O. 36,489,635 41,885,442
Series 2013B (Taxable) 2019–2043 2.750 S.L.O. 10,316,213 12,388,159
Series 2013C 2019–2043 3.875 S.L.O. 8,918,650 10,068,567
95,780,727 110,299,033
Plus unamortized premium thereon 207,630 260,536
Less unamortized discount thereon (825,525) (847,650)
Total Housing Revenue Bonds $ 95,162,832 109,711,919
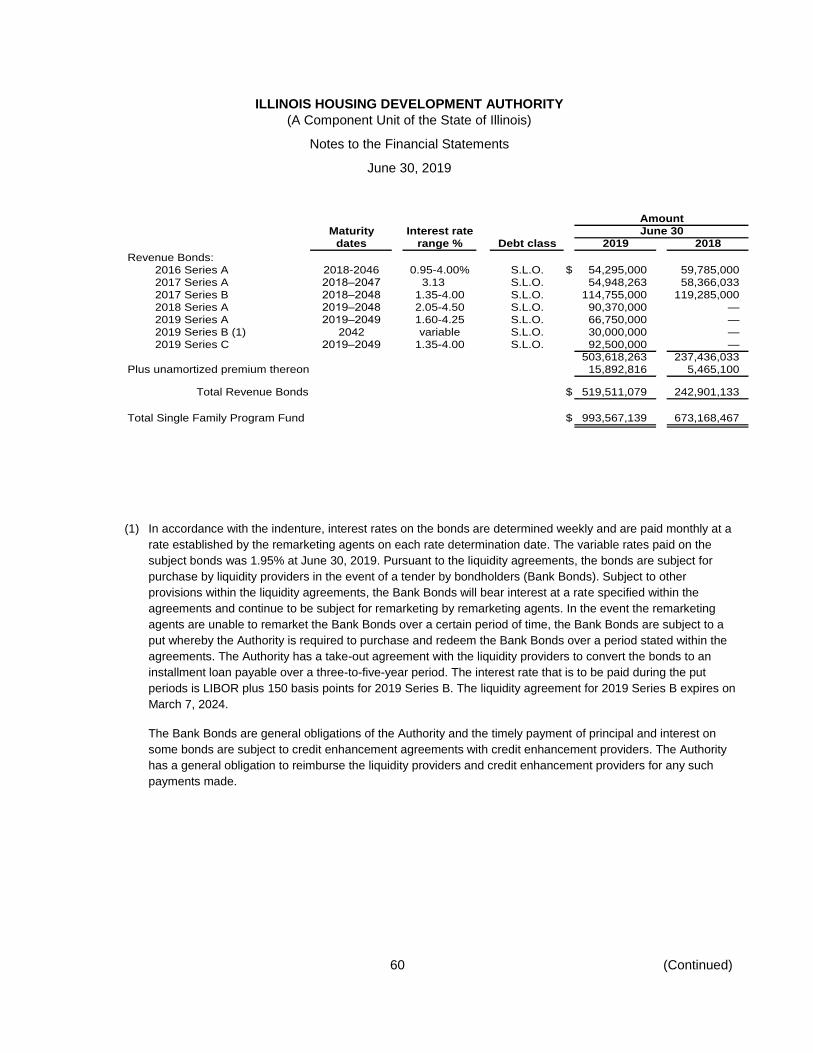
ILLINOIS HOUSING DEVELOPMENT AUTHORITY
(A Component Unit of the State of Illinois)
Notes to the Financial Statements
June 30, 2019
60 (Continued)
Amount
Maturity Interest rate June 30
dates range % Debt class 2019 2018
Revenue Bonds:
2016 Series A 2018-2046 0.95-4.00% S.L.O. $ 54,295,000 59,785,000
2017 Series A 2018–2047 3.13 S.L.O. 54,948,263 58,366,033
2017 Series B 2018–2048 1.35-4.00 S.L.O. 114,755,000 119,285,000
2018 Series A 2019–2048 2.05-4.50 S.L.O. 90,370,000 —
2019 Series A 2019–2049 1.60-4.25 S.L.O. 66,750,000 —
2019 Series B (1) 2042 variable S.L.O. 30,000,000 —
2019 Series C 2019–2049 1.35-4.00 S.L.O. 92,500,000 —
503,618,263 237,436,033
Plus unamortized premium thereon 15,892,816 5,465,100
Total Revenue Bonds $ 519,511,079 242,901,133
Total Single Family Program Fund $ 993,567,139 673,168,467
(1) In accordance with the indenture, interest rates on the bonds are determined weekly and are paid monthly at a
rate established by the remarketing agents on each rate determination date. The variable rates paid on the
subject bonds was 1.95% at June 30, 2019. Pursuant to the liquidity agreements, the bonds are subject for
purchase by liquidity providers in the event of a tender by bondholders (Bank Bonds). Subject to other
provisions within the liquidity agreements, the Bank Bonds will bear interest at a rate specified within the
agreements and continue to be subject for remarketing by remarketing agents. In the event the remarketing
agents are unable to remarket the Bank Bonds over a certain period of time, the Bank Bonds are subject to a
put whereby the Authority is required to purchase and redeem the Bank Bonds over a period stated within the
agreements. The Authority has a take-out agreement with the liquidity providers to convert the bonds to an
installment loan payable over a three-to-five-year period. The interest rate that is to be paid during the put
periods is LIBOR plus 150 basis points for 2019 Series B. The liquidity agreement for 2019 Series B expires on
March 7, 2024.
The Bank Bonds are general obligations of the Authority and the timely payment of principal and interest on
some bonds are subject to credit enhancement agreements with credit enhancement providers. The Authority
has a general obligation to reimburse the liquidity providers and credit enhancement providers for any such
payments made.
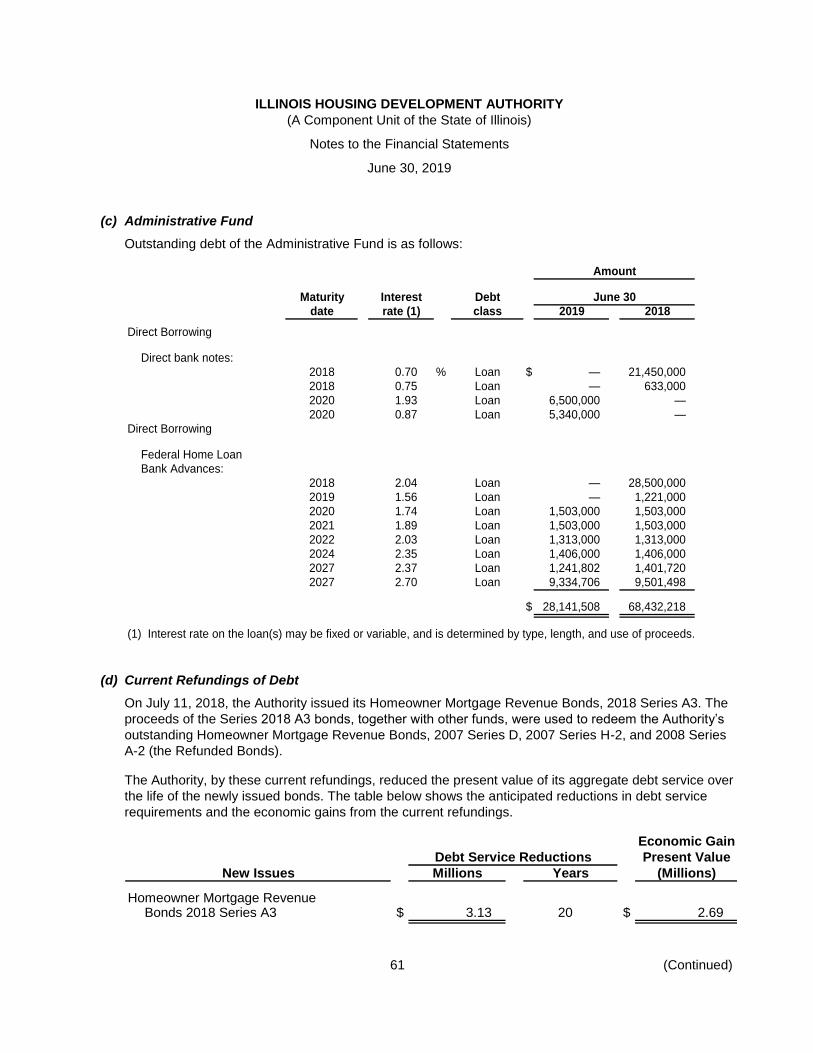
ILLINOIS HOUSING DEVELOPMENT AUTHORITY
(A Component Unit of the State of Illinois)
Notes to the Financial Statements
June 30, 2019
61 (Continued)
(c) Administrative Fund
Outstanding debt of the Administrative Fund is as follows:
Amount
Maturity Interest Debt June 30
date rate (1) class 2019 2018
Direct Borrowing
Direct bank notes:
2018 0.70 % Loan $ — 21,450,000
2018 0.75 Loan — 633,000
2020 1.93 Loan 6,500,000 —
2020 0.87 Loan 5,340,000 —
Direct Borrowing
Federal Home Loan
Bank Advances:
2018 2.04 Loan — 28,500,000
2019 1.56 Loan — 1,221,000
2020 1.74 Loan 1,503,000 1,503,000
2021 1.89 Loan 1,503,000 1,503,000
2022 2.03 Loan 1,313,000 1,313,000
2024 2.35 Loan 1,406,000 1,406,000
2027 2.37 Loan 1,241,802 1,401,720
2027 2.70 Loan 9,334,706 9,501,498
$ 28,141,508 68,432,218
(1) Interest rate on the loan(s) may be fixed or variable, and is determined by type, length, and use of proceeds.
(d) Current Refundings of Debt
On July 11, 2018, the Authority issued its Homeowner Mortgage Revenue Bonds, 2018 Series A3. The
proceeds of the Series 2018 A3 bonds, together with other funds, were used to redeem the Authority’s
outstanding Homeowner Mortgage Revenue Bonds, 2007 Series D, 2007 Series H-2, and 2008 Series
A-2 (the Refunded Bonds).
The Authority, by these current refundings, reduced the present value of its aggregate debt service over
the life of the newly issued bonds. The table below shows the anticipated reductions in debt service
requirements and the economic gains from the current refundings.
Economic Gain
Debt Service Reductions Present Value
New Issues Millions Years (Millions)
Homeowner Mortgage RevenueBonds 2018 Series A3 $ 3.13 20 $ 2.69
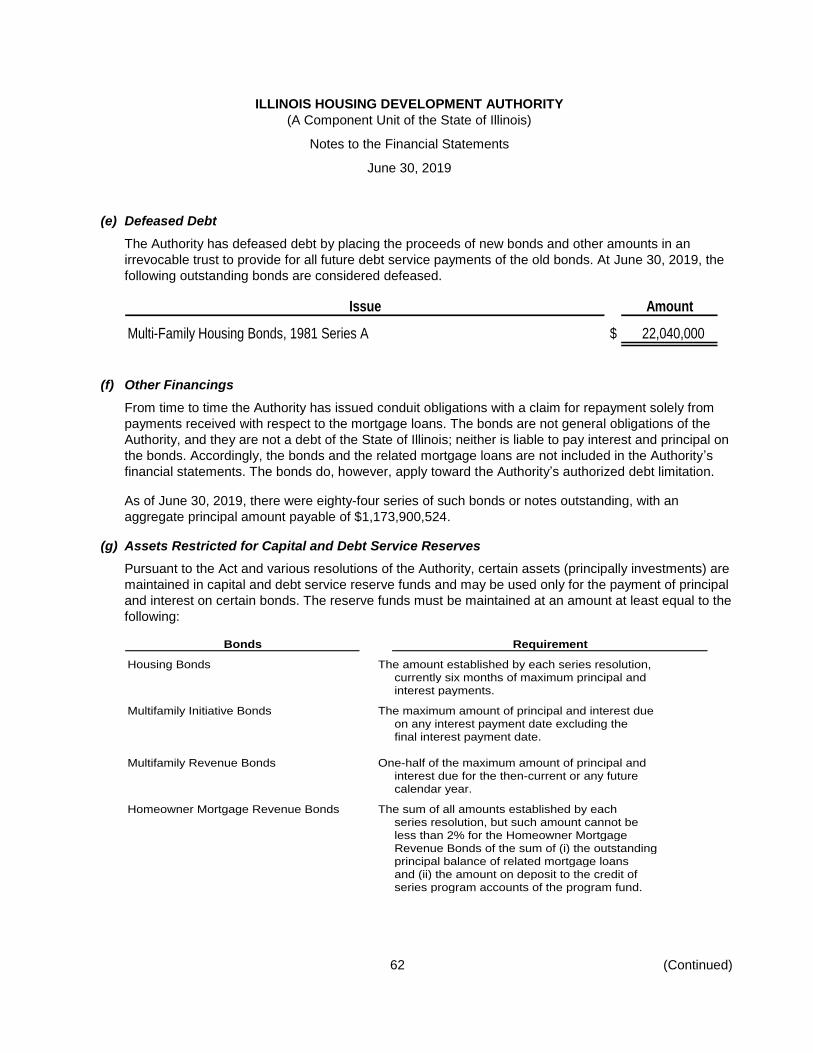
ILLINOIS HOUSING DEVELOPMENT AUTHORITY
(A Component Unit of the State of Illinois)
Notes to the Financial Statements
June 30, 2019
62 (Continued)
(e) Defeased Debt
The Authority has defeased debt by placing the proceeds of new bonds and other amounts in an
irrevocable trust to provide for all future debt service payments of the old bonds. At June 30, 2019, the
following outstanding bonds are considered defeased.
Issue Amount
Multi-Family Housing Bonds, 1981 Series A $ 22,040,000
(f) Other Financings
From time to time the Authority has issued conduit obligations with a claim for repayment solely from
payments received with respect to the mortgage loans. The bonds are not general obligations of the
Authority, and they are not a debt of the State of Illinois; neither is liable to pay interest and principal on
the bonds. Accordingly, the bonds and the related mortgage loans are not included in the Authority’s
financial statements. The bonds do, however, apply toward the Authority’s authorized debt limitation.
As of June 30, 2019, there were eighty-four series of such bonds or notes outstanding, with an
aggregate principal amount payable of $1,173,900,524.
(g) Assets Restricted for Capital and Debt Service Reserves
Pursuant to the Act and various resolutions of the Authority, certain assets (principally investments) are
maintained in capital and debt service reserve funds and may be used only for the payment of principal
and interest on certain bonds. The reserve funds must be maintained at an amount at least equal to the
following:
Bonds Requirement
Housing Bonds The amount established by each series resolution,
currently six months of maximum principal and
interest payments.
Multifamily Initiative Bonds The maximum amount of principal and interest due
on any interest payment date excluding the
final interest payment date.
Multifamily Revenue Bonds One-half of the maximum amount of principal and
interest due for the then-current or any future
calendar year.
Homeowner Mortgage Revenue Bonds The sum of all amounts established by each
series resolution, but such amount cannot be
less than 2% for the Homeowner Mortgage
Revenue Bonds of the sum of (i) the outstanding
principal balance of related mortgage loans
and (ii) the amount on deposit to the credit of
series program accounts of the program fund.
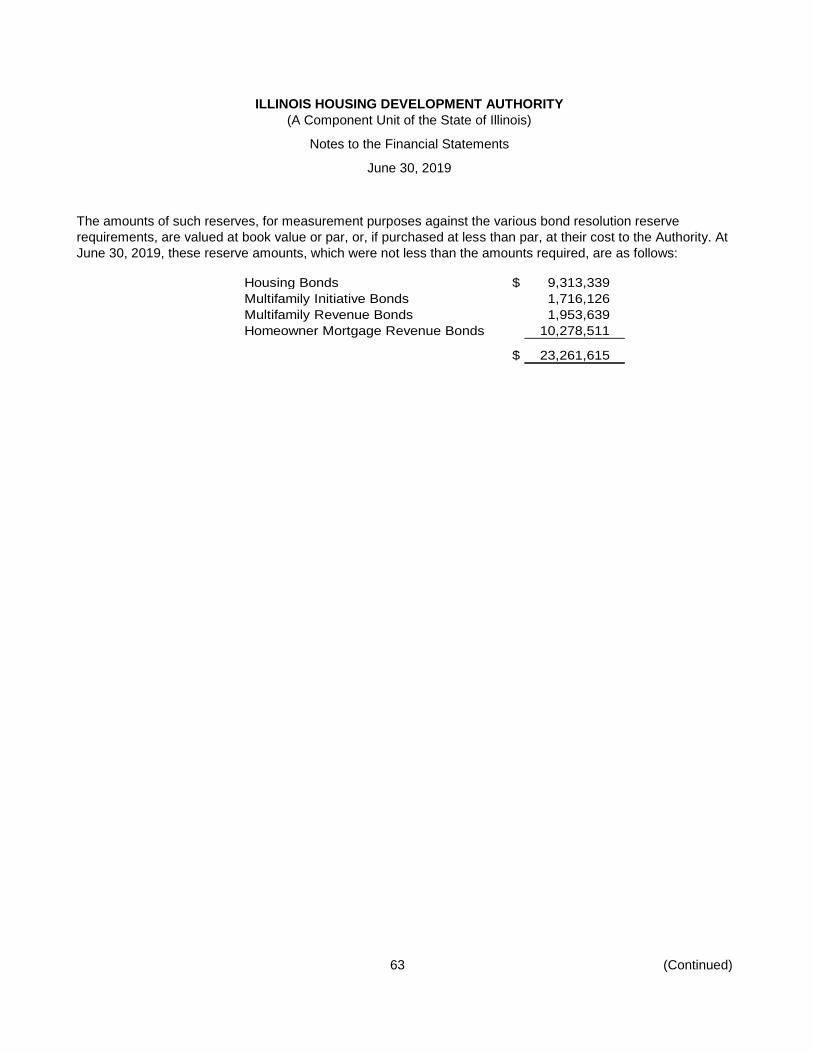
ILLINOIS HOUSING DEVELOPMENT AUTHORITY
(A Component Unit of the State of Illinois)
Notes to the Financial Statements
June 30, 2019
63 (Continued)
The amounts of such reserves, for measurement purposes against the various bond resolution reserve
requirements, are valued at book value or par, or, if purchased at less than par, at their cost to the Authority. At
June 30, 2019, these reserve amounts, which were not less than the amounts required, are as follows:
Housing Bonds $ 9,313,339
Multifamily Initiative Bonds 1,716,126
Multifamily Revenue Bonds 1,953,639
Homeowner Mortgage Revenue Bonds 10,278,511
$ 23,261,615
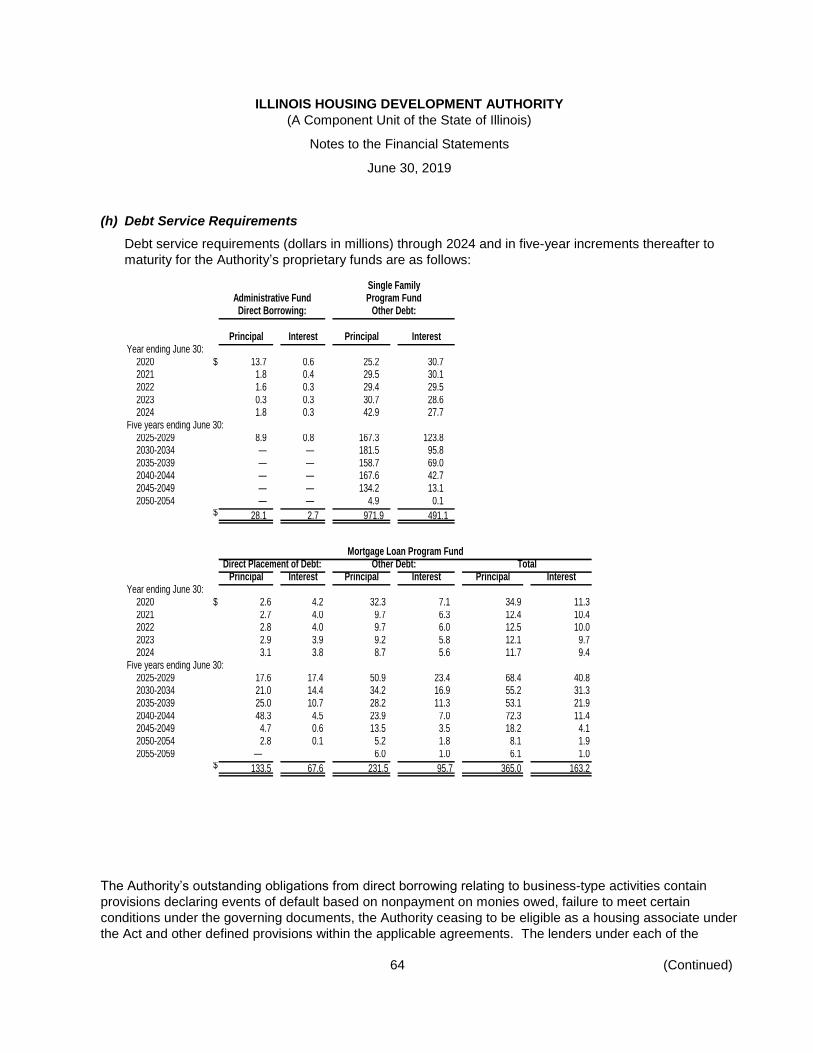
ILLINOIS HOUSING DEVELOPMENT AUTHORITY
(A Component Unit of the State of Illinois)
Notes to the Financial Statements
June 30, 2019
64 (Continued)
(h) Debt Service Requirements
Debt service requirements (dollars in millions) through 2024 and in five-year increments thereafter to
maturity for the Authority’s proprietary funds are as follows:
Single FamilyProgram Fund
Principal Interest Principal InterestYear ending June 30:
2020 $ 13.7 0.6 25.2 30.7 2021 1.8 0.4 29.5 30.1 2022 1.6 0.3 29.4 29.5 2023 0.3 0.3 30.7 28.6 2024 1.8 0.3 42.9 27.7
Five years ending June 30:2025-2029 8.9 0.8 167.3 123.8 2030-2034 — — 181.5 95.8 2035-2039 — — 158.7 69.0 2040-2044 — — 167.6 42.7 2045-2049 — — 134.2 13.1 2050-2054 — — 4.9 0.1
$ 28.1 2.7 971.9 491.1
TotalPrincipal Interest Principal Interest Principal Interest
Year ending June 30:2020 $ 2.6 4.2 32.3 7.1 34.9 11.32021 2.7 4.0 9.7 6.3 12.4 10.42022 2.8 4.0 9.7 6.0 12.5 10.02023 2.9 3.9 9.2 5.8 12.1 9.72024 3.1 3.8 8.7 5.6 11.7 9.4
Five years ending June 30:2025-2029 17.6 17.4 50.9 23.4 68.4 40.82030-2034 21.0 14.4 34.2 16.9 55.2 31.32035-2039 25.0 10.7 28.2 11.3 53.1 21.92040-2044 48.3 4.5 23.9 7.0 72.3 11.42045-2049 4.7 0.6 13.5 3.5 18.2 4.12050-2054 2.8 0.1 5.2 1.8 8.1 1.92055-2059 — 6.0 1.0 6.1 1.0
$ 133.5 67.6 231.5 95.7 365.0 163.2
Administrative FundDirect Borrowing: Other Debt:
Mortgage Loan Program FundDirect Placement of Debt: Other Debt:
The Authority’s outstanding obligations from direct borrowing relating to business-type activities contain
provisions declaring events of default based on nonpayment on monies owed, failure to meet certain
conditions under the governing documents, the Authority ceasing to be eligible as a housing associate under
the Act and other defined provisions within the applicable agreements. The lenders under each of the
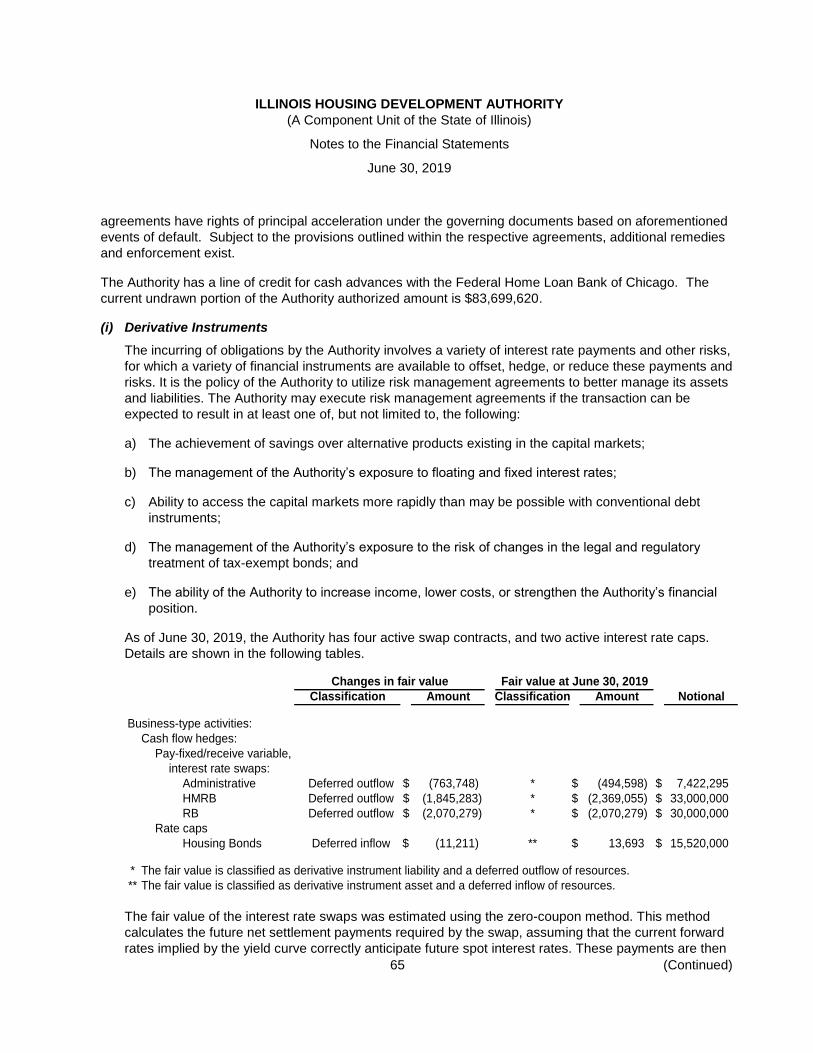
ILLINOIS HOUSING DEVELOPMENT AUTHORITY
(A Component Unit of the State of Illinois)
Notes to the Financial Statements
June 30, 2019
65 (Continued)
agreements have rights of principal acceleration under the governing documents based on aforementioned
events of default. Subject to the provisions outlined within the respective agreements, additional remedies
and enforcement exist.
The Authority has a line of credit for cash advances with the Federal Home Loan Bank of Chicago. The
current undrawn portion of the Authority authorized amount is $83,699,620.
(i) Derivative Instruments
The incurring of obligations by the Authority involves a variety of interest rate payments and other risks,
for which a variety of financial instruments are available to offset, hedge, or reduce these payments and
risks. It is the policy of the Authority to utilize risk management agreements to better manage its assets
and liabilities. The Authority may execute risk management agreements if the transaction can be
expected to result in at least one of, but not limited to, the following:
a) The achievement of savings over alternative products existing in the capital markets;
b) The management of the Authority’s exposure to floating and fixed interest rates;
c) Ability to access the capital markets more rapidly than may be possible with conventional debt
instruments;
d) The management of the Authority’s exposure to the risk of changes in the legal and regulatory
treatment of tax-exempt bonds; and
e) The ability of the Authority to increase income, lower costs, or strengthen the Authority’s financial
position.
As of June 30, 2019, the Authority has four active swap contracts, and two active interest rate caps.
Details are shown in the following tables.
Changes in fair value Fair value at June 30, 2019
Classification Amount Classification Amount Notional
Business-type activities:
Cash flow hedges:
Pay-fixed/receive variable,
interest rate swaps:
Administrative Deferred outflow $ (763,748) * $ (494,598) $ 7,422,295
HMRB Deferred outflow $ (1,845,283) * $ (2,369,055) $ 33,000,000
RB Deferred outflow $ (2,070,279) * $ (2,070,279) $ 30,000,000
Rate caps
Housing Bonds Deferred inflow $ (11,211) ** $ 13,693 $ 15,520,000
* The fair value is classified as derivative instrument liability and a deferred outflow of resources.
** The fair value is classified as derivative instrument asset and a deferred inflow of resources.
The fair value of the interest rate swaps was estimated using the zero-coupon method. This method
calculates the future net settlement payments required by the swap, assuming that the current forward
rates implied by the yield curve correctly anticipate future spot interest rates. These payments are then
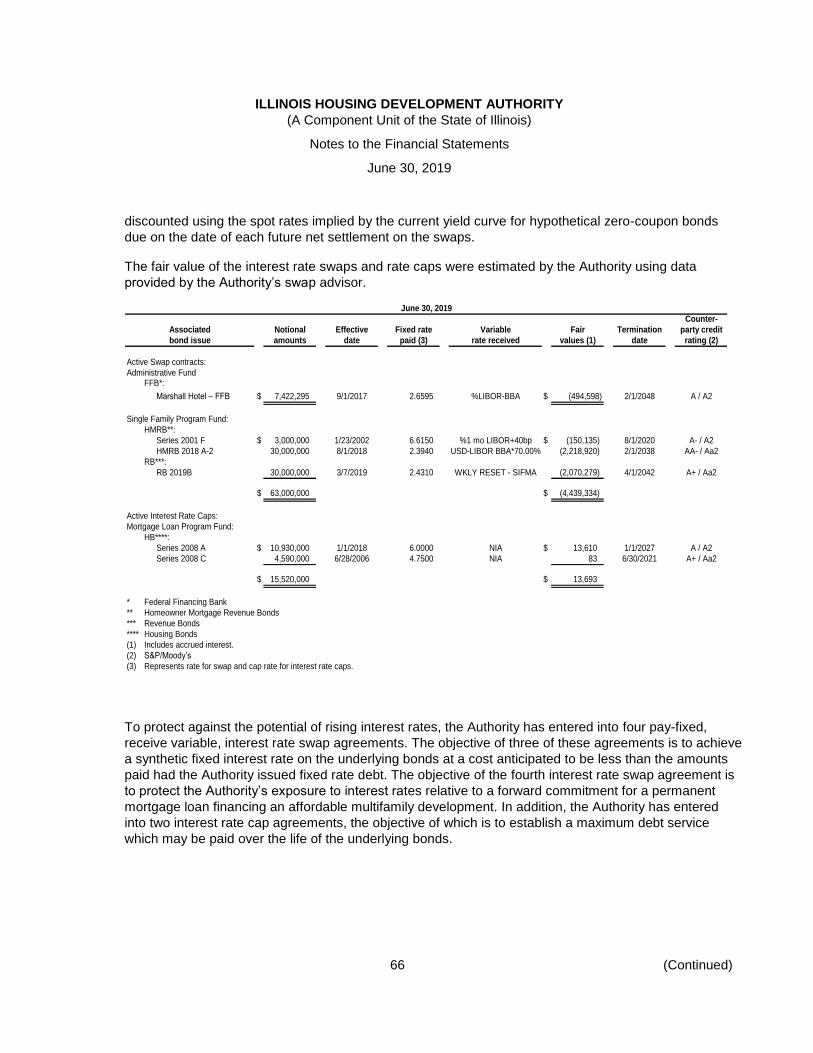
ILLINOIS HOUSING DEVELOPMENT AUTHORITY
(A Component Unit of the State of Illinois)
Notes to the Financial Statements
June 30, 2019
66 (Continued)
discounted using the spot rates implied by the current yield curve for hypothetical zero-coupon bonds
due on the date of each future net settlement on the swaps.
The fair value of the interest rate swaps and rate caps were estimated by the Authority using data
provided by the Authority’s swap advisor.
June 30, 2019
Counter-
Associated Notional Effective Fixed rate Variable Fair Termination party credit
bond issue amounts date paid (3) rate received values (1) date rating (2)
Active Swap contracts:
Administrative FundFFB*:
Marshall Hotel – FFB $ 7,422,295 9/1/2017 2.6595 %LIBOR-BBA $ (494,598) 2/1/2048 A / A2
Single Family Program Fund:
HMRB**:
Series 2001 F $ 3,000,000 1/23/2002 6.6150 %1 mo LIBOR+40bp $ (150,135) 8/1/2020 A- / A2
HMRB 2018 A-2 30,000,000 8/1/2018 2.3940 USD-LIBOR BBA*70.00% (2,218,920) 2/1/2038 AA- / Aa2
RB***:
RB 2019B 30,000,000 3/7/2019 2.4310 WKLY RESET - SIFMA (2,070,279) 4/1/2042 A+ / Aa2
$ 63,000,000 $ (4,439,334)
Active Interest Rate Caps:
Mortgage Loan Program Fund:
HB****:
Series 2008 A $ 10,930,000 1/1/2018 6.0000 NIA $ 13,610 1/1/2027 A / A2
Series 2008 C 4,590,000 6/28/2006 4.7500 NIA 83 6/30/2021 A+ / Aa2
$ 15,520,000 $ 13,693
* Federal Financing Bank
** Homeowner Mortgage Revenue Bonds
*** Revenue Bonds
**** Housing Bonds
(1) Includes accrued interest.
(2) S&P/Moody’s
(3) Represents rate for swap and cap rate for interest rate caps.
To protect against the potential of rising interest rates, the Authority has entered into four pay-fixed,
receive variable, interest rate swap agreements. The objective of three of these agreements is to achieve
a synthetic fixed interest rate on the underlying bonds at a cost anticipated to be less than the amounts
paid had the Authority issued fixed rate debt. The objective of the fourth interest rate swap agreement is
to protect the Authority’s exposure to interest rates relative to a forward commitment for a permanent
mortgage loan financing an affordable multifamily development. In addition, the Authority has entered
into two interest rate cap agreements, the objective of which is to establish a maximum debt service
which may be paid over the life of the underlying bonds.
ILLINOIS HOUSING DEVELOPMENT AUTHORITY
(A Component Unit of the State of Illinois)
Notes to the Financial Statements
June 30, 2019
67 (Continued)
The terms, fair values, and credit ratings of the outstanding agreements as of June 30, 2019 are shown
in the above table. The notional amount of the swap and caps match the principal amount of the
associated debt, as applicable, except in the case of Series 2001 F where early redemption of the bonds
have reduced the outstanding bond amount leaving the notional amount of the interest rate cap at its
original scheduled value.
The Authority’s swap and cap agreements in most cases contain scheduled reductions to outstanding
notional amounts that are expected to approximately follow scheduled or an anticipated reduction in the
associated bonds payable category.
Because interest rates have declined since the execution of the swap agreements in the Single-Family
Program Fund, they have negative fair values as of June 30, 2019. The negative fair value may be
countered by reductions in total interest payments required under the variable-rate bonds, creating lower
synthetic interest rates. Because the coupons on the Authority’s variable rate bonds adjust to changing
interest rates, the bonds do not have corresponding fair value changes.
As of June 30, 2019, the Authority was not exposed to credit risk for the swaps that had negative fair
value. As interest rates change and the fair value becomes positive, the Authority is exposed to credit
risk in the amount of the swap’s or cap’s fair value. The Authority is exposed to credit risk on the caps
and swaps with positive fair value. The aggregate fair value of hedging derivative instruments with
positive fair value at June 30, 2019 was $13,693. This represents the maximum loss that would be
recognized at the reporting date if all counterparties failed to perform as contracted. Fair value is a factor
only upon termination.
Basis risk on a swap occurs when the variable payment received is based on an index other than the
index on the underlying bonds. The Authority believes its swap agreements has been structured to
minimize or eliminate this risk.
The Authority or the counter-party may terminate the swap agreements if the other party fails to perform
under the terms of the agreements. If a swap is insured, a termination event occurs if the insurer fails to
meet its obligations under the agreement.
The Authority is not exposed to rollover risk on its swap agreements. The Authority is exposed to rollover
risk on hedging derivative instruments that are hedges of debt that mature or may be terminated prior to
the maturity of the hedged debt. When these hedging derivative instruments terminate, the Authority will
be re-exposed to the risks being hedged by the hedging derivative instrument. The Authority is exposed
to rollover risk on the caps which have termination dates that occur prior to the final maturity of the
related bonds.
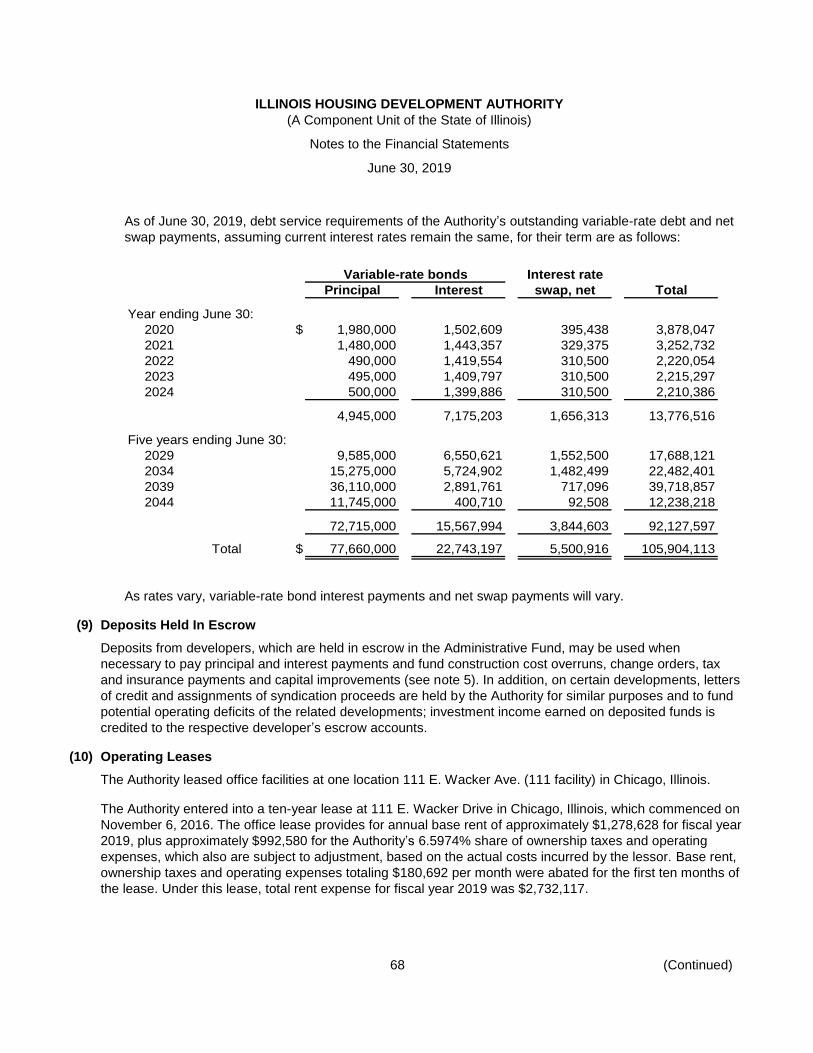
ILLINOIS HOUSING DEVELOPMENT AUTHORITY
(A Component Unit of the State of Illinois)
Notes to the Financial Statements
June 30, 2019
68 (Continued)
As of June 30, 2019, debt service requirements of the Authority’s outstanding variable-rate debt and net
swap payments, assuming current interest rates remain the same, for their term are as follows:
Variable-rate bonds Interest rate
Principal Interest swap, net Total
Year ending June 30:
2020 $ 1,980,000 1,502,609 395,438 3,878,047
2021 1,480,000 1,443,357 329,375 3,252,732
2022 490,000 1,419,554 310,500 2,220,054
2023 495,000 1,409,797 310,500 2,215,297
2024 500,000 1,399,886 310,500 2,210,386
4,945,000 7,175,203 1,656,313 13,776,516
Five years ending June 30:
2029 9,585,000 6,550,621 1,552,500 17,688,121
2034 15,275,000 5,724,902 1,482,499 22,482,401
2039 36,110,000 2,891,761 717,096 39,718,857
2044 11,745,000 400,710 92,508 12,238,218
72,715,000 15,567,994 3,844,603 92,127,597
Total $ 77,660,000 22,743,197 5,500,916 105,904,113
As rates vary, variable-rate bond interest payments and net swap payments will vary.
(9) Deposits Held In Escrow
Deposits from developers, which are held in escrow in the Administrative Fund, may be used when
necessary to pay principal and interest payments and fund construction cost overruns, change orders, tax
and insurance payments and capital improvements (see note 5). In addition, on certain developments, letters
of credit and assignments of syndication proceeds are held by the Authority for similar purposes and to fund
potential operating deficits of the related developments; investment income earned on deposited funds is
credited to the respective developer’s escrow accounts.
(10) Operating Leases
The Authority leased office facilities at one location 111 E. Wacker Ave. (111 facility) in Chicago, Illinois.
The Authority entered into a ten-year lease at 111 E. Wacker Drive in Chicago, Illinois, which commenced on
November 6, 2016. The office lease provides for annual base rent of approximately $1,278,628 for fiscal year
2019, plus approximately $992,580 for the Authority’s 6.5974% share of ownership taxes and operating
expenses, which also are subject to adjustment, based on the actual costs incurred by the lessor. Base rent,
ownership taxes and operating expenses totaling $180,692 per month were abated for the first ten months of
the lease. Under this lease, total rent expense for fiscal year 2019 was $2,732,117.
ILLINOIS HOUSING DEVELOPMENT AUTHORITY
(A Component Unit of the State of Illinois)
Notes to the Financial Statements
June 30, 2019
69 (Continued)
The future minimum lease commitments in the five years subsequent to June 30, 2019 and thereafter are as
follows:
Year Amount
2020 $ 2,732,117
2021 2,732,117
2022 2,122,254
2023 1,817,323
2024 1,817,323
2025 and thereafter 4,240,421
$ 15,461,555
(11) Other Liabilities
The bonds issued by the Authority after 1980 are subject to a variety of Internal Revenue Service (IRS)
regulations that limit the amount of income that may be earned with nonmortgage investments to an amount
not greater than the amount that would have been earned had the funds been invested at the yield on the
bonds as defined by the IRS. Excess earnings must be rebated annually, or every five years, depending on
the date and type of bond issue. It has been determined that there is no estimated rebate liability as of
June 30, 2019.
The Authority is a defendant in various legal actions arising from normal business activities. Management
believes, after consultation with legal counsel, that the ultimate liability, if any, resulting from these legal
actions, will not materially affect the Authority’s financial position or results of operations.
In connection with various federal and state grant programs, the Authority is obligated to administer related
programs and spend the grant funding in accordance with regulatory restrictions and is subject to audits by
the grantor agencies. In the opinion of Authority management, any grant expenditures that may be
disallowed by the grantor agency, if any, would not result in a material liability to the Authority.
The Authority carries commercial insurance for directors and officers liability, general liability, employee
health, workers’ compensation, cyber liability, crime, property, and automobile ownership and usage. Settled
claims resulting from these risks have not exceeded commercial insurance coverage in any of the past three
fiscal years. Insurance coverage has not changed significantly since the prior year.
(12) Retirement Plan
The Authority provides a defined contribution retirement plan for the benefit of its employees. In a defined
contribution plan, benefits depend solely on amounts contributed to the plan plus investment earnings. Full
time employees are eligible to participate in and are fully vested in the plan from the date of employment. All
plan assets and investments are administered by a trustee, which maintains an individual account for each
participant. The Authority contributes 6% of its employees’ salaries and employees, at their option, may
contribute up to 100% (within a maximum dollar limit) of their salaries to the plan. In addition, the Authority,
under the provisions of the Economic Growth and Tax Relief Act of 2001, permits additional contributions
each calendar year for those employees who attain age 50 (or higher) during the calendar year. The plan
ILLINOIS HOUSING DEVELOPMENT AUTHORITY
(A Component Unit of the State of Illinois)
Notes to the Financial Statements
June 30, 2019
70 (Continued)
may be amended or terminated by the Authority at any time and for any reason in the future, but no such
action can deprive employees of their vested interests.
The Authority’s total payroll in fiscal year 2019 was $23,153,726. The Authority’s contributions were
calculated using the base salary amount of $22,986,667. The Authority contributed $1,379,200 or 6% of the
base salary amount, in fiscal year 2019. Employee contributions amounted to $1,661,567, in fiscal year
2019, or approximately 7.228% of the base salary amount.
(13) Commitments
At June 30, 2019, the Authority had authorized loans and grants totaling $59.5 million for the Illinois
Affordable Housing Trust Fund.
Under the HOME Program, $512.1 million and $21.1 million for federal fiscal years 1992 through 2018 and
2019, respectively, have been allocated to the State by HUD, to be administered by the Authority, under the
HOME Program provisions of the 1990 National Affordable Housing Act. In fiscal year 1994, the Authority
was allocated $10.2 million of additional HOME funds to be used for flood disaster relief. At June 30, 2019,
the Authority had authorized loans totaling $13.8 million for the HOME Program.
In accordance with an agreement (the FAF Agreement) entered into by the Authority and HUD at the time of
delivery of the Authority’s Multi-Family Housing Bonds, 1982 Series A, 1982 Series B, and 1983 Series A,
annual Section 8 contributions payable to HUD with respect to the developments financed by these bonds
would be reduced to the extent of the debt service savings resulting from the early redemptions of these
Bonds.
These redemptions were accomplished through the issuance of the Authority’s Multi-Family Housing Bonds,
1991 Series A and B, 1992 Series A and B, and 1993 Series A and B. In November of 2006, the Authority
entered into a new agreement (the FAF Refunding Agreement) with HUD at the time of delivery of the
Authority’s Housing Bonds, 2006 Series G to refund the Multi-Family Housing Bonds, 1991 Series A, 1992
Series A, and 1993 Series A. Pursuant to federal legislation and a written agreement with the Authority, HUD
has agreed to share a portion of such savings (the FAF Savings Program) with the Authority in order to
create and maintain affordable housing opportunities for individuals of “very low income” (as such term is
defined in the 1937 Housing Act) in the State. These savings, which are to be used solely for the purpose
stated above, became available beginning in fiscal year 1992 for the 1991 Series A and B Bonds, in fiscal
year 1993 for the 1992 Series A and B Bonds, in fiscal year 1994 for the 1993 Series A and B Bonds, and in
fiscal year 2008 for the 2006 Series E, and are recorded as other income of the Administrative Fund. At
June 30, 2019, loans receivable under this program were approximately $39.3 million.
On July 21, 2017, the Authority authorized the issuance of tax-exempt Multifamily Revenue Bonds
(Refunding Bonds) in an amount not to exceed $7 million to refund the tax-exempt Multifamily Mortgage
Revenue Note, 2017 Series A (Concord at Sheridan) (2017 Series A Note), the proceeds of which are to be
used to finance the acquisition, construction and equipping of a 111-unit multifamily rental housing
development located in Chicago, Illinois. The Authority intends to place the Refunding Bonds with Citibank,
N.A. pursuant to a forward bond purchase agreement by and between the Authority and Citibank, with an
estimated delivery date of December 31, 2020. Although the Refunding Bonds have not been issued as of
June 30, 2019, the 2017 Series A Note was issued on November 2, 2017.
ILLINOIS HOUSING DEVELOPMENT AUTHORITY
(A Component Unit of the State of Illinois)
Notes to the Financial Statements
June 30, 2019
71 (Continued)
On May 18, 2018, The Authority authorized the issuance of tax-exempt Multifamily Revenue Bonds
(Refunding Bonds) in an amount not to exceed $4 million to refund the tax-exempt Multifamily Mortgage
Revenue Note, 2019 Series A (Oso Apartments) (2019 Series A Note), the proceeds of which will be used to
finance the acquisition, construction and equipping of a 48-unit multifamily rental housing developments
located in Chicago, Illinois. The Authority intends to place the Refunding Bonds with Citibank, N.A. pursuant
to a forward bond purchase agreement by and between the Authority and Citibank, with an estimated
delivery date of March 2, 2020. Although the Refunding Bonds have not been issued as of June 30, 2019,
the 2019 Series A Note was issued on August 31, 2018.
On June 15 2018, The Authority authorized the issuance of tax-exempt Multifamily Revenue Bonds
(Refunding Bonds) in an amount not to exceed $2.5 million to refund the tax-exempt Multifamily Mortgage
Revenue Note, 2019 Series A (Chelsea Senior Commons) (2019 Series A Note), the proceeds of which will
be used to finance the acquisition, construction and equipping of a 40-unit multifamily rental housing
developments located in Sugar Grove, Illinois. The Authority intends to place the Refunding Bonds with
Citibank, N.A. pursuant to a forward bond purchase agreement by and between the Authority and Citibank,
with an estimated delivery date of March 2, 2020. Although the Refunding Bonds have not been issued as of
June 30, 2019, the 2019 Series A Note was issued on September 13, 2018.
On June 15, 2018, The Authority authorized the issuance of Multifamily Revenue Bonds (Refunding Bonds)
in an amount not to exceed $2.3 million to refund a taxable construction loan to be made by Citi Community
Capital (Taxable Note), the proceeds of which will be used to finance the acquisition, construction and
equipping of a 62-unit multifamily rental housing developments located in Cary, Illinois. The Authority intends
to place the Refunding Bonds with Citibank, N.A. pursuant to a forward bond purchase agreement by and
between the Authority and Citibank, with an estimated delivery date of April 2, 2020. Although the Refunding
Bonds have not been issued as of June 30, 2019, the Taxable Note was issued on August 15, 2018.
(14) Subsequent Events
On February 15, 2017, the Illinois Housing Development Authority (the “Authority”) issued $26,000,000 in
aggregate principal amount of its Multifamily Revenue Bonds, 2017 Series A (Non-AMT) (FHA Risk-Sharing
Insured Pass-Through) (the “Bonds”), the proceeds of which were used in part to make a loan (the “Bond
Loan”) for the construction and equipping of the Regency at Cole Park (the “Development”) in North Chicago.
On July 19, 2019, The Authority authorized the making of an additional subordinate loan to the Development
in an amount of $500,000 (the “Additional Authority Resources”). The Additional Authority Resources are to
be disbursed as required to meet the Development’s current construction completion schedule. The
Additional Authority Resources will be in a lien position subordinate to the aforementioned Bond Loan. With
the proceeds of the Additional Authority Resources, the Development is expected to imminently complete
construction.
On February 15, 2017, the Illinois Housing Development Authority (the “Authority”) issued $26,000,000 in
aggregate principal amount of its Multifamily Revenue Bonds, 2017 Series A (Non-AMT) (FHA Risk-Sharing
Insured Pass-Through) (the “Bonds”), the proceeds of which were used in part to make a loan (the “Bond
Loan”) for the construction and equipping of the Brookstone at Cole Park (the “Development”) in North Chicago.
On August 16, 2019, The Authority authorized the making of an additional subordinate loan to the Development
in an amount of $2,000,000 (the “Additional Authority Resources”). The Additional Authority Resources are to
be disbursed as required to meet the Development’s current construction completion schedule. The Additional
Authority Resources will be in a lien position subordinate to the aforementioned Bond Loan. With the proceeds
ILLINOIS HOUSING DEVELOPMENT AUTHORITY
(A Component Unit of the State of Illinois)
Notes to the Financial Statements
June 30, 2019
72
of the Additional Authority Resources, the Development now is expected to complete construction by the end
of 2019.
On December 12th, 2019, the Authority issued its Multifamily Revenue Bonds, 2019 Series A, in aggregate
principal amount of $41,550,000. Proceeds of the Series 2019A Bonds are being issued to provide moneys
to (i) to finance the rehabilitation and equipping of a 119-unit supportive and independent living apartment
development and (ii) to finance the rehabilitation and equipping of a 74-unit independent living apartment
development both of which are located at 4501 N. Winchester Ave in the City of Chicago, Illinois.
On December 19th, 2019, the Authority issued its Revenue Bonds, 2019 Series D, in aggregate principal
amount of $125,000,000. Proceeds of the Series 2019D Bonds together with other funds of the Authority
are expected to be used to: (a) purchase, and/or reimburse the Authority for its prior purchase of, mortgage-
backed securities guaranteed as to timely payment of principal and interest by the Government National
Mortgage Association or the Federal National Mortgage Association (or participation interests in such
mortgage backed securities); and (b) pay or reimburse the Authority for certain costs incurred in connection
with the issuance of the Series 2019D Bonds
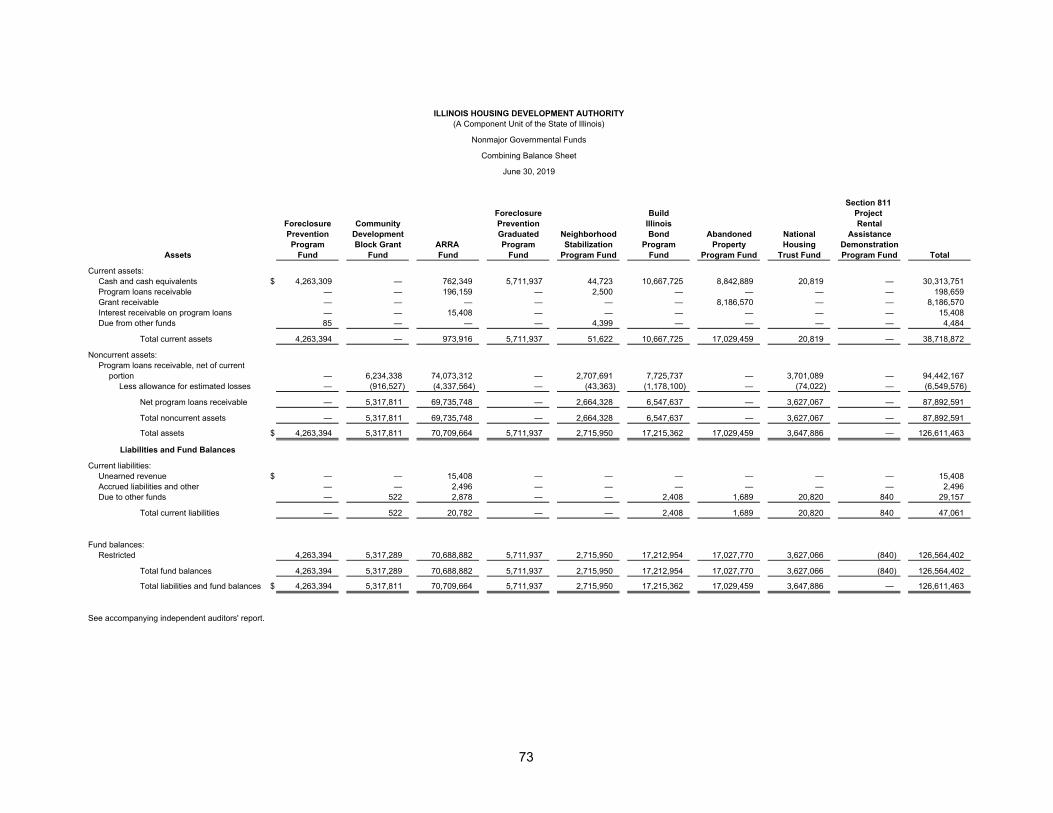
ILLINOIS HOUSING DEVELOPMENT AUTHORITY(A Component Unit of the State of Illinois)
Nonmajor Governmental Funds
Combining Balance Sheet
June 30, 2019
Section 811 Foreclosure Build Project
Foreclosure Community Prevention Illinois RentalPrevention Development Graduated Neighborhood Bond Abandoned National AssistanceProgram Block Grant ARRA Program Stabilization Program Property Housing Demonstration
Assets Fund Fund Fund Fund Program Fund Fund Program Fund Trust Fund Program Fund Total
Current assets:Cash and cash equivalents $ 4,263,309 — 762,349 5,711,937 44,723 10,667,725 8,842,889 20,819 — 30,313,751 Program loans receivable — — 196,159 — 2,500 — — — — 198,659 Grant receivable — — — — — — 8,186,570 — — 8,186,570 Interest receivable on program loans — — 15,408 — — — — — — 15,408 Due from other funds 85 — — — 4,399 — — — — 4,484
Total current assets 4,263,394 — 973,916 5,711,937 51,622 10,667,725 17,029,459 20,819 — 38,718,872
Noncurrent assets:Program loans receivable, net of current
portion — 6,234,338 74,073,312 — 2,707,691 7,725,737 — 3,701,089 — 94,442,167 Less allowance for estimated losses — (916,527) (4,337,564) — (43,363) (1,178,100) — (74,022) — (6,549,576)
Net program loans receivable — 5,317,811 69,735,748 — 2,664,328 6,547,637 — 3,627,067 — 87,892,591
Total noncurrent assets — 5,317,811 69,735,748 — 2,664,328 6,547,637 — 3,627,067 — 87,892,591
Total assets $ 4,263,394 5,317,811 70,709,664 5,711,937 2,715,950 17,215,362 17,029,459 3,647,886 — 126,611,463
Liabilities and Fund Balances
Current liabilities:Unearned revenue $ — — 15,408 — — — — — — 15,408 Accrued liabilities and other — — 2,496 — — — — — — 2,496 Due to other funds — 522 2,878 — — 2,408 1,689 20,820 840 29,157
Total current liabilities — 522 20,782 — — 2,408 1,689 20,820 840 47,061
Fund balances:Restricted 4,263,394 5,317,289 70,688,882 5,711,937 2,715,950 17,212,954 17,027,770 3,627,066 (840) 126,564,402
Total fund balances 4,263,394 5,317,289 70,688,882 5,711,937 2,715,950 17,212,954 17,027,770 3,627,066 (840) 126,564,402
Total liabilities and fund balances $ 4,263,394 5,317,811 70,709,664 5,711,937 2,715,950 17,215,362 17,029,459 3,647,886 — 126,611,463
See accompanying independent auditors' report.
73
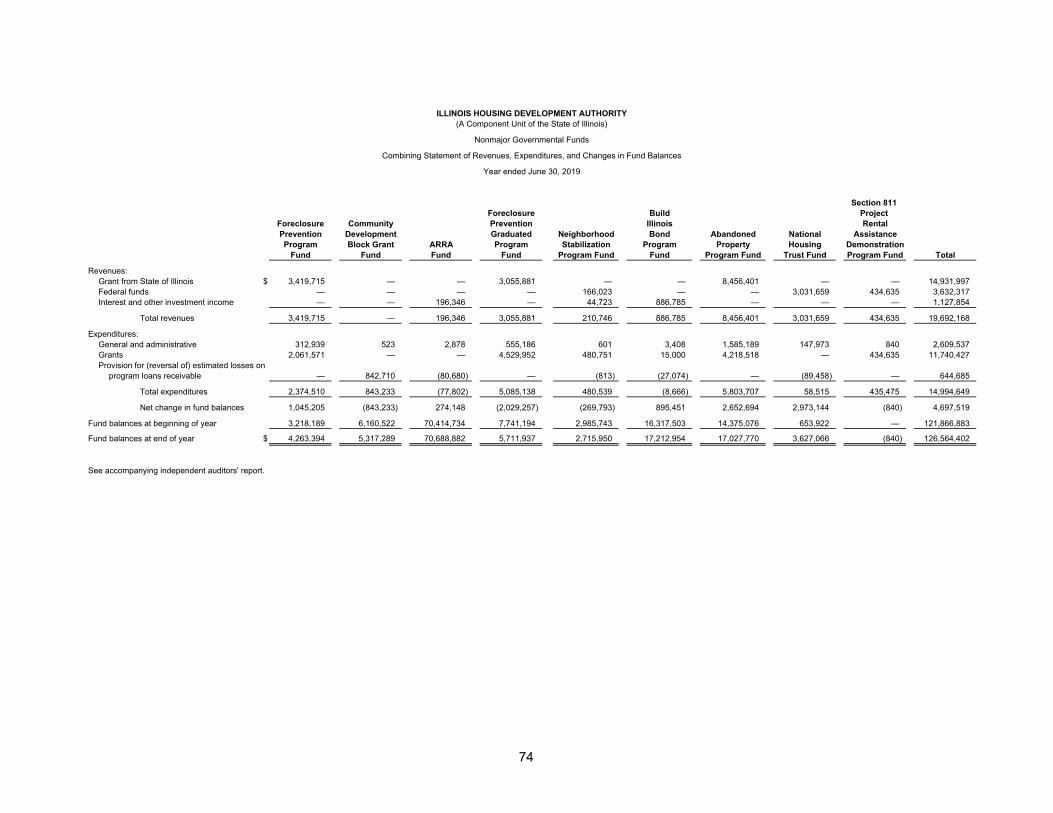
ILLINOIS HOUSING DEVELOPMENT AUTHORITY(A Component Unit of the State of Illinois)
Nonmajor Governmental Funds
Combining Statement of Revenues, Expenditures, and Changes in Fund Balances
Year ended June 30, 2019
Section 811 Foreclosure Build Project
Foreclosure Community Prevention Illinois RentalPrevention Development Graduated Neighborhood Bond Abandoned National AssistanceProgram Block Grant ARRA Program Stabilization Program Property Housing Demonstration
Fund Fund Fund Fund Program Fund Fund Program Fund Trust Fund Program Fund Total
Revenues:Grant from State of Illinois $ 3,419,715 — — 3,055,881 — — 8,456,401 — — 14,931,997 Federal funds — — — — 166,023 — — 3,031,659 434,635 3,632,317 Interest and other investment income — — 196,346 — 44,723 886,785 — — — 1,127,854
Total revenues 3,419,715 — 196,346 3,055,881 210,746 886,785 8,456,401 3,031,659 434,635 19,692,168
Expenditures:General and administrative 312,939 523 2,878 555,186 601 3,408 1,585,189 147,973 840 2,609,537 Grants 2,061,571 — — 4,529,952 480,751 15,000 4,218,518 — 434,635 11,740,427 Provision for (reversal of) estimated losses on
program loans receivable — 842,710 (80,680) — (813) (27,074) — (89,458) — 644,685
Total expenditures 2,374,510 843,233 (77,802) 5,085,138 480,539 (8,666) 5,803,707 58,515 435,475 14,994,649
Net change in fund balances 1,045,205 (843,233) 274,148 (2,029,257) (269,793) 895,451 2,652,694 2,973,144 (840) 4,697,519
Fund balances at beginning of year 3,218,189 6,160,522 70,414,734 7,741,194 2,985,743 16,317,503 14,375,076 653,922 — 121,866,883
Fund balances at end of year $ 4,263,394 5,317,289 70,688,882 5,711,937 2,715,950 17,212,954 17,027,770 3,627,066 (840) 126,564,402
See accompanying independent auditors' report.
74
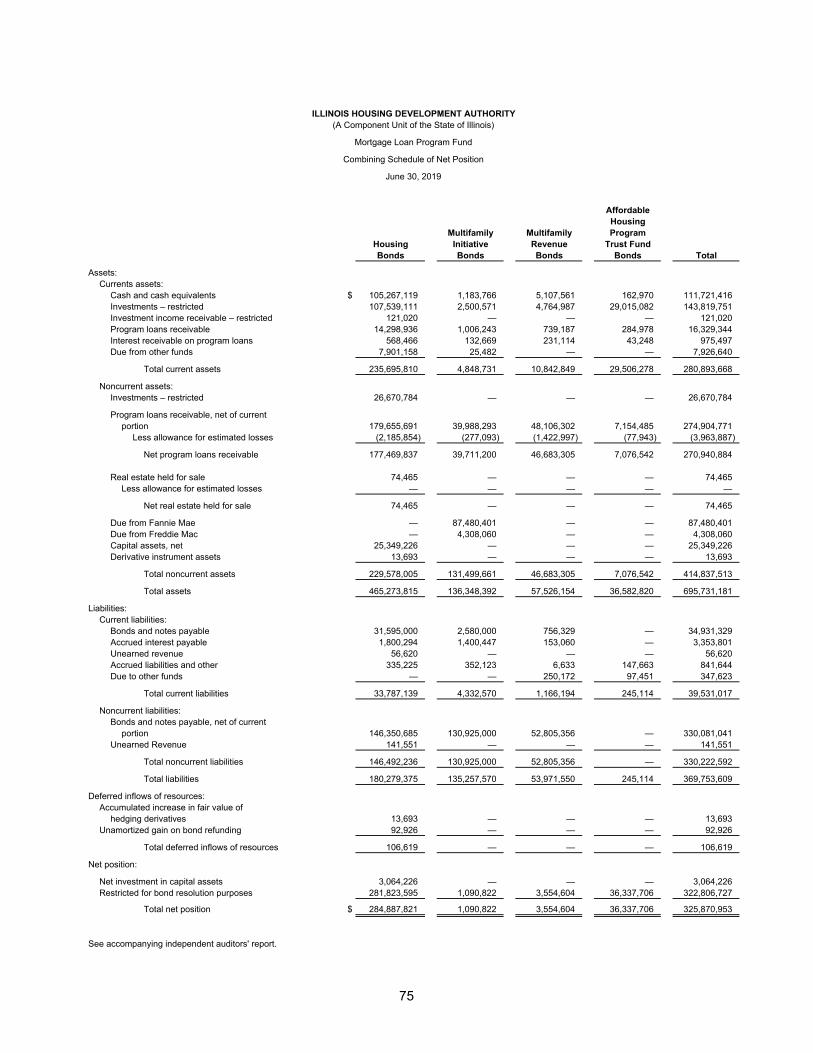
ILLINOIS HOUSING DEVELOPMENT AUTHORITY(A Component Unit of the State of Illinois)
Mortgage Loan Program Fund
Combining Schedule of Net Position
June 30, 2019
AffordableHousing
Multifamily Multifamily ProgramHousing Initiative Revenue Trust FundBonds Bonds Bonds Bonds Total
Assets:Currents assets:
Cash and cash equivalents $ 105,267,119 1,183,766 5,107,561 162,970 111,721,416 Investments – restricted 107,539,111 2,500,571 4,764,987 29,015,082 143,819,751 Investment income receivable – restricted 121,020 — — — 121,020 Program loans receivable 14,298,936 1,006,243 739,187 284,978 16,329,344 Interest receivable on program loans 568,466 132,669 231,114 43,248 975,497 Due from other funds 7,901,158 25,482 — — 7,926,640
Total current assets 235,695,810 4,848,731 10,842,849 29,506,278 280,893,668
Noncurrent assets:Investments – restricted 26,670,784 — — — 26,670,784
Program loans receivable, net of currentportion 179,655,691 39,988,293 48,106,302 7,154,485 274,904,771
Less allowance for estimated losses (2,185,854) (277,093) (1,422,997) (77,943) (3,963,887)
Net program loans receivable 177,469,837 39,711,200 46,683,305 7,076,542 270,940,884
Real estate held for sale 74,465 — — — 74,465 Less allowance for estimated losses — — — — —
Net real estate held for sale 74,465 — — — 74,465
Due from Fannie Mae — 87,480,401 — — 87,480,401 Due from Freddie Mac — 4,308,060 — — 4,308,060 Capital assets, net 25,349,226 — — — 25,349,226 Derivative instrument assets 13,693 — — — 13,693
Total noncurrent assets 229,578,005 131,499,661 46,683,305 7,076,542 414,837,513
Total assets 465,273,815 136,348,392 57,526,154 36,582,820 695,731,181
Liabilities:Current liabilities:
Bonds and notes payable 31,595,000 2,580,000 756,329 — 34,931,329 Accrued interest payable 1,800,294 1,400,447 153,060 — 3,353,801 Unearned revenue 56,620 — — — 56,620 Accrued liabilities and other 335,225 352,123 6,633 147,663 841,644 Due to other funds — — 250,172 97,451 347,623
Total current liabilities 33,787,139 4,332,570 1,166,194 245,114 39,531,017
Noncurrent liabilities:Bonds and notes payable, net of current
portion 146,350,685 130,925,000 52,805,356 — 330,081,041 Unearned Revenue 141,551 — — — 141,551
Total noncurrent liabilities 146,492,236 130,925,000 52,805,356 — 330,222,592
Total liabilities 180,279,375 135,257,570 53,971,550 245,114 369,753,609
Deferred inflows of resources:Accumulated increase in fair value of
hedging derivatives 13,693 — — — 13,693 Unamortized gain on bond refunding 92,926 — — — 92,926
Total deferred inflows of resources 106,619 — — — 106,619
Net position:
Net investment in capital assets 3,064,226 — — — 3,064,226 Restricted for bond resolution purposes 281,823,595 1,090,822 3,554,604 36,337,706 322,806,727
Total net position $ 284,887,821 1,090,822 3,554,604 36,337,706 325,870,953
See accompanying independent auditors' report.
75
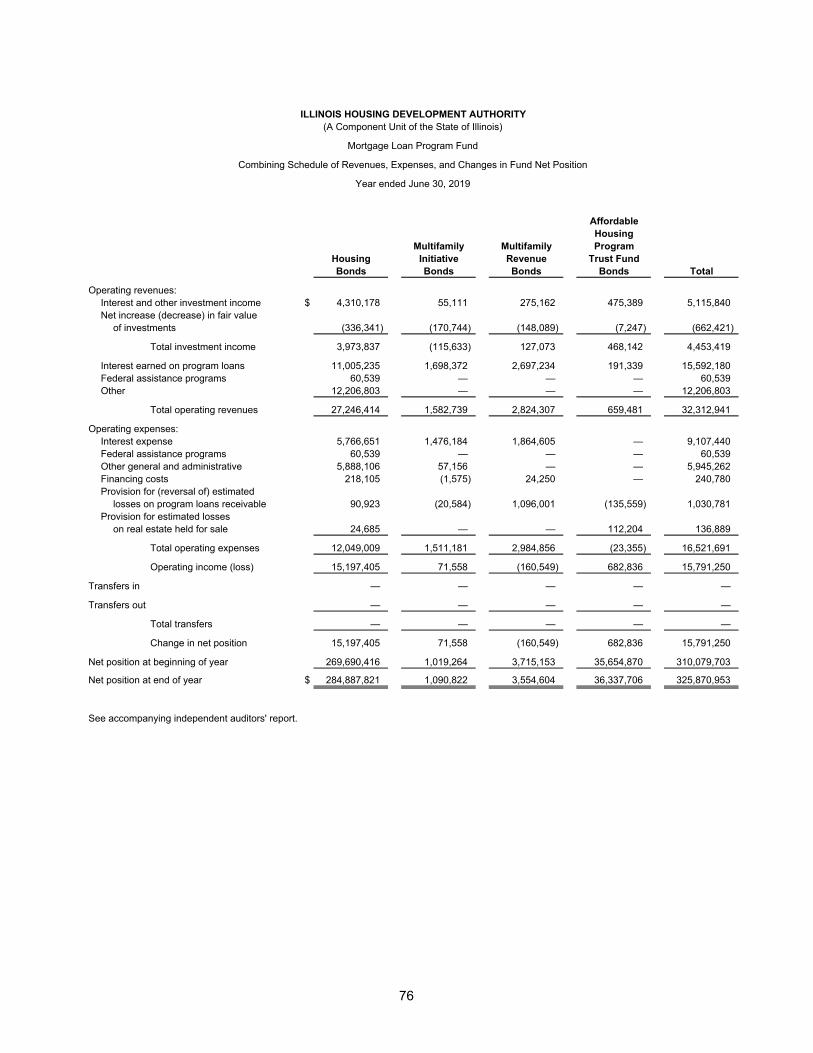
ILLINOIS HOUSING DEVELOPMENT AUTHORITY(A Component Unit of the State of Illinois)
Mortgage Loan Program Fund
Combining Schedule of Revenues, Expenses, and Changes in Fund Net Position
Year ended June 30, 2019
AffordableHousing
Multifamily Multifamily ProgramHousing Initiative Revenue Trust FundBonds Bonds Bonds Bonds Total
Operating revenues:Interest and other investment income $ 4,310,178 55,111 275,162 475,389 5,115,840 Net increase (decrease) in fair value
of investments (336,341) (170,744) (148,089) (7,247) (662,421)
Total investment income 3,973,837 (115,633) 127,073 468,142 4,453,419
Interest earned on program loans 11,005,235 1,698,372 2,697,234 191,339 15,592,180 Federal assistance programs 60,539 — — — 60,539 Other 12,206,803 — — — 12,206,803
Total operating revenues 27,246,414 1,582,739 2,824,307 659,481 32,312,941
Operating expenses:Interest expense 5,766,651 1,476,184 1,864,605 — 9,107,440 Federal assistance programs 60,539 — — — 60,539 Other general and administrative 5,888,106 57,156 — — 5,945,262 Financing costs 218,105 (1,575) 24,250 — 240,780 Provision for (reversal of) estimated
losses on program loans receivable 90,923 (20,584) 1,096,001 (135,559) 1,030,781 Provision for estimated losses
on real estate held for sale 24,685 — — 112,204 136,889
Total operating expenses 12,049,009 1,511,181 2,984,856 (23,355) 16,521,691
Operating income (loss) 15,197,405 71,558 (160,549) 682,836 15,791,250
Transfers in — — — — —
Transfers out — — — — —
Total transfers — — — — —
Change in net position 15,197,405 71,558 (160,549) 682,836 15,791,250
Net position at beginning of year 269,690,416 1,019,264 3,715,153 35,654,870 310,079,703
Net position at end of year $ 284,887,821 1,090,822 3,554,604 36,337,706 325,870,953
See accompanying independent auditors' report.
76
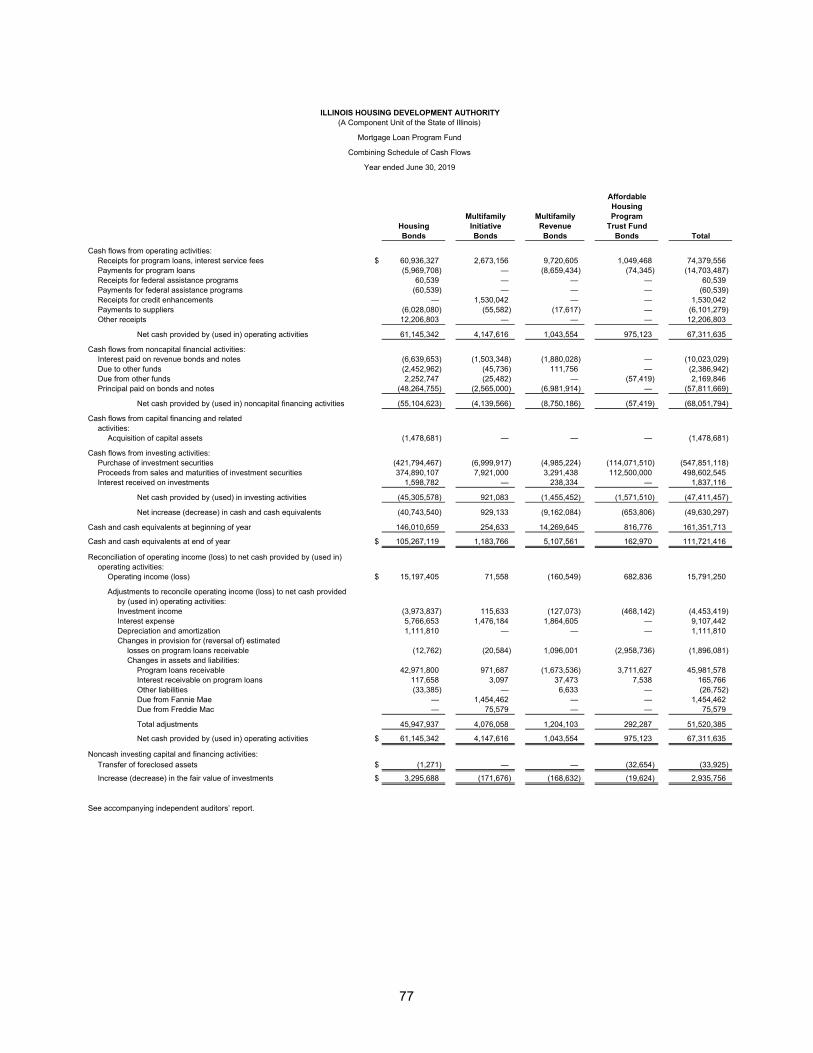
ILLINOIS HOUSING DEVELOPMENT AUTHORITY(A Component Unit of the State of Illinois)
Mortgage Loan Program Fund
Combining Schedule of Cash Flows
Year ended June 30, 2019
AffordableHousing
Multifamily Multifamily ProgramHousing Initiative Revenue Trust FundBonds Bonds Bonds Bonds Total
Cash flows from operating activities:Receipts for program loans, interest service fees $ 60,936,327 2,673,156 9,720,605 1,049,468 74,379,556 Payments for program loans (5,969,708) — (8,659,434) (74,345) (14,703,487) Receipts for federal assistance programs 60,539 — — — 60,539 Payments for federal assistance programs (60,539) — — — (60,539) Receipts for credit enhancements — 1,530,042 — — 1,530,042 Payments to suppliers (6,028,080) (55,582) (17,617) — (6,101,279) Other receipts 12,206,803 — — — 12,206,803
Net cash provided by (used in) operating activities 61,145,342 4,147,616 1,043,554 975,123 67,311,635
Cash flows from noncapital financial activities:Interest paid on revenue bonds and notes (6,639,653) (1,503,348) (1,880,028) — (10,023,029) Due to other funds (2,452,962) (45,736) 111,756 — (2,386,942) Due from other funds 2,252,747 (25,482) — (57,419) 2,169,846 Principal paid on bonds and notes (48,264,755) (2,565,000) (6,981,914) — (57,811,669)
Net cash provided by (used in) noncapital financing activities (55,104,623) (4,139,566) (8,750,186) (57,419) (68,051,794)
Cash flows from capital financing and relatedactivities:
Acquisition of capital assets (1,478,681) — — — (1,478,681)
Cash flows from investing activities:Purchase of investment securities (421,794,467) (6,999,917) (4,985,224) (114,071,510) (547,851,118) Proceeds from sales and maturities of investment securities 374,890,107 7,921,000 3,291,438 112,500,000 498,602,545 Interest received on investments 1,598,782 — 238,334 — 1,837,116
Net cash provided by (used) in investing activities (45,305,578) 921,083 (1,455,452) (1,571,510) (47,411,457)
Net increase (decrease) in cash and cash equivalents (40,743,540) 929,133 (9,162,084) (653,806) (49,630,297)
Cash and cash equivalents at beginning of year 146,010,659 254,633 14,269,645 816,776 161,351,713
Cash and cash equivalents at end of year $ 105,267,119 1,183,766 5,107,561 162,970 111,721,416
Reconciliation of operating income (loss) to net cash provided by (used in) operating activities:
Operating income (loss) $ 15,197,405 71,558 (160,549) 682,836 15,791,250
Adjustments to reconcile operating income (loss) to net cash provided by (used in) operating activities:Investment income (3,973,837) 115,633 (127,073) (468,142) (4,453,419) Interest expense 5,766,653 1,476,184 1,864,605 — 9,107,442 Depreciation and amortization 1,111,810 — — — 1,111,810 Changes in provision for (reversal of) estimated
losses on program loans receivable (12,762) (20,584) 1,096,001 (2,958,736) (1,896,081) Changes in assets and liabilities:
Program loans receivable 42,971,800 971,687 (1,673,536) 3,711,627 45,981,578 Interest receivable on program loans 117,658 3,097 37,473 7,538 165,766 Other liabilities (33,385) — 6,633 — (26,752) Due from Fannie Mae — 1,454,462 — — 1,454,462 Due from Freddie Mac — 75,579 — — 75,579
Total adjustments 45,947,937 4,076,058 1,204,103 292,287 51,520,385
Net cash provided by (used in) operating activities $ 61,145,342 4,147,616 1,043,554 975,123 67,311,635
Noncash investing capital and financing activities:Transfer of foreclosed assets $ (1,271) — — (32,654) (33,925)
Increase (decrease) in the fair value of investments $ 3,295,688 (171,676) (168,632) (19,624) 2,935,756
See accompanying independent auditors’ report.
77
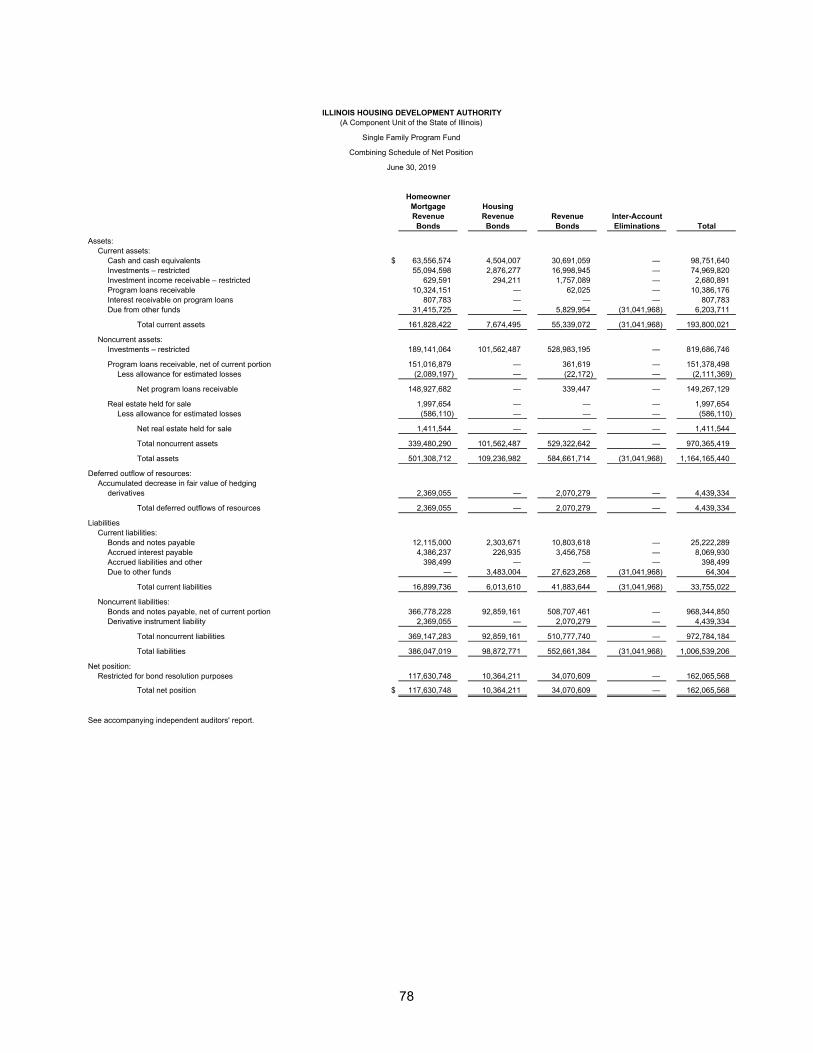
ILLINOIS HOUSING DEVELOPMENT AUTHORITY(A Component Unit of the State of Illinois)
Single Family Program Fund
Combining Schedule of Net Position
June 30, 2019
HomeownerMortgage HousingRevenue Revenue Revenue Inter-AccountBonds Bonds Bonds Eliminations Total
Assets:Current assets:
Cash and cash equivalents $ 63,556,574 4,504,007 30,691,059 — 98,751,640 Investments – restricted 55,094,598 2,876,277 16,998,945 — 74,969,820 Investment income receivable – restricted 629,591 294,211 1,757,089 — 2,680,891 Program loans receivable 10,324,151 — 62,025 — 10,386,176 Interest receivable on program loans 807,783 — — — 807,783 Due from other funds 31,415,725 — 5,829,954 (31,041,968) 6,203,711
Total current assets 161,828,422 7,674,495 55,339,072 (31,041,968) 193,800,021
Noncurrent assets:Investments – restricted 189,141,064 101,562,487 528,983,195 — 819,686,746
Program loans receivable, net of current portion 151,016,879 — 361,619 — 151,378,498 Less allowance for estimated losses (2,089,197) — (22,172) — (2,111,369)
Net program loans receivable 148,927,682 — 339,447 — 149,267,129
Real estate held for sale 1,997,654 — — — 1,997,654 Less allowance for estimated losses (586,110) — — — (586,110)
Net real estate held for sale 1,411,544 — — — 1,411,544
Total noncurrent assets 339,480,290 101,562,487 529,322,642 — 970,365,419
Total assets 501,308,712 109,236,982 584,661,714 (31,041,968) 1,164,165,440
Deferred outflow of resources:Accumulated decrease in fair value of hedging
derivatives 2,369,055 — 2,070,279 — 4,439,334
Total deferred outflows of resources 2,369,055 — 2,070,279 — 4,439,334
LiabilitiesCurrent liabilities:
Bonds and notes payable 12,115,000 2,303,671 10,803,618 — 25,222,289 Accrued interest payable 4,386,237 226,935 3,456,758 — 8,069,930 Accrued liabilities and other 398,499 — — — 398,499 Due to other funds — 3,483,004 27,623,268 (31,041,968) 64,304
Total current liabilities 16,899,736 6,013,610 41,883,644 (31,041,968) 33,755,022
Noncurrent liabilities:Bonds and notes payable, net of current portion 366,778,228 92,859,161 508,707,461 — 968,344,850 Derivative instrument liability 2,369,055 — 2,070,279 — 4,439,334
Total noncurrent liabilities 369,147,283 92,859,161 510,777,740 — 972,784,184
Total liabilities 386,047,019 98,872,771 552,661,384 (31,041,968) 1,006,539,206
Net position:Restricted for bond resolution purposes 117,630,748 10,364,211 34,070,609 — 162,065,568
Total net position $ 117,630,748 10,364,211 34,070,609 — 162,065,568
See accompanying independent auditors' report.
78
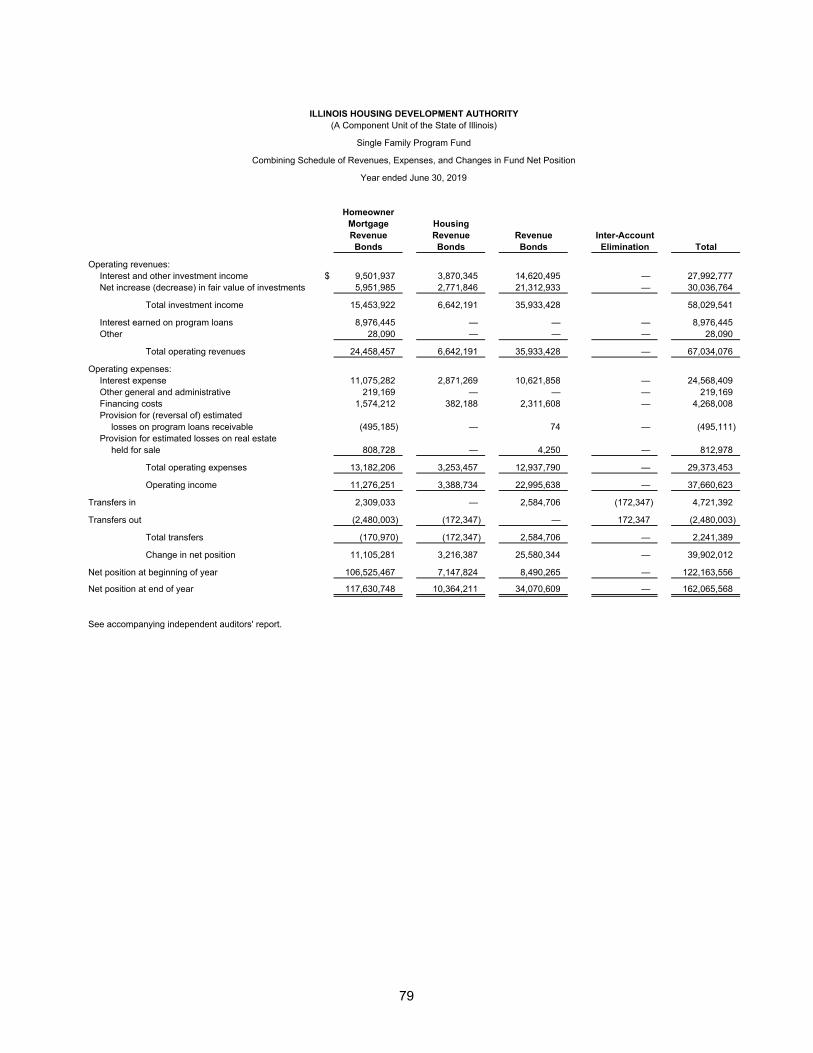
ILLINOIS HOUSING DEVELOPMENT AUTHORITY(A Component Unit of the State of Illinois)
Single Family Program Fund
Combining Schedule of Revenues, Expenses, and Changes in Fund Net Position
Year ended June 30, 2019
HomeownerMortgage HousingRevenue Revenue Revenue Inter-AccountBonds Bonds Bonds Elimination Total
Operating revenues:Interest and other investment income $ 9,501,937 3,870,345 14,620,495 — 27,992,777 Net increase (decrease) in fair value of investments 5,951,985 2,771,846 21,312,933 — 30,036,764
Total investment income 15,453,922 6,642,191 35,933,428 58,029,541
Interest earned on program loans 8,976,445 — — — 8,976,445 Other 28,090 — — — 28,090
Total operating revenues 24,458,457 6,642,191 35,933,428 — 67,034,076
Operating expenses:Interest expense 11,075,282 2,871,269 10,621,858 — 24,568,409 Other general and administrative 219,169 — — — 219,169 Financing costs 1,574,212 382,188 2,311,608 — 4,268,008 Provision for (reversal of) estimated
losses on program loans receivable (495,185) — 74 — (495,111) Provision for estimated losses on real estate
held for sale 808,728 — 4,250 — 812,978
Total operating expenses 13,182,206 3,253,457 12,937,790 — 29,373,453
Operating income 11,276,251 3,388,734 22,995,638 — 37,660,623
Transfers in 2,309,033 — 2,584,706 (172,347) 4,721,392
Transfers out (2,480,003) (172,347) — 172,347 (2,480,003)
Total transfers (170,970) (172,347) 2,584,706 — 2,241,389
Change in net position 11,105,281 3,216,387 25,580,344 — 39,902,012
Net position at beginning of year 106,525,467 7,147,824 8,490,265 — 122,163,556
Net position at end of year 117,630,748 10,364,211 34,070,609 — 162,065,568
See accompanying independent auditors' report.
79
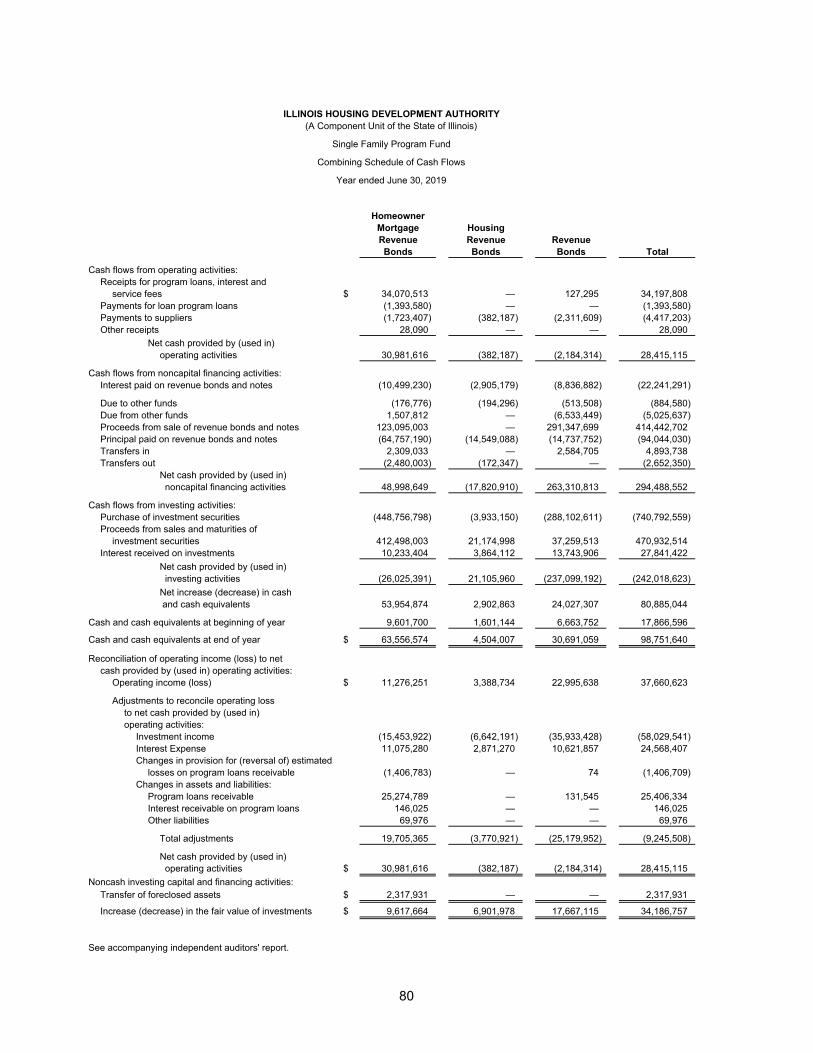
ILLINOIS HOUSING DEVELOPMENT AUTHORITY(A Component Unit of the State of Illinois)
Single Family Program Fund
Combining Schedule of Cash Flows
Year ended June 30, 2019
HomeownerMortgage HousingRevenue Revenue RevenueBonds Bonds Bonds Total
Cash flows from operating activities:Receipts for program loans, interest and
service fees $ 34,070,513 — 127,295 34,197,808 Payments for loan program loans (1,393,580) — — (1,393,580) Payments to suppliers (1,723,407) (382,187) (2,311,609) (4,417,203) Other receipts 28,090 — — 28,090
Net cash provided by (used in)operating activities 30,981,616 (382,187) (2,184,314) 28,415,115
Cash flows from noncapital financing activities:Interest paid on revenue bonds and notes (10,499,230) (2,905,179) (8,836,882) (22,241,291)
Due to other funds (176,776) (194,296) (513,508) (884,580) Due from other funds 1,507,812 — (6,533,449) (5,025,637) Proceeds from sale of revenue bonds and notes 123,095,003 — 291,347,699 414,442,702 Principal paid on revenue bonds and notes (64,757,190) (14,549,088) (14,737,752) (94,044,030) Transfers in 2,309,033 — 2,584,705 4,893,738 Transfers out (2,480,003) (172,347) — (2,652,350)
Net cash provided by (used in) noncapital financing activities 48,998,649 (17,820,910) 263,310,813 294,488,552
Cash flows from investing activities:Purchase of investment securities (448,756,798) (3,933,150) (288,102,611) (740,792,559) Proceeds from sales and maturities of
investment securities 412,498,003 21,174,998 37,259,513 470,932,514 Interest received on investments 10,233,404 3,864,112 13,743,906 27,841,422
Net cash provided by (used in) investing activities (26,025,391) 21,105,960 (237,099,192) (242,018,623) Net increase (decrease) in cash and cash equivalents 53,954,874 2,902,863 24,027,307 80,885,044
Cash and cash equivalents at beginning of year 9,601,700 1,601,144 6,663,752 17,866,596
Cash and cash equivalents at end of year $ 63,556,574 4,504,007 30,691,059 98,751,640
Reconciliation of operating income (loss) to netcash provided by (used in) operating activities:
Operating income (loss) $ 11,276,251 3,388,734 22,995,638 37,660,623
Adjustments to reconcile operating lossto net cash provided by (used in)operating activities:
Investment income (15,453,922) (6,642,191) (35,933,428) (58,029,541) Interest Expense 11,075,280 2,871,270 10,621,857 24,568,407 Changes in provision for (reversal of) estimated
losses on program loans receivable (1,406,783) — 74 (1,406,709) Changes in assets and liabilities:
Program loans receivable 25,274,789 — 131,545 25,406,334 Interest receivable on program loans 146,025 — — 146,025 Other liabilities 69,976 — — 69,976
Total adjustments 19,705,365 (3,770,921) (25,179,952) (9,245,508)
Net cash provided by (used in) operating activities $ 30,981,616 (382,187) (2,184,314) 28,415,115
Noncash investing capital and financing activities:Transfer of foreclosed assets $ 2,317,931 — — 2,317,931
Increase (decrease) in the fair value of investments $ 9,617,664 6,901,978 17,667,115 34,186,757
See accompanying independent auditors' report.
80
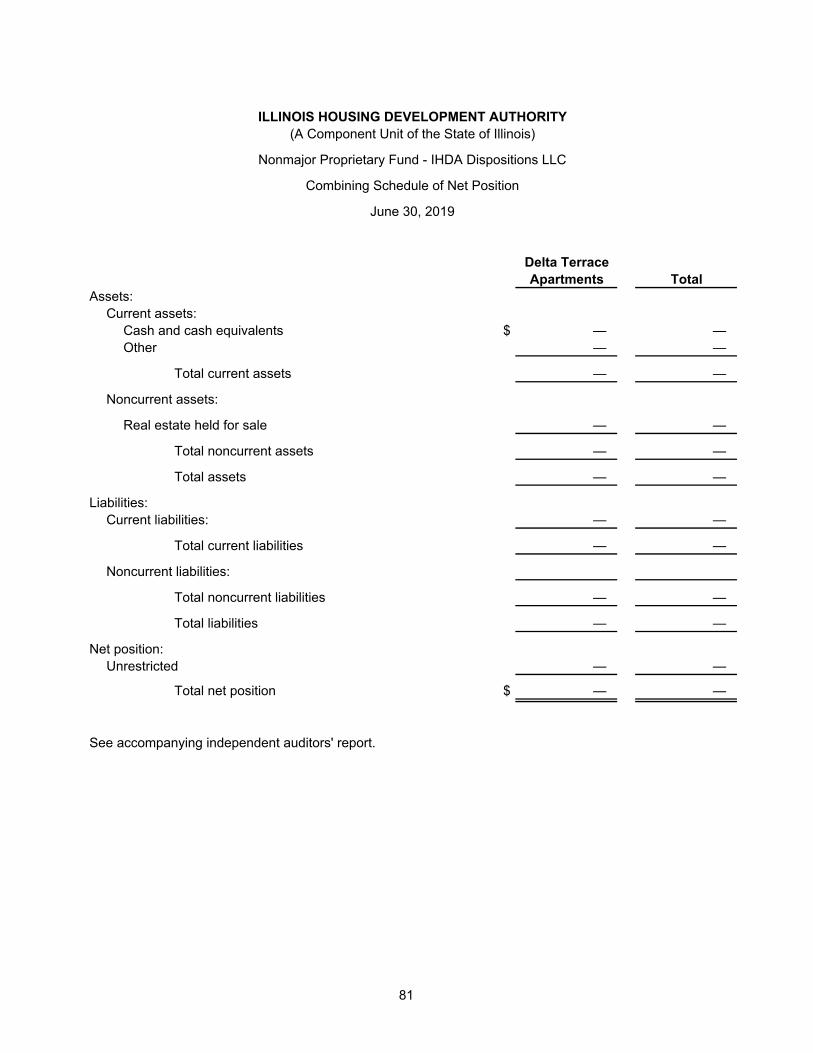
ILLINOIS HOUSING DEVELOPMENT AUTHORITY(A Component Unit of the State of Illinois)
Nonmajor Proprietary Fund - IHDA Dispositions LLC
Combining Schedule of Net Position
June 30, 2019
Delta TerraceApartments Total
Assets:Current assets:
Cash and cash equivalents $ — — Other — —
Total current assets — —
Noncurrent assets:
Real estate held for sale — —
Total noncurrent assets — —
Total assets — —
Liabilities:Current liabilities: — —
Total current liabilities — —
Noncurrent liabilities:
Total noncurrent liabilities — —
Total liabilities — —
Net position:Unrestricted — —
Total net position $ — —
See accompanying independent auditors' report.
81
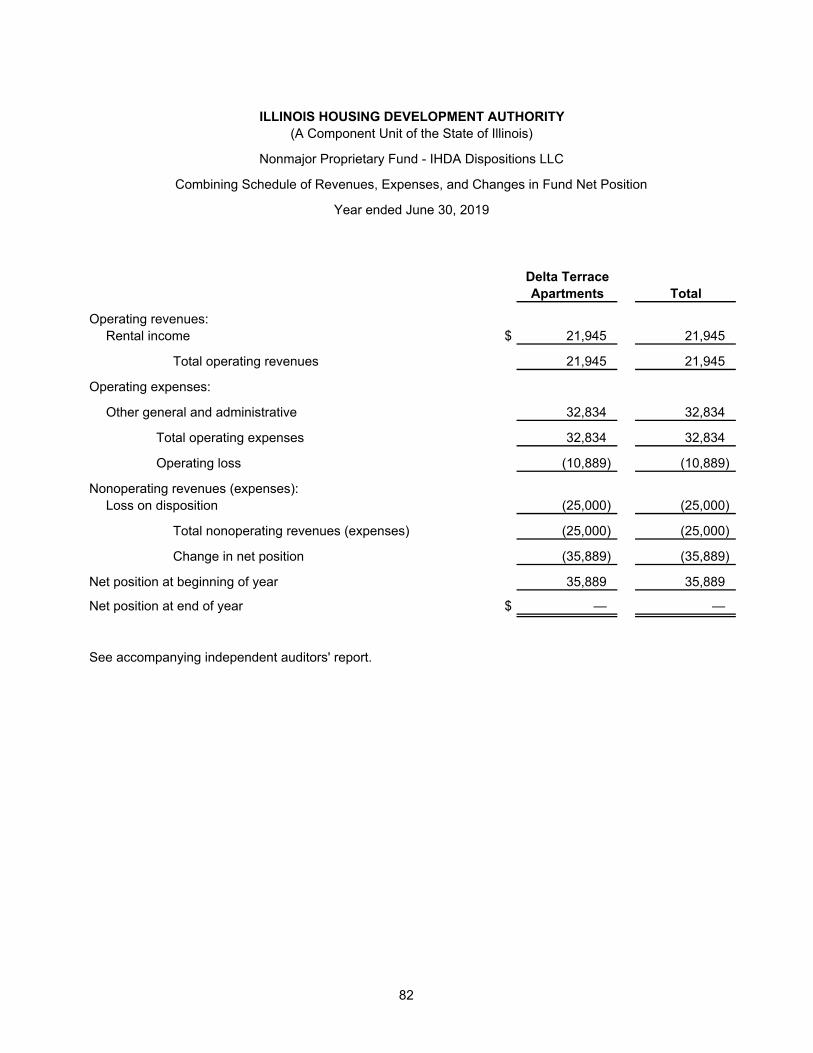
ILLINOIS HOUSING DEVELOPMENT AUTHORITY(A Component Unit of the State of Illinois)
Nonmajor Proprietary Fund - IHDA Dispositions LLC
Combining Schedule of Revenues, Expenses, and Changes in Fund Net Position
Year ended June 30, 2019
Delta TerraceApartments Total
Operating revenues:Rental income $ 21,945 21,945
Total operating revenues 21,945 21,945
Operating expenses:
Other general and administrative 32,834 32,834
Total operating expenses 32,834 32,834
Operating loss (10,889) (10,889)
Nonoperating revenues (expenses):Loss on disposition (25,000) (25,000)
Total nonoperating revenues (expenses) (25,000) (25,000)
Change in net position (35,889) (35,889)
Net position at beginning of year 35,889 35,889
Net position at end of year $ — —
See accompanying independent auditors' report.
82
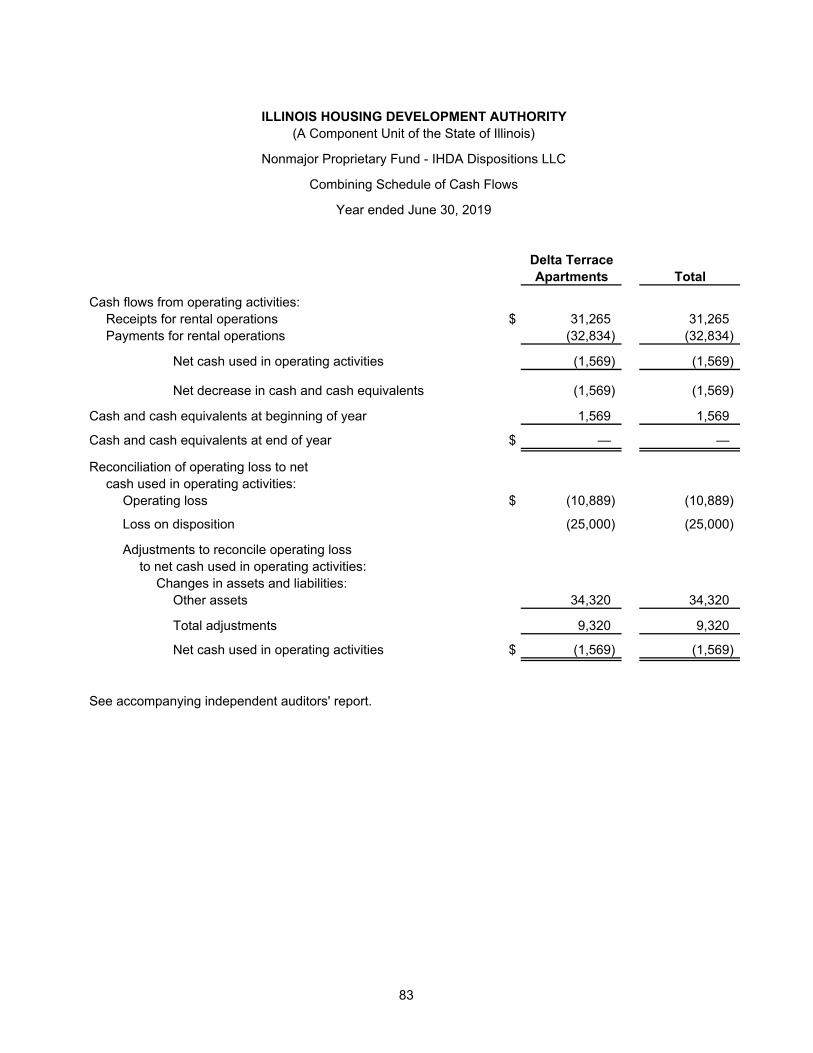
ILLINOIS HOUSING DEVELOPMENT AUTHORITY(A Component Unit of the State of Illinois)
Nonmajor Proprietary Fund - IHDA Dispositions LLC
Combining Schedule of Cash Flows
Year ended June 30, 2019
Delta TerraceApartments Total
Cash flows from operating activities:Receipts for rental operations $ 31,265 31,265 Payments for rental operations (32,834) (32,834)
Net cash used in operating activities (1,569) (1,569)
Net decrease in cash and cash equivalents (1,569) (1,569)
Cash and cash equivalents at beginning of year 1,569 1,569
Cash and cash equivalents at end of year $ — —
Reconciliation of operating loss to netcash used in operating activities:
Operating loss $ (10,889) (10,889)
Loss on disposition (25,000) (25,000)
Adjustments to reconcile operating lossto net cash used in operating activities:
Changes in assets and liabilities:Other assets 34,320 34,320
Total adjustments 9,320 9,320
Net cash used in operating activities $ (1,569) (1,569)
See accompanying independent auditors' report.
83