Embed Size (px)
Citation preview
John Maki Illinois Criminal Justice Information Authority
State of IllinoisBruce Rauner, Governor
HOUSING AND SERVICES AFTER PRISON Evaluation of the St. Leonard's House Reentry Program

Photograph by Sandro Miller, used with permission
HOUSING AND SERVICES AFTER PRISON: Evaluation of the St. Leonard’s House Reentry
Program
Third in a series
2016
Prepared by Jessica Reichert, Senior Research Analyst
Mark Powers, Senior Research Analyst Rebecca Skorek, Senior Research Analyst
Suggested citation: Reichert, J., Powers, M., & Skorek, R. (2016).Housing and services after prison: Evaluation of the St. Leonard’s House reentry program. Chicago, IL: Illinois Criminal Justice Information Authority. This project was supported in part by Grant# 08-DJ-BX-0034, #10-DJ-BX-0015, and #12-DJ-BX-0203, awarded to the Illinois Criminal Justice Information Authority by the Bureau of Justice Assistance, Office of Justice Programs, U.S. Department of Justice. Points of view or opinions contained within this document are those of the authors and do not necessarily represent the official position or policies of the Authority or the U.S. Department of Justice.
Illinois Criminal Justice Information Authority 300 West Adams, Suite 200
Chicago, Illinois 60606 Phone: 312.793.8550 Fax: 312.793.8422
http://www.icjia.state.il.us
Acknowledgements The authors would like to thank the following individuals and agencies for providing assistance and guidance on this project:
Angela Aidala, Columbia University
Diana Chavez, Loyola University of Chicago Lisa Hampton, Illinois Department of Juvenile Justice
Heather Hlavka, Marquette University Reuben Miller, Loyola University Chicago
Patricia O’Brien, University of Illinois-Chicago Gwendolyn Purifoye, Loyola University of Chicago
Ryan Santos-Leslie, Marquette University Kimberly Sperber, Talbert House
Judith Wittner, Loyola University Chicago Jennifer Yahner, The Urban Institute
The authors would like to acknowledge the following St. Leonard’s Ministries staff and former staff for their assistance:
Kimberly Crawford Walter Boyd
Robert Dougherty Bernadine Dowdell
Victor Gaskins Carla Lewis Erwin Mayer
Christopher Roach Sister Theresa Mayrand
The authors would like to acknowledge the following Authority staff for their assistance:
Sharyn Adams Megan Alderden
Ashley Blair, Intern Kimberly Burke Matthew Clarke
Vickii Coffey, Intern Christine Devitt Westley
Racquel Diaz, Intern Jin Fong
Chelsea Hanlock, Intern John Maki
Ernst Melchior Cristin Evans Mark Myrent
Sal Perri Idetta Phillips
Hannah Ridge, Intern Christopher Schweda LaToyia Sias, Intern
Amy Sylwestrzak, Intern
i
Table of contents
Key findings ................................................................................................ ii
Introduction ................................................................................................. 1
About St. Leonard’s Ministries .................................................................... 3
Literature review ....................................................................................... 15
Methodology ............................................................................................. 25
Findings: Program outcomes .................................................................... 30
Characteristics of sample groups ........................................................... 30
Criminal history of sample groups .......................................................... 31
Analysis of recidivism outcomes ............................................................ 36
Employment outcomes by sample group ............................................... 43
Comparison of outcomes by sample group ............................................ 46
Relationships between resident characteristics and outcomes ............... 51
Findings: Program residents over time ...................................................... 57
Findings: Staff and stakeholder feedback ................................................. 63
Implications for policy and practice ........................................................... 73
Conclusion ................................................................................................ 83
References ............................................................................................... 85
Appendix A: St. Leonard’s House calendar ............................................... 96
Appendix B: Staff and stakeholder interview questions ............................. 97
ii
Key findings More than 2.4 million people are confined in the U.S. in state and federal prisons, juvenile corrections, and jails (Wager & Sakala, 2014). Each year, more than half a million individuals are released from prison and return to their communities (Carson & Sabol, 2012; Guerino, Harrison, & Sabol, 2011; Travis, 2005). After leaving prison, individuals with criminal records face obstacles including difficulty finding employment and housing, significant debt, outstanding fines, and restitution payments (Levingston & Turetsky, 2007; Wheelock, 2005; Gouvis-Roman & Travis, 2004). Two thirds of released prisoners are rearrested within three years of release for new crimes or a violation of parole (Langan & Levin, 2002). This report, the third in the series for the St. Leonard’s Ministries’ evaluation, focuses on St. Leonard’s House, a voluntary, residential, prisoner reentry program for men in Chicago (see Reichert, 2015; Cossyleon & Reichert, 2015). The program helps residents rebuild their lives and reenter society and helps them overcome substance abuse and gain education, life skills, employment, and permanent housing. Research goals were to describe the program and its residents, examine the program’s impact, and make suggestions about how to enhance programming. Illinois Criminal Justice Information Authority (Authority) researchers compared rearrest, reconviction, reincarceration, and employment rate among a resident group and a non-resident group. In addition, staff examined administrative program reports and interviewed program staff. About St. Leonard’s House participants Authority researchers examined 2009-2012 St. Leonard’s House program data on 316 residents accepted into the program, as well as data on 467 applicants who were not accepted into the program and lived elsewhere. Black residents were the racial majority during the four-year period examined. In 2012, the average resident age was 40 years old (the range was 20 to 66 years old); 72 percent of residents had at least a high school diploma or GED; and the average number of days in the program was 163. For every year except 2012, heroin was the most common drug of choice among residents and marijuana the second most common. (Heroin was second most common after marijuana in 2012.) In the resident sample, the average number of prior arrests was 21, prior convictions was nine, and prior incarcerations was three. The majority of residents had prior property and drug arrests and convictions, and nearly half had a prior violent conviction. Program outcomes Resident outcomes compared to a comparison group St. Leonard’s House provided Authority researchers with records on residents (who were to form the treatment group) as well as individuals who applied but were not accepted to the program (who were to form the comparison group) Those chosen for the comparison group were not accepted to the program due to a lack of capacity. Researchers compared the outcomes of 119
iii
residents to those of 127 non-residents. Overall, the evaluation revealed that St. Leonard’s House residents had statistically better outcomes than the comparison group, including reduced recidivism. Of those St. Leonard’s House residents included in the sample, 48 percent were rearrested, 19 percent reconvicted, and 16 percent reincarcerated. Of those non-resident included in the comparison group, 63 percent were rearrested, 29 percent reconvicted, and 37 percent reincarcerated. Multivariate regression models indicated that residents were 62 percent less likely to be reincarcerated and 38 percent less likely to be rearrested after controlling for other variables. St. Leonard’s House residents also had longer periods of desistence. The median time to rearrest was 11.3 months for St. Leonard’s House residents and 9.7 months for non-residents in the comparison group; median time to reincarceration was 10.3 months for residents and 6.4 months for members of the comparison group. St. Leonard’s House residents also did better than the comparison group as it relates to employment. St. Leonard’s House residents earned an average of $10,200, while members of the comparison group earned an average of $5,500 over a two-year time period. Program outcomes by resident characteristics A chi-square test and t-test were performed to determine the correlation or relationship between different characteristics of St. Leonard’s House residents and the likelihood of reincarceration after program participation. There was a relationship between residents’ race and the likelihood of reincarceration—Black residents were more likely to be reincarcerated than residents other races. There was a relationship found between length of participation in St. Leonard’s House and reincarceration; those with longer average lengths of stay were less likely to be reincarcerated. Those with fewer prior arrests and reincarcerations, as well as fewer prior felony arrests were less likely to be reincarcerated. Similarly, those with longer average lengths of stay in prison were more likely to be reincarcerated. There was a relationship between residents’ offense type and reincarceration. Residents offense at the time of application to St. Leonard’s House included property, person/violent, drugs, and sex. Residents who served time in prison for a property offense or whose last offenses was violent were more likely to be reincarcerated after program participation.
Staff and stakeholder feedback Authority researchers interviewed 17 St. Leonard’s House staff and stakeholders. Five staff received no training at the start of employment. Staff and stakeholders did not report the same goals of St. Leonard’s House or criteria for successful completion. In addition to praising the program model, they shared that the best part of working at St. Leonard’s House was helping men achieve their goals and successfully complete the program. They believed that the strongest parts of the program were staff, volunteers, and board members. On the other hand, they believed weaknesses of the program included staff inconsistency and lack of follow through with policies and procedures. Fourteen staff said that sometimes there is tension or friction between residents and staff, and nine said that residents caused the tension or friction. Thirteen staff said that sometimes there is tension or friction among residents, mainly due to personality conflicts.
iv
Implications for policy and practice Improve resident selection process Based on evaluation findings, researchers recommend that St. Leonard’s House improve the resident selection process by measuring the risk, needs, and assets of potential residents to guide individualized treatment plans. St. Leonard’s House can also use a tool to measure readiness for change and criminal thinking at intake and again at exit. Enhance programming St. Leonard’s House can enhance programming by offering individualized services guided by factors such as risk, needs, and assets. In developing individualized services, the following factors should be considered: treatment dosages, lengths of stay, group/service participation, case manager assignments, living quarters, and employment needs. St. Leonard’s House can increase resident autonomy by allowing residents to earn privileges and reduced restrictions, as well as some choice in service participation. Enhance case management skills, effectiveness
Researchers recommend training for staff and volunteers in evidence-based practices, such as motivational interviewing and Thinking for a Change (T4C), to enhance case management skills and effectiveness. Thinking for a change was incorporated in to the St. Leonard House’s core programming (E. Meyer, personal communication, November 14, 2016). Improve communication Based on the evaluation findings, researchers suggest improving communication among administration, staff, volunteers, and interns, as well as communication among residents. Staff mentioned inconsistency in rules enforcement, and this should be addressed. Collect data for quality improvement St. Leonard’s House should further market its program and its many successes. Researchers suggest that the program collect data for quality improvement and future evaluation.
1
Introduction Evaluation of St. Leonard’s Ministries St. Leonard’s Ministries operates two transitional residential programs with supportive services: St. Leonard’s House for adult men exiting prison and Grace House for adult women exiting prison. Illinois Criminal Justice Information Authority (Authority) researchers sought to identify program components that are effective in contributing to successful resident outcomes and collect information on the programs’ residents and operations. The goal was to educate criminal justice professionals and the public about the potential benefits of long-term, structured reentry programs for formerly incarcerated men and women. The evaluation research goals were to
• learn the day-to-day operations and interactions; • provide a description of residents of the programs; • measure recidivism and employment outcomes of program residents and a comparison
group; • assess indicators of incremental and longer-term success for program residents; • gauge levels of resident satisfaction with programs; • identify effective components of the overall program model; • offer suggestions for program enhancement; and • determine the cost and benefits of the programs.
The methodology of the evaluation included the following components:
• case study interviews with former St. Leonard’s House and Grace House residents; • field observations of Grace House; • interviews with staff and stakeholders of St. Leonard’s House and Grace House; • administrative program data for St. Leonard’s House and Grace House; and • impact/outcome analysis of St. Leonard’s House and Grace House. (St. Leonard’s House
had a comparison group, while Grace House did not.) Evaluation of St. Leonard’s House
The study design, which is described in greater detail below, addresses past limitation to reentry studies in two ways. First, the study used quasi-experimental design with a sample size of 119 in the treatment group and 127 in the comparison group. The study design follows the What Works in Reentry Clearinghouse which recommends that reentry program, outcome evaluations use experimental or quasi-experimental design (with a treatment and comparison group) and have a minimum sample size of 30 in treatment and comparison groups. There is a dearth of reentry research that uses experimental or quasi-experimental design. Seiter and Kadella (2003) looked at a 25-year span and found only nine reentry program evaluations
2
used a comparison group, which indicated a clear need for more rigorous outcome evaluation in the field. Muhlhausen (2010) was unable to identify any quasi-experimental evaluations of faith-based programs and only five of non-secular programs. Second, this study used multiple measures of resident outcomes, including rearrests, reconvictions, reincarcerations, and employment levels. Prior research has been limited to reincarceration outcomes (Spivak & Sharp, 2008; Wilson, 2005). As Ostermann (2015) noted, this limitation can “artificially deflate recidivism” (p. 166). However, “by defining recidivism as a rearrest or a reconviction, criminal involvement is captured at multiple levels and outcomes are not masked because of technical violations or sentencing practices” (Ostermann, p. 166). Prior evaluation of St. Leonard’s Ministries Multiple applied research studies have been conducted at St. Leonard’s Ministries to learn more about formerly incarcerated individuals and reentry. However, to date, only two evaluations of one of its programs—Grace House—has been conducted (Cossyleon & Reichert, 2015; O’Brien, 2002), so there is a lack of information on its programs’ processes and outcomes. While there are other similar residential programs around the country, few evaluations have been conducted to determine the efficacy of this type of single-site model.
3
About St. Leonard’s Ministries St. Leonard’s Ministries was founded in 1954 as a result of the work of Father James Jones, who served as Episcopal Chaplain at the Bridewell Jail, now Cook County jail. St. Leonard’s Ministries is located in Chicago in the West Loop neighborhood and operates two transitional housing programs—St. Leonard’s House and Grace House. St. Leonard’s Ministries also operates other programs, including St. Andrew’s Court, Harvest Common Residence and the Michael Barlow Center. St. Andrew’s Court, which opened in 1998, is a subsidized rent program that provides men who have successfully completed the St. Leonard’s House program with small apartments on the grounds of St. Leonard’s Ministries. Harvest Common Residence opened in 2014 and offers permanent residences for women and men. The Michael Barlow Center offers educational and vocational assistance to residents of St. Leonard’s House and Grace House but is also open to non-residents. Additionally, St. Leonard’s Ministries operates Gracie's Café, which gives St. Leonard’s Ministries’ residents training and employment in food service.1
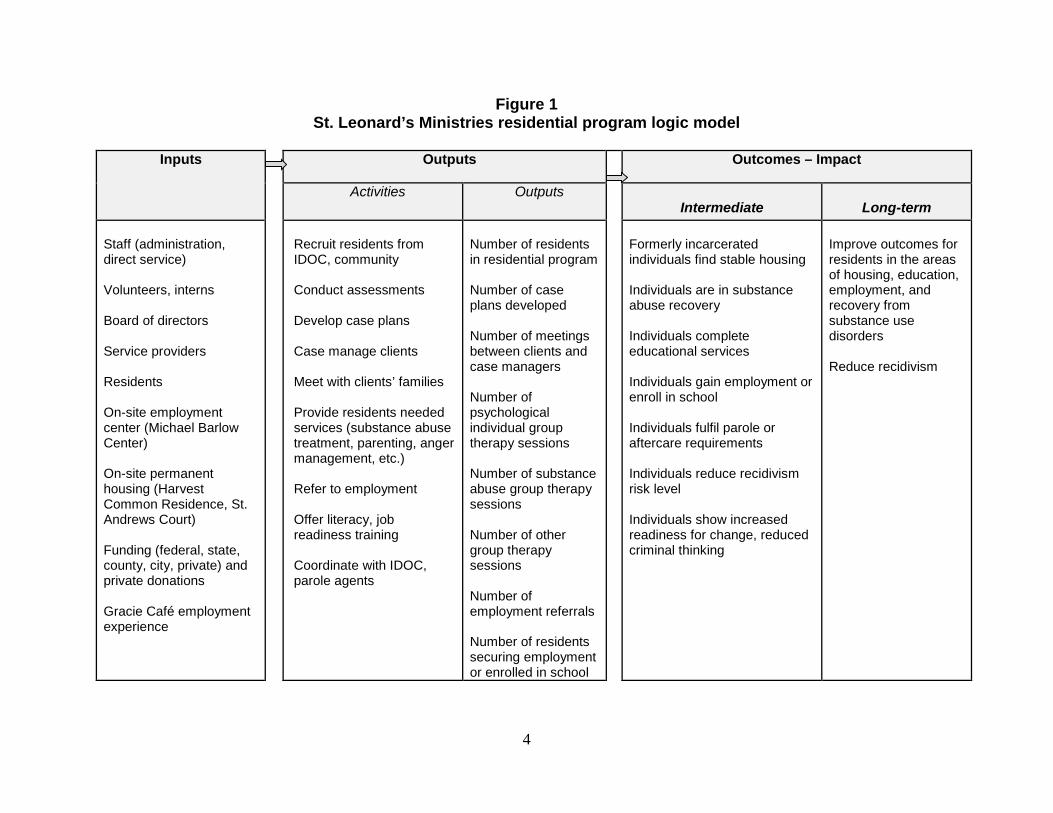
In 2011, St. Leonard’s Ministries’ staff calculated a three-year reincarceration rate for St. Leonard’s House residents returned to the Illinois Department of Corrections (IDOC). Staff searched the IDOC website to see if residents were back in prison, but the method excluded individuals who were in prison before or after the point in time that the website was searched. The St. Leonard’s House reincarceration rate was 12.6 percent—34 out of 270 residents; in comparison, the reincarceration rate for all individuals leaving IDOC is about 50 percent. According to the Congressional Research Service, “When using recidivism statistics to evaluate a program, it is important to understand exactly what is included in the definition of recidivism” (James, 2015, p.11). Therefore, this report offers a more precise recidivism rate of residents including the number of rearrest, reconviction, and reincarceration as measures of recidivism. In 2012, the National Criminal Justice Association awarded St. Leonard’s Ministries the Outstanding Criminal Justice Program for the Midwest Region Award. In 2010, the United Way of Metropolitan Chicago awarded St. Leonard’s Ministries the Agency of the Year Award, based, in part, on its valuable and collaborative efforts in advancing the United Way Mission. In 2001, St. Andrew’s Court was the recipient of the Fannie Mae Foundation’s Maxwell Award of Excellence for its work in the field of supportive housing for homeless individuals. Program logic model Researchers created a logic model of St. Leonard’s Ministries residential programs to depict logical linkages among program resources, activities, outputs, and outcomes (Figure 1).
1 St. Leonard’s Ministries closed its Gracie’s Café site on June 30, 2016 but retained its catering business and training program and now operates the Gracie’s Catering business out of its culinary training program at the Michael Barlow Center.
4
Figure 1 St. Leonard’s Ministries residential program logic model
Inputs Outputs Outcomes – Impact
Activities Outputs Intermediate Long-term
Staff (administration, direct service) Volunteers, interns Board of directors Service providers Residents On-site employment center (Michael Barlow Center) On-site permanent housing (Harvest Common Residence, St. Andrews Court) Funding (federal, state, county, city, private) and private donations Gracie Café employment experience
Recruit residents from IDOC, community Conduct assessments Develop case plans Case manage clients Meet with clients’ families Provide residents needed services (substance abuse treatment, parenting, anger management, etc.) Refer to employment Offer literacy, job readiness training Coordinate with IDOC, parole agents
Number of residents in residential program Number of case plans developed Number of meetings between clients and case managers Number of psychological individual group therapy sessions Number of substance abuse group therapy sessions Number of other group therapy sessions Number of employment referrals Number of residents securing employment or enrolled in school
Formerly incarcerated individuals find stable housing Individuals are in substance abuse recovery Individuals complete educational services Individuals gain employment or enroll in school Individuals fulfil parole or aftercare requirements Individuals reduce recidivism risk level Individuals show increased readiness for change, reduced criminal thinking
Improve outcomes for residents in the areas of housing, education, employment, and recovery from substance use disorders Reduce recidivism

5
Operations St. Leonard’s Ministries is a non-profit organization with a governing board of 17 board members. The board has five committees—a personnel committee, a program committee, a fund raising committee, finance committee, and audit committee. Grace House also has an advisory board. Agency staff In July 2012, St. Leonard’s Ministries employed 43 full-time and 22 part-time staff. Many of the staff are formerly incarcerated individuals or former residents. There were 18 staff employed at St. Leonard’s House—12 full-time and six part-time—in the following positions:
• 1 program director; • 1 intake worker; • 2 case workers; • 1 housing/aftercare specialist; • 1 senior house monitor; • 5 full-time and 6 part-time house monitors; and • 1 data specialist.
Thirteen staff members were employed at Grace House, including five full-time and seven part-time. They included the following:
• 1 program director • 1 administrator; • 1 housing/aftercare/mentoring director; • 1 administrative assistant; • 2 full-time and 6 part-time house monitors; and • 1 part-time maintenance worker.
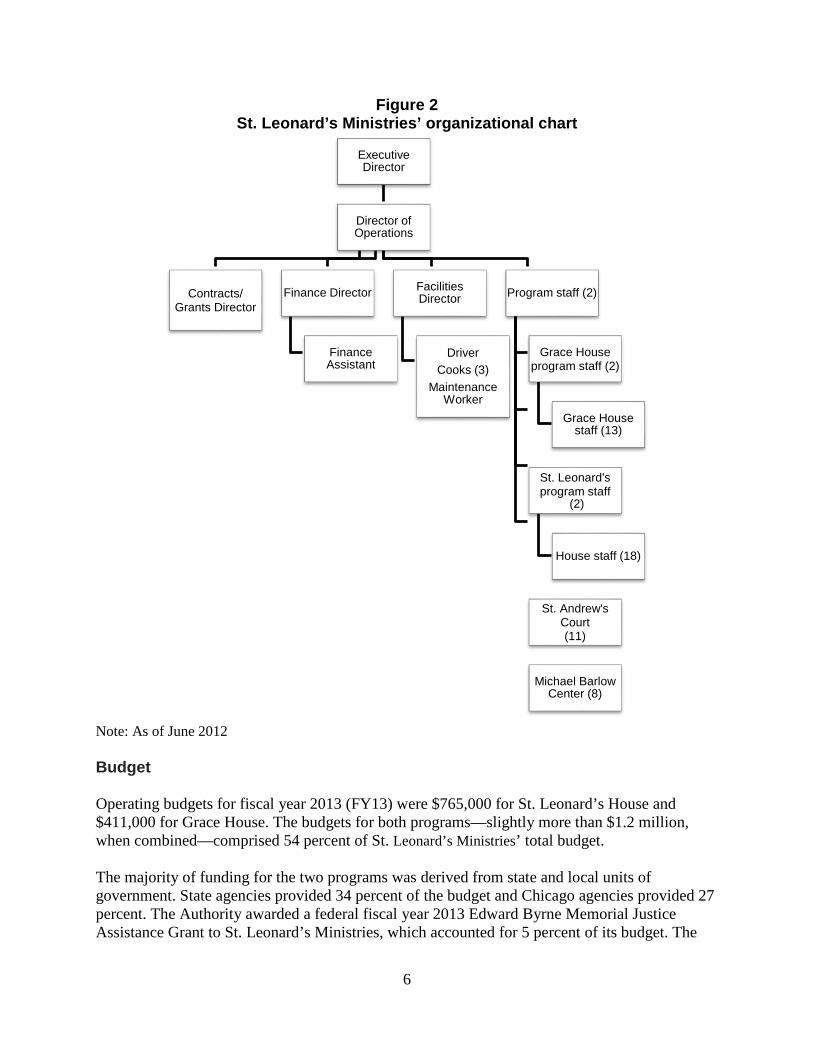
In addition, a volunteer services coordinator and a volunteer chaplain worked with both residential programs and St. Andrew’s Court. The agency also hired 10 unpaid interns per college semester who received college credit. Finally, 12 volunteers tutored program participants. Figure 2 depicts St. Leonard’s Ministries’ organizational chart.
6
Figure 2 St. Leonard’s Ministries’ organizational chart
Note: As of June 2012 Budget Operating budgets for fiscal year 2013 (FY13) were $765,000 for St. Leonard’s House and $411,000 for Grace House. The budgets for both programs—slightly more than $1.2 million, when combined—comprised 54 percent of St. Leonard’s Ministries’ total budget. The majority of funding for the two programs was derived from state and local units of government. State agencies provided 34 percent of the budget and Chicago agencies provided 27 percent. The Authority awarded a federal fiscal year 2013 Edward Byrne Memorial Justice Assistance Grant to St. Leonard’s Ministries, which accounted for 5 percent of its budget. The
Executive Director
Director of Operations
Contracts/Grants Director
Finance Director
Finance Assistant
Facilities Director
Driver Cooks (3)
Maintenance Worker
Program staff (2)
Grace House program staff (2)
Grace House staff (13)
St. Leonard's program staff
(2)
House staff (18)
St. Andrew's Court (11)
Michael Barlow Center (8)
7
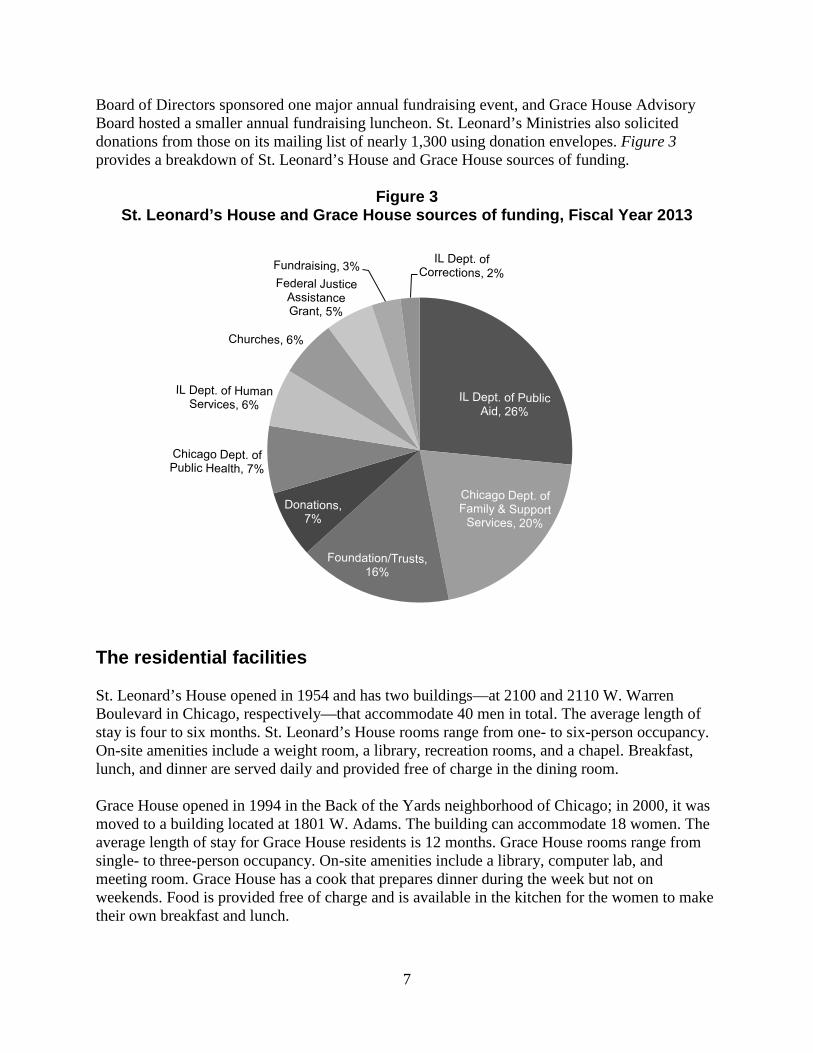
Board of Directors sponsored one major annual fundraising event, and Grace House Advisory Board hosted a smaller annual fundraising luncheon. St. Leonard’s Ministries also solicited donations from those on its mailing list of nearly 1,300 using donation envelopes. Figure 3 provides a breakdown of St. Leonard’s House and Grace House sources of funding.
Figure 3 St. Leonard’s House and Grace House sources of funding, Fiscal Year 2013
The residential facilities St. Leonard’s House opened in 1954 and has two buildings—at 2100 and 2110 W. Warren Boulevard in Chicago, respectively—that accommodate 40 men in total. The average length of stay is four to six months. St. Leonard’s House rooms range from one- to six-person occupancy. On-site amenities include a weight room, a library, recreation rooms, and a chapel. Breakfast, lunch, and dinner are served daily and provided free of charge in the dining room. Grace House opened in 1994 in the Back of the Yards neighborhood of Chicago; in 2000, it was moved to a building located at 1801 W. Adams. The building can accommodate 18 women. The average length of stay for Grace House residents is 12 months. Grace House rooms range from single- to three-person occupancy. On-site amenities include a library, computer lab, and meeting room. Grace House has a cook that prepares dinner during the week but not on weekends. Food is provided free of charge and is available in the kitchen for the women to make their own breakfast and lunch.
8
Rules and regulations Staff are on duty 24 hours a day. Residents are required to sign in and sign out. When leaving, they must write where they are going, the time they left, and the time they expect to return. Some residents have additional restrictions because of their parole. For example, if a resident is on electronic monitoring and misses curfew, St. Leonard’s Ministries contacts the parole agent. The curfew for men is 11:00 p.m. from Sunday through Thursday, and 1:00 a.m. from Friday through Sunday. For women, the curfew is 10:00 p.m. from Monday through Thursday, and 12:00 a.m. from Friday through Sunday. Residents are responsible for cleaning and maintaining their quarters and common areas within assigned buildings. Residents who are not attending programs or working are asked to complete chores to keep their living environment clean and safe. St. Leonard’s Ministries issues a property bag with toiletries, bed linens, and a room key to an assigned room. Residents are allowed laptop computers, personal DVD players, personal music devices, alarm clocks, electric razors/clippers, cell phones, and a maximum of three bags of clothing. Wireless Internet access is not available. New residents receive passes allowing them to leave the grounds upon completion of a 10-day orientation period. Passes may be limited as a result of an individual’s relapse while on a weekend pass, unauthorized absences, or behavior detrimental to the individual or St. Leonard’s Ministries (e.g., criminal activity). Visitors are allowed during program hours but are restricted to the first floors, dining room, and yard. St. Leonard’s Ministries has an appeals process for residents who believe they have been unjustly cited for a breach of the rules or who believe that imposed penalties are unduly severe. Residents can appeal the decision through a grievance process. They first discuss their concerns and intention to appeal with their caseworker. If the resident remains unsatisfied with the response, he or she may then appeal to the Program Director. If the resident is not satisfied, they may make a final appeal to the St. Leonard’s Ministries’ Director of Operations. Program process While still incarcerated, individuals learn about the program through word of mouth or from the Illinois Department of Corrections Field Services Division. Field Services provides applications to the programs. An application is completed by the inmate and sent to the program’s intake coordinator. The intake coordinator decides who will be accepted into the program based on information collected from the application and in a phone interview. Decisions are made based on the individual’s need and willingness to try to make changes in his or her life.
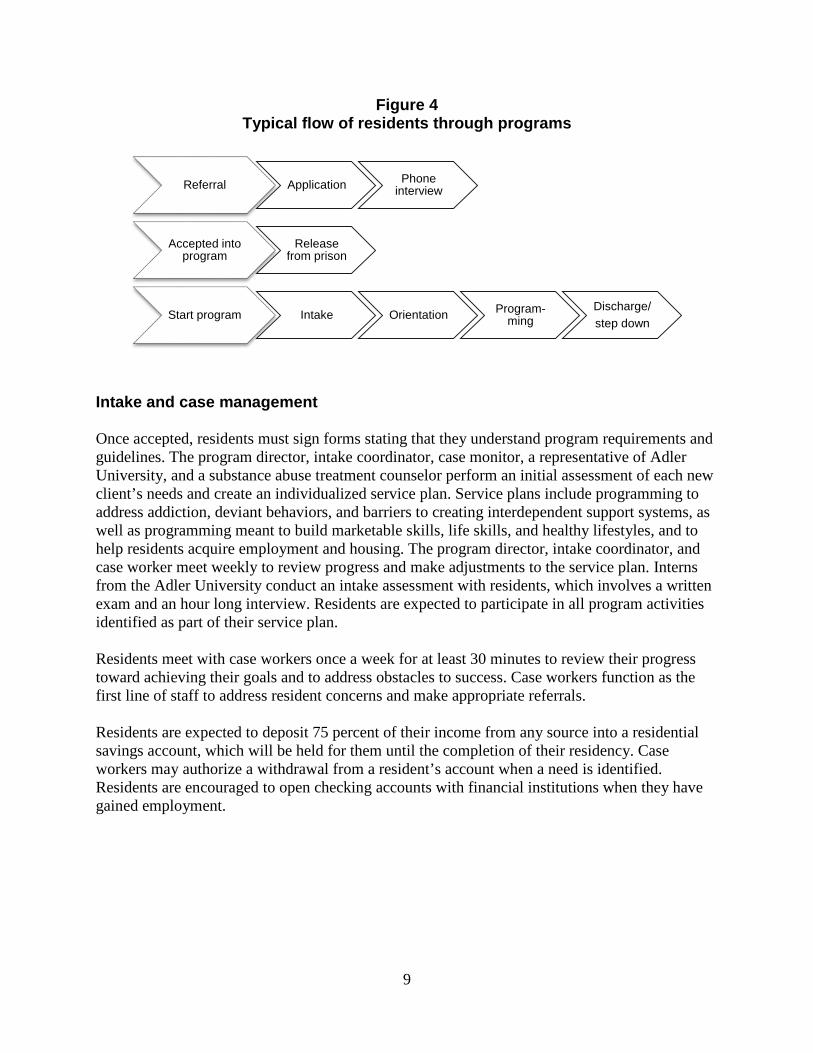
Figure 4 offers the flow of residents through St. Leonard’s House and Grace House programs.
9
Figure 4 Typical flow of residents through programs
Intake and case management Once accepted, residents must sign forms stating that they understand program requirements and guidelines. The program director, intake coordinator, case monitor, a representative of Adler University, and a substance abuse treatment counselor perform an initial assessment of each new client’s needs and create an individualized service plan. Service plans include programming to address addiction, deviant behaviors, and barriers to creating interdependent support systems, as well as programming meant to build marketable skills, life skills, and healthy lifestyles, and to help residents acquire employment and housing. The program director, intake coordinator, and case worker meet weekly to review progress and make adjustments to the service plan. Interns from the Adler University conduct an intake assessment with residents, which involves a written exam and an hour long interview. Residents are expected to participate in all program activities identified as part of their service plan. Residents meet with case workers once a week for at least 30 minutes to review their progress toward achieving their goals and to address obstacles to success. Case workers function as the first line of staff to address resident concerns and make appropriate referrals. Residents are expected to deposit 75 percent of their income from any source into a residential savings account, which will be held for them until the completion of their residency. Case workers may authorize a withdrawal from a resident’s account when a need is identified. Residents are encouraged to open checking accounts with financial institutions when they have gained employment.
Referral Application Phone interview
Accepted into program
Release from prison
Start program Intake Orientation Program-ming
Discharge/step down
10
Discharge from the program There are three ways to be discharged from St. Leonard’s House or Grace House:
1. successful completion of the program; 2. leave/ self-discharge; 3. administrative discharge- either asked to leave the program or extensive medical or
mental health needs.
Residents who refuse to fulfill service plans or otherwise participate in the program are asked to leave. Staff are required to contact the Illinois Department of Corrections if one of its parolees self-discharges or is administratively discharged. All former residents are invited to an annual holiday party. Grace House sends postcards to former residents at three, six, and 12 months post-discharge requesting addresses and information on employment, school enrollment, and attendance in recovery support meetings. Program services During the first 90 days, all services are mandatory. After that time period, residents are expected to attend all services unless excused to look for or attend work or to attend school. St. Leonard’s House’s mandatory services include the following:
• substance abuse treatment services, including o intensive outpatient treatment, o relapse prevention, and o Alcoholics Anonymous/Narcotics Anonymous meetings;
• and psychological services, including o psychological assessment, o mental health counseling, o parenting, and o anger management.
Grace House’s mandatory services include the following:
• substance abuse treatment services, including o intensive outpatient treatment, o relapse prevention, and o Alcoholics Anonymous/Narcotics Anonymous meetings;
• psychological services, including o anger management, o emotional healing, and o family restoration;
• and educational and vocational services, including o financial literacy, and
11
o life-skills development.
St. Leonard’s House and Grace House also require residents to obtain vital statistics forms, such as birth certificates, social security cards, medical cards, and medical evaluations. Psychological services The Adler University provides mental health counseling, parenting classes, and anger management classes to residents of both programs. Adler University’s mission is to prepare its students to be socially responsible practitioners who engage communities and advance social justice during both their course of study and their later professional lives. The University and St. Leonard’s Ministries have a direct service contract which allows students to meet the school’s internship requirements by serving at St. Leonard’s Ministries. In doing so, graduate students gain experience with mental health assessments, testing, and individual and group counseling on site. Students are overseen by a site manager, also a student, who works with St. Leonard’s Ministries for an academic year. Substance abuse-related services In addition to intensive outpatient treatment, St. Leonard’s House offers individual and group counseling, recovery management groups, and referrals to in-patient detoxification when necessary. Healthcare Alternatives Systems (HAS) is the male intensive outpatient treatment provider. These services are designed for individuals who have significant addiction symptoms but are medically stable and do not need detoxification or residential services. Upon completing an assessment, residents are placed in either a 25-session intensive outpatient substance abuse group or a 10-session outpatient substance abuse group. Upon completion of the intensive outpatient drug treatment group, residents will automatically be placed in the lesser intensive outpatient group for 10 weeks. During outpatient counseling, participants learn about the disease process of alcoholism and drug addiction, work with staff to understand and accept their own chemical dependence, and explore healthy lifestyles that do not include alcohol and drug use. At St. Leonard’s House, a relapse prevention group meets weekly before the residents leave on weekend passes. The group assists residents in identifying situations they may encounter while off site that will interfere with their sobriety. Residents are required to attend two on-site and two off-site Narcotics Anonymous (NA) or Alcoholics Anonymous (AA) meetings. Urinalysis tests are given to residents after they leave the program on a weekend pass and randomly throughout week. Tests are given by trained house monitors; results are indicated in five minutes and results are confirmed by another staff person. If a test is positive, the resident is sent to detox and the treatment provider is consulted. A treatment plan is developed and the resident’s movement is restricted. Grace House offers 60 to 70 hours of intensive outpatient services through Women’s Treatment Center in Chicago. The Center’s mission is to provide women with a continuum of care,
12
recovery tools, and parenting skills to maintain a sober lifestyle as they rebuild their lives and their futures. Groups cover drug affects, relapse prevention, introduction to the 12-step recovery process, and related health issues. Life skills Life Skills Group is a 12-week course run by a volunteer. The course helps residents improve social development by introducing them to everyday skills they will need to successfully function in society. Life Skills II course exposes the resident to cultural activities. Residents attend plays, write poems, and participate in cultural outings. Educational and vocational services The Michael Barlow Center offers residents of both programs the following:
• literacy assessment and tutoring services; • access to St. Leonard’s High School Completion Program; • participation in The Odyssey Project; • participation in Money Smarts; • employment preparation training; • training in basic culinary skills; • participation in Greenworks: Building Maintenance for the Future; • access to a computer lab; and • job placement and retention services.
All resident are assessed for literacy, and if their skills are too low for participation in education classes at the Center, they may receive on-site tutoring. The Odyssey Project provides a college-level introduction to the humanities through text-based seminars led by professors at colleges and universities. The project helps adults with low incomes more actively shape their own lives and the lives of their families and communities. Money Smarts is a financial literacy course held twice a week. It helps residents learn to manage their finances by teaching them how to develop and maintain a budget, how to check their credit scores, and how to open checking and savings accounts. Employment preparation training is conducted regularly by Michael Barlow Center staff and the Inspiration Corporation, which conducts several three-week-long, three-hour-per-day sessions that focus on skills related to the job search, such as resume preparation and job interviewing. Offered three times a year, the basic culinary skills course is an 11-week class. Students learn the basics of food preparation and preservation as well as knife skills and other skills necessary for working in a food services setting. The class takes place in a fully-equipped kitchen classroom. Greenworks: Building Maintenance for the Future is an 11-week class offered three times per year. Students learn the basics of plumbing, carpentry, and electrician-work, with an emphasis on green technology and eco-friendly ways of building and maintaining structures.
13
The Michael Barlow Center has a computer lab with 18 computers, which is open Monday through Friday, from 9:00 a.m. to 5:00 p.m. Grace House has a computer lab with eight computers, which is always open to residents. Frequently, computer classes are offered where tutors can provide computer assistance. Residents also have access to a job developer and retention counselor. Adler University graduate interns conduct an employment training group in which residents can volunteer to participate in order to develop stronger interviewing skills. Housing assistance
Residents meet with a housing specialist 90 days into the programs for weekly training and guidance on identifying and maintaining acceptable housing. Other programs and services St. Leonard’s House St. Leonard’s House residents can voluntarily participate in the Back on My Feet (BoMF) program. (At the time of this evaluation, BoMF was not offered to Grace House residents.) BoMF is a national nonprofit organization that engages individuals in running to build confidence, strength, and self-esteem. After one month of participation, BoMF members with a good attendance record advance to the Next Steps phase, where they can receive job training programs, educational scholarships, and housing assistance. Residents who have successfully completed the program come back to speak to current residents. The goal is to help residents gain an understanding of what life is like upon graduation from St. Leonard’s House. Understanding Relationships is a group for residents to discuss ways to develop and maintain healthy relationships in a group setting. Neighborhood Writing Alliance allows residents to use the art of writing to express their thoughts and feelings. Some residents are not comfortable expressing their thoughts and feelings verbally, and the program offers training and support in another form of expression.2 House of Healing is a peer-led group (staff are excluded) where residents discuss a variety of issues and, in those conversations, develop interpersonal and conflict resolution skills. Appendix A offers an example of a calendar of events offered to residents.
2 Neighborhood Writing Alliance was disbanded and no longer offers programming at St. Leonard’s House (E. Meyer, personal communication, November 14, 2016).
14
Grace House
Other Grace House programs include spiritual development; workshops on self-image, self-esteem, relationships, legal rights, and stress management; meditation; a “survivor’s” group; and recreational and social activities that compliment program services and programs. These may include gardening and other service projects such as talking to high school students about prison.
Grace House conducts a family reconnection program every other month. The day-long program includes an educational component related to coping with life’s challenges, as well as guest speakers, recreational time with kids, and entertainment. A Mother’s Day dinner is provided, as are cookouts in the summer and tree-trimming events in the winter. Counseling is available to families and is provided by students from the Adler University. Heartland Health Outreach provides medical exams, medicine, and referrals. Stroger Hospital provides limited medical treatment at no cost. Residents with medical needs that require payment must pay out of pocket or set up a payment plan. Mile Square Community Health Center also provides limited health care. Medications are stored, distributed, and recorded by staff. Residents are required to use medication as prescribed.
15
Literature review Incarceration and prisoner reentry U.S. estimates indicate that, nationwide, 13 million women and men are either currently serving or have previously served a felony sentence (Mauer, 2010). This large accrual of prisoners can be attributed in part to the enactment of “tough on crime” policies, the war on drugs, and mandatory and determinate sentencing guidelines (Lynch & Sabol, 1997). Leaders in reentry research describe the often complicated process of exiting prison is a social and emotional process, as well as a physical relocation. Reentry is not a new phenomenon, as most incarcerated individuals return to their communities (Travis, 2005). Increased attention to the reintegration of former prisoners grew parallel to the drastic rise in incarceration rates (Lynch & Sabol, 2001). Since1980, rates of incarceration have increased from one in 719 to one in 201 residents in 2010 (Blumstein & Beck, 1999; Guerino, Harrison, & Sabol, 2011). Prisoner population estimates indicate that substantially more than half of one million individuals are released from state or federal prison each year (Carson & Sabol, 2012; Guerino, Harrison, & Sabol, 2011). Notably, although Blacks represent 13.1 percent of the national population (U.S. Census Bureau, 2010), they comprise 40.7 percent of prisoners sentenced to at least one year in state or federal prison (Guerino et al., 2011). These figures may describe the current reentry dilemma quantitatively, but they only begin to portray the social and economic realities millions of formerly incarcerated individuals face each year due to prior convictions. The collateral consequences reentering individuals face after leaving prison include formal and informal policies that hinder reentry into various social institutions (Mauer & Chesney-Lind, 2003; Mock, 2016). Common repercussions of a criminal record include a decrease in civic participation, difficulties in finding employment, and housing insecurity and homelessness (Gouvis-Roman & Travis, 2004; Wheelock, 2005). Exiting individuals often are offered limited pre-release planning (Kupers, 1999; Nelson, Deess, & Allen, 2011) and many have significant debt, outstanding fines, and restitution payments (Levingston & Turetsky, 2007). These costs and other policies may contribute to recidivism. Two-thirds of released prisoners were rearrested within three years of release—many for committing another crime, but nearly 25 percent for a technical violation of probation or parole (Langan & Levin, 2002). In fact, the number of people who returned to state prison for a parole violation increased sevenfold from 27,000 individuals in 1980 to 203,000 in 2000 (Travis & Lawrence, 2002). Factors that lead to incarceration There are a number of factors that directly or indirectly influence an individual’s likelihood of incarceration. Inmates have been shown to have higher rates of substance use, gang involvement, mental health disorders, childhood abuse and neglect, unemployment, and lower levels of education than the general population (Esbensen & Huizinga, 1993; Fondacaro & Holt, 1999; Harlow, 2003; Johnson, Ross, Taylor, Carvajal, & Peters, 2005; Modestin & Wuermle, 2005;
16
Varano, Huebner, & Bynum, 2011; Widom, 1995). Each of these factors may play a role in an individual’s criminal behavior. Substance abuse Research has shown that drug and alcohol use is a risk factor for criminal behavior and incarceration (Hattery & Smith, 2010; Sinha & Easton, 1999). Substance use can lower inhibitions, causing changes in an individual’s behaviors, and certain drugs may increase aggressive tendencies (Sinha & Easton, 1999). Some individuals commit crimes to support their drug habit (Harrison & Gfroerer, 1992). Drug use has been shown to be highly correlated with property and violent crimes (Harrison & Gfroerer, 1992). One fourth of jail detainees reported abusing alcohol or drugs and 40 percent reported alcohol or drug dependence (Karberg & James, 2005). Prisoners have a higher rate of substance abuse than the general population—48 percent for male prisoners and 60 percent for female inmates (Fazel, Bains, & Doll, 2004). Gang involvement Gang involvement has also been found to be a significant risk factor for criminal behavior (Varano, Huebner, & Bynum, 2011). Research shows that individuals who are gang-involved commit their first offense at a younger age, are involved in more serious crimes, and are incarcerated more frequently than non-gang members (Huff, 1998; Levitt & Venkatesh, 2001). Gangs promote criminal behavior among members and significantly increase an individual’s risk of incarceration (Krohn & Thornberry, 2008; Leavitt & Venkatesh, 2001). Varano, Huebner, and Bynum (2011) found that up to one third of sampled inmates were gang-involved prior to incarceration. Furthermore, gang members report significantly higher numbers of criminal activities than non-gang members, including those involving drugs and weapons (Esbensen & Huizinga, 1993; Varano et al., 2011). Mental health Individuals with major mental disorders are more likely to be arrested and incarcerated at some point in their lives (Lamb & Weinberger, 1998). Individuals with mental health disorders are overly represented in the criminal justice system. According to James and Glaze (2006), over half of incarcerated individuals have mental health disorders. There is a lack of community-based mental health treatment providers and psychiatric beds for individuals with mental illness (Aufderheide & Brown, 2005). As a result, many mentally ill individuals do not receive adequate treatment for their disorders and frequently come into contact with the criminal justice system (Aufderheide & Brown, 2005; Chelune, 2011; Lurigio, Rollins, & Fallon, 2004). Childhood abuse and neglect Victims of childhood abuse and neglect often suffer from psychological disorders, behavioral problems, and substance abuse (Fondacaro et al., 1999; Hattery & Smith, 2010; Johnson, et al., 2005; Widom, 1995). There is a higher rate of criminal and violent behavior among childhood abuse and neglect victims (Widom, 1989; Widom, 1995; Widom & Ames, 1994). According to Widom (1989), individuals with a history of child abuse and neglect have a significantly higher
17
rate of criminal justice involvement. Approximately 29 percent of adults and 26 percent of juveniles who are victims of childhood abuse and neglect are arrested at some point in their lives (Widom, 1995). Employment and income Unemployment rates are higher for formerly incarcerated individuals than the general population. Studies of unemployment have shown that between 34 and 53 percent of inmates were unemployed prior to their arrest (Indig et al., 2009; Lynch, Smith, Graziadei, & Pittayathikhun, 1994). In 2002, 29 percent of formerly incarcerated individuals reported that they were unemployed prior to their incarceration (James, 2004). In comparison, the unemployment rate for the general population at the end of 2002 was 6 percent (U.S. Department of Labor, 2012). Some studies find a correlation between unemployment rates and property and violent crimes (Lee & Holoviak, 2006; Parker & Horwitz, 1986; Raphael & Winter-Ebmer, 2001). Henderson (2001) reported that “unemployed offenders are more likely to have contact with the criminal justice system and that such offenders do not fare as well as their employed counterparts in the criminal justice system” (p. 84). Research finds a link between lower income and higher crime rates. Poverty and low income are related to violent crime with the exception of homicide (Box, 1987; Hsieh & Pugh, 1993). Research has shown that there is a strong relationship between income disparity and crime (Box, 1987). Areas in which there are high levels of income inequality have been found to have higher overall crime rates (Witte & Witt, 2000). Education Research shows that a lack of education can be a risk factor for criminal behavior. Individuals with lower levels of education, on average earn a lower salary and have higher crime rates (Harlow, 2003; Lochner & Moretti, 2004). According to Harlow (2003), individuals involved in the criminal justice system have a significantly lower level of educational achievement than the general population. In the United States, 41 percent of prisoners had not graduated from high school, compared with 18 percent of the general population (Harlow, 2003). Furthermore, researchers found that only 16 percent of offenders had attended at least some college as compared to 43 percent of the general U.S. population (Lynch et al., 1994). Reentry needs after prison Reentry is defined as the transition of a formerly incarcerated individual from custody back into his or her community. Reentry can occur after release from local jails, state prisons, private correctional institutions, federal prisons, and juvenile detention facilities. The number of individuals incarcerated has increased over the past quarter century (La Vigne, Mamalian, Travis, & Visher, 2003). The incarceration rate peaked in 2006 with 749,798 incarcerated individuals and has slowly begun to decline since then (Guerino, Harrison, & Sabol, 2011). According to Petersilia (2003), prisoners will spend, on average, approximately five months in jail and 29 months in prison. With more individuals being incarcerated and relatively
18
shorter incarceration periods, the number of individuals being released from correctional facilities has also increased over the past decade, peaking in 2008, when a total of 735,454 prisoners were released from state and federal prisons (Guerino et al., 2011; La Vigne et al., 2003). In 2010, there were 708,677 prisoners released compared to 604,858 in 2000 (Guerino et al., 2011). Many individuals leave incarceration and return to disadvantaged communities characterized by high levels of crime, poverty, and drug use (Visher, La Vigne, & Travis, 2004; La Vigne et al., 2003). In Illinois, over 50 percent of formerly incarcerated individuals return to the city of Chicago and of those, over 30 percent return to six of the city’s 77 communities (La Vigne, et al., 2003). The six communities with the highest number of returning formerly incarcerated individuals were areas characterized by socioeconomic disadvantage and high crime rates (La Vigne et al., 2003). Petersilia (2011) finds that in poor and disadvantaged neighborhoods, approximately 20 percent of the male population is incarcerated. The incarceration and recidivism of large number of individuals in one area creates instability in communities (Thompson, 2008). Furthermore, the communities lack the social cohesion and support necessary to help formerly incarcerated individuals successfully live outside of prison (Visher et. al., 2004). In addition, individuals returning to disadvantaged neighborhoods have higher recidivism rates (Visher et al., 2004). Individuals reentering the community after incarceration are faced with a wide range of barriers that often make successful reintegration difficult (Graffam, Shinkfield, Lavelle, & McPherson, 2008). Formerly incarcerated individuals may have trouble reconnecting with family members, finding stable housing, securing employment, maintaining sobriety, and obtaining other forms of assistance (Flannery, 2004; Guerino et al., 2011; Hattery & Smith, 2010). Correctional facilities offer fewer prison programs and services to inmates (Petersilia, 2003). Furthermore, La Vigne et al. (2003) found that participation in prison programs is declining. While substance abuse and dependence rates are high among inmates, less than 25 percent of them will attend substance abuse programs while incarcerated (Petersilia, 2003). Furthermore, less than one third of inmates will participate in educational or vocational training in prison (Petersilia, 2003). Often inmates are unable to attend prison programs due to long wait lists (Petersilia, 2003). Preparing inmates for successful reentry is vital to reducing recidivism. According to the Bureau of Justice Statistics, over 67 percent of formerly incarcerated individuals are rearrested within three years of release (Langan & Levin, 2002). Factors that contribute to recidivism include homelessness, poverty, unemployment, and drug use (La Vigne et al., 2004; Paylor, 1995; Uggen & Staff, 2004). According to Hattery and Smith (2010), “barriers to reentry significantly shape the probability for recidivism” (p. 14). Research has shown that formerly incarcerated individuals who were given support in finding housing and employment had better outcomes and were more successful when returning to their communities (Hattery & Smith, 2010). Furthermore, individuals who had strong social support networks and close ties to family were more successful at reintegration (Graffam et al., 2008; Solomon, Gouvis, & Waul, 2001).
19
Physical and mental health The majority of individuals leaving prison suffer from chronic physical health problems. According to Mallick-Kane and Visher (2008), 49 percent of males and 67 percent of females leaving prison reported a physical health problem. Research has shown that formerly incarcerated individuals suffer from a wide range of health conditions, including asthma, diabetes, heart disease, cancer, HIV/AIDs, hepatitis, hypertension, and tuberculosis (Mallik-Kane & Visher, 2008; Thompson, 2008; Visher, 2004; Williams, 2006). Individuals with health problems have greater difficulty reintegrating into society. They struggle to find stable employment and housing and have more problems with family reintegration (Mallik-Kane & Visher, 2008). In 2005, over 700,000 incarcerated individuals had symptoms of a mental disorder such as mania, depression, and psychosis among prisoners (James & Glaze, 2006). However, the majority of former prisoners with mental health disorders are unable to receive long term care (Mallik-Kane & Visher, 2008). Many individuals with mental health disorders who do not receive adequate treatment have trouble functioning in their community (The Sentencing Project, 2002). The presence of a mental health disorder makes reentry even more challenging for formerly incarcerated individuals. Formerly incarcerated individuals with mental illness experience greater difficulty finding stable housing and employment and receive less support from family members (Mallik-Kane & Visher, 2008). Individuals with serious mental disorders are at a higher risk for recidivism and return to prison sooner than individuals without mental disorders (Cloyes, Wong, Latimer, & Abarca, 2010). Formerly incarcerated persons often lack access to financial support for health care. Many formerly incarcerated individuals do not have health insurance and have had federal benefits suspended. Individuals incarcerated for long periods of time may have their Medicaid benefits terminated (La Vigne et al., 2004; Thompson, 2008). While a formerly incarcerated individual may apply for these benefits to be reinstated, it often takes a substantial amount of time. As a result, many formerly incarcerated individuals with chronic physical or mental illnesses do not receive health care and treatment after release (Mallik-Kane & Visher, 2008). Many are forced to seek short-term treatment in hospitals and emergency rooms (Mallik-Kane & Visher, 2008). Substance abuse Substance abuse is another common problem for former prisoners. Approximately two thirds of individuals entering prison report some form of substance abuse (Mallik-Kane & Visher, 2008). While there are prison programs to help inmates deal with their addiction problems, only about half of inmates participate in prison programming for their substance abuse (Mallik-Kane & Visher, 2008). Research has shown that individuals with prior substance abuse problems are at a higher risk for continued use and criminal activity (Gever, 2007; Mallik-Kane & Visher, 2008; Sinha & Easton, 1999). Up to one third of former prisoners reported substance use within a year of their release (Mallik-Kane & Visher, 2008). Substance abuse can further complicate a former formerly incarcerated individual’s ability to obtain stable employment or housing (Holzer et al., 2003; Mallik-Kane & Visher, 2008). Formerly incarcerated populations suffering from addiction are at an increased risk of developing serious health conditions or contracting infectious diseases
20
(Mallik-Kane & Visher, 2008). Furthermore, the risk of overdose is high for recently released individuals with substance abuse problems (Merrall et al, 2010). Research has shown that formerly incarcerated individuals with substance abuse problems who obtain treatment have lower rates of recidivism; however, there is a lack of available treatment programs for persons after release from prison (Gever, 2007). Unemployment Research has shown that finding employment can help reduce recidivism rates of released prisoners (Holzer, Raphael, & Stoll, 2003; La Vigne et al., 2004; Uggen & Staff, 2004). However, there are a number of challenges that returning citizens face when seeking employment, such as a lack of education, work experience, qualifications, and employment opportunities, as well as negative employer attitudes (Holzer et al., 2003, Holzer, Raphel, & Stoll, 2004; Visher et al., 2004; Uggen & Staff, 2004). Of those formerly incarcerated individuals who are able to obtain employment, the majority obtain low-wage jobs (Holzer et al., 2003; Weiner, 2004). Often, the wages earned are not enough to cover the cost of an apartment and other basic necessities. Furthermore, these jobs are often temporary and lack benefits (Holzer et al., 2003). Visher et al. (2004) found that eight months after release, only 65 percent of formerly incarcerated individuals were able to obtain some form of employment and less than half were currently employed at the time of the interview. Formerly incarcerated individuals who are unable to obtain legitimate employment or who receive low wages are often forced to rely on other sources of income, such as support from family and friends, informal work, public assistance, and in some cases, illegal income (Holzer et al., 2003; Visher et al., 2004). Many former prisoners have low levels of education and lack work experience (Harlow, 2003; Holzer et al., 2003; Uggen & Staff, 2004). Visher et al. (2004) found that approximately half of formerly incarcerated individuals have their high school diploma. Furthermore, research has shown that up to one third of formerly incarcerated individuals were unemployed prior to their incarceration (Lynch & Sabol, 2001; Visher et al., 2004). Few formerly incarcerated persons have specialized training or job skills that will assist them with finding employment (Graffam et al., 2008). Formerly incarcerated individuals may not know how to look for or apply for a job, and their ability to locate a job may be compromised. Formerly incarcerated individuals may have lost job contacts as a result of their incarceration (Visher et al., 2004). Formerly incarcerated individuals may also lack the ability to afford appropriate attire to wear to interviews or on the job, and they may have difficulty securing or affording transportation to and from work (Graffam et al., 2008). Another employment barrier for former prisoners is employer attitudes towards hiring individuals with criminal records. Many employers conduct criminal background checks on potential employees or ask about criminal history on applications. Research has shown that employers are often reluctant to hire formerly incarcerated individuals, with approximately two thirds of employers reporting that they would not hire an individual with a criminal background (Holzer et al., 2004). While willingness to hire may increase depending on the specific formerly incarcerated individual’s education, the type of offense committed may negatively impact employer attitudes (Albright & Denq, 1996). Research has shown that employers are least likely to hire those who have been convicted of a violent crime or a crime committed against a child,
21
such as sexual or physical abuse (Albright & Denq, 1996). According to Holzer et al. (2004), employers may believe that an individual with a criminal record will be an untrustworthy or unreliable employee. Furthermore, they may be hesitant to hire a formerly incarcerated individuals out of concern for the safety of other employees or customers (Harris & Keller, 2005). Employers may fear being held liable for the criminal actions of the formerly incarcerated individuals. An employer may believe they may be liable if they expose their employees or customers to dangerous individuals (Holzer et al., 2004). Other barriers returning citizens may encounter are state or federal laws prohibiting their employment in certain professions. Formerly incarcerated individuals with felony convictions are barred from holding jobs in some health services industries, the security industry, and any job where they may be in contact with children (Holzer et al., 2003). Furthermore, some companies may have policies that prohibit hiring individuals with criminal records (Taxman, Young, & Byrne, 2002). There are also licensing restrictions, depending on the state, that prevent formerly incarcerated individuals from obtaining employment in certain fields, such as health care, law, garbage collection, barbering, and cosmetology (Petersilia, 2003). Federal assistance
Individuals who are convicted of a felony are ineligible to receive certain types of federal assistance. Individuals convicted of drug-related offenses are banned from obtaining food stamps or veteran’s benefits, or from participating in the Temporary Assistance for Needy Families (TANF) program (Roman & Travis, 2004). While formerly incarcerated individuals may still be eligible to receive assistance through Supplemental Security Income (SSI) or Social Security Disability Insurance (SSDI), these benefits may be suspended if an individual is incarcerated for more than one month. It often takes a significant length of time for these benefits to be reinstated (Roman & Travis, 2004). Persons convicted of drug-related felonies experience additional barriers. Federal legislation was passed that prevents individuals with felony convictions for drug offenses from obtaining financial aid for education (Hattery & Smith, 2010). Furthermore, the federal government passed a law requiring that states suspend or revoke the licenses of individuals convicted of drug felonies, including DUIs, for at least six months or else lose federal highway funding (Hattery & Smith, 2010; Petersilia, 2003). Housing According to Cortes and Rogers (2010), “in most jurisdictions to which individuals return after incarceration, accessible and affordable housing is in exceedingly short supply” (p. vii). While there are several options for those exiting incarceration, such as residing with friends and family or in community-based correctional housing, transitional housing, federally subsidized housing, supportive housing, or housing in the private market, there are barriers that make obtaining these different forms of housing challenging. As a condition of their parole, many formerly incarcerated individuals are required to have their residence pre-approved and are prevented from living with certain individuals (Bradley, Oliver, Richardson, & Slayter, 2001; Thompson, 2008). Research has shown that up to 80 percent of
22
individuals released from prison will move in with friends or relatives for a period of time (Roman & Travis, 2004). However, some formerly incarcerated individuals may not have any family or friends, may lack close ties with them, or may be involved in a family conflict that prevents them from residing with relatives (Roman & Travis, 2004). Friends and family who allow a paroled individual to live with them are subject to visits by the person’s parole officer, as well as searches of their home (Thompson, 2008). Friends and family members may fear having the individual return to their home after prison due to past violence or drug use (Roman & Travis, 2004; Thompson, 2008). Furthermore, a formerly incarcerated individual may be prohibited from living with another individual with a criminal history (Petersilia, 2003; Roman & Travis, 2004). Finally, the parolee may be prevented from living within a certain distance of his or her victim or in other specified areas (Logan, 2007; Petersilia, 2003). Formerly incarcerated individuals who are unable to reside with friends and family may be required to live in community-based correctional housing or halfway houses. Halfway houses are run by federal or state departments of corrections and are designed to help individuals transition from prison life back into the community. Those who are eligible may serve up to 10 percent of their sentence in a halfway house (Roman & Travis, 2004). However, certain factors may exclude an individual from residing in a halfway house, such as serious or violent criminal backgrounds, unemployment, or major psychiatric problems. Furthermore, there are a limited number of halfway houses available, and there is only limited space in them (Roman & Travis, 2004; Shilton & Vail, 2005). For this reason, halfway houses are not a viable option for many leaving prison. There are also government funded transitional housing programs that offer housing to homeless individuals who are disabled, mentally ill, or living with HIV/AIDS (Roman & Travis, 2004). Individuals who have been incarcerated for more than 30 days and meet other inclusion criteria are eligible for this type of transitional housing. However, the availability of this type of housing is limited, and there are often long waiting lists (Roman & Travis, 2004). Formerly incarcerated individuals rarely have access to federally subsidized housing due to the selection criteria and certain prohibitions. There is a lack of available public housing around the country (Roman & Travis, 2004). Individuals applying for public housing are subject to background checks, so they are less likely than other non-offending individuals to be granted subsidized housing (Hattery & Smith, 2010; Roman & Travis, 2004; Thompson, 2008). In addition, there are bans on violent criminal activity and drug use both on and off public housing property, so if an individual or guest violates a provision, all individuals residing in the house are subject to eviction (Hattery & Smith, 2010; Thompson, 2008; Thompson, 2008; Visher et al., 2004). Therefore, individuals residing in public housing may be hesitant to allow a formerly incarcerated individual to reside there. Formerly incarcerated individuals are rarely able to find rental apartments when they are released from prison due to their criminal histories and lack of finances (Petersilia, 2003; Visher et al., 2004). Landlords often do not want to rent to an individual with a criminal history (Clark, 2007; Harding & Harding, 2006). Furthermore, given that criminal records are publicly available, the community may object to apartments being rented to an individual with a criminal records (Clark, 2007; Roman & Travis, 2004). Other barriers to an formerly incarcerated individual’s
23
ability to rent are a lack of or poor credit history or rental history (Clark, 2007; Gunnison, 2011). A formerly incarcerated individual may also be unable to rent an apartment upon release from prison because of a lack of finances (Hattery & Smith, 2010; Visher et al., 2004). Individuals leaving prison often receive less than $200 dollars upon release, which cannot cover a security deposit and rent for an apartment (Roman & Travis, 2004). Formerly incarcerated individuals who are unable to secure housing are often left homeless and forced to stay in shelters. Research has shown that individuals living in shelters have a less successful reentry process than those who find stable housing (Nelson, Deess, & Allen, 1999). Furthermore, the shelter environment may not be ideal for individuals trying to avoid the criminal and drug lifestyle (Graffam et al., 2008; Paylor, 1995). Reentry housing programs Transitional supportive housing is another option for formerly incarcerated individuals leaving prison. Such housing options are typically run through private faith-based or non-profit organizations and are designed to support formerly incarcerated individuals as they move back into the community (Roman & Travis, 2004; Shilton & Vail, 2005). Transitional housing is typically short-term and designed to help residents become independent. Supportive services such as training in life skills, employment assistance, counseling, and substance abuse treatment are typically offered to residents (Roman & Travis, 2004). Formerly incarcerated individuals are allowed to reside in the transitional homes for a period of time until they are able to secure long-term housing. However, there is limited space available in transitional programs and not all formerly incarcerated individuals are eligible to reside in this type of housing (Shilton & Vail, 2005). One example of a reentry housing program is the Fortune Academy and Castle Gardens in West Harlem, New York. Fortune Academy provides emergency and longer-term housing for 62 formerly incarcerated individuals. Castle Gardens provides supportive and affordable housing and essential services at the same site, creating long-term housing solutions for homeless people with histories of incarceration and their families, as well as low-income individuals and their families. A different type of reentry housing program, Delancey Street, was created in 1971 and provides housing for the formerly incarcerated, substance abusers, and homeless individuals. The program is available in five locations throughout the United States: New Mexico, San Francisco, Los Angeles, North Carolina, and New York. Delancey Street is considered an extended family or community with no staff of experts and no programmatic approach. The program operates without government funds and is resident-run, in that all residents contribute to the community. The program offers residents free food, housing, clothing, education, and entertainment. Theoretical framework of residential reentry programs Residential reentry programming is informed by theories on individual behavior change including differential association, social learning, self-efficacy, and rehabilitation. Differential association theory suggests criminal behavior is the product of one’s different associations, so conforming and deviant behaviors are learned (Sutherland, 1939). Residential reentry programs
24
offer an environment away from the communities where negative peers may still reside who in the past had been a negative influence. With origins in differential association theory, social learning theory proposes that learning is a cognitive process that takes place in a social context and can occur through direct instruction or observation (Akers, 1973; Bandura, 1971). As in residential reentry program models, former prisoners interact with positive staff and learn skills beneficial to them in the future (Jensen & Reed, 2006). Self-efficacy theory suggests that a person has the ability to overcome life’s obstacles (Bandura, 2000). It is theorized that former prisoners become self-efficient through contact with staff and other residents who can demonstrate how to overcome obstacles to reintegration in the community after prison (Bandura, 2000). Finally, rehabilitation theory proposes offering formerly incarcerated individuals services can lead to changes in criminal behavior (Robinson, Lowenkamp, Lowenkamp, & Lowenkamp, 2015). Prison reentry programs connect individuals with the support they need in order to help them successfully reintegrate back into the community.
25
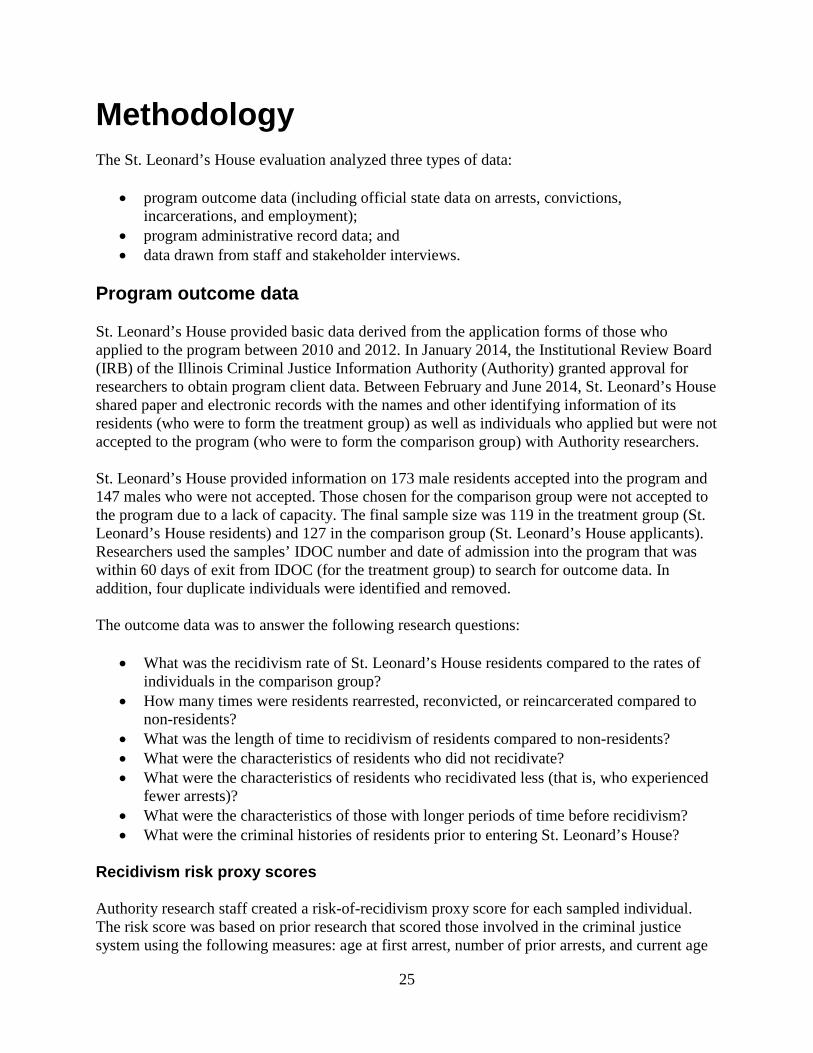
Methodology The St. Leonard’s House evaluation analyzed three types of data:
• program outcome data (including official state data on arrests, convictions, incarcerations, and employment);
• program administrative record data; and • data drawn from staff and stakeholder interviews.
Program outcome data St. Leonard’s House provided basic data derived from the application forms of those who applied to the program between 2010 and 2012. In January 2014, the Institutional Review Board (IRB) of the Illinois Criminal Justice Information Authority (Authority) granted approval for researchers to obtain program client data. Between February and June 2014, St. Leonard’s House shared paper and electronic records with the names and other identifying information of its residents (who were to form the treatment group) as well as individuals who applied but were not accepted to the program (who were to form the comparison group) with Authority researchers. St. Leonard’s House provided information on 173 male residents accepted into the program and 147 males who were not accepted. Those chosen for the comparison group were not accepted to the program due to a lack of capacity. The final sample size was 119 in the treatment group (St. Leonard’s House residents) and 127 in the comparison group (St. Leonard’s House applicants). Researchers used the samples’ IDOC number and date of admission into the program that was within 60 days of exit from IDOC (for the treatment group) to search for outcome data. In addition, four duplicate individuals were identified and removed. The outcome data was to answer the following research questions:
• What was the recidivism rate of St. Leonard’s House residents compared to the rates of individuals in the comparison group?
• How many times were residents rearrested, reconvicted, or reincarcerated compared to non-residents?
• What was the length of time to recidivism of residents compared to non-residents? • What were the characteristics of residents who did not recidivate? • What were the characteristics of residents who recidivated less (that is, who experienced
fewer arrests)? • What were the characteristics of those with longer periods of time before recidivism? • What were the criminal histories of residents prior to entering St. Leonard’s House?
Recidivism risk proxy scores Authority research staff created a risk-of-recidivism proxy score for each sampled individual. The risk score was based on prior research that scored those involved in the criminal justice system using the following measures: age at first arrest, number of prior arrests, and current age
26
(Wong, 2009). Risk scores ranged from zero to eight, and individuals who scored four or less were classified as low risk, whereas individuals who scored five or greater were considered to have an elevated risk of recidivism. The following are how scores were assigned to make the risk proxy score: Age at first arrest:
• 24 or greater (1 point); • 21 to 23 (2 points); • 20 or less (3 points).
Number of prior arrests:
• 0 to 2 (1 point); • 3 to 6 (2 points); • 7 or greater (3 points).
Current age:
• 38 or greater (0); • 34 to 37 (1 point); • 33 or less (2 points).
An individual’s ‘current age’ referred to the age at the time of entry into the program (for St. Leonard’s House residents) or their age at the time of exit from prison (for members of the comparison group). Arrest and conviction data The criminal history record information for the study sample was electronically extracted from the Criminal History Record Information (CHRI) System, the state’s central repository for criminal history information which is maintained by the Illinois State Police (ISP). The purpose was to obtain information on arrest histories prior to entering prison, as well as information on arrests occurring during and after St. Leonard’s House participation. The CHRI System contains information required by statute to be submitted on each arrested person by arresting agencies, state’s attorney’s offices, circuit courts, and state and county correctional institutions for the purpose of creating a cumulative history (or ‘rap sheet’) of such events. Upon arrest, an individual is fingerprinted using a paper card or an electronic Livescan system this record is then forwarded to ISP for processing and posting in the individual’s criminal history record. About 94 percent of all arrest cards in Illinois are submitted electronically via Livescan. The Authority has access to most information in the CHRI System through ISP’s off-line, ad hoc database, which allows extraction of complete CHRI records for research purposes. St. Leonard’s Ministries submitted unique CHRI System identifiers (state identification, or “SID,” numbers) for applicants when available, as well as first names, last names, and birthdates, which Authority researchers used to extract the corresponding criminal history information from the system. If an exact match using the SID and other identifiers provided could not be found,
27
researchers searched for a resident’s records using the first three letters of his or her last name, the first three letters of his or her first name, and his or her date of birth. A query into the system returned the unique SIDs of potential matches. The researchers then manually examined the potential matches to confirm their accuracy and make adjustments to the matching procedures. Once matches were confirmed, all arrest records for the matched individuals were extracted, reviewed, and analyzed. Researchers examined arrest incident reports recording only statutorily reportable arrests, excluding minor traffic violations and offenses that qualified as less than Class B misdemeanors. For each arrest event in a St. Leonard’s House resident’s criminal history, the most serious charge was identified based on offense class and coded into major categories based on statutory definitions. A ‘violent offense’ in this study referred to any offense that met the criteria of violent under the Rights of Crime Victims and Witnesses Act [725 ILCS 120]. The ‘non-violent sex offense’ category included sex offenses not involving the use or threat of force, including prostitution and sex offender registry violations. The CHRI data used in this report were extracted in November and December 2014 for analysis. All of the data were analyzed using SPSS (Statistical Package for the Social Sciences). Prior arrests were based only on what researchers could find and what was posted to CHRI. In cases where a member of the sample had prior arrests decades ago, this information may not have been successfully posted to CHRI back then. Incarceration data In addition to matching those in the sample to their arrest records, researchers also linked members of the sample to records of their incarcerations in Illinois Department of Corrections (IDOC) facilities using IDOC numbers. Each individual is assigned a unique IDOC number upon initial admission to an IDOC facility. That number remains a unique identifier for that individual in all subsequent incarcerations with IDOC. In November and December 2014, researchers pulled IDOC data (prison records) examining prior admissions to IDOC before St. Leonard’s Ministries and after St. Leonard’s House through state fiscal year 2013 (June 30, 2013). Incarceration data were analyzed using SPSS. Employment data Authority researchers entered into an agreement with the Illinois Department of Employment Security (IDES) to obtain employment and earnings data for members of the sample using IDES’s Wage Information System/Employment Tracking database. This database contains wage information for all state-taxed employees including names of employers, wages, and employment periods (in four quarters per year) for the period extending from January 1, 2013 to December 31, 2014. Social Security numbers of residents were provided by St. Leonard’s Ministries and were kept confidential. In June 2014, Authority researchers provided IDES with a password-protected CD containing an Excel sheet with the social security numbers and a unique case control number of
28
individuals in the sample group for cross-matching. IDES returned the response file to Authority researchers on a CD stripped of SSNs and any personal identifiers. Researchers then analyzed employment data using SPSS. Program administrative data
In 2013, St. Leonard’s House provided Authority researchers with data on men who resided in program from 2009 to 2012. This data included 16 men who self-reported by residents in applications to the program. Data included demographic information and information on criminal histories, prison stays, substance use histories, and lengths of stay at St. Leonard’s House. In addition, Authority researchers were also presented with data on why individuals were not accepted into the program during that time period. Staff and stakeholder interviews Between July 2012 and August 2012, Authority researchers interviewed 17 St. Leonard’s House staff or stakeholders who worked with residents. Appendix B offers the questions asked during the interviews. Of these 17, 16 were interviewed in private rooms at St. Leonard’s House and one was interviewed over the telephone. Interviewees were asked the same 34 questions, which covered their work at St. Leonard’s House, residential program operations, and program demographics. The data derived from these interviews was analyzed using Excel. Data limitations There are several limitations to this study that should be considered when interpreting its findings. First, the extent to which this study’s sample reflects the population exiting the Illinois Department of Corrections is not known. More research is needed before findings can be generalized across all of Illinois’ parolee population. Researchers relied on baseline risk-of-recidivism scores that were relative to this study’s sample only. Second, interview data was based on program staff and stakeholder self-reports, and interviewees may have been biased, untruthful, or have omitted information. Interviews were conducted just once, so policies or opinions may have changed over time. Third, because the program collected minimal data on its residents, researchers had to rely on application data only. Researchers were unable to explore the relationship between program components or participation and outcomes like recidivism and employment, sobriety, and success in securing permanent housing. Researchers did not have data on client participation in, and dosage of, services. Fourth, researchers were limited to administrative data for the outcome evaluation. The data available in the CHRI system is limited to arrests submitted by arresting agencies, state’s attorney’s offices, and circuit court clerks and successfully posted to the system by the State Police. Records of more recent years are more complete than previous years in the CHRI system. Finally, employment data limitations include only official taxed employment, not untaxed or
29
“under the table” employment. Social Security numbers were not reported for a total of 77 people in both the treatment and comparison group. Employment data for members of the sample was provided only for 2013 and 2014, so this study measures taxed employment in either 2013 or 2014.
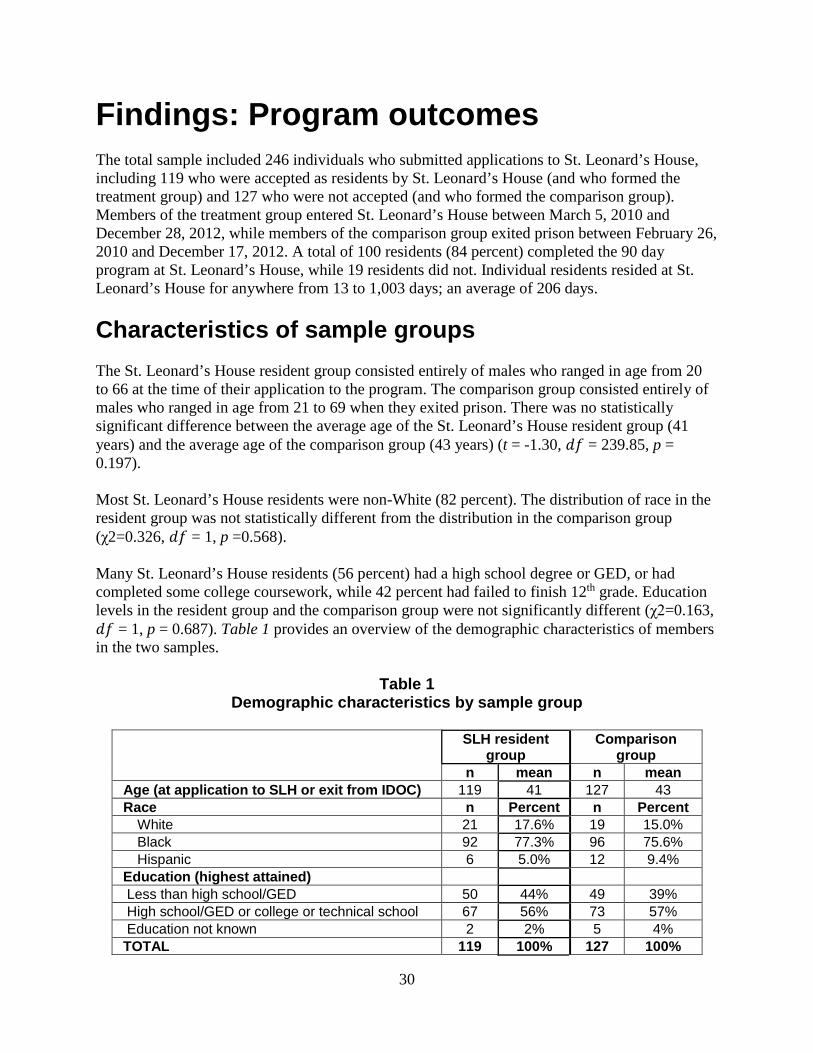
30
Findings: Program outcomes The total sample included 246 individuals who submitted applications to St. Leonard’s House, including 119 who were accepted as residents by St. Leonard’s House (and who formed the treatment group) and 127 who were not accepted (and who formed the comparison group). Members of the treatment group entered St. Leonard’s House between March 5, 2010 and December 28, 2012, while members of the comparison group exited prison between February 26, 2010 and December 17, 2012. A total of 100 residents (84 percent) completed the 90 day program at St. Leonard’s House, while 19 residents did not. Individual residents resided at St. Leonard’s House for anywhere from 13 to 1,003 days; an average of 206 days. Characteristics of sample groups The St. Leonard’s House resident group consisted entirely of males who ranged in age from 20 to 66 at the time of their application to the program. The comparison group consisted entirely of males who ranged in age from 21 to 69 when they exited prison. There was no statistically significant difference between the average age of the St. Leonard’s House resident group (41 years) and the average age of the comparison group (43 years) (t = -1.30, 𝑑𝑑𝑑𝑑 = 239.85, p = 0.197). Most St. Leonard’s House residents were non-White (82 percent). The distribution of race in the resident group was not statistically different from the distribution in the comparison group (χ2=0.326, 𝑑𝑑𝑑𝑑 = 1, p =0.568). Many St. Leonard’s House residents (56 percent) had a high school degree or GED, or had completed some college coursework, while 42 percent had failed to finish 12th grade. Education levels in the resident group and the comparison group were not significantly different (χ2=0.163, 𝑑𝑑𝑑𝑑 = 1, p = 0.687). Table 1 provides an overview of the demographic characteristics of members in the two samples.
Table 1 Demographic characteristics by sample group
SLH resident
group Comparison
group n mean n mean
Age (at application to SLH or exit from IDOC) 119 41 127 43 Race n Percent n Percent
White 21 17.6% 19 15.0% Black 92 77.3% 96 75.6% Hispanic 6 5.0% 12 9.4%
Education (highest attained) Less than high school/GED 50 44% 49 39% High school/GED or college or technical school 67 56% 73 57% Education not known 2 2% 5 4% TOTAL 119 100% 127 100%
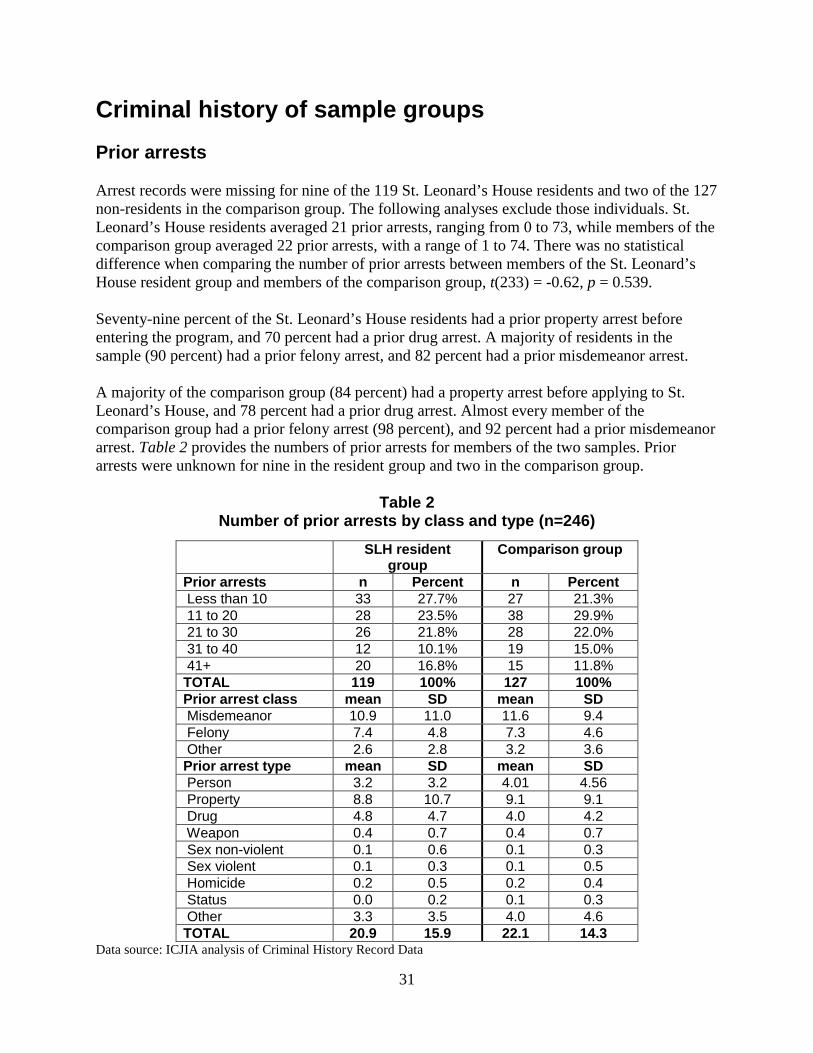
31
Criminal history of sample groups Prior arrests Arrest records were missing for nine of the 119 St. Leonard’s House residents and two of the 127 non-residents in the comparison group. The following analyses exclude those individuals. St. Leonard’s House residents averaged 21 prior arrests, ranging from 0 to 73, while members of the comparison group averaged 22 prior arrests, with a range of 1 to 74. There was no statistical difference when comparing the number of prior arrests between members of the St. Leonard’s House resident group and members of the comparison group, t(233) = -0.62, p = 0.539. Seventy-nine percent of the St. Leonard’s House residents had a prior property arrest before entering the program, and 70 percent had a prior drug arrest. A majority of residents in the sample (90 percent) had a prior felony arrest, and 82 percent had a prior misdemeanor arrest. A majority of the comparison group (84 percent) had a property arrest before applying to St. Leonard’s House, and 78 percent had a prior drug arrest. Almost every member of the comparison group had a prior felony arrest (98 percent), and 92 percent had a prior misdemeanor arrest. Table 2 provides the numbers of prior arrests for members of the two samples. Prior arrests were unknown for nine in the resident group and two in the comparison group.
Table 2 Number of prior arrests by class and type (n=246)
SLH resident group
Comparison group
Prior arrests n Percent n Percent Less than 10 33 27.7% 27 21.3% 11 to 20 28 23.5% 38 29.9% 21 to 30 26 21.8% 28 22.0% 31 to 40 12 10.1% 19 15.0% 41+ 20 16.8% 15 11.8% TOTAL 119 100% 127 100% Prior arrest class mean SD mean SD Misdemeanor 10.9 11.0 11.6 9.4 Felony 7.4 4.8 7.3 4.6 Other 2.6 2.8 3.2 3.6 Prior arrest type mean SD mean SD Person 3.2 3.2 4.01 4.56 Property 8.8 10.7 9.1 9.1 Drug 4.8 4.7 4.0 4.2 Weapon 0.4 0.7 0.4 0.7 Sex non-violent 0.1 0.6 0.1 0.3 Sex violent 0.1 0.3 0.1 0.5 Homicide 0.2 0.5 0.2 0.4 Status 0.0 0.2 0.1 0.3 Other 3.3 3.5 4.0 4.6 TOTAL 20.9 15.9 22.1 14.3
Data source: ICJIA analysis of Criminal History Record Data
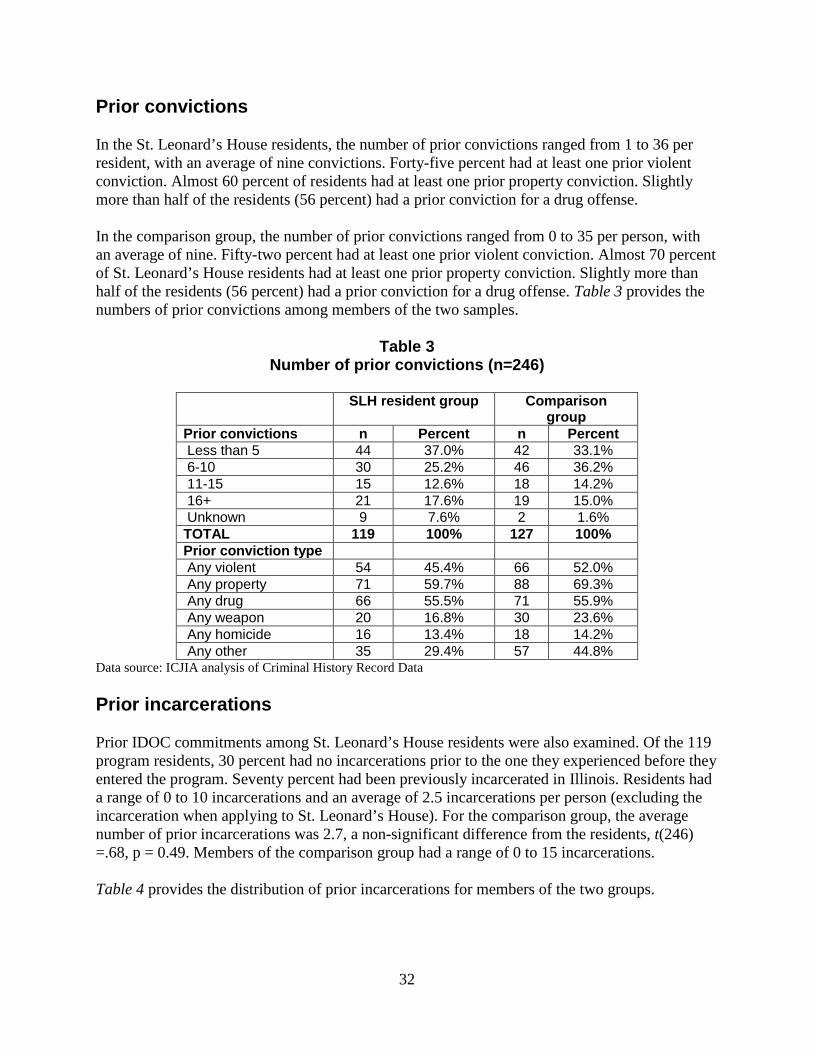
32
Prior convictions In the St. Leonard’s House residents, the number of prior convictions ranged from 1 to 36 per resident, with an average of nine convictions. Forty-five percent had at least one prior violent conviction. Almost 60 percent of residents had at least one prior property conviction. Slightly more than half of the residents (56 percent) had a prior conviction for a drug offense. In the comparison group, the number of prior convictions ranged from 0 to 35 per person, with an average of nine. Fifty-two percent had at least one prior violent conviction. Almost 70 percent of St. Leonard’s House residents had at least one prior property conviction. Slightly more than half of the residents (56 percent) had a prior conviction for a drug offense. Table 3 provides the numbers of prior convictions among members of the two samples.
Table 3
Number of prior convictions (n=246)
SLH resident group Comparison group
Prior convictions n Percent n Percent Less than 5 44 37.0% 42 33.1% 6-10 30 25.2% 46 36.2% 11-15 15 12.6% 18 14.2% 16+ 21 17.6% 19 15.0% Unknown 9 7.6% 2 1.6% TOTAL 119 100% 127 100% Prior conviction type Any violent 54 45.4% 66 52.0% Any property 71 59.7% 88 69.3% Any drug 66 55.5% 71 55.9% Any weapon 20 16.8% 30 23.6% Any homicide 16 13.4% 18 14.2% Any other 35 29.4% 57 44.8%
Data source: ICJIA analysis of Criminal History Record Data Prior incarcerations Prior IDOC commitments among St. Leonard’s House residents were also examined. Of the 119 program residents, 30 percent had no incarcerations prior to the one they experienced before they entered the program. Seventy percent had been previously incarcerated in Illinois. Residents had a range of 0 to 10 incarcerations and an average of 2.5 incarcerations per person (excluding the incarceration when applying to St. Leonard’s House). For the comparison group, the average number of prior incarcerations was 2.7, a non-significant difference from the residents, t(246) =.68, p = 0.49. Members of the comparison group had a range of 0 to 15 incarcerations. Table 4 provides the distribution of prior incarcerations for members of the two groups.
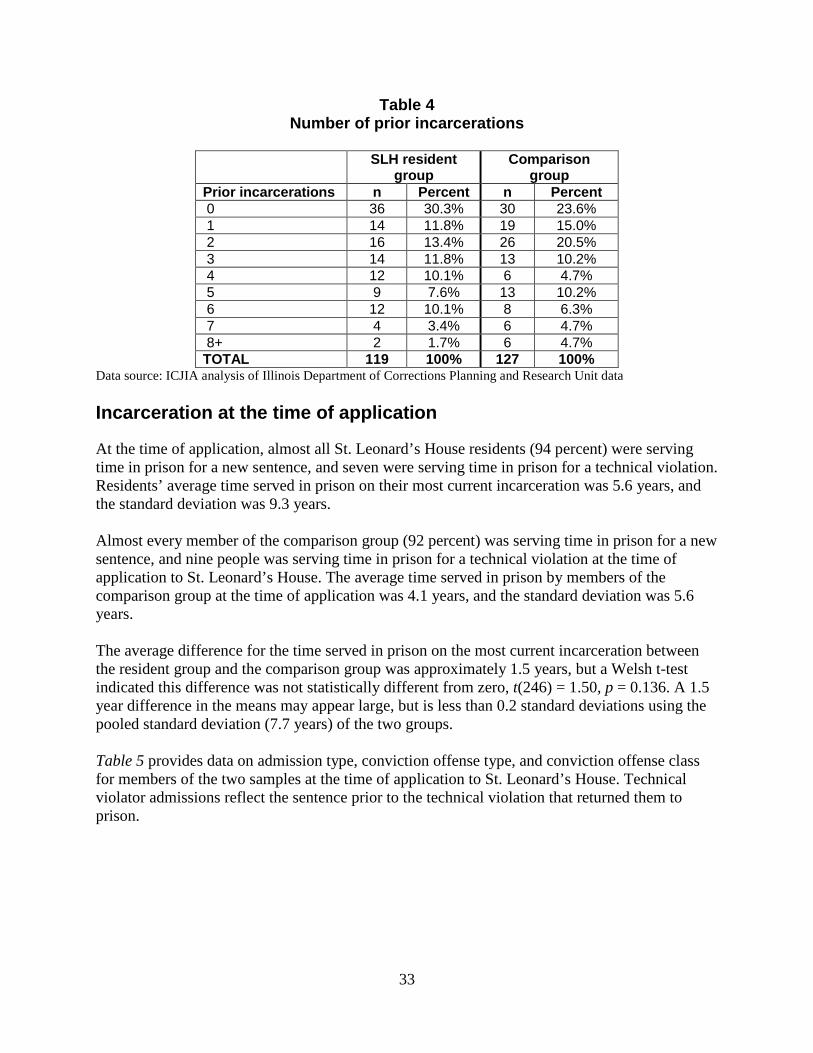
33
Table 4 Number of prior incarcerations
SLH resident
group Comparison
group Prior incarcerations n Percent n Percent 0 36 30.3% 30 23.6% 1 14 11.8% 19 15.0% 2 16 13.4% 26 20.5% 3 14 11.8% 13 10.2% 4 12 10.1% 6 4.7% 5 9 7.6% 13 10.2% 6 12 10.1% 8 6.3% 7 4 3.4% 6 4.7% 8+ 2 1.7% 6 4.7% TOTAL 119 100% 127 100%
Data source: ICJIA analysis of Illinois Department of Corrections Planning and Research Unit data Incarceration at the time of application
At the time of application, almost all St. Leonard’s House residents (94 percent) were serving time in prison for a new sentence, and seven were serving time in prison for a technical violation. Residents’ average time served in prison on their most current incarceration was 5.6 years, and the standard deviation was 9.3 years. Almost every member of the comparison group (92 percent) was serving time in prison for a new sentence, and nine people was serving time in prison for a technical violation at the time of application to St. Leonard’s House. The average time served in prison by members of the comparison group at the time of application was 4.1 years, and the standard deviation was 5.6 years. The average difference for the time served in prison on the most current incarceration between the resident group and the comparison group was approximately 1.5 years, but a Welsh t-test indicated this difference was not statistically different from zero, t(246) = 1.50, p = 0.136. A 1.5 year difference in the means may appear large, but is less than 0.2 standard deviations using the pooled standard deviation (7.7 years) of the two groups. Table 5 provides data on admission type, conviction offense type, and conviction offense class for members of the two samples at the time of application to St. Leonard’s House. Technical violator admissions reflect the sentence prior to the technical violation that returned them to prison.
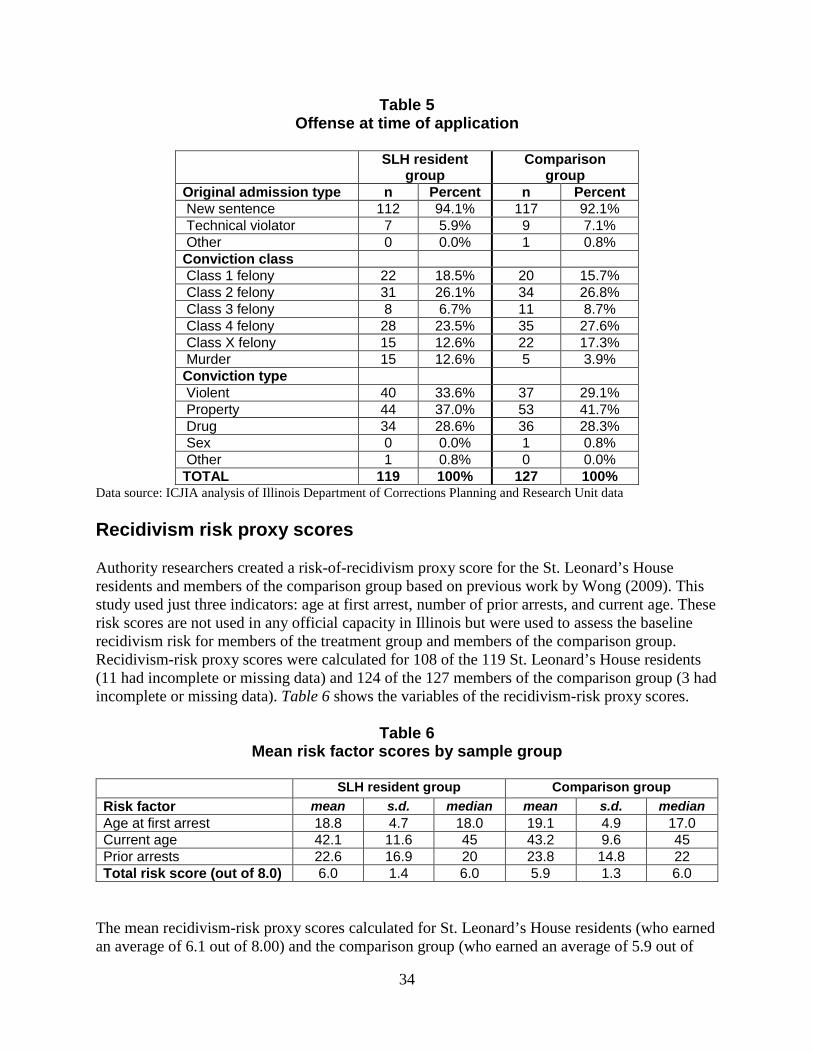
34
Table 5 Offense at time of application
SLH resident
group Comparison
group Original admission type n Percent n Percent New sentence 112 94.1% 117 92.1% Technical violator 7 5.9% 9 7.1% Other 0 0.0% 1 0.8% Conviction class Class 1 felony 22 18.5% 20 15.7% Class 2 felony 31 26.1% 34 26.8% Class 3 felony 8 6.7% 11 8.7% Class 4 felony 28 23.5% 35 27.6% Class X felony 15 12.6% 22 17.3% Murder 15 12.6% 5 3.9% Conviction type Violent 40 33.6% 37 29.1% Property 44 37.0% 53 41.7% Drug 34 28.6% 36 28.3% Sex 0 0.0% 1 0.8% Other 1 0.8% 0 0.0% TOTAL 119 100% 127 100%
Data source: ICJIA analysis of Illinois Department of Corrections Planning and Research Unit data Recidivism risk proxy scores Authority researchers created a risk-of-recidivism proxy score for the St. Leonard’s House residents and members of the comparison group based on previous work by Wong (2009). This study used just three indicators: age at first arrest, number of prior arrests, and current age. These risk scores are not used in any official capacity in Illinois but were used to assess the baseline recidivism risk for members of the treatment group and members of the comparison group. Recidivism-risk proxy scores were calculated for 108 of the 119 St. Leonard’s House residents (11 had incomplete or missing data) and 124 of the 127 members of the comparison group (3 had incomplete or missing data). Table 6 shows the variables of the recidivism-risk proxy scores.
Table 6 Mean risk factor scores by sample group
SLH resident group Comparison group Risk factor mean s.d. median mean s.d. median Age at first arrest 18.8 4.7 18.0 19.1 4.9 17.0 Current age 42.1 11.6 45 43.2 9.6 45 Prior arrests 22.6 16.9 20 23.8 14.8 22 Total risk score (out of 8.0) 6.0 1.4 6.0 5.9 1.3 6.0
The mean recidivism-risk proxy scores calculated for St. Leonard’s House residents (who earned an average of 6.1 out of 8.00) and the comparison group (who earned an average of 5.9 out of

35
8.00) were not statistically different, t(230) = 0.95, p = 0.34. The cutoff values for prior arrests in the Wong (2009) method are relatively low compared to cutoff values for prior arrests in our sample, as both the resident and comparison groups exhibit a mean score about three times as large as the highest cutoff of risk scores by Wong. Researchers calculated alternative cutoffs creating their own three groups using the top quartile (high risk), interquartile range (medium risk), and bottom quartile of the prior arrests (low risk) in the sample. The risk scores were lower for both groups by about one point, but not statistically different between the two groups.
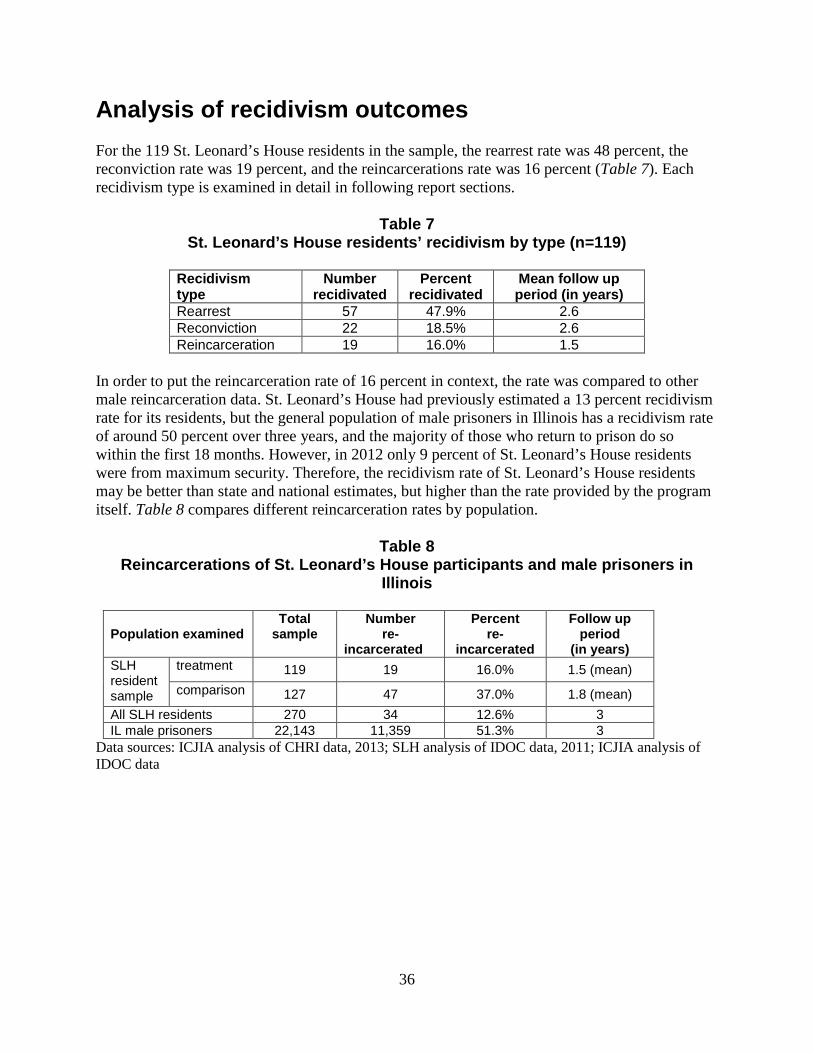
36
Analysis of recidivism outcomes For the 119 St. Leonard’s House residents in the sample, the rearrest rate was 48 percent, the reconviction rate was 19 percent, and the reincarcerations rate was 16 percent (Table 7). Each recidivism type is examined in detail in following report sections.
Table 7 St. Leonard’s House residents’ recidivism by type (n=119)
Recidivism type
Number recidivated
Percent recidivated
Mean follow up period (in years)
Rearrest 57 47.9% 2.6 Reconviction 22 18.5% 2.6 Reincarceration 19 16.0% 1.5
In order to put the reincarceration rate of 16 percent in context, the rate was compared to other male reincarceration data. St. Leonard’s House had previously estimated a 13 percent recidivism rate for its residents, but the general population of male prisoners in Illinois has a recidivism rate of around 50 percent over three years, and the majority of those who return to prison do so within the first 18 months. However, in 2012 only 9 percent of St. Leonard’s House residents were from maximum security. Therefore, the recidivism rate of St. Leonard’s House residents may be better than state and national estimates, but higher than the rate provided by the program itself. Table 8 compares different reincarceration rates by population.
Table 8 Reincarcerations of St. Leonard’s House participants and male prisoners in
Illinois
Population examined
Total sample
Number re-
incarcerated
Percent re-
incarcerated
Follow up period
(in years) SLH resident sample
treatment 119 19 16.0% 1.5 (mean) comparison 127 47 37.0% 1.8 (mean)
All SLH residents 270 34 12.6% 3 IL male prisoners 22,143 11,359 51.3% 3
Data sources: ICJIA analysis of CHRI data, 2013; SLH analysis of IDOC data, 2011; ICJIA analysis of IDOC data
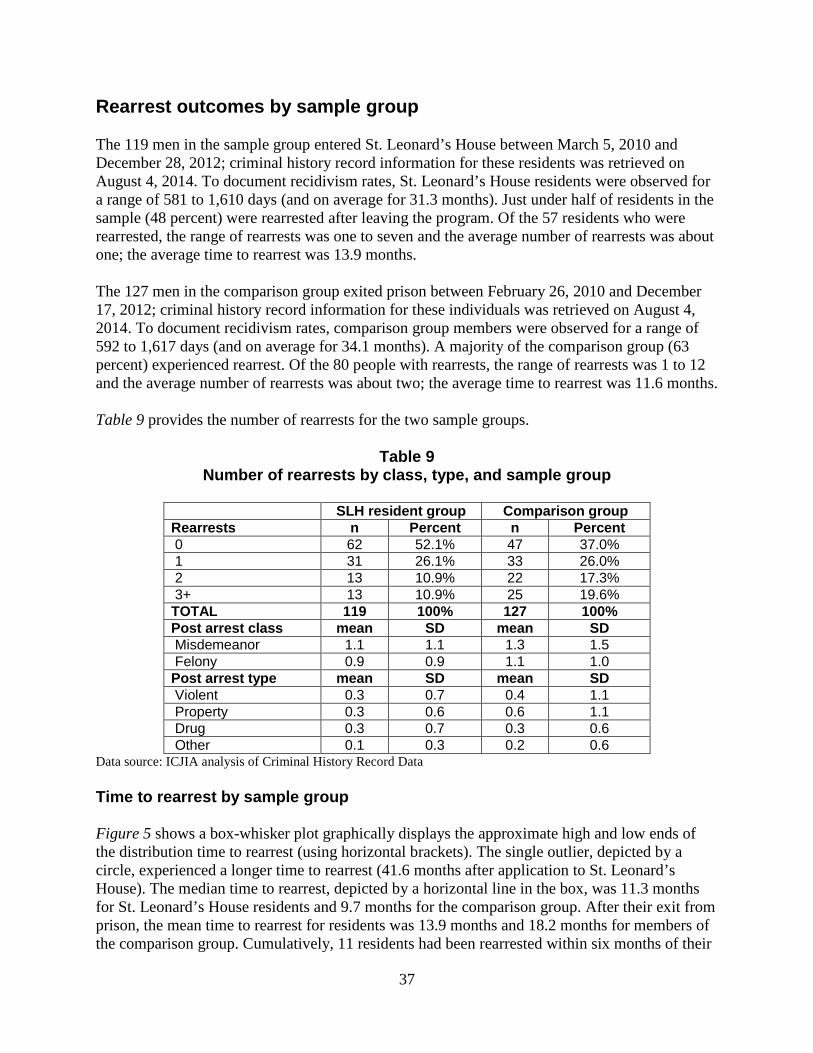
37
Rearrest outcomes by sample group The 119 men in the sample group entered St. Leonard’s House between March 5, 2010 and December 28, 2012; criminal history record information for these residents was retrieved on August 4, 2014. To document recidivism rates, St. Leonard’s House residents were observed for a range of 581 to 1,610 days (and on average for 31.3 months). Just under half of residents in the sample (48 percent) were rearrested after leaving the program. Of the 57 residents who were rearrested, the range of rearrests was one to seven and the average number of rearrests was about one; the average time to rearrest was 13.9 months. The 127 men in the comparison group exited prison between February 26, 2010 and December 17, 2012; criminal history record information for these individuals was retrieved on August 4, 2014. To document recidivism rates, comparison group members were observed for a range of 592 to 1,617 days (and on average for 34.1 months). A majority of the comparison group (63 percent) experienced rearrest. Of the 80 people with rearrests, the range of rearrests was 1 to 12 and the average number of rearrests was about two; the average time to rearrest was 11.6 months. Table 9 provides the number of rearrests for the two sample groups.
Table 9
Number of rearrests by class, type, and sample group
SLH resident group Comparison group Rearrests n Percent n Percent 0 62 52.1% 47 37.0% 1 31 26.1% 33 26.0% 2 13 10.9% 22 17.3% 3+ 13 10.9% 25 19.6% TOTAL 119 100% 127 100% Post arrest class mean SD mean SD Misdemeanor 1.1 1.1 1.3 1.5 Felony 0.9 0.9 1.1 1.0 Post arrest type mean SD mean SD Violent 0.3 0.7 0.4 1.1 Property 0.3 0.6 0.6 1.1 Drug 0.3 0.7 0.3 0.6 Other 0.1 0.3 0.2 0.6
Data source: ICJIA analysis of Criminal History Record Data Time to rearrest by sample group Figure 5 shows a box-whisker plot graphically displays the approximate high and low ends of the distribution time to rearrest (using horizontal brackets). The single outlier, depicted by a circle, experienced a longer time to rearrest (41.6 months after application to St. Leonard’s House). The median time to rearrest, depicted by a horizontal line in the box, was 11.3 months for St. Leonard’s House residents and 9.7 months for the comparison group. After their exit from prison, the mean time to rearrest for residents was 13.9 months and 18.2 months for members of the comparison group. Cumulatively, 11 residents had been rearrested within six months of their
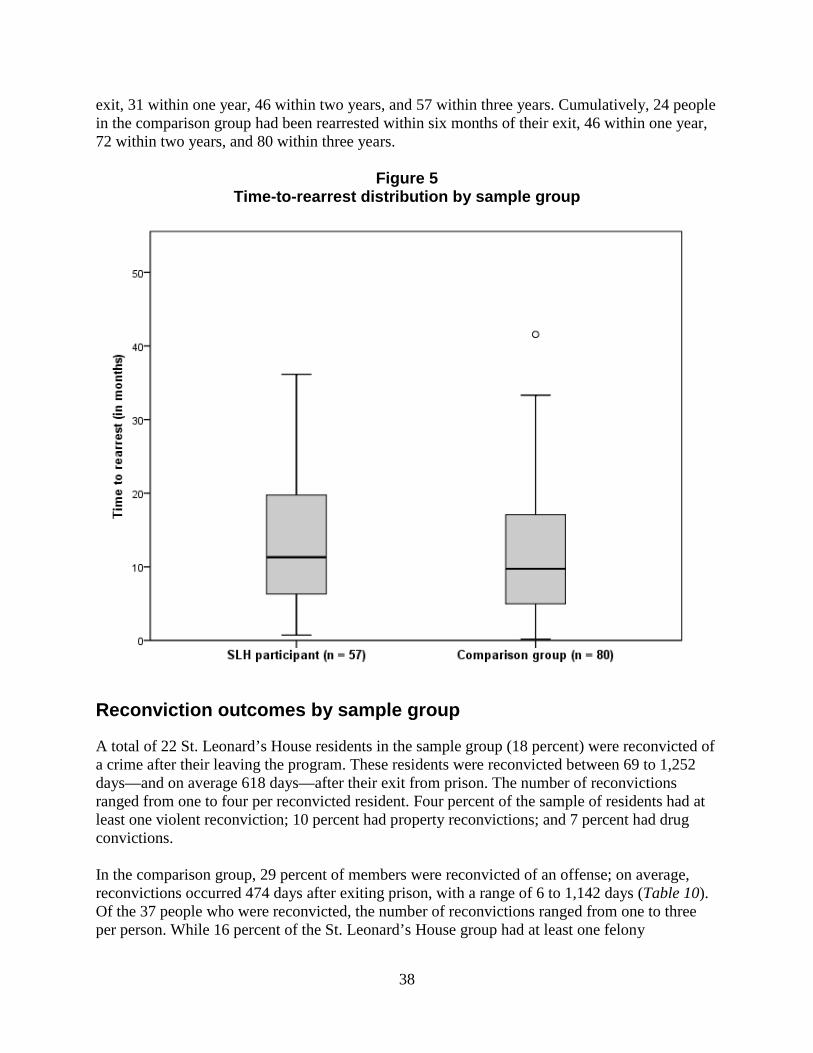
38
exit, 31 within one year, 46 within two years, and 57 within three years. Cumulatively, 24 people in the comparison group had been rearrested within six months of their exit, 46 within one year, 72 within two years, and 80 within three years.
Figure 5 Time-to-rearrest distribution by sample group
Reconviction outcomes by sample group
A total of 22 St. Leonard’s House residents in the sample group (18 percent) were reconvicted of a crime after their leaving the program. These residents were reconvicted between 69 to 1,252 days—and on average 618 days—after their exit from prison. The number of reconvictions ranged from one to four per reconvicted resident. Four percent of the sample of residents had at least one violent reconviction; 10 percent had property reconvictions; and 7 percent had drug convictions. In the comparison group, 29 percent of members were reconvicted of an offense; on average, reconvictions occurred 474 days after exiting prison, with a range of 6 to 1,142 days (Table 10). Of the 37 people who were reconvicted, the number of reconvictions ranged from one to three per person. While 16 percent of the St. Leonard’s House group had at least one felony
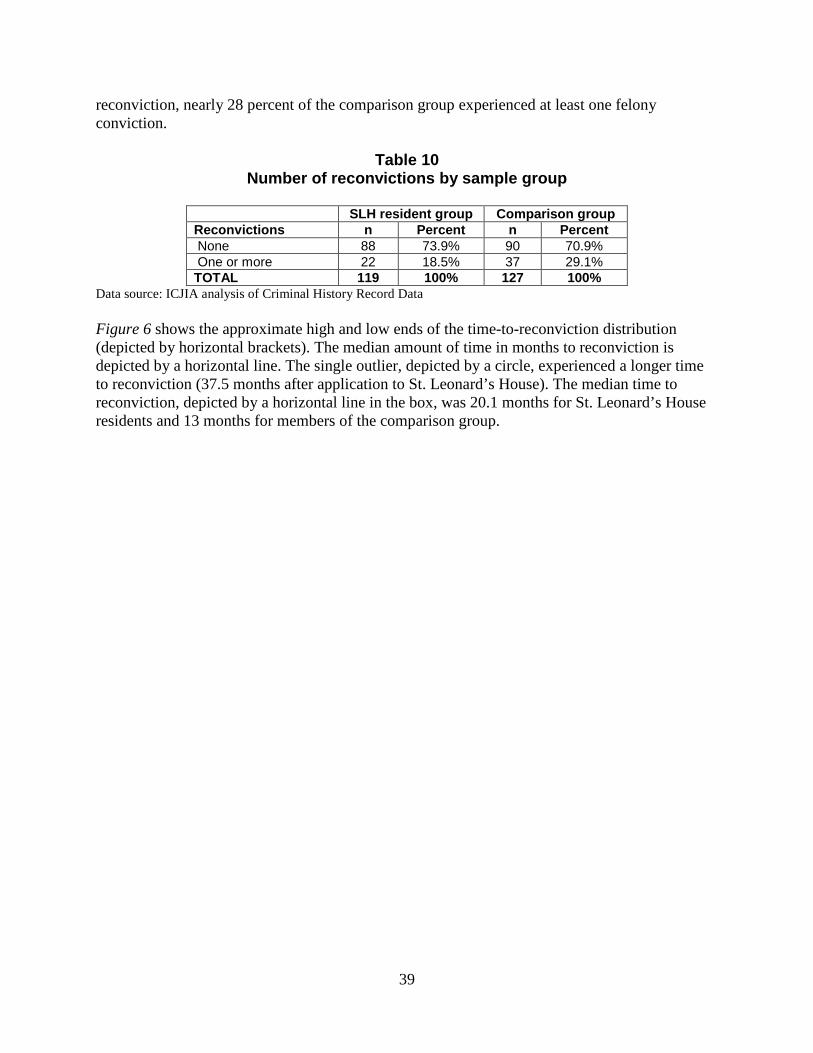
39
reconviction, nearly 28 percent of the comparison group experienced at least one felony conviction.
Table 10 Number of reconvictions by sample group
SLH resident group Comparison group Reconvictions n Percent n Percent None 88 73.9% 90 70.9% One or more 22 18.5% 37 29.1% TOTAL 119 100% 127 100%
Data source: ICJIA analysis of Criminal History Record Data Figure 6 shows the approximate high and low ends of the time-to-reconviction distribution (depicted by horizontal brackets). The median amount of time in months to reconviction is depicted by a horizontal line. The single outlier, depicted by a circle, experienced a longer time to reconviction (37.5 months after application to St. Leonard’s House). The median time to reconviction, depicted by a horizontal line in the box, was 20.1 months for St. Leonard’s House residents and 13 months for members of the comparison group.
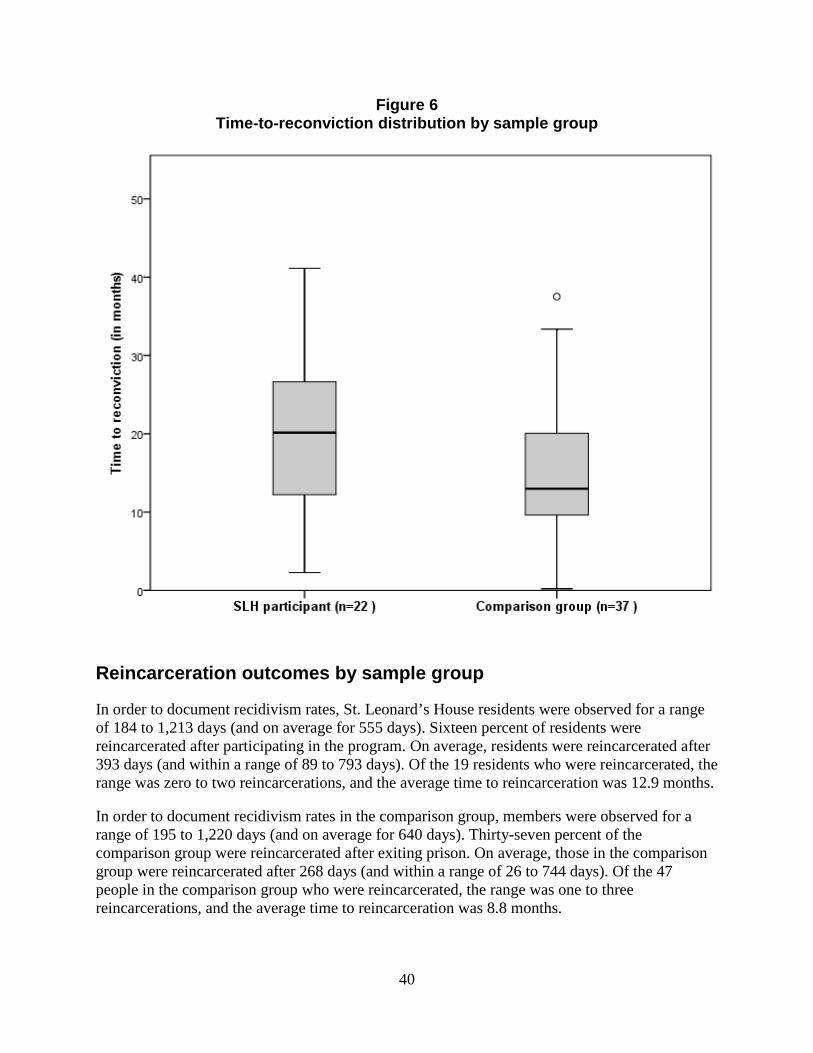
40
Figure 6 Time-to-reconviction distribution by sample group
Reincarceration outcomes by sample group
In order to document recidivism rates, St. Leonard’s House residents were observed for a range of 184 to 1,213 days (and on average for 555 days). Sixteen percent of residents were reincarcerated after participating in the program. On average, residents were reincarcerated after 393 days (and within a range of 89 to 793 days). Of the 19 residents who were reincarcerated, the range was zero to two reincarcerations, and the average time to reincarceration was 12.9 months. In order to document recidivism rates in the comparison group, members were observed for a range of 195 to 1,220 days (and on average for 640 days). Thirty-seven percent of the comparison group were reincarcerated after exiting prison. On average, those in the comparison group were reincarcerated after 268 days (and within a range of 26 to 744 days). Of the 47 people in the comparison group who were reincarcerated, the range was one to three reincarcerations, and the average time to reincarceration was 8.8 months.
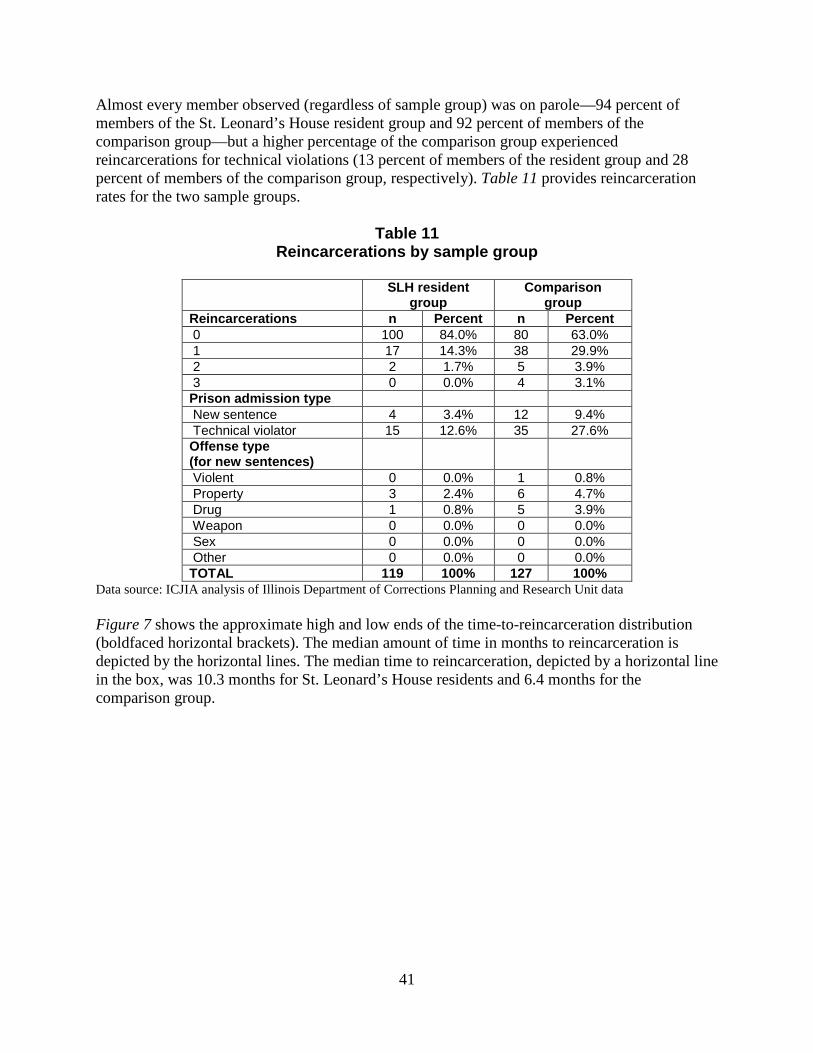
41
Almost every member observed (regardless of sample group) was on parole—94 percent of members of the St. Leonard’s House resident group and 92 percent of members of the comparison group—but a higher percentage of the comparison group experienced reincarcerations for technical violations (13 percent of members of the resident group and 28 percent of members of the comparison group, respectively). Table 11 provides reincarceration rates for the two sample groups.
Table 11 Reincarcerations by sample group
SLH resident
group Comparison
group Reincarcerations n Percent n Percent 0 100 84.0% 80 63.0% 1 17 14.3% 38 29.9% 2 2 1.7% 5 3.9% 3 0 0.0% 4 3.1% Prison admission type New sentence 4 3.4% 12 9.4% Technical violator 15 12.6% 35 27.6% Offense type (for new sentences)
Violent 0 0.0% 1 0.8% Property 3 2.4% 6 4.7% Drug 1 0.8% 5 3.9% Weapon 0 0.0% 0 0.0% Sex 0 0.0% 0 0.0% Other 0 0.0% 0 0.0% TOTAL 119 100% 127 100%
Data source: ICJIA analysis of Illinois Department of Corrections Planning and Research Unit data Figure 7 shows the approximate high and low ends of the time-to-reincarceration distribution (boldfaced horizontal brackets). The median amount of time in months to reincarceration is depicted by the horizontal lines. The median time to reincarceration, depicted by a horizontal line in the box, was 10.3 months for St. Leonard’s House residents and 6.4 months for the comparison group.
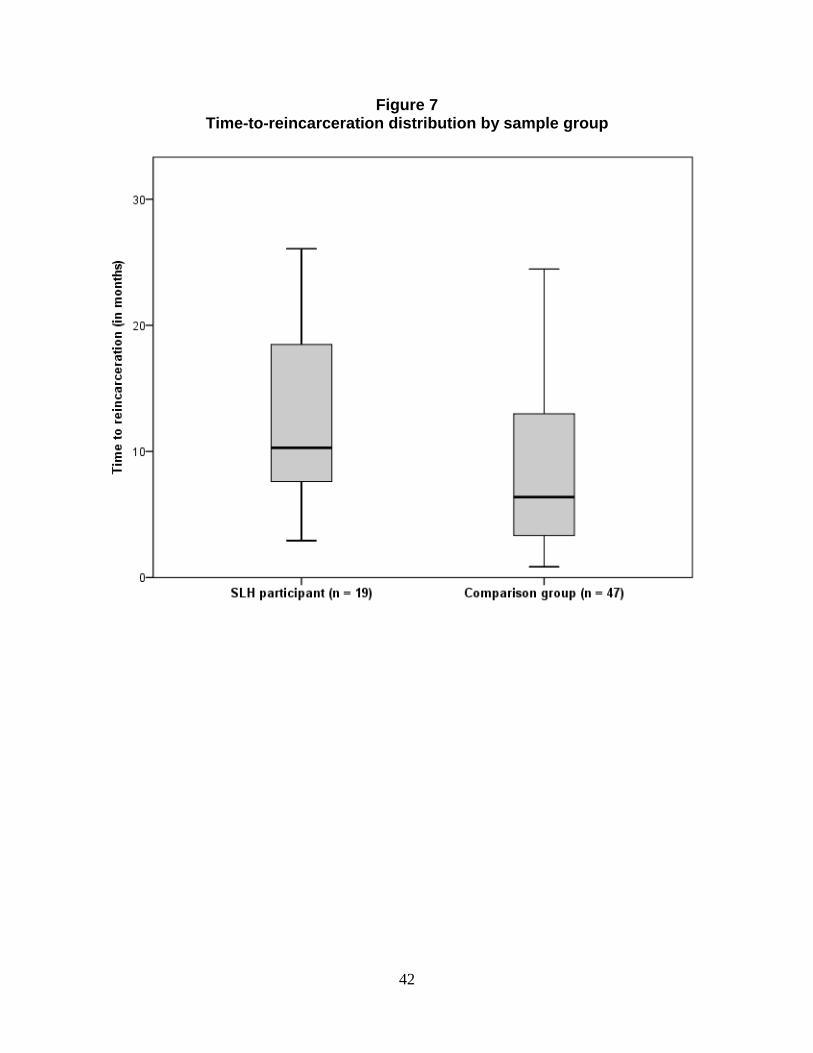
42
Figure 7 Time-to-reincarceration distribution by sample group
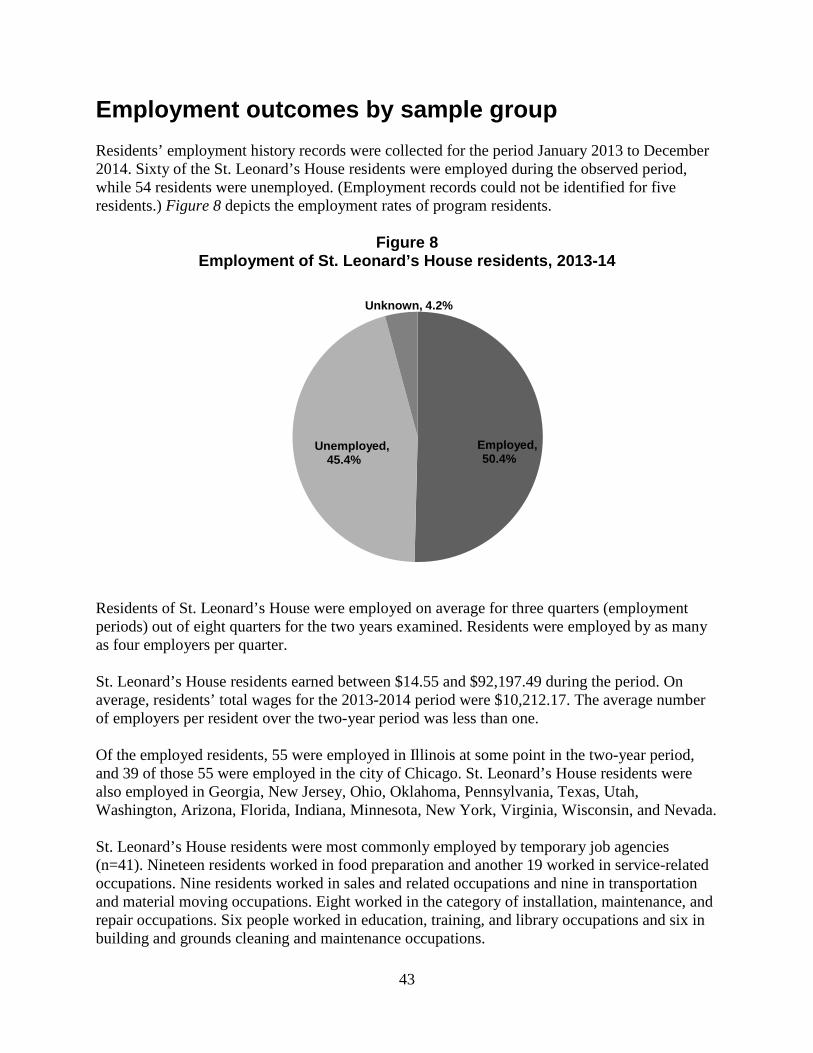
43
Employment outcomes by sample group Residents’ employment history records were collected for the period January 2013 to December 2014. Sixty of the St. Leonard’s House residents were employed during the observed period, while 54 residents were unemployed. (Employment records could not be identified for five residents.) Figure 8 depicts the employment rates of program residents. Figure 8
Employment of St. Leonard’s House residents, 2013-14
Residents of St. Leonard’s House were employed on average for three quarters (employment periods) out of eight quarters for the two years examined. Residents were employed by as many as four employers per quarter. St. Leonard’s House residents earned between $14.55 and $92,197.49 during the period. On average, residents’ total wages for the 2013-2014 period were $10,212.17. The average number of employers per resident over the two-year period was less than one. Of the employed residents, 55 were employed in Illinois at some point in the two-year period, and 39 of those 55 were employed in the city of Chicago. St. Leonard’s House residents were also employed in Georgia, New Jersey, Ohio, Oklahoma, Pennsylvania, Texas, Utah, Washington, Arizona, Florida, Indiana, Minnesota, New York, Virginia, Wisconsin, and Nevada. St. Leonard’s House residents were most commonly employed by temporary job agencies (n=41). Nineteen residents worked in food preparation and another 19 worked in service-related occupations. Nine residents worked in sales and related occupations and nine in transportation and material moving occupations. Eight worked in the category of installation, maintenance, and repair occupations. Six people worked in education, training, and library occupations and six in building and grounds cleaning and maintenance occupations.
Employed, 50.4%
Unemployed, 45.4%
Unknown, 4.2%
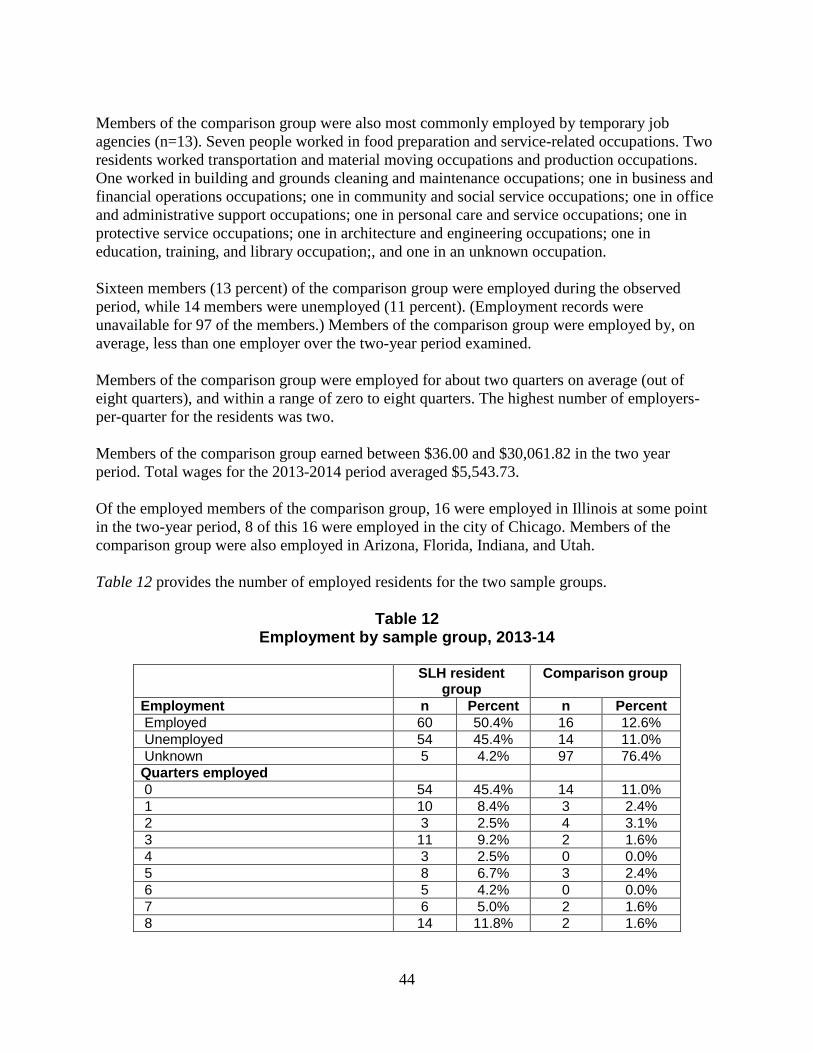
44
Members of the comparison group were also most commonly employed by temporary job agencies (n=13). Seven people worked in food preparation and service-related occupations. Two residents worked transportation and material moving occupations and production occupations. One worked in building and grounds cleaning and maintenance occupations; one in business and financial operations occupations; one in community and social service occupations; one in office and administrative support occupations; one in personal care and service occupations; one in protective service occupations; one in architecture and engineering occupations; one in education, training, and library occupation;, and one in an unknown occupation. Sixteen members (13 percent) of the comparison group were employed during the observed period, while 14 members were unemployed (11 percent). (Employment records were unavailable for 97 of the members.) Members of the comparison group were employed by, on average, less than one employer over the two-year period examined. Members of the comparison group were employed for about two quarters on average (out of eight quarters), and within a range of zero to eight quarters. The highest number of employers-per-quarter for the residents was two. Members of the comparison group earned between $36.00 and $30,061.82 in the two year period. Total wages for the 2013-2014 period averaged $5,543.73. Of the employed members of the comparison group, 16 were employed in Illinois at some point in the two-year period, 8 of this 16 were employed in the city of Chicago. Members of the comparison group were also employed in Arizona, Florida, Indiana, and Utah. Table 12 provides the number of employed residents for the two sample groups.
Table 12 Employment by sample group, 2013-14
SLH resident
group Comparison group
Employment n Percent n Percent Employed 60 50.4% 16 12.6% Unemployed 54 45.4% 14 11.0% Unknown 5 4.2% 97 76.4% Quarters employed 0 54 45.4% 14 11.0% 1 10 8.4% 3 2.4% 2 3 2.5% 4 3.1% 3 11 9.2% 2 1.6% 4 3 2.5% 0 0.0% 5 8 6.7% 3 2.4% 6 5 4.2% 0 0.0% 7 6 5.0% 2 1.6% 8 14 11.8% 2 1.6%
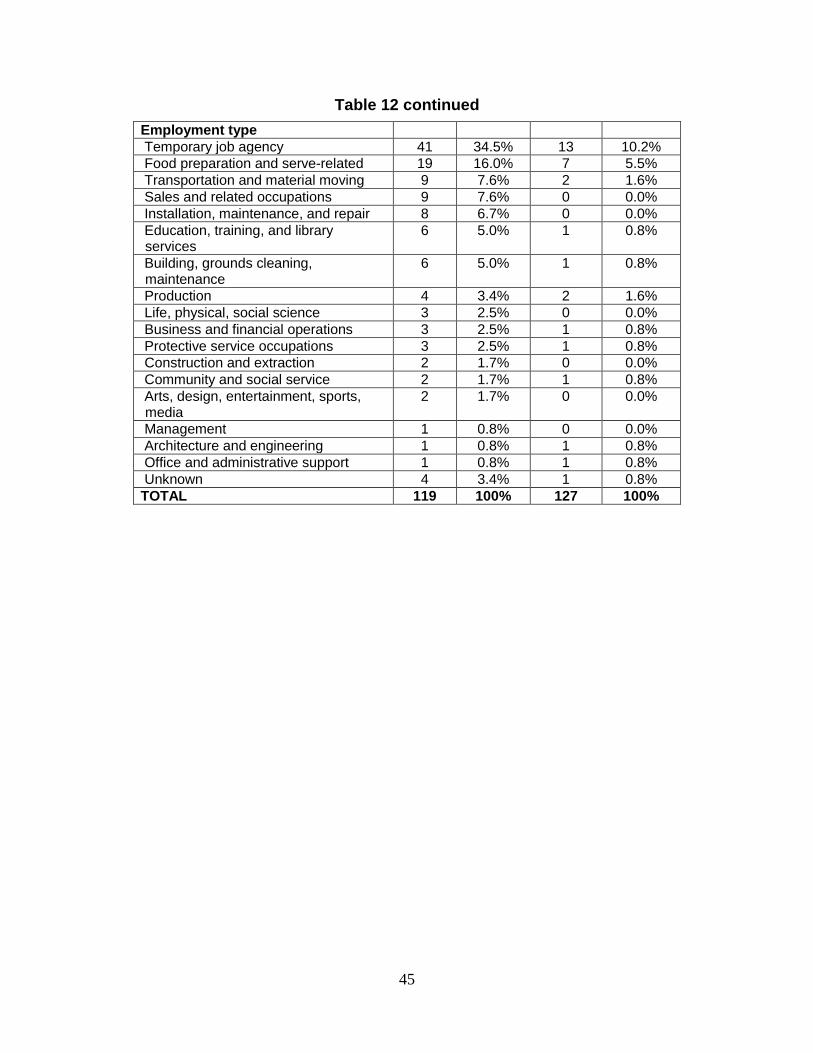
45
Table 12 continued Employment type Temporary job agency 41 34.5% 13 10.2% Food preparation and serve-related 19 16.0% 7 5.5% Transportation and material moving 9 7.6% 2 1.6% Sales and related occupations 9 7.6% 0 0.0% Installation, maintenance, and repair 8 6.7% 0 0.0% Education, training, and library services
6 5.0% 1 0.8%
Building, grounds cleaning, maintenance
6 5.0% 1 0.8%
Production 4 3.4% 2 1.6% Life, physical, social science 3 2.5% 0 0.0% Business and financial operations 3 2.5% 1 0.8% Protective service occupations 3 2.5% 1 0.8% Construction and extraction 2 1.7% 0 0.0% Community and social service 2 1.7% 1 0.8% Arts, design, entertainment, sports, media
2 1.7% 0 0.0%
Management 1 0.8% 0 0.0% Architecture and engineering 1 0.8% 1 0.8% Office and administrative support 1 0.8% 1 0.8% Unknown 4 3.4% 1 0.8% TOTAL 119 100% 127 100%
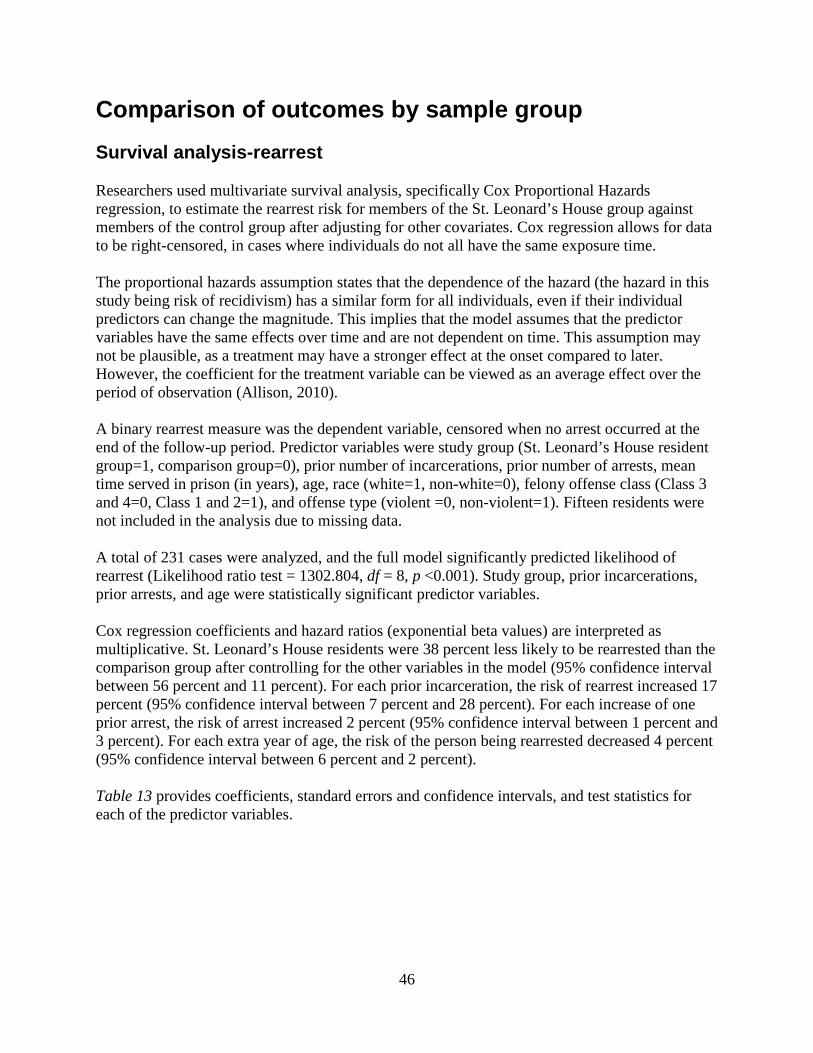
46
Comparison of outcomes by sample group Survival analysis-rearrest Researchers used multivariate survival analysis, specifically Cox Proportional Hazards regression, to estimate the rearrest risk for members of the St. Leonard’s House group against members of the control group after adjusting for other covariates. Cox regression allows for data to be right-censored, in cases where individuals do not all have the same exposure time. The proportional hazards assumption states that the dependence of the hazard (the hazard in this study being risk of recidivism) has a similar form for all individuals, even if their individual predictors can change the magnitude. This implies that the model assumes that the predictor variables have the same effects over time and are not dependent on time. This assumption may not be plausible, as a treatment may have a stronger effect at the onset compared to later. However, the coefficient for the treatment variable can be viewed as an average effect over the period of observation (Allison, 2010). A binary rearrest measure was the dependent variable, censored when no arrest occurred at the end of the follow-up period. Predictor variables were study group (St. Leonard’s House resident group=1, comparison group=0), prior number of incarcerations, prior number of arrests, mean time served in prison (in years), age, race (white=1, non-white=0), felony offense class (Class 3 and 4=0, Class 1 and 2=1), and offense type (violent =0, non-violent=1). Fifteen residents were not included in the analysis due to missing data. A total of 231 cases were analyzed, and the full model significantly predicted likelihood of rearrest (Likelihood ratio test = 1302.804, df = 8, p <0.001). Study group, prior incarcerations, prior arrests, and age were statistically significant predictor variables. Cox regression coefficients and hazard ratios (exponential beta values) are interpreted as multiplicative. St. Leonard’s House residents were 38 percent less likely to be rearrested than the comparison group after controlling for the other variables in the model (95% confidence interval between 56 percent and 11 percent). For each prior incarceration, the risk of rearrest increased 17 percent (95% confidence interval between 7 percent and 28 percent). For each increase of one prior arrest, the risk of arrest increased 2 percent (95% confidence interval between 1 percent and 3 percent). For each extra year of age, the risk of the person being rearrested decreased 4 percent (95% confidence interval between 6 percent and 2 percent). Table 13 provides coefficients, standard errors and confidence intervals, and test statistics for each of the predictor variables.
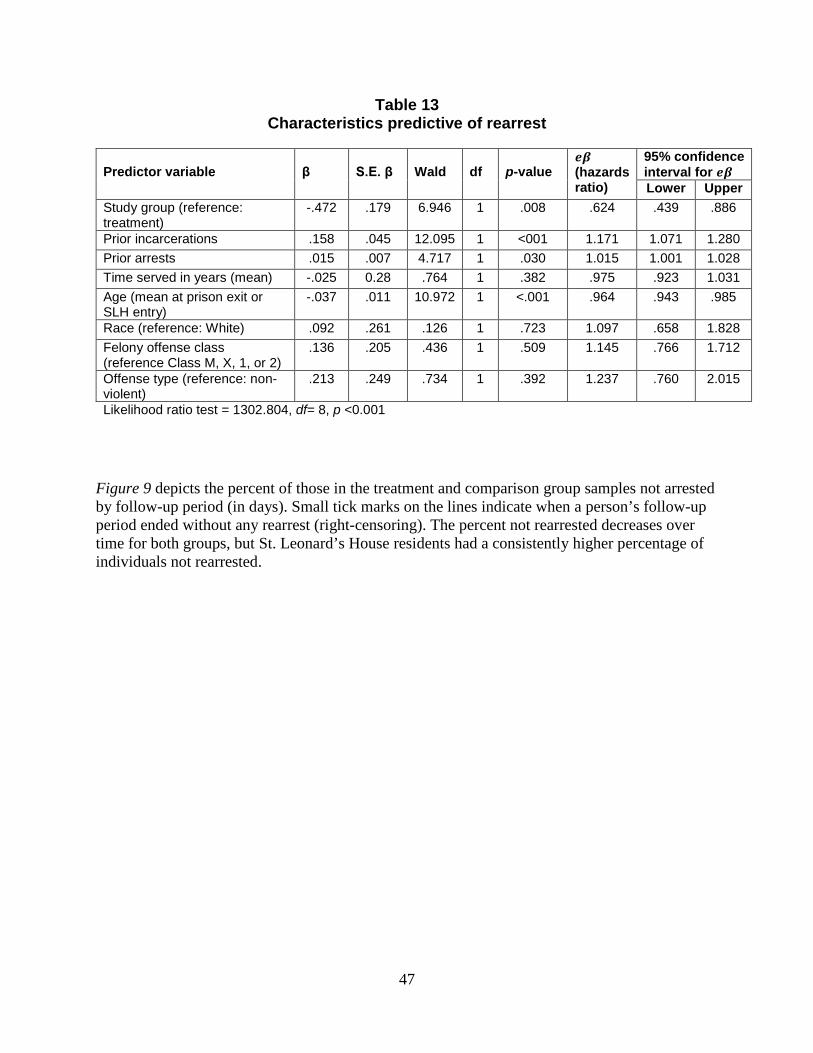
47
Table 13 Characteristics predictive of rearrest
Predictor variable
β
S.E. β
Wald
df
p-value
𝒆𝒆𝜷𝜷 (hazards ratio)
95% confidence interval for 𝒆𝒆𝜷𝜷 Lower Upper
Study group (reference: treatment)
-.472 .179 6.946 1 .008 .624 .439 .886
Prior incarcerations .158 .045 12.095 1 <001 1.171 1.071 1.280 Prior arrests .015 .007 4.717 1 .030 1.015 1.001 1.028 Time served in years (mean) -.025 0.28 .764 1 .382 .975 .923 1.031 Age (mean at prison exit or SLH entry)
-.037 .011 10.972 1 <.001 .964 .943 .985
Race (reference: White) .092 .261 .126 1 .723 1.097 .658 1.828 Felony offense class (reference Class M, X, 1, or 2)
.136 .205 .436 1 .509 1.145 .766 1.712
Offense type (reference: non-violent)
.213 .249 .734 1 .392 1.237 .760 2.015
Likelihood ratio test = 1302.804, df= 8, p <0.001
Figure 9 depicts the percent of those in the treatment and comparison group samples not arrested by follow-up period (in days). Small tick marks on the lines indicate when a person’s follow-up period ended without any rearrest (right-censoring). The percent not rearrested decreases over time for both groups, but St. Leonard’s House residents had a consistently higher percentage of individuals not rearrested.
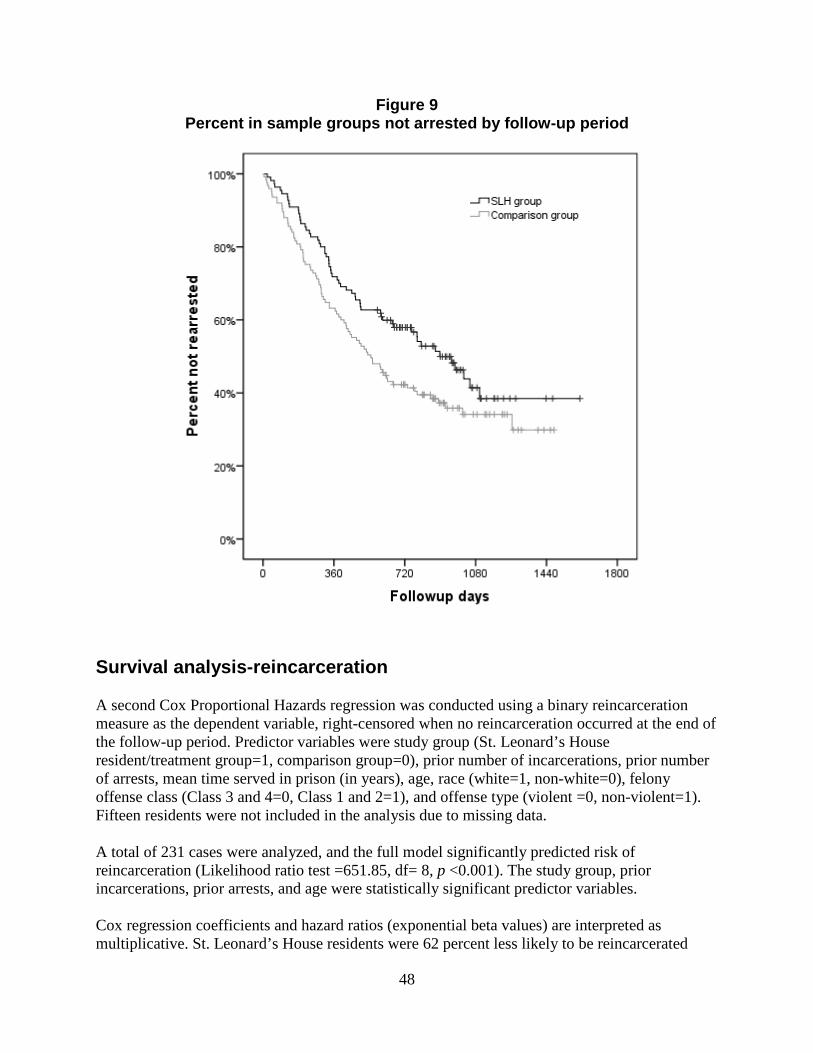
48
Figure 9 Percent in sample groups not arrested by follow-up period
Survival analysis-reincarceration A second Cox Proportional Hazards regression was conducted using a binary reincarceration measure as the dependent variable, right-censored when no reincarceration occurred at the end of the follow-up period. Predictor variables were study group (St. Leonard’s House resident/treatment group=1, comparison group=0), prior number of incarcerations, prior number of arrests, mean time served in prison (in years), age, race (white=1, non-white=0), felony offense class (Class 3 and 4=0, Class 1 and 2=1), and offense type (violent =0, non-violent=1). Fifteen residents were not included in the analysis due to missing data. A total of 231 cases were analyzed, and the full model significantly predicted risk of reincarceration (Likelihood ratio test =651.85, df= 8, p <0.001). The study group, prior incarcerations, prior arrests, and age were statistically significant predictor variables. Cox regression coefficients and hazard ratios (exponential beta values) are interpreted as multiplicative. St. Leonard’s House residents were 62 percent less likely to be reincarcerated
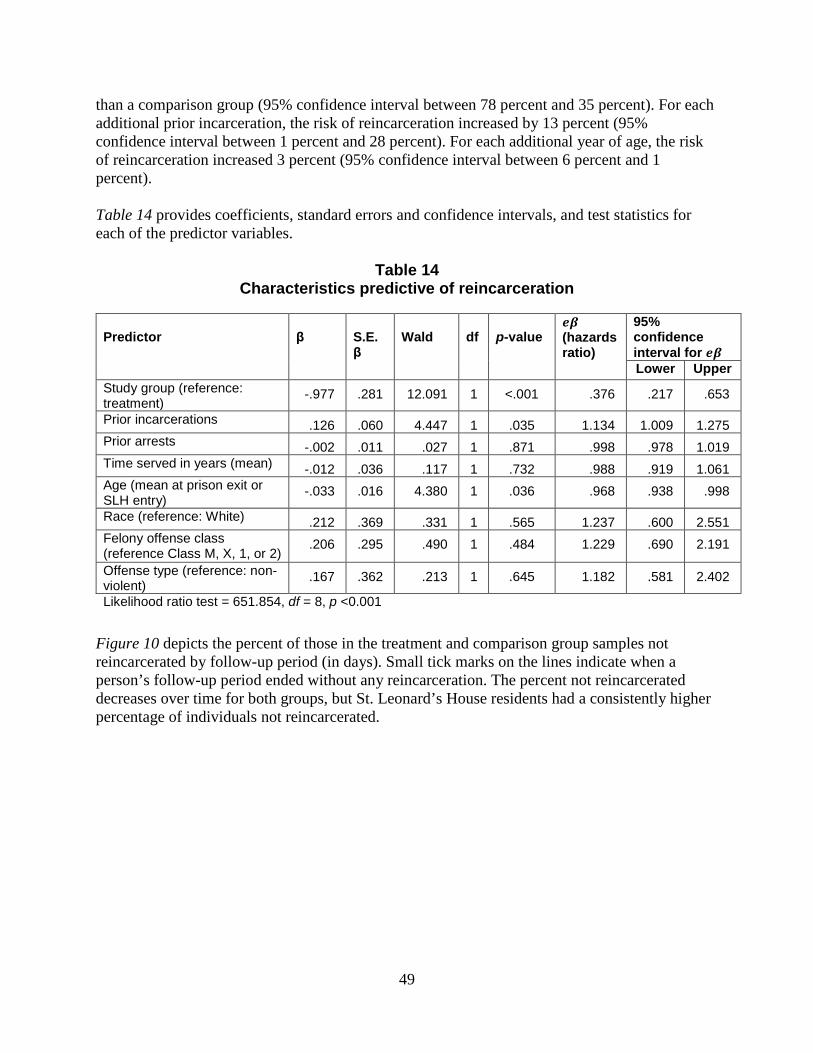
49
than a comparison group (95% confidence interval between 78 percent and 35 percent). For each additional prior incarceration, the risk of reincarceration increased by 13 percent (95% confidence interval between 1 percent and 28 percent). For each additional year of age, the risk of reincarceration increased 3 percent (95% confidence interval between 6 percent and 1 percent). Table 14 provides coefficients, standard errors and confidence intervals, and test statistics for each of the predictor variables.
Table 14 Characteristics predictive of reincarceration
Predictor
β
S.E. β
Wald
df
p-value
𝒆𝒆𝜷𝜷 (hazards ratio)
95% confidence interval for 𝒆𝒆𝜷𝜷 Lower Upper
Study group (reference: treatment)
-.977 .281 12.091 1 <.001 .376 .217 .653
Prior incarcerations .126 .060 4.447 1 .035 1.134 1.009 1.275 Prior arrests -.002 .011 .027 1 .871 .998 .978 1.019 Time served in years (mean) -.012 .036 .117 1 .732 .988 .919 1.061 Age (mean at prison exit or SLH entry)
-.033 .016 4.380 1 .036 .968 .938 .998
Race (reference: White) .212 .369 .331 1 .565 1.237 .600 2.551 Felony offense class (reference Class M, X, 1, or 2)
.206 .295 .490 1 .484 1.229 .690 2.191
Offense type (reference: non-violent)
.167 .362 .213 1 .645 1.182 .581 2.402
Likelihood ratio test = 651.854, df = 8, p <0.001
Figure 10 depicts the percent of those in the treatment and comparison group samples not reincarcerated by follow-up period (in days). Small tick marks on the lines indicate when a person’s follow-up period ended without any reincarceration. The percent not reincarcerated decreases over time for both groups, but St. Leonard’s House residents had a consistently higher percentage of individuals not reincarcerated.
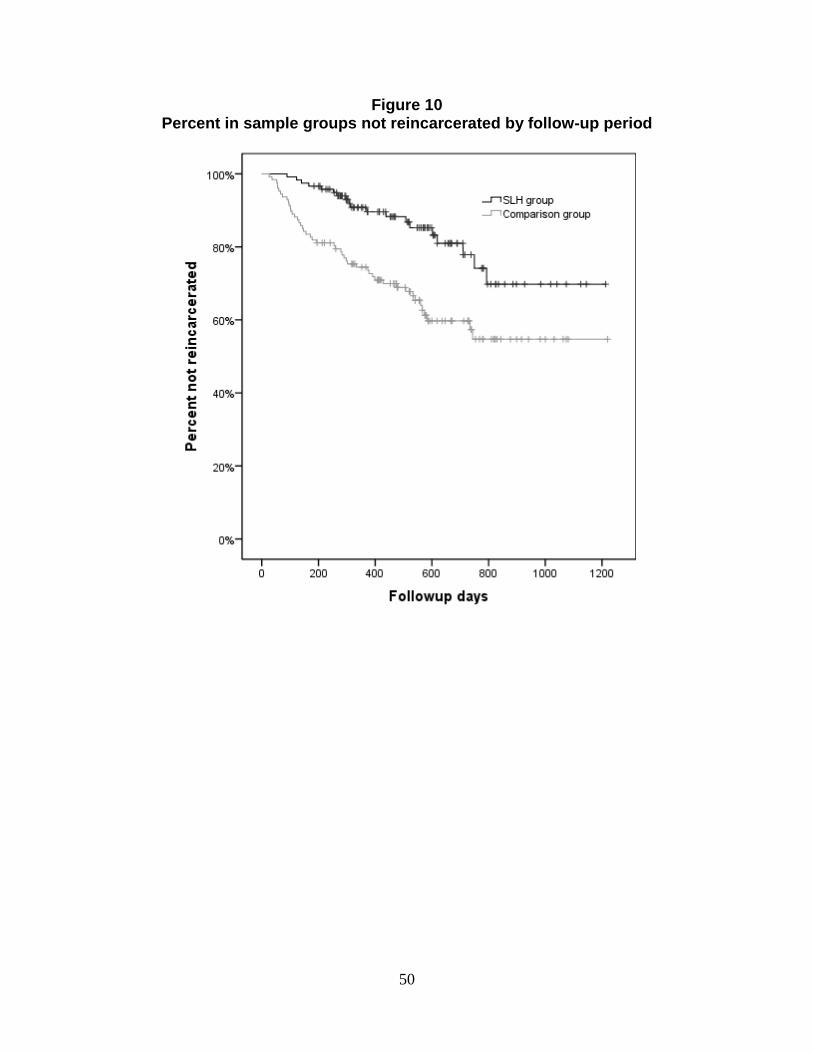
50
Figure 10 Percent in sample groups not reincarcerated by follow-up period
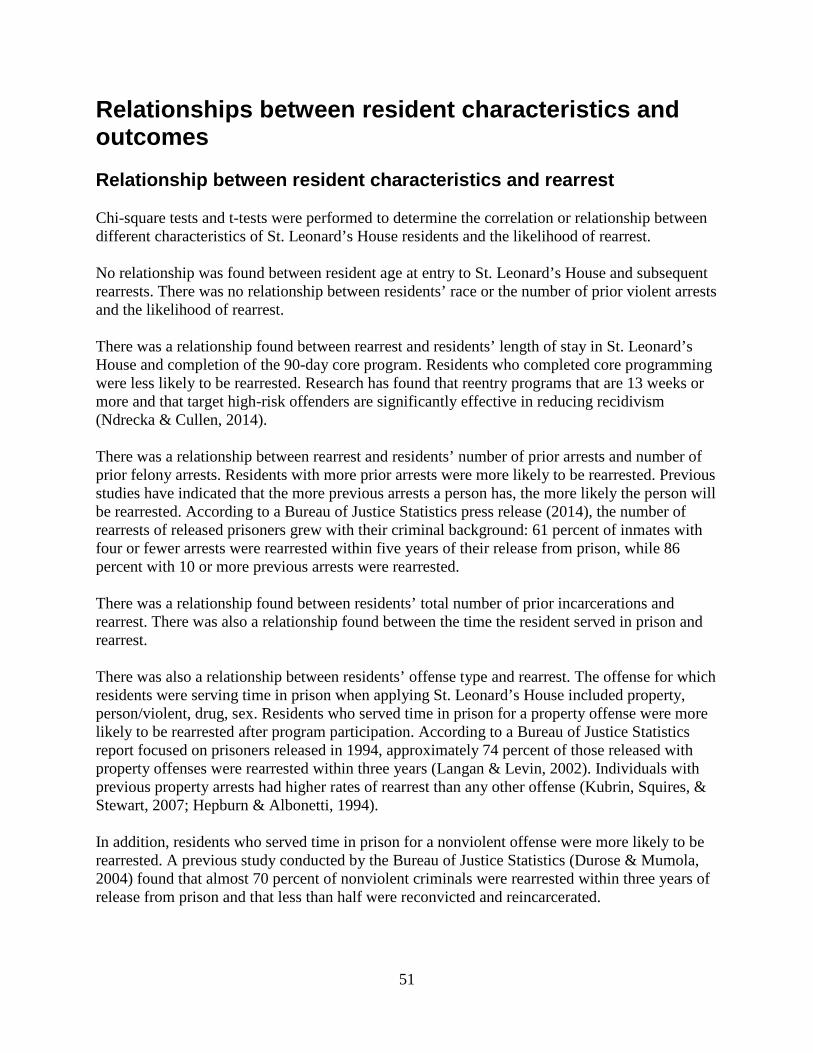
51
Relationships between resident characteristics and outcomes Relationship between resident characteristics and rearrest Chi-square tests and t-tests were performed to determine the correlation or relationship between different characteristics of St. Leonard’s House residents and the likelihood of rearrest. No relationship was found between resident age at entry to St. Leonard’s House and subsequent rearrests. There was no relationship between residents’ race or the number of prior violent arrests and the likelihood of rearrest. There was a relationship found between rearrest and residents’ length of stay in St. Leonard’s House and completion of the 90-day core program. Residents who completed core programming were less likely to be rearrested. Research has found that reentry programs that are 13 weeks or more and that target high-risk offenders are significantly effective in reducing recidivism (Ndrecka & Cullen, 2014). There was a relationship between rearrest and residents’ number of prior arrests and number of prior felony arrests. Residents with more prior arrests were more likely to be rearrested. Previous studies have indicated that the more previous arrests a person has, the more likely the person will be rearrested. According to a Bureau of Justice Statistics press release (2014), the number of rearrests of released prisoners grew with their criminal background: 61 percent of inmates with four or fewer arrests were rearrested within five years of their release from prison, while 86 percent with 10 or more previous arrests were rearrested. There was a relationship found between residents’ total number of prior incarcerations and rearrest. There was also a relationship found between the time the resident served in prison and rearrest. There was also a relationship between residents’ offense type and rearrest. The offense for which residents were serving time in prison when applying St. Leonard’s House included property, person/violent, drug, sex. Residents who served time in prison for a property offense were more likely to be rearrested after program participation. According to a Bureau of Justice Statistics report focused on prisoners released in 1994, approximately 74 percent of those released with property offenses were rearrested within three years (Langan & Levin, 2002). Individuals with previous property arrests had higher rates of rearrest than any other offense (Kubrin, Squires, & Stewart, 2007; Hepburn & Albonetti, 1994). In addition, residents who served time in prison for a nonviolent offense were more likely to be rearrested. A previous study conducted by the Bureau of Justice Statistics (Durose & Mumola, 2004) found that almost 70 percent of nonviolent criminals were rearrested within three years of release from prison and that less than half were reconvicted and reincarcerated.
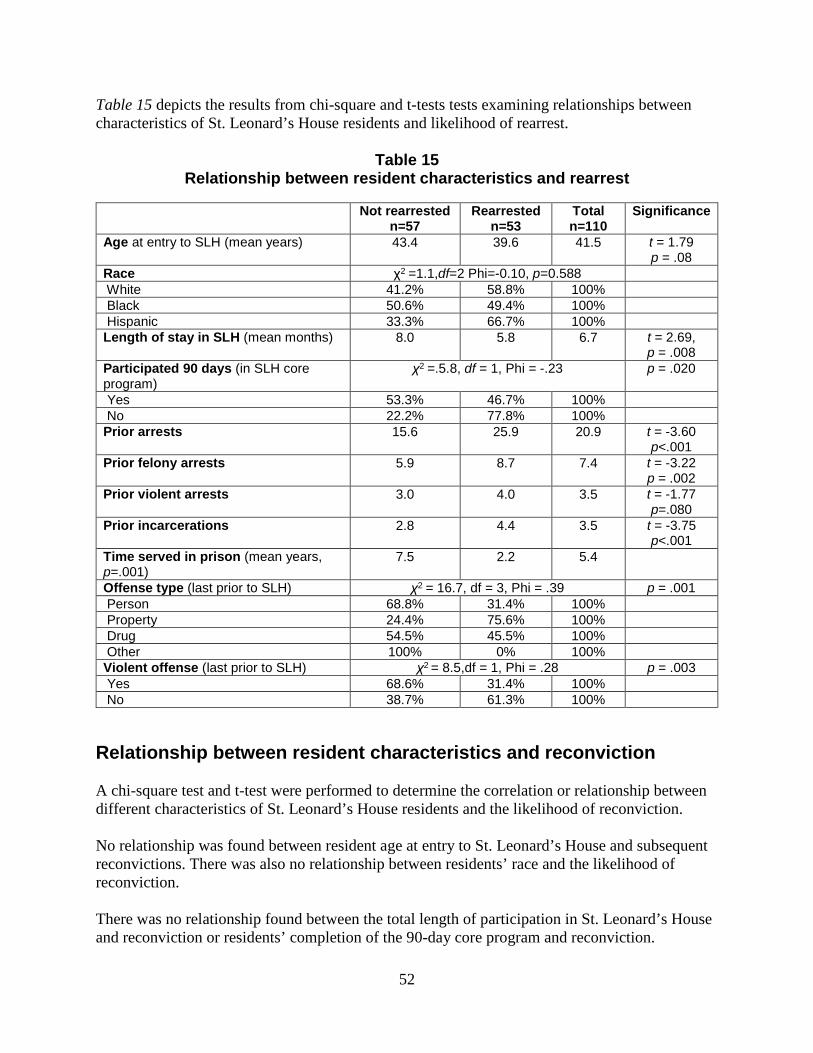
52
Table 15 depicts the results from chi-square and t-tests tests examining relationships between characteristics of St. Leonard’s House residents and likelihood of rearrest.
Table 15 Relationship between resident characteristics and rearrest
Not rearrested
n=57 Rearrested
n=53 Total n=110
Significance
Age at entry to SLH (mean years) 43.4 39.6 41.5 t = 1.79 p = .08
Race χ2 =1.1,df=2 Phi=-0.10, p=0.588 White 41.2% 58.8% 100% Black 50.6% 49.4% 100% Hispanic 33.3% 66.7% 100% Length of stay in SLH (mean months) 8.0 5.8 6.7 t = 2.69,
p = .008 Participated 90 days (in SLH core program)
χ2 =.5.8, df = 1, Phi = -.23 p = .020
Yes 53.3% 46.7% 100% No 22.2% 77.8% 100% Prior arrests 15.6 25.9 20.9 t = -3.60
p<.001 Prior felony arrests 5.9 8.7 7.4 t = -3.22
p = .002 Prior violent arrests 3.0 4.0 3.5 t = -1.77
p=.080 Prior incarcerations 2.8 4.4 3.5 t = -3.75
p<.001 Time served in prison (mean years, p=.001)
7.5 2.2 5.4
Offense type (last prior to SLH) χ2 = 16.7, df = 3, Phi = .39 p = .001 Person 68.8% 31.4% 100% Property 24.4% 75.6% 100% Drug 54.5% 45.5% 100% Other 100% 0% 100% Violent offense (last prior to SLH) χ2 = 8.5,df = 1, Phi = .28 p = .003 Yes 68.6% 31.4% 100% No 38.7% 61.3% 100%
Relationship between resident characteristics and reconviction A chi-square test and t-test were performed to determine the correlation or relationship between different characteristics of St. Leonard’s House residents and the likelihood of reconviction. No relationship was found between resident age at entry to St. Leonard’s House and subsequent reconvictions. There was also no relationship between residents’ race and the likelihood of reconviction. There was no relationship found between the total length of participation in St. Leonard’s House and reconviction or residents’ completion of the 90-day core program and reconviction.
53
There was a relationship between the number of prior arrests and reconviction, as well as the number of prior felony arrests and reconviction. Previous studies have found that the rate of recidivism is higher for people with a history of prior arrests (Kubrin, Squires, & Stewart, 2007). However, there was no relationship between the number of prior violent arrests and reconviction. There was a relationship between residents’ number of prior incarcerations and reconviction. However, no relationship was found between the time the resident served in prison and reconviction. There was a relationship between residents’ offense type and reconviction. Residents’ offense at the time of application to St. Leonard’s House included property, person/violent, drugs, and sex offenses. In addition, there was a relationship between residents with a last offense that was violent and reconviction. Residents who served time in prison for a nonviolent offense were more likely to be reconvicted as well. A study conducted by the Bureau of Justice Statistics (2004) found that 48 percent of nonviolent criminals were reconvicted within three years of release from prison. Table 16 shows the results of the chi-square test on relationships between resident characteristics and reconviction after program participation.
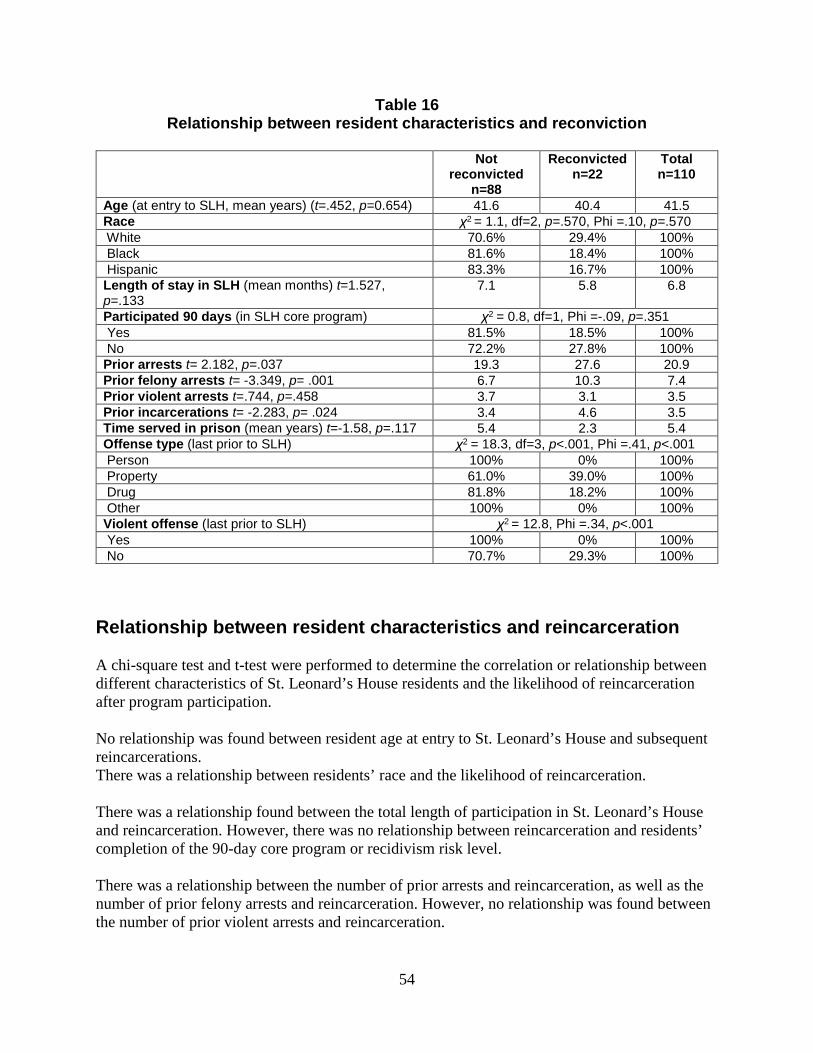
54
Table 16 Relationship between resident characteristics and reconviction
Not
reconvicted n=88
Reconvicted n=22
Total n=110
Age (at entry to SLH, mean years) (t=.452, p=0.654) 41.6 40.4 41.5 Race χ2 = 1.1, df=2, p=.570, Phi =.10, p=.570 White 70.6% 29.4% 100% Black 81.6% 18.4% 100% Hispanic 83.3% 16.7% 100% Length of stay in SLH (mean months) t=1.527, p=.133
7.1 5.8 6.8
Participated 90 days (in SLH core program) χ2 = 0.8, df=1, Phi =-.09, p=.351 Yes 81.5% 18.5% 100% No 72.2% 27.8% 100% Prior arrests t= 2.182, p=.037 19.3 27.6 20.9 Prior felony arrests t= -3.349, p= .001 6.7 10.3 7.4 Prior violent arrests t=.744, p=.458 3.7 3.1 3.5 Prior incarcerations t= -2.283, p= .024 3.4 4.6 3.5 Time served in prison (mean years) t=-1.58, p=.117 5.4 2.3 5.4 Offense type (last prior to SLH) χ2 = 18.3, df=3, p<.001, Phi =.41, p<.001 Person 100% 0% 100% Property 61.0% 39.0% 100% Drug 81.8% 18.2% 100% Other 100% 0% 100% Violent offense (last prior to SLH) χ2 = 12.8, Phi =.34, p<.001 Yes 100% 0% 100% No 70.7% 29.3% 100%
Relationship between resident characteristics and reincarceration A chi-square test and t-test were performed to determine the correlation or relationship between different characteristics of St. Leonard’s House residents and the likelihood of reincarceration after program participation. No relationship was found between resident age at entry to St. Leonard’s House and subsequent reincarcerations. There was a relationship between residents’ race and the likelihood of reincarceration. There was a relationship found between the total length of participation in St. Leonard’s House and reincarceration. However, there was no relationship between reincarceration and residents’ completion of the 90-day core program or recidivism risk level. There was a relationship between the number of prior arrests and reincarceration, as well as the number of prior felony arrests and reincarceration. However, no relationship was found between the number of prior violent arrests and reincarceration.
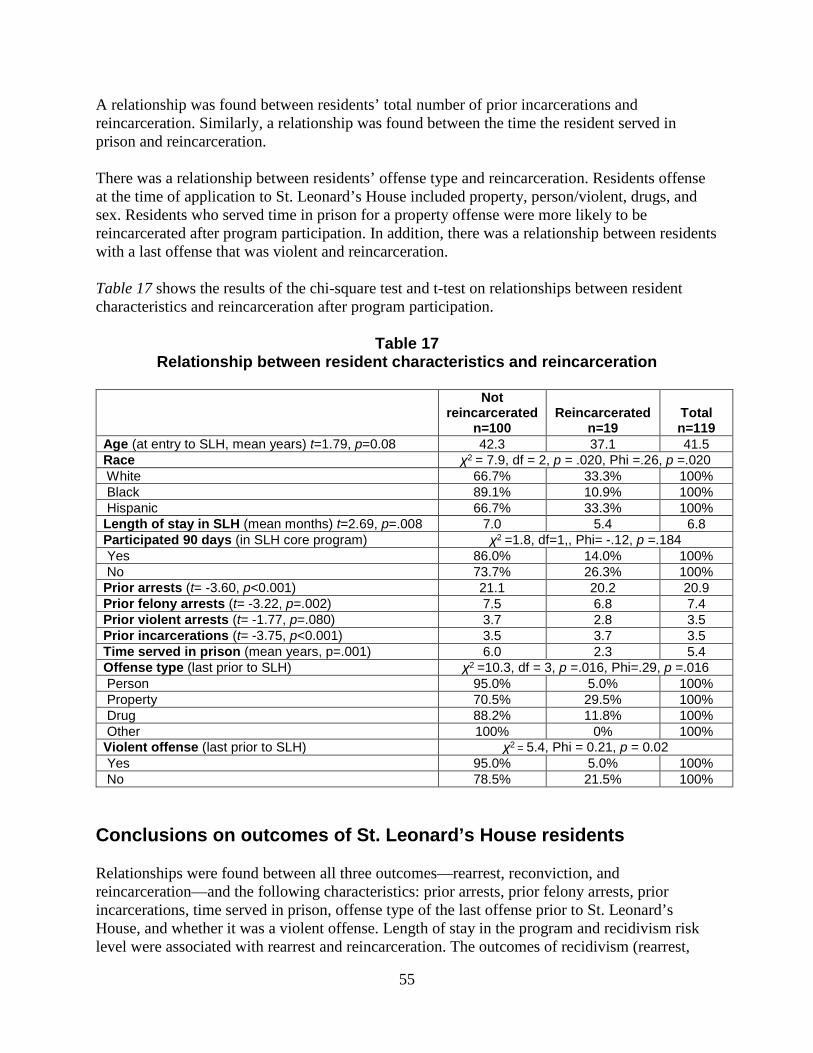
55
A relationship was found between residents’ total number of prior incarcerations and reincarceration. Similarly, a relationship was found between the time the resident served in prison and reincarceration. There was a relationship between residents’ offense type and reincarceration. Residents offense at the time of application to St. Leonard’s House included property, person/violent, drugs, and sex. Residents who served time in prison for a property offense were more likely to be reincarcerated after program participation. In addition, there was a relationship between residents with a last offense that was violent and reincarceration. Table 17 shows the results of the chi-square test and t-test on relationships between resident characteristics and reincarceration after program participation.
Table 17 Relationship between resident characteristics and reincarceration
Not
reincarcerated n=100
Reincarcerated
n=19
Total n=119
Age (at entry to SLH, mean years) t=1.79, p=0.08 42.3 37.1 41.5 Race χ2 = 7.9, df = 2, p = .020, Phi =.26, p =.020 White 66.7% 33.3% 100% Black 89.1% 10.9% 100% Hispanic 66.7% 33.3% 100% Length of stay in SLH (mean months) t=2.69, p=.008 7.0 5.4 6.8 Participated 90 days (in SLH core program) χ2 =1.8, df=1,, Phi= -.12, p =.184 Yes 86.0% 14.0% 100% No 73.7% 26.3% 100% Prior arrests (t= -3.60, p<0.001) 21.1 20.2 20.9 Prior felony arrests (t= -3.22, p=.002) 7.5 6.8 7.4 Prior violent arrests (t= -1.77, p=.080) 3.7 2.8 3.5 Prior incarcerations (t= -3.75, p<0.001) 3.5 3.7 3.5 Time served in prison (mean years, p=.001) 6.0 2.3 5.4 Offense type (last prior to SLH) χ2 =10.3, df = 3, p =.016, Phi=.29, p =.016 Person 95.0% 5.0% 100% Property 70.5% 29.5% 100% Drug 88.2% 11.8% 100% Other 100% 0% 100% Violent offense (last prior to SLH) χ2 = 5.4, Phi = 0.21, p = 0.02 Yes 95.0% 5.0% 100% No 78.5% 21.5% 100%
Conclusions on outcomes of St. Leonard’s House residents Relationships were found between all three outcomes—rearrest, reconviction, and reincarceration—and the following characteristics: prior arrests, prior felony arrests, prior incarcerations, time served in prison, offense type of the last offense prior to St. Leonard’s House, and whether it was a violent offense. Length of stay in the program and recidivism risk level were associated with rearrest and reincarceration. The outcomes of recidivism (rearrest,

56
reconviction, and reincarceration) are the most important variables in evaluating residential reentry programs when evaluating residential reentry programs in order to guide policy (The Council of State Governments, n.d.).
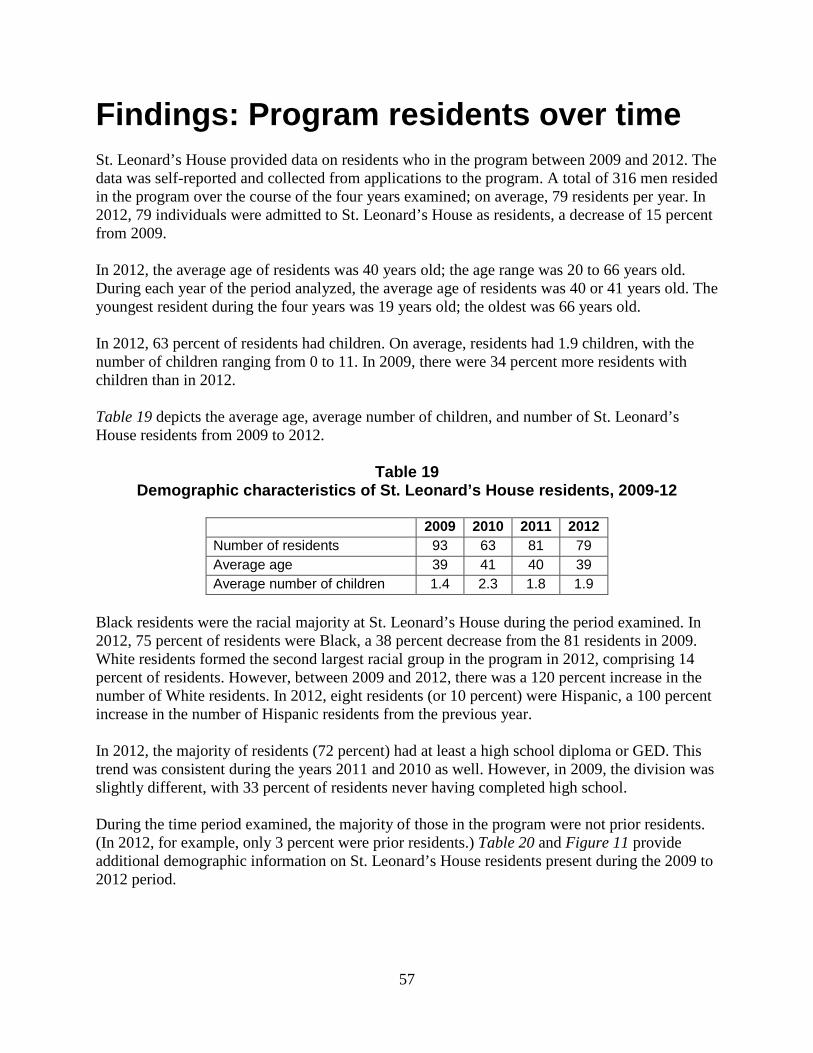
57
Findings: Program residents over time St. Leonard’s House provided data on residents who in the program between 2009 and 2012. The data was self-reported and collected from applications to the program. A total of 316 men resided in the program over the course of the four years examined; on average, 79 residents per year. In 2012, 79 individuals were admitted to St. Leonard’s House as residents, a decrease of 15 percent from 2009. In 2012, the average age of residents was 40 years old; the age range was 20 to 66 years old. During each year of the period analyzed, the average age of residents was 40 or 41 years old. The youngest resident during the four years was 19 years old; the oldest was 66 years old. In 2012, 63 percent of residents had children. On average, residents had 1.9 children, with the number of children ranging from 0 to 11. In 2009, there were 34 percent more residents with children than in 2012. Table 19 depicts the average age, average number of children, and number of St. Leonard’s House residents from 2009 to 2012.
Table 19 Demographic characteristics of St. Leonard’s House residents, 2009-12
2009 2010 2011 2012 Number of residents 93 63 81 79 Average age 39 41 40 39 Average number of children 1.4 2.3 1.8 1.9
Black residents were the racial majority at St. Leonard’s House during the period examined. In 2012, 75 percent of residents were Black, a 38 percent decrease from the 81 residents in 2009. White residents formed the second largest racial group in the program in 2012, comprising 14 percent of residents. However, between 2009 and 2012, there was a 120 percent increase in the number of White residents. In 2012, eight residents (or 10 percent) were Hispanic, a 100 percent increase in the number of Hispanic residents from the previous year. In 2012, the majority of residents (72 percent) had at least a high school diploma or GED. This trend was consistent during the years 2011 and 2010 as well. However, in 2009, the division was slightly different, with 33 percent of residents never having completed high school. During the time period examined, the majority of those in the program were not prior residents. (In 2012, for example, only 3 percent were prior residents.) Table 20 and Figure 11 provide additional demographic information on St. Leonard’s House residents present during the 2009 to 2012 period.
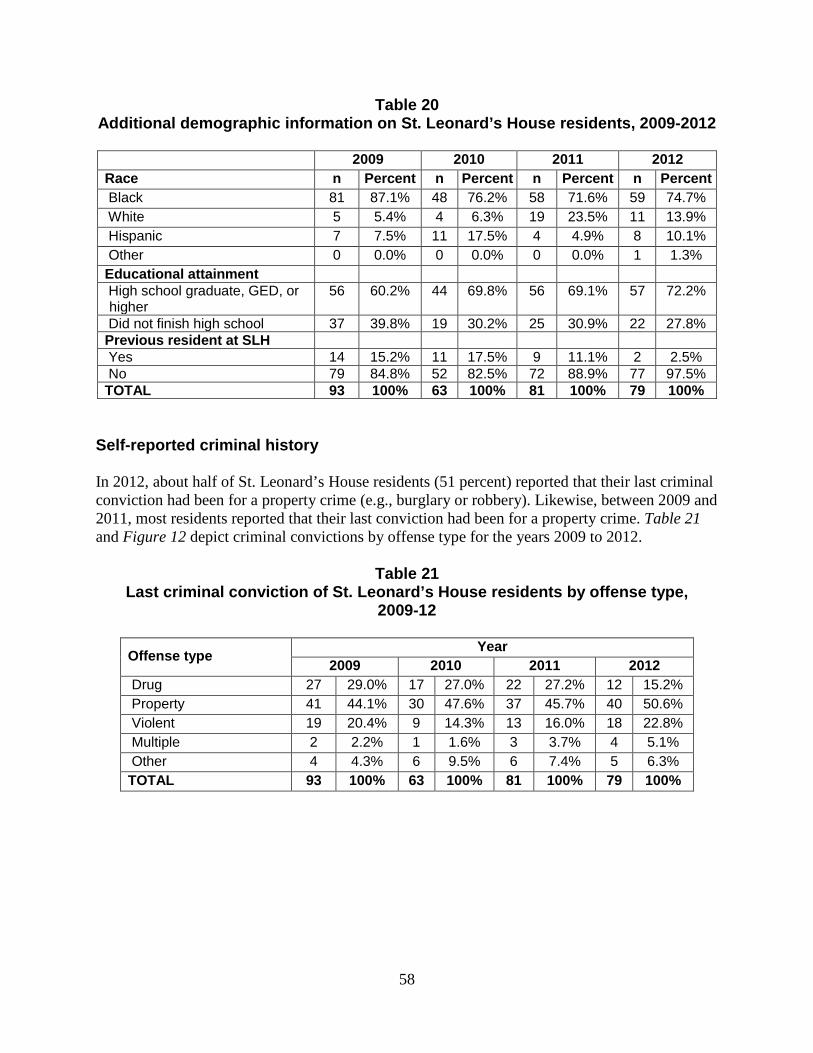
58
Table 20 Additional demographic information on St. Leonard’s House residents, 2009-2012
2009 2010 2011 2012 Race n Percent n Percent n Percent n Percent Black 81 87.1% 48 76.2% 58 71.6% 59 74.7% White 5 5.4% 4 6.3% 19 23.5% 11 13.9% Hispanic 7 7.5% 11 17.5% 4 4.9% 8 10.1% Other 0 0.0% 0 0.0% 0 0.0% 1 1.3% Educational attainment High school graduate, GED, or higher
56 60.2% 44 69.8% 56 69.1% 57 72.2%
Did not finish high school 37 39.8% 19 30.2% 25 30.9% 22 27.8% Previous resident at SLH Yes 14 15.2% 11 17.5% 9 11.1% 2 2.5% No 79 84.8% 52 82.5% 72 88.9% 77 97.5% TOTAL 93 100% 63 100% 81 100% 79 100%
Self-reported criminal history In 2012, about half of St. Leonard’s House residents (51 percent) reported that their last criminal conviction had been for a property crime (e.g., burglary or robbery). Likewise, between 2009 and 2011, most residents reported that their last conviction had been for a property crime. Table 21 and Figure 12 depict criminal convictions by offense type for the years 2009 to 2012.
Table 21 Last criminal conviction of St. Leonard’s House residents by offense type,
2009-12
Offense type Year 2009 2010 2011 2012
Drug 27 29.0% 17 27.0% 22 27.2% 12 15.2% Property 41 44.1% 30 47.6% 37 45.7% 40 50.6% Violent 19 20.4% 9 14.3% 13 16.0% 18 22.8% Multiple 2 2.2% 1 1.6% 3 3.7% 4 5.1% Other 4 4.3% 6 9.5% 6 7.4% 5 6.3% TOTAL 93 100% 63 100% 81 100% 79 100%
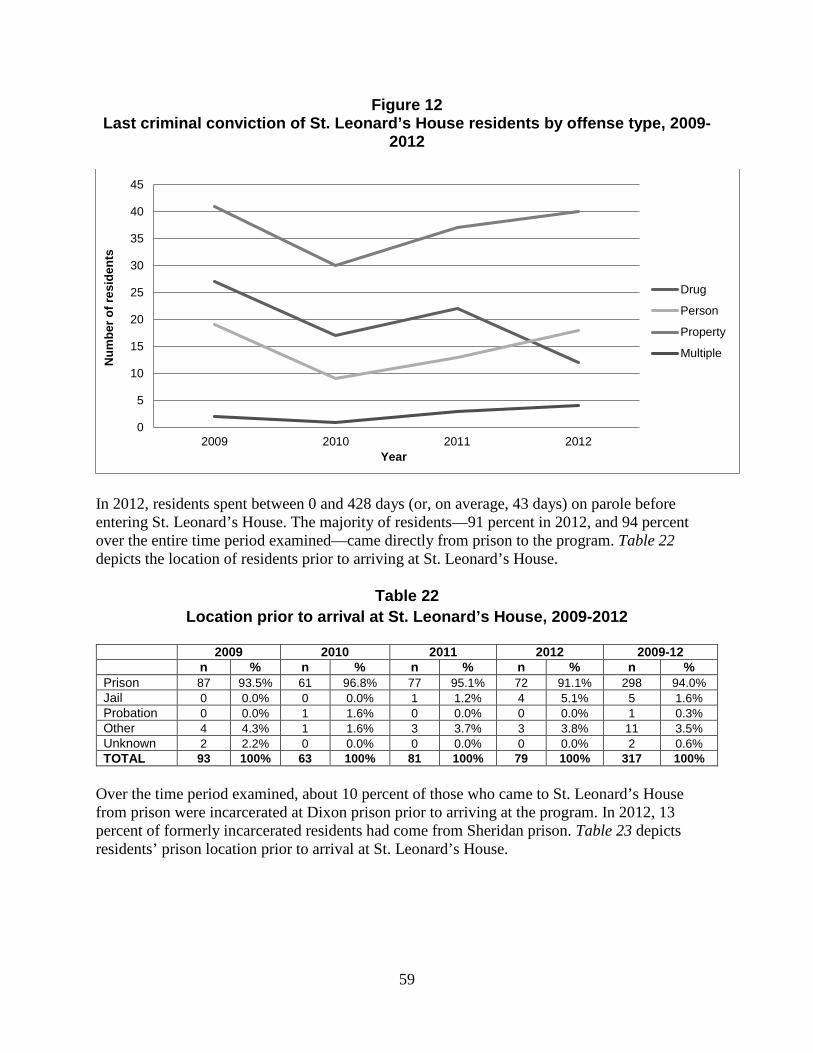
59
Figure 12 Last criminal conviction of St. Leonard’s House residents by offense type, 2009-
2012
In 2012, residents spent between 0 and 428 days (or, on average, 43 days) on parole before entering St. Leonard’s House. The majority of residents—91 percent in 2012, and 94 percent over the entire time period examined—came directly from prison to the program. Table 22 depicts the location of residents prior to arriving at St. Leonard’s House.
Table 22 Location prior to arrival at St. Leonard’s House, 2009-2012
2009 2010 2011 2012 2009-12 n % n % n % n % n % Prison 87 93.5% 61 96.8% 77 95.1% 72 91.1% 298 94.0% Jail 0 0.0% 0 0.0% 1 1.2% 4 5.1% 5 1.6% Probation 0 0.0% 1 1.6% 0 0.0% 0 0.0% 1 0.3% Other 4 4.3% 1 1.6% 3 3.7% 3 3.8% 11 3.5% Unknown 2 2.2% 0 0.0% 0 0.0% 0 0.0% 2 0.6% TOTAL 93 100% 63 100% 81 100% 79 100% 317 100%
Over the time period examined, about 10 percent of those who came to St. Leonard’s House from prison were incarcerated at Dixon prison prior to arriving at the program. In 2012, 13 percent of formerly incarcerated residents had come from Sheridan prison. Table 23 depicts residents’ prison location prior to arrival at St. Leonard’s House.
0
5
10
15
20
25
30
35
40
45
2009 2010 2011 2012
Num
ber o
f res
iden
ts
Year
Drug
Person
Property
Multiple
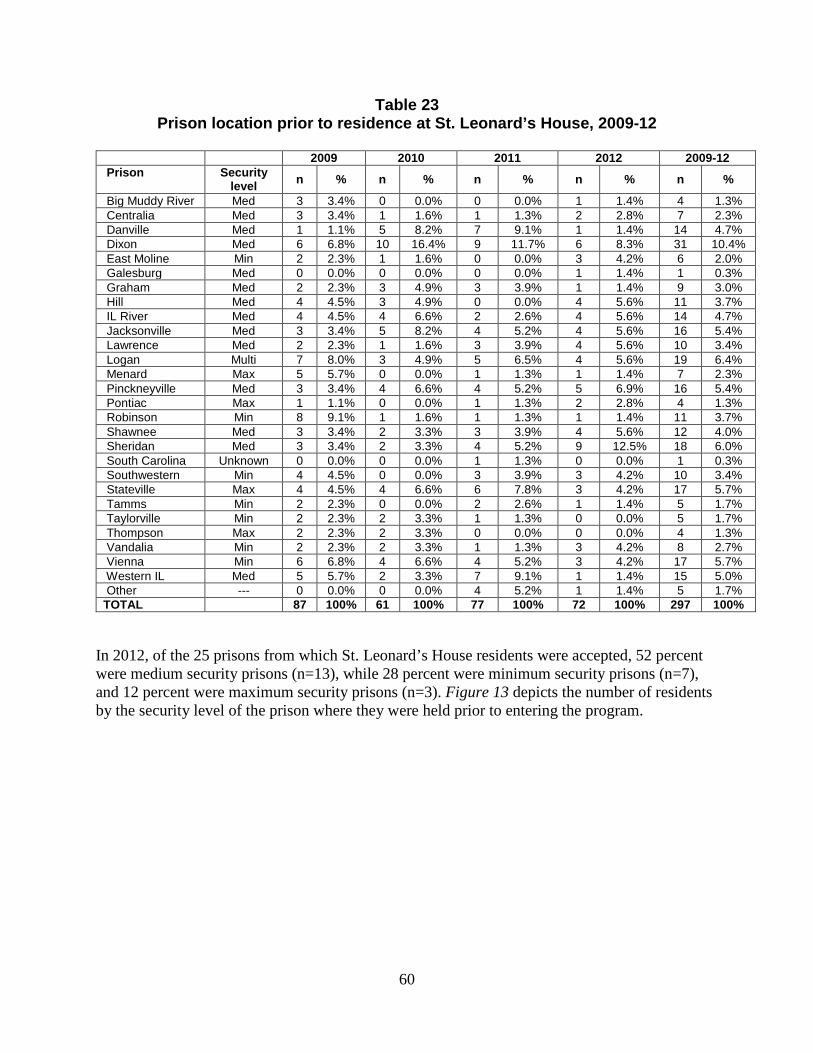
60
Table 23 Prison location prior to residence at St. Leonard’s House, 2009-12
2009 2010 2011 2012 2009-12 Prison Security
level n % n % n % n % n %
Big Muddy River Med 3 3.4% 0 0.0% 0 0.0% 1 1.4% 4 1.3% Centralia Med 3 3.4% 1 1.6% 1 1.3% 2 2.8% 7 2.3% Danville Med 1 1.1% 5 8.2% 7 9.1% 1 1.4% 14 4.7% Dixon Med 6 6.8% 10 16.4% 9 11.7% 6 8.3% 31 10.4% East Moline Min 2 2.3% 1 1.6% 0 0.0% 3 4.2% 6 2.0% Galesburg Med 0 0.0% 0 0.0% 0 0.0% 1 1.4% 1 0.3% Graham Med 2 2.3% 3 4.9% 3 3.9% 1 1.4% 9 3.0% Hill Med 4 4.5% 3 4.9% 0 0.0% 4 5.6% 11 3.7% IL River Med 4 4.5% 4 6.6% 2 2.6% 4 5.6% 14 4.7% Jacksonville Med 3 3.4% 5 8.2% 4 5.2% 4 5.6% 16 5.4% Lawrence Med 2 2.3% 1 1.6% 3 3.9% 4 5.6% 10 3.4% Logan Multi 7 8.0% 3 4.9% 5 6.5% 4 5.6% 19 6.4% Menard Max 5 5.7% 0 0.0% 1 1.3% 1 1.4% 7 2.3% Pinckneyville Med 3 3.4% 4 6.6% 4 5.2% 5 6.9% 16 5.4% Pontiac Max 1 1.1% 0 0.0% 1 1.3% 2 2.8% 4 1.3% Robinson Min 8 9.1% 1 1.6% 1 1.3% 1 1.4% 11 3.7% Shawnee Med 3 3.4% 2 3.3% 3 3.9% 4 5.6% 12 4.0% Sheridan Med 3 3.4% 2 3.3% 4 5.2% 9 12.5% 18 6.0% South Carolina Unknown 0 0.0% 0 0.0% 1 1.3% 0 0.0% 1 0.3% Southwestern Min 4 4.5% 0 0.0% 3 3.9% 3 4.2% 10 3.4% Stateville Max 4 4.5% 4 6.6% 6 7.8% 3 4.2% 17 5.7% Tamms Min 2 2.3% 0 0.0% 2 2.6% 1 1.4% 5 1.7% Taylorville Min 2 2.3% 2 3.3% 1 1.3% 0 0.0% 5 1.7% Thompson Max 2 2.3% 2 3.3% 0 0.0% 0 0.0% 4 1.3% Vandalia Min 2 2.3% 2 3.3% 1 1.3% 3 4.2% 8 2.7% Vienna Min 6 6.8% 4 6.6% 4 5.2% 3 4.2% 17 5.7% Western IL Med 5 5.7% 2 3.3% 7 9.1% 1 1.4% 15 5.0% Other --- 0 0.0% 0 0.0% 4 5.2% 1 1.4% 5 1.7% TOTAL 87 100% 61 100% 77 100% 72 100% 297 100%
In 2012, of the 25 prisons from which St. Leonard’s House residents were accepted, 52 percent were medium security prisons (n=13), while 28 percent were minimum security prisons (n=7), and 12 percent were maximum security prisons (n=3). Figure 13 depicts the number of residents by the security level of the prison where they were held prior to entering the program.
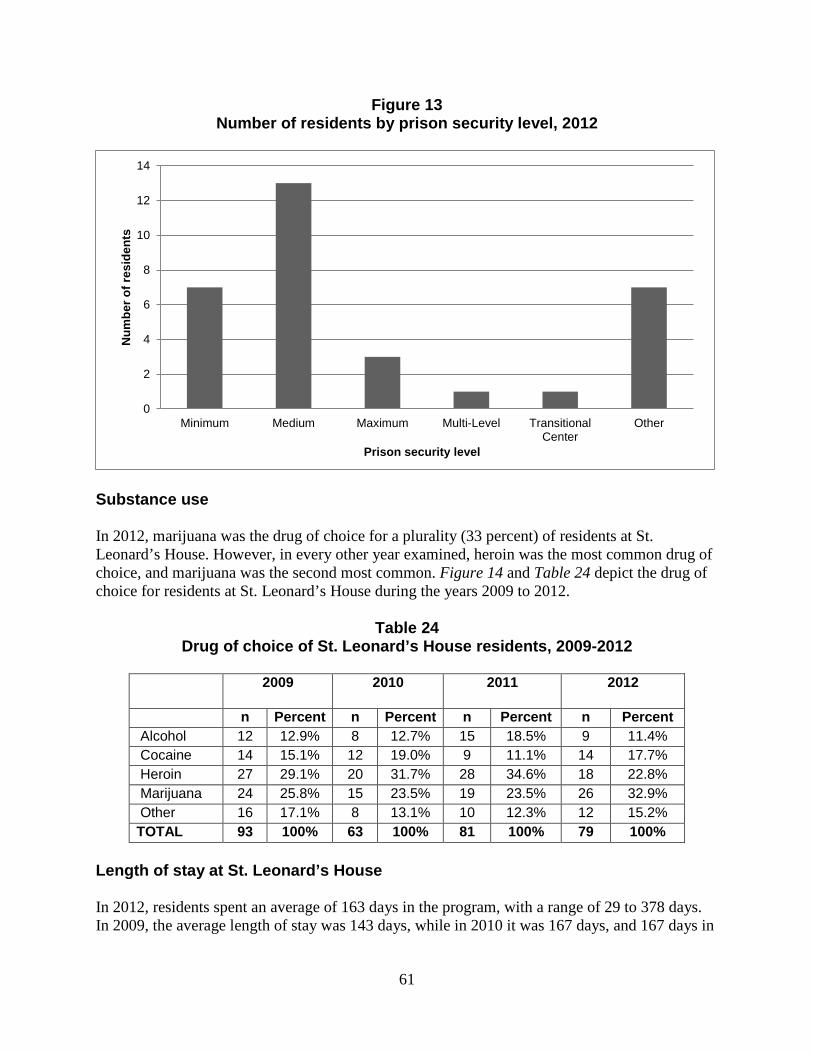
61
Figure 13 Number of residents by prison security level, 2012
Substance use In 2012, marijuana was the drug of choice for a plurality (33 percent) of residents at St. Leonard’s House. However, in every other year examined, heroin was the most common drug of choice, and marijuana was the second most common. Figure 14 and Table 24 depict the drug of choice for residents at St. Leonard’s House during the years 2009 to 2012.
Table 24 Drug of choice of St. Leonard’s House residents, 2009-2012
2009 2010 2011 2012
n Percent n Percent n Percent n Percent Alcohol 12 12.9% 8 12.7% 15 18.5% 9 11.4% Cocaine 14 15.1% 12 19.0% 9 11.1% 14 17.7% Heroin 27 29.1% 20 31.7% 28 34.6% 18 22.8% Marijuana 24 25.8% 15 23.5% 19 23.5% 26 32.9% Other 16 17.1% 8 13.1% 10 12.3% 12 15.2% TOTAL 93 100% 63 100% 81 100% 79 100%
Length of stay at St. Leonard’s House In 2012, residents spent an average of 163 days in the program, with a range of 29 to 378 days. In 2009, the average length of stay was 143 days, while in 2010 it was 167 days, and 167 days in
0
2
4
6
8
10
12
14
Minimum Medium Maximum Multi-Level TransitionalCenter
Other
Num
ber o
f res
iden
ts
Prison security level
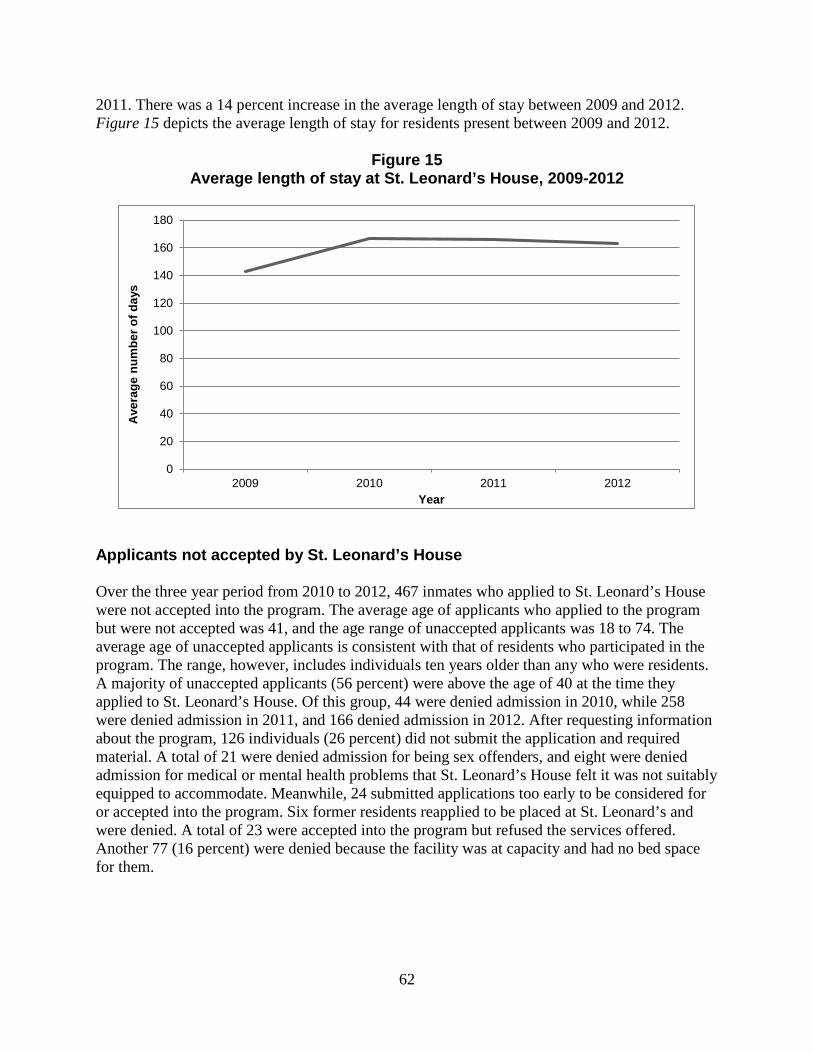
62
2011. There was a 14 percent increase in the average length of stay between 2009 and 2012. Figure 15 depicts the average length of stay for residents present between 2009 and 2012.
Figure 15 Average length of stay at St. Leonard’s House, 2009-2012
Applicants not accepted by St. Leonard’s House Over the three year period from 2010 to 2012, 467 inmates who applied to St. Leonard’s House were not accepted into the program. The average age of applicants who applied to the program but were not accepted was 41, and the age range of unaccepted applicants was 18 to 74. The average age of unaccepted applicants is consistent with that of residents who participated in the program. The range, however, includes individuals ten years older than any who were residents. A majority of unaccepted applicants (56 percent) were above the age of 40 at the time they applied to St. Leonard’s House. Of this group, 44 were denied admission in 2010, while 258 were denied admission in 2011, and 166 denied admission in 2012. After requesting information about the program, 126 individuals (26 percent) did not submit the application and required material. A total of 21 were denied admission for being sex offenders, and eight were denied admission for medical or mental health problems that St. Leonard’s House felt it was not suitably equipped to accommodate. Meanwhile, 24 submitted applications too early to be considered for or accepted into the program. Six former residents reapplied to be placed at St. Leonard’s and were denied. A total of 23 were accepted into the program but refused the services offered. Another 77 (16 percent) were denied because the facility was at capacity and had no bed space for them.
0
20
40
60
80
100
120
140
160
180
2009 2010 2011 2012
Ave
rage
num
ber o
f day
s
Year
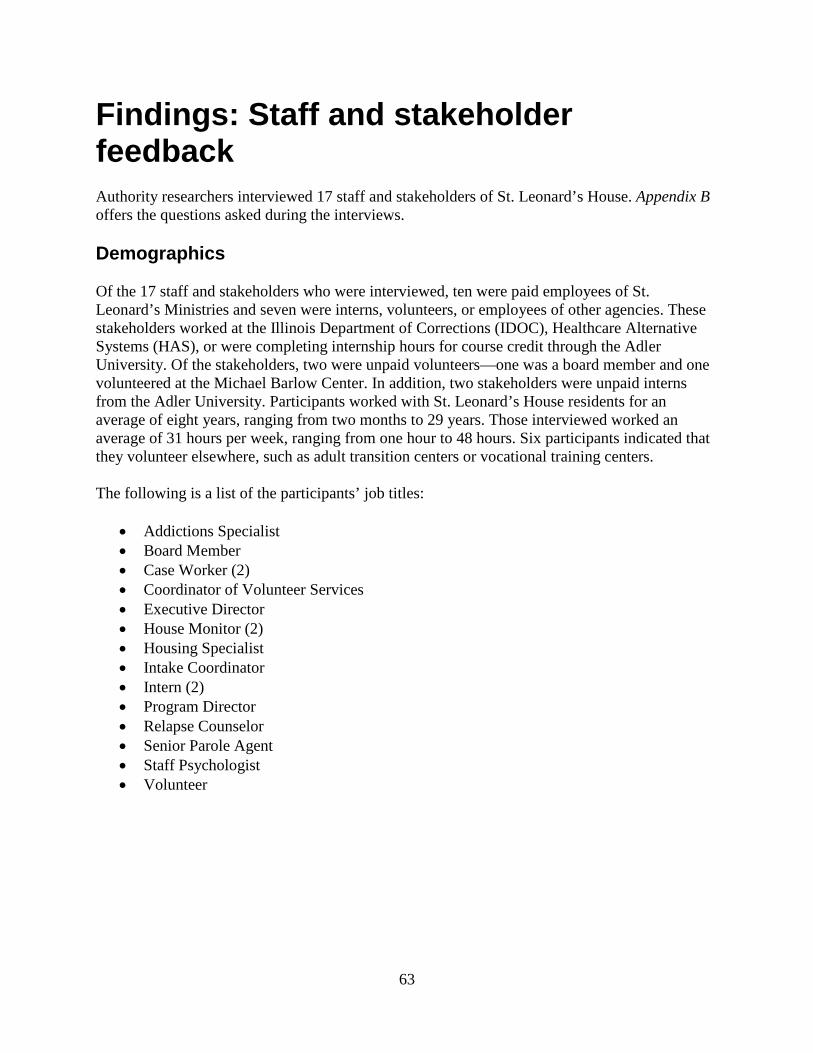
63
Findings: Staff and stakeholder feedback Authority researchers interviewed 17 staff and stakeholders of St. Leonard’s House. Appendix B offers the questions asked during the interviews. Demographics Of the 17 staff and stakeholders who were interviewed, ten were paid employees of St. Leonard’s Ministries and seven were interns, volunteers, or employees of other agencies. These stakeholders worked at the Illinois Department of Corrections (IDOC), Healthcare Alternative Systems (HAS), or were completing internship hours for course credit through the Adler University. Of the stakeholders, two were unpaid volunteers—one was a board member and one volunteered at the Michael Barlow Center. In addition, two stakeholders were unpaid interns from the Adler University. Participants worked with St. Leonard’s House residents for an average of eight years, ranging from two months to 29 years. Those interviewed worked an average of 31 hours per week, ranging from one hour to 48 hours. Six participants indicated that they volunteer elsewhere, such as adult transition centers or vocational training centers. The following is a list of the participants’ job titles:
• Addictions Specialist • Board Member • Case Worker (2) • Coordinator of Volunteer Services • Executive Director • House Monitor (2) • Housing Specialist • Intake Coordinator • Intern (2) • Program Director • Relapse Counselor • Senior Parole Agent • Staff Psychologist • Volunteer
64
The interviewees’ ages ranged from 24 to 69 years old, and the average age was 50. Five were White, eight were Black, and four identified as “other.” One interviewee who reported “other” identified as “African American and Puerto Rican,” another identified as “European American,” and two others identified as “Puerto Rican.” Four participants reported having served in the U.S. military. All staff and stakeholders reported earning a high school diploma/certificate or higher level of education. Three interviewees said that they had earned a bachelor’s degree, and one staff had a GED. One staff reported being a college graduate, and three said they had earned college/vocational credits. Nine respondents reported having earned some graduate/professional credits or having achieved a degree. Six of those interviewed were former residents of St. Leonard’s House, eight had prior felony convictions, and eight had served time in prison. Employment at St. Leonard’s House St. Leonard’s House staff and stakeholders were asked why they decided to work or volunteer at the residential program, and responses varied. Some mentioned being a prior resident of the program and having a vested interest in the program and its goals. One interviewee stated that it was the “only place that gave me a shot.” Another explained that he or she “believes in the mission of the agency,” while another shared that the program “had a lot to offer.” Others saw it as a compliment to their educational background. One person shared that they decided to work at St. Leonard’s House because they felt a sense of “empathy” and wanted to “give back.” Another reported that they felt they “could do more here than [my] other job.” Finally, a few interviewees reported choosing to join St. Leonard’s House because of a referral or assignment to the program or because they responded to a job opening. Staff training St. Leonard’s House staff and stakeholders were asked about any on-the-job training they received after starting in their position. Twelve individuals said that they received training at the start of employment and five did not. Many indicated that they received on-the-job training through “orientation” and “informal questions” or through “shadowing” other employees and interns. A few mentioned that they received training through school. Interviewees were asked about ongoing training on the job. Many mentioned learning through monthly or weekly workshops on a variety of topics, some mentioned seminars and conferences, and one cited “retreats.” Several participants mentioned that they took part in outside training workshops. A few mentioned receiving training through the Adler University. In particular, interns from Adler mentioned that they partake in monthly training meetings as part of their credit requirements, and one said that they have weekly lectures. During the interview, participants were asked about their current training needs. Only three said that they did not have any current training needs. Others mentioned needing training in areas such as family dynamics, knowledge of the current Illinois prison system (in order “to better understand residents”), lectures, conflict resolution, and motivational interviewing. Two participants mentioned that they would benefit from more knowledge on housing and
65
employment programs, and two mentioned that they would like to obtain higher-level degrees or certifications. One person shared that “[e]veryone needs to continue training.” Working at St. Leonard’s House The staff and stakeholders who were interviewed were asked to share the best part of working at St. Leonard’s House. In answer, many reported helping the men achieve their goals and successfully completing the program, while others praised the program model. In addition, the participants spoke about their experience working at the agency and with the staff. Interviewees responded to the question, what is the best part of the job at St. Leonard’s Ministries? in the following ways:
“Exciting to see improvement in the men and women; when you see a former resident who has succeeded.” “Opportunity to work with residents and watch the transition of men.” “When an individual leaves in a better situation than it was when he came, we’ve done our job; person leaves more confident than when he came.”
The following are responses from those who said the best part of the job was the relationships they formed with residents. “It’s like family. Feel like it’s a big family.”
“Working with program participants; Getting to watch them become people they want to be.”
The following are responses from those who said that the best part of the job was the program model at St. Leonard’s House. “Knowing the system here effectively offers services they can’t [get] elsewhere.”
“In an agency where the people are committed to the mission of helping.” “St. Leonard’s House offers many opportunities to help people change their lives. St. Leonard’s does a wonderful job providing an opportunity to correct these things. Provides one of the most important models for survival in America— spiritual, structure services.”
St. Leonard’s House staff and stakeholders were also asked about the worst part of the job. Most reported the worst part as dealing with the residents, especially those who fail. Others cited the program’s financial challenges and the lack of resources for residents. Two interviewees felt that there was no worst part of the job. The following are responses from those who said that the
66
worst part of the job stemmed from difficulties working with the population of men who fail the program. “Seeing people with abilities to change but they don’t see it themselves.”
“Unsuccessful discharging people—rough when people are given lots of chances and just don’t grab on.”
Other participants reported some frustrations with the program’s overall structure. The following are some of the responses indicating such frustrations:
“Structure—lots of different people in charge to see who to talk to regarding certain client needs.” “Getting compliance with policies and procedures, especially by other staff.”
Staff and stakeholders were asked to share the most challenging part of working at St. Leonard’s House. A few cited the residents as the most challenging part of the job, as illustrated in the following responses.
“To influence the guys to show them you have to do all you can. Get them to take every advantage available.” “Forty individuals, different personalities. You are the parent; they are the child. They don't want to give up pride or independence.” “Residents can be manipulative. Not all have for same reason - some just have a place to stay, just passing through. Trying to help someone who doesn’t want to help themselves.”
A few people mentioned a lack of resources as being the worst part of the job. One person stated that there is “always more to be done” and expressed disappointment at “seeing so many people completing the program without jobs to be found,” Others reported challenges arising from the program’s operations. For example, one interviewee said that the main challenge was “financial concerns—so people get paid, stay open to serve people … takes constant resources, grants,” while another interviewee reported that the main challenge was to “continue funds to continue the program. Raise money each year.” A couple of individuals shared that the job demands were the most challenging part of the job. One cited the “caseload—full caseload. Seeing a person each hour and running group.” Another said “[f]inding different and appropriate topics for groups for everyone; may have someone 18 and 65 [years old]. The topics have changed because of culture, family background.” Lastly, one person mentioned that the changing public perception of the population was the most challenging part of the job. The person said that “[h]elping people come to become more enlightened about ex-offenders, public in general, funders, churches, neighbors.”
67
The residential program The staff and stakeholders interviewed were asked to name the main goals of St. Leonard’s House, and the responses differed widely. Securing stable housing for residents was mentioned by five of the staff and stakeholders, while recovery from substance abuse was mentioned by almost as many others. One person said that St. Leonard’s House’s main goal was to give “persons time to focus on issues instead of basics.” Another said that the program helped “equip residents with tools to be independent and have values.” Six interview participants stated that enabling residents to gain education and work were the main goals of the program. For example, one person said that the goal is “education; empowerment; independence—living on [their] own, paying own bills.” Of those interviewed, four individuals indicated that a main goal of St. Leonard’s House was to provide residents with help in dealing with substance abuse issues. Other program goals mentioned included
• offering AA/NA counseling; • providing adequate nutrition; • offering anger management training; • changing value systems and behavior; • supplying clothing; • providing exercise opportunities and access to a computer; • changing mind sets from “old ways to new ways;” • reconnecting residents with their children; • reintegrating residents back into society; and • stabilizing residents.
Staff who decide who will be accepted into St. Leonard’s House described how residents are accepted. One person explained that staff go over intake packages, disciplinary records, mental health status reports, and behavior patterns to determine whether an applicant seems able to complete the program’s goals. When potential residents are interviewed, staff members learn a great deal by asking questions in a specific way to determine the motivations and individual goals of the potential client. St. Leonard’s House staff and stakeholders were asked how they would define successful completion of the residential program. Most provided multiple answers, and, again, responses varied. Nine people stated that successful completion of the program included personal change or growth in the resident. Some mentioned development in self-confidence, morale, and honesty as indicating successful completion. Three staff members defined successful completion in terms of a change in the participant’s criminal thinking and behavior. For example, one staff member stated that residents are “honest enough to admit they were wrong and strong enough to try to make it right.” Another staff member said the program sought to keep residents “off the streets” and “out of the criminal justice system.”
68
Other staff cited the obtaining of employment and securing housing as well as sobriety as indicating successful completion. Seven individuals stated that employment was a part of successful completion of the program, and two mentioned gaining education as an indication of successful completion. Four people said that housing contributed to the success of the program. Two of those interviewed believed that independence determined successful completion. One person explained that residents do not have to “rely on someone else to do all the footwork for them” and “are very serious about the men standing on their own two feet.” Two interviewees stated that being in recovery from substance use and maintaining sobriety indicated successful completion of the program. One person said that a resident should be able to leave “with education, a job, money in the bank, sense of self-worth.” Case managers were asked how the length of stay at St. Leonard’s House is decided. Again, answers varied. One person indicated that the program is a “180 day program. [An] extension granted on need – if [they] have nowhere to go.” A different interviewee mentioned that they “try to transition to alternative housing.” Lastly, one person interviewed said that they “Don't want to kick anyone out, but there is a waiting list.” Religion and spirituality Fifteen of the 17 staff and stakeholders interviewed said that St. Leonard’s House incorporates religion or spirituality into the program. Five of those interviewed stated that religion is not forced on the residents but that it is used in the program. One staff member reported, “It is up to them [participants] to decide if they want it involved in their program.” However, seven said that the program did incorporate spirituality. The following are quotes regarding how the program uses spirituality.
“Spirituality—because more people believe in something greater than themselves—but what it is their choice.” “Spirituality—everyone can lead their own belief; ‘Walk right’.” “Residents initiated conversation on spirituality.”
Some emphasized that religion or spirituality is used in St. Leonard’s House programming. For example, relapse prevention counselors incorporate religion or spirituality in substance abuse recovery groups such as Alcoholics Anonymous (AA) and Narcotics Anonymous (NA); however, one person clarified that it is not a part of the group therapy offered by Adler University. “There is also an adjacent church that participants are granted permission to attend,” one interviewee explained. Finally, two staff mentioned that Healthcare Alternative Systems (HAS) incorporates religion and/or spirituality but that there “should be more.” One interviewee said that the agency was an “Episcopal diocese,” and religion and/or spirituality was “not a part of admissions” and all religions were “respected.” However, this “depends on clients’ needs/interests asked at intake—how they find strength through spirituality,” another interviewee said. Finally, one interviewee stated that participation was voluntary but they did
69
offer “prayer; religious services; bible study; and for church groups to come in and talk with the residents.” Relationships between staff and residents Fourteen of the 17 individuals interviewed said that there are times when there is tension or friction between residents and staff at St. Leonard’s House (one said they did not know). Nine interviewees said that it was the residents who caused the tension or friction. The following responses suggest how residents may cause conflict.
“Residents don't think staff care or like them. Residents and staff may want different things.” “[Residents are] used to acting out; agitated in being controlled; residents may feel rights are impugned.” “Sometimes residents feel staff are assuming role of correctional staff; staff friction— who should or should not be here.”
Three people mentioned that the tension or friction between residents and staff at St. Leonard’s House was a normal feature of the living arrangements and the “nature of congregate living.” A few interview participants said that staff themselves cause friction or tension with residents. A few interviewees suggested that friction or tension stemmed in part from former residents who are now staff. The following are responses from these participants.
“Residents [are] used to doing things one way but when staff tell them to do it another way—[residents] go off.” “Power struggles, especially for individuals who are now staff.”
Finally, one interviewee explained that there is “panic around fifth month. Fear of job interviews.” Two other interviewees said that “clashes of personality” were the cause of tensions or friction. Relationships among residents Thirteen of the 17 individuals interviewed said that there are times when there is tension or friction among residents at St. Leonard’s House (one said they did not know). Five staff and stakeholders mentioned that the tension or friction was due to personality conflicts. The following are responses suggesting that personality conflicts caused tension among residents.
“Differing personalities; people not liking each other.”
“Personality conflicts in residential living and given background history; differing opinions; happens all the time.”
70
Four of those interviewed mentioned that the residential living environment was the cause of friction or tension. The following responses suggest that communal living causes problems among residents.
“Sharing small space with multiple people.” “Congregate living.”
Three St. Leonard’s House staff and stakeholders indicated that missing or stolen items were a cause of friction or tension among residents. Two individuals said that tension was due to background differences and the fact that residents were from different “hoods.” Another said that residents are at “different stages of change.” Finally, one interviewee explained that tension came from “being told what to do; guys can get preachy.” Strongest parts of the program St. Leonard’s House staff and stakeholders were asked to share the strongest part of the program. Twelve mentioned the staff, volunteers, or board members. The following are responses praising the program staff.
“Staff is involved and want what’s best for residents and for them to be successful.” “Sensitivity of staff, volunteers, and board members to issues of reentry and what people go through after prison.”
“Staff is genuinely caring—many want the best for the men and trying to instill a sense of empowerment.”
Six of those interviewed said that the structure and services offered to residents were the strongest parts of the program. Five mentioned the variety of services offered by Healthcare Alternative Systems and the Adler University were its strengths. The following were responses from those interviewed about the program’s services.
"Structure of the program—many tools to help the residents.”
“Comprehensive wraparound; all needs provided for on campus.” “The myriad of services offered to these individuals. Given all the tools—mental health, housing, job skills, physical health, etc.”
Finally, two individuals shared that knowing that two staff members were former residents of the program was the strongest part of the program One interviewee said,
“See former residents working here—understand them [participants] and give hope.”
71
Weakest parts of the program Those interviewed for the St. Leonard’s House evaluation were asked to share what they thought were the weakest part of the residential program. Three individuals felt that the weakest part of the program was the inconsistency and follow-through of policies and procedures by staff. The following responses indicate way to improve consistency.
“Consistency—every employee on the same page on how to deal with issues.”
“Consistency in following the rules by staff; staff give into some residents, some staff not all.”
Two individuals mentioned that a lack of resources was the weakest part of the program. For example, staff and stakeholders mentioned the need for resources including sustainable housing, employment, and technology education. A few staff stated that lack of communication—either between program staff and potential applicants—was a weakness. One person said, “Sometimes lack of communication ideas of what should be done on how program is implemented.” One staff member stated that the greatest weakness of the program was a lack of staff training: “some training [has] nothing to do with job—no one gets anything out of it.” Lastly, one person said that “[a]fter a while there is burn out.” Recommended changes to the program
During the interview, staff were asked to offer any recommendations about how to improve the program. Three of the 17 staff and stakeholders interviewed recommended improving staff unity and defining staff roles. One interviewee said that the program needs to “[c]learly define the roles of each staff position so everyone knows what they are responsible for.” Another person said, “[c]onsistency” is needed in the program. Another staff member shared that there was “too much freedom for the residents.” Three individuals interviewed indicated that there was a need for expanding the facility to provide better housing for residents after their departure from St. Leonard’s House, and that residents should be permitted to extend their stay. However, one staff member mentioned that they would recommend strengthening residents’ “transition into community.” One person urged that more recreational activities be available to the residents. Another staff member stated that there was a need for more “creativity” in the program and suggested an expansion of program services to better prepare the residents for employment. Two staff and stakeholders recommended improving the group sessions. One interviewee admitted that there should be “less in-house groups; cut out some groups; something new than redundant.” Another person said, “more improvement in how groups [are] scheduled, some days not much to do.” One staff member did share that that the program should have a better structure and more groups. Three individuals felt that there was no need for change, but that the program should be open-minded about possible change. One person stated “[e]xcellent program;
72
[p]rovides a lot of good services.” Finally, one person said that he or she would like a similar residential program to be made available to younger people who were formerly incarcerated. Final comments on St. Leonard’s House At the end of the interview, when asked if they had any comments about St. Leonard’s House, several people had positive things to say. The following are some additional responses from the staff and stakeholders.
“Residents have hope for a better life, positive energy.”
"I think St. Leonard’s is a program that works because the people we serve are the same as those running the place.”
“Benefit from having more programs like this”
Conclusions drawn from staff and stakeholder interviews Seventeen staff and stakeholders of St. Leonard’s House were interviewed about the program, the residents, and their jobs. Many did not receive training at the start of employment. Staff reported that the best part of working at St. Leonard’s House was helping residents achieve their goals and successfully complete the program. Some reported frustrations with the program’s overall structure and lack of resources. There was disagreement about the main goals of the program as well as the definition of successful completion of the residential program.
73
Implications for policy and practice Overall, St. Leonard’s House achieved the goals of improving outcomes for residents, reducing recidivism, and increasing employment, thereby impacting public safety. The reincarceration rate of residents was lower than a comparison group. During the evaluation, researchers uncovered areas for improvement and opportunities for expanding the program. In what follows, we suggest ways to enhance the St. Leonard’s House program based on evaluation findings as well as recent literature and research. Improve resident selection process No screening instrument was used when interviewing prospective residents. Admission is based solely on an application and the decision by the St. Leonard’s House Program Director. The Program Director screens, interviews, and admits new residents based on their applications, which indicate their housing status (e.g., whether they are homeless or not), whether they are willing to abstain from drugs and alcohol while in the program, and the degree of their commitment to recovery. The program has limited capacity, so selecting appropriate clients is paramount if the program is to use its limited resources wisely. A comprehensive assessment process can measure an applicant’s readiness for change in seven areas, including basic needs, substance abuse treatment, health care, relationships with family members and children, physical safety, trauma resolution, and mental and emotional needs (O’Brien & Young, 2006). Adopting such a process may provide uniformity and preliminary information to discuss at program interviews with prospective residents, but it need not be the sole determinant of admission. Measure risk, needs, and assets According to the information collected during the evaluation, St. Leonard’s House does not measure client risk, needs, or assets. Risk levels should dictate levels of service which has been shown to decrease re-offending (Andrews & Bonta, 1998; Sperber, Latessa, & Makarios, 2013; Lowenkamp & Latessa, 2005). Prior research on reentry housing has focused on evaluating participant recidivism risk and program quality and has found that participants with higher levels of risk to recidivate are more likely to benefit from reentry housing programs. (The Council of State Governments, n.d.). A client’s needs should also be determined prior to residency to ensure that his or her treatments focus on mitigating major risk factors that can lead to future re-offending. Modified treatments can be an important way to reduce recidivism in clients, especially those individuals considered to be at a high risk for recidivism. By collecting data on each client before he or she enters the program, St. Leonard’s House can determine his or her needs and risk of recidivism, thereby enabling more individualized services.
74
As mentioned, risk proxy scores indicated that St. Leonard’s House was not selecting individuals who would have not recidivated regardless of intervention. However, a risk tool can help ensure higher risk clients are selected for program participation. The Level of Service Inventory–Revised™ (LSI-R) survey is an actuarial risk determination tool that is utilized by probation units in Illinois to help regulate levels of supervision for probationers. The LSI-R scores probationers on a list of different areas of criminogenic risks and needs, allowing probation staff to focus on precise areas for treatment. The tool includes four levels of risk: containment, high, moderate, and low risk. Adopting this risk assessment tool would help residential reentry program staff evaluate recidivism risk in order to determine the specific level of treatment assigned to each individual. Makarios, Sperber, and Latessa (2014) found moderate to high recidivism risk individuals experience decreased recidivism from a more intensive treatment program and lower-risk individuals benefit from a less intensive treatment program. High-risk individuals need at least 300 hours of treatment and low- to moderate-risk clients need 100 to 200 hours of treatment to decrease recidivism (Makarios et al., 2014). In fact, Lowenkamp and Latessa (2005) noted that lower recidivism-risk individual are harmed by increased treatment because characteristics that put them at a low risk for recidivism are disturbed by the interference of treatment. A meta-analysis of 30 studies found that low-risk individuals in halfway house programs had, on average, 17 percent higher recidivism rates compared to high-risk individuals, who experience, on average, a 7 percent decrease in recidivism (Lowenkamp & Latessa, 2005). In addition, St. Leonard’s House can collect information on residents’ assets. Such assets—which are characteristics that decrease the likelihood of recidivism—include family support, previous employment, and education (Muhlhausen, 2010). Rather than a sole focus on a resident’s deficiencies, staff should highlight and foster the strengths and abilities of a resident which will further reduce recidivism (Saleebey, 1996). Measure readiness for change Prior research suggests that a “stages of change” measure can be administered at program intake to help determine an individual’s readiness for change. Examples of these instruments include the University of Rhode Island Change Assessment (URICA) and the Stages of Change Readiness and Treatment Eagerness Scale (SOCRATES-8D) (McConnaughy, Prochaska, & Velicer, 1983; Miller & Tonigan, 1996). The latter instrument focuses on alcohol and drug use and the former instrument is a general test of how susceptible a client is for therapy and rehabilitation. The instrument can also be administered at exit from the program in order to measure change before and after the program.
75
Enhance programming Individualize services The Vera Institute of Justice recommends that programs avoid a one-size-fits-all approach and “individualize reentry service plans for maximum impact” (Sandwick, Tamis, Parsons, & Arauz-Cuadra, 2013, p. 21). Therefore, an individual’s risk, needs, and assets should guide programming. Residents should be engaged in programs that address issues they view as personal priorities, such as employment, housing, and family unification (Sandwick et al.). For more effective treatment, those residents with specific identified needs should receive certain treatment services and be placed in certain treatment groups. Services provided for the residents should be case-specific in order to ensure that they have more profound effects on each client. Staff with expertise in a particular field should be paired with clients whose specific needs are covered by that field. Treatment dosage A resident’s recidivism risk level—low, moderate, or high— should influence the amount or dosage of treatment that he or she receives. Low-level treatment dosage is 0 to 99 hours of treatment, moderate dosage is 100 to 199 hours of treatment, and high dosage is 200 or more hours of treatment (Sperber et al., 2013). The results of Sperber et al.’s study revealed that when dosage rose from a low level to a moderate level, recidivism decreased by 13 percent; recidivism declined by 9 percent when levels were increased from low to high. The study also discovered that recidivism decreased by 24 percent for high-risk clients who received high level dosages. Research indicates that clients with a low risk of recidivism benefit from fewer service referrals and that those with a high risk of recidivism profit from higher service referrals and more intensive treatments. All residents are assigned to the same substance abuse treatment modality—intensive outpatient—regardless of their prior or current substance abuse use, substance abuse diagnosis, current treatment needs, risk of relapse, and assets (such as available support system). Substance abuse is a multifaceted condition, and there is not a single treatment that would appropriately treat everyone. Depending on the type of substance being abused and the characteristics of the patient—services and interventions should match client’s needs (National Institute of Drug Abuse, 2012). In addition, treatments and services should be altered during the course of the treatment to accommodate progress (National Institute of Drug Abuse, 2013). Parenting groups All residents must attend a parenting group regardless of whether they are or are not a parent and regardless of the age(s) of their child or children. As already mentioned, reentry programs need to avoid a one-size-fits-all approach, and this applies equally when addressing the issue of parenting (Sandwick, Tamis, Parsons, & Arauz-Cuadra, 2013). Parents of younger children may have different needs than those of adult children. Children of younger parents are more at risk of abuse and neglect, of developing poor cognitive and behavioral skills, and of being placed in
76
foster care than children of older parents (Center for Law and Social Policy, 2007) and parenting programs often prove more effective for younger parents (Kellermann, Fuqua-Witley, Rivara, & Mercy, 1998). Effective programs for parents who were incarcerated offer education in parenting skills and help prepare parents for the realities of parenting when they return home (Gaynes, 2005). While training in parenting skills is always valuable, it is most effective when paired with counseling, discharge planning, case management, and connections to the child’s other parent (Gaynes, 2005). Lengths of stay In 2012, lengths of stay in St. Leonard’s House ranged from 29 to 378 days. Length of stay in a residential reentry programs should be determined by the level of risk of recidivism (Lowenkamp & Latessa, 2005). Shorter stays for lower-risk residents would provide a more extensive and intensive program for high-risk residents. High-risk residents should also have the opportunity to take advantage of a more intensive and extensive treatment program, while the low-risk clients would benefit from less intensive, basic services. Treatment groups would also be more effective if they were differentiated according to the risk level of members. Low- to moderate-risk residents would profit from placement in groups designed for them, and high risk residents could be placed in groups offering more intensive and extensive service programs. Caseloads Residents would benefit from being assigned to case managers with caseloads based on risk level. Case managers could dedicate more time and services to a smaller caseload of high-risk clients. Case managers could better reduce recidivism by investing more one-on-one time in working with their high-risk clients (Andrews, Bonta, & Hoge, 1990; Lerner, Arling, & Baird, 1986). Living quarters Resident living quarters could benefit from offering risk-level floors. A designated area or floor for high-risk residents could allow staff to provide easier supervision for those individuals. Designating floors or areas for low- to moderate-risk residents could allow staff to provide more effective treatment fand less intensive supervision. Provide vocational training St. Leonard’s House residents most commonly found employment in temporary jobs (e.g., food preparation and serving; transportation and material moving; sales; and installation, maintenance, and repair). Reentry programs often attempt to connect formerly incarcerated individuals to employment programs that are general rather than specific to market demands, but providing trainings in industry-specific areas could enable residents to gain the kind of particularized knowledge that could improve their likelihood of finding employment (Lawrence, Mears, Dubin, & Travis, 2002). For example, Indiana’s Department of Corrections offers employment training in areas identified by the Indiana Department of Workforce Development as in high need of workers (Indiana Department of Corrections, 2000). In particular, the literature and research on
77
employment outcomes suggest that it would be beneficial to focus vocational training on transportation and material moving occupations, food preparation and serving occupations, and office and administrative support occupations (Illinois Department of Employment Security, 2012). Increase resident autonomy Residents with lower risk levels of recidivism could benefit from more privileges (Lowenkamp & Latessa, 2005). Decreased supervision would allow low-risk residents to continue to nurture important ties with their families, gain or keep employment, and increase their sense of independence, thereby enabling them to make smoother transitions. Urban Institute’s Best Practices for Reentry Programs recommends that individuals make a gradual transition from the institutional structure of prison to an open schedule. The Corporation for Supportive Housing (2009) proposes that tenants be given the ability “to determine the specific services in which they wish to participate, or decline to participate” (p. 26) and residents should also be “involved in the design, development, and implementation of their individualized service plans” (p. 26). Since St. Leonard’s House is designed as a stepping-stone for independent living, it may be helpful for residents to be given increased freedom to make decisions concerning their treatment and daily schedules. One suggestion is for residents progressing through the program in stages in a way that allows them to earn privileges and responsibilities. This may provide residents with more autonomy, self-confidence, and greater schedule flexibility. Enhance the effectiveness of case management Training for staff and volunteers Five interviewed staff reported no prior formal training for their jobs. Meanwhile, staff mentioned needs for training in the areas of family dynamics, conflict resolution, motivational interviewing, and housing and employment programs. Staff also wished for better knowledge of the Illinois prison system, and better didactic training. Case managers should be trained to use evidence-based practices to
• model prosocial attitudes and behaviors, including healthy communication practices and problem-solving skills, in their interactions with formerly incarcerated individuals;
• promote skill acquisition and effective problem solving through structured exercises and repeated opportunities to practice the skills;
• use reinforcers and incentives consistently and generously; • use disapproval and punishment wisely and selectively; • maintain an authoritative, but not authoritarian, posture; and • assume the role of advocate and fair broker (Burke, Herman, Stoker, & Giguere, 2010).
78
The Corporation for Supportive Housing (2009) recommends the ongoing training of staff members of supportive housing units. It suggests that staff should receive training relevant to their roles and responsibilities, including in the areas of
• program house rules and resident rights; • the confidentiality of resident’s information (including what can be shared with other
staff); • grievance policies and procedures; • requirements for mandated reporting of residents who may harm themselves or others; • community-building and supporting residents; • reasonable accommodations and reasonable modifications, the Americans with
Disabilities Act, and Section 504 of the Rehabilitation Act; and • other applicable local, state, and federal laws, regulations, and standards.
Volunteer management practices are important in ensuring a successful program. Volunteers have varied level of knowledge and skills, which makes training very helpful (Zischka & Jones, 1987). Volunteer training has been shown to predict the amount of time volunteers dedicate to their service, and it is also linked to retention and overall satisfaction (Hidalgo & Moreno, 2009; Jamison, 2003; Tang, Choi, & Morrow-Howell, 2010). Six of those interviewed were former residents of St. Leonard’s House. While there are benefits to hiring former residents—for example, doing so empowers them, makes use of their unique insights, and helps provide role models to current residents—boundary issues may occur if and when such staff disclose their former program participation (Reamer, 2013). A few interviewees mentioned that there were power struggles between residents and staff who were former residents. Case managers should maintain clear and appropriate boundaries in relationships with clients (Reamer, 2013) while still engaging and motivating clients (Burke, Herman, Stoker, & Gigure, 2010). Motivational interviewing techniques Interviews revealed that staff care about residents and are sensitive to their issues and needs. However, staff effectiveness could be enhanced if they practiced motivational interviewing (MI) when working with residents. The Urban Institute’s Best Practices for Reentry emphasize the importance of motivating residents, leading residents to envision new roles and self-concepts, and nurturing their commitment to change. MI is considered an evidenced-based practice, and research has found that this kind of case management style is effective in facilitating change among clients (National Institute of Corrections, 2012). In fact, the U.S. Department of Justice recommends that its employees utilize motivational interviewing when working with released populations because it “can help increase offenders’ motivation to make positive changes in their lives that will reduce their likelihood of reoffending” (Walters, Clark, Gingerich, & Meltzer, 2007, p. vii). Motivational interviewing was mentioned as a training need by staff. MI is a form of collaborative conversation for strengthening motivation and commitment to change in individuals. MI is a method to make change within an atmosphere of acceptance and compassion. MI embraces three core aims: collaboration (or fostering a partnership between the
79
resident and practitioner); evocation (or eliciting the resident’s internal motivation, as opposed to telling the resident why he or she should change); and autonomy (or leading the resident to acknowledge that he or she has the ability to determine how he or she will act). MI strategies include the following practices:
• Open-ended questions: probe for more information; help understand a client’s priorities and values;
• Reflective listening: mirror what the client says, communicate acceptance of a client as he or she is while offering support in the process of change; avoid advising, moralizing, suggesting, directing, or persuading; be non-threatening;
• Affirmation: support the client, demonstrate respect and understanding, encourage more progress;
• Summarize: reflect back to the client, show understanding, and clarify any misunderstanding;
• Elicit self-motivational statements: help the client make change statements; and • Roll with resistance: use reflective listening and understand and use empathy.
The National Institute of Corrections offers several free resources and guides on using MI with reentry clients. Change residents’ criminal thinking Three St. Leonard’s House staff members reported that successfully completing the program requires experiencing a change in criminal thinking and behavior. This can be achieved by incorporating the “Thinking for a Change” program (T4C), which helps clients take command of their own lives and through cognitive behavioral training, social skills improvement, and problem-solving techniques (Bush, Glick, & Taymans, 2011). Analyses of the T4C program suggest that this program diminishes the incidence of recidivism among those who participate in it (Lowenkamp & Latessa, 2005). The National Institute of Corrections (NIC) established the T4C curriculum, which consists of lesson plans, facilitator notes, video clips, and slides that are available free of charge. Most sessions include educational instruction, role-play illustrations of concepts, a review of previous lessons, and homework assignments, in which participants practice the skills learned in group lessons. Group facilitators do not need a specific education level or certification to lead the curriculum; however, NIC does offer certification and training for interested T4C facilitators. The curriculum includes 25 lessons designed to be presented to a select group of individuals by a pair of group facilitators in approximately one to two hours. Lessons contain the following elements:
• making introductions; • using active listening; • giving feedback; • knowing your feelings; • considering how thinking controls
our behavior;
• paying attention to our thinking; • recognizing risk; • using new thinking; • thinking check-in; • understanding the feelings of others; • making a complaint;
80
• apologizing; • responding to anger; • negotiating; • introducing problem solving; • stopping and thinking; • stating a problem; • setting a goal and gather
information;
• practicing problem solving skills; • thinking of choices and
consequences; • making a plan; • doing and evaluating; • applying problem solving; and • developing next steps. (National
Institute of Justice, n.d.). Thinking for a change was incorporated in to the St. Leonard House’s core programming (E. Meyer, personal communication, November 14, 2016. Liaison with external agencies Two staff said that they would benefit from more knowledge about housing and employment programs. One staff member could serve as the liaison between St. Leonard’s House and outside agencies in order to compile and maintain a referral list of external programs offering housing and employment services. Improve communication Communication among administration, staff, volunteers, and interns A few staff members stated that communication among staff was a weakness. The program may consider adding team-building exercises to form staff unity, improve working relationships, and strengthen communication among staff. In interviews, staff disagreed about the goals of the program and the criteria for successful completion of the program. In addition, a few interviewed staff reported inconsistencies in the enforcement of policies and procedures by staff members. Communication should be strengthened in order to keep staff unified and in agreement about what St. Leonard’s House is trying to accomplish. Communication with residents Three individuals felt that the weakest part of the program was the inconsistency with enforcement of policies and procedures by staff. The program should improve lines of communication between staff and administrators regarding policies and procedures. It should also explain decisions related to intake and sanctions while clearly defining the roles of each staff member and improving the transparency of operations of the agency. A Corporation for Supportive Housing (CSH) report (2009) suggests that supportive housing tenants should have a clear understanding of the options, rights, and responsibilities accorded to them by their individualized services plans. In the same way that new residents are screened, a council or group of designated staff (and residents) could review violations of rules to determine next steps. Some residents were also concerned that not all chores were completed on time. Although staff are charged with
81
monitoring assigned tasks, this process could be improved by assigning different residents to oversee chores each week and by establishing a response if residents fail to complete assigned chores. Additionally, quarterly meetings with each resident may be helpful in addressing residents’ changing needs and concerns. Marketing the program St. Leonard’s Ministries has a website and Facebook page and at times garners media attention, but the program could further publicize milestones, events, successes, information about its work and staff, and other noteworthy items. In addition, the program could highlight findings contained in this series of evaluations. Other avenues of social media could be explored, including Twitter and YouTube (Rakis, n.d.). Better publicizing its work could enable St. Leonard’s House to achieve additional grant funding, donations, and volunteers. Collect data for quality improvement During the course of the St. Leonard’s House evaluation, researchers had access only to limited data on residents. In order to improve its program, St. Leonard’s House should continuously collect data on clients. Data needs to be collected on those who apply to the program but are not accepted in order to make possible future evaluations requiring treatment and comparison groups. The intermediate goals of the program should also be measured. Periodic pre- and post-assessments can measure reductions in resident recidivism risk levels, increased readiness for change, and reduced criminal thinking. An important component of program success concerns future outcomes of clients. Long-term success can be monitored by continuing to follow-up with clients after they leave the program. In order to continuously assess clients’ outcomes, a set of specific characteristics relating to the goals of the program should be tracked. For example, St. Leonard’s House could track the number of times clients recidivate, their recidivism risks, their employment outcomes, and their levels of sobriety (Lampkin & Hatry, 2003). During the program, clients can be notified of the need for follow-up information. To gain participation, the program can offer incentives and ask for up-to-date contact information from former residents (Nayyar-Stone & Hatry, 2003). By continuing communication with former residents, staff can encourage them to avoid previously problematic behaviors while reinforcing positive learned behaviors (Nayyar-Stone & Hatry). In order to collect the data, the program can conduct a short follow-up interview. Collecting outcome data allows for potential analysis and improvement of the program. In addition, the evaluation uncovered little evidence of quality assurance, assessment, or improvement. According to Domurad and Carey (2010), effective reentry programs require continuous quality improvement and assurance in the areas of assessment, case planning, the application of cognitive-behavioral techniques, and motivational interviewing. An in-house researcher could collect, manage, and analyze the data necessary for continuous feedback; program and performance measurement; and quality improvement (Derrick-Mills,

82
2014; Sanger, 2008). Data would also be available for use in applications for grants and other funding opportunities. An Evidence Based Correctional Program Checklist can help programs evaluate their use of evidence-based practices (Latessa, Lovins, & Smith, 2010). Program management and progress are measured and staff are evaluated on training and skills, on their success as supervisors, and on their outlook.
83
Conclusion This report, the third in the series for the St. Leonard’s Ministries evaluation, focuses on St. Leonard’s House, a voluntary residential prisoner reentry program for men. Based on program data, St. Leonard’s House accepted an average of 79 residents per year. In 2012, the average age for a resident at St. Leonard’s House was 40 years old and three fourths of residents were Black. Residents spent an average of 163 days in the program. The sample that was studied included 246 individuals who applied to St. Leonard’s House: 119 who were accepted as residents and who formed the resident group, and 127 who were not accepted and who formed the comparison group. Of the St. Leonard’s House resident group, 48 percent had rearrests, 19 percent had reconvictions, and 16 percent were reincarcerated. Of the comparison group, 63 percent had rearrests, 29 percent were reconvicted, and 37 percent were reincarcerated. Program residents were 38 percent less likely to be rearrested and 62 percent less likely to be reincarcerated than members of the comparison group. Residents also displayed longer times to reincarceration—13 months compared to 9 months. Finally, residents were more likely to find employment— over the course of the two years examined, 50 percent found employment compared to 13 percent of the comparison group—and residents earned an average of about $5,000 more than members of the comparison group. St. Leonard’s House residents had an average of nine prior convictions and three prior incarcerations. Relationships were found between all three outcomes (rearrest, reconviction, and reincarceration) and the following resident characteristics: prior arrests, prior felony arrests, prior incarcerations, time served in prison, the offense for which they were in prison at the time of application to the program, and whether that offense was violent. Length of stay at St. Leonard’s House and recidivism-risk level were associated with at least two of the three outcome measures. Seventeen St. Leonard’s House staff and stakeholders were interviewed. Many did not receive training at the start of employment. Staff reported that the best part of working at St. Leonard’s House was helping residents achieve their goals and successfully complete the program. Some staff stated that the weakest part of the residential program was inconsistency of rule enforcement by staff. Based on evaluation findings, researchers recommend that St. Leonard’s House measure the risks, needs, and assets of incoming residents. The program should use a group-decision process for admissions, rather than relying on one intake staff member, and it should offer a probationary period. Researchers suggest offering individualized case plans to guide treatment, determine lengths of stay, govern group/service participation, make case manager assignments, assign living quarters, and respond to employment needs. St. Leonard’s House can increase resident autonomy by allowing residents to earn privileges and reduced restrictions, and by giving them some choice in service participation. Researchers recommend training for staff and volunteers in evidence-based practices. In addition, researchers suggest improving communication among administration, staff, volunteers, and interns, as well as communication among residents. St. Leonard’s House should further

84
market its program and its many successes. Finally, researchers suggest that the program collect data for quality improvement and future evaluation.
85
References Akers, R.L. (1973). Deviant behavior: A social learning approach. Belmont, CA: Wadsworth. Albright, S., & Denq, F. (1996). Employer attitudes toward hiring ex-offenders. The Prison
Journal, 76(2), 118-137. Allison, P. D. (2010). Survival analysis. In G.R. Hancock & R. O. Mueller (Eds.), The reviewer’s
guide to quantitative methods in the social sciences (pp. 413-425). New York: Routledge. Andrews, D. A., & Bonta, J. (1998). The psychology of criminal conduct (2nd ed.). Cincinnati,
OH: Anderson. Andrews, D., Bonta, J., & Hoge, R. (1990). Classification for effective rehabilitation:
Rediscovering psychology. Criminal Justice and Behavior, 17(1), 19-52. Anglin, M., & Hser, Y. (1987). Addicted women and crime. Criminology, 25 (2), 359-394. Aufderheide, D. H., & Brown, P. H. (2005). Crisis in corrections: The mentally ill in America’s
prisons. Corrections Today, 67(1), 30-33. Bandura, A. (2000). Self-efficacy. In A. Kazdin (Ed.), Encyclopedia of psychology (pp. 212-
213). New York, NY: Oxford University Press. Blumstein, A., & Beck, A. J. (1999). Population growth in U.S. prisons 1980-1996. Crime and
Justice, 26, 17-61. Box, S. (1987). Recession, crime, and punishment. Totowa, NJ: Barnes & Noble Books. Bradley, K. H., Oliver, R. B. M, Richardson, N. C., & Slayter, E. M. (2001). No place like home:
Housing and the ex-prisoner. Boston, MA: Community Resources for Justice. Burke, P., Herman, P., Stroker, R., & Giguere, R. (2010). TPC case management handbook: An
integrated case management approach. Silver Spring, MD: Center for Effective Public Policy.
Bush, J., Glick, B., & Taymans, J. (2011). Thinking for a change: Integrated cognitive behavior
change program. Washington, DC: U.S. Department of Justice, National Institute of Corrections.
Bureau of Justice Statistics (n.d.). Data analysis tools. Retrieved from http://www.bjs.gov/index.cfm?ty=daa.
86
Bureau of Justice Statistics. (2014). 3 in 4 former prisoners in 30 States arrested within 5 years of release [Press release]. Retrieved from http://www.bjs.gov/content/pub/press/rprts05p0510pr.cfm.
Carson, A. E., & Sabol, W.J. (2012). Prisoners in 2011. Washington, DC: U.S. Department of
Justice, Office of Justice Programs, Bureau of Justice Statistics. Center for Law and Social Policy. (2007). Early head start and teen parent families:
Partnerships for success. Retrieved from http://www.clasp.org/admin/site/publications_archive/files/0210.pdf.
Chelune, E. N. (2011). Mental illness in the justice system: Communication and HIPPA
compliance. Prepared for Cuyhoga County Mental Health Court Initiative. Clark, L. M. (2007). Landlord’s attitudes toward renting to released offenders. Federal
Probation 71(1), 20-30. Cloyes, K. G., Wong, B., Latimer, S., & Abarca, J. (2010). Time to prison return for offenders
with serious mental illness released from prison: A survival analysis. Criminal Justice and Behavior, 37(2), 175-187.
Corporation for Supportive Housing (CSH). (2009). The seven dimensions of quality for
supportive housing. Retrieved from http://www.csh.org/wp-content/uploads/ 2011/12/Report_DoQIndicators.pdf.
Cortes, K., & Rogers, S. (2010). Reentry housing options: The policymakers’ guide. New York:
Council of State Governments Justice Center.
The Council of State Governments, Justice Center, National Reentry Resource Center. (n.d.) What works in reentry clearinghouse: Housing. Retrieved from https://whatworks.csgjusticecenter.org/focus-area/housing.
Cossyleon, J.E., & Reichert, J. (2015). Women and reentry: Evaluation of the St. Leonard’s
Ministries’ Grace House program. Chicago, IL: Illinois Criminal Justice Information Authority.
Derrick-Mills, T. (2014). Data use for continuous quality improvement: What the Head Start
field can learn from other disciplines A literature review and conceptual framework. OPRE Report # 2014-77. Washington, DC: U.S. Department of Health and Human Services, Office of Planning, Research and Evaluation, Administration for Children and Families.
Domurad & Carey (2010). Implementing evidence-based practices. Washington DC: U.S.
Department of Justice, Office of Justice Programs, Bureau of Justice Assistance, Center for Effective Public Policy. Retrieved from http://www.reentrycoalition.ohio.gov/docs/initiative/coaching/Implementing%20Evidence%20Based%20Practices.pdf
87
Durose, M. R., Cooper, A.D., & Snyder, H. N. (2014). Recidivism of prisoners released in 30 states in 2005: Patterns from 2005 to 2010. Washington, D.C: Bureau of Justice Statistics, Office of Justice Programs, U.S. Department of Justice.
Durose, M. R., & Mumola, C. J. (2004). Profile of nonviolent offenders exiting state prisons.
Washington, DC: U.S. Department of Justice. Esbensen, F. A., & Huizinga, D. (1993). Gangs, drugs, and delinquency in a survey of urban
youth. Criminology, 31(4), 565–589. Fazel, S., Bains, P., & Doll, H. (2004). Substance abuse and dependence in prisoners: A
systematic review. Addiction, 101, 181-191. Flannery, D. J. (2004). Opportunity, provision, and best practice. In J. L. Krienert & M. S.
Fleisher (Eds.), Crime and employment: Critical issues in crime reduction for corrections. (pp. 169-176). Willow Creek, CA: AltaMira Press.
Fondacaro, K. M., Holt, J. C., & Powell, T. A. (1999). Psychological impact of childhood sexual
abuse on male inmates: The importance of perception. Childhood Abuse and Neglect, 23(4), 361-369.
Gaynes, E. (2005). Reentry: Helping former prisoners return to communities: A guide to key
ideas, effective approaches, and technical assistance resources for making connections cities and site teams. Baltimore, MD: The Annie E. Casey Foundation.
Gouvis-Roman, C., & Travis, J. (2004). Taking stock: Housing, homelessness, and prisoner
reentry. Washington, DC: Urban Institute. Retrieved from http://www.urban.org/ UploadedPDF/411096_taking_stock.pdf.
Graffam, J., Shinkfield, A., Lavelle, B., & McPherson, W. (2008). Variables affecting successful
reintegration as perceived by offenders and professionals. Journal of Offender Rehabilitation, 40(1-2), 147-171.
Gever, M. (2007). Prisoner reentry and lack of substance abuse treatment coverage.
Washington, DC: National Conference of State Legislators. Guerino, P., Harrison, P.M., & Sabol, W.J. (2011). Prisoners in 2010. U.S. Department of
Justice, Office of Justice Programs, Bureau of Justice Statistics. Gunnison, E., & Helfgott, J. B. (2011). Factors that hinder offender reentry success: A view from
community correction officers. International Journal of Offender Therapy and Comparative Criminology, 55(2), 287-304.
Harding, A., & Harding, J. (2006). Inclusion and exclusion in the re-housing of former prisoners.
The Journal of Community and Criminal Justice, 53(2), 137-153.
88
Harlow, C. W. (2003). Education and correctional populations. Washington, DC: U.S. Department of Justice, Office of Justice Programs, Bureau of Justice Statistics.
Harrison, L. & Gfroerer, J. (1992). The intersection of drug use and criminal behavior: Results
from the national household survey on drug abuse. Crime & Delinquency, 33(4), 422-433. Hattery, A., & Smith, E. (2010). Prisoner reentry and social capital: The long road to
Reintegration. Lanham, MD: Lexington Books. Henderson, M. L. (2001). Employment and crime: From the inmate’s perspective. In J.L.
Krienert and M.S. Fleisher (Eds.), Crime and employment: Critical issues in crime reduction for corrections. (pp. 84-94). Walnut Creek, CA: AltaMira Press.
Hepburn, J. R., & Albonetti, C. A. (1994). Recidivism among drug offenders: A survival analysis
of the effects of offender characteristics, type of offense, and two types of intervention. Journal of Quantitative Criminology, 10(2), 162.
Hidalgo, M. C., & Moreno, P. (2009). Organizational socialization of volunteers: The effect on
their intention to remain. Journal of Community Psychology, 37(5), 594-601. Holzer, H. J., Raphael, S., & Stoll, M. A. (2003). Understanding the nexus between prisoner
reentry and work: Employment barriers facing ex-offenders. Urban Institute Reentry Roundable. New York University Law School. Retrieved from http://www.urban.org/ UploadedPDF/410855_holzer.pdf.
Holzer, H. J., Raphael, S., & Stoll, M. A. (2004). Will employers hire ex-offenders: Employer
preferences, background checks, and their determinants. In M. Pattillo, D. Weiman, & B. Western (Eds.), Imprisoning America: The Social Effects of Mass Incarceration (pp. 205– 246). New York: Russell Sage.
Hsieh, C. C., & Pugh, M. D. (1993). Poverty, income inequality, and violent crime: A meta-
analysis of recent aggregate data studies. Criminal Justice Review, 18(2), 182-202. Huff, C. R. (1998). Comparing the criminal behavior of youth gangs and at-risk youths.
Washington, DC: U.S. Department of Justice, Office of Justice Programs, National Institute of Justice.
Illinois Department of Corrections. (2010). IDOC Annual Report. Retrieved from
http://www2.illinois.gov/idoc/reportsandstatistics/DocumentsFY10_DOC_Annual_Rpt.pdf.
Illinois Department of Employment Security. (2012). Employment projections. Retrieved from
http://www.ides.illinois.gov/LMI/Pages/Employment_Projections.aspx. Indiana Department of Corrections. (2000). FY00 Education Services Division annual report.
Indianapolis, IN: Indiana Department of Corrections, Education Services Division.
89
Indig, D., Topp, L., Ross, B., Mamoon, H., Border, B., Kumar, S., & McNamara, M. (2009). 2009 NSW Inmate health survey: Key findings report. Sydney: Justice Health.
James, D. J. (2004). Profile of jail inmates, 2002. Washington, DC: U.S. Department of Justice,
Office of Justice Programs, Bureau of Justice Statistics. James, D. J., & Glaze, L. E. (2006). Mental health problems of prison and jail inmates.
Washington, DC: U.S. Department of Justice, Office of Justice Programs, Bureau of Justice Statistics.
James, N. (2015). Offender reentry: Correctional statistics, reintegration into the community,
and recidivism. Washington, DC: Congressional Research Service. Jamison, I. B. (2003). Turnover and retention among volunteers in human service agencies.
Review of Public Personnel Administration, 23(2), 114-132. Jensen, E. L., & Reed, G. E. (2006). Adult correctional education programs: An update on
current status based on recent studies. Journal of Offender Rehabilitation, 44(1), 81-98. Johnson, R. J., Ross, M. W., Taylor, W. C., Williams, M. C., Carvajal, R. I., & Peters, R. J.
(2005). A history of drug use and child sexual abuse among incarcerated males in county jail. Substance Use & Misuse, 40, 211-229.
Johnson, B. R., Larson, D. B., & Pitts, T. C. (1997). Religious programs, institutional
adjustment, and recidivism among former inmates in prison fellowship programs. Justice Quarterly, 14(1), 157.
Karberg, J.C., & James, D. J. (2005). Substance dependence, abuse, and treatment of jail
inmates, 2002. Washington, DC: U.S. Department of Justice, Office of Justice Programs, Bureau of Justice Statistics.
Kellermann, A. L., Fuqua-Witley, D. S., Rivara, F. P., & Mercy, J. (1998). Prevention youth
violence: What works? Annual Review of Public Health, 12, 17-40. Krohn, M. D., & Thornberry, T. P. (2008). Longitudinal perspectives on adolescent street gangs.
In A. Liberman (Ed.), The long view of crime: A synthesis of longitudinal research (pp. 128-160). New York: Springer.
Kubrin, C. E., Squires, G., & Stewart, E. (2007). Neighborhoods, race, and recidivism: The
Community reoffending nexus and its implications for African Americans. In SAGE Race Relations Abstracts, 32(1), 7-37.
Lamb, H. R., & Weinberger, L. E. (1998). Persons with severe mental illness in jails and prisons:
A review. Psychiatric Services, 49(4), 483-492. Lampkin, L., & Hatry, H. (2003). Key steps in outcome management. Washington, DC: Urban
Institute.
90
Langan, P. A., & Levin, D. J. (2002). Recidivism of prisoners released in 1994. Washington, DC: U.S. Department of Justice, Office of Justice Programs, Bureau of Justice Statistics.
Latessa, E.J., Lovins, L.B., & Smith, P. (2010). Follow-up evaluation of Ohio's community based
correctional facility and halfway house programs – Outcome study. Cincinnati, OH: University of Cincinnati.
La Vigne, N. G., Mamalian, C. A., Travis, J., & Visher, C. (2003). A portrait of prisoner reentry
in Illinois. Washington, DC: The Urban Institute. La Vigne, N. G., Visher, C., & Castro, J. (2004). Chicago prisoners’ experiences returning home.
Washington, DC: Urban Institute. Retrieved from http://www.urban.org/UploadedPDF/311115_ChicagoPrisoners.pdf.
Lawrence, S., Mears, D. P., Dubin, G., & Travis, J. (2002). The practice and promise of prison
programming. Washington, DC: The Urban Institute. Leavitt, S. D., & Venkatesh, S. A. (2001). An analysis of the long-run consequences of gang
involvement. Paper presented at the 2001 Harvard Inequality Summer Institute, Harvard University.
Lee, D. Y., & Holoviak, S. J. (2006). Unemployment and crime: An empirical investigation.
Applied Economics Letters, 13, 805-810. Lerner, K., Arling, G., & Baird, C. (1986). Client management classification: Strategies for case
supervision. Crime and Delinquency, 32, 254–271. Levingston, K. D., & Turetsky, V. (2007). Debtors prison—Prisoners’ accumulation of debt as a
barrier to reentry. Journal of Poverty Law and Policy, 187-197. Lochner, L., & Moretti, E. (2004). The effect of education on crime: Evidence from prison
inmates, arrests, and self-reports. American Economic Review, 94, 155-189. Lowenkamp, C. T., & Latessa, E. J. (2005). Developing successful reentry programs: Lessons
learned from the “what works” research. Corrections Today, 67(2), 72-77. Logan, W. A. (2007). Constitutional collectivism and ex-offender residence exclusion zones.
University of Iowa College of Law, Iowa Law Review, 92(1), 1-40. Lurigio, A. J., Rollins, A., & Fallon, J. (2004). The effects of serious mental illness on offender
reentry. Federal Probation, 68(2), 45-52. Lynch, J. P., & Sabol, W. J. (1997). Crime Policy Report No. 1: Did getting tough on crime pay?
Washington, DC: The Urban Institute.
91
Lynch, J. P., & Sabol, W. J. (2001). Prisoner reentry in perspective. Washington, DC: The Urban Institute.
Lynch, J. P., Smith, S. K., Graziadei, H. A., & Pittayathikhun, T. (1994). Profile of inmates in
the United States and in England and Wales, 1991. Washington, DC: U.S. Department of Justice, Office of Justice Programs, Bureau of Justice Statistics.
Makarios, M. D., Sperber, K. G., & Latessa, E. J. (2014). Treatment dosage and the risk
principle: A refinement and extension. Journal of Offender Rehabilitation, 53, 334-350. Mallik-Kane, L., & Visher, C. A. (2008). Health and prisoner reentry: How physical, mental,
and substance abuse conditions shape the process of reintegration. Washington, DC: The Urban Institute.
Mauer, M., & Chesney-Lind, M. (2002). Invisible punishment: The collateral consequences of
mass imprisonment. Washington, DC: New Press. McConnaughy, E. N., Prochaska, J. O., & Velicer, W. F. (1983). Stages of change in
psychotherapy: Measurement and sample profiles. Psychotherapy: Theory, Research and Practice, 20(3), 368-375.
Mellow, J., Christensen, G. E., Warwick, K., & Buck Willison, J. (2014). Transition from jail to
community implementation toolkit. Washington, DC: The Urban Institute. Merrall, E. L. C., Karimina, A., Ninswanger, I. A., Hobbs, M. S., Farrell, M., Marsden, J.,
Hutcinson, S. J., & Bird, S. M. (2010). Meta-analysis of drug-related deaths soon after release from prison. Addiction, 105(9), 1545-1554.
Miller, W. R., & Tonigan, J. S. (1996). Assessing drinker’s motivation for change: The Stages of
Change Readiness and Treatment Eagerness (SOCRATES). Psychology of Addictive Behaviors, 10(2), 81-89.
Mock, L. (2016). The impact of employment restriction laws on Illinois convicted felons.
Chicago, IL: Illinois Criminal Justice Information Authority. Modestin, J., & Weurmle, O. (2005). Criminality in men with major mental disorder with and
without comorbid substance abuse. Psychiatry and Clinical Neurosciences, 59, 25-29. Muhlhausen, D. B. (2010). The Second Chance Act: More evaluations of effectiveness needed.
Before the Committee on the Judiciary of the United States Senate. Retrieved from http://www.heritage.org/research/testimony/second-chance-act-how-effective-are-prisoner-reentry-programs#_ednref48.
National Institute of Corrections. (2012). Motivational interviewing in corrections: A
comprehensive guide to implementing MI in corrections. Washington, DC.
92
National Institute on Drug Abuse. (2012). Principles of drug addiction treatment: A research-based guide (3rd ed.). Bethesda, MD: Author.
Nayyer-Stone, R., & Hatry, H.P. (2003). Finding out what happens to former clients.
Washington DC: The Urban Institute. Ndrecka, M. (2014). The impact of reentry programs on recidivism: A meta-analysis
(Unpublished doctoral dissertation). Cincinnati, OH: University of Cincinnati. Nelson, M., Deess, P., & Allen, C. (2011). The first month out: Post-incarceration experiences in
New York City. Federal Sentencing Reporter, 24(1), 72-75. O’Brien, P. (2002). Evaluation of Grace House: Using past experience to inform future results.
Chicago, IL: Jane Addams College of Social Work. O’Brien, P., & Young, D.S. (2006). Challenges for formerly incarcerated women: A holistic
approach to assessment. Families in Society, 87(3), 359-366. Ostermann, M. (2015). How do former inmates perform in the community? A survival analysis
of rearrests, reconvictions, and technical parole violations. Crime & Delinquency, 61(2) 163-187.
Parker, R. N., & Horwitz, A. V. (1986). Unemployment, crime, and imprisonment: A panel
approach. Criminology, 24, 751-773. Paylor, I. (1995). Housing needs of ex-offenders. Brookfield, VT: Ashgate Publishing Company. Petersilia, J. (2003). When prisoners come home: Parole and prisoner reentry. New York, NY:
Oxford University Press. Petersilia, J. (2011). Beyond the prison bubble. Washington, DC: U.S. Department of Justice,
Office of Justice Programs, National Institute of Justice. Rakis, J. (n.d.). Using social media to publicize reentry success. Balitmore, MD. National
Correctional Industries Association. Raphael, S., & Winter-Ebmer, R. (2001). Identifying the effect of unemployment on crime.
Journal of Law and Economics, 44, 259-283. Reamer, F. G. (2013). Social work values and ethics (4th ed.). New York, NY: Columbia
University Press. Reichert, J. (2015). Evaluation of St. Leonard’s Ministries: Case studies of former residents of
St. Leonard’s House and Grace House. Chicago, IL: Illinois Criminal Justice Information Authority.
93
Roman, C. G., & Travis, J. (2004). Taking stock: Housing, homelessness, and prisoner reentry. Washington, DC: The Urban Institute.
Saleebey, D. (1996). The strengths perspective in social work practice: Extensions and cautions.
Social Work, 41(3), 296–305. Sandwick, T., Tamis, K., Parsons, J., & Arauz-Cuadra, C. (2013). Making the transition:
Rethinking jail reentry in Los Angeles County. New York, NY: Vera Institute of Justice. Sanger, M. B. (2008). From Measurement to Management: Breaking through the barriers to
state and local performance. Public Administration Review, 68S70-S85. doi:10.1111/j.1540- 6210.2008.00980.x
Seiter, R. P., & Kadela, K. R. (2003). Prisoner reentry: What works, what does not, and what is
promising. Crime & Delinquency, 49(3), 360-388. Tang, F., Choi, E., & Morrow-Howell, N. (2010). Organizational support and volunteering
benefits for older adults. The Gerontologist, 50(5), 603-612. The Sentencing Project. (2002). Mentally ill offenders in the criminal justice system: An analysis
and prescription. Washington, DC: Author. The Sentencing Project. (2012). Fact sheet: Incarcerated women. Washington, DC. Retrieved
from http://www.sentencingproject.org/doc/publications/ cc_Incarcerated_Women_Factsheet_Sep24sp.pdf.
Shadd, M. (2011). Reentry as a rite of passage. Punishment & Society, 13(1), 3-28. Shilton, M. K., & Vail, P. (2005). Homecoming: Suggestions for offender housing and
transitional planning. Washington, DC: Center for Community Corrections. Sinha, R., & Easton, C. (1999). Substance abuse and criminality. Journal of the American
Academy of Psychiatry and Law, 27(4), 513-526. Solomon, A. L., Gouvis, C., & Waul, M. (2001). Summary of focus group with ex-prisoners in
the district: Ingredients for successful reintegration. Washington, DC: The Urban Institute. Spivak, A. L., & Sharp, S. F. (2008). Inmate recidivism as a measure of private prison
performance. Crime & Delinquency, 54(3), 482–508. Sperber, K. G., Latessa, E. J., & Makarios, M. D. (2013). Establishing a risk-dosage research
agenda: Implications for policy and practice. Justice Research and Policy, 15, 123-141. Sutherland, E. H. (1939). Principles of criminology, 3rd ed. Philadelphia, PA: Lippincott.
94
Taxman, F. S., Young, D., & Byrne, J. (2002). Offender’s view of reentry: Implications for processes, programs, and services. Rockville, MD: National Criminal Justice Reference Service.
Thompson, A. S. (2008). Releasing prisoners, redeeming communities: Reentry, race, and
politics. New York, NY: New York University Press. Travis, J. (2005). But they all come back: Facing the challenges of prisoner reentry.
Washington, DC: The Urban Institute. Travis, J., & Lawrence, S. (2002). Beyond the prison gates: The state of parole in America.
Washington, DC: The Urban Institute. Retrieved from http://www.urban.org/UploadedPDF/ 310583_Beyond_prison_gates.pdf.
Uggen, C., & Staff, J. (2004). Work as a turning point for criminal offenders. In J.L. Krienert &
M.S. Fleisher (Eds.), Crime and employment: Critical issues in crime reduction for corrections (pp. 141- 168). Walnut Creek, CA: Altamira Press.
U.S. Census Bureau. (2010). USA quickfacts. Retrieved from http://quickfacts.census.gov/
qfd/states/00000.html. U.S. Department of Labor, Bureau of Labor Statistics. (2012). Labor force statistics from the
current population survey. Washington, DC: author. Varano, S. P., Huebner, B. M., & Bynum, T. S. (2011). Correlates and consequences of pre-
incarceration gang involvement among incarcerated youthful offenders. Bristol, RI: Roger Williams University, School of Justice Studies Faculty Papers.
Visher, C. A., La Vigne, N., & Travis, J. (2004). Returning home: Understanding the challenges
of prisoner reentry. Washington, DC: The Urban Institute. Wager P., & Sakala, L. (2014). Mass incarceration: The whole pie. Northhampton, MA: Prison
Policy Initiative. Retrieved from http://www.prisonpolicy.org/reports/pie.html. Walters, S. T., Clark, M. D., Gingerich, R., & Meltzer, M. L. (2007). A guide for probation and
parole: Motivating offenders to change. Washington, DC: U.S. Department of Justice, Office of Justice Programs, National Institute of Corrections.
Weiner, D. S. (2004). Prosecutors, jobs, and crime. In J. L. Krienert & M. S. Fleisher (Eds.),
Crime and employment: Critical issues in crime reduction for corrections. (pp. 5-12). Walnut Creek, CA: AltaMira Press.
Wheelock, D. (2005). Collateral consequences and racial inequality felon status restrictions as a
system of disadvantage. Journal of Contemporary Criminal Justice, 21(1), 82-90.
95
Widom, C. P. (1989). Child abuse, neglect, and violent criminal behavior. Criminology, 27(2), 251-271.
Widom, C. P. (1995). Victims of childhood sexual abuse – later criminal consequence.
Washington, DC: U.S. Department of Justice, Office of Justice Programs, National Institute of Justice.
Widom, C. P., & Ames, M. A. (1994). Criminal consequences of childhood sexual victimization.
Child Abuse & Neglect, 18(4), 303-318. Williams, N. H. (2006). Examining the needs of the incarcerated, soon-to-be released, and ex-
offenders. Atlanta, GA: National Center for Primary Care, Morehouse School of Medicine. Wilson, W. A. (2005). Bad behavior or bad policy? An examination of Tennessee release
cohorts, 1993-2001. Criminology and Public Policy, 4, 485-518. Witte, A. D., & Dryden-Witt, R. (2001). Crime causation: economic theories. Encyclopedia of
Crime and Justice, 1-17. Wong, T. (2009). Validation of the state of Hawaii LSI-R proxy. Retrieved from
http://icis.hawaii.gov/wp-content/uploads/2013/07/copy2_of_copy_of_SARA-DVSI-Exploratory-Study-Oct-2008.pdf.
Zischka, P. C., & Jones, I. (1987). Special skills and challenges in supervising volunteers.
Clinical Supervisor, 5(4), 19-30. Zweig, J., Yahner, J., & Redcross, C. (2010). Recidivism effects of the Center for Employment
Opportunities (CEO) Program vary by former prisoners’ risk of reoffending. Washington, DC: MDRC.

96
Appendix A: St. Leonard’s House calendar
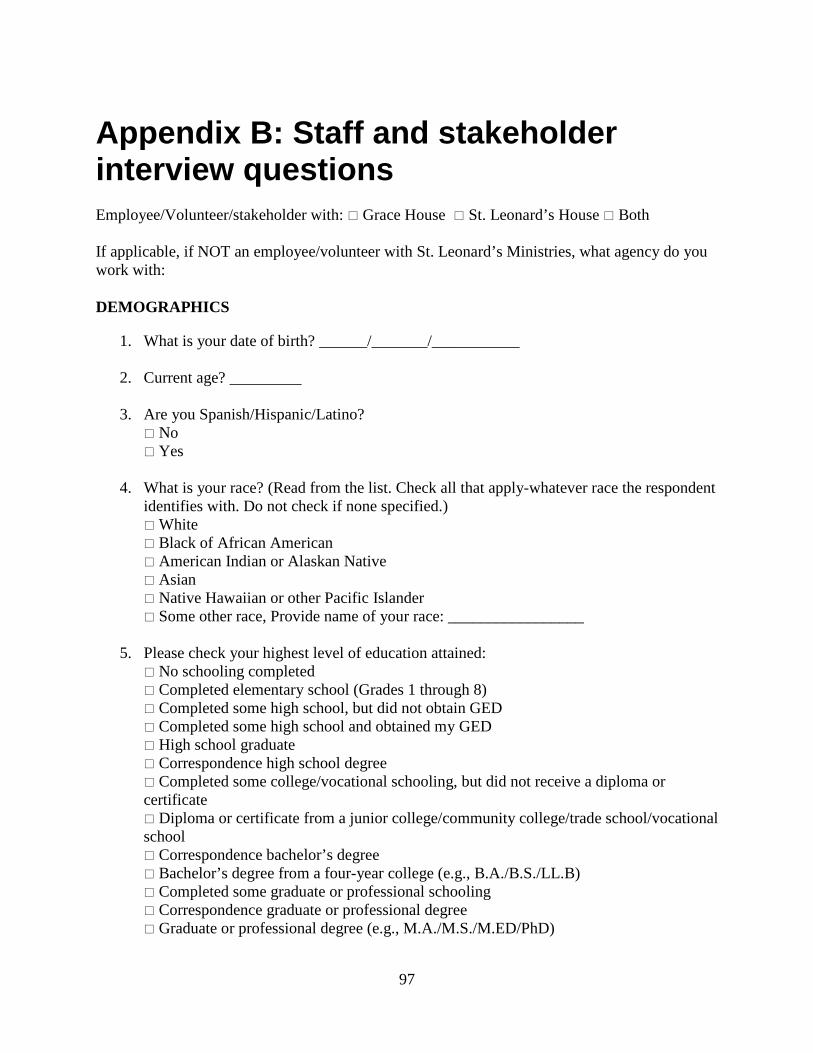
97
Appendix B: Staff and stakeholder interview questions Employee/Volunteer/stakeholder with: Grace House St. Leonard’s House Both If applicable, if NOT an employee/volunteer with St. Leonard’s Ministries, what agency do you work with:
DEMOGRAPHICS
1. What is your date of birth? ______/_______/___________
2. Current age? _________
3. Are you Spanish/Hispanic/Latino? No Yes
4. What is your race? (Read from the list. Check all that apply-whatever race the respondent
identifies with. Do not check if none specified.) White Black of African American American Indian or Alaskan Native Asian Native Hawaiian or other Pacific Islander Some other race, Provide name of your race: _________________
5. Please check your highest level of education attained: No schooling completed Completed elementary school (Grades 1 through 8) Completed some high school, but did not obtain GED Completed some high school and obtained my GED High school graduate Correspondence high school degree Completed some college/vocational schooling, but did not receive a diploma or certificate Diploma or certificate from a junior college/community college/trade school/vocational school Correspondence bachelor’s degree Bachelor’s degree from a four-year college (e.g., B.A./B.S./LL.B) Completed some graduate or professional schooling Correspondence graduate or professional degree Graduate or professional degree (e.g., M.A./M.S./M.ED/PhD)

98
6. Have you ever served in the U.S. military? Include the Armed Forces active-duty, the military Reserves, or the National Guard. No Yes
7. Were you ever…
Yes No a. a former resident of a St. Leonard’s Ministries program b. a former participant (but not a resident) at a St. Leonard’s Ministries program (like Michal Barlow Center)
c. convicted of a felony d. sentenced to probation e. sentenced to jail time f. sentenced to prison time
WORK AT ST. LEONARD’S MINISTRIES
8. Are you a volunteer or employee? Volunteer Employee at St. Leonard’s Ministries Employee with another agency that works with St. Leonard’s Ministries
9. What is your job title? (If volunteer, write volunteer.)
10. At what program(s)/ group(s) at St. Leonard’s Ministries do you work?
11. What is your role there?
12. Please describe your daily work activities at St. Leonard’s Ministries.
13. How many hours per week do you work/volunteer?_________________ hours
14. How long have you worked/volunteered at St. Leonard’s Ministries? __________years _________months
15. Why did you decide to work/volunteer at St. Leonard’s Ministries?
16. Did you receive any training when you first started the position? If yes, describe.
17. What ongoing training do you receive on the job?
18. What are your current training needs?
19. Are you employed or volunteer at another agency?
No Yes
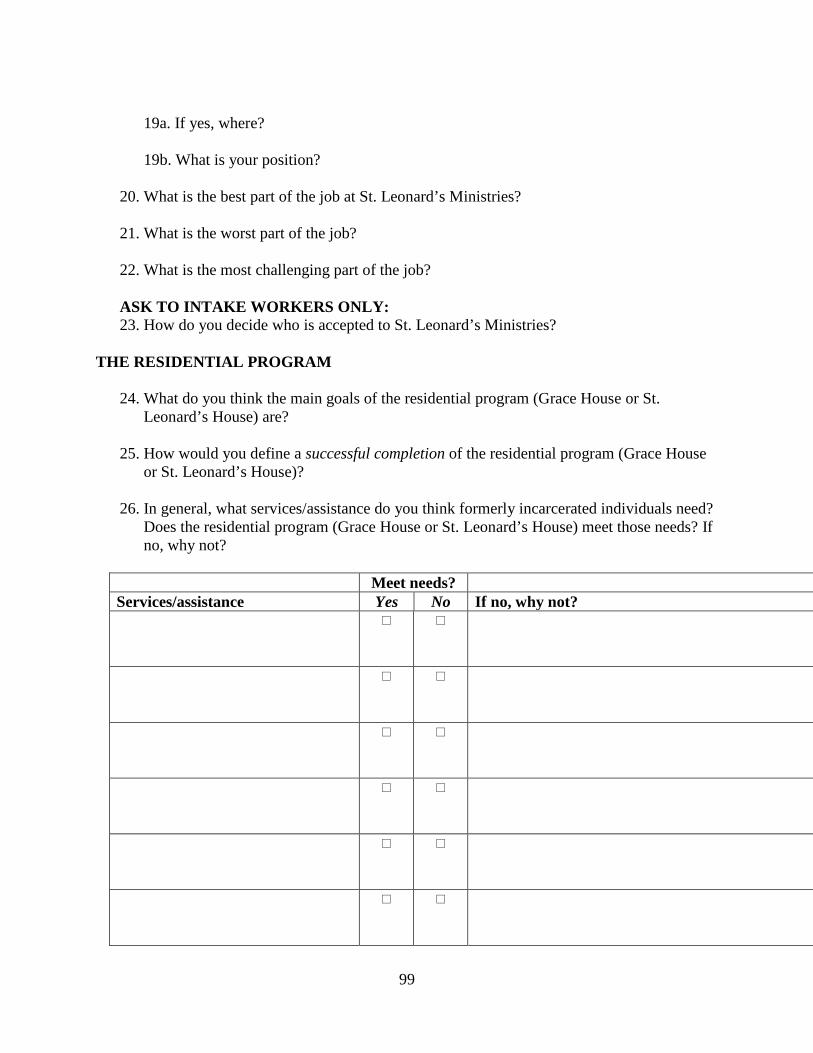
99
19a. If yes, where? 19b. What is your position?
20. What is the best part of the job at St. Leonard’s Ministries?
21. What is the worst part of the job?
22. What is the most challenging part of the job?
ASK TO INTAKE WORKERS ONLY: 23. How do you decide who is accepted to St. Leonard’s Ministries?
THE RESIDENTIAL PROGRAM
24. What do you think the main goals of the residential program (Grace House or St. Leonard’s House) are?
25. How would you define a successful completion of the residential program (Grace House
or St. Leonard’s House)?
26. In general, what services/assistance do you think formerly incarcerated individuals need? Does the residential program (Grace House or St. Leonard’s House) meet those needs? If no, why not?
Meet needs? Services/assistance Yes No If no, why not?
100
27. Are there times when there is tension/friction between residents and staff? No Yes 27a. If yes, what kind of tension/friction?
27b. If yes, how is it handled?
28. Are there times when there is tension/friction between residents and residents? No Yes
28a. If yes, what kind of tension/friction?
28b. If so, how is it handled?
29. Is religion or spirituality incorporated into the program?
No Yes
29a. If yes, how is it incorporated?
ASK TO CASE MANAGERS ONLY: 30. How is the length of stay for residents decided?
31. What are the strongest parts of the program?
32. What are the weakest parts of the program?
33. What changes if any to the program would you recommend?
34. Do you have any other comments?