Embed Size (px)
Citation preview
IRB-1 (R-6/07) Page 3
Marc V. Laino - Executive Director
Shelley Kalita - General Counsel/Director of Administration
Domenic DiCera - Director of Field Operations
Mickey Ezzo - Projects Coordinator
Robert Lang - Director of Mutuels
Ed Mingey - Director of Security
Adam Negrusz - Laboratory Director
Patricia Rocco - Director of Licensing
Illinois Racing Board
W. Jack ChamblinRobinson
Angelo A. CiambroneChicago Heights
William H. Farley Jr.Oak Park
Timothy P. MartinHomer Glen
Paul B. SmithPlainfi eld
Robert C. WinchesterRosiclare
Jonathan P. MetcalfIndian Head Park
Dennis S. BookshesterChicago
Joseph N. CasciatoBurr Ridge
Acting ChairmanJoseph J. Sinopoli
Glen Ellyn

IRB-1 (R-6/07)Page 4

IRB-1 (R-6/07)
Table of Contents Review . . . . . . . . . . . . . . . . . . . . . . . . . . . . . . . . . . . . . . . . . . . . . . . . . . . . . . . . . . . . . . . . . . . . . . . . . . . . . . . . . . . . 6 Laboratory . . . . . . . . . . . . . . . . . . . . . . . . . . . . . . . . . . . . . . . . . . . . . . . . . . . . . . . . . . . . . . . . . . . . . . . . . . . . . . . . 8 Track and OTB Locations . . . . . . . . . . . . . . . . . . . . . . . . . . . . . . . . . . . . . . . . . . . . . . . . . . . . . . . . . . . . . . . . . . . . 9
Money to Illinois Sources and Allocation of Revenue-Exhibit I . . . . . . . . . . . . . . . . . . . . . . . . . . . . . . . . . . . . . . . . . . . . . . . . . . . . 10 Cash Disbursements-Exhibit II . . . . . . . . . . . . . . . . . . . . . . . . . . . . . . . . . . . . . . . . . . . . . . . . . . . . . . . . . . . . . . . 11
Statistical Data Purses, State Revenue, Track Commission, and Payout to Public 1989-2006 . . . . . . . . . . . . . . . . . . . . . . . 12 1987-2006 Illinois Handles . . . . . . . . . . . . . . . . . . . . . . . . . . . . . . . . . . . . . . . . . . . . . . . . . . . . . . . . . . . . . . . . . . 13 2006 Disbursement of Illinois Handle . . . . . . . . . . . . . . . . . . . . . . . . . . . . . . . . . . . . . . . . . . . . . . . . . . . . . . . . . . 14 2006 Monthly Handle Comparison . . . . . . . . . . . . . . . . . . . . . . . . . . . . . . . . . . . . . . . . . . . . . . . . . . . . . . . . . . . . 15 Comparison of Handle on Track, Intertrack, and Off Track . . . . . . . . . . . . . . . . . . . . . . . . . . . . . . . . . . . . . . . . . 16 On Track Totals . . . . . . . . . . . . . . . . . . . . . . . . . . . . . . . . . . . . . . . . . . . . . . . . . . . . . . . . . . . . . . . . . . . . . . . . . . . . . 18 Intertrack Totals . . . . . . . . . . . . . . . . . . . . . . . . . . . . . . . . . . . . . . . . . . . . . . . . . . . . . . . . . . . . . . . . . . . . . . . . . . . . 19 Off Track Totals . . . . . . . . . . . . . . . . . . . . . . . . . . . . . . . . . . . . . . . . . . . . . . . . . . . . . . . . . . . . . . . . . . . . . . . . . . . . 20 All Racing Totals . . . . . . . . . . . . . . . . . . . . . . . . . . . . . . . . . . . . . . . . . . . . . . . . . . . . . . . . . . . . . . . . . . . . . . . . . . . . 21 Comparison of Wagering Pools . . . . . . . . . . . . . . . . . . . . . . . . . . . . . . . . . . . . . . . . . . . . . . . . . . . . . . . . . . . . . . 22 2006 Off Track Parlor and Intertrack Handles . . . . . . . . . . . . . . . . . . . . . . . . . . . . . . . . . . . . . . . . . . . . . . . . . . . 24 Summary of Parlor Surcharges and Revenues to City and County . . . . . . . . . . . . . . . . . . . . . . . . . . . . . . . . . 25 2006 Illinois Handle on Out-of-State Tracks . . . . . . . . . . . . . . . . . . . . . . . . . . . . . . . . . . . . . . . . . . . . . . . . . . . . . 26 2006 Commingled Handle vs. Simulcast Handle . . . . . . . . . . . . . . . . . . . . . . . . . . . . . . . . . . . . . . . . . . . . . . . . . 27 2000-2006 Average Daily Handles and Purses of Thoroughbred Meets . . . . . . . . . . . . . . . . . . . . . . . . . . . . . 28 2000-2006 Average Daily Handles and Purses of Harness Meets . . . . . . . . . . . . . . . . . . . . . . . . . . . . . . . . . . 29 2006 Major Stake Races . . . . . . . . . . . . . . . . . . . . . . . . . . . . . . . . . . . . . . . . . . . . . . . . . . . . . . . . . . . . . . . . . . . . . 30 2006 and 2007 Racing Dates Schedule . . . . . . . . . . . . . . . . . . . . . . . . . . . . . . . . . . . . . . . . . . . . . . . . . . . . . . . . 31
Race Meeting Statistics Thoroughbred Arlington Park - Arlington Park . . . . . . . . . . . . . . . . . . . . . . . . . . . . . . . . . . . . . . . . . . . . . . . . . . . . . . . . . . . . . . 32 National Jockey Club and Hawthorne Race Course - Hawthorne Race Course . . . . . . . . . . . . . . . . . . . . . . 33 Fairmount Park - Fairmount Park . . . . . . . . . . . . . . . . . . . . . . . . . . . . . . . . . . . . . . . . . . . . . . . . . . . . . . . . . . . . . 36
Harness Balmoral Racing Club -Balmoral Park . . . . . . . . . . . . . . . . . . . . . . . . . . . . . . . . . . . . . . . . . . . . . . . . . . . . . . . . . 37 Maywood Park Trotting and Associates Racing - Maywood Park . . . . . . . . . . . . . . . . . . . . . . . . . . . . . . . . . . 38 Suburban Downs - Hawthorne Race Course . . . . . . . . . . . . . . . . . . . . . . . . . . . . . . . . . . . . . . . . . . . . . . . . . . . 41 State and county fairs - Springfi eld, DuQuoin, and Brown County . . . . . . . . . . . . . . . . . . . . . . . . . . . . . . . . 42
Intertrack and Off Track Locations Intertrack Sites . . . . . . . . . . . . . . . . . . . . . . . . . . . . . . . . . . . . . . . . . . . . . . . . . . . . . . . . . . . . . . . . . . . . . . . . . . . . 43 Off track Parlor Sites . . . . . . . . . . . . . . . . . . . . . . . . . . . . . . . . . . . . . . . . . . . . . . . . . . . . . . . . . . . . . . . . . . . . . . . . 44 Harness Breeders Fund Purses and Awards Paid . . . . . . . . . . . . . . . . . . . . . . . . . . . . . . . . . . . . . . . . . . . . . . . . 47 Thoroughbred and Quarterhorse Breeders Fund Purses and Awards Paid . . . . . . . . . . . . . . . . . . . . . . . . 48
Page 5

IRB-1 (R-6/07)
The Year 2006 in Review
T he Illinois Racing Board is a regulatory and enforcement agency of State Government. The Illinois General Assembly establishes
public policy in the area of horse racing regulation that is carried out by the Board. The Board, which allocates race dates to various racing associations, is also responsible for licensing, rule making, and supervising the conduct of race meets. Every individual that participates in Illinois racing is required to be licensed. The licensing process includes fi ngerprinting as well as the conduct of a background review for criminal histories. The Board issued 10,186 licenses during 2006. A staff of administrative, security, and veterinary profes-sionals, in conjunction with Board approved racing offi cials, supervised the activities at fi ve racetracks conducting pari-mutuel racing in Illinois during 2006.
The Board is a member of the Association of Racing Commissioners International (RCI), the industry’s oldest and most prominent regulatory association. Executive Director Marc Laino is an active participant on RCI committees. The information contained in the RCI database allows the Board to monitor the backgrounds of licensees and to exchange important regulatory and industry information with other jurisdictions.
The 646 race programs conducted during 2006 resulted in a total handle of $952,119,485 representing a decrease of 5% compared to 2005. Thoroughbred meets accounted for $631,272,800, a decrease of 4%, while standardbred meets accounted for $320,846,685, a decrease of 7%.
Twenty-seven percent of the total handle, or $259,022,153 was wagered on Illinois races at wagering facilities in Illinois in 2006. An additional $844.8 million was wagered on Illinois races broad-cast to other states. This represents a 6% decrease from the prior year. However, 2006 marks the sixth time since full-card simulcasting began that other states wagered more on Illinois races than Illinois wagered on races from other states.Pari-mutuel wagering in Illinois generated $10,347,144 in total state revenues, a decrease of 12% compared to 2005. Wagering at off-track betting parlors generated $10.2 million (2% of OTB handle) for city and county governments in 2006. This represents a 2% decrease from the prior year.During 2006, Governor Blagojevich made several
appointments to the Illinois Racing Board. On June 19, Commissioner Dr. Paul Smith was appointed to replace Ralph Gonzalez, a member since 1984 and Chairman from 1999 to 2001. Dr. Smith was previously employed by the Board for 33 years and retired in 2002. Commissioner Angelo “Sam” Ciam-brone was appointed to the Board on August 29 re-placing John Simon, a 16 year veteran of the Board. Mr. Ciambrone previously served on the Board from 1976 to 1980 and was the Mayor of Chicago Heights from 1995 to 2003. Finally, on September 11, Governor Blagojevich appointed Commis-sioner Joseph Sinopoli. Mr. Sinopoli served as the Board’s Deputy Director and Legal Counsel from 1986 through 1990. In 1991, he was appointed the Board’s Executive Director and resigned in 1998.
Prominent Chicago trial lawyer and Chairman of the Board, Lorna Propes, submitted her resignation from the Board effective December 13, 2006. She served as a member of the IRB from 1989 through August, 2002 and Chairman from April 14, 2003 through December 12, 2006. During her tenure on the Board, Ms. Propes dealt with such issues and the 1995 Interstate Simulcasting Legislation, admin-istrative hearings on the Horse Racing Act recap-ture provisions, the re-birth of Arlington Park, and the closing of Sportsman’s Park. She also served on the Thoroughbred Breeders’ Advisory Board and several RCI committees. At the Chairman’s direction, the Board conducted several days of hearings in July to examine the state of the Illinois horse racing industry. Twenty-two industry experts offered their perspective on racing from the local, national, and international level. Testimony primar-ily focused on the history and contribution of horse racing to the economy of Illinois, reasons for the drastic decline in industry revenues over the past thirty years, and potential solutions that would allow Illinois racing to compete effectively with both other racing jurisdictions and the diverse gaming oppor-tunities presently available in Illinois. Afterwards, a report was given to the Governor and leaders of the General Assembly.
Since 2005, the Racing Board has been electroni-cally transferring individual license record informa-tion to the Collections Division of the Illinois Depart-ment of Revenue (IDOR) for comparison to their outstanding individual income tax debt database.
Page 6

IRB-1 (R-6/07)
This process has allowed the IDOR to collect nearly $140,000.
Illinois granted 29 off-track (OTB) licenses in 2006. Each Illinois racetrack is entitled to receive up to six OTB licenses, except Fairmount Park, which is entitled to seven licenses. A total of thirty-seven licenses are available. Two new OTB’s opened, two closed and two received site approval. Inter-Track Partners, on behalf of Balmoral Park, opened a new OTB facility in Normal and on behalf of Maywood Park, opened a new OTB facility in Niles. OTB facilities in Bloomington and Grayville permanently closed their doors. The applications for OTB fa-cilities in Hodgkins (Arlington Park) and Lockport (Quad City Downs) received site approval in 2006.
In June of 2006, the Illinois General Assembly passed legislation creating a tax on riverboat gam-bling and directing the proceeds to the horseracing industry. House Bill 1918 created the Horse Racing Equity Trust Fund and placed an additional 3% tax on those riverboat casinos that gross more than $200 million annually. The anticipated $36 million per year is intended to assist Illinois’ racetracks and horsemen. The fund, administered by the Illinois Gaming Board, will sunset in 2 years. While the four largest riverboat casinos in Illinois immediately obtained an injunction in the Will County Circuit Court blocking establishment of the fund and chal-lenging the constitutionality of the law, the money is being paid into a Protest Fund pending the out-come of the lawsuit.In December of 2006, Arlington Park announced plans to immediately replace its conventional dirt track with a new state-of-the-art synthetic racing surface. Arlington’s concern for the safety of horses and jockeys led to the decision to install a synthetic track at an estimated cost of $10 million.
Total purses paid in 2006 decreased by 3.5% ($89 million versus $92.2 million) from the prior year. Purses paid at Illinois’ thoroughbred tracks in-creased slightly ($57.3 million versus $57.2 million), while purses paid at Illinois’ standardbred tracks decreased by nearly 9% ($31.8 million versus $34.9 million). Average daily purses paid at the Chicago-land thoroughbred tracks decreased by less than 1% ($232,956 versus $233,867) and the average daily purses paid at the Chicagoland standardbred tracks increased by 1% ($90,458 versus $89,610)
over the prior year.
For the fi fth consecutive year, the Board awarded racing dates to the Brown County Fair Associa-tion in Mt. Sterling, Illinois, to conduct pari-mutuel wagering on two days of harness racing during its county fair.
Several IRB rule changes were adopted during 2006, the most noteworthy being an emergency amendment to the Medication rule, Part 603, autho-rizing the Board’s Equine Testing Laboratory to test for human EPO antibodies, commonly referred to as blood doping. EPO is a prohibited substance for racing in many jurisdictions around the world. The use of EPO in horses is a dangerous practice and has no application in racehorses because of its life-threatening side effects.
FORT PRADO was voted the Illinois Thoroughbred Horse of the Year. This fi ve-year-old gray son of El Prado, owned by Team Block and bred by David Block, had 4 win in 7 starts in 2006 and earned $327,910. Trained by Chris Block, Fort Prado recorded wind in the $200,000 Fair Grounds Breed-ers’ Cup Handicap (gr. III), the $125,000 Tamp Bay Breeders’ Cup, the $193,000 Connally Breeders’ Cup Turf Handicap (gr. III), and the $75,000 Black Tie Affair Handicap at Arlington Park. Fort Prado fi nished third in the Sea o’Erin Breeders Cup Mile at Arlington and fourth in the Grade III Robert F. Carey Memorial Handicap at Hawthorne Race Course and was also selected Illinois’ champion older hand-icap male and champion male turf horse.
MY BOY DAVID was voted the Illinois Harness Horse of the Year. A winner of $610,075, this three-year-old pacing gelding, trained by Homer Hoch-stetler, went postward 24 times and recorded four wins. Owned by Shirley LeVin and her grandson David Riff, My Boy David captured the $180,000 Pete Langley Memorial Stake at Balmoral Park and fi nished second in the $1 million Meadowlands Pace Final. He won an elimination race of the Illinois State Fair Stakes at Springfi eld in 1:47.4, making him the fastest three-year-old in the sport in 2006. He was also honored as three-year-old colt pacer. The son of Cole Muffl er and the Abercrom-bie mare Eicarls Valentine was bred by Cottonwood Farm and Lake To Sky Farms.
Page 7

IRB-1 (R-6/07)
Laboratory
Over the past year, the University of Illinois at Chicago Animal Forensic Toxicology Laboratory has conducted one of the most comprehensive equine drug testing programs in the country. The laboratory accomplished this by employing an extensive array of enzyme linked immunosorbent assays (ELISA) to routinely screen samples for prohibited substances. These tests are highly sensitive and allow the laboratory to screen for a wide range of pharmaceutical substances. In addition, the laboratory routinely tests equine blood samples for violations exceeding the permitted levels of furosemide, fl unixin, phenylbutazone, oxyphenbutazone, and total carbon dioxide (TCO2). The laboratory acquired new analytical equipment and upgraded and modernized the existing ana-lytical tools. Recently, a bar coding system was implemented to enhance the chain of custody.
The laboratory continues to assist the track stewards and security personnel in investigating possible doping violations that employ methods designed to circumvent our standard testing procedures. The laboratory also investigates and reports on special items such as syringes, drug vials and other contraband that are collected or seized at the racetracks.
The laboratory continues participation in two external profi ciency testing programs: the International Association of Racing Commissioners Quality Assurance Program and the International Profi -ciency Testing Program conducted by the Association of Offi cial Racing Chemists. The laboratory maintained a perfect score on all blinds and profi ciencies in 2006.
2006 Laboratory Test Samples
Post Race Urine Blood Total Thoroughbred 3,860 3,939 7,799 Harness 5,320 5,513 10,833 Total 9,180 9,452 18,632
Prohibited Drug Positives Thoroughbred 28 Harness 40 Total drug positives 68
Phenylbutazone Violations Thoroughbred overages 20 Harness overages 13 Total overages 33
Lasix Violations Thoroughbred overages 6 Harness overages 1 Total overages 7
TC02 Violations Thoroughbred overages 0 Harness overages 6 Total overages 6
Page 8

IRB-1 (R-6/07)
Illinois Racetracks and OTB Facilitiesas of December 31, 2005
Racetracks Phone Address
Arlington Park 847 385-7500 2200 W. Euclid, Arlington Heights, IL 60006
Balmoral Park 708 672-7560 26435 S. Dixie Highway, Crete, IL 60417
Fairmount Park 618 345-4300 9301 Collinsville Road, Collinsville, IL 62234
Hawthorne Race Course 708 780-3700 3501 S. Laramie, Cicero, IL 60804
Maywood Park 708 343-4800 8600 W. North Avenue, Melrose Park, IL 60160
Quad City Downs - no live racing 309 792-0202 5005 Morton Drive, East Moline, IL 61244
OTBs
Alton Time Out OTB 618 465-1006 315 Belle Street, Alton, IL 62002
Aurora The Foundry 630 978-2088 85 Executive Drive, Aurora, IL 60504
Carbondale University Teletrack 618 457-2877 1360 E. Main Street, Carbondale, IL 62901
Corliss Corliss OTB 773 995-8238 11203 S. Corliss, Chicago, IL 60628
Crestwood Crestwood OTB 708 489-4700 13148 Rivercrest Drive, Crestwood, IL 60445
Joliet Bookie Magee’s 815 744-6500 2450 Jefferson Street, Joliet, IL 60435
Lockport Fat Sam’s Sports Bar & Grill 815 838-4420 1225 E. 9th Street, Lockport, IL 60441
McHenry Nicolino’s 815 344-9800 621 Ridgeview Drive, McHenry, IL 60050
Mokena Stoney Point Grill 708 478-1670 19031 Old LaGrange Road, Mokena, IL 60448
Niles Lucky Magee’s 847 795-8000 9215 N. Greenwood Avenue, Niles, IL 60714
Normal All Seasons Entertainment 309 829-3300 1304 Cross Creek Drive, Normal, IL 61761
Oakbrook Terrace Oakbrook Terrace OTB 630 627-8238 17W648 22nd Street, Oakbrook Terrace 60181
Peoria Landmark Recreation Center 309 687-3062 3225 N. Dries Lane, Peoria, IL 61604
Peru Peru OTB 815 224-2000 124 May Road, Peru, IL 61354
Rockford Sports Spectrum Rockford 815 398-2300 5011 E. State Street, Rockford, IL 61108
Sauget Route 3 OTB 618 274-6468 2400 Mississippi Avenue, Sauget, IL 62201
South Beloit The Inferno 815 389-2445 1322 Gardner Street, South Beloit, IL 61080
South Elgin Lucky’s Bar & Grill 847 695-6666 335 N. McLean Boulevard, South Elgin, IL 60123
Springfi eld Capital Teletrack 217 546-2111 1766 Wabash Avenue, Springfi eld, IL 62704
Tinley Park Bud’s Sports Place 708 802-8966 16086 S. Harlem Avenue, Tinley Park, IL 60477
Urbana The Brick House 217 367-2255 1901 South HighCross Road, Urbana, IL 61821
Waukegan Sports Spectrum Waukegan 847 336-1400 630 S. Green Bay Road, Waukegan, IL 60085
Weed St.(MudBug) Sports Spectrum Chicago 312 787-9600 901 W. Weed Street, Chicago, IL 60622
West Jackson Jackson OTB 312 427-2300 223 W. Jackson, Chicago, IL 60606
Illinois Racing Board 312 814-2600 100 W. Randolph, Suite 7-701, Chicago, IL 60601
Intertrack Partners Maywood Park 708 615-1200 8600 W. North Ave., Melrose Park, IL 60160
Web sites Arlington Park www.arlingtonpark.com
Balmoral Park www.balmoralpark.com
Fairmount Park www.fairmountpark.com
Hawthorne Race Course www.hawthorneracecourse.com
Maywood Park www.maywoodpark.com
Illinois Racing Board www.state.il.us/agency/irb
Intertrack Partners www.illinoisotb.com
Page 9
IRB-1 (R-6/07)
Illinois Racing BoardStatement of Source and Allocation of Revenue
for the 2006 Racing Year
Source of revenue: Application and license fees of racing associations . . . . . . . . . . . . . . . . . . . . . . . . . . . . $ 103,565
Admission taxes . . . . . . . . . . . . . . . . . . . . . . . . . . . . . . . . . . . . . . . . . . . . . . . . . . . . . . . . . . $ 94,664
Pari-mutuel tax . . . . . . . . . . . . . . . . . . . . . . . . . . . . . . . . . . . . . . . . . . . . . . . . . . . . . . . . . . . $ 13,589,301
Pari-mutuel tax credit . . . . . . . . . . . . . . . . . . . . . . . . . . . . . . . . . . . . . . . . . . . . . . . . . . . . . $ (3,910,705)
Licensing of racing personnel . . . . . . . . . . . . . . . . . . . . . . . . . . . . . . . . . . . . . . . . . . . . . . $ 250,975
Fingerprint fees . . . . . . . . . . . . . . . . . . . . . . . . . . . . . . . . . . . . . . . . . . . . . . . . . . . . . . . . . . $ 97,560
Horseman’s fi nes . . . . . . . . . . . . . . . . . . . . . . . . . . . . . . . . . . . . . . . . . . . . . . . . . . . . . . . . $ 116,445
Miscellaneous sources . . . . . . . . . . . . . . . . . . . . . . . . . . . . . . . . . . . . . . . . . . . . . . . . . . . . $ 5,339
Total state revenues received . . . . . . . . . . . . . . . . . . . . . . . . . . . . . . . . . . . . . . . . . . . $ 10,347,144
2% of OTB handle to city and county . . . . . . . . . . . . . . . . . . . . . . . . . . . . . . . . . . . . . . . . $ 10,191,692
City (Chicago) OTB admission tax . . . . . . . . . . . . . . . . . . . . . . . . . . . . . . . . . . . . . . . . . . . $ 415,348
On track city admission tax . . . . . . . . . . . . . . . . . . . . . . . . . . . . . . . . . . . . . . . . . . . . . . . . . $ 44,432
Intertrack surcharge to county (20%) . . . . . . . . . . . . . . . . . . . . . . . . . . . . . . . . . . . . . . . . $ 612,627
Total local government revenues received . . . . . . . . . . . . . . . . . . . . . . . . . . . . . . . . $ 11,264,100
Total revenues received . . . . . . . . . . . . . . . . . . . . . . . . . . . . . . . . . . . . . . . . . . . . . . . . $ 21,611,244
Allocation of revenueHorse racing fund . . . . . . . . . . . . . . . . . . . . . . . . . . . . . . . . . . . . . . . . . . . . . . . . . . . . . . . . $ 9,658,250
General revenue fund . . . . . . . . . . . . . . . . . . . . . . . . . . . . . . . . . . . . . . . . . . . . . . . . . . . . . $ 570,988
Quarterhorse breeders’ fund . . . . . . . . . . . . . . . . . . . . . . . . . . . . . . . . . . . . . . . . . . . . . . . $ 20,346
Fingerprint license fund . . . . . . . . . . . . . . . . . . . . . . . . . . . . . . . . . . . . . . . . . . . . . . . . . . . . $ 97,560
Total state revenues allocated . . . . . . . . . . . . . . . . . . . . . . . . . . . . . . . . . . . . . . . . . . $ 10,347,144
To cities . . . . . . . . . . . . . . . . . . . . . . . . . . . . . . . . . . . . . . . . . . . . . . . . . . . . . . . . . . . . . . . . . $ 5,555,626
To counties . . . . . . . . . . . . . . . . . . . . . . . . . . . . . . . . . . . . . . . . . . . . . . . . . . . . . . . . . . . . . . $ 5,708,474
Total local government revenues allocated . . . . . . . . . . . . . . . . . . . . . . . . . . . . . . . . $ 11,264,100
Total revenues allocated . . . . . . . . . . . . . . . . . . . . . . . . . . . . . . . . . . . . . . . . . . . . . . . . $ 21,611,244
Exhibit I
Page 10

IRB-1 (R-6/07)
Illinois Racing BoardStatement of Cash Disbursements
for the 2006 Racing Year
Supervision of General Race Meets Administration and Laboratory Total
Salary expenses, including expense of retirement
and social security . . . . . . . . . . . . . 1,312,167 0 1,312,167
Contractual services: freight, repairs, rentals, postage,
professional services, etc. . . . . . 149,862 0 149,862
Other state offi cers . . . . . . . . . . . 26,700 0 26,700
Travel expenses . . . . . . . . . . . . . . . . 17,311 0 17,311
Commodities: offi ce supplies,
repair parts, etc. . . . . . . . . . . . . . . 4,200 0 4,200
Printing . . . . . . . . . . . . . . . . . . . . . . . 2,130 0 2,130
Equipment . . . . . . . . . . . . . . . . . . . . . 12,070 0 12,070
EDP processing . . . . . . . . . . . . . . . . 60,258 0 60,258
Telecommunications . . . . . . . . . . . . . 72,530 0 72,530
Operating auto equipment . . . . . . . 16,250 0 16,250
Refunds . . . . . . . . . . . . . . . . . . . . . . . 50 50
Operations of laboratory and
supervision of race meets . . . . 0 4,974,954 4,974,954
CMS charge move to Revenue . . . . 0 0 0
Court of claims award . . . . . . . . . . . 0 0 0
Total 2006 disbursements 1,673,528 4,974,954 6,648,482
Exhibit II
Page 11

IRB-1 (R-6/07)
1989-2006 Purses, Commissions, and State Revenue
Thoroughbred Harness Total Track/OTB Purses Purses Purses Commissions Distributed Distributed Distributed From Takeout
1989 52,537,943 41,854,952 94,392,895 N/A 1990 52,169,788 43,717,401 95,887,189 N/A 1991 48,861,451 44,203,891 93,065,342 N/A 1992 48,819,244 44,044,963 92,864,207 N/A 1993 48,804,617 41,761,228 90,565,845 N/A 1994 49,623,030 40,044,973 89,668,003 N/A 1995 49,313,304 41,392,332 90,705,636 N/A 1996 53,850,395 41,757,050 95,607,445 109,108,765 1997 50,843,274 37,141,615 87,984,889 104,436,051 1998 49,904,435 34,542,076 84,446,511 93,374,131 1999 52,398,833 39,180,917 91,579,750 93,937,886 2000 65,955,254 42,068,597 108,023,851 101,185,883 2001 65,176,932 39,863,175 105,040,107 101,339,464 2002 79,233,651 40,177,699 119,411,350 103,066,740 2003 60,224,987 32,900,951 93,125,938 95,597,139 2004 57,231,170 40,178,599 97,409,769 95,847,940 2005 57,250,778 34,906,211 92,156,989 90,580,2812006 57,314,077 31,810,706 89,124,783 84,895,542
% Of Handle Illinois Payout to the State Revenue on Illinois Races Handle Public
1989 43,289,387 98% 1,193,202,530 937,591,476 1990 45,723,937 98% 1,252,368,115 982,664,662 1991 46,318,927 98% 1,248,161,065 975,519,214 1992 44,744,193 97% 1,290,919,614 1,004,615,812 1993 47,571,875 96% 1,282,020,262 995,979,555 1994 46,624,337 95% 1,238,762,950 961,856,234 1995 44,529,168 73% 1,201,999,292 930,988,936 1996 45,758,661 54% 1,232,867,396 956,512,427 1997 45,133,914 47% 1,180,033,714 915,771,264 1998 42,072,401 36% 1,087,061,250 844,351,543 1999 42,404,844 34% 1,103,849,329 856,519,567 2000 13,338,057 34% 1,102,541,723 855,730,378 2001 13,444,319 33% 1,105,692,484 858,186,861 2002 12,839,705 34% 1,131,874,324 880,017,501 2003 12,783,565 29% 1,067,918,400 828,298,451 2004 12,757,741 31% 1,059,383,287 821,615,350 2005 11,794,271 30% 1,002,819,877 777,582,7632006 10,347,144 27% 952,119,485 736,885,775
Note: In 2000, state revenue declined sharply due to statutory changes passed in 1999. These include a fl at tax of 1.5%, elimination of HRTA tax, uncashed tickets and breakage to the state, and a pari-mutuel tax credit.
In 2002, thoroughbred purses include $14,280,000 that was paid at the Arlington Park Breeder’s Cup. In 2003, there was a harness labor dispute totalling 86 days. Page 12

IRB-1 (R-6/07)
1987-2006 Illinois Handle Totals Total On Track Intertrack Off Track Thoroughbred Thoroughbred Thoroughbred Thoroughbred Meets 1987 356,421,707 194,440,313 6,491,923 557,353,943 1988 300,440,988 210,116,491 52,217,122 562,774,601 1989 362,027,974 204,424,200 134,256,244 700,708,418 1990 358,258,669 205,490,935 157,175,600 720,925,204 1991 337,354,770 181,590,802 178,797,671 697,743,243 1992 311,469,954 168,456,647 219,595,842 699,522,443 1993 285,304,997 163,196,102 251,089,094 699,590,193 1994 269,292,713 154,548,452 257,743,541 681,584,706 1995 208,971,670 161,026,595 284,072,667 654,070,932 1996 224,480,978 165,164,793 307,428,219 697,073,990 1997 203,602,521 165,229,200 310,108,794 678,940,515 1998 145,599,880 191,893,259 339,166,726 676,659,865 1999 137,231,659 203,667,305 348,393,492 689,292,456 2000 183,746,086 184,012,741 337,818,255 705,577,082 2001 175,914,328 183,437,871 347,626,218 706,978,417 2002 193,437,182 187,024,183 346,520,477 726,981,842 2003 176,252,921 183,086,880 348,843,259 708,183,060 2004 168,286,222 172,356,634 345,071,171 685,714,027 2005 164,331,055 167,612,637 324,976,790 656,920,482 2006 150,200,686 157,201,055 323,871,059 631,272,800 On Track Intertrack Off Track Total Harness Harness Harness Harness Meets 1987 317,966,134 83,969,761 5,347,502 407,283,397 1988 289,706,937 110,485,223 42,665,213 442,857,373 1989 258,603,812 125,921,999 107,968,301 492,494,112 1990 256,855,703 134,948,222 139,638,986 531,442,911 1991 228,205,387 142,874,593 179,337,842 550,417,822 1992 193,087,205 162,203,257 236,106,709 591,397,171 1993 167,541,086 150,389,103 264,499,880 582,430,069 1994 151,493,533 139,555,386 266,129,325 557,178,244 1995 121,047,072 145,351,015 281,530,273 547,928,360 1996 104,102,288 148,996,834 282,694,284 535,793,406 1997 88,580,572 144,422,036 268,090,591 501,093,199 1998 62,378,668 120,957,134 227,065,583 410,401,385 1999 63,453,215 120,180,400 230,923,258 414,556,873 2000 58,171,917 116,137,855 222,654,869 396,964,641 2001 56,708,378 117,444,699 224,560,990 398,714,067 2002 60,299,996 120,368,974 224,223,512 404,892,482 2003 50,585,062 105,100,231 204,050,047 359,735,340 2004 56,452,185 106,523,349 210,693,726 373,669,260 2005 48,712,033 102,081,782 195,105,580 345,899,395 2006 41,800,020 93,333,101 185,713,564 320,846,685 On Track Intertrack Off Track Total All Racing All Racing All Racing All Racing Meets 1987 674,387,841 278,410,074 11,839,425 964,637,340 1988 590,147,925 320,601,714 94,882,335 1,005,631,974 1989 620,631,786 330,346,199 242,224,545 1,193,202,530 1990 615,114,372 340,439,157 296,814,586 1,252,368,115 1991 565,560,157 324,465,395 358,135,513 1,248,161,065 1992 504,557,159 330,659,904 455,702,551 1,290,919,614 1993 452,846,083 313,585,205 515,588,974 1,282,020,262 1994 420,786,246 294,103,838 523,872,866 1,238,762,950 1995 330,018,742 306,377,610 565,602,940 1,201,999,292 1996 328,583,266 314,161,627 590,122,503 1,232,867,396 1997 292,183,093 309,651,236 578,199,385 1,180,033,714 1998 207,978,548 312,850,393 566,232,309 1,087,061,250 1999 200,684,874 323,847,705 579,316,750 1,103,849,329 2000 241,918,003 300,150,596 560,473,124 1,102,541,723 2001 232,622,706 300,882,570 572,187,208 1,105,692,484 2002 253,737,178 307,393,157 570,743,989 1,131,874,324 2003 226,837,983 288,187,111 552,893,306 1,067,918,400 2004 224,738,407 278,879,983 555,764,897 1,059,383,287 2005 213,043,088 269,694,419 520,082,370 1,002,819,877 2006 192,000,706 250,534,156 509,584,623 952,119,485
Page 13

IRB-1 (R-6/07)
2006 Disbursement of Illinois Handle
2006 Illinois handle 952,119,485 Track/OTB Horsemen State Local Gov’t Public Other states
Track commission 84,895,542 84,895,542 Purses earned 74,797,816 74,797,816 Pari-mutuel tax 13,589,301 13,589,301 Pari-mutuel tax credit 3,910,705 3,910,705 (3,910,705) Out-of-state fee(~3.2%) 22,027,346 22,027,346 Public pool 756,809,480 756,809,480 Breakage 4,648,302 3,486,227 1,162,076 (4,648,302) On track surcharge 278,770 278,770 (278,770) ITW surcharge 3,063,137 1,225,255 1,225,255 612,627 (3,063,137) OTB surcharge 9,771,087 (420,605) 10,191,692 (9,771,087) Recapture* 13,130,746 13,130,746 (13,130,746) Uncashed tickets (’04) 4,589,566 2,294,783 2,294,783 (4,589,566) RICF Charity 750,000 (750,000) 750,000 Breeders awards 2,240,190 (2,240,190) 2,240,190 Total 952,119,485 105,811,232 69,339,373 9,678,596 10,804,319 734,458,618 22,027,346 11.11% 7.28% 1.02% 1.13% 77.14% 2.31% Out-of-state handle on Illinois races 844,791,759 Simulcast fee (3.16%) 26,696,923 13,348,462 13,348,462 (26,696,923) Grand totals 119,159,694 82,687,835 9,678,596 10,804,319 734,458,618 (4,669,557)
* Note that the state reimbursement for recapture was not appropriated in 2006. Balmoral, Maywood and Hawthorne Harness deferred $4.1 million of their 2004 recapture to be waived or realized by the end of 2006, pending the outcome of the lawsuit regarding HB1918 passed in June of 2006. These fi gures are not refl ected in the fi gures above.
What is purse recapture? Purse recapture is a 1995 provision of the law that allows racetracks to recoup losses on live handle brought on by the authorization of full-card simulcasting of races from other states. Handle on Illinois races as a percentage of total Illinois handle has dropped from 95% in 1994 to 27% in 2006. The recapture amount is 2% of the decrease of Illinois handle on Illinois races from 1994. The recapture monies allocated to the racetracks are deducted from the horsemen’s purse accounts. In 1999, legislation was passed that authorized annual appropriations to the Department of Agricul-ture for reimbursement to purse accounts equal to the recapture amounts. The appropriation is an annual decision, the racetracks will always receive their monies, either from the state or from the originally intended horsemen’s purse accounts. Below are the annual amounts of purse recapture since 1995, when full card simulcasting was authorized.
Illinois Handle on Illinois Races 1994 1,181,911,128 Race Year Recapture Year Recapture 1995 872,357,004 1995 1996 $4,234,922 1996 660,598,891 1996 1997 $9,728,218 1997 553,709,328 1997 1998 $6,894,623 1998 387,351,792 1998 1999 $10,254,087 1999 374,209,987 1999 2000 $15,063,347 2000 377,762,519 2000 2001 $15,152,298 2001 367,053,388 2001 2002 $15,489,017 2002 382,473,610 2002 2003 $15,119,303 2003 308,244,909 2003 2004 $13,704,522 2004 327,079,537 2004 2005 $13,347,193 2005 303,605,111 2005 2006 $13,130,746 2006 259,022,153 2006 2007 $13,882,814
Page 14

IRB-1 (R-6/07)
Illinois Monthly Handle Comparison 2006
Live and Simulcast Handle Combined Thoroughbred Harness All Meets Meets Meets January 43,040,749 24,633,625 67,674,374 February 45,176,841 26,271,303 71,448,144 March 52,724,739 27,781,759 80,506,498 April 53,154,143 27,543,666 80,697,809 May 68,721,955 27,738,443 96,460,398 June 57,149,092 28,711,564 85,860,656 July 57,698,235 28,191,916 85,890,151 August 59,253,181 28,748,849 88,002,030 September 50,254,443 26,810,528 77,064,971 October 45,756,355 24,219,092 69,975,447 November 51,348,993 24,379,721 75,728,714 December 46,994,074 25,816,219 72,810,293 Total 631,272,800 320,846,685 952,119,485
Live Illinois Races Only Thoroughbred Harness All Meets Meets Meets January 970,957 7,337,774 8,308,731 February 2,270,856 9,054,146 11,325,002 March 9,762,906 9,152,571 18,915,477 April 13,067,937 8,641,019 21,708,956 May 17,348,310 8,746,182 26,094,492 June 18,919,621 9,054,821 27,974,442 July 21,008,083 9,291,283 30,299,366 August 23,222,523 10,189,678 33,412,201 September 16,311,324 9,425,117 25,736,441 October 9,565,728 8,169,180 17,734,908 November 10,060,301 8,137,682 18,197,983 December 10,307,603 9,006,551 19,314,154 Total 152,816,149 106,206,004 259,022,153
Simulcast Races Only Thoroughbred Harness All Meets Meets Meets January 42,069,792 17,295,851 59,365,643 February 42,905,985 17,217,157 60,123,142 March 42,961,833 18,629,188 61,591,021 April 40,086,206 18,902,647 58,988,853 May 51,373,645 18,992,261 70,365,906 June 38,229,471 19,656,743 57,886,214 July 36,690,152 18,900,633 55,590,785 August 36,030,658 18,559,171 54,589,829 September 33,943,119 17,385,411 51,328,530 October 36,190,627 16,049,912 52,240,539 November 41,288,692 16,242,039 57,530,731 December 36,686,471 16,809,668 53,496,139 Total 478,456,651 214,640,681 693,097,332
Page 15

IRB-1 (R-6/07)
2006 Comparison of Location Handles
Live Illinois Racing and Simulcasts On Inter Off Live Amount On Track Inter Track Off TrackPrograms Wagered Track % Track % Track % Thoroughbred meetings 95 Arlington Park 302,355,796 88,172,360 29.2% 66,405,119 22.0% 147,778,317 48.9% 49 National Jockey Club (Hawthorne) 139,254,016 22,079,104 15.9% 42,155,464 30.3% 75,019,448 53.9% 77 Hawthorne Race Course 171,457,034 27,122,199 15.8% 47,020,045 27.4% 97,314,790 56.8% 126 Hawthorne (both Meets) 310,711,050 49,201,303 15.8% 89,175,509 28.7% 172,334,238 55.5% 90 Fairmount Park 18,205,954 12,827,023 70.5% 1,620,427 8.9% 3,758,504 20.6%
311 Thoroughbred Total 631,272,800 150,200,686 23.8% 157,201,055 24.9% 323,871,059 51.3% Harness meetings 197 Balmoral Racing Club 173,532,408 19,270,790 11.1% 54,002,713 31.1% 100,258,905 57.8% 59 Maywood Park Trotting Assoc. 72,040,023 10,365,517 14.4% 19,445,810 27.0% 42,228,696 58.6% 30 Associates Racing Assoc. (Maywood) 32,744,509 4,877,706 14.9% 8,208,128 25.1% 19,658,675 60.0% 89 Maywood Park (both meets) 104,784,532 15,243,223 14.5% 27,653,938 26.4% 61,887,371 59.1% 37 Suburban Downs (Hawthorne) 40,800,370 6,403,102 15.7% 11,351,506 27.8% 23,045,762 56.5% 6 Springfi eld State Fair 1,089,889 588,572 54.0% 200,171 18.4% 301,146 27.6% 4 Du Quoin State Fair 615,659 270,506 43.9% 124,773 20.3% 220,380 35.8% 2 Brown County Fair 23,827 23,827 100.0% 0 0.0% 0 0.0% 335 Harness total 320,846,685 41,800,020 13.0% 93,333,101 29.1% 185,713,564 57.9% 646 Total all racing 952,119,485 192,000,706 20.2% 250,534,156 26.3% 509,584,623 53.5%
Live Illinois Racing Only On Inter OffLive Amount On Track Inter Track Off TrackPrograms Wagered Track % Track % Track % Thoroughbred meetings 95 Arlington Park 74,409,834 46,215,951 60.5% 9,856,084 12.9% 20,337,799 26.6% 49 National Jockey Club (Hawthorne) 21,718,053 7,689,015 35.4% 5,271,391 24.3% 8,757,647 40.3% 77 Hawthorne Race Course 36,482,308 11,501,309 31.5% 8,527,466 23.4% 16,453,533 45.1% 126 Hawthorne (both meets) 58,200,361 19,190,324 33.0% 13,798,857 23.7% 25,211,180 43.3% 90 Fairmount Park 18,205,954 12,827,023 70.5% 1,620,427 8.9% 3,758,504 20.6% 311 Thoroughbred total 152,816,149 78,233,298 51.2% 25,275,368 16.5% 49,307,483 32.3% Harness meetings197 Balmoral Racing Club 62,122,494 13,397,117 21.6% 16,691,330 26.9% 32,034,047 51.6% 59 Maywood Park Trotting Assoc. 19,404,811 5,020,835 25.9% 4,198,213 21.6% 10,185,763 52.5% 30 Associates Racing Assoc. (Maywood) 9,971,029 2,515,761 25.2% 2,063,672 20.7% 5,391,596 54.1% 89 Maywood Park (both meets) 29,375,840 7,536,596 25.7% 6,261,885 21.3% 15,577,359 53.0% 37 Suburban Downs (Hawthorne) 12,978,295 3,625,982 27.9% 3,025,607 23.3% 6,326,706 48.7% 6 Springfi eld State Fair 1,089,889 588,572 54.0% 200,171 18.4% 301,146 27.6% 4 Du Quoin State Fair 615,659 270,506 43.9% 124,773 20.3% 220,380 35.8% 2 Brown County Fair 23,827 23,827 100.0% 0 0.0% 0 0.0%
335 Harness total 106,206,004 25,442,600 24.0% 26,303,766 24.8% 54,459,638 51.3% 646 Total all racing 259,022,153 103,675,898 40.0% 51,579,134 19.9% 103,767,121 40.1%
Page 16

IRB-1 (R-6/07)
2006 Out-of-State SimulcastsThoroughbred Meetings On Inter OffSimulcast Amount On Track Inter Track Off Track Programs Wagered Track % Track % Track % 2,493 Arlington Park 225,945,963 41,956,409 18.6% 56,549,039 25.0% 127,440,518 56.4% 1,839 Thoroughbred simulcasts 212,403,387 40,914,163 19.3% 52,875,428 24.9% 118,613,796 55.8% 624 Harness simulcasts 13,411,578 1,029,488 7.7% 3,641,668 27.2% 8,740,422 65.2% 30 Quarterhorse simulcasts 130,998 12,758 9.7% 31940 24.4% 86,300 65.9% 1,260 National Jockey Club (Hawthorne) 117,535,963 14,390,089 12.2% 36,884,073 31.4% 66,261,801 56.4% 841 Thoroughbred simulcasts 106,015,054 13,398,884 12.6% 33,646,149 31.7% 58,970,021 55.6% 405 Harness simulcasts 11,461,368 986,768 8.6% 3,222,064 28.1% 7,252,536 63.3% 14 Quarterhorse simulcasts 59,541 4,437 7.5% 15,860 26.6% 39,244 65.9% 1,712 Hawthorne Race Course 134,974,725 15,620,890 11.6% 38,492,578 28.5% 80,861,257 59.9% 1,172 Thoroughbred simulcasts 122,512,299 14,678,416 12.0% 35,326,955 28.8% 72,506,928 59.2% 540 Harness simulcasts 12,462,426 942,474 7.6% 3,165,623 25.4% 8,354,329 67.0% 0 Quarterhorse simulcasts 566,988 71,581 12.6% 139,533 24.6% 355,874 62.8%
2,742 Hawthorne (both meets) 272,649,359 33,003,685 12.1% 85,158,566 31.2% 154,487,108 56.7% 1,980 Thoroughbred simulcasts 249,968,065 31,100,805 12.4% 79,010,757 31.6% 139,856,503 55.9% 733 Harness simulcasts 22,019,992 1,821,454 8.3% 5,981,540 27.2% 14,216,998 64.6% 29 Quarterhorse simulcasts 0 0 0.0% 0 0.0% 0 0.0% 4,845 Thoroughbred Total 480,662,233 74,567,499 15.5% 137,038,043 28.5% 269,056,691 56.0% 3,635 Thoroughbred simulcasts 447,181,432 71,746,484 16.0% 128,076,370 28.6% 247,358,578 55.3% 1,181 Harness simulcasts 32,819,499 2,739,589 8.3% 8,795,404 26.8% 21,284,506 64.9% 29 Quarterhorse simulcasts 661,302 81,426 12.3% 166,269 25.1% 413,607 62.5%
Harness Meetings On Inter OffSimulcast Amount On Track Inter Track Off Track Programs Wagered Track % Track % Track % 2,705 Balmoral Racing Club 111,409,914 5,873,673 5.3% 37,311,383 33.5% 68,224,858 61.2% 1,271 Thoroughbred simulcasts 45,754,506 1,685,734 3.7% 15,811,938 34.6% 28,256,834 61.8% 1,306 Harness simulcasts 58,494,315 3,761,630 7.4% 19,034,653 32.5% 35,698,032 61.0% 128 Quarterhorse simulcasts 7,161,093 426,309 6.0% 2,464,792 34.4% 4,269,662 59.6% 911 Maywood Park Trotting Assn. 52,635,212 5,344,681 10.2% 15,247,598 29.0% 32,042,933 60.9% 451 Thoroughbred simulcasts 23,345,415 1,756,790 7.5% 7,496,114 32.1% 14,092,511 60.4% 383 Harness simulcasts 25,098,764 3,078,851 12.3% 6,671,245 26.6% 15,348,668 61.2% 77 Quarterhorse simulcasts 4,191,033 509,040 12.1% 1,080,239 25.8% 2,601,754 62.1% 418 Associates Racing Assn. (Maywood) 22,773,480 2,361,945 10.4% 6,144,456 27.0% 14,267,079 62.6% 190 Thoroughbred simulcasts 10,656,475 866,042 8.1% 3,088,133 29.0% 6,702,300 62.9% 186 Harness simulcasts 9,656,166 1,205,441 12.5% 2,436,205 25.2% 6,014,520 62.3% 42 Quarterhorse simulcasts 2,460,839 290,462 11.8% 620,118 25.2% 1,550,259 63.0% 1,329 Maywood Park (both meets) 75,408,692 7,706,626 10.2% 21,392,054 28.4% 46,310,012 61.4% 641 Thoroughbred simulcasts 34,001,890 2,622,832 7.7% 10,584,247 31.1% 20,794,811 61.2% 569 Harness simulcasts 34,754,930 4,284,292 12.3% 9,107,450 26.2% 21,363,181 61.5% 119 Quarterhorse simulcasts 6,651,872 799,502 12.0% 1,700,357 25.6% 4,152,013 62.4% 616 Suburban Downs (Hawthorne) 27,822,075 2,777,121 10.0% 8,325,898 29.9% 16,719,056 60.1% 323 Thoroughbred simulcasts 11,419,405 1,068,832 9.4% 3,499,771 30.6% 6,850,802 60.0% 256 Harness simulcasts 14,448,658 1,500,305 10.4% 4,246,939 29.4% 8,701,414 60.2% 37 Quarterhorse simulcasts 1,954,012 207,984 10.6% 579,188 29.6% 1,166,840 59.7% 4,034 Harness Total 214,640,681 16,357,420 7.6% 67,029,335 31.2% 131,253,926 61.2% 1,912 Thoroughbred simulcasts 91,175,801 5,377,398 5.9% 29,895,956 32.8% 55,902,447 61.3% 1,875 Harness simulcasts 107,697,903 9,546,227 8.9% 32,389,042 30.1% 65,762,634 61.1% 247 Quarterhorse simulcasts 15,766,977 1,433,795 9.1% 4,744,337 30.1% 9,588,845 60.8% 9,499 Total all racing 693,097,332 88,324,808 12.7% 198,955,022 28.7% 405,817,502 58.6% 5,764 Thoroughbred simulcasts 532,106,541 74,368,861 14.0% 151,744,488 28.5% 305,993,192 57.5% 3,444 Harness simulcasts 145,033,275 12,504,957 8.6% 42,418,397 29.2% 90,109,921 62.1% 291 Quarterhorse simulcasts 15,957,516 1,450,990 9.1% 4,792,137 30.0% 9,714,389 60.9%
Page 17

IRB-1 (R-6/07)
On Track Thoroughbred Harness All Meets Meets MeetsLive programs raced Total live programs raced plus dark days Live races run Attendance Admission tax License fee License fee-daily handle
Live Racing Day Handle Illinois handle on Illinois races Illinois handle on out-of-state races Combined Illinois handle Dark Day Handle (Illinois handle on out-of-state races) Total dark day handle
Total Illinois handle
Average Live Racing Day HandleAverage Illinois handle on Illinois races Average Illinois handle on out-of-state racesAverage combined Illinois handle
Average Dark Day Handle (Illinois handle on out-of-state races)Average total dark day handle
Combined Illinois handle $ - commission (take out) $ - track commission $ - purses earned $ - out-of-state simulcast fee $ - pari-mutuel tax $ Public pool $ - breakage $ - surcharge $ Payout to public $
311 335 646 455 380 835 2,858 3,932 6,790 1,124,713 340,063 1,464,776 59,274 7,373 66,647 38,540 43,050 81,590 7,300 100 7,400 78,233,298 25,442,600 103,675,898 54,629,862 15,606,896 70,236,758 132,863,160 41,049,496 173,912,656
17,337,526 750,524 18,088,050 150,200,686 41,800,020 192,000,706
251,554 75,948 160,489 175,659 46,588 108,726 427,213 122,536 269,215 120,399 16,678 95,704 150,200,686 41,800,020 192,000,706 29,722,230 8,698,508 38,420,738 12,583,187 3,806,171 16,389,358 12,583,187 3,806,171 16,389,358 2,407,436 459,176 2,866,612 2,148,420 626,990 2,775,410 120,478,456 33,101,512 153,579,968 986,682 250,421 1,237,103 102,600 176,169 278,769 119,389,174 32,674,922 152,064,096
Page 18

IRB-1 (R-6/07)
Intertrack Thoroughbred Harness All Meets Meets MeetsLive programs raced
Attendance Admission tax
Live Racing Day Handle Illinois handle on Illinois races Illinois handle on out-of-state races Combined Illinois handle
Dark Day Handle (Illinois handle on out-of-state races) Total dark day handle
Total Illinois handle
Average Live Racing Day HandleAverage Illinois handle on Illinois races Average Illinois handle on out-of-state races Average combined Illinois handle
Average Dark Day Handle (Illinois handle on out-of-state races)Average total dark day handle
Combined Illinois handle $ - commission (take out) $ - track commission $ - purses earned $ - out-of-state simulcast fee $ - pari-mutuel tax $ Public pool $ - breakage $ - surcharge $ Payout to public $
1,605 1,866 3,471 519,199 374,729 893,928 17,092 10,924 28,016 25,275,368 26,303,766 51,579,134 88,544,808 61,721,026 150,265,834 113,820,176 88,024,792 201,844,968 43,380,879 5,308,309 48,689,188 157,201,055 93,333,101 250,534,156
81,271 70,331 75,298 284,710 165,029 219,366 365,981 235,360 294,664 301,256 117,962 257,615 157,201,055 93,333,101 250,534,156 31,679,388 19,578,555 51,257,943 12,564,772 8,204,386 20,769,158 12,564,772 8,204,386 20,769,158 4,422,930 1,874,903 6,297,833 2,126,914 1,294,880 3,421,794 125,521,667 73,754,546 199,276,213 792,027 460,182 1,252,209 1,948,669 1,114,468 3,063,137 122,780,971 72,179,896 194,960,867
Page 19

IRB-1 (R-6/07)
Off Track (OTB Parlors) Thoroughbred Harness All Meets Meets Meets Live programs raced
Live Racing Day Handle Illinois handle on Illinois races Illinois handle on out-of-state races Combined Illinois handle
Dark Day Handle (Illinois handle on out-of-state races) Total dark day handle
Total Illinois handle
Average Live Racing Day Handle Average Illinois handle on Illinois races Average Illinois handle on out-of-state races Average combined Illinois handle
Average Dark Day Handle (Illinois handle on out-of-state races) Average total dark day handle
Combined Illinois handle $ -commission (take out) $ -track commission $ -purses earned $ -out-of-state simulcast fee $ -pari-mutuel tax $ Public pool $ -breakage $ - surcharge $ Payout to public $
8,308 9,536 17,844
49,307,483 54,459,638 103,767,121 182,037,455 119,628,500 301,665,955 231,344,938 174,088,138 405,433,076 92,526,121 11,625,426 104,151,547 323,871,059 185,713,564 509,584,623
158,545 145,614 151,485 585,329 319,862 440,388 743,874 465,476 591,873 642,543 258,343 551,066 323,871,059 185,713,564 509,584,623 66,213,225 39,418,097 105,631,322 28,473,643 19,263,383 47,737,026 23,849,537 13,789,763 37,639,300 9,198,622 3,664,279 12,862,901 4,691,423 2,700,672 7,392,095 257,657,834 146,295,467 403,953,301 1,374,665 784,325 2,158,990 6,232,190 3,538,899 9,771,089 250,050,979 141,972,243 392,023,222
Page 20

IRB-1 (R-6/07)
All Locations Thoroughbred Harness All Meets Meets MeetsLive programs raced Total live programs raced plus dark days Live races run Attendance Admission tax License fee License fee-daily handle
Purses distributed Uncashed tickets (2004)
Live Racing Day Handle Illinois handle on Illinois races Illinois handle on out-of-state races Combined Illinois handle Out-of-state handle (commingled) on Illinois races Total live racing day handle
Dark Day Handle (Illinois handle on out-of-state races) Total dark day handle
Total Illinois handle Out-of-state commingled handle Grand total meet handle
Average Live Racing Day HandleAverage Illinois handle on Illinois races Average Illinois handle on out-of-state racesAverage combined Illinois handle Average out-of-state handle (commingled) on Illinois races Average total live racing day handle
Average Dark Day Handle (Illinois handle on out-of-state races)Average total dark day handle
Combined Illinois handle $ - commission (take out) $ - track commission $ - purses earned $ - out-of-state simulcast fee $ - pari-mutuel tax $ Public pool $ - breakage $ - surcharge $ Payout to public $
10,224 11,737 21,961 455 380 835 2,858 3,932 6,790 1,643,912 714,792 2,358,704 76,366 18,297 94,663 38,540 43,050 81,590 7,300 100 7,400 57,314,077 31,810,706 89,124,783 2,776,259 1,813,307 4,589,566
152,816,149 106,206,004 259,022,153 325,212,125 196,956,422 522,168,547 478,028,274 303,162,426 781,190,700 574,892,940 269,898,819 844,791,759 1,052,921,214 573,061,245 1,625,982,459
153,244,526 17,684,259 170,928,785 631,272,800 320,846,685 952,119,485 574,892,940 269,898,819 844,791,759 1,206,165,740 590,745,504 1,796,911,244
491,370 283,973 378,135 1,045,698 526,621 762,290 1,537,068 810,595 1,140,424 1,848,530 721,655 1,233,273 3,385,599 1,532,249 2,373,697
1,064,198 392,984 904,385 631,272,800 320,846,685 952,119,485 127,614,842 67,695,160 195,310,033 53,621,602 31,273,940 84,895,542 48,997,496 25,800,320 74,797,816 16,028,987 5,998,358 22,027,346 8,966,757 4,622,542 13,589,299 503,657,958 253,151,525 756,809,482 3,153,374 1,494,928 4,648,302 8,283,459 4,829,536 13,112,995 492,221,125 246,827,061 739,048,185
Page 21

IRB-1 (R-6/07)
2006 Comparison of Wagering PoolsCombined Live Racing and Simulcasts
Total On Inter Off % Thoroughbred Meets Handle Track % Track % Track % Arlington Park 37.1% Win, Place, and Show 112,243,857 38,354,739 34.2% 24,374,450 21.7% 49,514,668 44.1% 28.8% 2-horse 87,011,712 23,111,420 26.6% 19,585,770 22.5% 44,314,522 50.9% 34.1% 3-horse 103,100,227 26,706,201 25.9% 22,444,899 21.8% 53,949,127 52.3% Total Handle 302,355,796 88,172,360 29.2% 66,405,119 22.0% 147,778,317 48.9% Natl. Jockey Club (Hawthorne) 34.4% Win, Place, and Show 47,853,793 9,404,506 19.7% 14,639,506 30.6% 23,809,781 49.8% 30.2% 2-horse 42,040,492 6,330,366 15.1% 12,339,511 29.4% 23,370,615 55.6% 35.4% 3-horse 49,359,731 6,344,232 12.9% 15,176,447 30.7% 27,839,052 56.4% Total Handle 139,254,016 22,079,104 15.9% 42,155,464 30.3% 75,019,448 53.9% Hawthorne Race Course 34.3% Win, Place, and Show 58,861,716 11,692,472 19.9% 15,706,838 26.7% 31,462,406 53.5% 29.5% 2-horse 50,540,465 7,430,219 14.7% 13,679,867 27.1% 29,430,379 58.2% 36.2% 3-horse 62,054,853 7,999,508 12.9% 17,633,340 28.4% 36,422,005 58.7% Total Handle 171,457,034 27,122,199 15.8% 47,020,045 27.4% 97,314,790 56.8% Hawthorne (both meets) 34.3% Win, Place, and Show 106,715,509 21,096,978 19.8% 30,346,344 28.4% 55,272,187 51.8% 29.8% 2-horse 92,580,957 13,760,585 14.9% 26,019,378 28.1% 52,800,994 57.0% 35.9% 3-horse 111,414,584 14,343,740 12.9% 32,809,787 29.4% 64,261,057 57.7% Total Handle 310,711,050 49,201,303 15.8% 89,175,509 28.7% 172,334,238 55.5% Fairmount Park 44.7% Win, Place, and Show 8,137,277 6,130,435 75.3% 661,684 8.1% 1,345,158 16.5% 32.0% 2-horse 5,829,356 3,932,228 67.5% 555,192 9.5% 1,341,936 23.0% 23.3% 3-horse 4,239,321 2,764,360 65.2% 403,551 9.5% 1,071,410 25.3% Total Handle 18,205,954 12,827,023 70.5% 1,620,427 8.9% 3,758,504 20.6% Thoroughbred Total 36.0% Win, Place, and Show 227,096,643 65,582,152 28.9% 55,382,478 24.4% 106,132,013 46.7% 29.4% 2-horse 185,422,025 40,804,233 22.0% 46,160,340 24.9% 98,457,452 53.1% 34.7% 3-horse 218,754,132 43,814,301 20.0% 55,658,237 25.4% 119,281,594 54.5% Total Handle 631,272,800 150,200,686 23.8% 157,201,055 24.9% 323,871,059 51.3% Total On Inter Off % Harness Meets Handle Track % Track % Track % Balmoral Racing Club 30.7% Win, Place, and Show 52,939,566 6,695,030 12.6% 17,010,994 32.1% 29,233,542 55.2% 27.7% 2-horse 48,043,734 5,091,830 10.6% 14,840,461 30.9% 28,111,443 58.5% 41.8% 3-horse 72,549,108 7,483,930 10.3% 22,151,258 30.5% 42,913,920 59.2% Total Handle 173,532,408 19,270,790 11.1% 54,002,713 31.1% 100,258,905 57.8%
Maywood Park Trot. Assoc. 31.3% Win, Place, and Show 22,542,250 3,738,193 16.6% 6,253,717 27.7% 12,550,340 55.7% 28.2% 2-horse 20,282,732 2,902,795 14.3% 5,406,240 26.7% 11,973,697 59.0% 40.6% 3-horse 29,215,041 3,724,529 12.7% 7,785,853 26.7% 17,704,659 60.6% Total Handle 72,040,023 10,365,517 14.4% 19,445,810 27.0% 42,228,696 58.6% Associates Racing Assoc. 31.0% Win, Place, and Show 10,137,435 1,755,337 17.3% 2,610,236 25.7% 5,771,862 56.9% 27.8% 2-horse 9,118,206 1,390,201 15.2% 2,207,214 24.2% 5,520,791 60.5% 41.2% 3-horse 13,488,868 1,732,168 12.8% 3,390,678 25.1% 8,366,022 62.0% Total Handle 32,744,509 4,877,706 14.9% 8,208,128 25.1% 19,658,675 60.0% Maywood Park (both meets) 31.2% Win, Place, and Show 32,679,685 5,493,530 16.8% 8,863,953 27.1% 18,322,202 56.1% 28.1% 2-horse 29,400,938 4,292,996 14.6% 7,613,454 25.9% 17,494,488 59.5% 40.8% 3-horse 42,703,909 5,456,697 12.8% 11,176,531 26.2% 26,070,681 61.0% Total Handle 104,784,532 15,243,223 14.5% 27,653,938 26.4% 61,887,371 59.1%
Page 22

IRB-1 (R-6/07)
Total On Inter Off % Harness Meets (contd.) Handle Track % Track % Track % Suburban Downs (Hawthorne) 31.4% Win, Place, and Show 12,808,219 2,413,723 18.8% 3,542,028 27.7% 6,852,468 53.5% 28.2% 2-horse 11,502,288 1,821,855 15.8% 3,174,527 27.6% 6,505,906 56.6% 40.4% 3-horse 16,489,863 2,167,524 13.1% 4,634,951 28.1% 9,687,388 58.7% Total Handle 40,800,370 6,403,102 15.7% 11,351,506 27.8% 23,045,762 56.5% DuQuoin State Fair 37.4% Win, Place, and Show 230,254 124,866 54.2% 44,470 19.3% 60,918 26.5% 29.4% 2-horse 181,291 68,682 37.9% 38,227 21.1% 74,382 41.0% 33.2% 3-horse 204,114 76,958 37.7% 42,076 20.6% 85,080 41.7% Total Handle 615,659 270,506 43.9% 124,773 20.3% 220,380 35.8% Springfi eld State Fair 38.3% Win, Place, and Show 417,042 253,895 60.9% 65,893 15.8% 97,254 23.3% 31.7% 2-horse 345,266 179,910 52.1% 65,551 19.0% 99,805 28.9% 30.1% 3-horse 327,581 154,767 47.2% 68,727 21.0% 104,087 31.8% Total Handle 1,089,889 588,572 54.0% 200,171 18.4% 301,146 27.6% Brown County Fair 60.2% Win, Place, and Show 14,348 14,348 100.0% 0 N/A 0 N/A 32.4% 2-horse 7,710 7,710 100.0% 0 N/A 0 N/A 7.4% 3-horse 1,769 1,769 100.0% 0 N/A 0 N/A Total Handle 23,827 23,827 100.0% 0 N/A 0 N/A Harness Total 30.9% Win, Place, and Show 99,089,114 14,995,392 15.1% 29,527,338 29.8% 54,566,384 55.1% 27.9% 2-horse 89,481,227 11,462,983 12.8% 25,732,220 28.8% 52,286,024 58.4% 41.2% 3-horse 132,276,344 15,341,345 11.6% 38,073,543 28.8% 78,861,156 59.6% Total Handle 320,846,685 41,800,020 13.0% 93,333,101 29.1% 185,713,564 57.9% All Racing Total 34.3% Win, Place, and Show 326,185,757 80,577,544 24.7% 84,909,816 26.0% 160,698,397 49.3% 28.9% 2-horse 274,903,252 52,267,216 19.0% 71,892,560 26.2% 150,743,476 54.8% 36.9% 3-horse 351,030,476 59,155,946 16.9% 93,731,780 26.7% 198,142,750 56.4% Total Handle 952,119,485 192,000,706 20.2% 250,534,156 26.3% 509,584,623 53.5% Total On Inter Off Live Illinois Racing Handle Track % Track % Track % 36.9% Win, Place, and Show 95,648,071 46,296,965 48.4% 16,783,436 17.5% 32,567,670 34.0% 27.5% 2-horse 71,257,889 27,184,814 38.1% 14,513,088 20.4% 29,559,987 41.5% 35.6% 3-horse 92,116,193 30,194,119 32.8% 20,282,610 22.0% 41,639,464 45.2% Total Handle 259,022,153 103,675,898 40.0% 51,579,134 19.9% 103,767,121 40.1% Simulcast Races 33.3% Win, Place, and Show 230,537,686 34,280,579 14.9% 68,126,380 29.6% 128,130,727 55.6% 29.4% 2-horse 203,645,363 25,082,402 12.3% 57,379,472 28.2% 121,183,489 59.5% 37.4% 3-horse 258,914,283 28,961,825 11.2% 73,449,171 28.4% 156,503,287 60.4% Total Handle 693,097,332 88,324,806 12.7% 198,955,023 28.7% 405,817,503 58.6%
Average Takeout Rates When Simulcasting Out-Of-State Races (Based on actual Illinois wagering combinations on out-of-state races)
Win, Place, Show 2-Horse 3-Horse Illinois thoroughbred meets 16.63% 20.21% 23.77% Illinois harness meets 17.25% 21.20% 24.02% Total Illinois meets 16.81% 20.51% 23.86%
Page 23

IRB-1 (R-6/07)
2006 Off Track Parlor Handles Average Live Illinois Simulcast Total Daily Handle Handle Handle Handle
Oakbrook Terrace - Hawthorne 14,383,654 59,028,347 73,412,001 201,681 Crestwood - (NJC at Hawthorne) 12,732,416 38,091,534 50,823,950 139,626 Chicago (Weed St.) - Arlington 8,483,082 41,617,077 50,100,159 137,638 Chicago (Corliss) - Balmoral 10,889,290 35,031,627 45,920,917 126,156 Niles - Maywood (opened 4/24/06) 7,008,897 24,127,865 31,136,762 124,051 Waukegan - Arlington 5,963,180 31,230,911 37,194,091 102,182 Chicago (W. Jackson) - Maywood 6,211,570 24,526,368 30,737,938 84,445 Joliet (NJC at Hawthorne) 4,624,285 16,696,645 21,320,930 58,574 Chicago (State St.) - Hawthorne 3,912,002 17,338,564 21,250,566 58,381 Rockford - Quad City Downs 3,565,549 14,293,194 17,858,743 49,062 Sauget - Fairmount 2,159,865 11,451,877 13,611,742 37,395 South Elgin - Quad City Downs 2,605,637 10,570,889 13,176,526 36,199 Aurora - Maywood 2,804,895 10,159,247 12,964,142 35,616 Mokena - Maywood 3,178,793 8,574,976 11,753,769 32,291 McHenry - Quad City Downs 2,247,387 7,832,073 10,079,460 27,691 Springfi eld- Fairmount 1,912,671 7,038,208 8,950,879 24,590 Alton - Fairmount 1,172,607 6,310,510 7,483,117 20,558 Urbana - Balmoral 1,294,391 6,024,904 7,319,295 20,108 South Beloit - Quad City Downs 1,253,734 5,679,035 6,932,769 19,046 Peoria - Balmoral 1,560,226 5,368,605 6,928,831 19,035 Danville - Balmoral 917,722 5,804,366 6,722,088 18,467 Tinley Park - Balmoral 1,609,326 5,081,424 6,690,750 18,381 Peru - (NJC at Hawthorne) 1,259,299 4,381,120 5,640,419 15,496 Carbondale - Fairmount 1,014,884 4,583,391 5,598,275 15,380 Bloomington - Balmoral (closed 6/25/06) 362,372 2,052,323 2,414,695 13,720 Normal - Balmoral (opened 7/13/06) 470,055 1,736,107 2,206,162 12,902 Grayville - Fairmount (closed 5/22/06) 169,332 1,186,315 1,355,647 9,547 Total 103,767,121 405,817,502 509,584,623 1,399,958
2006 Intertrack Handles Average Live Illinois Simulcast Total Daily Handle Handle Handle Handle
Arlington Park 13,705,345 52,843,316 66,548,661 182,826 Maywood Park 13,338,543 46,492,515 59,831,058 164,371 Fairmount Park 6,877,230 40,847,404 47,724,634 131,112 Hawthorne Race Course 10,987,061 32,426,422 43,413,483 119,268 Quad City Downs 3,562,467 13,245,174 16,807,641 46,175 Balmoral Park 3,108,488 13,100,191 16,208,679 44,529 Total 51,579,134 198,955,022 250,534,156 688,281
Page 24

IRB-1 (R-6/07)
Summary of Surcharges and Revenues to Local Governments from Off Track Parlors in 2005
Total Revenue Revenue Over/under Date Date Surcharge to City to County to City - Licensee Code Opened Closed County Handle on Winnings 1% of Handle 1% of Handle Licensee Waukegan - ARL 12/30/88 Lake 37,194,091 718,140 371,941 371,941 (25,742) Chicago (Weed St.) - ARL 06/04/93 Cook 50,100,159 968,599 501,002 501,002 (33,404) Danville - BAL 01/24/91 Vermillion 6,722,088 123,445 67,221 67,221 (10,997) Chicago (Corliss) - BAL 04/18/91 Cook 45,920,917 862,359 459,209 459,209 (56,059) Urbana - BAL 10/27/05 Champaign 7,319,295 138,096 73,193 73,193 (8,290) Bloomington - BAL 06/10/05 06/25/06 McLean 2,414,695 47,894 24,147 24,147 (400) Normal - BAL* 07/13/06 McLean 2,206,162 42,161 22,062 22,062 (1,962) Peoria - BAL 05/03/00 Peoria 6,928,831 133,018 69,288 69,288 (5,559) Tinley Park - BAL 07/16/05 Cook 6,690,750 129,999 66,908 66,908 (3,816) Springfi eld - FMT 05/05/88 Sangamon 8,950,879 171,171 89,509 89,509 (7,847) Grayville - FMT 08/07/89 05/22/06 White 1,355,647 25,660 13,556 13,556 (1,453) Carbondale - FMT 08/20/92 Jackson 5,598,275 107,522 55,983 55,983 (4,444) Sauget - FMT 02/12/01 St. Clair 13,611,742 261,135 136,117 136,117 (11,100) Alton - FMT 10/03/02 Madison 7,483,117 144,061 74,831 74,831 (5,601) Chicago (State St.) - HAW 10/24/89 Cook 21,250,566 407,671 212,506 212,506 (17,340) Oakbrook Terrace - HAW 09/04/92 DuPage 73,412,001 1,412,918 734,120 734,120 (55,322) Joliet - NJC at HAW 10/25/90 Will 21,320,930 409,772 213,209 213,209 (16,647) Crestwood - NJC at HAW 02/17/92 Cook 50,823,950 969,712 508,240 508,240 (46,767) Peru - NJC at HAW 03/05/92 LaSalle 5,640,419 108,656 56,404 56,404 (4,152) Chicago (W. Jackson) - MAY 07/19/88 Cook 30,737,938 592,769 307,379 307,379 (21,990) Niles - MAY* 04/24/06 Cook 31,136,762 604,148 311,368 311,368 (18,587) Mokena - MAY 05/16/03 Will 11,753,769 225,835 117,538 117,538 (9,240) Aurora - MAY 04/08/05 DuPage 12,964,142 250,511 129,641 129,641 (8,772) South Beloit - QCD 02/17/04 Winnebago 6,932,769 130,792 69,328 69,328 (7,863) South Elgin - QCD 12/07/02 Kane 13,176,526 253,265 131,765 131,765 (10,266) McHenry - QCD 12/08/05 McHenry 10,079,460 193,656 100,795 100,795 (7,933) Rockford - QCD 11/18/87 Winnebago 17,858,743 338,122 178,587 178,587 (19,053)
Total 509,584,623 9,771,087 5,095,846 5,095,846 (420,605)
* OTB parlors in bold opened in 2006
Licensee Codes: ARL Arlington MAY Maywood BAL Balmoral HAW Hawthorne FMT Fairmount QCD Quad City Downs
Page 25
IRB-1 (R-6/07)
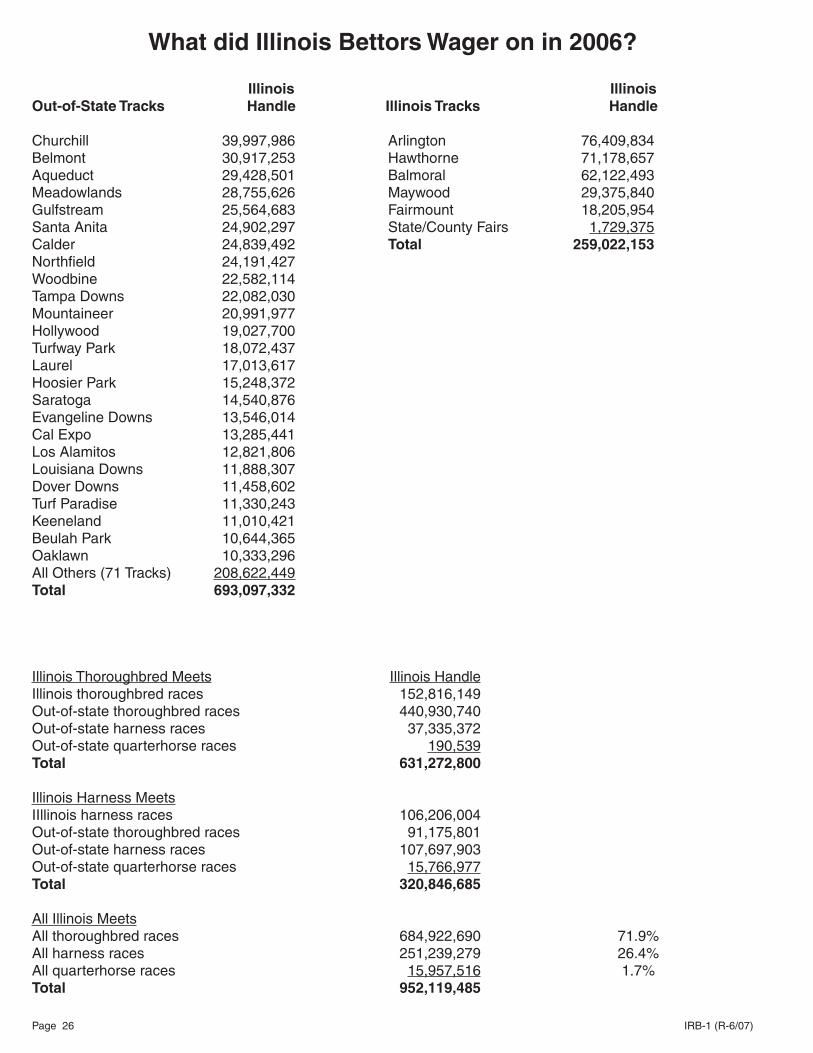
What did Illinois Bettors Wager on in 2006?
Illinois Illinois Out-of-State Tracks Handle Illinois Tracks Handle Churchill 39,997,986 Arlington 76,409,834 Belmont 30,917,253 Hawthorne 71,178,657 Aqueduct 29,428,501 Balmoral 62,122,493 Meadowlands 28,755,626 Maywood 29,375,840 Gulfstream 25,564,683 Fairmount 18,205,954 Santa Anita 24,902,297 State/County Fairs 1,729,375 Calder 24,839,492 Total 259,022,153 Northfi eld 24,191,427 Woodbine 22,582,114 Tampa Downs 22,082,030 Mountaineer 20,991,977 Hollywood 19,027,700 Turfway Park 18,072,437 Laurel 17,013,617 Hoosier Park 15,248,372 Saratoga 14,540,876 Evangeline Downs 13,546,014 Cal Expo 13,285,441 Los Alamitos 12,821,806 Louisiana Downs 11,888,307 Dover Downs 11,458,602 Turf Paradise 11,330,243 Keeneland 11,010,421 Beulah Park 10,644,365Oaklawn 10,333,296 All Others (71 Tracks) 208,622,449 Total 693,097,332
Illinois Thoroughbred Meets Illinois Handle Illinois thoroughbred races 152,816,149 Out-of-state thoroughbred races 440,930,740 Out-of-state harness races 37,335,372 Out-of-state quarterhorse races 190,539 Total 631,272,800 Illinois Harness MeetsIIllinois harness races 106,206,004 Out-of-state thoroughbred races 91,175,801 Out-of-state harness races 107,697,903 Out-of-state quarterhorse races 15,766,977 Total 320,846,685 All Illinois Meets All thoroughbred races 684,922,690 71.9% All harness races 251,239,279 26.4% All quarterhorse races 15,957,516 1.7% Total 952,119,485
Page 26

IRB-1 (R-6/07)
2006 Commingled Handle vs. Simulcast Handle Commingled in Simulcasting Out-of-State Illinois Handle Handle into on Out-of-State “Trade Balance” Thoroughbred Meets Illinois Pools Races Difference Dark period 1/3-2/8 (Arlington) 0 51,922,465 (51,922,465) Dark period 2/9-2/23 (NJC at Hawthorne) 0 22,967,221 (22,967,221) Total dark period (both meets) 0 74,889,686 (74,889,686) National Jockey Club at Hawthorne 93,488,588 94,568,742 (1,080,154) Arlington Park 294,328,029 174,023,498 120,304,531 Hawthorne Race Course 177,406,912 134,974,725 42,432,187 Fairmount Park 9,669,411 0 9,669,411 Thoroughbred Total 574,892,940 478,456,651 96,436,289
Commingled in Simulcasting Out-of-State Illinois Handle Handle into on Out-of-State “Trade Balance” Harness Meets Illinois Pools Races Difference Balmoral Racing Club 159,023,397 111,409,914 47,613,483 Maywood Park Trotting 52,915,892 52,635,212 280,680 Associates Racing (Maywood) 29,048,021 22,773,480 6,274,541 Suburban Downs (Hawthorne) 28,539,946 27,822,075 717,871 Springfi eld Fair 104,628 0 104,628 DuQuoin Fair 266,935 0 266,935
Harness total 269,898,819 214,640,681 55,258,138
All racing total 844,791,759 693,097,332 151,694,427
1988-2006 “Trade Balance” from Simulcasting into and out of Illinois Commingled in Simulcasting
Out-of-State Illinois Handle “Trade Handle into on Out-of-State Balance” Illinois Pools Races Difference 1988 not allowed 17,561,687 (17,561,687) 1989 not allowed 21,489,159 (21,489,159) 1990 18,795,400 23,020,321 (4,224,921) 1991 17,255,791 30,321,477 (13,065,686) 1992 82,581,380 34,054,510 48,526,870 1993 127,121,414 47,861,326 79,260,088 1994 233,137,790 56,851,822 176,285,968 1995 297,133,418 329,642,288 (32,508,870) 1996 551,232,436 572,268,505 (21,036,069) 1997 524,992,359 626,324,386 (101,332,027) 1998 455,011,181 699,709,458 (244,698,277) 1999 516,104,829 729,639,342 (213,534,513) 2000 628,884,689 724,779,204 (95,894,515) 2001 743,634,500 738,639,096 4,995,404 2002 914,879,233 749,400,714 165,478,519 2003 765,812,794 759,673,491 6,139,303 2004 834,052,261 732,303,750 101,748,511 2005 896,740,508 699,214,766 197,525,742 2006 844,791,759 693,097,332 151,694,427
Note: In 2002, Arlington commingled in $91.5 million on Breeder’s Cup Day. In 2003, there was a harness labor dispute totaling 86 days.
Page 27

IRB-1 (R-6/07)
Thoroughbred MeetsAverage Daily Handle and Purses on Live Race Days
National Jockey Club atSportsman’s/Hawthorne 2000 2001 2002 2003 2004 2005 2006 (at Hawthorne) (at Hawthorne) (at Hawthorne) (at Hawthorne)
Live racing programs 54 43 46 48 47 54 48
Purses distributed 216,696 245,753 237,431 213,278 220,118 219,651 203,741
Total Illinois on Illinois races 624,658 688,256 620,032 668,693 627,418 554,926 444,062
Total Illinois on out-of-state races 1,540,174 1,468,438 1,699,308 1,667,053 1,717,830 1,602,718 1,428,689
Total Illinois on Illinois and out-of-state races 2,164,832 2,156,694 2,319,340 2,335,746 2,345,248 2,157,644 1,872,751
Out-of-state on Illinois races 1,137,766 1,511,526 1,437,547 1,751,127 1,753,409 1,664,097 1,920,860
Arlington Park 2000 2001 2002 2003 2004 2005 2006 (w/o Br. Cup)
Live racing programs 103 101 106 104 96 94 95
Purses distributed 305,251 310,612 299,920 280,752 274,649 257,724 272,225
Total Illinois on Illinois races 1,068,823 960,413 986,668 948,402 958,968 949,366 804,314
Total Illinois on out-of-state races 1,323,324 1,389,963 1,402,597 1,473,809 1,483,462 1,436,599 1,517,993
Total Illinois on Illinois and out-of-state races 2,392,147 2,350,376 2,389,264 2,422,211 2,442,429 2,385,965 2,322,307
Out-of-state on Illinois races 2,019,177 2,460,018 2,923,163 2,980,198 3,062,295 3,299,126 3,098,190
Hawthorne Race Course 2000 2001 2002 2003 2004 2005 2006
Live racing programs 62 77 66 67 67 71 77
Purses distributed 214,194 209,208 216,601 212,231 209,518 213,095 202,718
Total Illinois on Illinois races 661,768 725,053 692,039 629,954 611,392 534,505 473,796
Total Illinois on out-of-state races 1,405,064 1,489,030 1,420,389 1,484,281 1,452,927 1,381,435 1,437,594
Total Illinois on Illinois and out-of-state races 2,066,832 2,214,083 2,112,428 2,114,235 2,064,319 1,915,940 1,911,390
Out-of-state on Illinois races 1,329,816 1,684,470 1,883,195 2,184,505 2,173,811 2,449,988 2,303,986
Fairmount 2000 2001 2002 2003 2004 2005 2006
Live racing programs 146 125 110 102 101 102 90
Purses distributed 65,293 57,030 72,224 64,412 64,174 59,155 67,225
Total Illinois on Illinois races 224,563 211,823 210,756 228,902 210,461 188,798 202,288
Out-of-state on Illinois races 97,250 83,522 73,484 110,676 83,542 92,267 107,438
Page 28

IRB-1 (R-6/07)
Harness Meets Average Daily Handle and Purses on Live Race Days
Balmoral 2000 2001 2002 2003 2004 2005 2006
Live racing programs 206 204 198 128 173 180 197
Purses distributed 118,603 113,576 111,528 131,217 114,725 101,790 96,438
Total Illinois on Illinois races 502,564 488,767 481,895 439,983 429,073 379,888 315,343
Total Illinois on out-of-state races 621,218 640,871 635,223 627,479 598,786 572,152 515,935
Total Illinois on Illinois and out-of-state races 1,123,782 1,129,638 1,117,118 1,067,461 1,027,859 952,040 831,277
Out-of-state on Illinois races 830,576 868,362 964,709 886,313 970,584 939,311 826,571
Maywood 2000 2001 2002 2003 2004 2005 2006
Live racing programs 153 155 122 97 133 132 89
Purses distributed 97,237 89,500 89,184 96,466 89,032 71,793 74,915
Total Illinois on Illinois races 357,221 363,768 380,336 341,655 334,294 292,304 330,066
Total Illinois on out-of-state races 711,551 708,559 707,473 696,935 688,874 653,275 823,249
Total Illinois on Illinois and out-of-state races 1,068,772 1,072,327 1,087,810 1,038,591 1,023,168 945,579 1,153,314
Out-of-state on Illinois races 598,540 725,295 831,542 700,465 729,682 775,157 920,943
Suburban Downs atHawthorne 2000 2001 2002 2003 2004 2005 2006
Live racing programs 37 49 55 48 37
Purses distributed 116,647 97,852 104,906 92,933 96,009 Did Did
Total Illinois on Illinois races not not 504,082 426,254 421,493 393,058 350,765
Total Illinois on out-of-state races race race 748,923 698,647 635,154 597,527 693,504
Total Illinois on Illinois and out-of-state races 1,253,005 1,124,901 1,056,647 990,585 1,044,269
Out-of-state on Illinois races 601,207 663,844 696,454 870,264 771,350
Page 29

IRB-1 (R-6/07)
2006 Major Stake Races
Thoroughbred
Date National Jockey Club at Hawthorne Purse Horse Jockey April 8 Illinois Derby $500,000 SweetNorthernSaint K. Desormeaux April 22 National Jockey Club Handicap $250,000 Three Hour Nap F. Torres April 22 Sixty Sails Handicap $250,000 Fleet Indian J. Santos April 29 Chicagoland Handicap $107,450 Silver Bid P. Compton April 29 Milwaukee Avenue Handicap $105,650 Wiggins C. Emigh Date Arlington Park Purse Horse Jockey August 12 Arlington Million $1,000,000 The Tin Man V. Espinosa August 12 The Beverly D $750,000 Gorella J. Leparoux August 12 The Secretariat $400,000 Showing Up C. Velasquez July 29 The Washington Park Handicap $300,000 Suave C. Borel July 22 The American Derby $250,000 Union Avenue L. Melancon
Date Hawthorne Race Course Purse Horse Jockey September 30 Hawthorne Gold Cup $500,000 It’s No Joke E. Razo Jr. October 14 Hawthorne Derby $250,000 Best Of Buddies E. Martin Jr. September 30 Robert F. Carey Memorial Handicap $150,000 No Tolerance J. Campbell September 30 Indian Maid Handicap $127,400 Stormina J. Velazquez December 16 Jim Edgar Illinois Futurity $105,175 I Got A Dream E. Razo Jr. Date Fairmount Park Purse Horse Jockey August 26 St. Louis Derby $250,000 Lawyer Ron J. McKee September 2 Troy Our Boy Stakes $41,000 Caruso C. Silva September 4 All Sold Out Stakes $40,800 Tak’s Wish A. Velasquez July 22 The Bungalow Handicap Stakes $40,700 Lady Riss L. Robletto August 25 The Slight In The Rear Stakes $40,700 Trout River Red R. Hernandez September 26 Circle C Classic Handicap $40,700 Lady Riss L. Robletto
Harness
Date Balmoral Park Purse Horse Driver September 16 Orange & Blue 2-Year-Old Colt Pacers $300,000 Home Bed Advantage R. Anderson September 16 Orange & Blue 2-Year-Old Filly Pacers $280,000 Orgami Rose S. Widger August 26 American National Aged Pace $203,000 Holborn Hanover G. Brennan August 26 American National Aged Trot $200,000 Sand Vic G. Brennan August 26 American National 3-Year-Old Colt Trot $190,000 Chocalatier D.R. Ackerman Date Maywood Park Purse Horse Driver November 17 Windy City Pace $250,000 My Boy David A. Miller November 17 Galt Trot $110,000 Investor A. Montini November 17 Abe Lincoln Pace $105,000 The Quiet Mon J. Dillander November 17 Cinderella $100,000 Street Dancer D. Hiteman October 13 Maywood Pace $100,000 Third Day T. Tetrick October 13 Maywood Filly Pace $100,000 Free T. Tetrick
Date Hawthorne Race Course (Suburban Downs) Purse Horse Driver June 17 Edwin F. Dygert Memorial Trot $105,000 Dunkster K. Sugg June 17 Robert F. Carey Jr. Memorial Pace $96,000 Cheyenne Hollywood B. Holland June 3 Eddie Oakley $53,500 Battleshoe Victor Dave MaGee June 3 Jimmy’s Pilot $53,500 Live Out Loud Dave MaGee June 3 Silhouette Star $49,000 Go Go Gabby Dave MaGee
Page 30
IRB-1 (R-6/07)
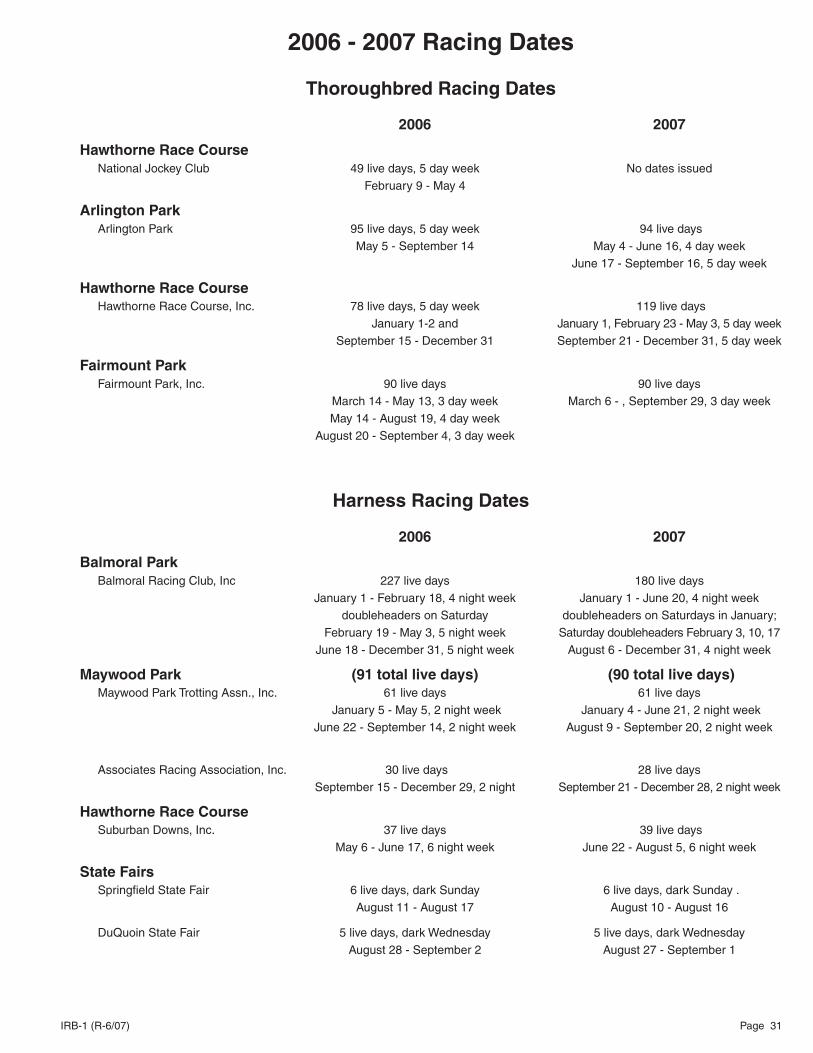
2006 - 2007 Racing Dates
Thoroughbred Racing Dates
2006 2007
Hawthorne Race Course National Jockey Club 49 live days, 5 day week No dates issued February 9 - May 4
Arlington Park Arlington Park 95 live days, 5 day week 94 live days May 5 - September 14 May 4 - June 16, 4 day week June 17 - September 16, 5 day week
Hawthorne Race Course Hawthorne Race Course, Inc. 78 live days, 5 day week 119 live days January 1-2 and January 1, February 23 - May 3, 5 day week September 15 - December 31 September 21 - December 31, 5 day week
Fairmount Park Fairmount Park, Inc. 90 live days 90 live days March 14 - May 13, 3 day week March 6 - , September 29, 3 day week May 14 - August 19, 4 day week August 20 - September 4, 3 day week
Harness Racing Dates 2006 2007
Balmoral Park Balmoral Racing Club, Inc 227 live days 180 live days January 1 - February 18, 4 night week January 1 - June 20, 4 night week doubleheaders on Saturday doubleheaders on Saturdays in January; February 19 - May 3, 5 night week Saturday doubleheaders February 3, 10, 17 June 18 - December 31, 5 night week August 6 - December 31, 4 night week
Maywood Park (91 total live days) (90 total live days) Maywood Park Trotting Assn., Inc. 61 live days 61 live days January 5 - May 5, 2 night week January 4 - June 21, 2 night week June 22 - September 14, 2 night week August 9 - September 20, 2 night week
Associates Racing Association, Inc. 30 live days 28 live days September 15 - December 29, 2 night September 21 - December 28, 2 night week
Hawthorne Race Course Suburban Downs, Inc. 37 live days 39 live days May 6 - June 17, 6 night week June 22 - August 5, 6 night week
State Fairs Springfi eld State Fair 6 live days, dark Sunday 6 live days, dark Sunday . August 11 - August 17 August 10 - August 16
DuQuoin State Fair 5 live days, dark Wednesday 5 live days, dark Wednesday August 28 - September 2 August 27 - September 1
Page 31

IRB-1 (R-6/07)
Arlington Park2006 Thoroughbred Meet May 5 - September 14
Live programs raced 95 License fee $ 11,450 Total live programs raced plus dark days 171 License fee - daily handle $ 6,900 Live races run 861 On track attendance 694,957 On track admission tax $ 33,952 Intertrack attendance 246,003 Intertrack admission tax $ 10,811 Total attendance 940,960 Total admission tax $ 44,764 Purses distributed $ 25,861,365 Uncashed tickets (2004) $ 1,428,979
On Inter Off All Track Track Track Locations at on on on Arlington Arlington Arlington Arlington
Live racing day handle Illinois handle on Illinois races 46,215,951 9,856,084 20,337,799 76,409,834 Illinois handle on out-of-state races 31,213,855 34,379,157 78,616,345 144,209,357 Combined Illinois handle 77,429,806 44,235,241 98,954,144 220,619,191 Out-of-state handle (commingled) on Illinois races 294,328,029 Total live racing day handle 514,947,220 Dark day handle (Illinois handle on out-of-state races) Dark thoroughbred period (Jan 3 - Feb 8) 7,267,636 14,409,906 30,244,923 51,922,465 Dark days during live meet (Mon. Tues.) 3,474,918 7,759,972 18,579,250 29,814,140 Total dark day handle 10,742,554 22,169,878 48,824,173 81,736,605 Total Illinois handle 88,172,360 66,405,119 147,778,317 302,355,796 Out of state commingled handle 294,328,029 Grand total meet handle 596,683,825
Average Live Racing Day Handle Average Illinois handle on Illinois Races 486,484 103,748 214,082 804,314 Average Illinois handle on out-of-state races 328,567 361,886 827,540 1,517,993 Average combined Illinois handle 815,051 465,634 1,041,623 2,322,307 Average out-of-state handle (commingled) on Illinois races 3,098,190 Average total live racing day handle 5,420,497 Average Dark Day Handle (Illinois handle on out-of-state races) Average dark thoroughbred period (Jan 3- Jan 31) 196,423 389,457 817,430 1,403,310 Average dark days during live meet (Mon. Tues.) 89,100 198,974 476,391 764,465 Average total dark day handle 141,349 291,709 642,423 1,075,482
Combined Illinois handle $ 88,172,360 66,405,119 147,778,317 302,355,796 - commission (take out) $ 17,462,332 13,202,859 29,918,164 60,583,354 - track commission $ 7,372,222 5,222,381 12,718,760 25,313,363 - purses earned $ 7,372,222 5,222,381 10,823,030 23,417,633 - out-of-state simulcast fee $ 1,395,307 1,880,601 4,238,176 7,514,083 - pari-mutuel tax $ 1,322,581 877,496 2,138,198 4,338,275 Public pool $ 70,710,028 53,202,260 117,860,153 241,772,442 - breakage $ 557,165 332,313 632,293 1,521,771 - surcharge $ 0 779,011 2,852,125 3,631,136 Payout to public $ 70,152,863 52,090,936 114,375,735 236,619,535
Note: The above track commission and purses earned include those of the Fairmount network and any other race meet whose intertrack or OTB is entitled to such. Transmission costs are not deducted.Page 32

IRB-1 (R-6/07)
National Jockey Club - Hawthorne Race Course2006 Thoroughbred Meet February 24 - May 4
Live programs raced 49 License Fee $ 6,390 Total live programs raced plus dark days 86 License Fee - Daily Handle $ 100 Live races run 436 On track attendance 92,116 On track admission tax $ 5,650 Intertrack attendance 128,195 Intertrack admission tax $ 3,411 Total attendance 220,311 Total Admission Tax $ 9,061 Purses distributed $9,793,133 Uncashed Tickets (2004) $ 609,647 On Inter Off All Track Track Track Locations at on on on Hawthorne Hawthorne Hawthorne Hawthorne
Live racing day handle Illinois handle on Illinois races 7,689,015 5,271,391 8,757,647 21,718,053 Illinois handle on out-of-state races 9,758,239 22,126,192 38,423,588 70,308,019 Combined Illinois handle 17,447,254 27,397,583 47,181,235 92,026,072 Out-of-state handle (commingled) on Illinois races 93,488,588 Total live racing day handle 185,514,660 Dark day handle (Illinois handle on out-of-state races)
Dark thoroughbred period (Feb 9 - Feb 23) 2,333,982 7,472,286 13,160,953 22,967,221 Dark days during live meet (Wed. Thurs.) 2,297,868 7,285,595 14,677,260 24,260,723 Total dark day handle during live meet (Wed. Thurs.) 4,631,850 14,757,881 27,838,213 47,227,944 Total Illinois handle 22,079,104 42,155,464 75,019,448 139,254,016 Out-of-state commingled handle 93,488,588 Grand total meet handle 232,742,604
Average Live Racing Day Handle Average Illinois handle on Illinois races 156,919 107,579 178,727 443,226 Average Illinois handle on out-of-state races 199,148 451,555 784,155 1,434,858 Average combined Illinois handle 356,066 559,134 962,882 1,878,083 Average out-of-state handle (commingled) on Illinois races 1,907,930 Average total live racing day handle 3,786,013
Average Dark Day Handle (Illinois handle on out-of-state races) Average dark thoroughbred period - (Feb 9-Feb 23) 155,599 498,152 877,397 1,531,148 Average dark days during live meet (Wed. Thurs.) 104,449 331,163 667,148 1,102,760 Average total dark day handle during live meet 125,185 398,862 752,384 1,276,431 Combined Illinois handle $ 22,079,104 42,155,464 75,019,448 139,254,016 - commission (take out) $ 4,426,819 8,658,303 15,585,571 28,670,693 - track commission $ 1,804,006 3,388,063 6,524,501 11,716,570 - purses earned $ 1,804,006 3,388,063 5,690,478 10,882,547 - out-of-state simulcast fee $ 487,623 1,249,856 2,245,351 3,982,830 - pari-mutuel tax $ 331,184 632,321 1,125,241 2,088,746 Public pool $ 17,652,285 33,497,161 59,433,877 110,583,323 - breakage $ 151,510 240,156 329,820 721,486 - surcharge $ 0 594,642 1,438,538 2,033,180 Payout to public $ 17,500,775 32,662,363 57,665,519 107,828,657
Note: The above track commission and purses earned include those of the Fairmount network and any other race meet whose intertrack or OTB is entitled to such. Transmission costs are not deducted.
Page 33

IRB-1 (R-6/07)
Hawthorne Race Course2006 Thoroughbred Meet January 1-2, September 15 - December 31
Live programs raced 77 License fee $ 9,800 Total live programs raced plus dark days 108 License fee - daily handle $ 200 Live races run 701 On track attendance 126,332 On track admission tax $ 6,608 Intertrack attendance 145,001 Intertrack admission tax $ 2,870 Total attendance 271,333 Total admission tax $ 9,478 Purses distributed $15,609,286 Uncashed tickets (2004) $ 605,774 On Inter Off All Track Track Track Locations at on on on Hawthorne Hawthorne Hawthorne Hawthorne
Live racing day handle Illinois handle on Illinois Races 11,501,309 8,527,466 16,453,533 36,482,308 Illinois handle on out-of-state races 13,657,768 32,039,459 64,997,522 110,694,749 Combined Illinois handle 25,159,077 40,566,925 81,451,055 147,177,057 Out-of-state handle (commingled) on Illinois races 177,406,912 Total live racing day handle 324,583,969
Dark day handle (Illinois handle on out-of-state races) Dark days during live meet (Mon, Tues.) 1,963,122 6,453,120 15,863,735 24,279,977 Total dark day handle during live meet (Mon, Tues.) 1,963,122 6,453,120 15,863,735 24,279,977 Total Illinois handle 27,122,199 47,020,045 97,314,790 171,457,034 Out-of-state commingled handle 177,406,912 Grand total meet handle 348,863,946
Average Live Racing Day Handle Average Illinois handle on Illinois races 149,368 110,746 213,682 473,796 Average Illinois handle on out-of-state races 177,374 416,097 844,124 1,437,594 Average combined Illinois handle 326,741 526,843 1,057,806 1,911,390 Average out-of-state handle (commingled) on Illinois races 2,303,986 Average total live racing day handle 4,215,376 Average Dark Day Handle (Illinois handle on out-of-state races) Average dark days during live meet (Mon, Tues.) 63,327 208,165 511,733 783,225 Total dark day handle during live meet (Mon, Tues.) 63,327 208,165 511,733 783,225 Combined Illinois handle $ 27,122,199 47,020,045 97,314,790 171,457,034 - commission (take out) $ 5,398,288 9,491,038 19,946,029 34,835,355 - track commission $ 2,233,476 3,802,887 8,702,508 14,738,871 - purses earned $ 2,233,476 3,802,887 7,148,654 13,185,017 - out-of-state simulcast fee $ 524,506 1,292,473 2,715,095 4,532,074 - pari-mutuel tax $ 406,830 592,791 1,379,772 2,379,393 Public pool $ 21,723,911 37,529,007 77,368,761 136,621,679 - breakage $ 163,972 207,870 390,660 762,502 - surcharge $ 0 556,387 1,868,939 2,425,326 Payout to public $ 21,559,939 36,764,750 75,109,162 133,433,851
Note: The above track commission and purses earned include those of the Fairmount network and any other race meet whose intertrack or OTB is entitled to such. Transmission costs are not deducted.
Page 34
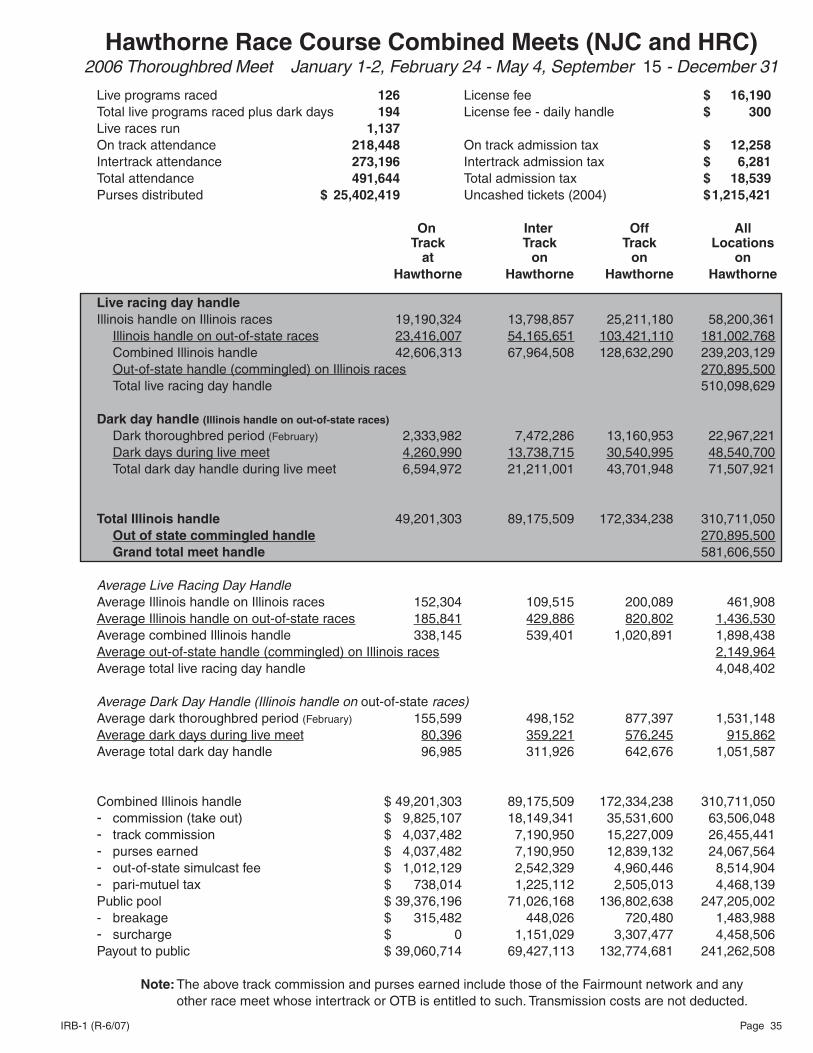
IRB-1 (R-6/07)
Hawthorne Race Course Combined Meets (NJC and HRC)2006 Thoroughbred Meet January 1-2, February 24 - May 4, September 15 - December 31
Live programs raced 126 License fee $ 16,190 Total live programs raced plus dark days 194 License fee - daily handle $ 300 Live races run 1,137 On track attendance 218,448 On track admission tax $ 12,258 Intertrack attendance 273,196 Intertrack admission tax $ 6,281 Total attendance 491,644 Total admission tax $ 18,539 Purses distributed $ 25,402,419 Uncashed tickets (2004) $ 1,215,421 On Inter Off All Track Track Track Locations at on on on Hawthorne Hawthorne Hawthorne Hawthorne
Live racing day handle Illinois handle on Illinois races 19,190,324 13,798,857 25,211,180 58,200,361 Illinois handle on out-of-state races 23,416,007 54,165,651 103,421,110 181,002,768 Combined Illinois handle 42,606,313 67,964,508 128,632,290 239,203,129 Out-of-state handle (commingled) on Illinois races 270,895,500 Total live racing day handle 510,098,629 Dark day handle (Illinois handle on out-of-state races) Dark thoroughbred period (February) 2,333,982 7,472,286 13,160,953 22,967,221 Dark days during live meet 4,260,990 13,738,715 30,540,995 48,540,700 Total dark day handle during live meet 6,594,972 21,211,001 43,701,948 71,507,921 Total Illinois handle 49,201,303 89,175,509 172,334,238 310,711,050 Out of state commingled handle 270,895,500 Grand total meet handle 581,606,550
Average Live Racing Day Handle Average Illinois handle on Illinois races 152,304 109,515 200,089 461,908 Average Illinois handle on out-of-state races 185,841 429,886 820,802 1,436,530 Average combined Illinois handle 338,145 539,401 1,020,891 1,898,438 Average out-of-state handle (commingled) on Illinois races 2,149,964 Average total live racing day handle 4,048,402
Average Dark Day Handle (Illinois handle on out-of-state races) Average dark thoroughbred period (February) 155,599 498,152 877,397 1,531,148 Average dark days during live meet 80,396 359,221 576,245 915,862 Average total dark day handle 96,985 311,926 642,676 1,051,587
Combined Illinois handle $ 49,201,303 89,175,509 172,334,238 310,711,050 - commission (take out) $ 9,825,107 18,149,341 35,531,600 63,506,048 - track commission $ 4,037,482 7,190,950 15,227,009 26,455,441 - purses earned $ 4,037,482 7,190,950 12,839,132 24,067,564 - out-of-state simulcast fee $ 1,012,129 2,542,329 4,960,446 8,514,904 - pari-mutuel tax $ 738,014 1,225,112 2,505,013 4,468,139 Public pool $ 39,376,196 71,026,168 136,802,638 247,205,002 - breakage $ 315,482 448,026 720,480 1,483,988 - surcharge $ 0 1,151,029 3,307,477 4,458,506 Payout to public $ 39,060,714 69,427,113 132,774,681 241,262,508 Note: The above track commission and purses earned include those of the Fairmount network and any other race meet whose intertrack or OTB is entitled to such. Transmission costs are not deducted.
Page 35

IRB-1 (R-6/07)
Fairmount Park2006 Thoroughbred Meet March 14 - September 4
Live programs raced 90 License fee $ 10,900 Total live programs raced plus dark days 90 License fee - daily handle $ 100 Live races run 860 On track attendance 211,308 On track admission tax $ 13,064 Intertrack attendance 0 Intertrack admission tax $ 0 Total attendance 211,308 Total admission tax $ 13,064 Purses distributed $ 6,050,293 Uncashed tickets (2004) $ 131,859
On Inter Off All Track Track Track Locations at on on on Fairmount Fairmount Fairmount Fairmount
Live racing day handle Illinois handle on Illinois Races 12,827,023 1,620,427 3,758,504 18,205,954 Illinois handle on out-of-state races 0 0 0 0 Combined Illinois handle 12,827,023 1,620,427 3,758,504 18,205,954 Out-of-state handle (commingled) on Illinois races 9,669,411 Total live racing day handle 27,875,365
Average Live Racing Day Handle Average Illinois handle on Illinois races 142,522 18,005 41,761 202,288 Average Illinois handle on out-of-state races 0 0 0 0 Average combined Illinois handle 142,522 18,005 41,761 202,288 Average out-of-state handle (commingled) on Illinois races 107,438 Average total live racing day handle 309,726
Combined Illinois handle $ 12,827,023 1,620,427 3,758,504 18,205,954 - commission (take out) $ 2,434,791 327,188 763,461 3,525,440 - track commission $ 1,173,483 151,441 527,874 1,852,798 - purses earned $ 1,173,483 151,441 187,375 1,512,299 - out-of-state simulcast fee $ 0 0 0 0 - pari-mutuel tax $ 87,825 24,306 48,212 160,343 Public pool $ 10,392,232 1,293,239 2,995,043 14,680,514 - breakage $ 114,035 11,688 21,892 147,615 - surcharge $ 102,600 18,629 72,588 193,817 Payout to public $ 10,175,597 1,262,922 2,900,563 14,339,082
Note: The above track commission and purses earned include those of the Chicago network and any other race meet whose intertrack or OTB is entitled to such. Transmission costs are not deducted.
Page 36

IRB-1 (R-6/07)
Balmoral Park2006 Harness Meet January 1 - May 3, June 18 - December 31
Live programs raced 197 License fee $ 25,970 Total live programs raced plus dark days 234 License fee - daily handle $ 100 Live races run 2,287 On track attendance 203,678 On track admission tax $ 1,755 Intertrack attendance 241,392 Intertrack admission tax $ 6,792 Total attendance 445,070 Total admission tax $ 8,548 Purses distributed $ 18,998,305 Uncashed tickets (2004) $ 894,495
On Inter Off All Track Track Track Locations at on on on Balmoral Balmoral Balmoral Balmoral Live racing day handle Illinois handle on Illinois Races 13,397,117 16,691,330 32,034,047 62,122,494 Illinois handle on out-of-state races 5,477,234 33,204,595 59,345,796 98,027,625 Combined Illinois handle 18,874,351 49,895,925 91,379,843 160,150,119 Out-of-state handle (commingled) on Illinois races 159,023,397 Total live racing day handle 319,173,516
Average Live Racing Day Handle Average Illinois handle on Illinois races 68,006 84,728 162,609 315,343 Average Illinois handle on out-of-state races 27,803 168,551 301,248 497,602 Average combined Illinois handle 95,809 253,279 463,857 812,945 Average out-of-state handle (commingled) on Illinois races 807,225 Average total live racing day handle 1,620,170 Dark Day Handle (Illinois handle on out-of-state races) Total dark day handle 396,439 4,106,788 8,879,062 13,382,289 Average dark day handle 10,715 110,994 239,975 361,683
Total Illinois handle 19,270,790 54,002,713 100,258,905 173,532,408 Out-of-state commingled handle 159,023,397 Grand total meet handle 19,270,790 54,002,713 100,258,905 332,555,805
Combined Illinois handle $ 19,270,790 54,002,713 100,258,905 173,532,408 commission (take out) $ 4,047,695 11,393,802 21,417,243 36,858,739 - track commission $ 1,797,055 4,798,037 10,640,716 17,235,808 - purses earned $ 1,797,055 4,798,037 7,408,726 14,003,818 - out-of-state simulcast fee $ 164,528 1,045,131 1,911,050 3,120,708 - pari-mutuel tax $ 289,057 752,597 1,456,751 2,498,405 Public pool $ 15,223,095 42,608,911 78,841,662 136,673,669 - breakage $ 114,150 263,503 422,619 800,272 - surcharge $ 109,821 634,317 1,905,786 2,649,924 Payout to public $ 14,999,124 41,711,091 76,513,257 133,223,473
Note: The above track commission and purses earned include those of the Fairmount network and any other race meet whose intertrack or OTB is entitled to such. Transmission costs are not deducted.
Page 37

IRB-1 (R-6/07)
Maywood Park Trotting Association - Maywood Park2006 Harness Meet January 5 - May 5, June 22 - September 14
Live programs raced 59 License fee $ 7,710 Total live programs raced plus dark days 61 License fee - daily handle $ 0 Live races run 720 On track attendance 60,225 On track admission tax $ 2,273 Intertrack attendance 60,061 Intertrack admission tax $ 2,567 Total attendance 120,286 Total admission tax $ 4,840 Purses distributed $ 3,806,809 Uncashed tickets (2004) $ 439,405
On Inter Off All Track Track Track Locations at on on on Maywood Maywood Maywood Maywood Live racing day handle Illinois handle on Illinois Races 5,020,835 4,198,213 10,185,763 19,404,811 Illinois handle on out-of-state races 5,118,743 14,638,335 30,738,573 50,495,651 Combined Illinois handle 10,139,578 18,836,548 40,924,336 69,900,462 Out-of-state handle (commingled) on Illinois races 52,915,892 Total live racing day handle 122,816,354
Average Live Racing Day Handle Average Illinois handle on Illinois races 85,099 71,156 172,640 328,895 Average Illinois handle on out-of-state races 86,758 248,107 520,993 855,858 Average combined Illinois handle 171,857 319,264 693,633 1,184,754 Average out-of-state handle (commingled) on Illinois races 896,880 Average total live racing day handle 2,081,633
Dark Day Handle (Illinois handle on out-of-state races) Total dark day handle 225,939 609,262 1,304,360 2,139,561 Average dark day handle 112,970 304,631 652,180 1,069,781
Total Illinois handle 10,365,517 19,445,810 42,228,696 72,040,023 Out-of-state commingled handle 52,915,892 Grand total meet handle 10,365,517 19,445,810 42,228,696 124,955,915
Combined Illinois handle $ 10,365,517 19,445,810 42,228,696 42,040,023 - commission (take out) $ 2,143,644 4,047,390 8,897,445 15,088,478 - track commission $ 919,643 1,673,335 4,201,298 6,794,276 - purses earned $ 919,643 1,673,335 3,181,832 5,774,810 - out-of-state simulcast fee $ 148,877 425,750 894,019 1,468,645 - pari-mutuel tax $ 155,481 274,970 620,296 1,050,747 Public pool $ 8,221,873 15,398,420 33,331,251 56,951,545 - breakage $ 60,849 97,900 181,723 340,472 - surcharge $ 39,575 233,456 808,475 1,081,506 Payout to public $ 8,121,449 15,067,064 32,341,053 55,529,567
Note: The above track commission and purses earned include those of the Fairmount network and any other race meet whose intertrack or OTB is entitled to such. Transmission costs are not deducted.
Page 38
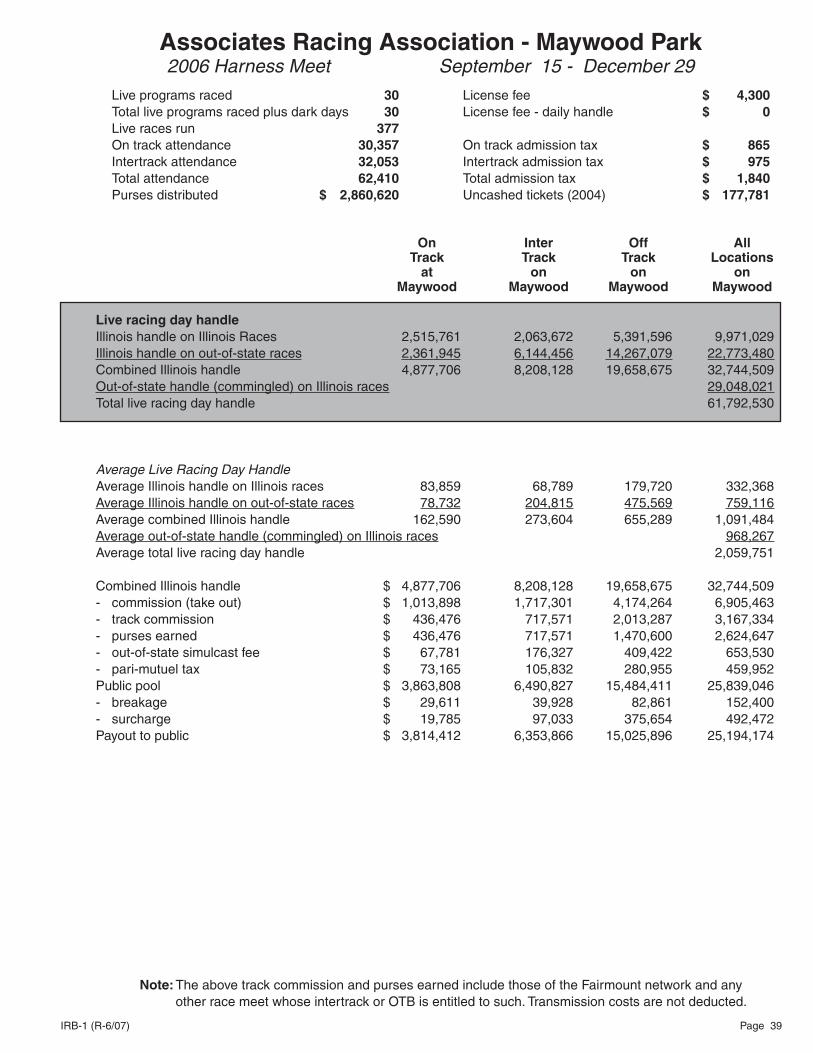
IRB-1 (R-6/07)
Associates Racing Association - Maywood Park2006 Harness Meet September 15 - December 29
Live programs raced 30 License fee $ 4,300 Total live programs raced plus dark days 30 License fee - daily handle $ 0 Live races run 377 On track attendance 30,357 On track admission tax $ 865 Intertrack attendance 32,053 Intertrack admission tax $ 975 Total attendance 62,410 Total admission tax $ 1,840 Purses distributed $ 2,860,620 Uncashed tickets (2004) $ 177,781
On Inter Off All Track Track Track Locations at on on on Maywood Maywood Maywood Maywood
Live racing day handle Illinois handle on Illinois Races 2,515,761 2,063,672 5,391,596 9,971,029 Illinois handle on out-of-state races 2,361,945 6,144,456 14,267,079 22,773,480 Combined Illinois handle 4,877,706 8,208,128 19,658,675 32,744,509 Out-of-state handle (commingled) on Illinois races 29,048,021 Total live racing day handle 61,792,530
Average Live Racing Day Handle Average Illinois handle on Illinois races 83,859 68,789 179,720 332,368 Average Illinois handle on out-of-state races 78,732 204,815 475,569 759,116 Average combined Illinois handle 162,590 273,604 655,289 1,091,484 Average out-of-state handle (commingled) on Illinois races 968,267 Average total live racing day handle 2,059,751
Combined Illinois handle $ 4,877,706 8,208,128 19,658,675 32,744,509 - commission (take out) $ 1,013,898 1,717,301 4,174,264 6,905,463 - track commission $ 436,476 717,571 2,013,287 3,167,334 - purses earned $ 436,476 717,571 1,470,600 2,624,647 - out-of-state simulcast fee $ 67,781 176,327 409,422 653,530 - pari-mutuel tax $ 73,165 105,832 280,955 459,952 Public pool $ 3,863,808 6,490,827 15,484,411 25,839,046 - breakage $ 29,611 39,928 82,861 152,400 - surcharge $ 19,785 97,033 375,654 492,472 Payout to public $ 3,814,412 6,353,866 15,025,896 25,194,174
Note: The above track commission and purses earned include those of the Fairmount network and any other race meet whose intertrack or OTB is entitled to such. Transmission costs are not deducted.
Page 39

IRB-1 (R-6/07)
Maywood Park Combined Meets (M.P.T.A. and Associates)2006 Harness Meet January 5 - May 5, June 22 - December 29
Live programs raced 89 License fee $ 12,010 Total live programs raced plus dark days 91 License fee - daily handle $ 0 Live races run 1,097 On track attendance 90,582 On track admission tax $ 3,138 Intertrack attendance 92,114 Intertrack admission tax $ 3,542 Total attendance 182,696 Total admission tax $ 6,680 Purses distributed $ 6,667,429 Uncashed tickets (2004) $ 617,186
On Inter Off All Track Track Track Locations at on on on Maywood Maywood Maywood Maywood
Live racing day handle Illinois handle on Illinois Races 7,536,596 6,261,885 15,577,359 29,375,840 Illinois handle on out-of-state races 7,480,688 20,782,791 45,005,652 73,269,131 Combined Illinois handle 15,017,284 27,044,676 60,583,011 102,644,971 Out-of-state handle (commingled) on Illinois races 81,963,913 Total live racing day handle 184,608,884
Average Live Racing Day Handle Average Illinois handle on Illinois races 84,681 70,358 175,027 330,066 Average Illinois handle on out-of-state races 84,053 233,515 505,681 823,249 Average combined Illinois handle 168,734 303,873 680,708 1,153,314 Average out-of-state handle (commingled) on Illinois races 920,943 Average total live racing day handle 2,074,257
Dark Day Handle (Illinois handle on out-of-state races) Total dark day handle 225,939 609,262 1,304,360 2,139,561 Average dark day handle 112,970 304,631 652,180 1,069,781
Total Illinois handle 15,243,223 27,653,938 61,887,371 104,784,532 Out-of-state commingled handle 81,963,913 Grand total meet handle 15,243,223 27,653,938 61,887,371 186,748,445
Combined Illinois handle $ 15,243,223 27,653,938 61,887,371 104,784,532 - commission (take out) $ 3,157,541 5,764,691 13,071,709 21,993,941 - track commission $ 1,356,119 2,390,906 6,214,585 9,961,610 - purses earned $ 1,356,119 2,390,906 4,652,432 8,399,457 - out-of-state simulcast fee $ 216,657 602,077 1,303,441 2,122,175 - pari-mutuel tax $ 228,646 380,802 901,251 1,510,699 Public pool $ 12,085,682 21,889,247 48,815,662 82,790,591 - breakage $ 90,460 137,828 264,584 492,872 - surcharge $ 59,360 330,489 1,184,129 1,573,978 Payout to public $ 11,935,862 21,420,930 47,366,949 80,723,741
Note: The above track commission and purses earned include those of the Fairmount network and any other race meet whose intertrack or OTB is entitled to such. Transmission costs are not deducted.Page 40

IRB-1 (R-6/07)
Suburban Downs - Hawthorne Race Course 2006 Harness Meet May 6 - June 17
Live programs raced 37 License fee $ 5,070 Total live programs raced plus dark days 43 License fee - daily handle $ 0 Live races run 397 On track attendance 45,803 On track admission tax $ 2,480 Intertrack attendance 41,223 Intertrack admission tax $ 590 Total attendance 87,026 Total admission tax $ 3,069 Purses distributed $ 3,552,346 Uncashed tickets (2004) $ 291,949
On Inter Off All Track Track Track Locations at on on on Hawthorne Hawthorne Hawthorne Hawthorne
Live racing day handle Illinois handle on Illinois Races 3,625,982 3,025,607 6,326,706 12,978,295 Illinois handle on out-of-state races 2,648,974 7,733,640 15,277,052 25,659,666 Combined Illinois handle 6,274,956 10,759,247 21,603,758 38,637,961 Out-of-state handle (commingled) on Illinois races 28,539,946 Total live racing day handle 67,177,907
Average Live Racing Day Handle Average Illinois handle on Illinois races 98,000 81,773 170,992 350,765 Average Illinois handle on out-of-state races 71,594 209,017 412,893 693,504 Average combined Illinois handle 169,593 290,790 583,885 1,044,269 Average out-of-state handle (commingled) on Illinois races 771,350 Average total live racing day handle 1,815,619
Dark Day Handle (Illinois handle on out-of-state races) Total dark day handle 128,146 592,259 1,442,004 2,162,409 Average dark day handle 21,358 98,710 240,334 360,402
Total Illinois handle 6,403,102 11,351,506 23,045,762 40,800,370 Out-of-state commingled handle 28,539,946 Grand total meet handle 6,403,102 11,351,506 23,045,762 69,340,316
Combined Illinois handle $ 6,403,102 11,351,506 23,045,762 40,800,370 - commission (take out) $ 1,315,532 2,352,852 4,820,097 8,488,481 - track commission $ 570,748 984,012 2,332,015 3,886,775 - purses earned $ 570,748 984,012 1,702,605 3,257,365 - out-of-state simulcast fee $ 77,991 227,695 449,789 755,475 - pari-mutuel tax $ 96,045 157,133 335,688 588,866 Public pool $ 5,087,570 8,998,654 18,225,665 32,311,889 - breakage $ 37,941 56,351 93,545 187,837 - surcharge $ 0 145,635 439,221 584,856 Payout to public $ 5,049,629 8,796,668 17,692,899 31,539,196
Note: The above track commission and purses earned include those of the Fairmount network and any other race meet whose intertrack or OTB is entitled to such. Transmission costs are not deducted.
Page 41

IRB-1 (R-6/07)
Illinois State and County Fairs 2006 Harness Meets Springfi eld State Fair August 11 - 17 DuQuoin State Fair August 28 - September 2 Brown County Fair August 2 - 3 Springfi eld DuQuoin Brown County Live programs raced 6 4 2 Live races run 76 53 22 Purses distributed $1,101,000 $1,435,000 $56,626 Uncashed tickets (2004) $6,376 $3,301 $0
On Inter Off All Track Track Track Locations at on on on Fair Fair Fair Fair
Springfi eld Illinois handle on Springfi eld fair races 588,572 200,171 301,146 1,089,889 Out-of-state handle on Springfi eld fair races 104,628 Total handle on Springfi eld fair races 588,572 200,171 301,146 1,194,517 Average Illinois handle on Springfi eld fair races 98,095 33,362 50,191 181,648 Average out-of-state handle on Springfi eld fair races 17,438 Average total handle on Springfi eld fair races 98,095 33,362 50,191 199,086
Combined Illinois handle $ 588,572 200,171 301,146 1,089,889 - commission (take out) $ 118,734 41,518 62,593 222,845 - track commission $ 54,953 19,409 43,485 117,847 - purses earned $ 54,953 19,409 15,013 89,375 - out-of-state simulcast fee $ 0 0 0 0 - pari-mutuel tax $ 8,828 2,700 4,095 15,623 Public pool $ 469,838 158,653 238,553 867,044 - breakage $ 5,028 1,599 2,406 9,033 - surcharge $ 4,652 2,430 5,778 12,860 Payout to public $ 460,158 154,624 230,369 845,151
DuQuoin Illinois handle on DuQuoin fair races 270,506 124,773 220,380 615,659 Out-of-state handle on DuQuoin fair races 266,935 Total handle on DuQuoin fair races 270,506 124,773 220,380 882,594
Average Illinois handle on DuQuoin fair races 67,627 31,193 55,095 153,915 Average out-of-state handle on DuQuoin fair races 66,734 Average total handle on DuQuoin fair races 67,627 31,193 55,095 220,649
Combined Illinois handle $ 270,506 124,773 220,380 615,659 - commission (take out) $ 54,545 25,692 46,456 126,693 - track commission $ 25,244 12,022 32,582 69,848 - purses earned $ 25,244 12,022 10,987 48,253 - out-of-state simulcast fee $ 0 0 0 0 - pari-mutuel tax $ 4,057 1,648 2,887 8,592 Public pool $ 215,961 99,081 173,924 488,966 - breakage $ 2,536 901 1,171 4,608 - surcharge $ 2,150 1,597 3,985 7,732 Payout to public $ 211,275 96,583 168,768 476,626
Brown County Handle Pari-mutuel tax Breakage Surcharge On track on Brown County races 23,827 357 306 186 Note: The above track commission and purses earned include those of the Illinois network and any other race meet whose intertrack or OTB is entitled to such. Transmission costs are not deducted.Page 42
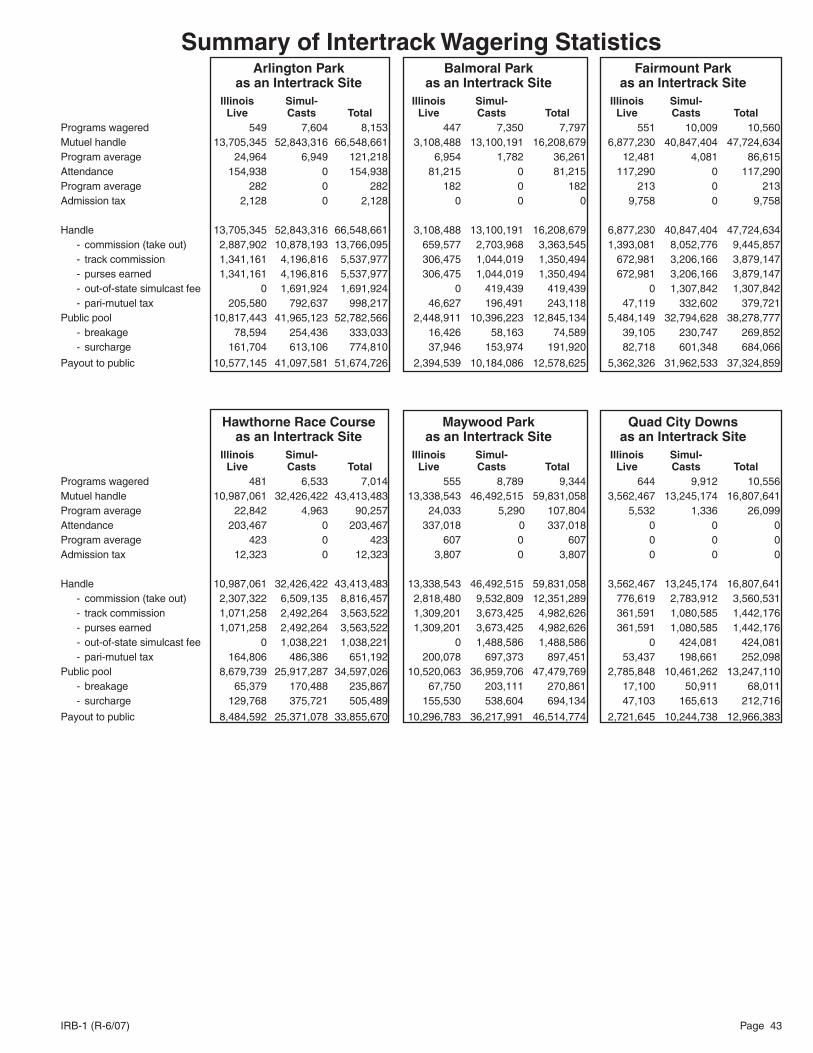
IRB-1 (R-6/07)
Summary of Intertrack Wagering Statistics Arlington Park Balmoral Park Fairmount Park as an Intertrack Site as an Intertrack Site as an Intertrack Site Illinois Simul- Illinois Simul- Illinois Simul- Live Casts Total Live Casts Total Live Casts TotalPrograms wagered 549 7,604 8,153 447 7,350 7,797 551 10,009 10,560 Mutuel handle 13,705,345 52,843,316 66,548,661 3,108,488 13,100,191 16,208,679 6,877,230 40,847,404 47,724,634Program average 24,964 6,949 121,218 6,954 1,782 36,261 12,481 4,081 86,615Attendance 154,938 0 154,938 81,215 0 81,215 117,290 0 117,290Program average 282 0 282 182 0 182 213 0 213Admission tax 2,128 0 2,128 0 0 0 9,758 0 9,758
Handle 13,705,345 52,843,316 66,548,661 3,108,488 13,100,191 16,208,679 6,877,230 40,847,404 47,724,634 - commission (take out) 2,887,902 10,878,193 13,766,095 659,577 2,703,968 3,363,545 1,393,081 8,052,776 9,445,857 - track commission 1,341,161 4,196,816 5,537,977 306,475 1,044,019 1,350,494 672,981 3,206,166 3,879,147 - purses earned 1,341,161 4,196,816 5,537,977 306,475 1,044,019 1,350,494 672,981 3,206,166 3,879,147 - out-of-state simulcast fee 0 1,691,924 1,691,924 0 419,439 419,439 0 1,307,842 1,307,842 - pari-mutuel tax 205,580 792,637 998,217 46,627 196,491 243,118 47,119 332,602 379,721Public pool 10,817,443 41,965,123 52,782,566 2,448,911 10,396,223 12,845,134 5,484,149 32,794,628 38,278,777 - breakage 78,594 254,436 333,033 16,426 58,163 74,589 39,105 230,747 269,852 - surcharge 161,704 613,106 774,810 37,946 153,974 191,920 82,718 601,348 684,066
Payout to public 10,577,145 41,097,581 51,674,726 2,394,539 10,184,086 12,578,625 5,362,326 31,962,533 37,324,859
Hawthorne Race Course Maywood Park Quad City Downs as an Intertrack Site as an Intertrack Site as an Intertrack Site Illinois Simul- Illinois Simul- Illinois Simul- Live Casts Total Live Casts Total Live Casts Total Programs wagered 481 6,533 7,014 555 8,789 9,344 644 9,912 10,556 Mutuel handle 10,987,061 32,426,422 43,413,483 13,338,543 46,492,515 59,831,058 3,562,467 13,245,174 16,807,641Program average 22,842 4,963 90,257 24,033 5,290 107,804 5,532 1,336 26,099Attendance 203,467 0 203,467 337,018 0 337,018 0 0 0Program average 423 0 423 607 0 607 0 0 0Admission tax 12,323 0 12,323 3,807 0 3,807 0 0 0
Handle 10,987,061 32,426,422 43,413,483 13,338,543 46,492,515 59,831,058 3,562,467 13,245,174 16,807,641 - commission (take out) 2,307,322 6,509,135 8,816,457 2,818,480 9,532,809 12,351,289 776,619 2,783,912 3,560,531 - track commission 1,071,258 2,492,264 3,563,522 1,309,201 3,673,425 4,982,626 361,591 1,080,585 1,442,176 - purses earned 1,071,258 2,492,264 3,563,522 1,309,201 3,673,425 4,982,626 361,591 1,080,585 1,442,176 - out-of-state simulcast fee 0 1,038,221 1,038,221 0 1,488,586 1,488,586 0 424,081 424,081 - pari-mutuel tax 164,806 486,386 651,192 200,078 697,373 897,451 53,437 198,661 252,098Public pool 8,679,739 25,917,287 34,597,026 10,520,063 36,959,706 47,479,769 2,785,848 10,461,262 13,247,110 - breakage 65,379 170,488 235,867 67,750 203,111 270,861 17,100 50,911 68,011 - surcharge 129,768 375,721 505,489 155,530 538,604 694,134 47,103 165,613 212,716
Payout to public 8,484,592 25,371,078 33,855,670 10,296,783 36,217,991 46,514,774 2,721,645 10,244,738 12,966,383
Page 43

IRB-1 (R-6/07)
Summary of Off-Track Wagering Statistics Waukegan Weed Street (Chicago) Rockford Arlington Park Arlington Park Quad City Downs Illinois Simul- Illinois Simul- Illinois Simul- Live Casts Total Live Casts Total Live Casts TotalPrograms wagered 644 10,085 10,729 644 10,085 10,729 643 10,054 10,697Mutuel handle 5,963,180 31,230,911 37,194,091 8,483,082 41,617,077 50,100,159 3,565,549 14,293,194 17,858,743Program average 9,260 3,097 57,755 13,172 4,127 77,795 5,545 1,422 27,774
Handle 5,963,180 31,230,911 37,194,091 8,483,082 41,617,077 50,100,159 3,565,549 14,293,194 17,858,743 - commission (take out) 1,249,858 6,397,195 7,647,053 1,786,027 8,546,142 10,332,169 776,743 3,038,981 3,815,724 - track commission 877,160 2,464,402 3,341,562 1,255,835 3,294,709 4,550,544 553,896 1,183,482 1,737,378 - purses earned 283,251 2,464,402 2,747,653 402,946 3,294,709 3,697,655 169,364 1,183,482 1,352,846 - out-of-state simulcast fee 0 999,944 999,944 0 1,332,485 1,332,485 0 457,636 457,636 - pari-mutuel tax 89,447 468,447 557,894 127,246 624,239 751,485 53,483 214,381 267,864Public pool 4,713,322 24,833,716 29,547,038 6,697,055 33,070,935 39,767,990 2,788,806 11,254,213 14,043,019 - breakage 29,413 134,075 163,488 44,694 175,908 220,602 14,050 47,052 61,102 - surcharge 112,007 606,133 718,140 163,978 804,621 968,599 68,595 269,527 338,122
Payout to public 4,571,902 24,093,508 28,665,410 6,488,383 32,090,406 38,578,789 2,706,161 10,937,634 13,643,795 McHenry South Beloit South Elgin Quad City Downs Quad City Downs Quad City Downs
Illinois Simul- Illinois Simul- Illinois Simul- Live Casts Total Live Casts Total Live Casts Total Programs wagered 643 9,495 10,138 642 9,663 10,305 643 9,490 10,133Mutuel handle 2,247,387 7,832,073 10,079,460 1,253,734 5,679,035 6,932,769 2,605,637 10,570,889 13,176,526Program average 3,495 825 15,676 1,953 588 10,799 4,052 1,114 20,492 Handle 2,247,387 7,832,073 10,079,460 1,253,734 5,679,035 6,932,769 2,605,637 10,570,889 13,176,526 - commission (take out) 468,451 1,590,329 2,058,780 271,060 1,177,397 1,448,457 546,592 2,165,350 2,711,942 - track commission 327,990 611,049 939,039 180,656 455,199 635,855 343,619 834,173 1,177,792 - purses earned 106,751 611,049 717,800 71,599 455,199 526,798 163,889 834,173 998,062 - out-of-state simulcast fee 0 250,765 250,765 0 181,830 181,830 0 338,456 338,456 - pari-mutuel tax 33,710 117,466 151,176 18,805 85,169 103,974 39,084 158,548 197,632Public pool 1,778,936 6,241,744 8,020,680 982,674 4,501,638 5,484,312 2,059,045 8,405,539 10,464,584 - breakage 13,527 40,741 54,268 5,182 22,176 27,358 14,517 46,946 61,463 - surcharge 43,102 150,554 193,656 24,060 106,732 130,792 51,361 201,904 253,265
Payout to public 1,722,307 6,050,449 7,772,756 953,432 4,372,730 5,326,162 1,993,167 8,156,689 10,149,856 Springfi eld Grayville Alton Fairmount Park Fairmount Park Fairmount Park
Illinois Simul- Illinois Simul- Illinois Simul- Live Casts Total Live Casts Total Live Casts Total Programs wagered 623 8,509 9,132 228 2,921 3,149 642 9,475 10,117 Mutuel handle 1,912,671 7,038,208 8,950,879 169,332 1,186,315 1,355,647 1,172,607 6,310,510 7,483,117Program average 3,070 827 14,367 743 406 5,946 1,826 666 11,656 Handle 1,912,671 7,038,208 8,950,879 169,332 1,186,315 1,355,647 1,172,607 6,310,510 7,483,117 - commission (take out) 400,095 1,418,531 1,818,626 35,087 241,485 276,572 236,517 1,241,474 1,477,991 - track commission 299,503 568,809 868,312 25,299 92,856 118,155 167,879 494,689 662,568 - purses earned 87,839 568,809 656,648 7,248 92,856 100,104 60,796 494,689 555,485 - out-of-state simulcast fee 0 225,348 225,348 0 37,983 37,983 0 202,048 202,048 - pari-mutuel tax 12,753 55,565 68,318 2,540 17,790 20,330 7,842 50,048 57,890Public pool 1,512,576 5,619,677 7,132,253 134,245 944,830 1,079,075 936,090 5,069,036 6,005,126 - breakage 8,788 29,586 38,374 837 5,191 6,028 6,197 27,065 33,262 - surcharge 36,225 134,946 171,171 3,121 22,539 25,660 22,854 121,207 144,061
Payout to public 1,467,563 5,455,145 6,922,708 130,287 917,100 1,047,387 907,039 4,920,764 5,827,803
Page 44

IRB-1 (R-6/07)
Summary of Off-Track Wagering Statistics Carbondale Sauget State and Lake (Chicago) Fairmount Park Fairmount Park Hawthorne Race Course Illinois Simul- Illinois Simul- Illinois Simul- Live Casts Total Live Casts Total Live Casts TotalPrograms wagered 644 7,720 8,364 630 9,528 10,158 644 9,907 10,551Mutuel handle 1,014,884 4,583,391 5,598,275 2,159,865 11,451,877 13,611,742 3,912,002 17,338,564 21,250,566Program average 1,576 594 8,693 3,428 1,202 21,606 6,075 1,750 32,998
Handle 1,014,884 4,583,391 5,598,275 2,159,865 11,451,877 13,611,742 3,912,002 17,338,564 21,250,566 - commission (take out) 210,333 935,302 1,145,635 438,513 2,275,368 2,713,881 818,934 3,531,378 4,350,312 - track commission 148,347 375,672 524,019 311,403 906,078 1,217,481 574,434 1,358,087 1,932,521 - purses earned 54,508 275,672 430,180 111,217 906,078 1,017,295 185,820 1,358,087 1,543,907 - out-of-state simulcast fee 0 146,750 146,750 0 366,663 366,663 0 555,142 555,142 - pari-mutuel tax 7,478 37,208 44,686 15,893 96,549 112,442 58,680 260,062 318,742Public pool 804,551 3,648,089 4,452,640 1,721,352 9,176,509 10,897,861 3,093,068 13,807,186 16,900,254 - breakage 4,321 16,003 20,324 11,489 51,473 62,962 19,829 76,468 96,297 - surcharge 19,455 88,067 107,522 43,122 218,013 261,135 74,601 333,070 407,671Payout to public 780,775 3,544,019 4,324,794 1,666,741 8,907,023 10,573,764 2,998,638 13,397,648 16,396,286
Oakbrook Terrace Crestwood Joliet Hawthorne Race Course National Jockey Club National Jockey Club
Illinois Simul- Illinois Simul- Illinois Simul- Live Casts Total Live Casts Total Live Casts Total Programs wagered 644 10,115 10,759 643 10,761 10,761 644 10,056 10,700Mutuel handle 14,383,654 59,028,347 73,412,001 12,732,416 38,091,534 50,823,950 4,624,285 16,696,645 21,320,930Program average 22,335 5,836 113,994 19,802 3,765 79,042 7,181 1,660 33,107
Handle 14,383,654 59,028,347 73,412,001 12,732,416 38,091,534 50,823,950 4,624,285 16,696,645 21,320,930 - commission (take out) 3,042,283 12,199,491 15,241,774 2,706,328 7,874,891 10,581,219 982,866 3,454,952 4,437,818 - track commission 2,143,304 4,712,064 6,855,368 1,910,552 3,041,965 4,952,517 693,849 1,334,965 2,028,814 - purses earned 683,224 4,712,064 5,395,288 604,790 3,041,965 3,646,755 219,653 1,334,965 1,554,618 - out-of-state simulcast fee 0 1,889,955 1,889,955 0 1,219,606 1,219,606 0 534,589 534,589 - pari-mutuel tax 215,755 885,408 1,101,163 190,986 571,355 762,341 69,364 250,433 319,797Public pool 11,341,371 46,828,856 58,170,227 10,026,088 30,216,643 40,242,731 3,641,419 13,241,693 16,883,112 - breakage 70,156 228,051 298,207 61,811 149,049 210,860 21,831 66,519 88,350 - surcharge 277,179 1,135,739 1,412,918 241,555 728,157 969,712 88,155 321,617 409,772Payout to public 10,994,036 45,465,066 56,459,102 9,722,722 29,339,437 39,062,159 3,531,433 12,853,557 16,384,990
Peru West Jackson (Chicago) Niles National Jockey Club Maywood Park Maywood Park
Illinois Simul- Illinois Simul- Illinois Simul- Live Casts Total Live Casts Total Live Casts Total Programs wagered 643 9,428 10,071 644 10,034 10,678 473 6,967 7,440Mutuel handle 1,259,299 4,381,120 5,640,419 6,211,570 24,526,368 30,737,938 7,008,897 24,127,865 31,136,762Program average 1,958 465 8,772 9,645 2,444 47,730 14,818 3,463 65,828
Handle 1,259,299 4,381,120 5,640,419 6,211,570 24,526,368 30,737,938 7,008,897 24,127,865 31,136,762 - commission (take out) 265,361 896,758 1,162,119 1,309,887 5,001,840 6,311,727 1,464,343 4,953,395 6,417,738 - track commission 161,469 345,391 506,860 921,664 1,924,341 2,846,005 1,026,287 1,909,484 2,935,771 - purses earned 85,003 345,391 430,394 295,050 1,924,341 2,219,391 332,923 1,909,484 2,242,407 - out-of-state simulcast fee 0 140,274 140,274 0 785,279 785,279 0 772,520 772,520 - pari-mutuel tax 18,889 65,702 84,591 93,173 367,879 461,052 105,133 361,907 467,040Public pool 993,938 3,484,362 4,478,300 4,901,683 19,524,528 24,426,211 5,544,554 19,174,470 24,719,024 - breakage 6,614 20,775 27,389 31,927 111,711 143,638 38,942 101,292 140,234 - surcharge 23,706 84,950 108,656 121,384 471,385 592,769 134,681 469,467 604,148Payout to public 963,618 3,378,637 4,342,255 4,748,372 18,941,432 23,689,804 5,370,931 18,603,711 23,974,642
Page 45
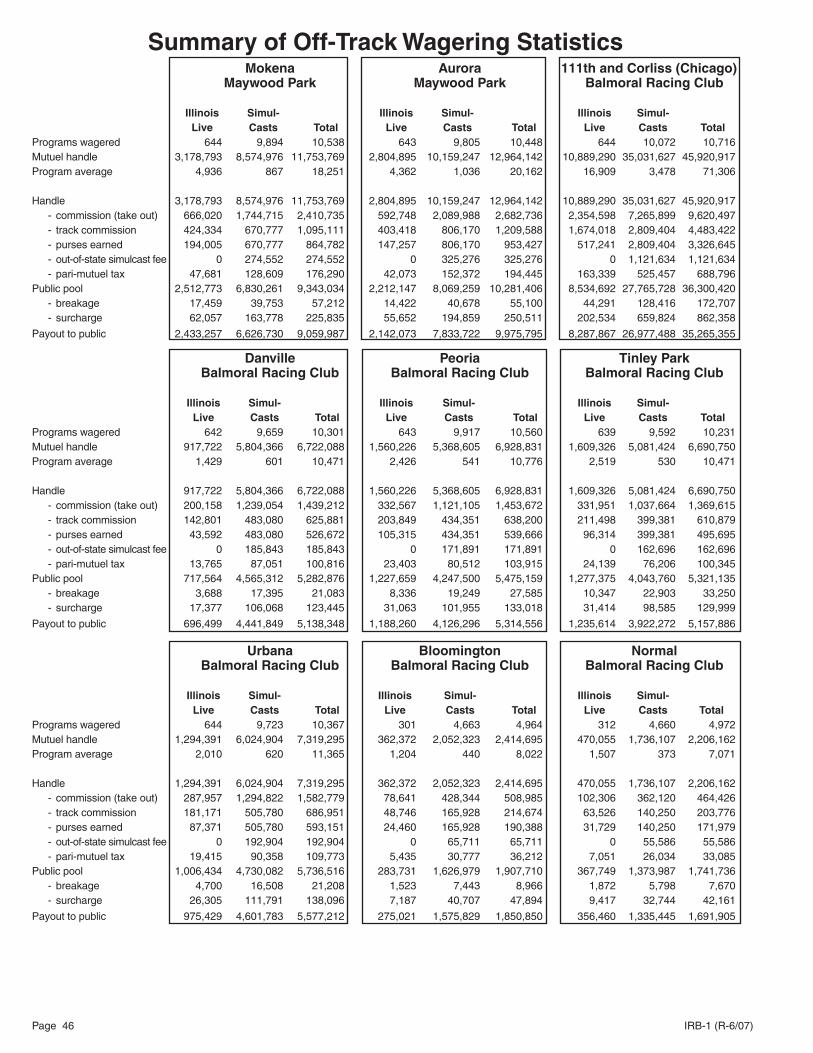
IRB-1 (R-6/07)
Summary of Off-Track Wagering Statistics Mokena Aurora 111th and Corliss (Chicago) Maywood Park Maywood Park Balmoral Racing Club Illinois Simul- Illinois Simul- Illinois Simul- Live Casts Total Live Casts Total Live Casts TotalPrograms wagered 644 9,894 10,538 643 9,805 10,448 644 10,072 10,716Mutuel handle 3,178,793 8,574,976 11,753,769 2,804,895 10,159,247 12,964,142 10,889,290 35,031,627 45,920,917Program average 4,936 867 18,251 4,362 1,036 20,162 16,909 3,478 71,306
Handle 3,178,793 8,574,976 11,753,769 2,804,895 10,159,247 12,964,142 10,889,290 35,031,627 45,920,917 - commission (take out) 666,020 1,744,715 2,410,735 592,748 2,089,988 2,682,736 2,354,598 7,265,899 9,620,497 - track commission 424,334 670,777 1,095,111 403,418 806,170 1,209,588 1,674,018 2,809,404 4,483,422 - purses earned 194,005 670,777 864,782 147,257 806,170 953,427 517,241 2,809,404 3,326,645 - out-of-state simulcast fee 0 274,552 274,552 0 325,276 325,276 0 1,121,634 1,121,634 - pari-mutuel tax 47,681 128,609 176,290 42,073 152,372 194,445 163,339 525,457 688,796Public pool 2,512,773 6,830,261 9,343,034 2,212,147 8,069,259 10,281,406 8,534,692 27,765,728 36,300,420 - breakage 17,459 39,753 57,212 14,422 40,678 55,100 44,291 128,416 172,707 - surcharge 62,057 163,778 225,835 55,652 194,859 250,511 202,534 659,824 862,358
Payout to public 2,433,257 6,626,730 9,059,987 2,142,073 7,833,722 9,975,795 8,287,867 26,977,488 35,265,355 Danville Peoria Tinley Park Balmoral Racing Club Balmoral Racing Club Balmoral Racing Club
Illinois Simul- Illinois Simul- Illinois Simul- Live Casts Total Live Casts Total Live Casts Total Programs wagered 642 9,659 10,301 643 9,917 10,560 639 9,592 10,231Mutuel handle 917,722 5,804,366 6,722,088 1,560,226 5,368,605 6,928,831 1,609,326 5,081,424 6,690,750Program average 1,429 601 10,471 2,426 541 10,776 2,519 530 10,471
Handle 917,722 5,804,366 6,722,088 1,560,226 5,368,605 6,928,831 1,609,326 5,081,424 6,690,750 - commission (take out) 200,158 1,239,054 1,439,212 332,567 1,121,105 1,453,672 331,951 1,037,664 1,369,615 - track commission 142,801 483,080 625,881 203,849 434,351 638,200 211,498 399,381 610,879 - purses earned 43,592 483,080 526,672 105,315 434,351 539,666 96,314 399,381 495,695 - out-of-state simulcast fee 0 185,843 185,843 0 171,891 171,891 0 162,696 162,696 - pari-mutuel tax 13,765 87,051 100,816 23,403 80,512 103,915 24,139 76,206 100,345Public pool 717,564 4,565,312 5,282,876 1,227,659 4,247,500 5,475,159 1,277,375 4,043,760 5,321,135 - breakage 3,688 17,395 21,083 8,336 19,249 27,585 10,347 22,903 33,250 - surcharge 17,377 106,068 123,445 31,063 101,955 133,018 31,414 98,585 129,999
Payout to public 696,499 4,441,849 5,138,348 1,188,260 4,126,296 5,314,556 1,235,614 3,922,272 5,157,886 Urbana Bloomington Normal Balmoral Racing Club Balmoral Racing Club Balmoral Racing Club
Illinois Simul- Illinois Simul- Illinois Simul- Live Casts Total Live Casts Total Live Casts Total Programs wagered 644 9,723 10,367 301 4,663 4,964 312 4,660 4,972Mutuel handle 1,294,391 6,024,904 7,319,295 362,372 2,052,323 2,414,695 470,055 1,736,107 2,206,162Program average 2,010 620 11,365 1,204 440 8,022 1,507 373 7,071
Handle 1,294,391 6,024,904 7,319,295 362,372 2,052,323 2,414,695 470,055 1,736,107 2,206,162 - commission (take out) 287,957 1,294,822 1,582,779 78,641 428,344 508,985 102,306 362,120 464,426 - track commission 181,171 505,780 686,951 48,746 165,928 214,674 63,526 140,250 203,776 - purses earned 87,371 505,780 593,151 24,460 165,928 190,388 31,729 140,250 171,979 - out-of-state simulcast fee 0 192,904 192,904 0 65,711 65,711 0 55,586 55,586 - pari-mutuel tax 19,415 90,358 109,773 5,435 30,777 36,212 7,051 26,034 33,085Public pool 1,006,434 4,730,082 5,736,516 283,731 1,626,979 1,907,710 367,749 1,373,987 1,741,736 - breakage 4,700 16,508 21,208 1,523 7,443 8,966 1,872 5,798 7,670 - surcharge 26,305 111,791 138,096 7,187 40,707 47,894 9,417 32,744 42,161
Payout to public 975,429 4,601,783 5,577,212 275,021 1,575,829 1,850,850 356,460 1,335,445 1,691,905
Page 46

IRB-1 (R-6/07) Page 47
Illinois Department of AgricultureHorse Racing Programs
Illinois Standardbred Breeders Fund 2006 Purses and Awards Paid
Total Stakes and Owners’/ Purses and Late Closers Overnites Breeders’ Bonus Breeders’Track/Association Races Purses Races Purses Awards Awards AwardsBalmoral Park Balmoral Racing Club 171 $4,029,600 62 $322,700 $477,599 $501,900 $5,331,798
Maywood Park Maywood Park Trot., Inc. & Associates Racing Assn. 38 $736,400 60 $23,340 $127,967 $241,707 $1,129,414
Hawthorne Race Course Suburban Downs, Inc. 30 $574,000 22 $115,100 $96,956 $73,796 $859,852 (Owner’s Awards fi rst offered-2000)Illinois State Fair Dept. of Agriculture 56 $313,000 6 $18,000 $5,309 $336,309
DuQuoin State Fair Dept. of Agriculture 36 $524,000 6 $12,000 $2,885 $538,885
Pari-Mutuel Totals 331 $6,177,000 156 $491,140 $710,716 $817,403 $9,196,259 Non Pari-Mutuel RacingCounty Fairs Colt Association Racing Class A 196 $476,574 $476,574 Class AA 302 $1,148,902 $1,148,902 Brown Co., Mt. Sterling AA 12 $56,626 $56,626 ICF Aged Stakes 4 and Up Division 20 $73,500 $73,500 Downstate Classic Decatur (3 y.o.) 5 $56,263 $56,263 Lincoln (2 y.o.) 6 $54,148 $54,148 Illinois Stallion Stakes Carmi 5 $51,800 $51,800
ISOBA Summer and Fall Previews DuQuoin (5/27) 19 $12,000 $12,000 Springfi eld (6/3 and 6/10) 24 $24,000 $24,000 Springfi eld (10/7) 9 $12,000 $12,000
Non Pari-Mutuel Totals 598 $1,965,813 $1,965,813
Illinois Conceived and Foaled Bonus Programs Million Dollar Bonus Program for 2-year-olds (not offered after 2002) $0 $0 Illinois Topline 3 and Up Bonuses for ICF Winners (2000-1st year offered) $14,375 $14,375 Maywood Park’s Illinois-bred Championship Series $20,000 $20,000 Total Bonuses Paid $34,375 $34,375 2006 Grand Totals 929 $8,142,813 156 $491,140 $710,716 $851,778 $10,196,447
These 2006 fi gures are only for events restricted to Illinois Conceived and Foaled (ICF) horses that are properly regis-tered with the Department of Agriculture, and do not include purses won by ICF horses in open competition. Bonuses awarded to ICF horses winning in open overnites in Illinois pari-mutuel competition are included in above table. 2004 was the fi rst year Class A and Class AA racing was offered at the Illinois county fairs.

IRB-1 (R-6/07)
Illin
ois
Dep
artm
ent
of
Ag
ricu
ltu
reH
ors
e R
acin
g P
rog
ram
s20
06 Il
lino
is T
ho
rou
gh
bre
d B
reed
ers
Fu
nd
Pu
rses
an
d A
war
ds
Pai
d
Pla
ce/
To
tal
IL
-Reg
iste
red
IL
-Res
tric
ted
Win
ner
s’
Win
ner
’s
Sh
ow
Pu
rses
S
take
s R
aces
O
pen
S
har
e O
wn
ers’
O
wn
ers’
B
reed
ers’
an
dTr
ack/
Ass
oci
atio
n
Rac
es
Pu
rses
R
aces
P
urs
es
Rac
es
of
Pu
rses
A
war
ds
Aw
ard
s A
war
ds
Aw
ard
s
Haw
thor
ne R
ace
Cou
rse
6 $5
92,0
00
112
$2,4
43,5
00
85
$815
,040
$2
78,4
00
$159
,223
$3
03,7
11
$4,5
91,8
74
Nat
iona
l Joc
key
Clu
b
(5
9 ra
ces)
(1
21 r
aces
)
Arli
ngto
n P
ark
8 $5
99,4
75
154
$4,1
36,0
00
139
$1,6
11,5
75
$646
,840
$3
75,5
97
$540
,542
$7
,910
,029
A
rling
ton
Par
k
(1
25 r
aces
) (2
67 r
aces
)
Haw
thor
ne R
ace
Cou
rse
8 $7
69,7
00
119
$2,9
86,0
00
152
$1,6
04,0
00
$571
,560
$2
92,9
76
$451
,688
$6
,675
,924
H
awth
orne
Rac
e C
ours
e, In
c.
(113
rac
es)
(222
rac
es)
Fair
mou
nt P
ark
6 $2
44,5
00
111
$720
,600
36
2 $1
,262
,120
$3
97,3
56
$199
,697
$2
33,5
33
$3,0
57,8
06
Fai
rmou
nt P
ark,
Inc.
(1
65 ra
ces)
(3
43 ra
ces)
Par
i-M
utu
el T
ota
ls
28
$2,2
05,6
75
496
$10,
286,
100
738
$5,2
92,7
35
$1,8
94,1
56
$1,0
27,4
93
$1,5
29,4
74
$22,
235,
633
Sta
llion
Ow
ner’s
Aw
ards
$128
,836
Cou
nty
Fairs
Rac
ing
$7
0,50
0
Tota
l of
Pro
gra
m
$2
2,43
4,96
9
Illin
ois
Dep
artm
ent
of
Ag
ricu
ltu
reH
ors
e R
acin
g P
rog
ram
s20
05 Il
lino
is Q
uar
terh
ors
e B
reed
ers
Fu
nd
Pu
rses
Rac
es
Pu
rses
Par
i-Mut
uel T
otal
s
0
$0
Cou
nty
Fairs
8
$14,
392
Non
Par
i-Mut
uel T
otal
s
8
$14,
392
2006
Gra
nd
To
tals
8
$14,
392
The
se 2
006
fi gur
es a
re o
nly
for
even
ts r
estr
icte
d to
Illin
ois
Con
ceiv
ed a
nd F
oale
d (I
CF
)
ho
rses
that
are
pro
perly
reg
iste
red
with
the
Dep
artm
ent o
f Agr
icul
ture
, and
do
not i
nclu
de
purs
es w
on b
y IC
F h
orse
s in
ope
n co
mpe
titio
n.
Page 48

IRB-1 (R-6/07) Page 49
Notes

IRB-1 (R-6/07)
Notes
Page 50