Embed Size (px)
Citation preview
Cooperating agencies
ILLINOIS STATE GEOLOGICAL SURVEY Department of Natural Resources
BUREAU OF MINES United States Department of the Interior

Danny J. Van Roosendaal Robert A. Bauer Philip J. DeMaris Nelson Kawamura
ILLINOIS STATE GEOLOGICAL SURVEY William Shilts, Chief Natural Resources Building 61 5 East Peabody Drive Champaign, IL 61 820-6964

(IMSRP) was established in 1985 to investi- gate methods and develop guidelines for underground mining operations that aim to maximize coal extraction yet preserve the productivity of prime farmland. The research program was initi- ated by the lllinois Coal Association and the Illinois Farm Bureau.
The lllinois State Geological Survey, a division of the lllinois Department of Natural Resources, directed the IMSRP. Participating research institutions included Southern lllinois University at Carbondale, the University of lllinois at Urbana-Champaign, Northern lllinois University, and the lllinois State Geological Survey. A five-year Memorandum of Agreement, signed by the State of lllinois and the Bureau of Mines, U.S. Department of the Interior, ensured collaboration, coopera- tion, and financial support through 1991. Major funding was also provided by the lllinois Coal Development Board.
This publication is one in a series printed and distributed by the lllinois State Geological Survey as a service to the IMSRP.
Appendixes to this volume are available upon request as Open File Series 1997-7
Printed with soybean ink on recycled paper Printed by authority of the State of lllinois/1997/500

ABSTRACT
INTRODUCTION Scope and Purpose of Work Background and Previous Studies
Natural resources affected by mine subsidence, method of mining, overburden fracturing, hydrogeologic effects, surface subsidence characteristics
Physical Setting Site selection, physiography, surficial geology, bedrock stratigraphy and structure, hyd rogeology
Mine Characteristics
GEOTECHNICAL MONITORING PROGRAM Introduction
Instrument layout, mine operations Surface Subsidence and Deformation Monitoring
Surveying, horizontal displacements, tiltplates Overburden Characterization
Exploratory drilling, laboratory testing for intact rock properties Overburden Deformation Monitoring
Time-domain reflectometry, inclinometer/sondex Hydrogeologic Investigations
Drift piezometers, bedrock piezometers, aquifer characterization
RESULTS Surface Subsidence Characteristics
Subsidence profiles, strain profile, tiltplates Overburden Characterization
Geotechnical core log, geophysical logs, intact rock properties Overburden Deformation Monitoring
Time-domain reflectometry, inclinometer/sondex Hydrogeologic Response to Subsidence
rift water level response, bedrock water level response, aquifer characteristics
TION OF OBSERVATIONS
ND CONCLUSIONS Surface Subsidence Characteristics Overburden Characterization Overburden Deformation Hydrogeologic Response
NOWLEDGMENTS
IXES (available upon request as Open File Series 1997-7) Total Station Data Longitudinal Surveys and Subsidence Calculations Transverse Surveys and Subsidence Calculations Closures on Controls Horizontal Strain Calculations Presubsidence Geotechnical Core Log Presubsidence Geophysical Logs Postsubsidence Geophysical Logs Rock Mechanics Laboratory Data Split-Spoon Sample Descriptions and Soil Lab Test Data and Hydrographs of Drift and Bedrock Wells Sondex Data
REFERENCES

FIGURES Diagram of the longwall mining technique Strata deformation associated with longwall mining Site location in Jefferson County, Illinois Stratigraphic column of bedrock above the Herrin Coal at the study site North-south geologic cross section through the study area The study panels and adjacent portions of the Rend Lake Fault System Instrument plan over panels 3 and 4 Frost-free monument design General tiltplate installation Schematic of the TDR installation Schematic of the inclinometer/sondex installation Schematic of the piezometer and pump well installation Transverse subsidence profile development Longitudinal subsidence profile development with mine face location Panel 4 transverse strain profile for coal company's monument line Subsidence, tilt, and face advance resulting from the dynamic subsidence wave Subsidence, tilt, and curvature results using two monitoring techniques Comparison of pre- and postsubsidence core logs Presubsidence intact rock properties Postsubsidence intact rock properties Progression of TDR cable deformation at the centerline of panel 4 Comparisons between TDR events and sondex changes Inclinometer data showing the location of the shear planes Piezometric response of the drift piezometers due to precipitation and not mining Piezometric response of the bedrock piezometers over panel 3 Water level in the well in the center of panel 3
1 Sequence of subsurface events

The purpose of this investigation was to study the amount, extent, and location of overburden frac- turing leading to the surface expression of coal-mine subsidence and to examine the effects of bedrock deformation on the local hydrogeology. Two longwall panels in Jefferson County, lllinois, were characterized before, during, and after subsidence by using core drilling, geotechnical instru- mentation, and in situ testing. Geotechnical instruments, including surface monuments, piezome- ters, a pump well, an inclinometer/extensometer (sondex), and two time-domain reflectometry cables, were used to monitor overburden and ground-surface response over a 5-year period.
Ninety percent of the subsidence occurred within the first 3 months of undermining. Over this period, the ratio of subsidence to mined-out height was 63%. The long-term subsidence meas- ured over panel 3 increased the ratio of subsidence to mined-out height to 70%. The residual subsidence is probably induced by the closure of fractures generated during the collapse of over- burden. Static subsidence characteristics were within the range of values previously reported for the lllinois Basin. Drift (shallow) water levels showed no appreciable change during mining. Bed- rock water levels declined as the mine face approached, reached maximum lows when tensile strains (as measured on the surface) passed, showed a temporary recovery spike as the maxi- mum compressive strain passed, and then steadily recovered over a period of 3 months until pas- sage of the mine face of the adjacent panel. Above the panels, aquifer characteristics, such as hydraulic conductivity and storativity, were improved as a result of mining-induced fracturing.
High-extraction mining techniques are being used more frequently in lllinois to maximize coal min- ing productivity and to decrease the cost of the delivered product. Underground coal extraction by these techniques causes rapid collapse of the overburden and subsidence of the ground surface. Farmland and water resources may be affected by this surface subsidence. The lllinois Mine Sub- sidence Research Program (IMSRP) was created to address these concerns. This study is one of several projects performed under the IMSRP with funding from the U.S. Bureau of Mines (USBM), lllinois Department of Energy and Natural Resources Coal Development Board, and the Office of Surface Mining Reclamation and Enforcement.
The purpose of this investigation was to study the amount, extent, and location of overburden frac- turing that leads to the surface expression of coal-mine subsidence and to examine the effects of the bedrock deformation on the local hydrogeology. Two longwall panels in Jefferson County, Illinois, were characterized before and after subsidence by using core drilling, geotechnical instru- mentation, and in situ testing. Geotechnical instruments, including surface monuments, piezome- ters, a pump well, an inclinometer/extensometer (sondex), and two time-domain reflectometry (TDR) cables, were used to monitor overburden and ground-surface response. The lllinois State Geological Survey (ISGS) monitored the instruments before, during, and after subsidence. North- ern lllinois University (NU) assisted the ISGS in characterizing the hydrologic changes in the overburden. This report summarizes the geotechnical monitoring program and the results from monitoring throughout a 5-year period.
vio in Coal and farmland are both important to the
state's economy. lllinois is the second largest producer of agricultural commodities and the fifth largest producer of coal in the United States. Problems sometimes exist in ensuring that both farmland and coal resources are used to their maximum potential. Depending on the original topography of the land, subsidence-induced ground movements can modify surface drainage, possibly affecting crop yields of gently rolling farmland. Mine operators need to understand the impact of underground mining on near-surface hydrology and surface-drainage patterns.
The modern longwall mining system has been used in lllinois since 1976 (Janes 1983) and has been used in the study mine since 1987. Longwall mining produces imme- diate planned subsidence over each longwall panel. The longwall panels are laid out using tradi- tional room-and-pillar methods to form entryways. When panel layout is complete, specialized longwall equipment is moved in, set up, and mining of the defined block of coal begins (fig. 1). Gradually advancing under movable hydraulic shields, the longwall shearer removes all of the coal across a wide working face. The room-and-pillar entryways, which are used for ventilation

side view \ \
shield movement -'----. \ \ \
roof -'---, \ \
"faceM of panel, \ \
- moveable shearer with / - \ shield - - - - -
floor - rotating cutter drum convey0 r
Diagram of the longwall mining technique.
and transportation, are left in place between the panels. As the mine face advances, the overbur- den behind the shields is left unsupported and collapses into the void. Vertical and horizontal movements are propagated by gravity up through the bedrock and surficial materials; thus, sur- face subsidence quickly follows this collapse. A general model for this process is shown in figure 2 (Peng and Chiang 1984, ew South Wales Coal ssociation 1 989).
Coe and Stowe (1 984), Ming-Gao (1 982), and Whitworth (1 982) investi- gated the location and amount of fracturing in subsided bedrock over longwall operations in Ohio (U.S.A.), Jiangsu Province (China), and South Staff ordshire Coalfield (United Kingdom), respec- tively. Before the IMSRP began, Conroy (1 980) conducted the only study concerning fracturing above a high-extraction mining operation in Illinois. He grouted two time-domain reflectometry (TDR) cables into boreholes that extended from the ground surface into a 625-foot-deep longwall mine and found that the bedrock movements severed one of the cables to within 100 to 150 feet of the surface.
More recently, Bauer et al. (1991) investigated fracturing using a TDR cable and an MPBX over a high-extraction mine in Williamson County. They found that differential movements were associ- ated with interfaces between materials of contrasting strength, such as bedrock and drift, or near the boundaries of a fragipan within the soil where the TDR cable was sheared.
ects Fracturing of the overburden may affect water-bearing formations by creating voids and increasing secondary permeability, as found in the Appalachian Plateau of Pennsylvania by Booth (1 986). In a study in England, Garritty (1 982) suggested that fracturing of the bedrock up to the surface may hydrologically connect an aquifer or surface water body with the mine. In Illinois, Cartwright and Hunt (1978) observed localized, open, vertical joints due to faulting in a mine roof; they speculated that these joints could provide a direct passage for water from higher strata in the immediate roof. These fractures were discontinuous, however, and did not provide any hydrologic connection to the surface. In another study in Illinois, Nieto (1979) found no leakage into mines with faults located 600 feet under the Rend Lake reservoir. Sub- sequent studies in Illinois, including this one, also have shown that discontinuous, localized frac- turing caused by strains in the bedrock occurs without any hydrologic connections to the surface.
Before this study was initiated, the hydrogeological effects of subsidence on aquifers had been investigated by several researchers, including Coe and Stowe (1 984), Duigon and Smigaj (1 985),
maximum compression. , maximum subsidence
angle of draw I
-P I I
coal
extraction width (w) 4
h = mined out height not to scale
Zone I = caved zone thickness = 2 to 8 times h
Zone II = fractured zone thickness = 28 to 42 times h
Zone Ill = continuous deformation zone
Zone IV = near surface
zones
Strata deformation associated with longwall mining (modified from Peng and Chiang 1984 and New South Wales Coal Association 1989).
Garritty (1 982), Owili-Eger (1 983), Pennington et al. (1 984), and Sloan and Warner (1 984). In studies of the Appalachian Plateau, Coe and Stowe (1984), Booth (1 986), and Pennington et al. (1 984) observed water level drops in wells that were undermined by the longwall mining method. Water levels partially or completely recovered, however, several months after being undermined by the longwall method in the Appalachian Plateau (Owili-Eger 1983). Subsequent studies in llli- nois by Pauvlik and Esling (1 987) have also observed a similar response of wells to mining.
ristics The longwall method of mining produces planned subsi- dence. As the longwall face advances, a subsidence trough develops at the surface; it is both longer and wider than the area of total coal extraction at the mine level. The face advance at mine level produces a dynamic traveling wave at the surface directly above and slightly behind the face position. The subsidence trough is typically characterized by two types of profiles: static and dynamic.

Static profiles are generally measured transverse to the panel to show the final shape of the subsi- dence trough. In general, a "maximum possible subsidence" cannot exceed the thickness of the mined-out height. For geological conditions prevailing in Illinois, the maximum subsidence is approximately 60% to 70% of the mined-out height. Three conditions of the subsidence trough's final shape were defined by a width-to-depth ratio (WID) (Whittaker and Reddish 1989) for the United Kingdom coal field. Subcritical extraction would correspond to a WID 4 .4 ; critical extraction would correspond to a WID = 1.4; and super-critical extraction would correspond to a subsidence WID >I .4. These conditions are dependent on the overburden's strength characteristics and its bridging ability; therefore, these ratios may not hold true for the Illinois Basin or the Appalachian area. The vertical movements are accompanied by horizontal displacements that act toward the area of maximum subsidence. The magnitude of the horizontal displacements is a function of the gradient of the subsidence profile (Whittaker and Reddish 1989, Tandanand and Triplett 1987).
Dynamic profiles are documented as surface subsidence occurs. A longitudinal survey line over the length of the panel is used to document the dynamic traveling subsidence wave that develops on the ground surface behind the advancing face. At the sides of the trough, the progression from dynamic to static subsidence occurs rapidly and produces a complex pattern of surface cracks (Van Roosendaal et al. 1990, 1991). Both types of profiles are presented in this report.
rai factors were considered during the site selection process. First, a long- wall mine had to be available for study within a reasonable time frame. It was essential that instru- ments be installed well before the site was undermined so that site characterization and baseline data collection could take place. Next, the full cooperation of the mine operators and surface own- ers was required. Formal agreements with these parties were negotiated prior to initiation of work. Finally, the site had to be accessible and well suited for both instrument installation and long-term monitoring.
The above criteria were used to select two longwall panels in southwestern Jefferson County, Illinois (fig. 3). The panels are located about 12 miles southwest of Mt. Vernon in Sections 19 and 20, T4S, R2E. The site lies between Illinois State Route 148 and the west side of Rend Lake, 4 miles south of Waltonville.
sio The study site is located in the Mount Vernon Hill Country physiographic division of Illinois. The geomorphology of the area is characteristic of a maturely dissected, sandstone- shale plain of low relief under a thin mantle of lllinoian drift. Restricted uplands and broad alluvi- ated valleys occur along the larger streams (Leighton et al. 1948).
Clinton St. Clair r/z----
Washington Jefferson
Jackson William -u rT \ Union 1 Jz::.
Saline
- . site location
Site location in Jefferson County, Illinois.

Surface topography above the panels is gently rolling, with elevations between 420 to 460 feet above mean sea level. The topography in the area is primarily bedrock-controlled (Horberg 1950). Bedrock features are modified, however, by glacial action and somewhat subdued by a thin mantle of deeply eroded drift that covers the region (Leighton et al. 1948).
Dendritic drainage is predominantly bedrock-controlled in the vicinity of the panel site (MacClin- tock 1929). The panels are located in the drainage basin of the Big Muddy River, which drains into the man-made Rend Lake Reservoir. Any surface water over the panels generally drains east into the west arm of the reservoir.
y The Bluford silt loam is the predominant modern soil over the study area (Dar- mody 1990), which is a somewhat poorly drained upland sloping gently to the northeast. Slopes range from 1% to 2% over most of the area and reach 4% in the shallow drainageway on the north side. The low slopes here have minimized erosion of the original 2 to 4 feet of Peoria loess that the modern soil developed on. The Peoria loess in this area overlies the Sangamon paleosol, which developed atop the lllinoian glacial drift deposit (L. Follmer, personal communication, 1993), here only 4 to 8 feet thick. The drift is quite rich in clay and locally contains rounded pebbles and organic debris. Below the drift is deeply weathered bedrock; weathered remnants of bedrock, such as siltstone lenses, are found as much as 4 feet above coherent bedrock.
The Bluford soils (subtypes change as slopes vary from 0" to 6") were originally forested and are generally well suited to growing corn, soybeans, small grains, hay, and pasture (Soil Conserva- tion Service 1988). A weakly expressed fragipan in the B horizon inhibits root penetration and becomes brittle in the dry season.
The coal mine operates in the Herrin Coal seam at a depth of about 700 feet. Only the Herrin and Springfield Coals are considered suitable for under- ground mining in this township; the Herrin Coal is the uppermost of the two coal seams. The Her- rin Coal, which ranges from 7 to 11 feet thick in the mine, is typically 8 to 9 feet thick in the study area. The bedrock is of Pennsylvanian age and composed of rock units of the Carbondale, Shel- burn, Patoka, and Bond Formations (fig. 4; Greb et al. 1992). A detailed geologic log of this col- umn is given in appendix F.
The immediate roof of the Herrin Coal is the Energy Shale, which is more than 100 feet thick. The Energy Shale is predominantly silty shale and thinly bedded siltstone; it has some thin zones of sandstone. Near its base, the shale is less silty and locally finely carbonaceous; it generally con- tains small plant compressions and, in some areas, contains both fallen and upright tree trunks. The study area is 5 to 6 miles east of the Walshville paleochannel, which was active contempora- neously with Herrin peat deposition. The Walshville paleochannel was the source of the thick clastic deposits that became the Energy Shale. The Herrin Coal near the paleochannel is split by shale interpreted as flood deposits (DiMichele and DeMaris 1987), and the thick deposits of En- ergy Shale are interpreted as overbank flood deposits (Bauer and DeMaris 1982). Energy Shale deposits more than 100 feet thick, such as those found here, probably formed from channel avul- sion in response to gradual marine transgression (DiMichele and DeMaris 1987). The typical Wer- rin Coal roof units (Anna Shale and Brereton Limestone) found elsewhere in the Illinois Basin are missing in this study area. Their absence is apparently due to nondeposition.
The bedrock interval from the Bankston Fork Limestone to the Carthage Limestone contains few minable coal seams and is less studied than the Carbondale Formation. The interval contains no thick sandstone units or other likely aquifers; two thin coals of uncertain stratigraphy are found near the top of the interval.
The Bond Formation (all bedrock here above the Carthage Limestone) is of interest because of groundwater supplies. Thin sandstone intervals are present, but the Mt. Carmel Sandstone chan- nels provide the best local water sources. The study site is located over the northwest flank of one of these channels (fig. 5), and several piezometers were placed within the channel interval.
The Mt. Carmel Sandstone is a sandstone/siltstone unit that is widespread in southeastern Illinois. As the cross section indicates, the Mt. Carmel Sandstone shows an abrupt change (over a dis- tance of less than 1 mile) from a thin (less than 30 feet thick) sheet facies to the thick sandstone- dominated channel facies seen in drill hole T401. Drill holes within the study area show the Mt. Carmel Sandstone is as much as 80 feet thick. The bottom 50 feet consists predominantly of sand- stone interbedded with some shale and siltstone; the upper 30 feet contains some sandstone and
System
a.
Named Members
Mt. Carmel ? Sandstone (channel facies)
Predominant Lithology -1 top of bedrock
shale and siltstone, weathered at top
shale, black, fissile shale, silty, fining upward
-1 . . . sandstone, massive at top, silty toward bottom
shale, silty, interlaminated with siltstone; 100 rare sandstone interbeds
sandstone, massive, rare shale interbeds, scattered fossil follage in bottom third; pebble lag deposit at base; unconformably overlying:
Carthage Limestone (Shoal Creek Limestone)
4 1 : I : : 11 siltstone, fining upward to nonsilty shale 200 . - . - . - .
coal, 0.44 ft thick
siltstone, fining upward into shale
coal, 1.20 ft thick shale, carbonaceous, with calcareous
nodules; some slickensides near base
- . - . - . - . . - . - . - . - - . - . - . - . siltstone, sandy at top, with . - . - . - - - clav interlaminations at bottom
I I I I I '
- - - - . . . . - - - -
shale, black, marine fossils
Chapel Coal ' coal. 0.68 ft thick \ cla~stone. weak. with shale
limestone, fossiliferous, over black shale shale, silty
- . - . - . - . . - . - . - . -
- . - . - - - - - - - - - - shale, gray, silty at top, carbonaceous
- - - - - around 540 ft , siltstone , shale, black, marine fossils sandstone, Piasa Limestone - unconformably overlying: Danville Coal 600 claystone. slickensided Bankston Fork Limestone limestone over black shale
coal, 3.0 ft thick claystone, slickensided ' limestone
siltstone, with some sandstone zones at top, laminated siltstone in lower half, fining downward
Energy Shale
700 section is estimated below TD of 699 ft
siltstone, fining downward to shale with plant debris at base
Herrin Coal coal, bright-banded, typically 8 to 9 ft thick
Figure 4 Stratigraphic column of bedrock above the Herrin Coal at the study site. Formation boundaries follow Greb et al. (1 992).
North South 75D 730 780 740 T401 580 60D
bedrock I I
- t o p / of marine units
sheet facies)
top of marine units
position of coal
/
- -- / I
study panels
5 I
thousand ft
thousand ft
North-south geologic cross section through the study area, modified from Pattee (1 994).
silty shale, although siltstone predominates. The lower 50 feet is largely poorly cemented sand- stone, but it contains some short intervals of calcite cemented sandstone. At least 60 to 65 feet of sediment was eroded by the channel at the study site (fig. 5), and the erosion cut through rela- tively low porosity shale and impure siltstone beds.
The bedrock below the study is relatively undeformed, producing relatively flat-lying strata.
The regional dip of the strata is approximately 1.9 to 2.8 mlkm (1 0 to 15 Wmile) to the east-north- east. The Rend Lake Fault Zone passes through this and neighboring mines (Keys and Nelson 1980). The fault zone consists of north-striking, parallel, normal faults with moderate to low dis- placements. At the mine level, the faults are often found in en echelon patterns, making it difficult to lay out mine panels to avoid them.
The Rend Lake Fault Zone begins to trend slightly to the north-northwest beginning several miles south of the mine, and it strikes roughly N20°W adjacent to the study area. The longwall study panels, aligned east-west, were laid out to avoid these faults (fig. 6). The position of the fault just to the east of the study panels determined the eastern extent of both panels 3 and 4. Because this fault dips westward, no fault effects were expected in the subsided overburden.
y Groundwater resources are limited and are primarily used for domestic and household needs. Surface water reservoirs, such as Rend Lake Reservoir and smaller artificial impoundments, supply water to the larger communities. Water for livestock, minor irrigation, and other farming purposes is usually obtained from small ponds found in the study area.
Groundwater is pumped from large diameter (typically 2-12 ft) dug wells that provide water for domestic purposes. These wells typically end near the top of bedrock, thus accessing sand and gravel lenses in the glacial drift overlying the bedrock surface. A survey of farmstead wells (Illinois State Water Survey 1934) showed that 4- to 5-foot-diameter wells dug from 10 to 23 feet deep were sufficient for domestic uses. Smaller diameter modern wells have also obtained ground- water from the glacial drift. Yields, however, were generally much smaller than those obtained from the dug wells.

North
The study panels and adjacent portions of the Rend Lake Fault System.
Bedrock aquifers of the nsylvanian Series in the study area are limited primarily to sandstone units; some fractured li uifers were also reported (Pryor 1956). Static water levels in these wells range t 10 to as much as 80 feet below the ground surface. The Mt. Carmel Sandstone aquifer, about 60 to 150 feet below ground surface, is most often tapped.
The mine operates in the Herrin Coal at a depth of about 720 feet. The Herrin Coal ranges from 7 to 11 feet thick in the mine and is typically 8 to 9 feet thick in the study area. The study area consisted of longwall panels 3 and 4, their adjacent entries, and the ground surface above them. Panels 3 and 4 (fig. 6) are 600 feet wide, run east-west, and approach 1 mile long. The total unsupported panel width is 61 7 feet, giving a panel width versus mine depth (WID) ratio of 0.86. The panels were mined from east to west. The carbonaceous base of the roof shale is often mined with the coal, producing actual mining heights of 9 to slightly more than 10 feet in the study panels.
Longwall mining in panel 3 began on June 15, 1988. The transverse monument line and piezome- ters were undermined in late August, and mining was completed on December 15, 1988. Longwall mining began in panel 4 on November 23, 1988. The transverse monument line was undermined in early January 1989. The piezometers and a nearby instrument cluster were undermined in early February, and the mining was completed on April 25, 1989.
The instrumentation for this study was selected to measure the geotechnical and hydrological effects of subsidence on the overburden. The ISGS proposed an instrumentation plan that was reviewed and accepted by the USBM Twin Cities Research Center, and the mine company. The ISGS was responsible for subcontracting the drilling and installation of instruments. The drilling contract was awarded to Raimonde Drilling, Inc. (RDI) of Chicago, Illinois. RDI was responsible for installation of seven bedrock piernometers, one pump well, two time-domain reflectometry (TDR)

- face advance
000000000000 - face advance
urle 7 Instrument plan over panels 3 and 4.
cables, and one inclinometerlsondex assembly. One angled-cored borehole was geotechnically and geophysically logged and used for the installation of a TDR cable. ISGS personnel assisted RDI in the installation of the TDR cables and the inclinometerlsondex assembly. Drilling and instal- lation started in August 1988 and was completed by mid-September 1988. ISGS staff were also responsible for the installation of five drift piezometers, four tiltplates, and 88 survey monuments.
One angled-cored borehole was installed over panel 4 to study the effects after subsidence. This hole was geotechnically and geophysically logged and was used for the installation of a piezome- ter. The drilling for this hole was performed by RDI in early September 1989. A down-hole camera was also used in the pump well to visualize the type of fractures or shear planes that occurred as a result of subsidence.
ine coordinates were initially used to stake out the panel 3 centerline on the surface. The instrumentation layout was designed to measure the different responses of the overburden to mining of the panel. Instruments were placed over the chain pillars, the edge, and the centerline of the panel. The instrumentation plan called for two TDR cables (one at the edge and one at the centerline of the panel); one inclinorneterlsondex assembly at the center of the panel; bedrock and drift piezometers over the chain pillars, the edge, and the centerline of the panel; and one pump well in the centerline. Survey monuments transverse and longitudinal to the panel as well as controls outside of the panel were installed as part of the monitoring plan.
Midway through the installation of panel 3, the instrumentation plans had to be changed. Although the longitudinal and transverse monuments and the drift piezometers were already installed over panel 3 by early July 1988, a decision was made to split the bedrock piezometers between panels 3 and 4. This decision was made because the longwall face was advancing at such a rate that drilling and installation of instruments could not be completed over panel 3 before the longwall face approached the study area. Consequently, only two bedrock piezometers were installed over panel 3, and the other instruments (TDR, sondex, etc.) were moved to panel 4.
Panel 4 instrumentation was located approximately 1,000 feet west and 800 feet north of the panel 3 instrumentation. The instrumentation over panel 4 consisted of the two TDR cables (over the edge and centerline), an inclinometerlsondex (over the centerline), four bedrock piezometers, and one pump well (centerline). Figure 7 shows the final instrument plan over panels 3 and 4. Two

drift piezometers, two control survey monuments, and one bedrock piezometer were installed approximately 420 feet north of the north edge of panel 4. This distance, based on the previous angle of draw (23") of panel 3, was determined to be far enough away from any influence of mining.
PV onument design and installation Subsidence monuments are used to monitor ver- tical and horizontal movements of the land surface as it subsides. The design and configuration of '
subsidence monuments can compensate for movements due to frost and moisture c soil, movements that commonly cause errors in subsidence surveys (Bauer and Van 1992). Individual monuments (fig. 8) were designed to negate the effects of frost-ind movements. The lower portion of the rebar monument was anchored in the soil below the frost line. The upper section, which exten through the frost zone to the ground surface, was jacketed with closed-cell foam insulation and C pipe to isolate the rebar from shallow soil movements.
The procedure for installing a surface monument included augering a small-diameter hole to a feet. The hole diameter had to be large enough to acce casing but as small as possible to minimize backfilling.
rmaflex or some other closed-cell foam insulation of equal length inside of the PVC, was lowered into the augered hole. A piece of (no. 8) rebar, 5 feet long and 1 inch in diame- ter, was lowered through the center of the PVCIArmaflex assembly. The closed-cell insulation filled the annular gap between the rebar and the PVC pipe (i.e., I.D. about l-in., O.D. about 2 in.). A lubricant such as graphite, silicon spray, or oil was needed to slip the foam inside the PVC pipe and over the rebar. The rebar was driven into the ground until nearly flush with the top of the PVC casing (fig. 8). The rebar was usually left sticking up slightly higher than the PVC casing so that a flat-bottomed surveying rod could rest only on the rebar.
single, prominent indentation was made in the top-center of the rebar with a metal punch and hammer. The indentation was for the tip of the surveying rod and for strain measurement between monuments. A 2-inch I.D. PVC cap was placed over the top of the 2-inch I.D. PVC pipe, and any annular space around the pipe was backfilled. The monument designation number was written on the inside and outside of the PVC cap.
Surveying methods and frequency The ISGS began baseline monitoring in May 1988. A Lietz SET3 total station equipped ith a SDR2 electronic notebook was used to set control monuments and the longitudinal and transverse survey monument lines over panels 3 and 4. Several baseline surveys were initially performed using the mine's control monuments to determine the coordinates and elevations of the controls. The mine's monuments consisted of a rebarlanchor, 2 to 3 feet in length, hammered into the ground and a spike on a telephone pole. Once the elevation and coor- dinates for the ISGS monuments were established, the mine's monuments were no longer used. This procedure ensured that higher survey accuracy would be obtained by using all monuments of similar construction. Appendix A contains the total station data.
ISGS control monuments were used to install survey monuments 35 feet apart (5% of depth of mining) in transverse and longitudinal lines over panel 3 to document dynamic and static surface subsidence and strain. Level surveys were performed using a WILD NA-2 with a micrometer and a wooden sectional rod. When proper procedures are used, the NA-2 instrument is able to achieve First-Order, Class II results, according to the Federal Geodetic Control Committee (1 984). The transverse monument line was surveyed with the level every 2 days during active subsidence. The transverse monument line was later extended over panel 4 to determine the subsidence effects between panels and any long-term subsidence over panels 3 and 4. Appendix B contains the results of longitudinal surveys and subsidence calculations; appendix C contains results and calculations for the transverse surveys; appendix D contains the closures on the control monuments.
Information provided by mine personnel was used to track the mining progress and to determine the frequency of monitoring. Monitoring surveys to document time-related effects were most fre- quent during the early, most active stage of subsidence. The frequency of monitoring decreased with the rate of movement. Instruments were monitored about every 3 months through July 1989. Long-term monitoring through December 1992 continued to document residual movement of the overburden.

PVC cap
I:::::::I
ground surface
frost zone
--......................-.*.......*......**.....-*.....-----..--.-.-...~..---
closed-cell foam insulation
1 -inch (no. 8) rebar
Frost-free monument design.
Horizontal displacement between monuments was measured using a steel tape. The accuracy of the readings was zt0.005 feet. Horizontal measurements were per- formed in the tension area of the north side of panel 3 and along four monuments on the longitudi- nal line of panel 3. Horizontal measurements were also made along a transverse monument line set up by the mine company over panel 4. All measurements were made throughout the active subsidence period. Appendix E contains horizontal displacement measurements and strain calcu- lations.
Tiltplates installed over panel 3 were used to record changes in slope as the subsi- dence wave passed. The tiltplates were set into mortar beneath the frost zone (12-1 5 in. deep) and inside of 6-inch I.D. PVC casings with caps (fig. 9). The tiltplates were placed adjacent to six frost-isolated survey monuments along the centerline of panel 3. Tiltplates were monitored during the most active subsidence.
ore logs Core was obtained before and after subsidence from two holes drilled at a 10" angle from vertical, dipping to the north, near the center of panel 4. The coring was performed at an angle in order to sample vertical fractures. Core description, core recovery, fractures, and rock quality designation (RQD) were logged in the field by ISGS personnel.

PVC cap,
I 1 6 inches
tiltplate (5.5 inch diameter)
cement grout . . . .
General tiltplate installation.
The presubsidence borehole was drilled to a depth of 700 feet. Postsubsidence drilling was diffi- cult because of subsidence-induced fracturing in the overburden. Problems associated with loss of circulation prevented drilling below 520 feet.
A stratigraphic section developed on the basis of the resulting depth-adjusted core log is pre- sented in figure 4. The bedrock here is composed primarily of Pennsylvanian-age siltstones and shales; approximately 16 feet of glacial deposits overlie it. The bedrock overburden is composed of approximately 36% shales, 42% siltstones, 14% sandstones, and 4% limestones; coals and claystones make up the remainder. The geotechnical core log is presented in appendix F. The GeoTechnical Graphics System software (1991) was used to combine all of the field logging notes into a final core log.
A separate hole along the panel 4 centerline was used to retrieve samples of the glacial material using the split-spoon sampling technique. Standard penetration tests were performed following ASTM 1586-84. This technique of sampling the glacial material was only performed before subsi- dence; thus, there are no comparisons between pre- and postsubsidence. A11 soil test results are found in appendix J.
Rock quality designation (RQD) Rock quality designation is a standard parameter for evaluat- ing the degree of fracturing of a rock core. RQD is used as an index property to indicate rock- mass quality. The RQD value, expressed as a percent, is the quotient of the sum of the length of all core segments longer than 4 inches to the drilled length of the core run. Fractures caused by drilling or handling are not included in the RQD determination.
* Fracture frequency (FF) Total fracture frequency per core run, in units of fractures per foot, is determined by counting the number of natural fractures per core run and dividing by the length of the core run. All natural discontinuities are counted, including fractures along weak bedding planes and joints. As with RQD, drilling- and handling-induced breaks are not included in the fracture fre- quency determination.
Geophysical logging Geophysical logs, including gamma ray, density, and sonic velocity, were run in the open, angled boreholes. A correlation of rock and fluid properties can be made by simultaneously running these logs. The elastic properties of the rock were computed using the sonic and the density logs. BPB Instruments, Inc. was subcontracted by the ISGS to run these logs. All geophysical logs may be found in appendixes G and H (pre- and postsubsidence data, respectively).
* Caliper log The caliper log is a mechanically measured profile of the borehole wall. A single- arm, electro-mechanical device was held closed for entry into the borehole and activated during the logging run (BPB Instruments, Inc. 1982).

r Gamma ray log The gamma ray log is used to measure the naturally occurring radioactivity in the rock. Radioisotopes normally found in rocks are potassium ( 4 0 ~ ) , thorium, and uranium. Clay minerals usually have relatively high concentrations of 4 0 ~ , SO shales generally exhibit high gamma ray intensity. Sandstones and carbonates generally produce lower gamma ray counts because of their relatively low concentration of highly radioactive constituents (Lynch 1962).
Density log The density log is a measure of the electron density of the formation. Gamma rays are first scattered in the formation. These rays then collide with the electrons in the forma- tion; the rays reaching a detector are then counted as an indication of formation density. Density logs are primarily used as porosity logs (Lynch 1962).
Sonic log The sonic log is generally used to determine the porosity of the formation. The sonic device measures the transit time of a sound pulse, or compression wave, through a given length of rock; in this case, the receivers were spaced at 24 and 40 inches. Measurement of the time taken for the wave to pass between receiver pairs enables the calculation of the velocity, nor- mally known as the sonic velocity. The rate of propagation of the compression wave through the rock depends on the elastic properties of the rock matrix and its contained fluids. The multichannel sonic sonde measures the compressional 'P' wave velocity (Vp) (Lynch 1962, BPB lnstruments 1 982).
Computed composite moduli analysis The use of borehole geophysical logging techniques presumes that there are relationships between the geophysical and the geotechnical properties of the geological strata. Although there is a scale effect associated with this presumption, borehole geophysical logging techniques are used to provide in situ geotechnical parameters. The shear wave velocity was calculated, using the density log and the sonic log data, by Christiansen's equation:
where Vs = shear wave velocity (ft/s) Vp = compression wave velocity (ft/s) p = mass specific gravity of rock, defined as y/yw, where y and yw are the unit weights
of rock and water (1b1in.q~ respectively.
Forster and McCann (1 979) determined that these computed shear wave velocities were in error by as much as 25% as a result of low readings of the density tool in sections of borehole where excessive caving had occurred. The other dynamic properties are calculated using the following equations.
Poisson's ratio was calculated using the following equation (BP Instruments 1982):
VP where R = - v s
Young's modulus was calculated by this equation (BPB lnstruments 1982):
where E = Young's modulus (psi) g = acceleration of gravity (in./s2) Vp = compression wave velocity (in./s)
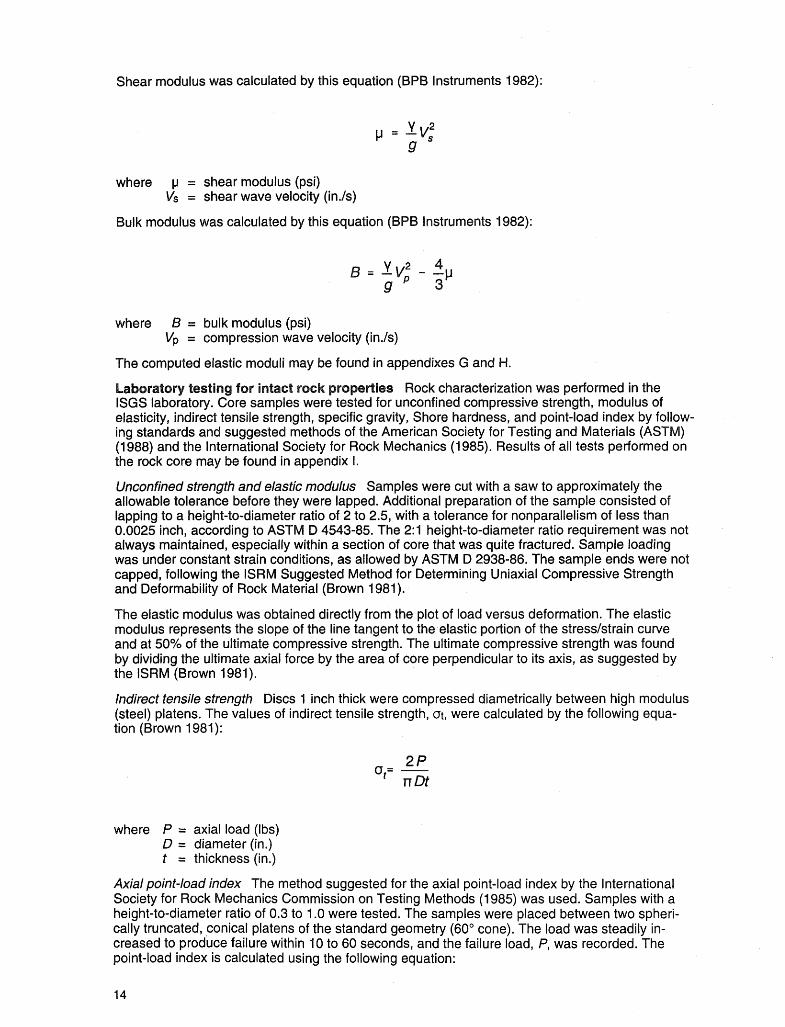
Shear modulus was calculated by this equation (BPB Instruments 1982):
where p = shear modulus (psi) b/s = shear wave velocity (in.1~)
Bulk modulus was calculated by this equation ( PB Instruments 1982):
where = bulk modulus (psi) Vp = compression wave velocity ( ink)
The computed elastic moduli may be found in appendixes G and H.
Rock characterization was performed in the ISGS laboratory. Core samples were tested for unconfined compressive strength, modulus of elasticity, indirect tensile strength, specific gravity, Shore hardness, and point-load index by follow- ing standards and suggested methods of the American Society for Testing and Materials (ASTM) (1 988) and the International Society for Rock Mechanics (1 985). Results of all tests performed on the rock core may be found in appendix I.
Unconfined strength and elastic modulus Samples were cut with a saw to approximately the allowable tolerance before they were lapped. Additional preparation of the sample consisted of lapping to a height-to-diameter ratio of 2 to 2.5, with a tolerance for nonparallelism of less than 0.0025 inch, according to ASTM D 4543-85. The 2:1 height-to-diameter ratio requirement was not always maintained, especially within a section of core that was quite fractured. Sample loading was under constant strain conditions, as allowed by ASTM D 2938-86. The sample ends were not capped, following the ISRM Suggested Method for Determining Uniaxial Compressive Strength and Deformability of Rock Material (Brown 1981).
The elastic modulus was obtained directly from the plot of load versus deformation. The elastic modulus represents the slope of the line tangent to the elastic portion of the stresslstrain curve and at 50% of the ultimate compressive strength. The ultimate compressive strength was found by dividing the ultimate axial force by the area of core perpendicular to its axis, as suggested by the lSRM (Brown 1981).
Indirect tensile strength Discs 1 inch thick were compressed diametrically between high modulus (steel) platens. The values of indirect tensile strength, at, were calculated by the following equa- tion (Brown 1981):
where P = axial load (lbs) D = diameter (in.) t = thickness (in.)
axial point-load index The method suggested for the axial point-load index by the International Society for Rock Mechanics Commission on Testing Methods (1985) was used. Samples with a height-to-diameter ratio of 0.3 to 1.0 were tested. The samples were placed between two spheri- cally truncated, conical platens of the standard geometry (60" cone). The load was steadily in- creased to produce failure within 10 to 60 seconds, and the failure load, P, was recorded. The point-load index is calculated using the following equation:

where IS = P = De =
uncorrected point-load strength (psi) axial load (Ibs) "the equivalent core diameter" = thickness (in.)
This equation does not take into account variable sample thicknesses; therefore, a size correction is required. The size correction for the axial point-load index T500 of a rock specimen or sample is defined as the value that would have been measured by a diametralttest with D = 50 mm (Brook 1980). The corrected axial point-load index is calculated by the following equation:
where T500 = corrected point-load index (MPa) P = load (kN) A = diameter x thickness (mm2)
center portion of the samples tested for unconfined strength was used for moisture content determination. Moisture content was calculated as a percentage of the dry weight of the sample, as specified in ASTM D 2216-80.
Shore hardness A model D schleroscope, manufactured by Shore Instrument and Manufactur- ing Company, was used for hardness determination of compressive strength specimens. Each of the values in the summary tables (in appendix I) is an average of the highest 10 tests from a total of 20 tests performed on the lapped ends of the uniaxial compressive strength test specimen, as described in Brown (1981).
The TDR technique was used to document fracture development caused by subsidence in the overburden. This technique was developed by the power and com- munications industries to locate breaks in transmission cables. A TDR tester sends ultra-fast rise time voltage pulses down the coaxial cable. Deformations in the cable reflect signals back to the tester. Reflections appear as a distinct signature versus distance on a cathode-ray tube (CRT) or strip-chart recorder. Researchers at Northwestern University (Dowding et al. 1988, 1989) deter- mined the optimum cable size, bonding strength, and grout composition; they also characterized the signatures caused by different modes of deformation (e.g., tension versus shear).
Two TDR cables were installed at this site. Both were 0.50 inch diameter, unjacketed, Cablewave System FXA 12-50 cables. One was placed on the centerline of the panel near the inclinometer1 sondex, and the other was placed 99 feet inside the north edge of the panel. Figure 10 shows a schematic of the TDR installation.
The entire TDR cable was laid out on the ground and reference crimps were placed at intewals of 20 feet. Without reference crimps along the cable, location accuracy is on the order of 2% of the distance from the tester to the cable defect. Crimps at known distances allow for much more accu- rate measurements. The reflected signal is attenuated as a function of distance along the cable. Therefore, a wider crimp, consisting of adjacent, individual plier crimps, was required at greater depths to produce the desired signal amplitude of 40 mp. An anchorlweight was then attached to the cable to ease the installation down a 3-inch-diameter borehole. This anchorlweight consisted of a black steel pipe that was 5 feet long and 0.75 inch or 1.63 inches in diameter and was placed over the cable with a wire clamp to hold it in place. The borehole was then grouted from the bottom up to the surface. The grout had a 65% water-to-cement ratio by weight (7.6 gallons194 Ib sack cement). High early strength Type Ill cement and 2% Intrusion-Aid (Intrusion-Prepakt, Inc. 1980) were used, as recommended by Dowding et al. (1 989). The TDR installation and monitoring were part of an ongoing contract with the Office of Surface Mining to test the application of using TDR to monitor overburden fractures. Results of several studies over both active and abandoned mines using the TDR technique may be found in Bauer et al. (1991).

BNC
locking \ protective cover
/ battery operated TDR cable tester
record
crimp in cable (every 20 ft)
cement grout
cable anchor
Figure 10 Schematic of the TDR installation.
Changes in the distance between the inner and outer conductors of the cable, breaks in either conductor, or touching of the inner and outer conductors will produce changes in the induced volt- age signature. These changes in the cable geometry are read and recorded by a cable tester. The cable tester has a CRT screen where the signal can be viewed; it also has a strip-chart recorder so that a hard copy of the signal can be preserved.
Shear deformation of the TDR cable causes an easily detectable TDR reflection spike that in- creases in magnitude in direct response to shear deformation of the cable. consequently, it is possible to monitor the rate of shear deformation by obtaining a series of TDR records over a period of time. Extension deformation of the TDR cable causes a subtle, troughlike TDR reflection

that increases in length as the cable is deformed. Cable failure caused by extension can be distin- guished from that caused by shearing by the absence of a shear reflection spike at the point of failure.
TDR cable 99 feet inside panel edge The cable inside the panel edge was 699 feet long. Six plier crimps were used every 20 feet from 19.1 feet below the ground surface down to 519.1 feet in order to attain 40-mp signal amplitudes. Eight plier crimps were used from 519.1 feet to the bot- tom of the cable. The cable was lowered by hand down the 3-inch-diameter borehole using a 5-foot-long, 1.63-inch-diameter black pipe as the weightlanchor. The hole was grouted to within about 160 feet of the ground surface. The rest of the hole was backfilled with bentonite in order to avoid shear failure of the cable in the glacial material.
TDR cable at the centerline of panel The cable at the centerline of the panel was installed in a 3-inch-diameter borehole that was cored. The cable at the centerline needed many more plier crimps to produce the 40 mp amplitude signal than did the other cable. This cable was 684.5 feet long and required six plier crimps every 20 feet from a depth of 4.5 to 44.5 feet, eight plier crimps from 64.5 to 344.5 feet, 10 plier crimps from 364.5 to 384.5 feet, and 12 plier crimps from 404.5 feet to the bottom of the cable. The large number of crimps made the reflected signals very flat and wide, in comparison with the narrower sharp signal peaks of the other cables. The cable was installed using the same method as above, except that a 5-foot-long, 0.75-inch-diameter black pipe was used as the weightlanchor. The borehole was backfilled to the top of bedrock. A bentonite grout was used up through the glacial material.
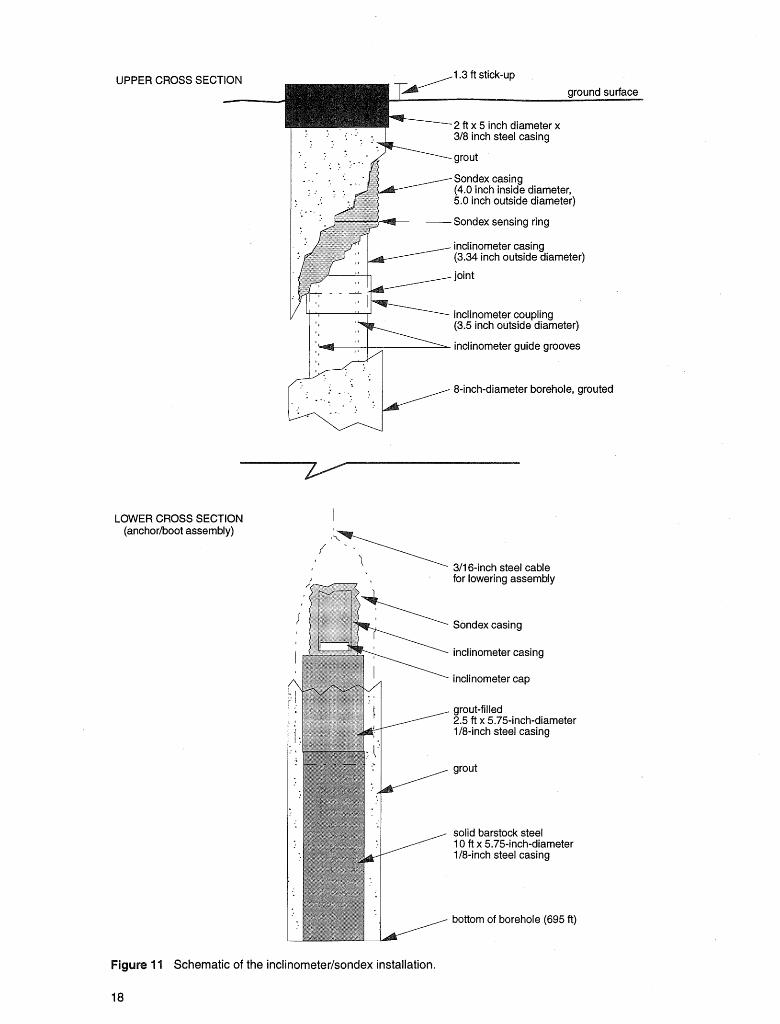
The inclinometerlsondex asse bly was installed to measure both horizon- ement of the overburden strata. ecause the overburden was so thick at
this site, an inclinometerlsondex arrangement was used instead of rod extensometers and an inclinometer. The sondex was expected to allow extension measurements to be taken at numer- ous points in the overburden more economically than rod or wire extensometers.
The inclinometer/sondex assembly was installed in an 8-inch-diameter borehole near the center- line TDW cable. The borehole was grouted to within 40 feet of the top of the coal seam. The sondex settlement system manufactured by Sl CO, Inc., consists of the following: a marked elec- trical cable with a sondex probe at the end; a readout unit located on the storage reel with internal batteries and sensitivity controls; and a 4-inch (I.D.) corrugated, flexible, plastic casing with sens- ing rings. The sondex probe was slowly lowered down the casing. The location of each sensing ring was measured from the ground surface. The accuracy of the probe was k0.005 foot. The sensing rings were spaced every 20 feet from the ground surface down to 460 feet and every 10 feet from 460 to 680 feet deep (fig. 11).
BS plastic inclinometer casing was placed inside the 4-inch sondex pipe s large diameter casing was used so that strata movements would not inclinometer or sondex probes. This length of inclinometer necessitated
Is for raising and lowering the cable as well as a readout unit capable ata. The annulus between the sondex corrugated pipe and the bore-
hole wall was then grouted with a bentonite slurry to the ground surface. The annulus between the sondex pipe and the inclinometer pipe was left without any fill material.
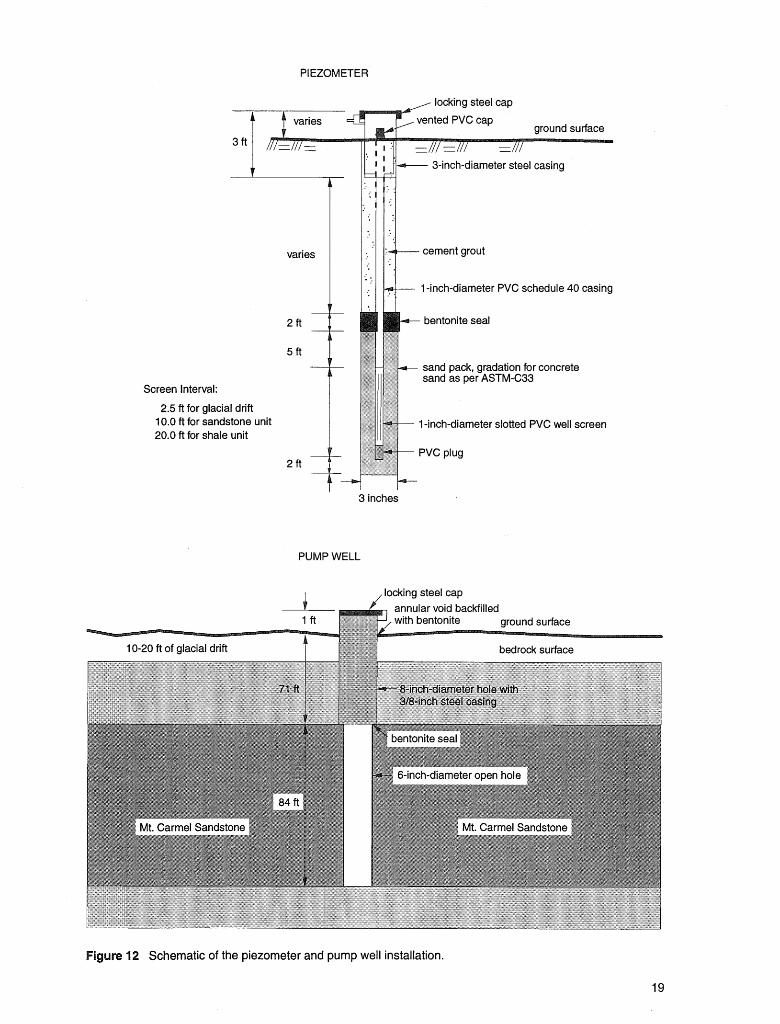
piezometers of 1 -inch-diameter PV g. 12) were installed to monitor the hydro- of subsidence in the glacial drift, th . Carmel Sandstone aquifer, and a deep
shale unit. Drift and sandstone piezometers were positioned over the chain pillars, on the center- line, and on the edge of the longwall panel. The piezometers monitoring the deep shale unit and the pump well were located near the centerline of panel 4. Piezometric levels were monitored hourly by using (1) pressure transducers and data recorders during the most active subsidence period and (2) a drop line after water levels were deemed more stable. Several publications report on the hydrogeological investigations performed at this site by geologists from Northern Illinois University (MU) (Spande 1990, Booth and Spande 1990, 1991, 1992a, b, Booth 1992, Pattee 1994, Miller in prep.).
Piezometers in the glacial drift were installed an average depth of 15 feet, with a 5-f00t screened section at the bottom of the piezometer. Screens were placed in the lower part of the drift just above the bedrock. These piezometers were installed in early June 1988 by ISGS personnel. '
,1.3 ft stick-up
-2 ft x 5 inch diameter x . . , , . ( . . a ' - . . . , , 318 inch steel casing
. . - . .. . : . , ; . ,"'
grout . . . . . Sondex casing (4.0 inch inside diameter, 5.0 inch outside diameter)
Sondex sensing ring
inclinometer casing (3.34 inch outside diameter)
joint
inclinometer coupling (3.5 inch outside diameter)
I inclinometer guide grooves
I--,; . ' ., 8-inch-diameter borehole, grouted . - . ' - . : - - -
LOWER CROSS SECTION I (anchorlboot assembly)
J' * -
I -'--._ 311 6-inch steel cable for lowering assembly
Sondex casing
inclinometer casing
inclinometer cap
grout-filled 2.5 ft x 5.75-inch-diameter 118-inch steel casing
grout
solid barstock steel 10 ft x 5.75-inch-diameter 118-inch steel casing
bottom of borehole (695 ft)
Figure 11 Schematic of the inciinometerlsondex installation.
18
PIEZOMETER
locking steel cap
? varies ted PVC cap ground surface
varies
Screen Interval:
2.5 ft for glacial drift 10.0 ft for sandstone unit 20.0 ft for shale unit
cement grout
7 1 inchdiameter PVC schedule 40 casing
bentonite seal
sand pack, gradation for concrete sand as per ASTM-C33
1 -inch-diameter slotted PVC well screen
3 inches
PUMP WELL
I , locking steel cap
Schematic of the piezometer and pump well installation.
19
II but one of the piezometers were placed in the 80-foot-thick Mt. Carmel Sandstone. All bedrock piezometers consisted of 10-foot screened sections, except for a 20-foot screened section installed in the deep shale unit. A e-inch-diameter, 155-foot well was installed over the center of panel 4. The well was cased to a depth of 90 feet and left open through the full thickness of the aquifer. This well was used to perform pump tests (Booth and Spande 1992a, b).
Premining hydraulic properties over panel 4 were determined using slug tests in piezometers, an aquifer pumping test in the 6-inch well, and hydraulic injection tests (packer tests) in the deep inclined borehole. Subsidence damage to the piezometers inside the panel prevented their further use; however, postsubsidence hydraulic properties were determined
ts in the postsubsidence cored borehole (T402). In 1991, two piezometers installed ecorded the postsubsidence water levels and the hydraulic conductivity of the Mt.
Carmel Sandstone aquifer. orneters have shown that water lev s in the sandstone aqui- fer recovered (Pattee 1994) haracterization was performed by IU researchers assisted by ISGS personnel (Spand 0th and Spande 1992a, b).
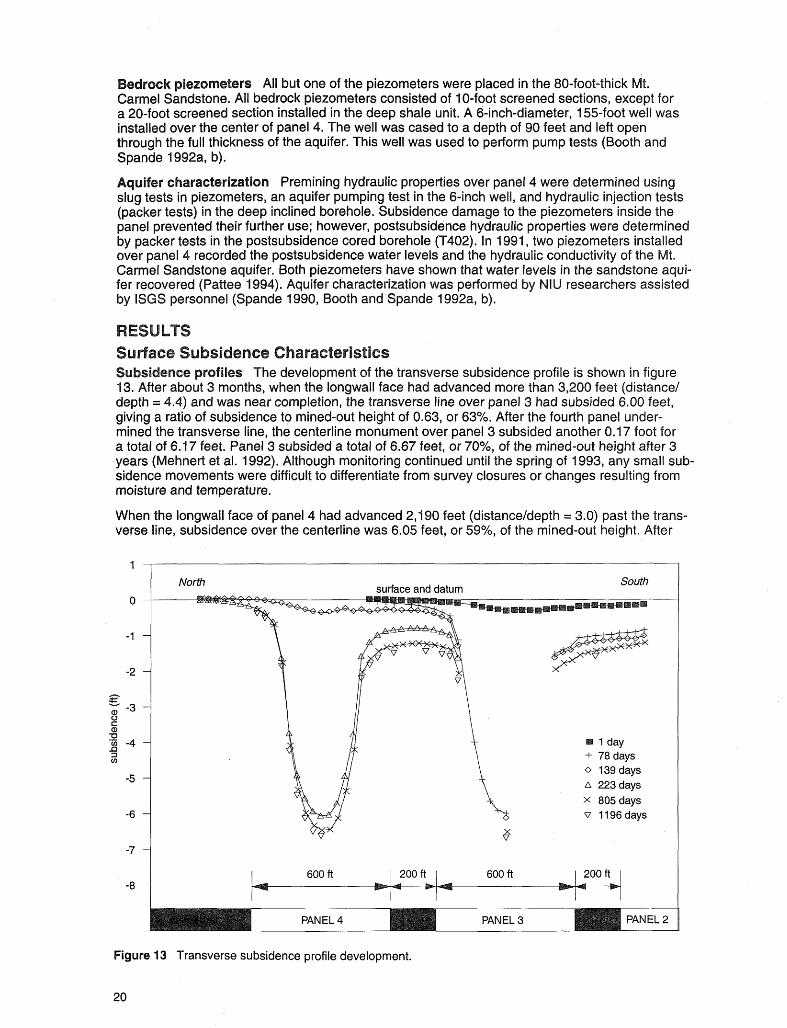
The development of the transverse subsidence profile is shown in figure ths, when the longwall face had advanced more than 3,200 feet (distance1
depth = 4.4) and was near completion, the transverse line over panel 3 had subsided 6.00 feet, giving a ratio of subsidence to mined-out height of 0.63, or 63%. After the fourth panel under- mined the transverse line, the centerline monument over panel 3 subsided another 0.17 foot for a total of 6.17 feet. Panel 3 subsided a total of 6.67 feet, or 70%, of the mined-out height after 3 years (Mehnert et al. 1 992). lthough monitoring continued until the spring of 1993, any small sub sidence movements were difficult to differentiate from survey closures or changes resulting from moisture and temperature.
When the longwall face of panel 4 had advanced 2,190 feet (distanceldepth = 3.0) past the trans- verse line, subsidence over the centerline was 6.05 feet, or 59%, of the mined-out height. After
1 North surface and datum
South
0
-1
-2
h
5 a, -3 0 c a, -0 -5 -4 a 3 V)
0 139 days -5
A 223 days x 805 days
-6 v 1196 days
-7
-8
igure 13 Transverse subsidence profile development.
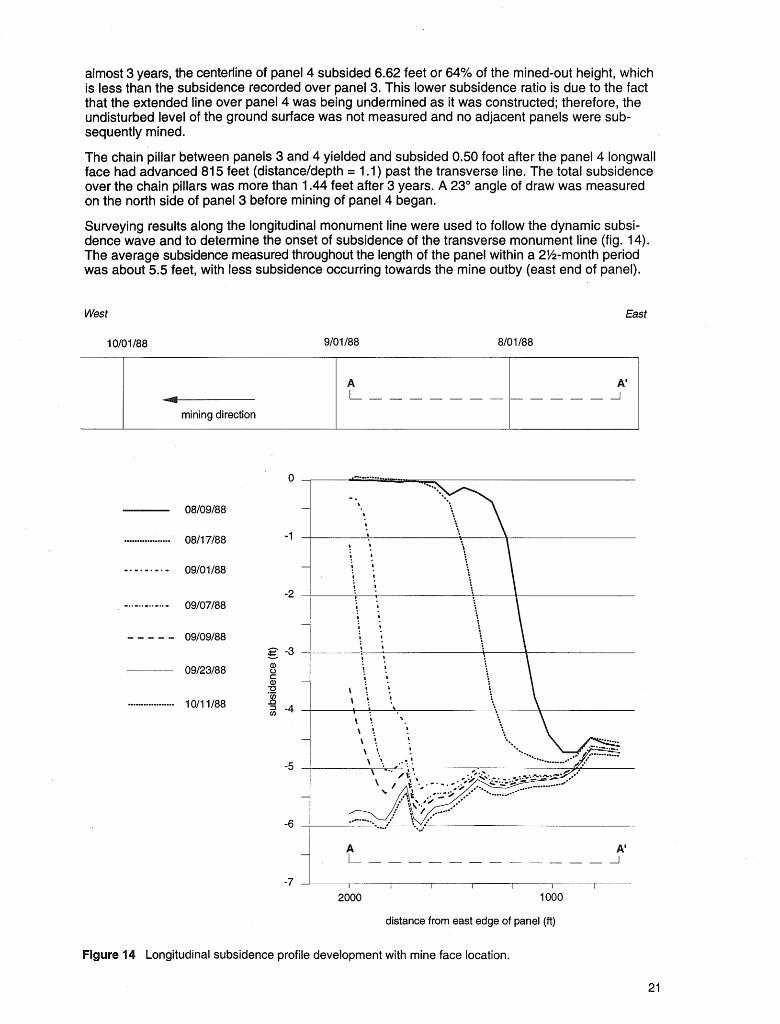
almost 3 years, the centerline of panel 4 subsided 6.62 feet or 64% of the mined-out height, which is less than the subsidence recorded over panel 3. This lower subsidence ratio is due to the fact that the extended line over panel 4 was being undermined as it was constructed; therefore, the undisturbed level of the ground surface was not measured and no adjacent panels were sub- sequently mined.
The chain pillar between panels 3 and 4 yielded and subsided 0.50 foot after the panel 4 longwall face had advanced 815 feet (distanceldepth = 1 . I ) past the transverse line. The total subsidence over the chain pillars was more than 1.44 feet after 3 years. A 23" angle of draw was measured on the north side of panel 3 before mining of panel 4 began.
Surveying results along the longitudinal monument line were used to follow the dynamic subsi- dence wave and to determine the onset of subsidence of the transverse monument line (fig. 14). The average subsidence measured throughout the length of the panel within a 2%-month period was about 5.5 feet, with less subsidence occurring towards the mine outby (east end of panel).
West East
distance from east edge of panel (ft)
Longitudinal subsidence profile development with mine face location.
Transverse line over panel 3 1 1 1 to M107) Horizontal measurements to deter- mine strain were performed over the north edge of panel 3 and along four monuments in the longi- tudinal line of panel 3. The coordinates along the transverse line were obtained with the total station (June 30, 1988). These measurements were used as a baseline for determining horizontal strain. The monument line was undermined on August 31, 1988. A steel tape was then used to measure distance between monuments; measurements were taken almost daily from September 6 to September 23, 1988. The maximum strain was 0.014, located approximately 81 feet inside the panel edge. The location of the maximum tension is within the range of values typically observed in the Illinois Basin (Bauer and Hunt 1982). From the subsidence profile, the maximum tensile strain was located between M I 12 and MI 11 ; there was an elevated county road and fence between these two monuments, however, which made measuring strain difficult.
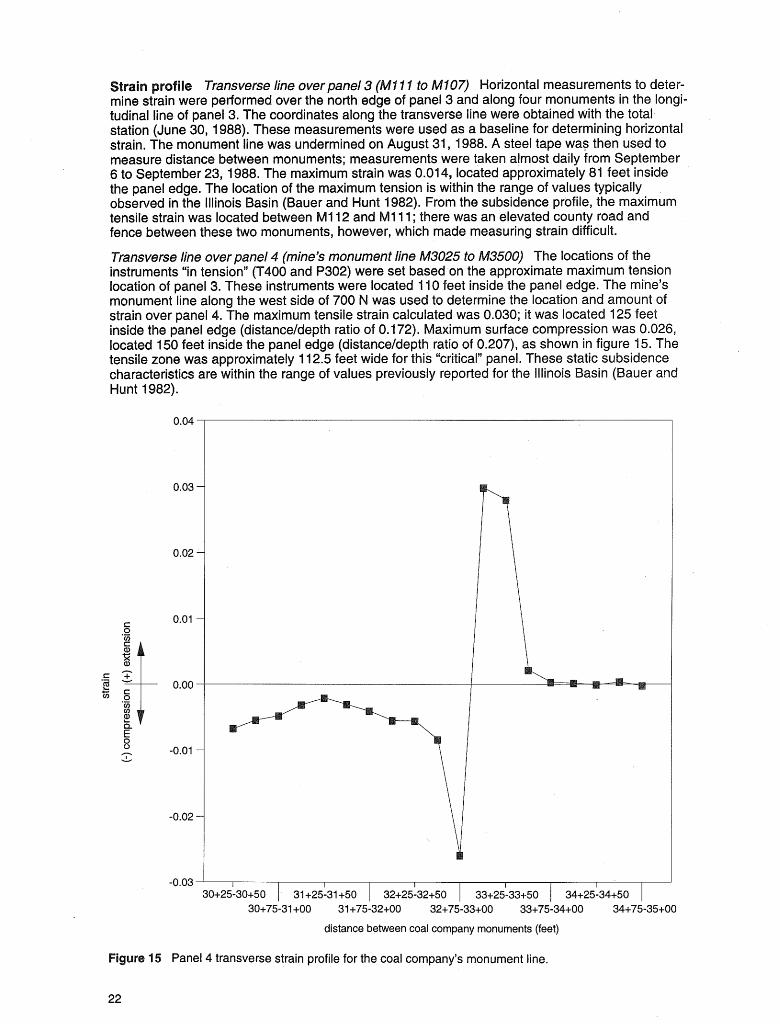
Transverse line over panel (mine's monument line 00) The locations of the instruments "in tension" (T400 and P302) were set based on the approximate maximum tension location of panel 3. These instruments were located 11 0 feet inside the panel edge. The mine's monument line along the west side of 700 N was used to determine the location and amount of strain over panel 4. The maximum tensile strain calculated was 0.030; it was located 125 feet inside the panel edge (distanceldepth ratio of 0.1 72). Maximum surface compression was 0.026, located 150 feet inside the panel edge (distanceldepth ratio of 0.207), as shown in figure 15. The tensile zone was approximately 11 2.5 feet wide for this "critical" panel. These static subsidence characteristics are within the range of values previously reported for the Illinois Basin (Bauer and Hunt 1982).
0.04
30+75-3l+OO 31 +75-32+OO 32+75-33+00 33+75-34+00 34+75-35+00
distance between coal company monuments (feet)
15 Panel 4 transverse strain profile for the coal company's monument line.

Longitudinal line over panel 3 134 to M137) Horizontal measurements to determine strain were performed over the centerline of panel 3 (MI34 to MI 37). Cracks between monuments were documented to show the effect of the dynamic subsidence wave at the ground surface. The aper- ture of the cracks increased as the panel face passed and then closed up after the face was well past the area. The maximum aperture measured was 0.25 inch when the face was approximately 70 feet past the cracks. This maximum aperture corresponds to the first measurable strain be- tween monuments.
Longitudinal line overpanel4 (M76, P350, 1500, T401, M77, and M78) Strain was determined over the centerline of panel 4 (M76 to M78). The area enclosed by these monuments included the pump well, inclinometer hole (1500), and the TDR (T401) hole. The maximum tensile strain calcu- lated was 0.028, between 1500 and T4Ol.
es The tiltplates were placed adjacent to monuments MI 16, M134, M I 35, M I 36, M I 37, and M I 38 at the centerline of panel 3, as shown in figure 7. The tiltplate pegs were oriented north- south and east-west to document the dynamic slope changes as the longwall face advanced from east to west and also to record any permanent subsidence-induced slope changes in the north-south direction.
As the longwall face passed, daily measurements were performed using a SlNCO Digitilt Indica- tor (50306) with a SINCO Tiltmeter Sensor (50322). Subsidence was measured on adjacent sur- vey monuments. Figure 16 shows subsidence, tilt, and face advance as a result of the dynamic subsidence wave for tiltplate 116, which was located along the centerline of panel 3. The tilt for the east-west pegs increased with subsidence until the inflection point was reached, and then it decreased as subsidence continued to increase. The north-south pegs did not vary as much, although there was a slight change in the final tilt. The tilt versus subsidence results for the east- west pegs were similar to those found by Powell et al. (1 986). The maximum tilt of 1 .3g0 is com- parable with that measured at another Illinois site where tilt was measured directly on a founda- tion (Triplett et al. 1992).
E-W tilt 0 N-S tilt e
1.6 1.4 1.2 1.0 0.8 0.6 0.4 0.2 0.0 -400 -200 0 200 400 600 800 1000
tilt (.) face advance (ft)
Subsidence, tilt, and face advance resulting from the dynamic subsidence wave for tiltplate 11 6, located along the centerline of panel 3.

813 1 188 Easting (ft)
760 800 840 880 920 0.0
I .o
2.0
3.0
9/7/88 9/9/88 Easting (ft) Easting (ft)
760 800 840 880 920 760 800 840 880 920
9/23/88 Easting (ft)
760 800 840 880 920
values from subsidence (vertical --- values from tiltplate measurements displacement) measurements
Subsidence, tilt, and curvature results using two monitoring techniques.
Figure 17 shows a series of plots showing the development of the dynamic parameters through time. The tilt and curvature for both the tiltplates ("points") and survey monuments are equal. The slight differences are probably due to the fact that calculations of tilt and curvature via the survey monuments used the average distance between monuments.
Figure 18 shows a comparison of pre-and postsubsidence core logs. Although drilling through the postsubsidence overburden was more difficult because of the loss of drilling fluid in some highly fractured zones, core recovery was excellent before and after subsi- dence. Changes in the RQD of the respective cores were not unique to any particular lithology but more a function of the position of mining-induced fracture zones within the overburden. Under- mining caused the fracture frequency in the lower bedrock to increase dramatically, whereas only smaller increases were noted toward the surface. The larger increases occurred in the stronger materials, which deform more like brittle material (Bauer 1984).
s A plot of subsidence-induced changes in shear-wave velocity (fig. 18) shows four spikes that represent velocity decreases of 12% to 18%. These spikes directly correlate with coals and thin calcareous zones where more fracturing and bed separations occurred within the overburden. The general decrease of 1 % to 10% in the shear-wave velocity throughout the rest of the overburden is the result of wave attenuation through a fractured medium filled with fluid. Comparison of this plot with the postsubsidence fracture frequency and hydraulic conductivity logs supports this conclusion.
The other geophysical logs (caliper, density, and gamma ray log) did not show any appreciable changes as a result of subsidence.
roperties Intact rock core specimens were tested in the laboratory and classified following the methods of Deere and Miller (1 966). Figures 19 and 20 show plots of laboratory-

core recovery (=N
RQD ("w
fracture frequency change in shear hydraulic conductivity (fractures11 0 ft core run) wave velocity (cmls)
presubs. postsubs. presubs. postsubs. presubs. postsubs. (w - presubs. _ postsubs.
lithology
/ top of bedrock shale and siltstone 1 shale
sandstone shale
sandstone
, limestone shale coal silt tone
300 C O ~ shale
400 -- . -. - - -. coal =\ claystone - - - - - - - - -
- . -. -. -. \ shale
700 siltstone coal
Comparison of pre- and postsubsidence core logs. Lithology is interpreted below 699 feet.

shale + sandstone 0 limestone
0 siltstone
x claystone
0 shale/limestone
medium B
high strength
uniaxial compressive strength (psi x lo3)
Presu bsidence intact rock properties.
very low
20.00
10.00 re shale
a- + sandstone
s 0 limestone X
D low
strength
C medium strength
B high
strength
4 8 16 32 uniaxial compressive strength (psi x 1 03)
very high
ure 20 Postsubsidence intact rock properties.

time domain reflectometry signals
face position (f?)
Progression of TDR cable deformation at the centerline of panel 4.
tested specimens from pre- and postsubsidence drill cores. The uniaxial strength of a particular specimen is plotted against its tangent modulus taken at one-half the ultimate strength. Presubsi- dence plots show typical ranges of values for the given rock types. Data from the postsubsidence drill cores are limited, but they suggest that the rock strength decreased somewhat. Any effects to the modulus are indistinct. Subsidence may increase microfracturing or disrupt bedding planes or laminae, causing a decrease in strength. Strength information is best evaluated using the informa- tion shown in figures 19 and 20. Complete rock strength test data may be found in appendix I.
TDR cable 99 feet inside panel edge As mining progressed, this h of 262 feet, in tension at 138 feet, in shear at 11 1 feet, and finally
failed at a depth of 3 feet. Figure 21 shows the signal amplitude changes and the digitized signal outputs for the cable readings. The failure at a depth of 11 1 feet occurred in the upper part of the Mt. Carmel Sandstone, the last reflection amplitude was -58 mp. The failure at 138 feet is close to the base of the Carmel Sandstone, which is in contact with a shale unit. The failure at a depth of 262 feet occurred near a 0.3-foot-thick coal seam and had a maximum signal ampli- tude of -52 mp. Failures in this cable occurred near contacts between strong and weak lithologic units, and near weak units, such as thin coal. The 52 and 58 mp amplitude changes represent about 0.12 inch of displacement between the inner and outer conductors of the cable before fail- ure, as determined by the relationship between shear deformation and reflection coefficient for a 0.5-inch-diameter cable (fig. 8 in Dowding et al. 1989).
TDR cable at centerline of panel The cable in the center of the panel failed in tension at a depth of 11 7 feet on or just before February 9, 1989. No distortions were detected before this break. The failure at 11 7 feet corresponds to the top of the Mt. Carmel Sandstone in contact with a shale unit. A tensile strain of about 1% was calculated in the depth interval from 107.3 to 126.3 feet

using the sondex. After the failure at 11 7 feet, the cable deformed at depths of 51 an with reflection (signal) amplitudes of as much as -20 and -33 mp, respectively.
x Sondex As the longwall face approached the inclinometerlsondex hole, the upper 50 feet of overburden yielded 0.2 foot of vertical extensional movement. The lower 500 feet of overburden experienced very small changes. When the mine face advanced to within 50 feet of undermining the sondex, the upper bedrock continued ile the lower podion of the bedrock underwent small (0.01 foot) compressional displa y February 9, 1989, when the longwall face was 38.5 feet past the borehole, both th and inclinometer sondes could not be lowered below 423 feet, which is the depth of a 0 claystone unit. The next day the sondex could not be lowered the instruments could not be lowered below 145 feet; 1 week only to be stopped at the 5-foot point again.
The amount of strain between each son ex ring ranged from + .7% (extension) to -1. vertical strain were mostly related to lithologic changes. The largest
pper part of the bedr k, very near the ground surface. The . Carmel Sandstone. plot of vertical changes for each rin
(without taking into account subsidence) helps to identify zones of bedrock separations (fig. 22). ce approached, vertical extensional separations occurred near the top 50 feet the longwall face had advanced 100 feet, "b mstl approximately 100 feet thic
This response can be interpreted from the " shaped graph of changes ver- ix L contains the sondex data.
Sondex changes (ft)
T400 nt
TDR events in T4OO geologic TDR events in T401 (tensile zone) column (centerline) -0.2 0.0 0.2 0.4 0.6 0.8
shear at base of black shear in base of silt- fissile shale, 50 ft
shear in Mt. Carmel Sandstone, 111 ft
break in Mt. Carmel Sandstone, 11 5 ft
extension at base
shear and break just below thin coal, 262 ft
Comparisons between the TDR events and sondex changes occurring near the upper part of the bedrock.
28

Inclinometer Six sets of inclinometer readings were obtained between January 24, 1989, when the panel face was located 485 feet away from the inclinometer, and February 23, 1989, when the face was 637 feet past it. As the face approached the inclinometer, no significant horizontal displacements were detected until the face was between 125 and 60 feet away; at this time, noticeable horizontal displacements were measured. Major differential displacements of about 1 inch each were measured at four different depths when the face was 60 feet away. The relative displacement at a depth of 175 feet was located within an interlaminated siltstone. The next dis- placement occurred at 260 feet, just below a thin coal. The other two displacements took place at deeper locations: at 530 feet within a shale layer and at 590 feet, probably through a slickensided claystone. The magnitude of displacements corresponded to the northwest-southeast direction, which is about 45" relative to the mining direction (fig. 23).
When the face was 21 8 feet past the inclinometer, two substantial relative displacements were measured. The shallower displacement occurred at a depth of 50 feet, through the base of a black, fissile shale; this displacement had a magnitude of 7 inches. This shear plane was also detected by the centerline TDR cable. At a depth of 150 feet, close to the contact between the Mt. Carmel Sandstone and the interlaminated siltstone, the inclinometer casing had a displacement large enough to block the downward passage of the probe. Therefore, the magnitude of the cumu- lative displacement measured after this event is unknown because the fixed reference at the bot- tom of the casing was lost. Unfortunately, total station surveys were not performed each time the inclinometer was read, so a fixed reference at the top of the inclinometer was not available. The last two readings (fig. 23) cannot be compared with each other, nor can they be related to previous readings because the reference was no longer fixed. They can be analyzed individually, however, and do provide relative displacements with depth, a relationship that is indispensable in identifying sliding surfaces.
Drift water levels and local water-supply wells showed no apprecia- ble change during mining. Water level response was more a function of seasonal effects (Freeze and Cherry 1979) (fig. 24). Water levels in the drift piezometers were low during periods of high evapotranspiration (early spring to early fall), and water levels were high during low evapotranspi- ration (fall and winter). Hydrographs for all drift piezometers and daily precipitation are presented in appendix K.
0 50 100 150 200 250 300 depth (ft)
Inclinometer data showing the location of the shear planes found by the TDR cable and the dynamic movement of the bedrock with the advancing longwall face.

Piezometer P202 (continuous record) -1 4 I i i I I
1 Precipitation monthly, departure from normal
August November February May August 1988 1989
Piezometric response of the drift piezometers due to precipitation and not mining.
Hydrographs from Mt. Carmel Sandstone piezometers located on the centerline and chain pillars of panel 3 are shown in figure 25. Water levels declined as the mine face approached the instruments, reached maximum lows when tensile strains (as meas- ured on the surface) passed, showed a temporary recovery spike as the maximum compressive strain passed, and then steadily recovered for 3 months until passage of the mine face of the adja- cent panel. In each piezometer, maximum tensile strains were measured when the mine face was 50 to 100 feet past the instruments; this correlates with the maximum surface aperture measured when the face was approximately 70 feet past the surface cracks. Water levels in piezometers on the adjacent panel began to decrease when the approaching mine face was about 1,500 feet away.
Piezometric drops are caused by increased secondary porosity resulting from developing and opening fractures in the tensile part of the wave. Recovery occurs when the compressive part of the subsidence wave passes the piezometer, the fractures partially close, and the cone of depres- sion associated with the advancing longwall face (tensile event) moves away. The association between water level fluctuations and dynamic-subsidence strains has also been documented by Walker (1988). Bedrock water levels recovered within 2 to 3 months of undermining.

1st panel mining ~ I B
2nd panel mining
maximum tensile events
Julian days
Piezometric response of the bedrock piezometers over panel 3.
220 1 260 1 300 1 340 1 380 S 0 N D J
Julian date 1988
ure 26 Water level in the well in the center of panel 3. Arrows point to days when therawas no mining. After day 340, note the drop in water level caused by the mining of panel 4.

As the mine face approached each well, water levels showed steps or plateaus related to tempo- rary mine work stop undays; indicated by arrows on fig. 26). The effect of no mining is shown by after the day off. The declining curve shows partial recovery during work stoppage, and the recovery curve slows down when work sta up again. The gen- eral rate of decline as the face advanced was approximately 1.5 feeway, ereas the recovery rate was 0.7 foot/day.
g quite differently from
resubsidence hydraulic conductivities of 1 o ' ~ to 1 o - ~ cmls (shales)
n fracture frequency in the postsubsidence hole.
sequence of events anel 4 is presented in table 1. Panel 4 irst responded to the early December 1988, when the face was
onse was noted in the piernometers. The water levels in ace approached. No other surface or subsurface move-
e face advanced to within 437 feet, separations of 0.2 foot by the sondex. The inclinometer and the TDR cables also
hearing and extension sf the bedrock. The inclinome- ter documented some shear zones at 195,260, 530, and 590 feet. The location of these disrup- tions occurred at interfaces between strong and weak lithologic units.
When the mine face was within 50 feet, the centerline TDR cable broke at 117 feet, the top of the Mt. Carmel Sandstone unit. The bottom two-thirds of the inclinometerlsondex assembly was lost at this time. The location of the inelinorneterlsondex break corresponds to a shale with medium- angled slickensides.
When the face was past the instruments, definite shear planes as well as extensional features could be defined. In particular, the TDR cables and the inclinometer defined shear planes at 51, 11 3, 150, and 260 feet. These locations were associated with some high-angled joints or litho- logic interfaces. Bedding separations defined by extension in the sondex and TDR cable were at 46, 138, and 184 feet in lithologic interfaces or slickensided joints. The postsubsidence core log- ging complemented the readings of the TDR cables and inclinometerlsondex instruments; water circulation was lost and drill bits were dropped at the defined shear planes and bedding separa-
shear plane at 11 2 feet was defined with the downhole camera. The camera was unable to pass this constricted area. Piernometer obstructions were also prevalent in the shear plane located at 51 feet.
Surface and subsurface monitoring of two adjacent longwall panels allowed the study of the effects of planned subsidence on the overburden. The following are some of the more important findings from this study.
1) At this site, 90% of the subsidence occurred within the first 3 months of undermining. During this period, the ratio of subsidence to mined-out height was 63%. Residual subsidence at this longwall site continued for as much as 3 years, probably because of the closure of fractures developed

1 Sequence of subsurface events monitored over panel 4.
Face Evidence1 Complementary Date advance Instrument depth (ft) Location of movement instrument
(ft)
sondex
TDR-edge
inclinometer
TDR- centerline
sondexl inclinometer
TDR- centerline
sondex
inclinometer
TDR-edge
inclinometer
tensile146
shear1262
shear11 75
shear1260
shear1530
shear1590
breaW1117
bottom1423
shear151
shear11 I 3
tensile146
tensile11 84
bottom1 258
bottom/258
shear11 11
tensile and breaW138
shear150
shear11 50
above calcareous shale
between claystone and coal
within interlaminated siltstone
below a thin coal; shale has highly angled joints
siltstone
slickensided claystone
top of Mt. Carmel Sandstone
shale, med. angled slickensides
shale, just below calcareous zone
sandstone, shale parting
just above calcareous shale
siltstone interbedded with shale laminae
shale, high angled joints
shale, high angled joints
Wlt. Carmel Sandstone
Mt. Carmel Sandstone interface where slightly calcareous
7-in. displacement at base of black fissile shale
>7-in. displacement in Mt. Carmel Sandstone and interlaminated siltstone
see inclinometer on 2/7 and TDR-centerline on 2/10
see inclinometer and sondex on 2/10 and inclinometer on 2/7
see TDR-edge on 2/2 and sondex 2/10
see sondex on 1/25 and inclinometer on 2/14
see TDR-edge on 2/13
see inclinometer 211 4
see TDR-edge on 212
see TDR-edge on 212
see TDR-centerline on 2/9
see sondex 1 /25/89, TDR-centerline on 2/10
during the collapse of overburden. The long-term subsidence measured over panel 3 increased the ratio of subsidence to mined-out height to 70%.
2) The maximum tensile strain calculated was 0.03; this strain occurred 125 feet inside the panel edge (distanceldepth ratio of 0.172). The tensile zone on the north side of panel 4 was approxi- mately 11 2.5 feet wide for this "critical" panel. These static subsidence characteristics are within the range of values previously reported for the Illinois Basin (Bauer and Hunt 1982).
3) The tilt parallel to the direction of mining increased with subsidence until the inflection point was reached, and then it decreased as subsidence continued to increase. The north-south pegs did not vary as much, although there was a slight change in the final tilt. The maximum tilt of

1.39" is comparable with that measured at another Illinois site, where tilt was measured directly on a foundation (Triplett et al. 1992). Tilt and curvature may be calculated using tiltplates or sur- vey monuments; either method gives approximately the same results.
were associated with increases in fracture frequency in the ctivities increased about two to three orders of magnitude
for the shale and one order of magnitude for the Mt. Carmel Sandstone.
2) Fracturing within overburden resulte ecrease in shear wave velocity by as much as 18%; more often, it
y, location in the subsi
weak, previously fractured layers, as shown in cores retrieved before instrument installation. Tension failures were generally correlated with interfaces between strong and weak lithologic layers, where bedding separations are more likely to occur.
ress upward through the overburden as active mine faces The cable at the centerline of a longwall panel failed mostly
xperienced multiple shear failures.
3) The sondex re nes of bedrock separations approached, vert occurred near the top 50 fe the longwall face proximately 100 feet thick began to separate.
4) The inclinometer response h lped to identify shear zones. lthough a few shear zones in the Iso be identified by the TDR cables, the use of such a deep inclinometer because the bottom reference was lost, and large shearing prevented elow 245 feet.
1) Drift (shallow) water levels showed no appreciable change during mining. Changes in water level were more a function of seasonal effects.
edrock water levels as the mine face approached, reached maximum lows when tensile strains (as determined on the surface) passed, showed a temporary recovery spike as the maximum compressive strain passed, and then steadily recovered over a period of 3 months until passage of the mine face o he adjacent panel. Bedrock water levels recovered within 2 to 3 months of being undermin This response may be site-specific because of the lateral extent and thickness of the aquifer monitored (Mt. Carmel Sandstone).
3) Aquifer characteristics such as hydraulic conductivity and storativity were improved; this improvement is attributed to mining-induced fracturing in the overburden. The hydraulic conductiv- ity in the sandstone was increased by an order of magnitude.
We offer the following recommendations for monitoring and instrumentation.
1) The TDR should be monitored frequently during periods of active subsidence. An intense moni- toring schedule will enable the calculation of the rate of shear and completely document progres- sive failure in the overburden. A minimum frequency of monitoring of three readings per day is suggested. The best method would be to develop an automatic and/or telecommunicated data acquisition system that would permit continuous monitoring.
2) The total station was sensitive to ground movements during surveying; therefore, rapid surveys were required in the influenced area. If the total station instrument was set up in the influenced area and the surveying was delayed, enough subsidence movement could take the total station

instrument off level. The elevation of all monuments should be determined with a level rather than with the total station. The level is a more precise instrument in measuring elevation changes. The total station may still be used to determine coordinates with good accuracy.
3) Gathering data from an inclinometerlsondew assembly of such great lengths as was used in this setting can be time consuming. Although an automatic readout unit and a powered reel for lowering the inclinometer were used, it took 8 to 10 hours to read the inclinometer. In addition, as the panel face approached, the inclinometerlsondex assembly became inoperative for depths exceeding 250 feet because large shear and tensile displacements occurred. An inclinometer length of about one-third of the overburden thickness would have sufficed to determine the shear planes developed with undermining. Because the entire inclinometer casing was installed within the overburden where ground movements are induced by mining, a top reference must be selected. By using the top as a fixed reference, cumulative displacements can be calculated down to the bottom of the casing. Coordinates of the top of the casing need to be taken with the total station every time the inclinometer is read. Cumulative displacements at the top of the casing can be com- puted by comparing these coordinates to the initial coordinates determined before mining. Just as important as a fixed reference are (1) the direction of the inclinometer grooves, which should be aligned parallel and perpendicular to the mining direction, and (2) the possibility of the inclinome- ter casing spiraling because of its great length and the temperaturelseason of its installation.
This report was prepared by the Engineering Geology Section of the lllinois State Geological Sur- vey under USBM Cooperative Agr ment CO267001. The Cooperative greement was initiated under the Illinois Mine Subsidenc esearch Program. It was administe d under the technical direction of the USBM Twin Citie search Center; Larry Powell acted as Technical Project Offi- cer. Kent Charles and Jose Martinez were the contract administrators for the USBM. This report is a summary of the work completed as part his contract during the period October 1, 1986, to September 3Q, 1993, and submitted to the U M in January 1994.
The authors acknowledge the work of David F. rutcher, Joseph T. Kelleher, and Christine E. Ovanic for their assistance in the field; Billy .Trent assisted with manuscript preparation. The authors would also like to thank the landowners (Ernie Martin, , and James Wil- son) and the mining r their assistance and coopera Montelle, as former Director of the IMSR in securing this research site.
In addition to funding from the US also received funding from the Illinois Coal oard, under the administration of the Illinois Department of nergy and Natural
Resources-Office of Coal Development and Marketing.
vailable upon request as
dards, Section 4 Construe-
Profile, strain and time cha of subsidence from coal , editor, Proceedings of the on Surface Subsidence
Due to Underground Mining: Morgantown, WV, p. 207-218.
aris, 1982, Geologic Investigation of Roof and Floor Strata: Longwall Demonstration, Old Ben Mine #24: Final Technical Report, Part 1 : lllinois State Geological Survey, ContractIGrant Report 1982-2, 49 p.
auer, R.A., C.H. Dowding, D.J. Van Su, and K. B'Connor, 1991, Application f Time Domain Reflectometry to S onitoring: Final Report to Off ice of Surface ining, 48 p.; NTlS No. PB91-228411.

., and D.J. Van Roo really measuring ne subsidence?, in orkshop on Surface
Subsidence due to Under
Booth, C.J., 1986, Strata-movement concepts and the hydrogeological impact of underground coal mining: Ground Water, v. 2 , no. 4, p. 507-515.
Booth, C.J., 1992, Hydrogeologic impacts of underground (longwall) mining in the Illinois S.S. Peng, editor, orkshop on Surface Subsidence due to ground Mining: Mor
in C.B. Elifrits, editor, Mine Subsidence-Prediction and Csntrol- Held in Conjunction with the gists, 2-3 October 1990, Pitt
NM.
DiMichele, W.A., and P.J. DeMaris, 1987, Structure and dynamics of a Pennsylvanian-Age Lepi- dodendron forest-Colonizers of a disturbed swamp habitat in Herrin (No. 6) Coal of Illinois: Palaios, v. 2, 1987, p. 146-1 57.
Dowding, C.H., M.B. Su, and K. O'Connor, 1988, Principles of time domain reflectometry applied to measurement of rock mass deformation: International Journal of Rock Mechanics and Min- ing Sciences & Geomechanics bstracts, v. 25, no. 5, p. 287-297.
Dowding, C.H., M.B. Su, and K. O'Connor, 1989, Measurement of rock mass deformation with grouted coaxial antenna cables: Rock Mechanics and Rock Engineering, v. 22, no. 1, p. 1-23.

Duigon, M.T., and M.J. Smigaj, 1985, First eport on the Hydrologic Effects of Underground Coal ining in Southern Garrett County, Maryland: Report of Investigations No. 41, Maryland Geo-
logical Survey, 99 p.
Federal Geodetic Control Committee, 1984, Standards and Specifications for Geodetic Control Networks: Rockville, MD, 34 p.
Forster, A, and D.M. McCann, 1 979, Use of geophysical logging techniques in the determination of in-situ geotechnical parameters: Transactions of the 6th European Symposium of SPWLA, Paper G, 19 p.
Freeze, R.A., and J.A. Cherry, 1979, Groundwater: Prentice-Hall, Englewood Cliffs, NJ, 604 p.
Garritty, P., 1982, Water percolation into fully caved longwall faces, in Proceedings of the Sympo- sium on Strata Mechanics, Mewcastle-upon-Tyne: Developments in Geotechnical Engineer- ing, v. 32, p. 25-29.
GeoTechnical Graphics System, 1991, Software (version 3.1): GeoTechnical Graphics System,
illiamson, 1992, Geology a y of the Western Kentucky Coal Field: Kentucky Geological Sulvey Series 11,
Horberg, C.L., 1 950, edrock Topography of Illinois: Illinois State Geological Survey Bulletin 73, Ill p.
ater Survey, 1934, Unpublished field survey of water well information gathered under Civil Works dministration support by the Illinois State Water Survey.
International Society for hods: J.A. Franklin, es & Geomechanics
, v. 22, no. 2, p. 51-60.
id: Intrusion-Prepakt, leveland, OW, 4 p.
monstration of Longwall Mining-Final eport: U.S. Bureau of Mines, J0333949,105 p.
ault System in Southern Illinois: lllinois State
orberg, 1948, Physiographic Divisions of Illinois: lllinois vestigations 129, 19 p.
overed by the lllinoian Driftsheet in Southern Illinois: lllin eological Survey, Report of Investigations 19, 57 p.
rutcher, 1 990, Effects of longwall logy in Illinois, in C.D. Elifrits, edi-
nal Symposium Held in Conjunction ering Geologists, 2-3 October
auer, "192, Long-term subsidence monitoring in S.S. Peng, edi r, Proceedings of the Third
Workshop on Surface erground Mining: organtown, WV, p. 31 1-31 6.
Miller, J.D., 1996, eologic characterization of a heterogenous sandstone aquifer overlying a high extraction longwall coal mine: MS. Thesis, Northern lllinois University, DeKalb, 205 p.
Ming-Gao, C., 1982, study of the behavior of overlying strata in longwall mining and its applica- tion to strata control, in I.W. Farmer, editor, Proceedings of the Symposium on Strata Mechan- ics: Elsevier, New York, p. 13-17.
New South Wales Coal Association, l 989, Mine Su Community Information Booklet: Jointly published by the New South Wales Coal , Department of Minerals and Energy, and the ine Subsidence Board of Australia, September 1989, 32 p.

Nieto, AS., 1979, Evaluation of damage potential to earth dam by subsurface coal mining at Rend Lake, Illinois, in Ohio River Valley Soils Seminar, Geotechnics of Mining: Lexington, KY, Octo- ber 5, p. 9-1 8.
Owili-Eger, AS., 1983, Geohydrologic and Hydrogeochemical Impacts of Longwall Coal Mining on Local Aquifers: Society of ining Engineers of 81 E Fall Meeting, Salt Lake City, UT, Pre- print No. 83-376, 16 p.
Pauvlik, C.M., and S.P. Esling, 1987, The effects of longwall mining subsidence on the ground- water conditions of a shallow, unconfined aquitard in Southern Illinois, in Proceedings, National Symposium on ining, Hydrology, Sedimentology, and Reclamation: University of Kentucky, Lexington, December 7-1 1, p. 189-1 95.
Pattee, T., 1994, Long-term hydrogeologic impact of longwall subsidence on a shallow bedrock aquifer in Illinois: M.S. Thesi orthern Illinois Universi
eng, S.S., and H.S. Chian
Powell, L.R., T.L. Triplett, and R.E. Yarbrough, 1986, Measurement and analysis of foundation tilt resulting from mine subsidence in Southern Illinois, in Proceedings of the 2nd Workshop on Surface Subsidence Due to Underground Mining: Morgantown, WV, p. 142-1 52.
Groundwater Geology in Southern Illinois- Prelimina~y Geologic Report: eological Survey Circular 21 2, 25 p.
Sloan, P., and R.C. case study of groundwater impact caused by underground mining, in D.H. Graves, editor, Proceedings, 1984 Symposium on Surface Mining, Hydrology, Sedimentology, and Reclamation, December 2-7, 1984: University of Kentucky, Lexington, p. 1 13-1 20.
Soil Conservation Service of the US. Department of Agriculture, 1988, Soil Survey of Perry County, Illinois: September, 172 p. plus 66 plates.
Spande, E.D., 1 990, Effects of Ion wall-induced subsidence on hydraulic properties at a site in Jefferson County, Illinois: M.S. Thesis, Northern Illinois University, De Kalb, 245 p.
Tandanand, S., and T. Triplett, 1987, New approach for determining ground tilt and strain due to subsidence, in Proceedings, National Symposium on Mining, Hydrology, Sedimentology, and Reclamation: University of Kentucky, p. 21 7-221.
Triplett, T., G. Lin, W. Kane, and R.M. Bennett, 1992, Prediction of coal mine subsidence and implications for structural damage, in S.S. Peng, editor, Proceedings of the Third Workshop on Surface Subsidence Due to Underground Mining: Morgantown, WV, p. 76-82.
Van Roosendaal, D.J., D.F. Brutcher, B.B. Mehnert, J.T. Kelleher, and R.A. Bauer, 1990, Overbur- den deformation and hydrologic changes due to longwall mine subsidence in Illinois, in Y.P. Chugh, editor, Proceedings of the 3rd Conference on Ground Control Problems in the Illinois Coal Basin: Southern Illinois University at Carbondale, p. 73-82.
Van Roosendaal, D.J., B.B. Mehnert, J.T. Kelleher, and C.E. Ovanic, 1991, Three dimensional ground movements associated with longwall mine subsidence in Illinois, in Proceedings, Association of Engineering Geologists 34th Annual Meeting: Chicago, IL, p. 81 5-826.
Verruijt, A,, 1969, Flow through porous media, in R.J.M. Dewiest, editor, Elastic Storage of Aqui- fers: Academic Press, New York, p. 331-376.
Walker, J.S., 1988, Case Study of the Effects of Longwall Mining lnduced Subsidence on Shallow Ground Water Sources in the Northern Appalachian Coalfield: U.S. Bureau of Mines RI 91 98, 17 p.
Whittaker, B.N., and D.J. Reddish, 1989, Subsidence: Occurrence, Prediction and Control: Devel- opments in Geotechnical Engineering, 56: Elsevier, New York, 528 p.
Whitworth, K.R., 1982, lnduced changes in permeability of coal measure strata as an indicator of the mechanics of rock deformation above a longwall coal face, in I.W. Farmer, editor, Pro- ceedings of the Symposium on Strata Mechanics: Elsevier, New York, p. 18-24.