Embed Size (px)
Citation preview

Image-Analysis-Based Method for 3D Crystal MorphologyMeasurement and Polymorph Identification Using ConfocalMicroscopyMeenesh R. Singh,† Jayanta Chakraborty,‡ Nandkishor Nere,§ Hsien-Hsin Tung,|| Shailendra Bordawekar,||
and Doraiswami Ramkrishna*,†
†Chemical Engineering Department, Purdue University, 480 Stadium Mall Drive, West Lafayette, Indiana 47907, United States‡Chemical Engineering Department, Indian Institute of Technology Kharagpur, Kharagpur, West Bengal 721302, India§Process Engineering & Sciences, Adiya Birla Science & Technology Company Ltd., Plot No. 1 & 1-A/1, MIDC Taloja, Tal. Panvel,Dist. Raigad, Maharashtra 410208, India||Process Engineering, Global Pharmaceutical R&D, Abbott Laboratories, 1401 Sheridan Road, North Chicago, Illinois 60064, United States
ABSTRACT: A new technique for the measurement of 3D crystal morphology and identification of its polymorph using tomo-graphic images is proposed. Confocal microscopy is used for the first time to obtain tomographic images of crystals that are coatedwith a suitable fluorescent dye. A convex polyhedron is fitted through a stack of tomographic images of a crystal to obtain thenormal vectors of each facet and their corresponding perpendicular distances from the center of the crystal. The angular patterns aregenerated from the measured normal vectors and are matched with the master angular patterns of each polymorph. It is shown thatthe matching of the angular patterns is unique and provides a simpler way to identify polymorphs. An image-analysis program thatcan be integrated with conventional confocal microscopes was created to sequentially perform image processing, morphologymeasurement, and polymorph detection. This program was used to measure morphologies and identify polymorphs of 2D and 3Dacetaminophen crystals. Detailed directions are provided to enable the application of the methodology without the need for special-purpose software. The image-analysis program is also suitable for repeated measurements to produce morphology distributions.This technique will provide an effective platform for measuring the 3D shapes of materials of interest to many applications.
1. INTRODUCTIONMeasurement of crystal morphology is of high interest in currentresearch on crystalline material for diverse industrial applications.Widely used techniques to measure crystal morphology are basedon microscopy and digital video imaging. Such techniques relyon an appropriate method of image acquisition followed by asuitable image-analysis scheme to extract morphological details.Researchers have used stereoscopic imaging and model-basedshape recognition to measure simple crystal shapes such as parallele-pipeds and cubes. However, a technique for the comprehensivemeasurement of complex crystal shapes does not exist. We pre-sent herein evidence of a new, strikingly simple, and inexpensivemethod for identifying complex crystal shapes and polymorphsthrough computer-aided analysis of tomographic images pro-duced with a confocal microscope.Real-time visualization of complex processes offers the best
prospects for understanding their intricate behavior by revealingessential features. A broad class of such processes associated withthe pharmaceutical industry includes crystallization, milling, and
granulation, which are inherently complex and difficult to control.Moreover, the successful design and implementation of controlstrategies for such processes depend strongly on robust andefficient techniques to monitor their behavior. In crystallization,the simultaneous occurrence of particulate events such as nuclea-tion, breakage, and aggregation provides for an even more com-plex setting to monitor and control the properties of crystallineproducts. Consequently, the application of multiple sensors fordynamic measurements of crystal properties such as size, shape,and polymorph has evolved in industrial crystallization.The most commonly used instruments for online measure-
ment of particle size distributions are based on either light scatteringor imaging, for example, focused-beam reflectance measurement(FBRM) and particle vision measurement (PVM) probes.Raman-scattering- and X-ray-diffraction-based detectors are
Received: April 20, 2012Revised: May 25, 2012Published: May 28, 2012
Article
pubs.acs.org/crystal
© 2012 American Chemical Society 3735 dx.doi.org/10.1021/cg300547w | Cryst. Growth Des. 2012, 12, 3735−3748
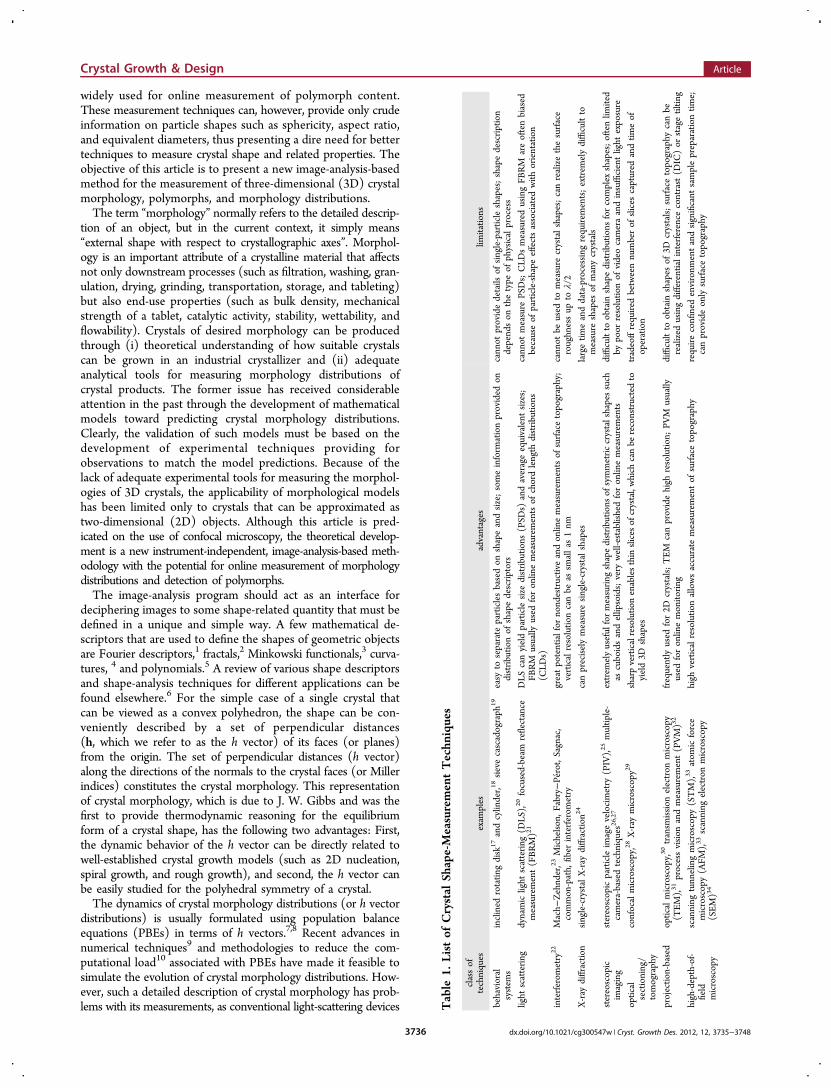
widely used for online measurement of polymorph content.These measurement techniques can, however, provide only crudeinformation on particle shapes such as sphericity, aspect ratio,and equivalent diameters, thus presenting a dire need for bettertechniques to measure crystal shape and related properties. Theobjective of this article is to present a new image-analysis-basedmethod for the measurement of three-dimensional (3D) crystalmorphology, polymorphs, and morphology distributions.The term “morphology” normally refers to the detailed descrip-
tion of an object, but in the current context, it simply means“external shape with respect to crystallographic axes”. Morphol-ogy is an important attribute of a crystalline material that affectsnot only downstream processes (such as filtration, washing, gran-ulation, drying, grinding, transportation, storage, and tableting)but also end-use properties (such as bulk density, mechanicalstrength of a tablet, catalytic activity, stability, wettability, andflowability). Crystals of desired morphology can be producedthrough (i) theoretical understanding of how suitable crystalscan be grown in an industrial crystallizer and (ii) adequateanalytical tools for measuring morphology distributions ofcrystal products. The former issue has received considerableattention in the past through the development of mathematicalmodels toward predicting crystal morphology distributions.Clearly, the validation of such models must be based on thedevelopment of experimental techniques providing forobservations to match the model predictions. Because of thelack of adequate experimental tools for measuring the morphol-ogies of 3D crystals, the applicability of morphological modelshas been limited only to crystals that can be approximated astwo-dimensional (2D) objects. Although this article is pred-icated on the use of confocal microscopy, the theoretical develop-ment is a new instrument-independent, image-analysis-based meth-odology with the potential for online measurement of morphologydistributions and detection of polymorphs.The image-analysis program should act as an interface for
deciphering images to some shape-related quantity that must bedefined in a unique and simple way. A few mathematical de-scriptors that are used to define the shapes of geometric objectsare Fourier descriptors,1 fractals,2 Minkowski functionals,3 curva-tures, 4 and polynomials.5 A review of various shape descriptorsand shape-analysis techniques for different applications can befound elsewhere.6 For the simple case of a single crystal thatcan be viewed as a convex polyhedron, the shape can be con-veniently described by a set of perpendicular distances(h, which we refer to as the h vector) of its faces (or planes)from the origin. The set of perpendicular distances (h vector)along the directions of the normals to the crystal faces (or Millerindices) constitutes the crystal morphology. This representationof crystal morphology, which is due to J. W. Gibbs and was thefirst to provide thermodynamic reasoning for the equilibriumform of a crystal shape, has the following two advantages: First,the dynamic behavior of the h vector can be directly related towell-established crystal growth models (such as 2D nucleation,spiral growth, and rough growth), and second, the h vector canbe easily studied for the polyhedral symmetry of a crystal.The dynamics of crystal morphology distributions (or h vector
distributions) is usually formulated using population balanceequations (PBEs) in terms of h vectors.7,8 Recent advances innumerical techniques9 and methodologies to reduce the com-putational load10 associated with PBEs have made it feasible tosimulate the evolution of crystal morphology distributions. How-ever, such a detailed description of crystal morphology has prob-lems with its measurements, as conventional light-scattering devices Table
1.Listof
Crystal
Shape-MeasurementTechn
iques
classof
techniques
exam
ples
advantages
limitatio
ns
behavioral
system
sinclined
rotatin
gdisk
17andcylinder,1
8sievecascadograph
19easy
toseparate
particlesbasedon
shapeandsize;someinform
ationprovided
ondistrib
utionof
shapedescrip
tors
cannot
providedetails
ofsingle-particleshapes;shapedescrip
tion
dependson
thetype
ofphysicalprocess
light
scatterin
gdynamiclight
scatterin
g(D
LS),20
focused-beam
reflectance
measurement(FBRM)21
DLS
canyieldparticlesize
distrib
utions
(PSD
s)andaverageequivalent
sizes;
FBRM
usually
used
foronlinemeasurementsof
chordlength
distrib
utions
(CLD
s)
cannot
measure
PSDs;CLD
smeasuredusingFB
RM
areoftenbiased
becauseof
particle-shape
effectsassociated
with
orientation
interferom
etry
22Mach−
Zehnder,23
Michelson,F
abry−Perot,Sagnac,
common-path,
fiberinterferom
etry
greatpotentialfor
nondestructiveandonlinemeasurementsof
surfacetopography;
verticalresolutio
ncanbe
assm
allas
1nm
cannot
beused
tomeasure
crystalshapes;canrealizethesurface
roughnessup
toλ/2
X-ray
diffraction
single-crystalX-ray
diffraction2
4canpreciselymeasure
single-crystalshapes
largetim
eanddata-processingrequirements;extrem
elydifficultto
measure
shapes
ofmanycrystals
stereoscopic
imaging
stereoscopicparticleimagevelocimetry
(PIV),25
multip
le-
camera-basedtechniques
26,27
extrem
elyusefulformeasurin
gshapedistrib
utions
ofsymmetric
crystalshapessuch
ascuboidsandellipsoids;very
well-establishedforonlinemeasurements
difficultto
obtain
shapedistrib
utions
forcomplex
shapes;oftenlim
ited
bypoor
resolutio
nof
videocameraandinsufficientlight
exposure
optical
sectioning/
tomography
confocalmicroscopy,28
X-ray
microscopy2
9sharpverticalresolutio
nenablesthinslices
ofcrystal,which
canbe
reconstructedto
yield3D
shapes
tradeoffrequiredbetweennumberof
slices
captured
andtim
eof
operation
projectio
n-based
opticalmicroscopy,30
transm
ission
electron
microscopy
(TEM
),31
processvision
andmeasurement(PVM)3
2frequentlyused
for2D
crystals;TEM
canprovidehigh
resolutio
n;PV
Musually
used
foronlinemonito
ring
difficultto
obtain
shapes
of3D
crystals;surfacetopography
canbe
realized
usingdifferentialinterferencecontrast(D
IC)or
stagetiltin
g
high-depth-of-
field
microscopy
scanning
tunnelingmicroscopy(STM),33
atom
icforce
microscopy(AFM
),33
scanning
electron
microscopy
(SEM
)34
high
verticalresolutio
nallowsaccurate
measurementof
surfacetopography
require
confinedenvironm
entandsignificant
samplepreparationtim
e;canprovideonlysurfacetopography
Crystal Growth & Design Article
dx.doi.org/10.1021/cg300547w | Cryst. Growth Des. 2012, 12, 3735−37483736
can yield only equivalent sizes but not shapes (or h vectors).Because of the limitations of the many other techniques listedin Table 1, we envisage the use of confocal microscopy orrelated techniques (such as multiphoton microscopy and X-raymicroscopy) to take the cross-sectional images of crystals andprocess them using our image-analysis technique to obtain crys-tal morphologies, polymorphs, and morphology distributions.The proposed technique relies on extracting the most informa-tion from the crystal images that can be translated to any shapedescriptors used industry-wide. It further has the potential foronline measurements, when combined with an appropriatesetup for continuous feeding of dye-coated crystals to a micro-scope and automatic adjustment of the focus.11−13
The organization of this article is as follows: Section 2discusses various techniques that have been used in the past forcrystal morphology measurement and polymorph detection.Section 3 describes our image-analysis methodology for themeasurement of crystal morphology with an algorithm for Millerindex identification and polymorph detection. Section 4 discussesthe methods used to prepare and image samples. Section 5 demon-strates the image-analysis technique using in silico generatedimages and real images of acetaminophen obtained from a con-focal microscope. Finally, some conclusions are presented insection 6 about the methodology, outlining the future scope ofthe proposed technique for online measurements.
2. PREVIOUS WORKShape-measurement techniques can be broadly classified asdirect or indirect methods. Direct methods encompass allimaging techniques that are based on either microscopy (using astylus or electromagnetic radiation) or interferometry. Thesetechniques usually employ some image-analysis software thatreads, analyzes, and quantifies images. The high spatial resolu-tion, accuracy, and robustness of such optical techniques haveconfirmed their worth for online measurement of surface topo-graphy14 and tracking of particle motion.15 An overview of methodsused to measure three-dimensional surface topography can befound elsewhere.16 Conversely, indirect methods make use ofbehavioral systems to study the effect of shape on particle dynamicsand extract shape descriptors by solving the inverse problem.A brief list of the most commonly used techniques to mea-
sure particle shape or shape distribution is presented in Table 1,although this list is not intended to be exhaustive. The remainderof this section preovides a short review of the development ofshape-measurement techniques in crystal research.2.1. Behavioral Systems and Shape Descriptors. The
measurement of crystal morphology is of paramount impor-tance for the design and implementation of strategies for thecontrolled production of crystalline materials. A primitive approachin the past to inferring crystal morphology was to examine somespecific shape-dependent behavior. For example, the rollingtendency of powder in an inclined rotating disk or cylinderand the residence time distribution in sieve cascadograph wereused for extracting shape descriptors.17−19 Shape descriptorsare scalar quantities that are sensitive to the crystal shape.Although such shape descriptors are only indicators and not afull description of crystal shapes, they have been used in oneform or another for controlling product quality in industrialpractice. Consequently, shape descriptors have gained tremen-dous applications in manufacturing industries following theadvent of imaging techniques for their direct measurement. Theselection of shape descriptors is critical, as the descriptors mustbe invariant to the orientation of the object.35 Shape descriptors
can be classified as macroshape and mesoshape descriptors basedon the details required for particle shape description. Macroshapedescriptors can be calculated from measurements made on particleimage (e.g., form factor, roundedness, aspect ratio, elongation),whereas the mesoshape descriptors are obtained from the com-parison of a real particle with some reference shape such as aconvex polygon.36 Also, shape-descriptor measurements arehighly sensitive to details of the image-acquisition proceduressuch as image magnification, lighting technique, and number ofparticles measured.37
2.2. Imaging Instruments: Inline, Online, and Offline.The rapid advancement in image-acquisition and -processingtechnologies has led to the possibility of real-time measurementsof morphology evolution in industrial crystallizers. Various inlineimaging probes are commercially available such as Particle Imag-ing System (PARIS) of DuPont, Particle Vision and Measure-ment (PVM) of Lasentec and Mettler Toledo Ltd., ProcessImage Analyzer (PIA) of MessTechnik Schwartz GmbH, and InSitu Particle Viewer (ISPV) of Perdix Analytical Systems.38
Endoscopy−stroboscopy imaging sensors such as ATMOSendoscopic systems represent some of the recent inline imaginginstruments (originally used for medical diagnosis) capable ofmonitoring the color, transparency, size, and shape of pharma-ceutical crystals.39 These invasive instruments are based onborescopes with a strobe light source and a video cameramounted on one end to capture images inside crystallizers.Although such imaging probes are flexible, fast, and robust, theyare prone to poor visibility arising from particle clogging andincreasing particle density inside the crystallizer. Particle cloggingof sensors can be avoided by using noninvasive schemes foronline measurement of crystal morphology. Examples of twosuch noninvasive schemes are the stroboscopic video imagingsystem of GlaxoSmithKline40 and hot-stage optical microscopy.27
The former takes online images from the exterior of a crystallizer,and the latter takes online images of crystals that are contin-uously supplied to the hot stage and recycled back to the cryst-allizer. Stroboscopic video imaging is also affected by backgroundnoise due to improper lighting, high particle density, and particlemotion effects. However, better images can be obtained usingoptical microscopy by adjusting light intensity, diluting particleslurries, and stopping slurry flow. The offline imaging techniquesreported in Table 1 such as stereoscopic video imaging,41 scann-ing electron microscopy (SEM),34 and atomic force microscopy(AFM)33 are also frequently used to analyze crystalline materialsobtained after drying samples taken from crystallizers. Otheroffline PAT imaging systems include Sysmex FPIA-3000, Pharma-Vision System (PVS), and Morphologi G3 of Malvern Instru-ments. Such in situ imaging techniques are mostly limited bytheir capability to capture two-dimensional images of crystals.Therefore, they are assisted with some image-analysis tools toapproximate three-dimensional features of crystals, as discussedlater. Some of the three-dimensional (3D) imaging techniquessuch as confocal, multiphoton, and X-ray microscopy are basedon the principles of tomography to take optical slices of a crystaland reconstruct its 3D shape using image analysis. Among thesetechniques, confocal microscopy has emerged as a powerfultool for the dynamic measurement of 3D structures of biolog-ical samples28 and solid surfaces.42 Some of the features thatmake it an attractive technique are high resolution of approxi-mately 200 nm and high scanning speed on the order of 1 s perimage, although these features might vary depending on thetype of sample. Nevertheless, it is a promising techniquefor dynamic measurements with the potential for online
Crystal Growth & Design Article
dx.doi.org/10.1021/cg300547w | Cryst. Growth Des. 2012, 12, 3735−37483737
adaptability.13 This article demonstrates the use of confocalmicroscopy to acquire 3D images of crystals that are furtherprocessed using a unique image-analysis algorithm presentedherein to obtain crystal morphologies and polymorphs.2.3. Image Processing and Analysis. Any imaging system
has three basic elements, namely, capture, curation, and anal-ysis. We previously discussed different techniques normallyused to capture images, which are further processed for shapemeasurements using an image-analysis program that performsthe other two elements (curation and analysis). Curation is apreliminary process of any image-analysis program that basicallyprepares images for the measurement of their features andperforms measurements. It has two major components: imageenhancement and image segmentation. Image enhancementinvolves techniques such as gray-level histogram modification,smoothing, and sharpening to improve the visual appearance ofan image for better machine interpretation, whereas imagesegmentation uses an appropriate thresholding algorithm suchas global thresholding, local binarization, and watershedtransforms to create a binary image (or to separate an objectfrom the background).43 A different class of image segmenta-tion technique, called multivariate image analysis, involves per-forming multiway principal component analysis to decomposehighly correlated data in images.39,44 After the curation of animage and its transformation to binary form have been completed,appropriate analysis can be performed for the measurement ofrelevant features. Some examples of basic analyses are measure-ments of length, width, circularity, convexity, and Ferret diameter.However, a few advanced analysis algorithms such as CameraModel45 and Model-Based Shape Recognition for Crystals(M-SHARC)46 have also been developed to identify the shapesof crystals. Such models are based on creating a library of 2Dprojection of crystal shapes at different orientations anddetermining crystal shape by identifying projected images fromthe library. Clearly, these models are questionable for the case ofasymmetric crystals with large numbers of faces, as the identificationof a unique crystal shape for some projected images is not assured.The main focus of this article is the development of an image-analysis program for tomographic images to derive completemorphological and polymorphic details for crystalline materials.
3. NEW TECHNIQUE FOR CRYSTAL MORPHOLOGYMEASUREMENT AND POLYMORPH DETECTION
The ability of crystallization processes to produce products ofdesired qualities relies on the availability of appropriate measure-ment and analysis tools. The rigor required in image analysismust be commensurate with the quality of images obtainedfrom the imaging instrument. An instrument producing imageswith poor resolution and/or significant background noise willincrease the image-processing time, which can be reduced oravoided by properly selecting/tuning imaging instruments toyield improved images. The image-analysis technique presentedherein takes tomographic images from a confocal microscopewith high resolution and low background noise, thus obviatingthe need for advanced image-processing techniques. Section 3.1discusses the algorithm for measuring 2D crystal shapes usingprojected images of crystals by fitting a convex polygon. Then,section 3.2 extends the same idea to measure the shape of a 3Dcrystal by fitting a convex polyhedron. Subsequently, section 3.3deals with the identification of the Miller indices of crystal facesand thereby deciphering the crystal's polymorph. The conversionof a measured shape quantity, h vector, to other easily measurablequantities such as sphericity, aspect ratio, anf equivalent diameters
is shown in section 3.4. The structure of the image-analysisprogram with different modules is described in section 3.5.
3.1. Measurement of 2D Crystal Morphology. Somecrystals have a tendency to attain a variety of 2D shapes, needleor platelike, under different operating conditions and are re-ferred to as 2D crystals because they are relatively small in atleast one direction. Examples of industrially grown 2D crystalswith applications in the pharmaceutical, semiconductor, andcatalyst industries are L-glutamic acid, succinic acid, hen-egg-white lysozyme, CdSe nanorods, and TiO nanosheets. It isessential to have appropriate tools to measure morphologydistributions, which, in this case, could be any one of theprojection-based techniques listed in Table 1, for the productionof crystals with shape-controlled properties. Projection-basedtechniques such as optical microscopy and video microscopy takeimages of crystal projections, recording their 2D shapes only withno information on thickness. Nevertheless, these techniquesprovide nearly complete shape descriptions, as the relative thick-ness is almost unchanged during the course of crystallization.The captured images of crystal projections are processed to re-move noise, enhance contrast, and prepare them for analysis.The typical outcome from image processing is binary (black-
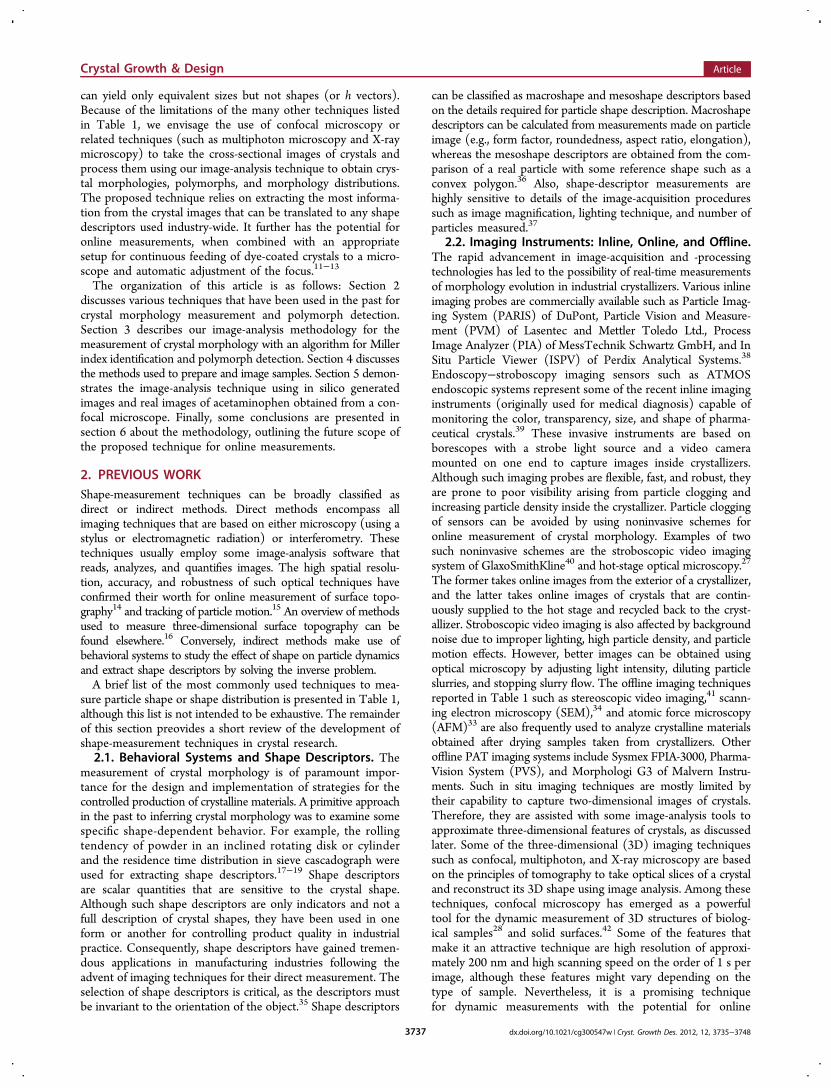
and-white) image that is further processed by an image-analysisalgorithm as shown in Figure 1 to obtain the h vector of any 2D
crystal. The following five steps are involved in the algorithmfor determining the shape of a 2D crystal.Step 1. The images are prepared for analysis by performing
some or all of the image-processing steps listed in section 2.3.The extent of processing required is inversely related to thequality of the images. Therefore, the time required in this stepcan be minimized by careful operation of the imaging instru-ments (for example, supplying sufficient light exposure, properlychoosing lens and focus). The preprocessed image is converted
Figure 1. Image algorithm to measure the shapes of 2D crystals withan illustrative treatment of an octagon.
Crystal Growth & Design Article
dx.doi.org/10.1021/cg300547w | Cryst. Growth Des. 2012, 12, 3735−37483738
to a binary form, and each crystal in the image is labeled tofacilitate identification and perform simultaneous analysis.Step 2. The usual binary representation of the image after
step 1 is such that crystals are colored black and background iswhite. The collection of black pixels at the interface of thecrystal and background forms a contour of the crystal. Theseboundary pixels can be easily identified using Matlab subroutineimcontour.Step 3. This part of the algorithm identifies those pixels of the
contour that are lying on a straight line. There are many ways offinding straight lines in intensity images; one popular approachis to group pixels corresponding to similar intensity gradients.47
Here, we use a relatively simple technique of finding pixels onstraight lines using a convex hull. Specifically, to obtain convexhulls, we used the Quickhull algorithm,48 which is available inMatlab as the subroutine convhulln and whose outputs are theindices of pixels comprising facets of the convex hull.Step 4. The straight lines are fit through the set of pixels
comprising facets of a crystal by linear regression. For example,step 4 in Figure 1 shows the fitting of eight straight lines pass-ing through each face of the octagon, which coincides with thesmallest convex region. The output from this step is a set oflinear equations of the form aix + biy = di, corresponding toeach face of the crystal, with respect to some center.Step 5. The h vector can be directly obtained from the set of
linear equations by calculating the perpendicular distances (h) ofthe straight lines from some appropriate point inside the crystal.This algorithm works very well with 2D faceted crystals, and
its performance on real crystals is demonstrated in section 5.1.Although this approach can be extended to nonfaceted crystals(for example, by fitting analytic functions, such as Fourier seriesor polynomial functions, to boundary pixels), we restrict con-sideration to only faceted crystals because of the complexityassociated with modeling the shape evolution of nonfacetedcrystals. Consequently, the proposed algorithm is expected tobe useful for validating such models and can also be used inde-pendently in different applications to measure the shapes of 2Dcrystals.3.2. Measurement of 3D Crystal Morphology. Crystals
grown in crystallizers can take varieties of shapes, ranging fromneedlelike to more complex polyhedral shapes, based on oper-ating conditions and material properties. The measurement ofcrystal shapes is of critical importance for the controlled syn-thesis of crystalline products with desired physical attributes. Asdiscussed in section 2, many light-scattering- and imaging-basedtechniques can be used to infer crystal shapes in some approximateways. Although some techniques such as single-crystal X-raydiffraction, X-ray tomography, confocal microscopy, and multi-photon microscopy can capture shapes of crystals more preciselythan others, their applications in quantifying shape distributionsare limited because of the unavailability of an appropriateframework that can read images and quantify shape distributions.This section presents a new methodology for obtaining the com-plete shape description (in terms of the h vector and correspondingnormal vectors) from tomographic images of a faceted crystal.Tomographic images are actually a set of cross-sectional
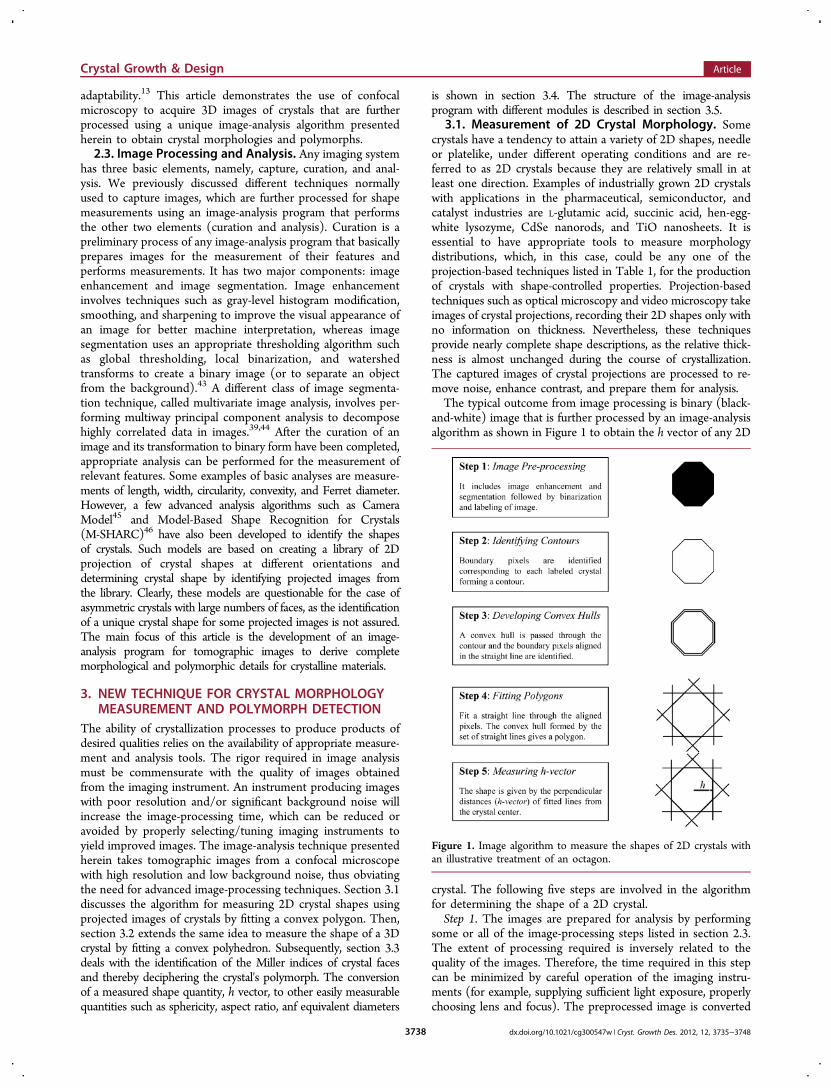
images of crystals that can be obtained from instruments suchas confocal microscopes. These images are processed with amethod similar to that described earlier for 2D crystals andconverted into binary images for further analysis using thealgorithm shown in Figure 2, to obtain the h vector and normalvectors for any 3D crystal. The image-analysis algorithm for 3Dcrystals is the same as for 2D crystals, except for the stack of
images being processed and analyzed together to yield the 3Dshape.Step 1. All images in a stack are preprocessed and binarized.
The information on the distance between two images in a givenstack is known from the imaging instrument and is kept fixedthroughout the analysis.Step 2. The boundary pixels for all images in a stack are
identified using the Matlab subroutine imcontour on eachimage in the stack. The resulting form is the set of level curvesof the crystal.Step 3. The set of boundary pixels corresponding to the
entire stack is processed through the Matlab subroutineconvhulln to yield a convex set of triangular faces (see Figure2, step 3) covering all boundary pixels. It might be possible toobtain multiple triangular faces with nearly same orientations.Therefore, the triangular faces having the same orientations aregrouped together, with each group forming a crystal face with adistinct orientation.Step 4. The boundary pixels lying closest to a group of
triangular faces (representing a facet of the crystal with a uniqueorientation) are identified, and the equation of a plane is fittedthrough these boundary pixels by linear regression.Step 5. The set of equations corresponding to each face of
the crystal can be used to calculate perpendicular distances(h vector) of the crystal faces from some center inside thecrystal. The final outputs from this image-analysis programare the h vector and the corresponding normal vectors of thecrystal faces, from which the crystal shape can be readilyconstructed.It is worth noticing that the choice of center governs the
number of distinct h values in the h vector that eventuallyreflects the symmetry of the crystal. This issue is addressedin the next section, and a method for deriving the center
Figure 2. Image algorithm to measure the shapes of 3D crystals withan illustrative treatment of an icosahexahedron.
Crystal Growth & Design Article
dx.doi.org/10.1021/cg300547w | Cryst. Growth Des. 2012, 12, 3735−37483739
corresponding to the maximum symmetry of the crystal fromthe crystal morphology is presented.3.3. Crystal Face Recognition and Polymorph
Detection. The shape of a crystal alone, without any referenceto the atomic structure on crystal faces, is meaningless becausethe surface energetics and related properties cannot be defineduniquely. The shape-related properties can be determineduniquely only if the shape is defined with respect to crystallo-graphic coordinates. The crystallographic coordinates aredefined based on the shape of a unit cell of a crystal. The dimen-sions of a unit cell are known as lattice parameters and comprisethe angles made by crystallographic axes (α, β, γ) and the lengthsof the sides of a unit cell (a, b, c). Hence, a crystal can be viewedas an object with repeating arrangement of unit cells alongcrystallographic axes.The shape of crystals relative to the crystallographic co-
ordinates is referred to here as the morphology, whereas thepolymorphs are characterized by the lattice parameters. Toclarify further, crystals with identical polymorphs can havedifferent growth morphologies, whereas the converse is nottrue. Measurements of crystal morphologies and polymorphsare of critical importance in assessing the quality of crystallineproducts. Different techniques can be used to measure shapesand polymorphs of crystals; however, there are no suchtechniques, except for X-ray microscopy and single-crystal X-ray diffraction (XRD), that can measure the morphologies ofcrystals. Single-crystal XRD can be used to determine the mor-phology of a single crystal, but it is time-consuming andimpractical for use for a population of crystals.The identification of crystal morphology requires the mea-
surement of h vector and the assignment of Miller indices tothe corresponding faces. For any instrument to be capable ofmeasuring crystal morphology, it must be able to measure 3Dshapes and detect crystallographic planes on crystal surfaces.We propose a simple, effective, and noninvasive method fordetecting crystallographic planes from only the shape measure-ments.A perfect crystal with a regular three-dimensional arrange-
ment of atoms has constant interfacial angles irrespective of itsshape. This was discovered by Nicolas Steno in 1669 and isknown as Steno’s law of constancy of interfacial angles: Theangles between corresponding faces on crystals are the same forall specimens of the same mineral. It follows from Steno’s lawthat all growth morphologies of crystalline materials with a fixedpolymorphic form have identical and unique patterns of inter-facial angles. Consequently, it can be stated that one polymorphdiffers from another by its interfacial angular patterns. Also, theinterfacial angular pattern made by a face (belonging to somecrystallographic family) with all other faces on a crystal is con-stant and unique for that family of faces. There exists a signa-ture angular pattern for each family of planes in a given polymorph,and the set of angular patterns corresponding to all families ofplanes is unique for a given polymorph.49
The determination of polymorphs and the Miller indices ofplanes requires the construction of master angular patterns forenergetically favorable faces that might appear during growth.Theoretically, a crystal has infinitely many planes, but only afew can appear during crystal growth. Bravais−Friedel−Donnay−Harker (BFDH) law is the basic way of selecting crystal that arelikely faces to appear. It states that the larger a face’s interplanarspacing (dhkl), the slower its growth, and the greater its size. Itaccounts for the internal structure and symmetry of the crystalbut not the attachment energy between atoms or molecules
(growth units). Subsequently, Bennema and co-workers extendedHartman−Perdok (HP) theory to determine energetically fa-vorable crystal faces. They proposed a methodology based oncrystal graphs (prepared by growth units connected with non-covalent bonds) and connected net theory to determine low-energy (favorable, F) faces with more than one connected net.The connected-net analysis reduces crystal faces to a limitednumber. Boerrigter et al.50 showed through connected-netanalysis that crystal faces of monoclinic paracetamol such as{001},{011},{110}, and {201} are energetically more favorableto appear, in agreement with the experimental morphologiesobserved by Ristic et al.51
Consider a crystal with n energetically favorable planes con-stituting f families. The total number of planes and the cor-responding normal vectors are written as
∑= =⋮=
⎡
⎣
⎢⎢⎢⎢⎢⎢
⎤
⎦
⎥⎥⎥⎥⎥⎥
n m N
n
n
n
,i
f
i
n
1
1T
2T
T(1)
where mi is the number of planes in the ith family and N is thematrix of normal vectors ni. The angular patterns θj made bythe jth face with all faces of the crystals are given as
θ = · =− i j nn ncos ( ), , 1, 2, ...,i j i j,1
(2)
where angles in θj = {θi,j}i=1n are arranged in ascending order.
It can be readily observed that all angular patterns in the ith familyare the same, that is, θ1,i = θ2,i = ... = θmi,i. The polymorph is uniquelycharacterized by its angular patterns {θj}i=1
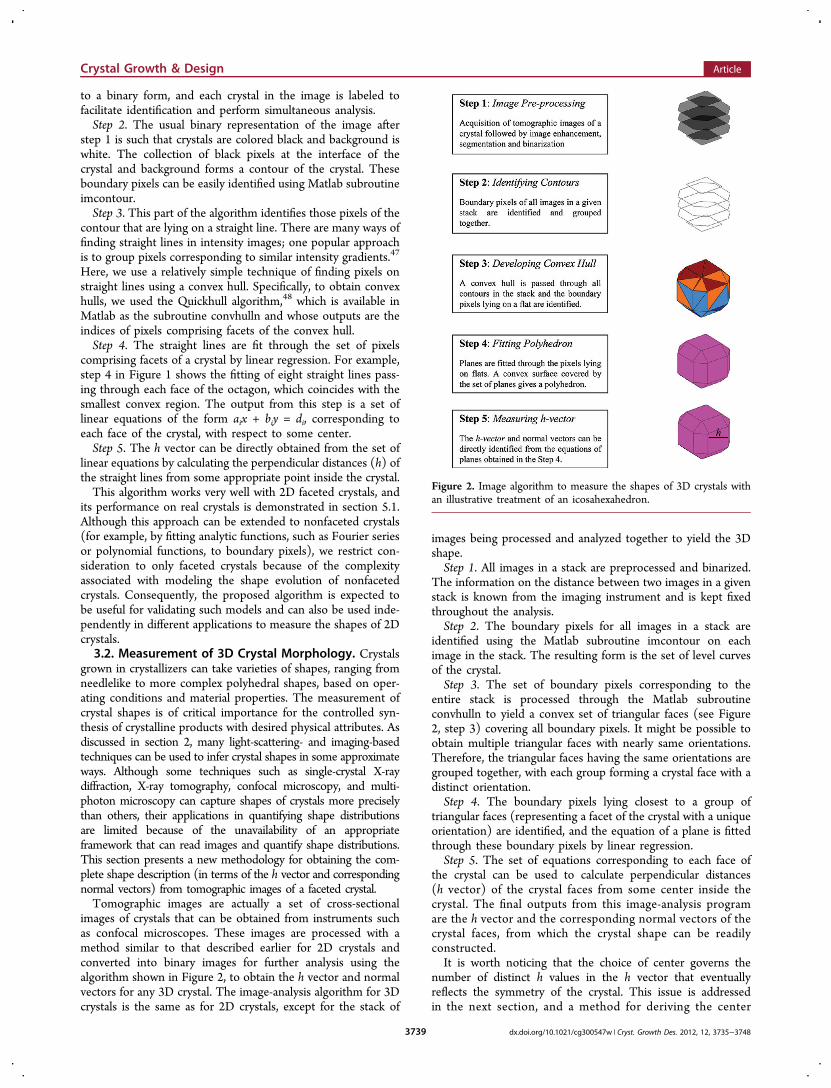
n , which are referred tohere as the master angular patterns. These master angular patternsare compared with the experimentally measured angular patterns toidentify polymorphs and assign Miller indices to crystal faces.The algorithm for identifying polymorphs and assigning
Miller indices to crystal faces is presented in Figure 3.
Step 1. The algorithm generates the set of energeticallyfavorable faces (F faces) for a given polymorph. The method toidentify F faces is well-established in the literature and is knownas connected-net analysis.50 For example, the F faces for aceta-minophen are given in the Appendix. The set of Miller indices
Figure 3. Algorithm for the identification of polymorphs and Millerindices of crystal faces from crystal shape information.
Crystal Growth & Design Article
dx.doi.org/10.1021/cg300547w | Cryst. Growth Des. 2012, 12, 3735−37483740

(hkl) corresponding to F faces of a given polymorph arecomposed as rows in a matrix M.Step 2. The row vectors mj ofM are the normal vectors of the
F faces whose “components” are expressed in terms of the crys-tallographic frame of reference. They can be transformed intothe vectors in the Cartesian frame using the transformation matrixK52
ω
ω α
β α
=
−⎡
⎣
⎢⎢⎢
⎤
⎦
⎥⎥⎥
a
a b
a b c
K
0 0
sin 0
cos cos
1
2
1
(3)
where
ω α β γ α β γ α
ω γ α βα
= − − − +
= −(1 cos cos cos 2 cos cos cos ) /sin
cos cos cossin
12 2 2 1/2
2
The transformation matrix K in eq 3 corresponds to the specificrelative orientation of the crystallographic and Cartesian framesof references; specifically, the c axis (crystal frame) is parallel tothe z axis (Cartesian frame), and the b axis (crystal frame) is inthe y−z plane (Cartesian frame). The transformed normal vectorsin the Cartesian frame can be obtained as
=N MK (4)
The master angular patterns {θj} for the set of energeticallyfavorable faces can be derived from eq 2. For example, the masterangular patterns for two different polymorphs of acetaminophenare shown in Tables A1 and A2 of the Appendix. These angularpatterns are unique for a given polymorph and are invariant withrespect to morphologies of growing crystals.Step 3. The experimental observation of crystal shape using
confocal microscopy, described in section 3.2, can produce amatrix N* of normal vectors that can be further manipulated toobtain experimentally measured angular patterns (θk*)
θ* = *· * =− n n l k mcos ( ), , 1, 2, ...,l k l k,1
(5)
where m is the number of experimentally observed crystal faces(for growing crystals m ≤ n) and the asterisk (*) denotes thatthey are experimentally measured quantities. Although theCartesian frames of reference for N and N* might not overlap,the angular patterns θj and θk* (which are both arranged inascending order) are independent of such differences. Forexample, the angular patterns computed for the experimentallymeasured normal vectors (Table A3, Appendix) are shown inTable A4 (Appendix).Step 4. The experimentally measured angular patterns {θk*}k=1
m
can then be compared with the master angular patterns {θj}j=1n of
each polymorph. As the dimensions of θk* and θj can be different,the match can be established under the condition that the set ofcomponents of θk* is a proper subset of the set of componentsof θj. The identification of the master angular patterns {θj}j=1
n
that match with {θk*}k=1m would fix the polymorph of the crystal.
For example, the match between Tables A4 and A1 confirmsform I of acetaminophen crystals.Step 5. Let ν1 = mj be the Miller index of jth face whose
angular pattern θj matches with some θk* with a normal vectorof ν2 = nk*. The relation between the Cartesian frames of referencecorresponding to N and N* can be obtained by using a rotationmatrix as follows
* = =σ σn R n R K mk j jT
(6)
The rotation matrix Rσ is given as
σ σ
σ σ
σ σ
σ σ
σ σ
σ σ
=−
·−
·
−
σ
⎡
⎣⎢⎢⎢
⎤
⎦⎥⎥⎥
⎡
⎣⎢⎢⎢
⎤
⎦⎥⎥⎥
⎡
⎣⎢⎢⎢
⎤
⎦⎥⎥⎥
R
1 0 00 cos sin
0 sin cos
cos 0 sin
0 1 0sin 0 cos
cos sin 0
sin cos 0
0 0 1
1 1
1 1
2 2
2 2
3 3
3 3
where σ1, σ2, and σ3 are the counterclockwise rotations aboutthe x, y, and z axes, respectively. The substitution of mj = ν1 andnk* = ν2 in eq 6 would fix the rotational angles σ ≡ {σ1, σ2, σ3}and, hence, the transformation matrix (KRσ
T). Now, the Millerindices (mk*) of the experimentally measured normal vectors(nk*) can be directly obtained as
* *= σ−M N KR( )T 1
(7)
Equation 7 identifies the crystallographic frame of referencefrom the experimentally measured crystal shape using the trans-formation matrix (KRσ
T). The identification of the transforma-tion matrix and the calculation of Miller indices for acetamino-phen crystals are given in the Appendix. The information onthe h vector and the corresponding Miller indices (M*) can befurther explored to study the polyhedral symmetry of the crys-tal to reduce the dimensions of the h vector. For example, acubic crystal with identical faces will have repeating elements inthe h vector measured with respect to the centroid of thecrystal. Such considerations of symmetry are very important forreducing the dimensionality of dynamic models for shapeevolution.10
3.4. Representation of Measurable Quantities Usingthe h Vector. There is a vast amount of literature on convexpolyhedra calculations in the area of computational geometry.Simple programs for computing the surface areas, volumes,mean diameters, and so on of convex polyhedra are availablein commercial software such as Matlab and Mathematica. Thebasis of such calculations lies in identifying the vertices of aconvex polyhedron defined as Nr ≤ h, where r is the positionvector. The vertex of a polyhedron is formed by at least threefaces that can be shown as
= · | | ≠
≤
−
⎡
⎣
⎢⎢⎢⎢
⎤
⎦
⎥⎥⎥⎥
h
h
h
v n n n n n n
Nv h
[ ] such that 0
and
i j k
i
j
k
i j kT T T 1 T T T
(8)
The set of vertices obtained for different combinations ofcrystal faces can be used to measure the face-specific area, totalsurface area, volume, and shape-related measures of thecrystals.8
3.5. Image-Analysis Program. The image-analysis pro-gram consists of three modules that were developed using theimage-processing toolbox of Matlab. The first module doesimage processing to obtain the contours of the crystals in theimages, which might involve multiple treatments based on thequality of the image. As the quality of confocal images underfixed microscope operating conditions is relatively constant, thetreatment to obtain contours is also fixed for a stack of confocalimages. The images must be converted to grayscale and thensubjected to contrast adjustment, if needed, using the Matlab
Crystal Growth & Design Article
dx.doi.org/10.1021/cg300547w | Cryst. Growth Des. 2012, 12, 3735−37483741
subroutine imadjust. The edges of the crystals in the images canthen be found by using Matlab subroutine edge which is basedon identifying intensity gradients in the intensity image. Finally,only those edges are selected that belongs to the contours ofthe crystals by filling holes and smoothing of the images. Theimage-processing treatments in this first module is very specificto the set of images obtained from a confocal microscope.The second module collects the contours of different slices of
a crystal in a given stack of confocal images with information onthe distance between the slices. These contours are then fittedbased on the methodology given in section 3.2 to yield thecrystal shape (h and N).The third module identifies the Miller indices of the crystal
faces and hence the crystal polymorph. The detailed calcula-tions for the identification of Miller indices (M*) are presentedin section 3.3. These three modules can be run for multipleconfocal stacks to obtain morphology distributions with respectto h vectors.
4. MATERIALS AND METHODSCrystals of acetaminophen of form I were grown by cooling a super-saturated solution of acetaminophen (MP Biomedicals, 90−100 wt %)in water at room temperature. There are many ways to produce acet-aminophen crystals of form I, which will not be discussed here in detailbecause they can be found elsewhere.53 The crystals were then filteredand dried, after which they were coated with a fluorescent dye. Thebasic requirement for 3D imaging using a confocal microscope is thatthe material should be fluorescent. Therefore, the coating of fluores-cent dyes on crystals is important for the versatility of this technique. Theinstability of fluorescent molecules at high temperatures and their high mo-lecular weights prevent their use for physical vapor deposition. Therefore,solution-based physical deposition was chosen to coat the fluorescent dye.Most active pharmaceutical ingredients (APIs) are polar molecules
with little or no solubility in nonpolar solvents. Lipophilic fluorescentmolecules can be dissolved in some nonpolar solvents in which crystalsof an API are suspended. The solution-based physical deposition of thefluorescent dye can be simply done by evaporating the nonpolar sol-vent. Acetaminophen crystals suspended in a solution of octadecylrhodamine B chloride (R18, Invitrogen) in n-heptane were coated with
the dye by evaporating the solvent. The coated crystals were taken onmicroscopic slides and observed by a confocal microscope (Bio-RadMRC 1024) at an excitation wavelength of 568 nm and an emissionfilter at 605/32. The method can be extended to coat fluorescent dyeon any material by choosing appropriate dye−solvent systems, henceenabling 3D imaging of the material using confocal microscopy.
5. RESULTS AND DISCUSSION
The performance of the morphology measurement techniquesdiscussed in section 3 on the experimentally observed 2D and3D shapes of acetaminophen is examined in the subsequentsubsections. The image-analysis program was able to produce hvectors and Miller indices for different shapes of acetamino-phen crystals and reliably generate morphology distributions forin silico images of 2D crystals.
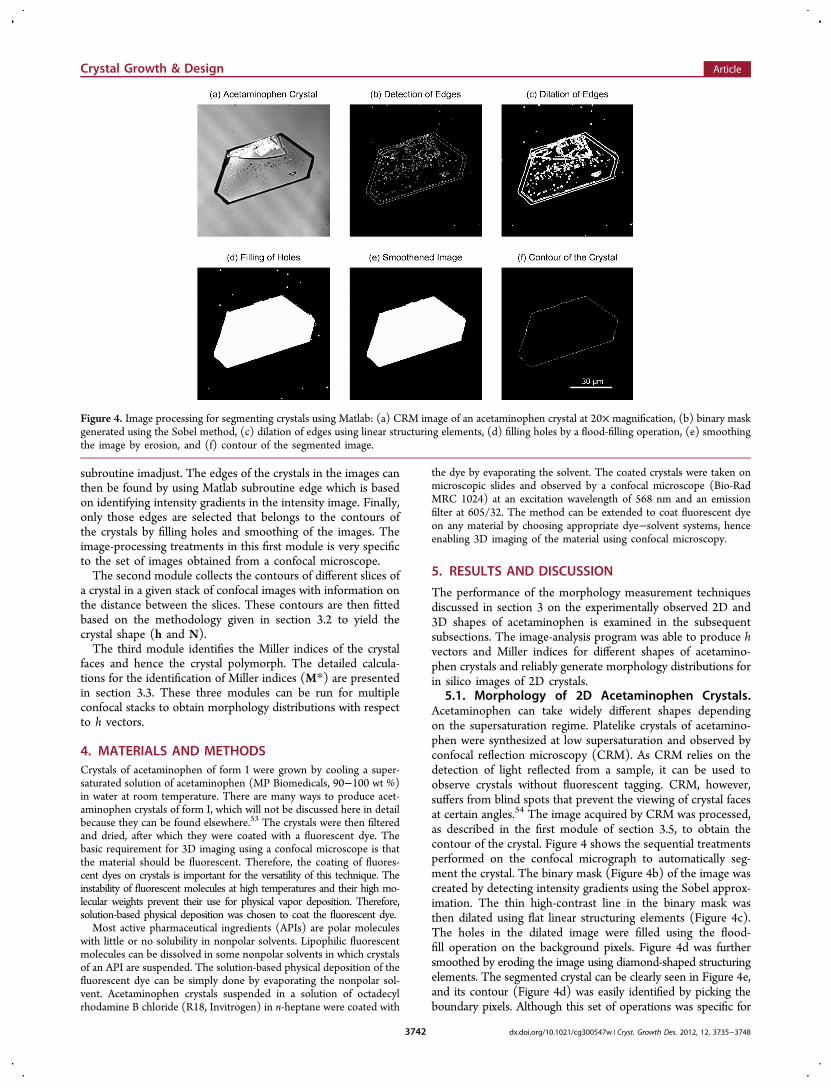
5.1. Morphology of 2D Acetaminophen Crystals.Acetaminophen can take widely different shapes dependingon the supersaturation regime. Platelike crystals of acetamino-phen were synthesized at low supersaturation and observed byconfocal reflection microscopy (CRM). As CRM relies on thedetection of light reflected from a sample, it can be used toobserve crystals without fluorescent tagging. CRM, however,suffers from blind spots that prevent the viewing of crystal facesat certain angles.54 The image acquired by CRM was processed,as described in the first module of section 3.5, to obtain thecontour of the crystal. Figure 4 shows the sequential treatmentsperformed on the confocal micrograph to automatically seg-ment the crystal. The binary mask (Figure 4b) of the image wascreated by detecting intensity gradients using the Sobel approx-imation. The thin high-contrast line in the binary mask wasthen dilated using flat linear structuring elements (Figure 4c).The holes in the dilated image were filled using the flood-fill operation on the background pixels. Figure 4d was furthersmoothed by eroding the image using diamond-shaped structuringelements. The segmented crystal can be clearly seen in Figure 4e,and its contour (Figure 4d) was easily identified by picking theboundary pixels. Although this set of operations was specific for
Figure 4. Image processing for segmenting crystals using Matlab: (a) CRM image of an acetaminophen crystal at 20× magnification, (b) binary maskgenerated using the Sobel method, (c) dilation of edges using linear structuring elements, (d) filling holes by a flood-filling operation, (e) smoothingthe image by erosion, and (f) contour of the segmented image.
Crystal Growth & Design Article
dx.doi.org/10.1021/cg300547w | Cryst. Growth Des. 2012, 12, 3735−37483742
this image, the operations can be easily automated for otherimages obtained by confocal microscopy under similar conditions.The contour obtained from image processing was analyzed to
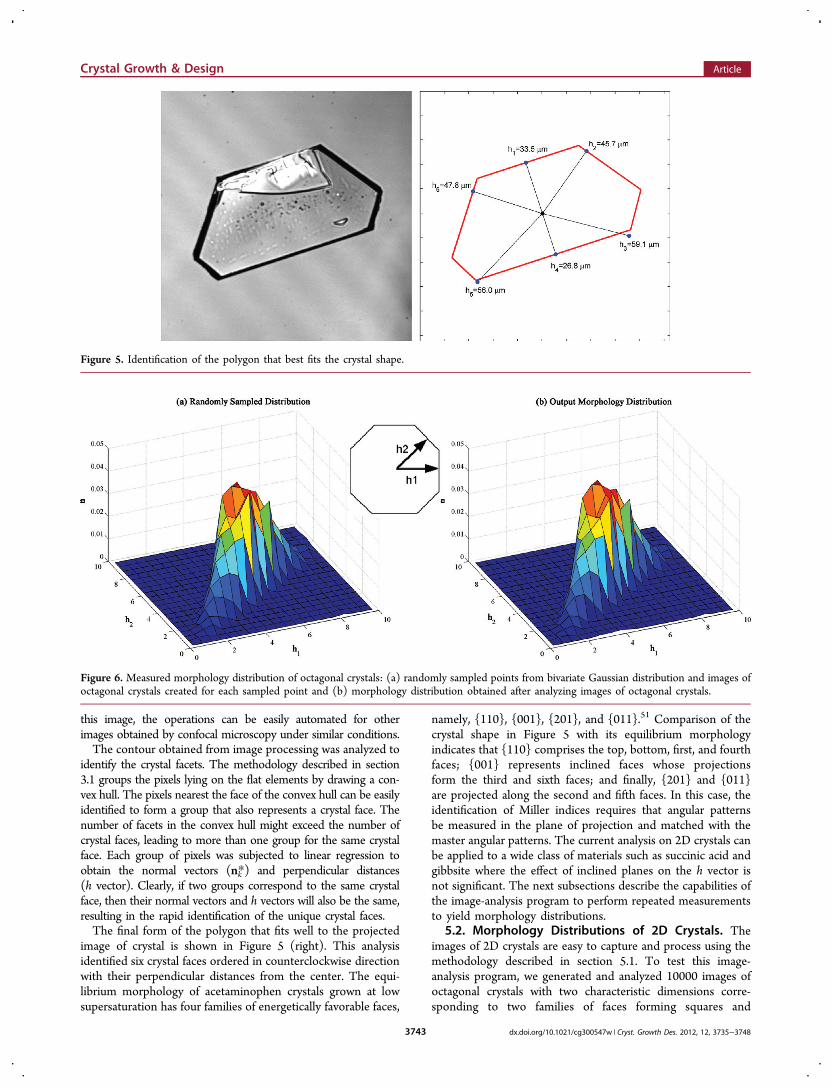
identify the crystal facets. The methodology described in section3.1 groups the pixels lying on the flat elements by drawing a con-vex hull. The pixels nearest the face of the convex hull can be easilyidentified to form a group that also represents a crystal face. Thenumber of facets in the convex hull might exceed the number ofcrystal faces, leading to more than one group for the same crystalface. Each group of pixels was subjected to linear regression toobtain the normal vectors (nk*) and perpendicular distances(h vector). Clearly, if two groups correspond to the same crystalface, then their normal vectors and h vectors will also be the same,resulting in the rapid identification of the unique crystal faces.The final form of the polygon that fits well to the projected
image of crystal is shown in Figure 5 (right). This analysisidentified six crystal faces ordered in counterclockwise directionwith their perpendicular distances from the center. The equi-librium morphology of acetaminophen crystals grown at lowsupersaturation has four families of energetically favorable faces,
namely, {110}, {001}, {201}, and {011}.51 Comparison of thecrystal shape in Figure 5 with its equilibrium morphologyindicates that {110} comprises the top, bottom, first, and fourthfaces; {001} represents inclined faces whose projectionsform the third and sixth faces; and finally, {201} and {011}are projected along the second and fifth faces. In this case, theidentification of Miller indices requires that angular patternsbe measured in the plane of projection and matched with themaster angular patterns. The current analysis on 2D crystals canbe applied to a wide class of materials such as succinic acid andgibbsite where the effect of inclined planes on the h vector isnot significant. The next subsections describe the capabilities ofthe image-analysis program to perform repeated measurementsto yield morphology distributions.
5.2. Morphology Distributions of 2D Crystals. Theimages of 2D crystals are easy to capture and process using themethodology described in section 5.1. To test this image-analysis program, we generated and analyzed 10000 images ofoctagonal crystals with two characteristic dimensions corre-sponding to two families of faces forming squares and
Figure 5. Identification of the polygon that best fits the crystal shape.
Figure 6. Measured morphology distribution of octagonal crystals: (a) randomly sampled points from bivariate Gaussian distribution and images ofoctagonal crystals created for each sampled point and (b) morphology distribution obtained after analyzing images of octagonal crystals.
Crystal Growth & Design Article
dx.doi.org/10.1021/cg300547w | Cryst. Growth Des. 2012, 12, 3735−37483743
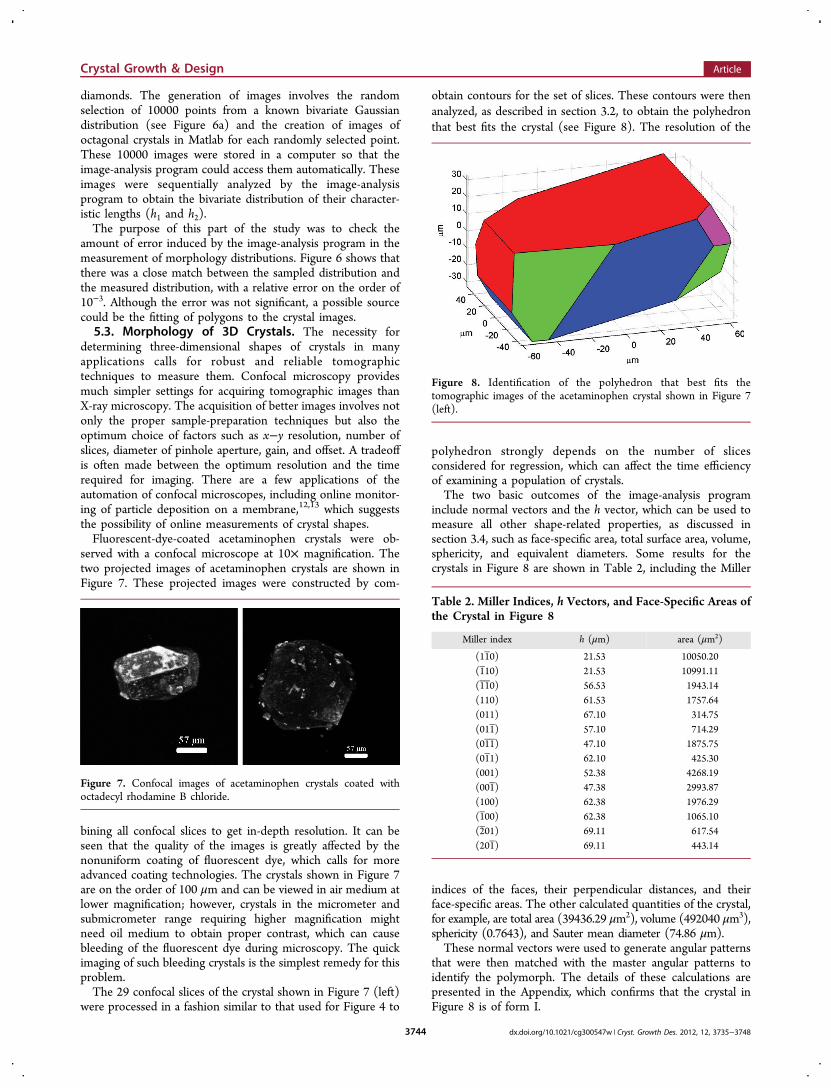
diamonds. The generation of images involves the randomselection of 10000 points from a known bivariate Gaussiandistribution (see Figure 6a) and the creation of images ofoctagonal crystals in Matlab for each randomly selected point.These 10000 images were stored in a computer so that theimage-analysis program could access them automatically. Theseimages were sequentially analyzed by the image-analysisprogram to obtain the bivariate distribution of their character-istic lengths (h1 and h2).The purpose of this part of the study was to check the
amount of error induced by the image-analysis program in themeasurement of morphology distributions. Figure 6 shows thatthere was a close match between the sampled distribution andthe measured distribution, with a relative error on the order of10−3. Although the error was not significant, a possible sourcecould be the fitting of polygons to the crystal images.5.3. Morphology of 3D Crystals. The necessity for
determining three-dimensional shapes of crystals in manyapplications calls for robust and reliable tomographictechniques to measure them. Confocal microscopy providesmuch simpler settings for acquiring tomographic images thanX-ray microscopy. The acquisition of better images involves notonly the proper sample-preparation techniques but also theoptimum choice of factors such as x−y resolution, number ofslices, diameter of pinhole aperture, gain, and offset. A tradeoffis often made between the optimum resolution and the timerequired for imaging. There are a few applications of theautomation of confocal microscopes, including online monitor-ing of particle deposition on a membrane,12,13 which suggeststhe possibility of online measurements of crystal shapes.Fluorescent-dye-coated acetaminophen crystals were ob-
served with a confocal microscope at 10× magnification. Thetwo projected images of acetaminophen crystals are shown inFigure 7. These projected images were constructed by com-
bining all confocal slices to get in-depth resolution. It can beseen that the quality of the images is greatly affected by thenonuniform coating of fluorescent dye, which calls for moreadvanced coating technologies. The crystals shown in Figure 7are on the order of 100 μm and can be viewed in air medium atlower magnification; however, crystals in the micrometer andsubmicrometer range requiring higher magnification mightneed oil medium to obtain proper contrast, which can causebleeding of the fluorescent dye during microscopy. The quickimaging of such bleeding crystals is the simplest remedy for thisproblem.The 29 confocal slices of the crystal shown in Figure 7 (left)
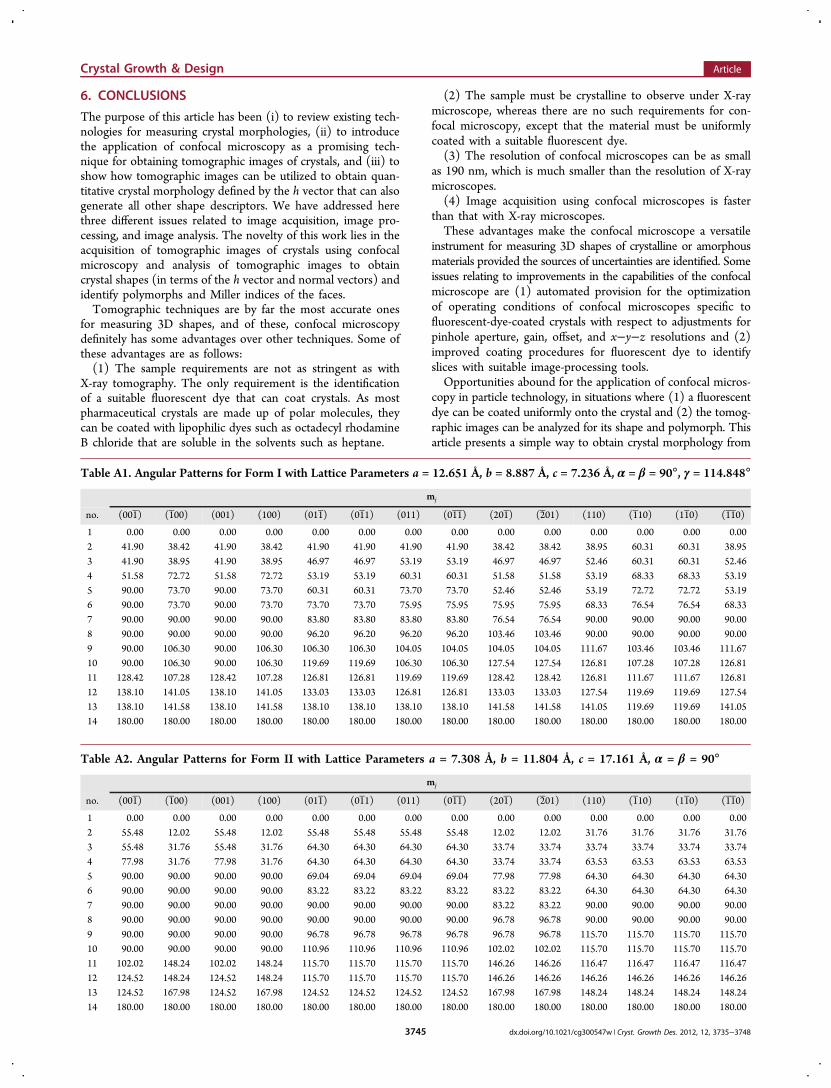
were processed in a fashion similar to that used for Figure 4 to
obtain contours for the set of slices. These contours were thenanalyzed, as described in section 3.2, to obtain the polyhedronthat best fits the crystal (see Figure 8). The resolution of the
polyhedron strongly depends on the number of slicesconsidered for regression, which can affect the time efficiencyof examining a population of crystals.The two basic outcomes of the image-analysis program
include normal vectors and the h vector, which can be used tomeasure all other shape-related properties, as discussed insection 3.4, such as face-specific area, total surface area, volume,sphericity, and equivalent diameters. Some results for thecrystals in Figure 8 are shown in Table 2, including the Miller
indices of the faces, their perpendicular distances, and theirface-specific areas. The other calculated quantities of the crystal,for example, are total area (39436.29 μm2), volume (492040 μm3),sphericity (0.7643), and Sauter mean diameter (74.86 μm).These normal vectors were used to generate angular patterns
that were then matched with the master angular patterns toidentify the polymorph. The details of these calculations arepresented in the Appendix, which confirms that the crystal inFigure 8 is of form I.
Figure 7. Confocal images of acetaminophen crystals coated withoctadecyl rhodamine B chloride.
Figure 8. Identification of the polyhedron that best fits thetomographic images of the acetaminophen crystal shown in Figure 7(left).
Table 2. Miller Indices, h Vectors, and Face-Specific Areas ofthe Crystal in Figure 8
Miller index h (μm) area (μm2)
(11 0) 21.53 10050.20(1 10) 21.53 10991.11(1 10) 56.53 1943.14(110) 61.53 1757.64(011) 67.10 314.75(011 ) 57.10 714.29(01 1) 47.10 1875.75(01 1) 62.10 425.30(001) 52.38 4268.19(001 ) 47.38 2993.87(100) 62.38 1976.29(1 00) 62.38 1065.10(2 01) 69.11 617.54(201 ) 69.11 443.14
Crystal Growth & Design Article
dx.doi.org/10.1021/cg300547w | Cryst. Growth Des. 2012, 12, 3735−37483744
6. CONCLUSIONS
The purpose of this article has been (i) to review existing tech-nologies for measuring crystal morphologies, (ii) to introducethe application of confocal microscopy as a promising tech-nique for obtaining tomographic images of crystals, and (iii) toshow how tomographic images can be utilized to obtain quan-titative crystal morphology defined by the h vector that can alsogenerate all other shape descriptors. We have addressed herethree different issues related to image acquisition, image pro-cessing, and image analysis. The novelty of this work lies in theacquisition of tomographic images of crystals using confocalmicroscopy and analysis of tomographic images to obtaincrystal shapes (in terms of the h vector and normal vectors) andidentify polymorphs and Miller indices of the faces.Tomographic techniques are by far the most accurate ones
for measuring 3D shapes, and of these, confocal microscopydefinitely has some advantages over other techniques. Some ofthese advantages are as follows:(1) The sample requirements are not as stringent as with
X-ray tomography. The only requirement is the identificationof a suitable fluorescent dye that can coat crystals. As mostpharmaceutical crystals are made up of polar molecules, theycan be coated with lipophilic dyes such as octadecyl rhodamineB chloride that are soluble in the solvents such as heptane.
(2) The sample must be crystalline to observe under X-raymicroscope, whereas there are no such requirements for con-focal microscopy, except that the material must be uniformlycoated with a suitable fluorescent dye.(3) The resolution of confocal microscopes can be as small
as 190 nm, which is much smaller than the resolution of X-raymicroscopes.(4) Image acquisition using confocal microscopes is faster
than that with X-ray microscopes.These advantages make the confocal microscope a versatile
instrument for measuring 3D shapes of crystalline or amorphousmaterials provided the sources of uncertainties are identified. Someissues relating to improvements in the capabilities of the confocalmicroscope are (1) automated provision for the optimizationof operating conditions of confocal microscopes specific tofluorescent-dye-coated crystals with respect to adjustments forpinhole aperture, gain, offset, and x−y−z resolutions and (2)improved coating procedures for fluorescent dye to identifyslices with suitable image-processing tools.Opportunities abound for the application of confocal micros-
copy in particle technology, in situations where (1) a fluorescentdye can be coated uniformly onto the crystal and (2) the tomog-raphic images can be analyzed for its shape and polymorph. Thisarticle presents a simple way to obtain crystal morphology from
Table A1. Angular Patterns for Form I with Lattice Parameters a = 12.651 Å, b = 8.887 Å, c = 7.236 Å, α = β = 90°, γ = 114.848°
mj
no. (001 ) (1 00) (001) (100) (011 ) (01 1) (011) (01 1) (201 ) (2 01) (110) (1 10) (11 0) (1 10)
1 0.00 0.00 0.00 0.00 0.00 0.00 0.00 0.00 0.00 0.00 0.00 0.00 0.00 0.002 41.90 38.42 41.90 38.42 41.90 41.90 41.90 41.90 38.42 38.42 38.95 60.31 60.31 38.953 41.90 38.95 41.90 38.95 46.97 46.97 53.19 53.19 46.97 46.97 52.46 60.31 60.31 52.464 51.58 72.72 51.58 72.72 53.19 53.19 60.31 60.31 51.58 51.58 53.19 68.33 68.33 53.195 90.00 73.70 90.00 73.70 60.31 60.31 73.70 73.70 52.46 52.46 53.19 72.72 72.72 53.196 90.00 73.70 90.00 73.70 73.70 73.70 75.95 75.95 75.95 75.95 68.33 76.54 76.54 68.337 90.00 90.00 90.00 90.00 83.80 83.80 83.80 83.80 76.54 76.54 90.00 90.00 90.00 90.008 90.00 90.00 90.00 90.00 96.20 96.20 96.20 96.20 103.46 103.46 90.00 90.00 90.00 90.009 90.00 106.30 90.00 106.30 106.30 106.30 104.05 104.05 104.05 104.05 111.67 103.46 103.46 111.6710 90.00 106.30 90.00 106.30 119.69 119.69 106.30 106.30 127.54 127.54 126.81 107.28 107.28 126.8111 128.42 107.28 128.42 107.28 126.81 126.81 119.69 119.69 128.42 128.42 126.81 111.67 111.67 126.8112 138.10 141.05 138.10 141.05 133.03 133.03 126.81 126.81 133.03 133.03 127.54 119.69 119.69 127.5413 138.10 141.58 138.10 141.58 138.10 138.10 138.10 138.10 141.58 141.58 141.05 119.69 119.69 141.0514 180.00 180.00 180.00 180.00 180.00 180.00 180.00 180.00 180.00 180.00 180.00 180.00 180.00 180.00
Table A2. Angular Patterns for Form II with Lattice Parameters a = 7.308 Å, b = 11.804 Å, c = 17.161 Å, α = β = 90°
mj
no. (001 ) (1 00) (001) (100) (011 ) (01 1) (011) (01 1) (201 ) (2 01) (110) (1 10) (11 0) (1 10)
1 0.00 0.00 0.00 0.00 0.00 0.00 0.00 0.00 0.00 0.00 0.00 0.00 0.00 0.002 55.48 12.02 55.48 12.02 55.48 55.48 55.48 55.48 12.02 12.02 31.76 31.76 31.76 31.763 55.48 31.76 55.48 31.76 64.30 64.30 64.30 64.30 33.74 33.74 33.74 33.74 33.74 33.744 77.98 31.76 77.98 31.76 64.30 64.30 64.30 64.30 33.74 33.74 63.53 63.53 63.53 63.535 90.00 90.00 90.00 90.00 69.04 69.04 69.04 69.04 77.98 77.98 64.30 64.30 64.30 64.306 90.00 90.00 90.00 90.00 83.22 83.22 83.22 83.22 83.22 83.22 64.30 64.30 64.30 64.307 90.00 90.00 90.00 90.00 90.00 90.00 90.00 90.00 83.22 83.22 90.00 90.00 90.00 90.008 90.00 90.00 90.00 90.00 90.00 90.00 90.00 90.00 96.78 96.78 90.00 90.00 90.00 90.009 90.00 90.00 90.00 90.00 96.78 96.78 96.78 96.78 96.78 96.78 115.70 115.70 115.70 115.7010 90.00 90.00 90.00 90.00 110.96 110.96 110.96 110.96 102.02 102.02 115.70 115.70 115.70 115.7011 102.02 148.24 102.02 148.24 115.70 115.70 115.70 115.70 146.26 146.26 116.47 116.47 116.47 116.4712 124.52 148.24 124.52 148.24 115.70 115.70 115.70 115.70 146.26 146.26 146.26 146.26 146.26 146.2613 124.52 167.98 124.52 167.98 124.52 124.52 124.52 124.52 167.98 167.98 148.24 148.24 148.24 148.2414 180.00 180.00 180.00 180.00 180.00 180.00 180.00 180.00 180.00 180.00 180.00 180.00 180.00 180.00
Crystal Growth & Design Article
dx.doi.org/10.1021/cg300547w | Cryst. Growth Des. 2012, 12, 3735−37483745

tomographic images using a convex hull. The convex hull facil-itates the identification of crystal faces and is followed by aregression procedure to obtain surface normals and the h vector.The identification of master angular patterns readily allows forthe detection of polymorphs.The current methodology for obtaining the h vector for 2D
crystals can also be used with other projection-based techniquessuch as PVM and optical microscopy. The analysis of 2D crys-tals can reliably produce h vectors and normal vectors if theinclination of the planes with respect to the projection plane isknown. The methodology for measuring 3D shapes from to-mographic images can also be extended to stereoscopic images.The dynamic 3D images of crystals can also be obtained fromhot-stage confocal microscopes if there are provisions forintermittent coating and removal of fluorescent dyes.As demonstrated, quick assessment of the morphology of
single crystals allows for the determination of the morphologydistribution among a population of crystals. However, for thedetermination of morphology distributions, it is essential todevelop the capability for online measurements. In this regard,the work of Patience and Rawlings27 is particularly noteworthyfor emulation. Alternatively, confocal microscopy can also beused for the offline imaging of crystals sampled frequently fromcrystallizers. What this work has accomplished is a method-ology for the rapid assessment of the morphologies of facetedobjects when their images are available.
■ APPENDIXMiller Index and Polymorph IdentificationAcetaminophen crystals are known to exist in threepolymorphic forms: form I (monoclinic, stable), form II(orthorhombic, metastable), and form III (Unknown). Thesepolymorphs of acetaminophen have four energetically favorablefamilies of faces (F faces), namely, {110}, {001}, {201}, and{011}, that form a tetradecahedron. The master angularpatterns for forms I and II were generated using eq 2 and arelisted in Tables A1 and A2, respectively.The normal vectors of the crystal faces obtained from the
shape measurements are given in Table A3. The objective ofthis analysis was to identify the polymorph of the crystal andthe Miller indices corresponding to the normal vectors. Theangular patterns (shown in Table A4) obtained from themeasured normal vectors matches significantly with Table A1,which confirms its polymorph to be form I. The assignment ofthe Miller indices requires the identification of the trans-formation matrix (KRσ
T). We use eq 6 to find the rotationsabout the axes for some pairs (nk*, mj) that correspond to thecolumns of Tables A4 and A1 with similar angular patterns. Weneed two pairs of (nk*, mj) to uniquely determine the angularrotations. The two arbitrary choices of pairs (n1*, m13) and(n6*, m1) yielded angular rotations σ = [90° 0° 18.324°] using eq6. The knowledge of lattice parameters and angular rotations fixesthe transformation matrix, which in Table A3 directly produces thecorresponding Miller indices, as shown in Table A5.
Table A3. Normal Vectors Derived from Crystal ShapeMeasurements in Figure 8
n1* 0.0000 0.0000 1.0000n2* −0.9307 0.0000 0.3659n3* 0.4427 −0.7478 −0.4948n4* 0.4427 0.7478 −0.4948n5* 0.0000 1.0000 0.0000n6* 0.0000 −1.0000 0.0000n7* −0.4427 −0.7478 0.4948n8* 0.0000 0.0000 −1.0000n9* 0.9493 0.0000 0.3144n10* 0.7407 −0.6255 0.2453n11* −0.4427 0.7478 0.4948n12* −0.7407 0.6255 −0.2453n13* 0.9307 0.0000 −0.3659n14* −0.9493 0.0000 −0.3144
Table A4. Angular Patterns Corresponding to the Normal Vectors Given in Table A3
nk*
no. n1* n2* n3* n4* n5* n6* n7* n8* n9* n10* n11* n12* n13* n14*
1 0.00 0.00 0.00 0.00 0.00 0.00 0.00 0.00 0.00 0.00 0.00 0.00 0.00 0.002 60.35 39.79 41.60 41.60 41.60 41.60 41.60 60.35 38.72 38.72 41.60 38.72 39.79 38.723 60.35 53.16 47.60 53.62 41.60 41.60 53.62 60.35 39.79 47.60 47.60 47.60 53.16 39.794 68.54 53.62 53.62 60.35 51.28 51.28 60.35 68.54 71.68 51.28 53.62 51.28 53.62 71.685 71.68 53.62 60.35 74.65 90.00 90.00 74.65 71.68 74.65 53.16 60.35 53.16 53.62 74.656 75.80 68.54 74.65 74.86 90.00 90.00 74.86 75.80 74.65 74.86 74.65 74.86 68.54 74.657 90.00 90.00 83.20 83.20 90.00 90.00 83.20 90.00 90.00 75.80 83.20 75.80 90.00 90.008 90.00 90.00 96.80 96.80 90.00 90.00 96.80 90.00 90.00 104.20 96.80 104.20 90.00 90.009 104.20 111.46 105.35 105.14 90.00 90.00 105.14 104.20 105.35 105.14 105.35 105.14 111.46 105.3510 108.32 126.38 119.65 105.35 90.00 90.00 105.35 108.32 105.35 126.84 119.65 126.84 126.38 105.3511 111.46 126.38 126.38 119.65 128.72 128.72 119.65 111.46 108.32 128.72 126.38 128.72 126.38 108.3212 119.65 126.84 132.40 126.38 138.40 138.40 126.38 119.65 140.21 132.40 132.40 132.40 126.84 140.2113 119.65 140.21 138.40 138.40 138.40 138.40 138.40 119.65 141.28 141.28 138.40 141.28 140.21 141.2814 180.00 180.00 180.00 180.00 180.00 180.00 180.00 180.00 180.00 180.00 180.00 180.00 180.00 180.00
Table A5. Identified Miller Indices for Crystal Faces
m1* 1.00 −1.00 0.00m2* −1.00 −1.00 0.00m3* 0.00 1.00 −1.00m4* 0.00 1.00 1.00m5* 0.00 0.00 1.00m6* 0.00 0.00 −1.00m7* 0.00 −1.00 −1.00m8* −1.00 1.00 0.00m9* 1.00 0.00 0.00m10* 2.00 0.00 −1.00m11* 0.00 −1.00 1.00m12* −2.00 0.00 1.00m13* 1.00 1.00 0.00m14* −1.00 0.00 0.00
Crystal Growth & Design Article
dx.doi.org/10.1021/cg300547w | Cryst. Growth Des. 2012, 12, 3735−37483746
■ AUTHOR INFORMATIONCorresponding Author*E-mail: [email protected].
NotesThe authors declare no competing financial interest.
■ ACKNOWLEDGMENTSM.R.S. and D.R. gratefully acknowledge current and pastfunding support from Abbott Laboratories, Roche Pharmaceut-icals, and the NSF Engineering Research Center for StructuredOrganic Particulate Systems for this research. We are thankfulto Dr. Ram Narayan (Roche Carolina) for useful discussions onmorphology measurements, Dr. Steef X. M. Boerrigter (SSCI/Aptuit) for providing suggestions on polymorph identification,Prof. Alexander Wei (Chemistry, Purdue) for providing accessto CRM, Dr. Gerard Gagne for suggesting fluorescent dyes andproviding access to the confocal microscope facility at AbbottPark. M.R.S. and D.R. are also grateful to GPRD-ProcessEngineering Department of Abbott Laboratories for providingthe opportunity to conduct part of this research at its facilities.
■ REFERENCES(1) Schwarcz, H.; Shane, K. Measurement of particle shape byFourier analysis. Sedimentology 1969, 13 (3−4), 213−231. Luerkens,D.; Beddow, J.; Vetter, A. Morphological Fourier descriptors. PowderTechnol. 1982, 31 (2), 209−215.(2) Clark, N. Three techniques for implementing digital fractalanalysis of particle shape. Powder Technol. 1986, 46 (1), 45−52.(3) Hutter, M.; Rutledge, G.; Armstrong, R. Crystal shapes andcrystallization in continuum modeling. Phys. Fluids 2005, 17, 014107.(4) Mokhtarian, F.; Mackworth, A. A theory of multiscale, curvature-based shape representation for planar curves. IEEE Trans. Pattern Anal.Mach. Intell. 1992, 789−805.(5) Keren, D.; Cooper, D.; Subrahmonia, J. Describing complicatedobjects by implicit polynomials. IEEE Trans. Pattern Anal. Mach. Intell.1994, 38−53. Carr, J.; Beatson, R.; Cherrie, J.; Mitchell, T.; Fright, W.;McCallum, B.; Evans, T. Reconstruction and Representation of 3DObjects with Radial Basis Functions. In SIGGRAPH '01: Proceedings ofthe 28th Annual Conference on Computer Graphics and InteractiveTechniques ; ACM: New York, 2001; pp 67−76.(6) Loncaric, S. A survey of shape analysis techniques. PatternRecognit. 1998, 31 (8), 983−1001. da Fontoura Costa, L.; Cesar, R.Shape Analysis and Classification: Theory and Practice; CRC Press: BocaRaton, FL, 2001.(7) Zhang, Y.; Doherty, M. Simultaneous prediction of crystal shapeand size for solution crystallization. AIChE J. 2004, 50 (9), 2101−2112. Wan, J.; Wang, X.; Ma, C. Particle shape manipulation andoptimization in cooling crystallization involving multiple crystalmorphological forms. AIChE J. 2009, 55 (8), 2049−2061.(8) Borchert, C.; Nere, N.; Ramkrishna, D.; Voigt, A.; Sundmacher,K. On the prediction of crystal shape distributions in a steady-statecontinuous crystallizer. Chem. Eng. Sci. 2009, 64 (4), 686−696.(9) Ma, D.; Tafti, D.; Braatz, R. High-resolution simulation ofmultidimensional crystal growth. Ind. Eng. Chem. Res. 2002, 41 (25),6217−6223. Chakraborty, J.; Kumar, S. A new framework for solutionof multidimensional population balance equations. Chem. Eng. Sci.2007, 62 (15), 4112−4125.(10) Chakraborty, J.; Singh, M. R.; Ramkrishna, D.; Borchert, C.;Sundmacher, K. Modeling of crystal morphology distributions.Towards crystals with preferred asymmetry. Chem. Eng. Sci. 2010, 65(21), 5676−5686.(11) Kelderman, H. F.; Fein, M. E.; Loh, A. E.; Adams, A.;Neukermans, A. P. (Tencor Instruments). Confocal measuringmicroscope with automatic focusing. U.S. Patent 4,844,617, 1989.(12) Ferrando, M.; Zator, M.; Lopez, F.; Guell, C. Confocal ScanningLaser Microscopy: Fundamentals and Uses on Membrane Fouling
Characterization and Opportunities for Online Monitoring. InMonitoring and Visualizing Membrane-Based Processes, Guell, C.,Ferrando, M., Lopez, F., Eds.; Wiley-VCH: Weinheim, Germany,2009; pp 55−75.(13) Kromkamp, J.; Faber, F.; Schroen, K.; Boom, R. Effects ofparticle size segregation on crossflow microfiltration performance:Control mechanism for concentration polarisation and particlefractionation. J. Membr. Sci. 2006, 268 (2), 189−197.(14) Vorburger, T.; Teague, E. Optical techniques for on-linemeasurement of surface topography. Precis. Eng. 1981, 3 (2), 61−83.(15) Adrian, R. Particle-imaging techniques for experimental fluidmechanics. Annu. Rev. Fluid Mech. 1991, 23 (1), 261−304.(16) Chen, F.; Brown, G.; Song, M. Overview of three-dimensionalshape measurement using optical methods. Opt. Eng. 2000, 39 (1),10−22.(17) Viswanathan, K.; Aravamudhan, S.; Mani, B. Separation Basedon Shape Part I: Recovery Efficiency of Spherical Particles. PowderTechnol. 1984, 39 (1), 83−91.(18) Nakagawa, M.; Furuuchi, M.; Yamahata, M.; Gotoh, K.;Beddow, J. Shape classification of granular materials by rotatingcylinder with blades. Powder Technol. 1985, 44 (2), 195−202.(19) Meloy, T.; Clark, N.; Durney, T.; Pitchumani, B. Measuring theparticle shape mix in a powder with the cascadograph. Chem. Eng. Sci.1985, 40 (7), 1077−1084.(20) Ma, Z.; Merkus, H.; de Smet, J.; Heffels, C.; Scarlett, B. Newdevelopments in particle characterization by laser diffraction: Size andshape. Powder Technol. 2000, 111 (1−2), 66−78.(21) Nere, N.; Ramkrishna, D.; Parker, B.; Bell, W., III; Mohan, P.Transformation of the Chord-Length Distributions to Size Distribu-tions for Nonspherical Particles with Orientation Bias. Ind. Eng. Chem.Res. 2007, 46 (10), 3041−3047.(22) Paschotta, R. Encyclopedia of Laser Physics and Technology;Wiley-VCH: Weinheim, Germany, 2008.(23) Singer, H. Measurements of the three-dimensional shape of icecrystals in supercooled water. Phys. Rev. E 2006, 73 (5), 51606.(24) Robinson, I.; Vartanyants, I.; Williams, G.; Pfeifer, M.; Pitney, J.Reconstruction of the shapes of gold nanocrystals using coherent x-raydiffraction. Phys. Rev. Lett. 2001, 87 (19), 195505.(25) Prasad, A. Stereoscopic particle image velocimetry. Exp. Fluids2000, 29 (2), 103−116.(26) Bujak, B.; Bottlinger, M. Three-Dimensional Measurement ofParticle Shape. Part. Part. Syst. Charact. 2008, 25 (4), 293−297.(27) Patience, D.; Rawlings, J. Particle shape monitoring and controlin crystallization processes. AIChE J. 2001, 47 (9), 2125−2130.(28) Webb, R. Confocal optical microscopy. Rep. Prog. Phys. 1996,59, 427−471.(29) Larson, B.; Yang, W.; Ice, G.; Budai, J.; Tischler, J. Three-dimensional X-ray structural microscopy with submicrometre reso-lution. Nature 2002, 415 (6874), 887−890.(30) Patchigolla, K.; Wilkinson, D. Crystal Shape Characterisation ofDry Samples Using Microscopic and Dynamic Image Analysis. Part.Part. Syst. Charact. 2009, 26 (4), 171−178.(31) Chang, S.; Shih, C.; Chen, C.; Lai, W.; Wang, C. The shapetransition of gold nanorods. Langmuir 1999, 15 (3), 701−709.(32) Braatz, R.; Hasebe, S. Particle Size and Shape Control inCrystallization Processes. AIChE Symp. Ser. 1998, 326, 307−327.(33) Hansma, P.; Elings, V.; Marti, O.; Bracker, C. Scanningtunneling microscopy and atomic force microscopy: Application tobiology and technology. Science 1988, 242 (4876), 209−216.(34) Myshkin, N.; Grigoriev, A.; Kholodilov, O. Quantitative analysisof surface topography using scanning electron microscopy. Wear 1992,153 (1), 119−133.(35) Hentschel, M.; Page, N. Selection of descriptors for particleshape characterization. Part. Part. Syst. Charact. 2003, 20 (1), 25−38.(36) Pons, M.; Vivier, H.; Belaroui, K.; Bernard-Michel, B.; Cordier,F.; Oulhana, D.; Dodds, J. Particle morphology: From visualisation tomeasurement. Powder Technol. 1999, 103 (1), 44−57.
Crystal Growth & Design Article
dx.doi.org/10.1021/cg300547w | Cryst. Growth Des. 2012, 12, 3735−37483747
(37) Podczeck, F.; Rahman, S.; Newton, J. Evaluation of astandardised procedure to assess the shape of pellets using imageanalysis. Int. J. Pharm. 1999, 192 (2), 123−138.(38) Wang, X.; Roberts, K.; Ma, C. Crystal growth measurementusing 2D and 3D imaging and the perspectives for shape control.Chem. Eng. Sci. 2008, 63 (5), 1173−1184.(39) Simon, L.; Merz, T.; Dubuis, S.; Lieb, A.; Hungerbuhler, K. In-situ monitoring of pharmaceutical and specialty chemicals crystal-lization processes using endoscopy−stroboscopy and multivariateimage analysis. Chem. Eng. Res. Des., published online Apr 5, 2012,http://dx.doi.org/10.1016/j.cherd.2012.03.023.(40) Wang, X.; Calderon De Anda, J.; Roberts, K.; Li, R.; Thomson,G.; White, G. Advances in on-line monitoring and control of themorphological and polymorphic forms of organic crystals grown fromsolution. Kona 2005, 23, 69−85.(41) Kempkes, M.; Vetter, T.; Mazzotti, M. Measurement of 3Dparticle size distributions by stereoscopic imaging. Chem. Eng. Sci.2010, 65 (4), 1362−1373.(42) Tiziani, H.; Uhde, H. Three-dimensional image sensing bychromatic confocal microscopy. Appl. Opt. 1994, 33 (10), 1838−1843.(43) Kindratenko, V. Development and application of image analysistechniques for identification and classification of microscopic particles.Ph.D. Thesis, Universitaire Antwerpen, Antwerp, Belgium, 1997.(44) Bharati, M.; MacGregor, J. Multivariate image analysis for real-time process monitoring and control. Ind. Eng. Chem. Res. 1998, 37(12), 4715−4724. Sarkar, D.; Doan, X.; Ying, Z.; Srinivasan, R. In situparticle size estimation for crystallization processes by multivariateimage analysis. Chem. Eng. Sci. 2009, 64 (1), 9−19.(45) Li, R.; Thomson, G.; White, G.; Wang, X.; De Anda, J.; Roberts,K. Integration of crystal morphology modeling and on line shapemeasurement. AIChE J. 2006, 52 (6), 2297−2305.(46) Larsen, P.; Rawlings, J.; Ferrier, N. Model-based objectrecognition to measure crystal size and shape distributions from insitu video images. Chem. Eng. Sci. 2007, 62 (5), 1430−1441.(47) Burns, J. B.; Hanson, A. R.; Riseman, E. M. Extracting straightlines. IEEE Trans. Pattern Anal. Mach. Intell. 1986, 8 (4), 425−455.(48) Barber, C. B.; Dobkin, D. P.; Huhdanpaa, H. The quickhullalgorithm for convex hulls. ACM Trans. Math. Software 1996, 22 (4),469−483.(49) Green, D.; Meenan, P.; Sunshine, G.; Ennis, B. Habit modellingand verification for glutaric acid. J. Phys. D: Appl. Phys. 1993, 26, B35−B40.(50) Boerrigter, S.; Cuppen, H.; Ristic, R.; Sherwood, J.; Bennema,P.; Meekes, H. Explanation for the supersaturation-dependentmorphology of monoclinic paracetamol. Cryst. Growth Des. 2002, 2(5), 357−361.(51) Ristic, R.; Finnie, S.; Sheen, D.; Sherwood, J. Macro- andmicromorphology of monoclinic paracetamol grown from pureaqueous solution. J. Phys. Chem. B 2001, 105 (38), 9057−9066.(52) Bond, W. Computation of interfacial angles, interzonal angles,and clinographic projection by matrix methods. Am. Mineral. 1946, 31,31−42.(53) Nichols, G.; Frampton, C. S. Physicochemical characterizationof the orthorhombic polymorph of paracetamol crystallized fromsolution. J. Pharm. Sci. 1998, 87 (6), 684−693.(54) Jawerth, L. M.; Munster, S.; Vader, D. A.; Fabry, B.; Weitz, D. A.A blind spot in confocal reflection microscopy: The dependence offiber brightness on fiber orientation in imaging biopolymer networks.Biophys. J. 2010, 98 (3), L1−L3.
Crystal Growth & Design Article
dx.doi.org/10.1021/cg300547w | Cryst. Growth Des. 2012, 12, 3735−37483748


![ELECTRON BACKSCATTER DIFFRACTION CRYSTAL … · 2014. 8. 8. · Electron backscatter diffraction (EBSD) measurement [1,2] is generally very useful in analyzing crystal morphology](https://img.pdfslide.net/doc/110x75/6020ac1488b59757b674b100/electron-backscatter-diffraction-crystal-2014-8-8-electron-backscatter-diffraction.jpg)