Embed Size (px)
Citation preview
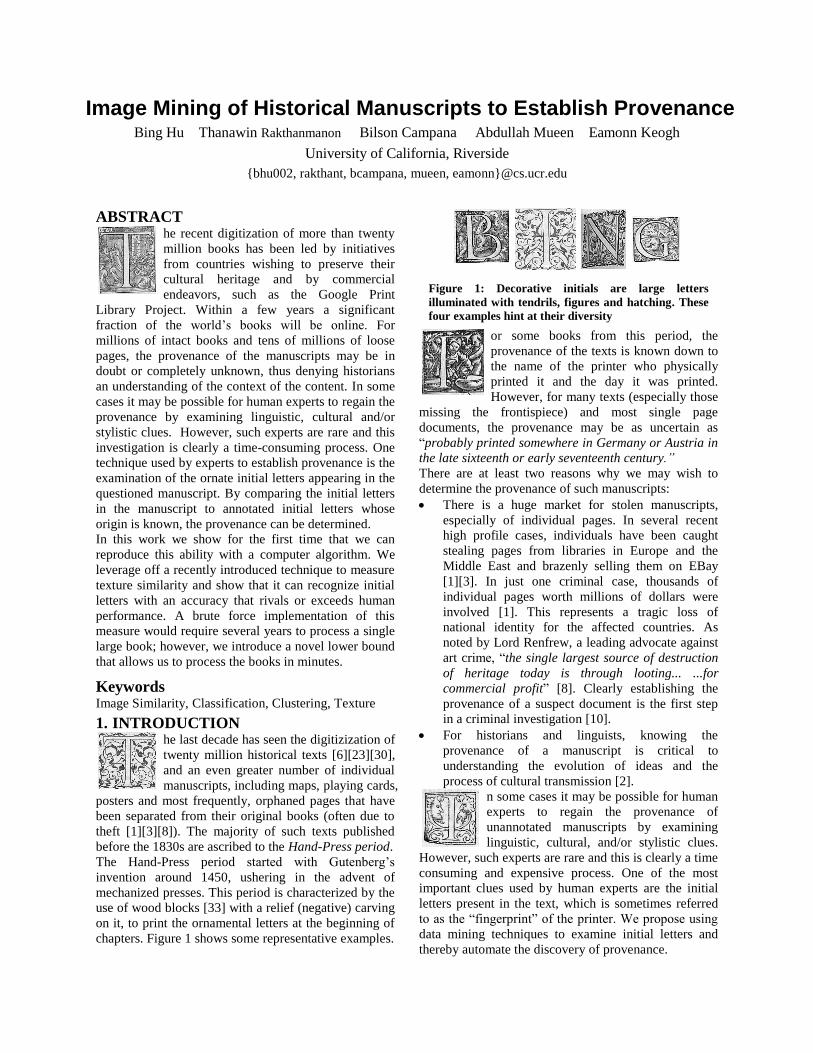
Image Mining of Historical Manuscripts to Establish Provenance Bing Hu Thanawin Rakthanmanon Bilson Campana Abdullah Mueen Eamonn Keogh
University of California, Riverside
{bhu002, rakthant, bcampana, mueen, eamonn}@cs.ucr.edu
ABSTRACT he recent digitization of more than twenty
million books has been led by initiatives
from countries wishing to preserve their
cultural heritage and by commercial
endeavors, such as the Google Print
Library Project. Within a few years a significant
fraction of the world’s books will be online. For
millions of intact books and tens of millions of loose
pages, the provenance of the manuscripts may be in
doubt or completely unknown, thus denying historians
an understanding of the context of the content. In some
cases it may be possible for human experts to regain the
provenance by examining linguistic, cultural and/or
stylistic clues. However, such experts are rare and this
investigation is clearly a time-consuming process. One
technique used by experts to establish provenance is the
examination of the ornate initial letters appearing in the
questioned manuscript. By comparing the initial letters
in the manuscript to annotated initial letters whose
origin is known, the provenance can be determined.
In this work we show for the first time that we can
reproduce this ability with a computer algorithm. We
leverage off a recently introduced technique to measure
texture similarity and show that it can recognize initial
letters with an accuracy that rivals or exceeds human
performance. A brute force implementation of this
measure would require several years to process a single
large book; however, we introduce a novel lower bound
that allows us to process the books in minutes.
Keywords Image Similarity, Classification, Clustering, Texture
1. INTRODUCTION he last decade has seen the digitizization of
twenty million historical texts [6][23][30],
and an even greater number of individual
manuscripts, including maps, playing cards,
posters and most frequently, orphaned pages that have
been separated from their original books (often due to
theft [1][3][8]). The majority of such texts published
before the 1830s are ascribed to the Hand-Press period.
The Hand-Press period started with Gutenberg’s
invention around 1450, ushering in the advent of
mechanized presses. This period is characterized by the
use of wood blocks [33] with a relief (negative) carving
on it, to print the ornamental letters at the beginning of
chapters. Figure 1 shows some representative examples.
Figure 1: Decorative initials are large letters
illuminated with tendrils, figures and hatching. These
four examples hint at their diversity
or some books from this period, the
provenance of the texts is known down to
the name of the printer who physically
printed it and the day it was printed.
However, for many texts (especially those
missing the frontispiece) and most single page
documents, the provenance may be as uncertain as
“probably printed somewhere in Germany or Austria in
the late sixteenth or early seventeenth century.”
There are at least two reasons why we may wish to
determine the provenance of such manuscripts:
There is a huge market for stolen manuscripts,
especially of individual pages. In several recent
high profile cases, individuals have been caught
stealing pages from libraries in Europe and the
Middle East and brazenly selling them on EBay
[1][3]. In just one criminal case, thousands of
individual pages worth millions of dollars were
involved [1]. This represents a tragic loss of
national identity for the affected countries. As
noted by Lord Renfrew, a leading advocate against
art crime, “the single largest source of destruction
of heritage today is through looting... ...for
commercial profit” [8]. Clearly establishing the
provenance of a suspect document is the first step
in a criminal investigation [10].
For historians and linguists, knowing the
provenance of a manuscript is critical to
understanding the evolution of ideas and the
process of cultural transmission [2].
n some cases it may be possible for human
experts to regain the provenance of
unannotated manuscripts by examining
linguistic, cultural, and/or stylistic clues.
However, such experts are rare and this is clearly a time
consuming and expensive process. One of the most
important clues used by human experts are the initial
letters present in the text, which is sometimes referred
to as the “fingerprint” of the printer. We propose using
data mining techniques to examine initial letters and
thereby automate the discovery of provenance.
The legal/technical model of fingerprint biometrics is
actually a good analogy for what we are proposing. It is
the computer’s task simply to eliminate the countless
true negatives and to bring to the attention of a human
expert a handful of candidate examples, hopefully
including any true positives.
This is essentially what we are proposing. In fact,
fingerprint biometrics is an example of impression
evidence [21] and initial letters are also literal examples
of impression evidence. Just as a person’s finger can
make multiple impressions during their lifetime, wood
blocks were also used to create multiple impressions
throughout their usage (which may have been several
decades or more). Likewise, fingerprint recognition
may be difficult because the two impressions we wish
to link may have been made decades apart; the finger
may have picked up additional scars or blemishes in the
interim. This is also true of our initial letters, which
receive constant wear and possibly occasional repairs
during their lifetime.
The obvious difference between our task and
fingerprint recognition is that the latter, because of its
legal and commercial importance, has received a huge
amount of research effort [21], whereas our task is
relatively understudied. As historical manuscript expert
Dr. Jean-Marc Ogier, who has spent over a decade
studying this problem recently bemoaned, “There is
little known on how to compute invariants for indexing
documents on this kind of features.” [22]
We have surveyed all the relevant literature
[5][9][11][22][25] and we argue that none of the current
techniques are able to scale to web sized collections of
manuscripts and, more critically, none of them are
likely to be accurate and robust enough for the task at
hand. While there is some tentative evidence of
accurate measures, there is also evidence that some of
the results can be attributed to careful cherry-picking of
test datasets, manual extraction of the initial letters,
careful parameter tuning and (perhaps) overfitting.
We propose to solve this problem by leveraging off a
recently introduced parameter-free distance measure
called the CK1 measure [7]. As we shall show, the CK1
measure is extraordinarily effective for matching
problems in historical manuscripts, with discrimination
abilities that rival human experts. While the CK1
measure is relatively efficient, a naive search method
based on it would take several months to test an entire
large book for the occurrence of a pattern; however, we
introduce in this work a novel lower bound that allows
us to process such books in hours or less.
The rest of this paper is organized as follows. In
Section 2, we introduce all the necessary definitions
and notation. In Section 3 we review the CK1 measure
that is at the heart of our technique. Section 4
introduces our lower bound algorithms for the CK1
measure and a search algorithm that exploits it. We
evaluate our ideas in Section 5 and offer conclusions
and directions for future work in Section 6.
2. DEFINITIONS AND NOTATION We begin by introducing all necessary notation and
definitions. Whether we are mining archives of books,
maps, single page manuscripts, etc., we can simply
generalize our data source as pages:
Definition 1: A page, P, is represented as an M × N
matrix. Each pixel of the page corresponds to an
element in the matrix, where M and N are the width
and height of the page, respectively.
As noted in [14], “Most classical methods (to process
historical manuscripts) need a binarization step.” Our
method does not require a binarization step to produce
high quality results. For example, the results reported
later in Figure 4 and Figure 12 used the original gray-
scale images. However, as we will show in Section 4,
we can exploit an internal binarized representation to
produce lower bounds to make our search algorithms
significantly faster. To binarize a page P we transform
the grayscale page into black or white using a simple
binary threshold filter [15].
To identify the provenance of an unlabeled page,
experts compare any existing initial letters, as shown in
Figure 1, in the page to the reference initial letters. We
call such reference initial letters annotated initial
letters.
Definition 2: Annotated initial letters are the initial
letters whose provenances have been firmly
established.
Because of the increasing interest in cultural heritage
there are many digital repositories that have huge
collections of carefully annotated initial letters [30].
Many of these sources have on the order of thousands
of annotated initial letters. Since the goal of our work is
to establish the provenance of historical manuscripts by
using just small sub-regions of a page containing initial
letters, we compare all candidate regions within a page
to the annotated initial letters. We call these small
regions windows.
Definition 3: A window W of pixels d is a rectangular
area inside a page.
{ | [ , ) [ , )},, ,
W d P i x x m j y y nx y i j
where m and n are the width and height of the
window, respectively.
The window size is determined by the size of the
annotated initial letters.
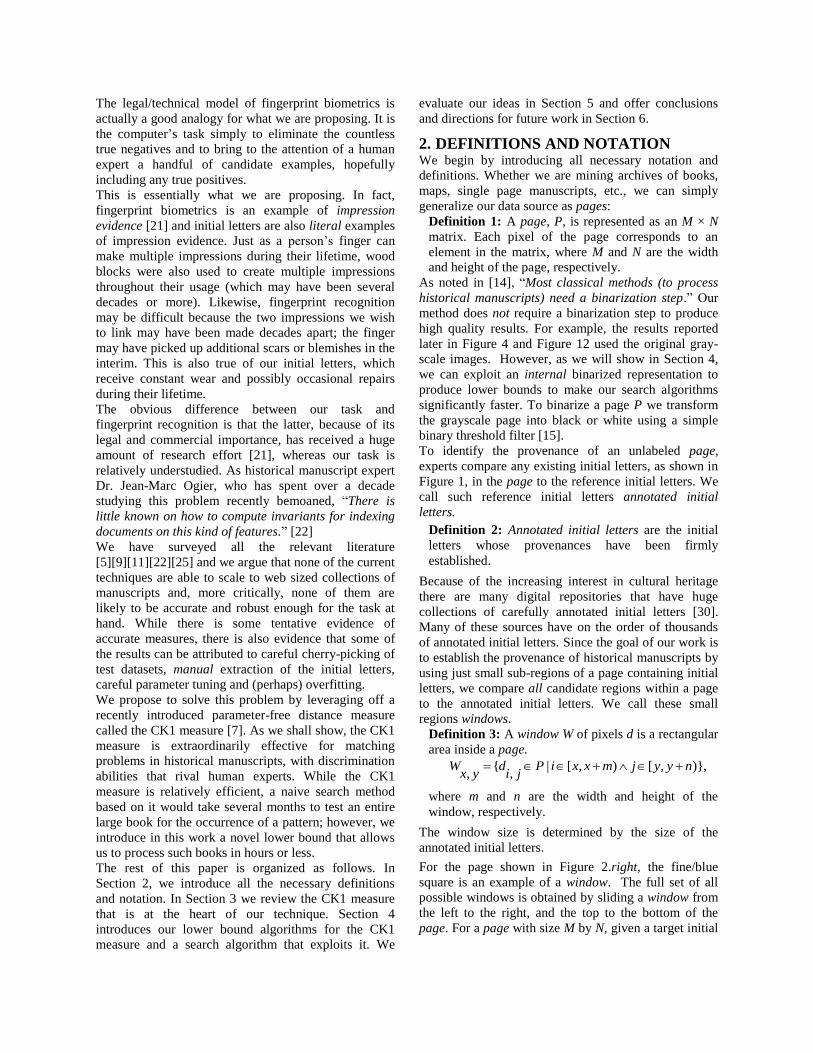
For the page shown in Figure 2.right, the fine/blue
square is an example of a window. The full set of all
possible windows is obtained by sliding a window from
the left to the right, and the top to the bottom of the
page. For a page with size M by N, given a target initial
letter size m by n, the number of windows is (M-m+1)
× (N-n+1).
Figure 2: left) The zoom-in of the bold/red box shown
in page from Comediae, published in 1552. right). The
bold/red box is the target, an initial letter. The
fine/blue box is a window
Note that while our choice of an axis parallel rectangle
as our primitive window shape is clearly based on how
wood block initial letters are typically presented, it is
not a limiting assumption. As we later show, our
algorithm is oblivious to minor violations of the axis-
parallel assumptions (such as the rotated letters shown
in Figure 12). Moreover, our algorithms can be
trivially adapted to be optimized to other shapes, such
as the typically round shape of Japanese mon (the
Japanese equivalent of European heraldic shields [34]).
At the heart of our provenance attribution scheme is the
ability to compare candidate windows with initial
letters from our reference library. We will use the
recently introduced CK1 distance measure [7] for this
task:
Definition 4: The distance between a window and an
annotated initial letter is denoted as dist(W, IL). Thus,
the distance is: dist(W, IL) = CK1_dist(W, IL)
In Section 3, we give a more detailed explanation of
how the CK1 distance measure works and our reasons
for using it rather than the dozens of rival techniques.
As hinted at above, while the CK1 measure can work
with either grayscale or binary images, for the purpose
of allowing lower bounding search, we need to use an
internal binarized representation. Note that this does not
preclude working directly with the grayscale images; it
is only the internal search algorithm that must work
with the internal binarized representation.
To support this internal representation, we define the
black pixel density of a window.
Definition 5: The black pixel density of a binarized
image is the total number of pixels that are ‘0’,
divided by the total number of pixels in this image.
Note that we assume that in a binary image, ‘0’
represents a black pixel and ‘1’ represents a white pixel.
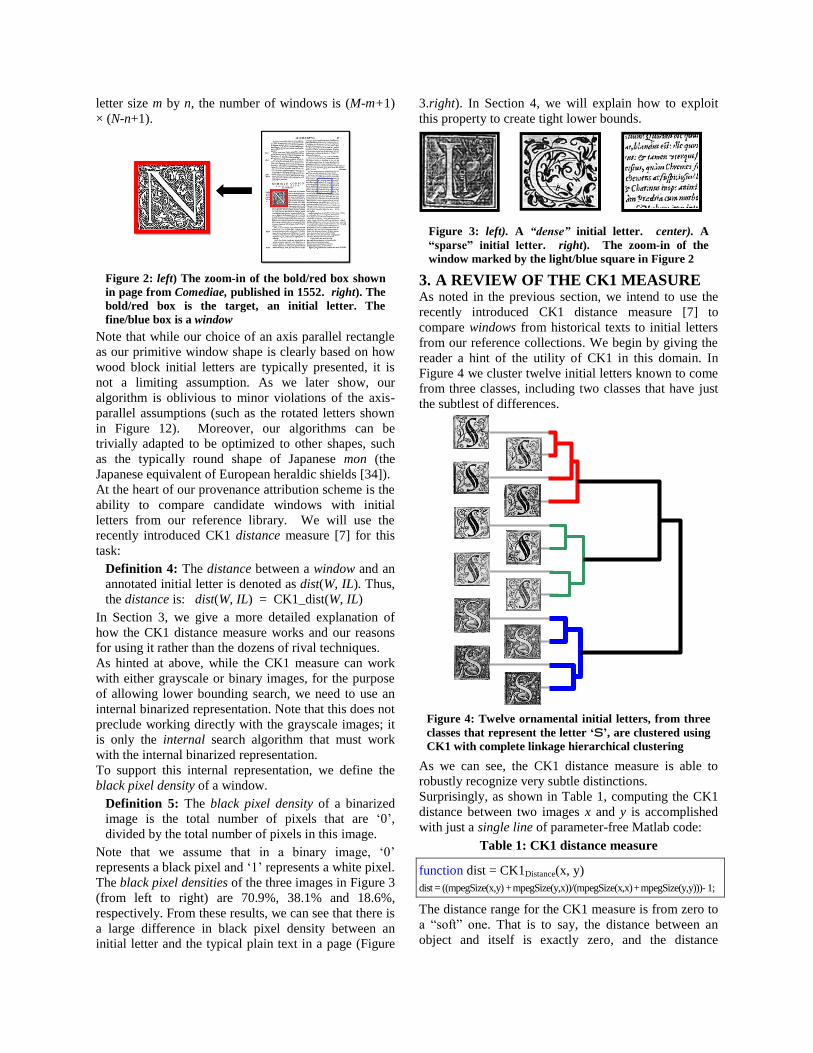
The black pixel densities of the three images in Figure 3
(from left to right) are 70.9%, 38.1% and 18.6%,
respectively. From these results, we can see that there is
a large difference in black pixel density between an
initial letter and the typical plain text in a page (Figure
3.right). In Section 4, we will explain how to exploit
this property to create tight lower bounds.
Figure 3: left). A “dense” initial letter. center). A
“sparse” initial letter. right). The zoom-in of the
window marked by the light/blue square in Figure 2
3. A REVIEW OF THE CK1 MEASURE As noted in the previous section, we intend to use the
recently introduced CK1 distance measure [7] to
compare windows from historical texts to initial letters
from our reference collections. We begin by giving the
reader a hint of the utility of CK1 in this domain. In
Figure 4 we cluster twelve initial letters known to come
from three classes, including two classes that have just
the subtlest of differences.
Figure 4: Twelve ornamental initial letters, from three
classes that represent the letter ‘S’, are clustered using
CK1 with complete linkage hierarchical clustering
As we can see, the CK1 distance measure is able to
robustly recognize very subtle distinctions.
Surprisingly, as shown in Table 1, computing the CK1
distance between two images x and y is accomplished
with just a single line of parameter-free Matlab code:
Table 1: CK1 distance measure
function dist = CK1Distance(x, y)
dist = ((mpegSize(x,y) + mpegSize(y,x))/(mpegSize(x,x) + mpegSize(y,y)))- 1;
The distance range for the CK1 measure is from zero to
a “soft” one. That is to say, the distance between an
object and itself is exactly zero, and the distance
between two very dissimilar objects is expected to be
one, but can be slightly larger.
We refer the reader to the original paper [7] for more
details on this measure. However, we briefly note that it
is a measure that follows the framework developed by
Li and Vitányi (and colleagues [20]) which states that
two objects can be considered similar if information
garnered from one can help compress the other [17].
There are three main reasons why we chose the CK1
distance measure over dozens of alternatives. First, it is
a parameter-free measure. Compared to parameter-
laden algorithms [25], the CK1 measure is more likely
to be adopted by historians who will be unable or
unwilling to carefully tune parameters. Second, as
shown by the original authors and confirmed by
experiments below, the CK1 measure is very accurate.
Thirdly, compared to other algorithms [9], the measure
is very robust to distortions on images. Historical
documents are often represented by a single surviving
instance and have a lot of variability. For example, the
images may be faded, printed with the rotation askew,
be inconsistently illuminated, have insect damage, be
poorly scanned, etc. As we shall show, the CK1
measure is largely robust to these variances.
3.1 Accuracy and Robustness of CK1 We claimed above that the CK1 measure is very
accurate and robust for our domain. This will be
implicitly shown in our experiments in Section 5, and
was hinted at in Figure 4. However, we take this
opportunity to explicitly demonstrate this here.
We have conducted an experiment 1 to illustrate how
well CK1 works as a distance measure in our domain.
Using a subset 2 of the dataset created by [4] which
contains nineteen classes of 16th
-century ornamental
letters, with 578 images (including those shown in
Figure 4), we conducted leave-one-out cross-validation
classification. The error rate is 0.00%. Recall that we
had no parameters to tune; thus, these results are highly
likely to generalize. As the largest class (the letter ‘A’)
has 82 members, the default error rate is 85.8%.
We also tried two rival approaches. One was
specifically designed for initial letters by a team with
more than a decade of experience working in this area
[9]. The error rate of that approach is 39.42%. The
second rival approach is based on the ubiquitous scale-
invariant feature transform (SIFT) algorithm [29].
While we are not aware of any papers that use SIFT for
initial letter classification, a very recent paper proposes
SIFT for the highly related task of segmenting historical
manuscripts (into margin, text, figures, initial letters,
1 We defer a detailed discussion of our experimental philosophy until
Section 5; however, we briefly note that all our experiments are
reproducible, and all code and data are available at [35].
2 Just the unique initial letters were deleted.
etc.) [12]. SIFT features (each of them is a 128-
dimensional vector) are first extracted from the query
and candidate images using Lowe’s SIFT algorithm
[19]. Then the number of matched features/key points is
used as the similarity measure between two images.
The more features that are matched, the more similar
two images are adjudged. The error rate of the leave-
one-out cross-validation classification when using SIFT
is 10.21%.
We note that we attempted just one SIFT-based
distance measure. While the literature is replete with
others, most of them require several parameters; this is
exactly what we are trying to avoid.
The time taken for SIFT and CK1 are commensurate
for this one-to-one matching problem3. However, as we
shall later show, for the similarity search (one-to-all)
problem we are interested in, we can speed up CK1 by
many orders of magnitude. It is less clear that SIFT
would yield to such optimizations.
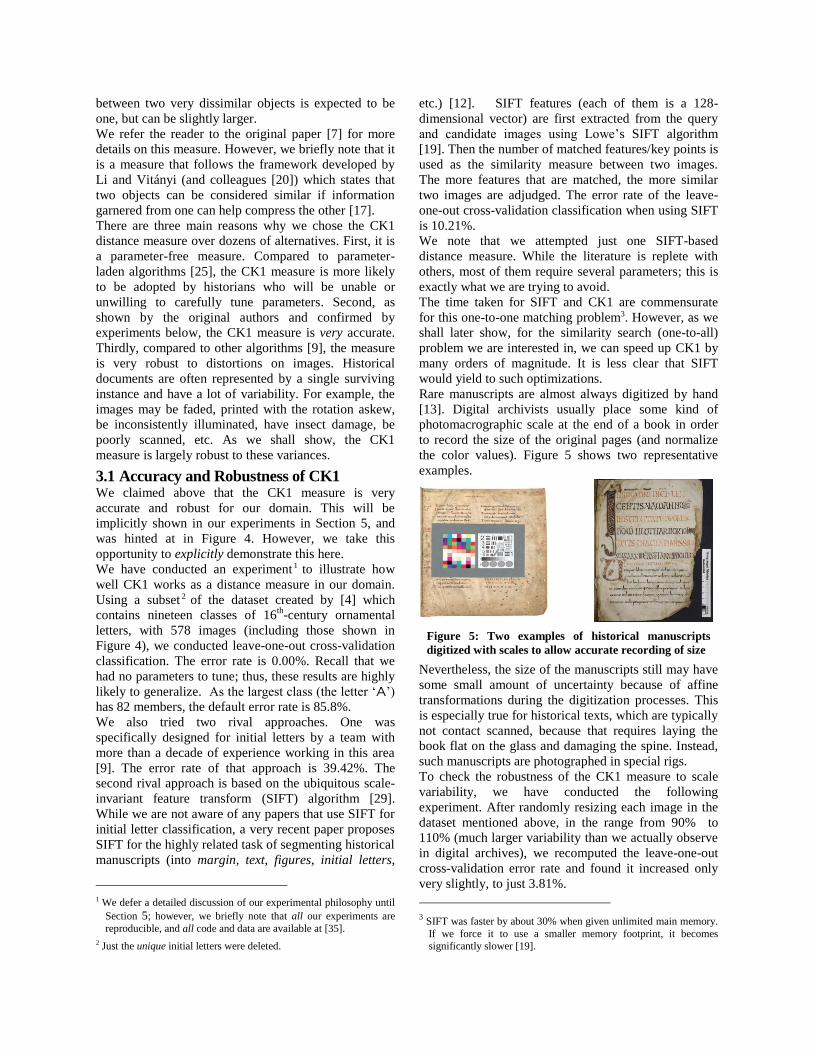
Rare manuscripts are almost always digitized by hand
[13]. Digital archivists usually place some kind of
photomacrographic scale at the end of a book in order
to record the size of the original pages (and normalize
the color values). Figure 5 shows two representative
examples.
Figure 5: Two examples of historical manuscripts
digitized with scales to allow accurate recording of size
Nevertheless, the size of the manuscripts still may have
some small amount of uncertainty because of affine
transformations during the digitization processes. This
is especially true for historical texts, which are typically
not contact scanned, because that requires laying the
book flat on the glass and damaging the spine. Instead,
such manuscripts are photographed in special rigs.
To check the robustness of the CK1 measure to scale
variability, we have conducted the following
experiment. After randomly resizing each image in the
dataset mentioned above, in the range from 90% to
110% (much larger variability than we actually observe
in digital archives), we recomputed the leave-one-out
cross-validation error rate and found it increased only
very slightly, to just 3.81%.
3 SIFT was faster by about 30% when given unlimited main memory.
If we force it to use a smaller memory footprint, it becomes
significantly slower [19].
A small amount of rotation invariance is also required
because the scanning process may have misaligned the
manuscript. The initial letter wood block itself may
have also been originally loose in the mold. We
frequently observe misalignments of up to five or six
degrees. We therefore have conducted an experiment to
check the robustness of the CK1 measure on rotation
variability. After randomly rotating each image
individually from +10 degrees to -10 degrees, the
classification error degrades to just 12.21%.
Before moving on, we will take a moment to emphasize
how surprisingly good these results are by visually
analyzing the dataset.
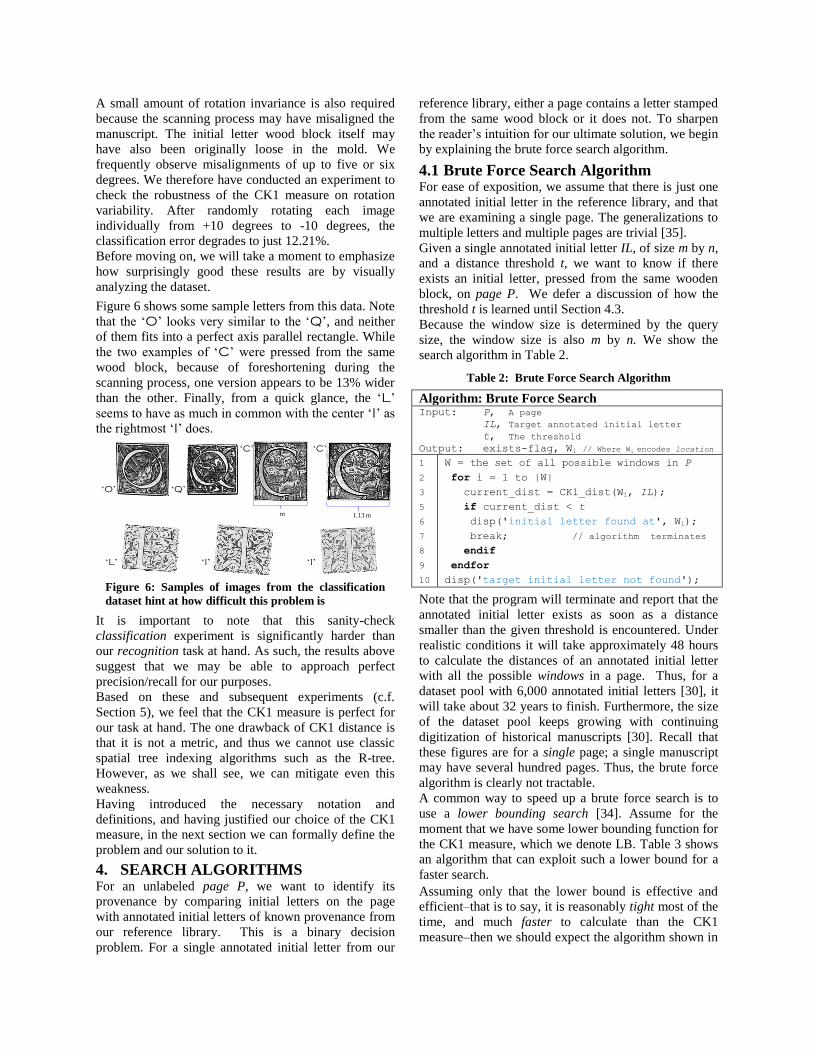
Figure 6 shows some sample letters from this data. Note
that the ‘O’ looks very similar to the ‘Q’, and neither
of them fits into a perfect axis parallel rectangle. While
the two examples of ‘C’ were pressed from the same
wood block, because of foreshortening during the
scanning process, one version appears to be 13% wider
than the other. Finally, from a quick glance, the ‘L’
seems to have as much in common with the center ‘I’ as
the rightmost ‘I’ does.
Figure 6: Samples of images from the classification
dataset hint at how difficult this problem is
It is important to note that this sanity-check
classification experiment is significantly harder than
our recognition task at hand. As such, the results above
suggest that we may be able to approach perfect
precision/recall for our purposes.
Based on these and subsequent experiments (c.f.
Section 5), we feel that the CK1 measure is perfect for
our task at hand. The one drawback of CK1 distance is
that it is not a metric, and thus we cannot use classic
spatial tree indexing algorithms such as the R-tree.
However, as we shall see, we can mitigate even this
weakness.
Having introduced the necessary notation and
definitions, and having justified our choice of the CK1
measure, in the next section we can formally define the
problem and our solution to it.
4. SEARCH ALGORITHMS For an unlabeled page P, we want to identify its
provenance by comparing initial letters on the page
with annotated initial letters of known provenance from
our reference library. This is a binary decision
problem. For a single annotated initial letter from our
reference library, either a page contains a letter stamped
from the same wood block or it does not. To sharpen
the reader’s intuition for our ultimate solution, we begin
by explaining the brute force search algorithm.
4.1 Brute Force Search Algorithm For ease of exposition, we assume that there is just one
annotated initial letter in the reference library, and that
we are examining a single page. The generalizations to
multiple letters and multiple pages are trivial [35].
Given a single annotated initial letter IL, of size m by n,
and a distance threshold t, we want to know if there
exists an initial letter, pressed from the same wooden
block, on page P. We defer a discussion of how the
threshold t is learned until Section 4.3.
Because the window size is determined by the query
size, the window size is also m by n. We show the
search algorithm in Table 2.
Table 2: Brute Force Search Algorithm
Algorithm: Brute Force Search Input: P, A page
IL, Target annotated initial letter
t, The threshold
Output: exists-flag, Wi // Where Wi encodes location
1
2
3
5
6
7
8
9
10
W = the set of all possible windows in P
for i = 1 to |W|
current_dist = CK1_dist(Wi, IL);
if current_dist < t
disp('initial letter found at', Wi);
break; // algorithm terminates
endif
endfor
disp('target initial letter not found');
Note that the program will terminate and report that the
annotated initial letter exists as soon as a distance
smaller than the given threshold is encountered. Under
realistic conditions it will take approximately 48 hours
to calculate the distances of an annotated initial letter
with all the possible windows in a page. Thus, for a
dataset pool with 6,000 annotated initial letters [30], it
will take about 32 years to finish. Furthermore, the size
of the dataset pool keeps growing with continuing
digitization of historical manuscripts [30]. Recall that
these figures are for a single page; a single manuscript
may have several hundred pages. Thus, the brute force
algorithm is clearly not tractable.
A common way to speed up a brute force search is to
use a lower bounding search [34]. Assume for the
moment that we have some lower bounding function for
the CK1 measure, which we denote LB. Table 3 shows
an algorithm that can exploit such a lower bound for a
faster search.
Assuming only that the lower bound is effective and
efficient–that is to say, it is reasonably tight most of the
time, and much faster to calculate than the CK1
measure–then we should expect the algorithm shown in
‘O’ ‘Q’
‘C’ ‘C’
m 1.13 m
‘L’ ‘I’
‘I’
‘I’
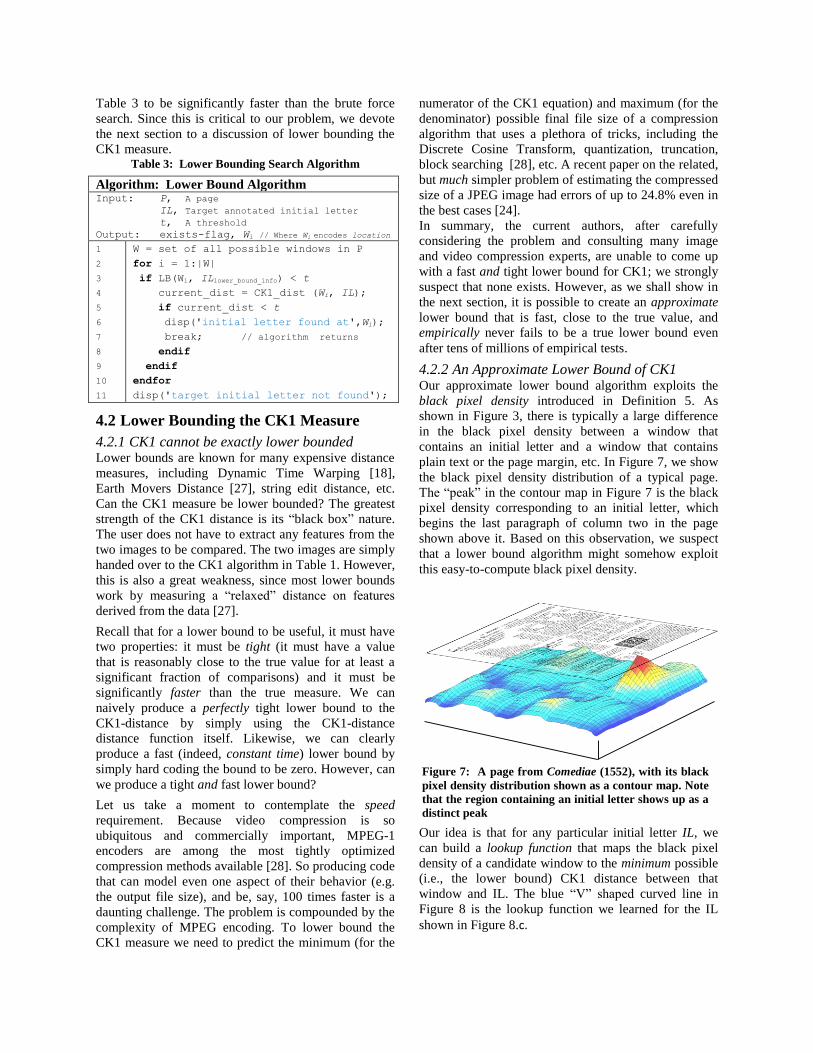
Table 3 to be significantly faster than the brute force
search. Since this is critical to our problem, we devote
the next section to a discussion of lower bounding the
CK1 measure. Table 3: Lower Bounding Search Algorithm
Algorithm: Lower Bound Algorithm Input: P, A page
IL, Target annotated initial letter
t, A threshold
Output: exists-flag, Wi // Where Wi encodes location
1
2
3
4
5
6
7
8
9
10
11
W = set of all possible windows in P
for i = 1:|W|
if LB(Wi, ILlower_bound_info) < t
current_dist = CK1_dist (Wi, IL);
if current_dist < t
disp('initial letter found at',Wi);
break; // algorithm returns
endif
endif
endfor
disp('target initial letter not found');
4.2 Lower Bounding the CK1 Measure
4.2.1 CK1 cannot be exactly lower bounded Lower bounds are known for many expensive distance
measures, including Dynamic Time Warping [18],
Earth Movers Distance [27], string edit distance, etc.
Can the CK1 measure be lower bounded? The greatest
strength of the CK1 distance is its “black box” nature.
The user does not have to extract any features from the
two images to be compared. The two images are simply
handed over to the CK1 algorithm in Table 1. However,
this is also a great weakness, since most lower bounds
work by measuring a “relaxed” distance on features
derived from the data [27].
Recall that for a lower bound to be useful, it must have
two properties: it must be tight (it must have a value
that is reasonably close to the true value for at least a
significant fraction of comparisons) and it must be
significantly faster than the true measure. We can
naively produce a perfectly tight lower bound to the
CK1-distance by simply using the CK1-distance
distance function itself. Likewise, we can clearly
produce a fast (indeed, constant time) lower bound by
simply hard coding the bound to be zero. However, can
we produce a tight and fast lower bound?
Let us take a moment to contemplate the speed
requirement. Because video compression is so
ubiquitous and commercially important, MPEG-1
encoders are among the most tightly optimized
compression methods available [28]. So producing code
that can model even one aspect of their behavior (e.g.
the output file size), and be, say, 100 times faster is a
daunting challenge. The problem is compounded by the
complexity of MPEG encoding. To lower bound the
CK1 measure we need to predict the minimum (for the
numerator of the CK1 equation) and maximum (for the
denominator) possible final file size of a compression
algorithm that uses a plethora of tricks, including the
Discrete Cosine Transform, quantization, truncation,
block searching [28], etc. A recent paper on the related,
but much simpler problem of estimating the compressed
size of a JPEG image had errors of up to 24.8% even in
the best cases [24].
In summary, the current authors, after carefully
considering the problem and consulting many image
and video compression experts, are unable to come up
with a fast and tight lower bound for CK1; we strongly
suspect that none exists. However, as we shall show in
the next section, it is possible to create an approximate
lower bound that is fast, close to the true value, and
empirically never fails to be a true lower bound even
after tens of millions of empirical tests.
4.2.2 An Approximate Lower Bound of CK1 Our approximate lower bound algorithm exploits the
black pixel density introduced in Definition 5. As
shown in Figure 3, there is typically a large difference
in the black pixel density between a window that
contains an initial letter and a window that contains
plain text or the page margin, etc. In Figure 7, we show
the black pixel density distribution of a typical page.
The “peak” in the contour map in Figure 7 is the black
pixel density corresponding to an initial letter, which
begins the last paragraph of column two in the page
shown above it. Based on this observation, we suspect
that a lower bound algorithm might somehow exploit
this easy-to-compute black pixel density.
Figure 7: A page from Comediae (1552), with its black
pixel density distribution shown as a contour map. Note
that the region containing an initial letter shows up as a
distinct peak
Our idea is that for any particular initial letter IL, we
can build a lookup function that maps the black pixel
density of a candidate window to the minimum possible
(i.e., the lower bound) CK1 distance between that
window and IL. The blue “V” shaped curved line in
Figure 8 is the lookup function we learned for the IL
shown in Figure 8.c.
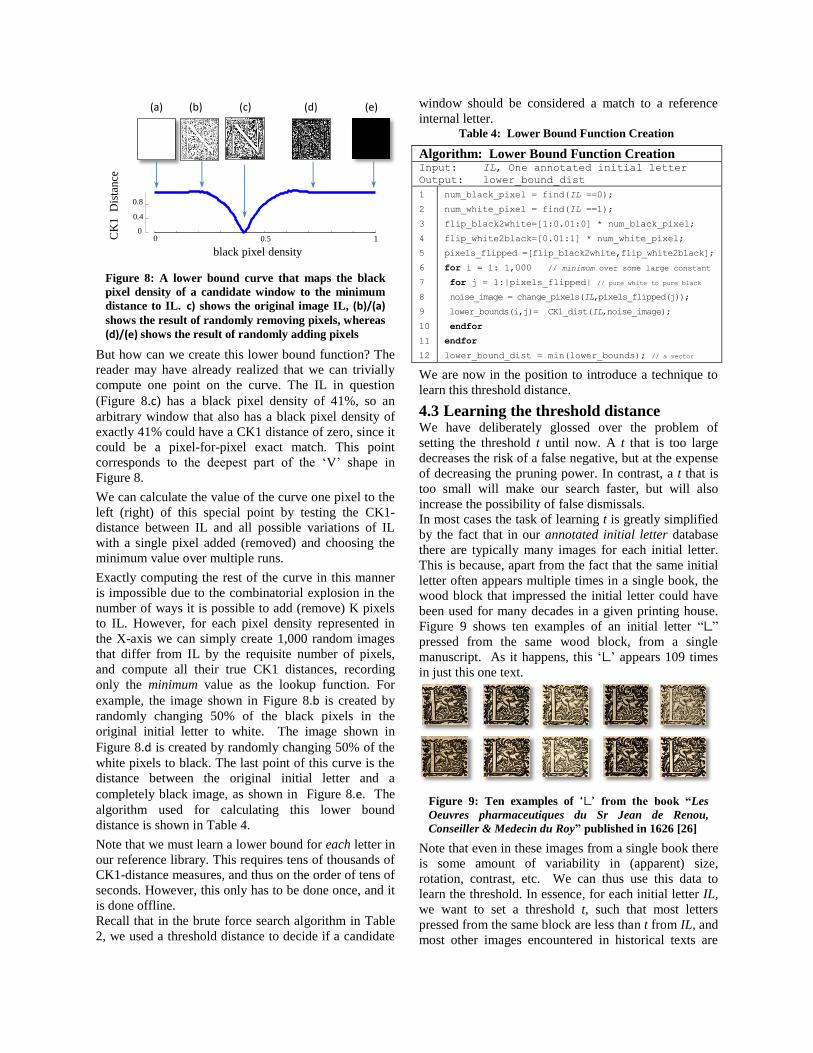
Figure 8: A lower bound curve that maps the black
pixel density of a candidate window to the minimum
distance to IL. c) shows the original image IL, (b)/(a) shows the result of randomly removing pixels, whereas
(d)/(e) shows the result of randomly adding pixels
But how can we create this lower bound function? The
reader may have already realized that we can trivially
compute one point on the curve. The IL in question
(Figure 8.c) has a black pixel density of 41%, so an
arbitrary window that also has a black pixel density of
exactly 41% could have a CK1 distance of zero, since it
could be a pixel-for-pixel exact match. This point
corresponds to the deepest part of the ‘V’ shape in
Figure 8.
We can calculate the value of the curve one pixel to the
left (right) of this special point by testing the CK1-
distance between IL and all possible variations of IL
with a single pixel added (removed) and choosing the
minimum value over multiple runs.
Exactly computing the rest of the curve in this manner
is impossible due to the combinatorial explosion in the
number of ways it is possible to add (remove) K pixels
to IL. However, for each pixel density represented in
the X-axis we can simply create 1,000 random images
that differ from IL by the requisite number of pixels,
and compute all their true CK1 distances, recording
only the minimum value as the lookup function. For
example, the image shown in Figure 8.b is created by
randomly changing 50% of the black pixels in the
original initial letter to white. The image shown in
Figure 8.d is created by randomly changing 50% of the
white pixels to black. The last point of this curve is the
distance between the original initial letter and a
completely black image, as shown in Figure 8.e. The
algorithm used for calculating this lower bound
distance is shown in Table 4.
Note that we must learn a lower bound for each letter in
our reference library. This requires tens of thousands of
CK1-distance measures, and thus on the order of tens of
seconds. However, this only has to be done once, and it
is done offline.
Recall that in the brute force search algorithm in Table
2, we used a threshold distance to decide if a candidate
window should be considered a match to a reference
internal letter. Table 4: Lower Bound Function Creation
Algorithm: Lower Bound Function Creation Input: IL, One annotated initial letter
Output: lower_bound_dist
1
2
3
4
5
6
7
8
9
10
11
12
num_black_pixel = find(IL ==0);
num_white_pixel = find(IL ==1);
flip_black2white=[1:0.01:0] * num_black_pixel;
flip_white2black=[0.01:1] * num_white_pixel;
pixels_flipped =[flip_black2white,flip_white2black];
for i = 1: 1,000 // minimum over some large constant
for j = 1:|pixels_flipped| // pure white to pure black
noise_image = change_pixels(IL,pixels_flipped(j));
lower_bounds(i,j)= CK1_dist(IL,noise_image);
endfor
endfor
lower_bound_dist = min(lower_bounds); // a vector
We are now in the position to introduce a technique to
learn this threshold distance.
4.3 Learning the threshold distance We have deliberately glossed over the problem of
setting the threshold t until now. A t that is too large
decreases the risk of a false negative, but at the expense
of decreasing the pruning power. In contrast, a t that is
too small will make our search faster, but will also
increase the possibility of false dismissals.
In most cases the task of learning t is greatly simplified
by the fact that in our annotated initial letter database
there are typically many images for each initial letter.
This is because, apart from the fact that the same initial
letter often appears multiple times in a single book, the
wood block that impressed the initial letter could have
been used for many decades in a given printing house.
Figure 9 shows ten examples of an initial letter “L”
pressed from the same wood block, from a single
manuscript. As it happens, this ‘L’ appears 109 times
in just this one text.
Figure 9: Ten examples of ‘L’ from the book “Les
Oeuvres pharmaceutiques du Sr Jean de Renou,
Conseiller & Medecin du Roy” published in 1626 [26]
Note that even in these images from a single book there
is some amount of variability in (apparent) size,
rotation, contrast, etc. We can thus use this data to
learn the threshold. In essence, for each initial letter IL,
we want to set a threshold t, such that most letters
pressed from the same block are less than t from IL, and
most other images encountered in historical texts are
(a) (b) (c) (d) (e)
0 0.5 10
0.4
0.8
black pixel density
CK
1
Dis
tance
greater than t. At first we imagined that this might
require careful tuning to balance the false positive/false
negative tradeoff. However, using the CK1 measure,
these two groups are so well separated that we can use a
simple method to assign t. We calculate the CK1
distances between all the annotated initials that are from
the same wood block. Then, the mean value of these
pairwise distances plus three standard deviations is
chosen as the threshold distance for all members of that
class. As discussed in Section 4.2.2, the blue/thick line
in Figure 8 is the lower bound distances for the initial
letter shown in Figure 8.c. This figure is augmented in
Figure 10 with a horizontal red/dashed line, which is
the threshold learned from the twenty-one examples of
the same ‘N’ from the book Comediae.
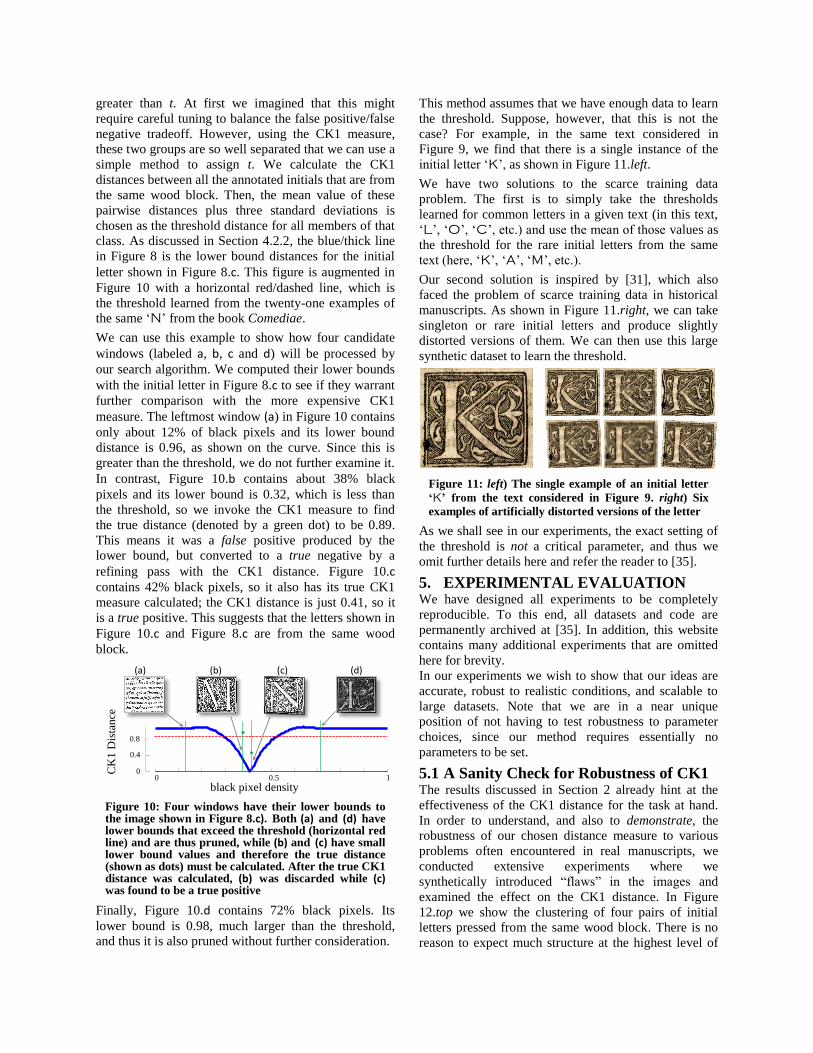
We can use this example to show how four candidate
windows (labeled a, b, c and d) will be processed by
our search algorithm. We computed their lower bounds
with the initial letter in Figure 8.c to see if they warrant
further comparison with the more expensive CK1
measure. The leftmost window (a) in Figure 10 contains
only about 12% of black pixels and its lower bound
distance is 0.96, as shown on the curve. Since this is
greater than the threshold, we do not further examine it.
In contrast, Figure 10.b contains about 38% black
pixels and its lower bound is 0.32, which is less than
the threshold, so we invoke the CK1 measure to find
the true distance (denoted by a green dot) to be 0.89.
This means it was a false positive produced by the
lower bound, but converted to a true negative by a
refining pass with the CK1 distance. Figure 10.c
contains 42% black pixels, so it also has its true CK1
measure calculated; the CK1 distance is just 0.41, so it
is a true positive. This suggests that the letters shown in
Figure 10.c and Figure 8.c are from the same wood
block.
Figure 10: Four windows have their lower bounds to the image shown in Figure 8.c). Both (a) and (d) have lower bounds that exceed the threshold (horizontal red line) and are thus pruned, while (b) and (c) have small lower bound values and therefore the true distance (shown as dots) must be calculated. After the true CK1 distance was calculated, (b) was discarded while (c) was found to be a true positive
Finally, Figure 10.d contains 72% black pixels. Its
lower bound is 0.98, much larger than the threshold,
and thus it is also pruned without further consideration.
This method assumes that we have enough data to learn
the threshold. Suppose, however, that this is not the
case? For example, in the same text considered in
Figure 9, we find that there is a single instance of the
initial letter ‘K’, as shown in Figure 11.left.
We have two solutions to the scarce training data
problem. The first is to simply take the thresholds
learned for common letters in a given text (in this text,
‘L’, ‘O’, ‘C’, etc.) and use the mean of those values as
the threshold for the rare initial letters from the same
text (here, ‘K’, ‘A’, ‘M’, etc.).
Our second solution is inspired by [31], which also
faced the problem of scarce training data in historical
manuscripts. As shown in Figure 11.right, we can take
singleton or rare initial letters and produce slightly
distorted versions of them. We can then use this large
synthetic dataset to learn the threshold.
Figure 11: left) The single example of an initial letter
‘K’ from the text considered in Figure 9. right) Six
examples of artificially distorted versions of the letter
As we shall see in our experiments, the exact setting of
the threshold is not a critical parameter, and thus we
omit further details here and refer the reader to [35].
5. EXPERIMENTAL EVALUATION We have designed all experiments to be completely
reproducible. To this end, all datasets and code are
permanently archived at [35]. In addition, this website
contains many additional experiments that are omitted
here for brevity.
In our experiments we wish to show that our ideas are
accurate, robust to realistic conditions, and scalable to
large datasets. Note that we are in a near unique
position of not having to test robustness to parameter
choices, since our method requires essentially no
parameters to be set.
5.1 A Sanity Check for Robustness of CK1 The results discussed in Section 2 already hint at the
effectiveness of the CK1 distance for the task at hand.
In order to understand, and also to demonstrate, the
robustness of our chosen distance measure to various
problems often encountered in real manuscripts, we
conducted extensive experiments where we
synthetically introduced “flaws” in the images and
examined the effect on the CK1 distance. In Figure
12.top we show the clustering of four pairs of initial
letters pressed from the same wood block. There is no
reason to expect much structure at the highest level of
(a)
0 0.5 10
0.4
0.8
CK
1 D
ista
nce
(b) (c) (d)
black pixel density
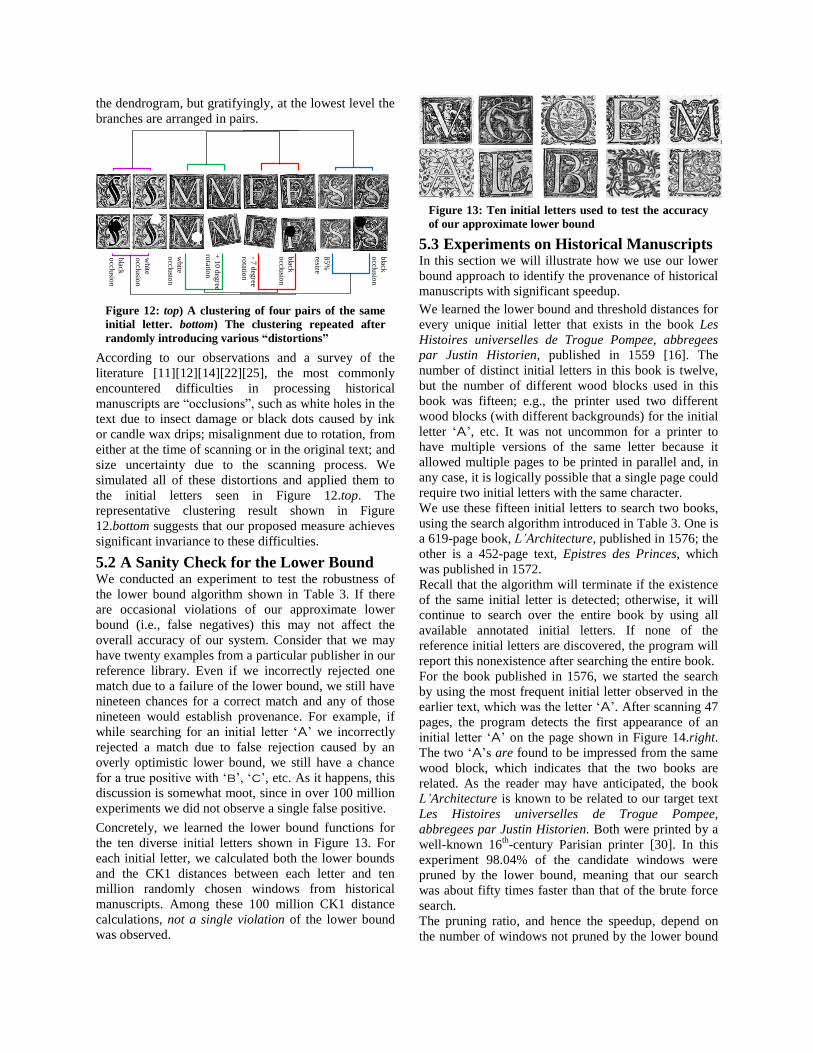
the dendrogram, but gratifyingly, at the lowest level the
branches are arranged in pairs.
Figure 12: top) A clustering of four pairs of the same
initial letter. bottom) The clustering repeated after
randomly introducing various “distortions”
According to our observations and a survey of the
literature [11][12][14][22][25], the most commonly
encountered difficulties in processing historical
manuscripts are “occlusions”, such as white holes in the
text due to insect damage or black dots caused by ink
or candle wax drips; misalignment due to rotation, from
either at the time of scanning or in the original text; and
size uncertainty due to the scanning process. We
simulated all of these distortions and applied them to
the initial letters seen in Figure 12.top. The
representative clustering result shown in Figure
12.bottom suggests that our proposed measure achieves
significant invariance to these difficulties.
5.2 A Sanity Check for the Lower Bound We conducted an experiment to test the robustness of
the lower bound algorithm shown in Table 3. If there
are occasional violations of our approximate lower
bound (i.e., false negatives) this may not affect the
overall accuracy of our system. Consider that we may
have twenty examples from a particular publisher in our
reference library. Even if we incorrectly rejected one
match due to a failure of the lower bound, we still have
nineteen chances for a correct match and any of those
nineteen would establish provenance. For example, if
while searching for an initial letter ‘A’ we incorrectly
rejected a match due to false rejection caused by an
overly optimistic lower bound, we still have a chance
for a true positive with ‘b’, ‘c’, etc. As it happens, this
discussion is somewhat moot, since in over 100 million
experiments we did not observe a single false positive.
Concretely, we learned the lower bound functions for
the ten diverse initial letters shown in Figure 13. For
each initial letter, we calculated both the lower bounds
and the CK1 distances between each letter and ten
million randomly chosen windows from historical
manuscripts. Among these 100 million CK1 distance
calculations, not a single violation of the lower bound
was observed.
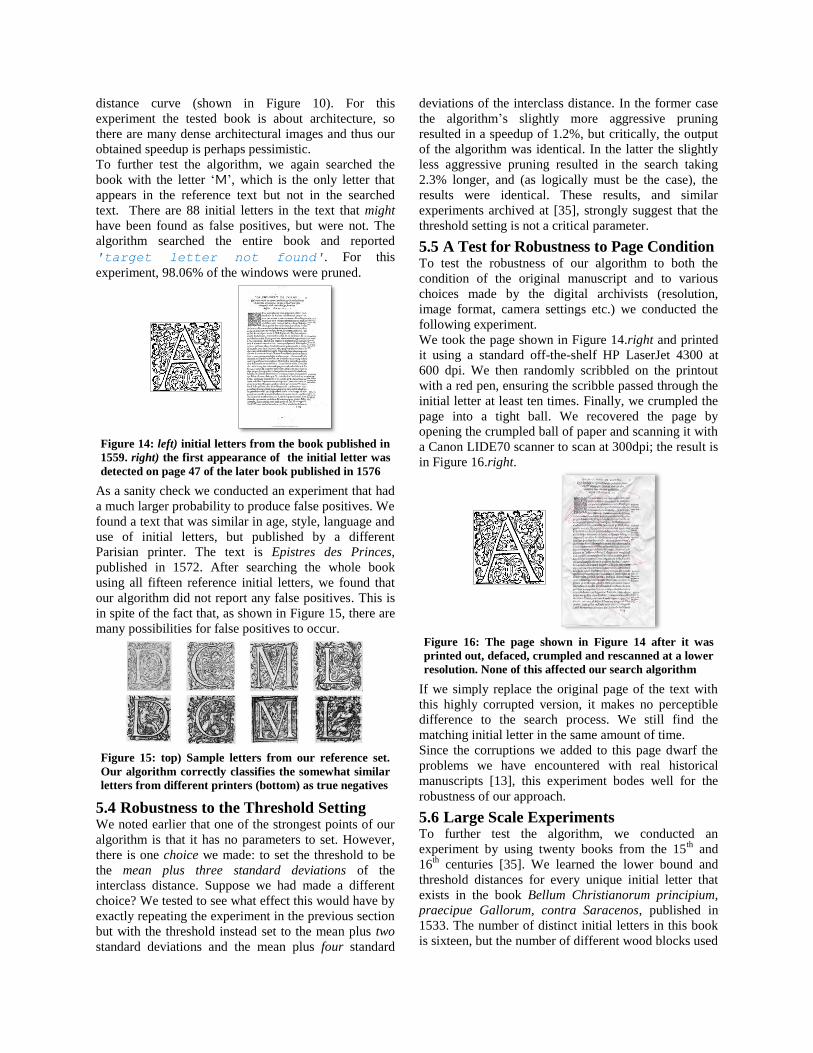
Figure 13: Ten initial letters used to test the accuracy
of our approximate lower bound
5.3 Experiments on Historical Manuscripts In this section we will illustrate how we use our lower
bound approach to identify the provenance of historical
manuscripts with significant speedup.
We learned the lower bound and threshold distances for
every unique initial letter that exists in the book Les
Histoires universelles de Trogue Pompee, abbregees
par Justin Historien, published in 1559 [16]. The
number of distinct initial letters in this book is twelve,
but the number of different wood blocks used in this
book was fifteen; e.g., the printer used two different
wood blocks (with different backgrounds) for the initial
letter ‘A’, etc. It was not uncommon for a printer to
have multiple versions of the same letter because it
allowed multiple pages to be printed in parallel and, in
any case, it is logically possible that a single page could
require two initial letters with the same character.
We use these fifteen initial letters to search two books,
using the search algorithm introduced in Table 3. One is
a 619-page book, L’Architecture, published in 1576; the
other is a 452-page text, Epistres des Princes, which
was published in 1572.
Recall that the algorithm will terminate if the existence
of the same initial letter is detected; otherwise, it will
continue to search over the entire book by using all
available annotated initial letters. If none of the
reference initial letters are discovered, the program will
report this nonexistence after searching the entire book.
For the book published in 1576, we started the search
by using the most frequent initial letter observed in the
earlier text, which was the letter ‘A’. After scanning 47
pages, the program detects the first appearance of an
initial letter ‘A’ on the page shown in Figure 14.right.
The two ‘A’s are found to be impressed from the same
wood block, which indicates that the two books are
related. As the reader may have anticipated, the book
L’Architecture is known to be related to our target text
Les Histoires universelles de Trogue Pompee,
abbregees par Justin Historien. Both were printed by a
well-known 16th
-century Parisian printer [30]. In this
experiment 98.04% of the candidate windows were
pruned by the lower bound, meaning that our search
was about fifty times faster than that of the brute force
search.
The pruning ratio, and hence the speedup, depend on
the number of windows not pruned by the lower bound
white
occlu
sion
black
occlu
sion
white
occlu
sion
+ 1
0 d
egree
rotatio
n
-7 d
egree
rotatio
n
black
occlu
sion
85%
resize
black
occlu
sion
distance curve (shown in Figure 10). For this
experiment the tested book is about architecture, so
there are many dense architectural images and thus our
obtained speedup is perhaps pessimistic.
To further test the algorithm, we again searched the
book with the letter ‘M’, which is the only letter that
appears in the reference text but not in the searched
text. There are 88 initial letters in the text that might
have been found as false positives, but were not. The
algorithm searched the entire book and reported
'target letter not found'. For this
experiment, 98.06% of the windows were pruned.
Figure 14: left) initial letters from the book published in
1559. right) the first appearance of the initial letter was
detected on page 47 of the later book published in 1576
As a sanity check we conducted an experiment that had
a much larger probability to produce false positives. We
found a text that was similar in age, style, language and
use of initial letters, but published by a different
Parisian printer. The text is Epistres des Princes, published in 1572. After searching the whole book
using all fifteen reference initial letters, we found that
our algorithm did not report any false positives. This is
in spite of the fact that, as shown in Figure 15, there are
many possibilities for false positives to occur.
Figure 15: top) Sample letters from our reference set.
Our algorithm correctly classifies the somewhat similar
letters from different printers (bottom) as true negatives
5.4 Robustness to the Threshold Setting We noted earlier that one of the strongest points of our
algorithm is that it has no parameters to set. However,
there is one choice we made: to set the threshold to be
the mean plus three standard deviations of the
interclass distance. Suppose we had made a different
choice? We tested to see what effect this would have by
exactly repeating the experiment in the previous section
but with the threshold instead set to the mean plus two
standard deviations and the mean plus four standard
deviations of the interclass distance. In the former case
the algorithm’s slightly more aggressive pruning
resulted in a speedup of 1.2%, but critically, the output
of the algorithm was identical. In the latter the slightly
less aggressive pruning resulted in the search taking
2.3% longer, and (as logically must be the case), the
results were identical. These results, and similar
experiments archived at [35], strongly suggest that the
threshold setting is not a critical parameter.
5.5 A Test for Robustness to Page Condition To test the robustness of our algorithm to both the
condition of the original manuscript and to various
choices made by the digital archivists (resolution,
image format, camera settings etc.) we conducted the
following experiment.
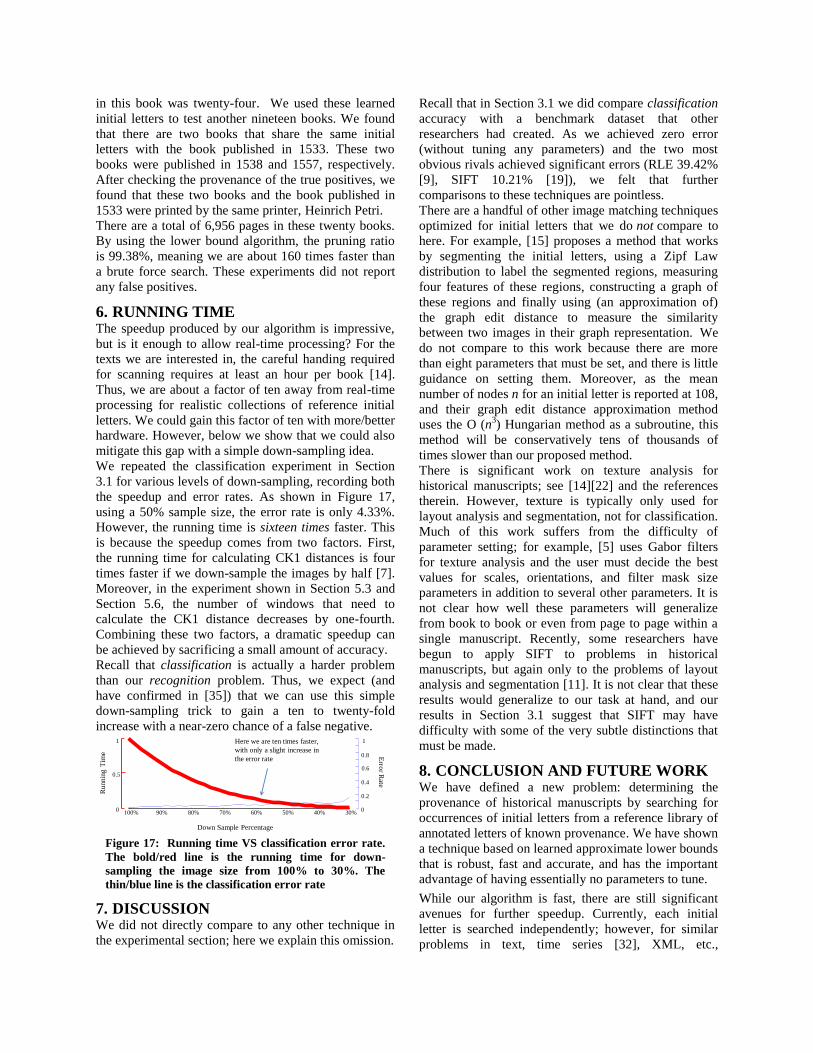
We took the page shown in Figure 14.right and printed
it using a standard off-the-shelf HP LaserJet 4300 at
600 dpi. We then randomly scribbled on the printout
with a red pen, ensuring the scribble passed through the
initial letter at least ten times. Finally, we crumpled the
page into a tight ball. We recovered the page by
opening the crumpled ball of paper and scanning it with
a Canon LIDE70 scanner to scan at 300dpi; the result is
in Figure 16.right.
Figure 16: The page shown in Figure 14 after it was
printed out, defaced, crumpled and rescanned at a lower
resolution. None of this affected our search algorithm
If we simply replace the original page of the text with
this highly corrupted version, it makes no perceptible
difference to the search process. We still find the
matching initial letter in the same amount of time.
Since the corruptions we added to this page dwarf the
problems we have encountered with real historical
manuscripts [13], this experiment bodes well for the
robustness of our approach.
5.6 Large Scale Experiments To further test the algorithm, we conducted an
experiment by using twenty books from the 15th
and
16th
centuries [35]. We learned the lower bound and
threshold distances for every unique initial letter that
exists in the book Bellum Christianorum principium,
praecipue Gallorum, contra Saracenos, published in
1533. The number of distinct initial letters in this book
is sixteen, but the number of different wood blocks used
in this book was twenty-four. We used these learned
initial letters to test another nineteen books. We found
that there are two books that share the same initial
letters with the book published in 1533. These two
books were published in 1538 and 1557, respectively.
After checking the provenance of the true positives, we
found that these two books and the book published in
1533 were printed by the same printer, Heinrich Petri.
There are a total of 6,956 pages in these twenty books.
By using the lower bound algorithm, the pruning ratio
is 99.38%, meaning we are about 160 times faster than
a brute force search. These experiments did not report
any false positives.
6. RUNNING TIME The speedup produced by our algorithm is impressive,
but is it enough to allow real-time processing? For the
texts we are interested in, the careful handing required
for scanning requires at least an hour per book [14].
Thus, we are about a factor of ten away from real-time
processing for realistic collections of reference initial
letters. We could gain this factor of ten with more/better
hardware. However, below we show that we could also
mitigate this gap with a simple down-sampling idea.
We repeated the classification experiment in Section
3.1 for various levels of down-sampling, recording both
the speedup and error rates. As shown in Figure 17,
using a 50% sample size, the error rate is only 4.33%.
However, the running time is sixteen times faster. This
is because the speedup comes from two factors. First,
the running time for calculating CK1 distances is four
times faster if we down-sample the images by half [7].
Moreover, in the experiment shown in Section 5.3 and
Section 5.6, the number of windows that need to
calculate the CK1 distance decreases by one-fourth.
Combining these two factors, a dramatic speedup can
be achieved by sacrificing a small amount of accuracy.
Recall that classification is actually a harder problem
than our recognition problem. Thus, we expect (and
have confirmed in [35]) that we can use this simple
down-sampling trick to gain a ten to twenty-fold
increase with a near-zero chance of a false negative.
Figure 17: Running time VS classification error rate.
The bold/red line is the running time for down-
sampling the image size from 100% to 30%. The
thin/blue line is the classification error rate
7. DISCUSSION We did not directly compare to any other technique in
the experimental section; here we explain this omission.
Recall that in Section 3.1 we did compare classification
accuracy with a benchmark dataset that other
researchers had created. As we achieved zero error
(without tuning any parameters) and the two most
obvious rivals achieved significant errors (RLE 39.42%
[9], SIFT 10.21% [19]), we felt that further
comparisons to these techniques are pointless.
There are a handful of other image matching techniques
optimized for initial letters that we do not compare to
here. For example, [15] proposes a method that works
by segmenting the initial letters, using a Zipf Law
distribution to label the segmented regions, measuring
four features of these regions, constructing a graph of
these regions and finally using (an approximation of)
the graph edit distance to measure the similarity
between two images in their graph representation. We
do not compare to this work because there are more
than eight parameters that must be set, and there is little
guidance on setting them. Moreover, as the mean
number of nodes n for an initial letter is reported at 108,
and their graph edit distance approximation method
uses the O (n3) Hungarian method as a subroutine, this
method will be conservatively tens of thousands of
times slower than our proposed method.
There is significant work on texture analysis for
historical manuscripts; see [14][22] and the references
therein. However, texture is typically only used for
layout analysis and segmentation, not for classification.
Much of this work suffers from the difficulty of
parameter setting; for example, [5] uses Gabor filters
for texture analysis and the user must decide the best
values for scales, orientations, and filter mask size
parameters in addition to several other parameters. It is
not clear how well these parameters will generalize
from book to book or even from page to page within a
single manuscript. Recently, some researchers have
begun to apply SIFT to problems in historical
manuscripts, but again only to the problems of layout
analysis and segmentation [11]. It is not clear that these
results would generalize to our task at hand, and our
results in Section 3.1 suggest that SIFT may have
difficulty with some of the very subtle distinctions that
must be made.
8. CONCLUSION AND FUTURE WORK We have defined a new problem: determining the
provenance of historical manuscripts by searching for
occurrences of initial letters from a reference library of
annotated letters of known provenance. We have shown
a technique based on learned approximate lower bounds
that is robust, fast and accurate, and has the important
advantage of having essentially no parameters to tune.
While our algorithm is fast, there are still significant
avenues for further speedup. Currently, each initial
letter is searched independently; however, for similar
problems in text, time series [32], XML, etc.,
Ru
nnin
g T
ime E
rror R
ate
100% 90% 80% 70% 60% 50% 40% 30%0 0
0.2
0.4
0.6
0.8
1
Down Sample Percentage
0.5
1Here we are ten times faster,
with only a slight increase in
the error rate
researchers have shown that it is possible to group
together similar elements (for example, grouping ‘O’
and ‘Q’, then conducting a single search for the group
representative). This idea may be tenable with some
modifications for our (nonmetric) CK1 measure.
We also plan to explore other possible uses of
empirically learned approximate lower bounds.
Finally, we have made all code and datasets publicly
available [35] in order to encourage replication and
extension of our results, and possible adoption of our
ideas for other historical manuscript data mining tasks.
9. ACKNOWLEDGMENTS
We thank all the digital archivists who produced the
vast amounts of data that made this work possible, and
Dr. Ioanna Kakoulli of UCLA for inspiring this effort
and pointing to relevant literature. This work was
funded by NSF awards 0803410 and 0808770.
10. REFERENCES [1] K. Alderman, Thieves Take a Page Out of Rare Books
and Manuscripts, ART & CULTURAL HERITAGE L. NEWSL.
Vol I, Issue V, Spring 2009.
[2] S. Atran, J. Henrich, The Evolution of Religion: How
Cognitive by‐products, Adaptive Learning Heuristics,
Ritual Displays, and Group Competition Generate Deep
Commitments to Prosocial Religions. Biological Theory:
Integrating Development, Evolution, and Cognition, 5,
pp.18‐30, 2010.
[3] E. Bronner, Stolen Manuscripts Plague Israeli Archives.
New York Times. August 20th, 2008.
[4] E. Baudrier, S. Busson, S. Corsini, M. Delalandre, J.
Landre, F. Morain-Nicolier, Retrieval of the Ornaments
from the Hand-Press Period: An Overview, 10th ICDAR
2009.
[5] P. Basa, P. S. Sabari, R. Nishikanta, A.G Ramakrishnan,
Gabor Filters for Document Analysis in Indian Bilingual
Documents, International Conference on Intelligent
Sensing and Information Processing, pp.123-126, 2004.
[6] Consortium of European Research Libraries
www.cerl.org/web/ 2011.
[7] B. Campana, E. Keogh, A Compression Based Distance
Measure for Texture, SDM, 2010.
[8] S. Calvani, Frequency and Figures Of Organised Crime
In Art And Antiquities, ISPAC Conference, 2008.
[9] M. Delalandre, J. M. Ogier, and J. Llados, A Fast CBIR
System of Old Ornamental Letter, Workshop on
Graphics Recognition, LNCS, pp. 135–144, 2008.
[10] INTERPOL, Stolen Works of Art. (Accessed 7th July
2011). www.interpol.int/Public/WorkOfArt/woafaq.asp
[11] A. Garz, M. Diem, R. Sablatnig, Local Descriptors for
Document Layout Analysis. In Proc’ of Addison-Wesley
series in statistics., pp. 29-38, 2010.
[12] A. Garz, M. Diem, R. Sablatnig, Layout Analysis of
Ancient Manuscripts Using Local Features. In
Eikonopoiia. Digital Imaging of Ancient Textual
Heritage, 2011.
[13] Ancient Greek Manuscripts Hit the Internet,
www.foxnews.com/scitech/2010/09/27/british-library-
posts-greek-manuscripts-web/
[14] N. Journet, V. Eglin, J.Y Ramel, R. Mullot, Dedicated
Texture Based Tools For Characterisation Of Old Books.
In Proceedings of the 2nd DIAL, April, 2006.
[15] S. Jouili, M. Coustaty, S. Tabbone, J. M. Ogier,
NAVIDOMASS: Structural-Based Approaches Towards
Handling Historical Documents. ICPR, pp. 946-959,
2010.
[16] T. P. Justin. Histoire universelle de Trogues Pompée,
réduite en abrégé par Justin. 1559.
[17] E. Keogh, S. Lonardi, C. A. Ratanamahatana, L. Wei, S.
Lee, J. Handley, Compression-Based Data Mining of
Sequential Data, DMKD. 14(1), pp. 99-129, 2007.
[18] E. Keogh: Exact Indexing of Dynamic Time Warping.
VLDB, pp.406-417, 2002.
[19] D. G. Lowe. Distinctive Image Features from Scale-
Invariant Key Point, International Journal of Computer
Vision, vol. 60, pp. 91-110, 2004.
[20] M. Li, X. Chen, X. Li, B. Ma, Paul M. B. Vitányi: The
Similarity Metric. IEEE Transactions on Information
Theory (TIT) 50 (12): 3250-3264 2004.
[21] D. Maltoni, D. Maio, A. K. Jain, and S. Prabhakar,
Handbook of Fingerprint Recognition, Springer 2003.
[22] J. M. Ogier, K. Tombre, Document Image Analysis
Techniques for Cultural Heritage Documents,
Proceedings of 1st EVA Conference, pp 107–114, 2006.
[23] Ornaments typographical, www.ornements-typo-
mouriau.be/
[24] S. Pigeon, S. Coulombe: Very Low Cost Algorithms for
Predicting the File Size of JPEG Images. DCC, pp.538, 2008.
[25] J. Y. Ramel, S. Leriche, M. L. Demonet, S. Busson,
User-Driven Page Layout Analysis of Historical Printed
Books, IJDAR, pp. 243–261, 2007.
[26] J. Renou, Les Oeuvres Pharmaceutiques du Sr Jean de
Renou, Conseiller & Medecin du Roy. 1626.
[27] Y. Rubner, C. Tomasi, L. Guibas, A Metric for
Distributions with Applications To Image Databases. In
Proceedings of the IEEE ICCV pp. 59–66, 1998.
[28] Q. Tang, P. Nasiopoulos, Efficient Motion Re-Estimation
with Rate-Distortion Optimization for MPEG-2 to
H.264/AVC Transcoding. IEEE Trans. Circuits Syst.
Video Techn. 20. pp. 262-74, 2010.
[29] A. Vedaldi (2011). www.vlfeat.org/~vedaldi/index.html
[30] Virtual Library Humanist Program
www.bvh.univ-tours.fr/index.htm. 2011.
[31] X. Wang, L. Ye, E. J. Keogh, C. R. Shelton, Annotating
Historical Archives of Images, JCDL, pp. 341-350, 2008.
[32] L. Wei, E. Keogh, H. Van Herle, A. Mafra-Neto: Atomic
Wedgie: Efficient Query Filtering for Streaming Times
Series. ICDM, 2005.
[33] Victoria and Albert Museum: Woodcut Printing (video)
www.youtube.com/watch?v=mgCYovlFRNY
[34] Q. Zhu, E. Keogh, Mother Fugger: Mining Historical
Manuscripts with Local Color Patches. ICDM, 2010.
[35] B. Hu, supporting URL for this paper ,
www.cs.ucr.edu/~bhu002/IL/IL.html 2011.