Embed Size (px)
Citation preview
© 2008 Takahashi et al, publisher and licensee Dove Medical Press Ltd. This is an Open Access article which permits unrestricted noncommercial use, provided the original work is properly cited.
International Journal of COPD 2008:3(2) 193–204 193
R E V I E W
Imaging of pulmonary emphysema: A pictorial review
Masashi Takahashi1
Junya Fukuoka2
Norihisa Nitta1
Ryutaro Takazakura1
Yukihiro Nagatani1
Yoko Murakami1
Hideji Otani1
Kiyoshi Murata1
1Department of Radiology, Shiga University of Medical Science, Shiga, Japan; 2Laboratory of Pathology, Toyama University Hospital, Toyama, Japan
Correspondence: Masashi TakahashiDepartment of Radiology, Shiga University of Medical Science, Seta-Tsukinowa, Otsu, Shiga 520-2192, JapanTel +81 77 548 2288Fax +81 77 544 0986Email [email protected]
Abstract: The term ‘emphysema’ is generally used in a morphological sense, and therefore
imaging modalities have an important role in diagnosing this disease. In particular, high
resolution computed tomography (HRCT) is a reliable tool for demonstrating the pathology
of emphysema, even in subtle changes within secondary pulmonary lobules. Generally, pul-
monary emphysema is classifi ed into three types related to the lobular anatomy: centrilobular
emphysema, panlobular emphysema, and paraseptal emphysema. In this pictorial review, we
discuss the radiological – pathological correlation in each type of pulmonary emphysema.
HRCT of early centrilobular emphysema shows an evenly distributed centrilobular tiny areas
of low attenuation with ill-defi ned borders. With enlargement of the dilated airspace, the sur-
rounding lung parenchyma is compressed, which enables observation of a clear border between
the emphysematous area and the normal lung. Because the disease progresses from the centri-
lobular portion, normal lung parenchyma in the perilobular portion tends to be preserved, even
in a case of far-advanced pulmonary emphysema. In panlobular emphysema, HRCT shows
either panlobular low attenuation or ill-defi ned diffuse low attenuation of the lung. Paraseptal
emphysema is characterized by subpleural well-defi ned cystic spaces. Recent topics related to
imaging of pulmonary emphysema will also be discussed, including morphometry of the airway
in cases of chronic obstructive pulmonary disease, combined pulmonary fi brosis and pulmonary
emphysema, and bronchogenic carcinoma associated with bullous lung disease.
Keywords: pulmonary emphysema, HRCT, radiologic-pathologic correlation, pulmonary
fi brosis, bronchus, lung cancer
IntroductionChronic obstructive pulmonary disease (COPD) is a disease characterized by airfl ow
limitation that is not fully reversible (Pauwels et al 2001). The pathogenesis of COPD
is thought to be chronic infl ammation throughout the airways, parenchyma, and pul-
monary vasculature (Pauwels et al 2001). Pathologic changes characteristic of COPD
occur in all these respiratory structures. Among these changes, destruction of the
lung parenchyma is commonly referred to as pulmonary emphysema, defi ned as “an
abnormal permanent enlargement of the air space distal to the terminal bronchioles,
accompanied by destruction of the alveolar walls, and without obvious fi brosis” (ATS
1962; Snider et al 1985). The etiology of pulmonary emphysema has not been fully
established (Tuder et al 2006), but the prevailing concept is that lung infl ammation
caused by cigarette smoke, environmental pollutants, or bacterial products leads to an
imbalance of proteases and antiproteases (Tuder et al 2006). Although the traditional
infl ammatory cell implicated in emphysema is the neutrophil which releases neutoro-
phil elastase, recent research has been focused on the macrophage and macrophage-
derived protease (Wright and Churg 2007). The link between the infl ammation and
infl ammation-related genes was also highlighted (Grumelli et al 2004). Apoptosis and
oxidative stress also act as amplifi cation mechanisms (Tuder et al 2006).
The term emphysema is generally used in a morphological sense in the fi eld
of pathology and radiology and should not be directly related with physiological
impairment. Imaging modalities have an important role in diagnosis of pulmonary
International Journal of COPD 2008:3(2)194
Takahashi et al
emphysema, and high resolution computed tomography
(HRCT) is an especially reliable tool for demonstrating the
pathology of emphysema, even for subtle changes in second-
ary pulmonary lobules. In this pictorial review, we show
the radiological – pathological correlation in pulmonary
emphysema. Recent topics related to imaging of pulmonary
emphysema will also be discussed, including morphometry of
the airway in cases of COPD, combined pulmonary fi brosis
and pulmonary emphysema, and bronchogenic carcinoma
associated with bullous lung disease (BLD).
Anatomy of the secondary pulmonary lobuleAn understanding of the normal anatomy of the peripheral
lung is required when interpreting CT images of pulmonary
emphysema. From the trachea, airways with a diameter of
1 mm reach the level of the lobular bronchus after 9 to 14
dichotomous branches. Lobular bronchus has 3 to 5 smaller
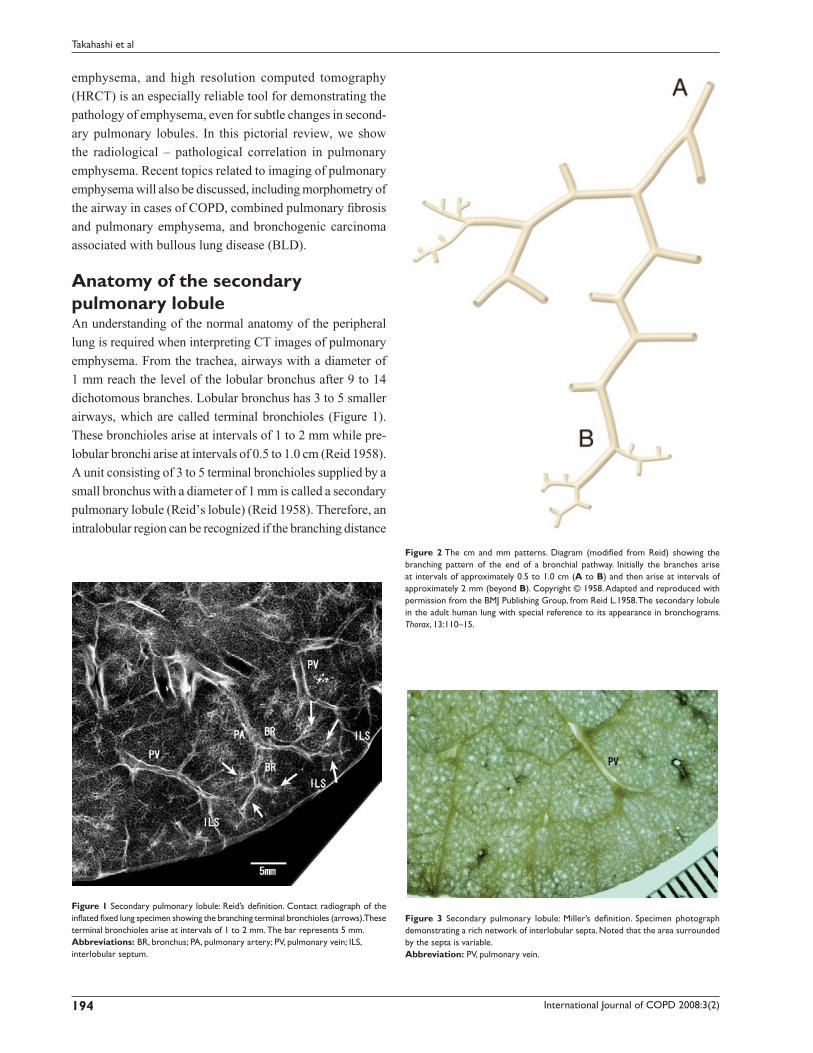
airways, which are called terminal bronchioles (Figure 1).
These bronchioles arise at intervals of 1 to 2 mm while pre-
lobular bronchi arise at intervals of 0.5 to 1.0 cm (Reid 1958).
A unit consisting of 3 to 5 terminal bronchioles supplied by a
small bronchus with a diameter of 1 mm is called a secondary
pulmonary lobule (Reid’s lobule) (Reid 1958). Therefore, an
intralobular region can be recognized if the branching distance
Figure 1 Secondary pulmonary lobule: Reid’s defi nition. Contact radiograph of the infl ated fi xed lung specimen showing the branching terminal bronchioles (arrows). These terminal bronchioles arise at intervals of 1 to 2 mm. The bar represents 5 mm.Abbreviations: BR, bronchus; PA, pulmonary artery; PV, pulmonary vein; ILS, interlobular septum.
Figure 2 The cm and mm patterns. Diagram (modifi ed from Reid) showing the branching pattern of the end of a bronchial pathway. Initially the branches arise at intervals of approximately 0.5 to 1.0 cm (A to B) and then arise at intervals of approximately 2 mm (beyond B). Copyright © 1958. Adapted and reproduced with permission from the BMJ Publishing Group, from Reid L.1958. The secondary lobule in the adult human lung with special reference to its appearance in bronchograms. Thorax, 13:110–15.
Figure 3 Secondary pulmonary lobule: Miller’s defi nition. Specimen photograph demonstrating a rich network of interlobular septa. Noted that the area surrounded by the septa is variable.Abbreviation: PV, pulmonary vein.
International Journal of COPD 2008:3(2) 195
Imaging of pulmonary emphysema
is constant at 1 to 2 mm. Prelobular branching is referred to
as a “cm pattern” and an intralobular pattern is called an “mm
pattern” (Reid 1958) (Figure 2), and the area supplied by
each terminal bronchiole is called an “acinus”. Miller (1950)
defi ned the secondary lobule as an area surrounded by the
interlobular septum (Figure 3). Reid’s and Miller’s lobules are
not conceptually the same, because the interlobular septum is
not constantly and uniformly observed within the lung, and
the area surrounded by the septum ranges from 1 to 3 cm; in
contrast, Reid’s lobule is constantly and uniformly observed
throughout the lung (Itoh et al 1993).
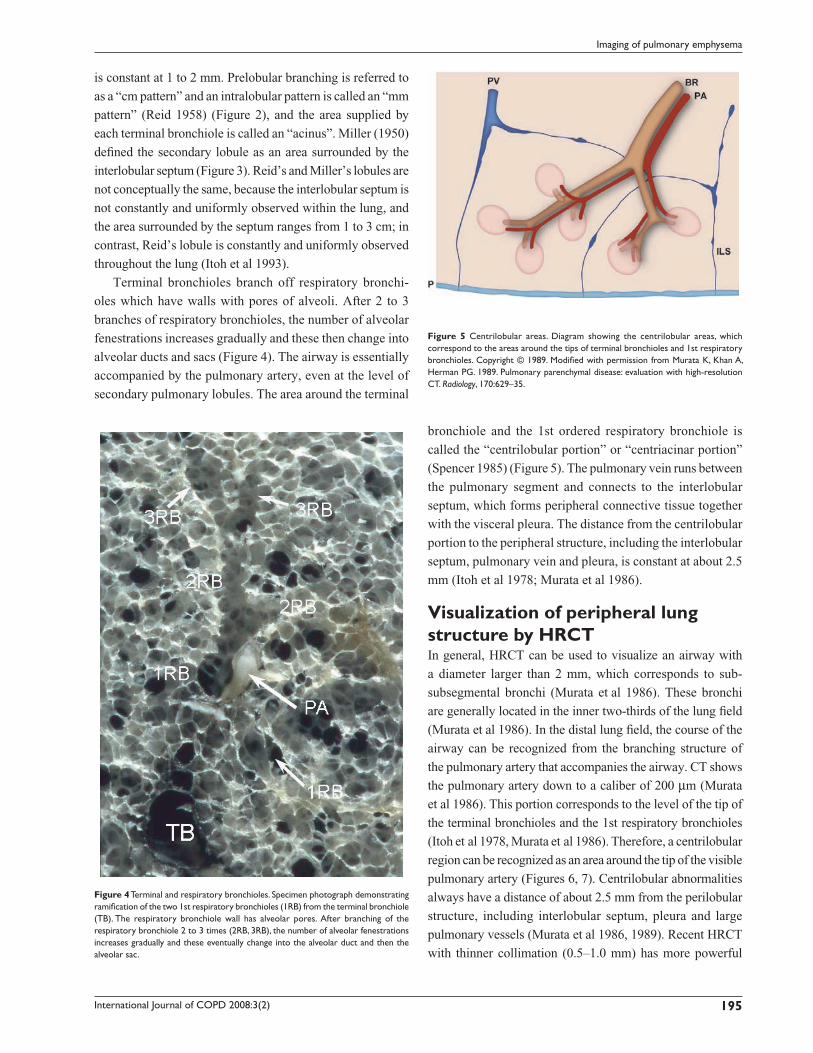
Terminal bronchioles branch off respiratory bronchi-
oles which have walls with pores of alveoli. After 2 to 3
branches of respiratory bronchioles, the number of alveolar
fenestrations increases gradually and these then change into
alveolar ducts and sacs (Figure 4). The airway is essentially
accompanied by the pulmonary artery, even at the level of
secondary pulmonary lobules. The area around the terminal
bronchiole and the 1st ordered respiratory bronchiole is
called the “centrilobular portion” or “centriacinar portion”
(Spencer 1985) (Figure 5). The pulmonary vein runs between
the pulmonary segment and connects to the interlobular
septum, which forms peripheral connective tissue together
with the visceral pleura. The distance from the centrilobular
portion to the peripheral structure, including the interlobular
septum, pulmonary vein and pleura, is constant at about 2.5
mm (Itoh et al 1978; Murata et al 1986).
Visualization of peripheral lung structure by HRCTIn general, HRCT can be used to visualize an airway with
a diameter larger than 2 mm, which corresponds to sub-
subsegmental bronchi (Murata et al 1986). These bronchi
are generally located in the inner two-thirds of the lung fi eld
(Murata et al 1986). In the distal lung fi eld, the course of the
airway can be recognized from the branching structure of
the pulmonary artery that accompanies the airway. CT shows
the pulmonary artery down to a caliber of 200 µm (Murata
et al 1986). This portion corresponds to the level of the tip of
the terminal bronchioles and the 1st respiratory bronchioles
(Itoh et al 1978, Murata et al 1986). Therefore, a centrilobular
region can be recognized as an area around the tip of the visible
pulmonary artery (Figures 6, 7). Centrilobular abnormalities
always have a distance of about 2.5 mm from the perilobular
structure, including interlobular septum, pleura and large
pulmonary vessels (Murata et al 1986, 1989). Recent HRCT
with thinner collimation (0.5–1.0 mm) has more powerful
Figure 4 Terminal and respiratory bronchioles. Specimen photograph demonstrating ramifi cation of the two 1st respiratory bronchioles (1RB) from the terminal bronchiole (TB). The respiratory bronchiole wall has alveolar pores. After branching of the respiratory bronchiole 2 to 3 times (2RB, 3RB), the number of alveolar fenestrations increases gradually and these eventually change into the alveolar duct and then the alveolar sac.
Figure 5 Centrilobular areas. Diagram showing the centrilobular areas, which correspond to the areas around the tips of terminal bronchioles and 1st respiratory bronchioles. Copyright © 1989. Modifi ed with permission from Murata K, Khan A, Herman PG. 1989. Pulmonary parenchymal disease: evaluation with high-resolution CT. Radiology, 170:629–35.
International Journal of COPD 2008:3(2)196
Takahashi et al
resolution for demonstration of peripheral lung structures, in
which the distance between the most distal visible pulmonary
artery and pleura is about 1–1.5 mm and that between the most
distal visible airway and pleura is about 1.5 cm. The former
corresponds to the level of 2nd respiratory bronchioles and the
latter to prelobular bronchi (Takahashi et al 2002).
Classifi cation of pulmonary emphysemaPulmonary emphysema can be classifi ed into three major
subtypes based on the disease distribution within secondary
pulmonary lobules (Stern and Frank 1994; Thurlbeck and Müller
1994): centriacinar emphysema, panacinar emphysema, and dis-
tal acinar emphysema (Figure 8). The relationships among these
types of pulmonary emphysema and how each type is formed
have yet to be clarifi ed. The subtypes of emphysema can usually
be determined in mild or moderate cases, but classifi cation into
anatomic subtypes becomes more diffi cult by CT and pathology
as emphysema becomes more severe, with even highly trained
and experienced pathologists sometimes disagreeing on the
classifi cation (Mitchell et al 1970). Centriacinar and panacinar
emphysema can also coexist in the same patient; for example,
with centriacinar emphysema in the upper lobe and panacinar
emphysema in the lower lobe (Mitchell et al 1970).
Centriacinar emphysemaCentriacinar emphysema is the commonest type of pulmo-
nary emphysema and is characterized by an enlargement of
the centriacinar airspace, with the effect mainly occurring in
proximal respiratory bronchioles, leaving normal distal alveo-
lar ducts and sacs (Leopold and Gough 1957). The disease
mainly involves the second and third respiratory bronchi-
oles, and the severity of destruction of the lung parenchyma
usually differs from lobule to lobule (Leopold and Gough
1957). Development of centriacinar emphysema is believed
to be closely related to cigarette smoking and dust inhalation
(ATS 1962; Finkelstein et al 1995; Cosio Piqueras et al 2001;
Pauwels et al 2001; Satoh et al 2001), and most emphysema
observed in heavy smokers is centriacinar emphysema
(Thurlbeck 1963). The disease is usually distributed to the
upper lobe or the superior segment of the lower lobe (Figure
9). The precise reasons for this distribution are unclear, but
may include regional differences in perfusion, transit time of
leukocytes, clearance of deposited dust, and pleural pressure
(Gurney 1991). The inner zone is more severely affected than
the outer zone, which may be explained by zonal differences
in respiratory kinetics and lymph fl ow (Nakano et al 1999).
The characteristic appearance of a gross specimen of cen-
triacinar emphysema is pigmentation (anthracosis) in a patchy
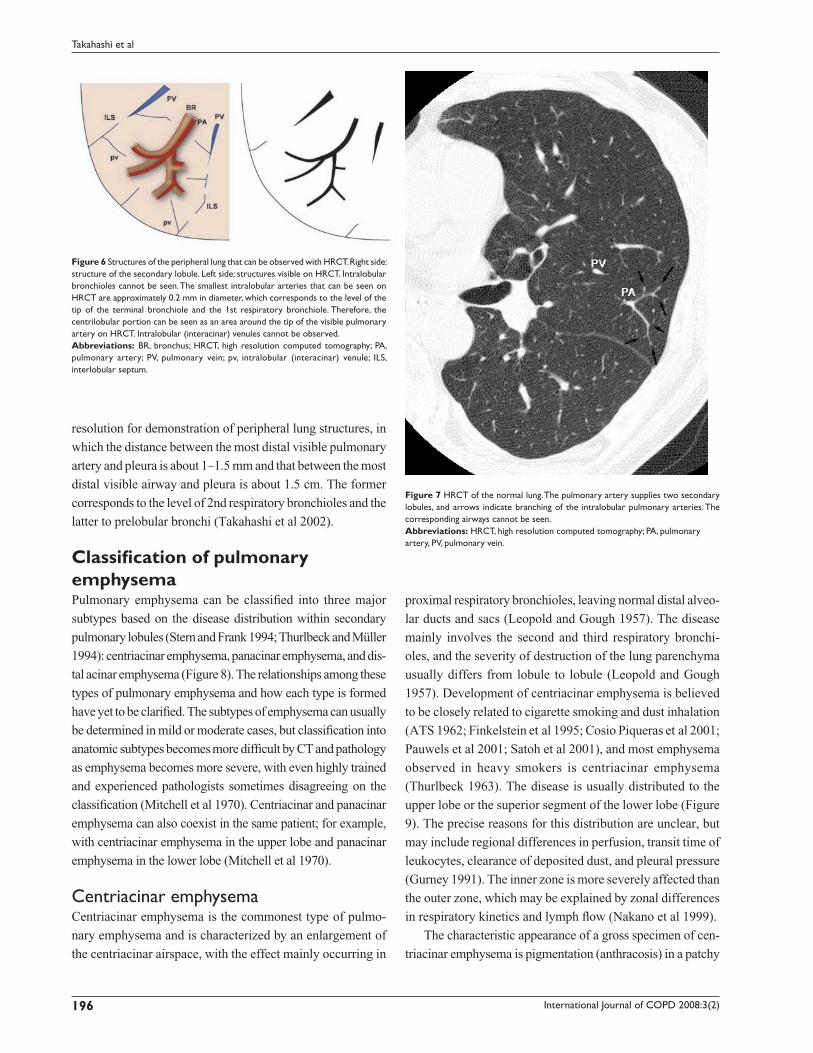
Figure 6 Structures of the peripheral lung that can be observed with HRCT. Right side: structure of the secondary lobule. Left side: structures visible on HRCT. Intralobular bronchioles cannot be seen. The smallest intralobular arteries that can be seen on HRCT are approximately 0.2 mm in diameter, which corresponds to the level of the tip of the terminal bronchiole and the 1st respiratory bronchiole. Therefore, the centrilobular portion can be seen as an area around the tip of the visible pulmonary artery on HRCT. Intralobular (interacinar) venules cannot be observed.Abbreviations: BR, bronchus; HRCT, high resolution computed tomography; PA, pulmonary artery; PV, pulmonary vein; pv, intralobular (interacinar) venule; ILS, interlobular septum.
Figure 7 HRCT of the normal lung. The pulmonary artery supplies two secondary lobules, and arrows indicate branching of the intralobular pulmonary arteries. The corresponding airways cannot be seen.Abbreviations: HRCT, high resolution computed tomography; PA, pulmonary artery, PV, pulmonary vein.

International Journal of COPD 2008:3(2) 197
Imaging of pulmonary emphysema
fashion in the inner zone of the lung (Figure 10). This is one
of the clues shows that centriacinar emphysema is closely
associated with inhaled exogenous dust. The pigmented area
corresponds to centriacinar dilatation of the airspace, but
this area is not a simple unilocular space and is composed of
aggregated and dilated small air spaces (Figures 11, 12). The
surrounding lung parenchyma shows a normal appearance, but
there is no border structure between these regions. Therefore,
HRCT in early centriacinar emphysema shows evenly distrib-
uted centrilobular tiny areas of low attenuation with ill-defi ned
borders (Naidich et al 1982) (Figure 13). Aggregation of the
dilated small airspaces is observed as a single air space since
this feature is beyond the spatial resolution of CT. With enlarge-
ment of the dilated airspace, the surrounding lung parenchyma
is compressed, which enables a clear border to be observed
between the emphysematous area and normal lung (Naidich
et al 1982) (Figures 14, 15). Since the disease progresses from
the centrilobular portion, the normal lung parenchyma in the
perilobular portion tends to be preserved, even in advanced
Figure 8 Subtypes of pulmonary emphysema.
Figure 9 Distribution of centriacinar emphysema. Photograph of an infl ated and fi xed lung showing emphysematous foci with anthracosis mainly distributed in the upper lobe and superior segment of the lower lobe (*).
Figure 10 Distribution of centriacinar emphysema. Photograph of an infl ated and fi xed lung showing emphysematous foci with anthracosis mainly observed in the inner zone of the lung.
International Journal of COPD 2008:3(2)198
Takahashi et al
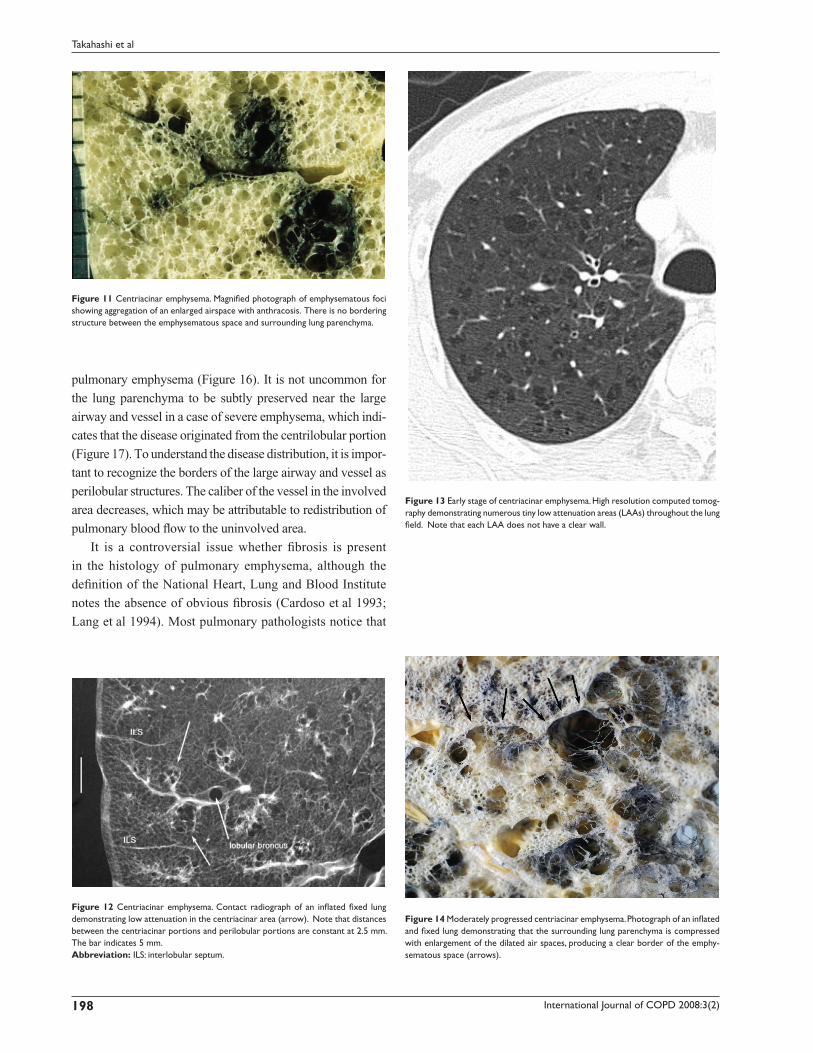
Figure 11 Centriacinar emphysema. Magnifi ed photograph of emphysematous foci showing aggregation of an enlarged airspace with anthracosis. There is no bordering structure between the emphysematous space and surrounding lung parenchyma.
Figure 12 Centriacinar emphysema. Contact radiograph of an infl ated fi xed lung demonstrating low attenuation in the centriacinar area (arrow). Note that distances between the centriacinar portions and perilobular portions are constant at 2.5 mm. The bar indicates 5 mm.Abbreviation: ILS: interlobular septum.
Figure 13 Early stage of centriacinar emphysema. High resolution computed tomog-raphy demonstrating numerous tiny low attenuation areas (LAAs) throughout the lung fi eld. Note that each LAA does not have a clear wall.
Figure 14 Moderately progressed centriacinar emphysema. Photograph of an infl ated and fi xed lung demonstrating that the surrounding lung parenchyma is compressed with enlargement of the dilated air spaces, producing a clear border of the emphy-sematous space (arrows).
pulmonary emphysema (Figure 16). It is not uncommon for
the lung parenchyma to be subtly preserved near the large
airway and vessel in a case of severe emphysema, which indi-
cates that the disease originated from the centrilobular portion
(Figure 17). To understand the disease distribution, it is impor-
tant to recognize the borders of the large airway and vessel as
perilobular structures. The caliber of the vessel in the involved
area decreases, which may be attributable to redistribution of
pulmonary blood fl ow to the uninvolved area.
It is a controversial issue whether fi brosis is present
in the histology of pulmonary emphysema, although the
defi nition of the National Heart, Lung and Blood Institute
notes the absence of obvious fi brosis (Cardoso et al 1993;
Lang et al 1994). Most pulmonary pathologists notice that

International Journal of COPD 2008:3(2) 199
Imaging of pulmonary emphysema
the alveoli, resulting in evenly distributed emphysematous
changes within secondary lobules (acini) (Thurlbeck 1995).
In a gross specimen of a normal lung, the lumen of the alveo-
lar ducts and respiratory bronchioles are slightly larger than
surrounding normal alveoli (Heppleston and Leopold 1961;
Thurlbeck 1963). In very early panacinar emphysema, this
contrast tends to diminish with an increase in the size of the
alveolar space and a “monotonous” appearance is apparent
(Thurlbeck 1995). Alpha 1-antitrypsin defi ciency is thought
to be a major cause of panacinar emphysema, but the inci-
dence is very low (Eriksson 1965). Other etiologies, including
Swyer-James syndrome (Swyer and James 1953; Macleod
1954) and ritalin abuse, have been reported (Stern et al 1994),
but most cases observed in surgical or autopsy specimens
are unrelated to these conditions. Features that distinguish
panacinar emphysema from centriacinar emphysema are
as follows: the disease is dominant in the lower lung fi eld,
whereas the upper lung is mainly affected in centriacinar
emphysema (Thurlbeck 1963); the degree of lung infl ation
is greater than that in centriacinar emphysema; there is a
tendency for the airway to be narrowed; and bullous forma-
tion is less frequently observed compared to centriacinar
emphysema (Mitchell et al 1970).
Two types of disease distribution have been recognized
in panacinar emphysema: a localized form and a diffuse form
(Thurlbeck 1995) (Figure 18). The former has a multilobular
distribution and the latter has a distribution that is not related
to the zonal anatomy of the lung. The striking difference from
Figure 15 Moderately progressed centriacinar emphysema. On high resolution computed tomography, a “wall” structure is observed at the periphery of the emphy-sema (arrows), composed of compressed lung tissue and perilobular vessels.
Figure 16 Advanced centriacinar emphysema. Photograph of an infl ated and fi xed lung showing that residual normal lung is clearly observed around the large vessels (arrows), even in progressed emphysema. The long arrows represent pulmonary veins.
Figure 17 Advanced centriacinar emphysema. It is very diffi cult to assess the sub-type of emphysema using high resolution computed tomography. However, a small area of preserved normal lung can be observed around the large bronchovascular bundle and pulmonary vein, which indicates that this emphysema originated from the centriacinar area (arrow).
some degree of fi brosis is found around the emphysematous
region (Cardoso et al 1993; Lang et al 1994), but how these
fi brotic changes are refl ected on HRCT images of pulmonary
emphysema is unknown (Tonelli et al 1997).
Panacinar emphysemaPanacinar emphysema is characterized by a uniform dila-
tation of the air space from the respiratory bronchioles to
International Journal of COPD 2008:3(2)200
Takahashi et al
centriacinar emphysema is the low contrast to the neighbor-
ing normal lung (Stern and Frank 1994). The low attenuation
of centriacinar emphysema is easily recognized on HRCT
because of the contrast between the emphysematous region
and the normal lung, whereas panacinar emphysema does
not show a difference in intralobular attenuation because the
entire lobule is involved to almost the same extent. Yamagishi
and colleagues (1991) reported several CT-pathological
observations in cases of panacinar emphysema, as follows:
the low attenuation region is not evenly distributed within
the lobule or lobule-by-lobule on HRCT, which is attrib-
uted to an uneven distribution of the degree of the disease;
the caliber of the vessels in the involved area is decreased
due to overinfl ation of the air space; the localized form of
panacinar emphysema has a polygonal border, which repre-
sents the interlobular septum, and perilobular large vessels
are observed at the border of the lesion (Figure 19); and the
margin of the diffuse form of panacinar emphysema is ill
defi ned, due to the inhomogeneity of the intralobular disease
distribution in lobules located at the periphery of the lesion
(Figures 20, 21).
Distal acinar or paraseptal emphysemaDistal acinar or paraseptal emphysema is characterized as
an enlarged airspace at the periphery of acini (Thurlbeck
1995). The lesion is usually limited in extent, occurs most
commonly along the dorsal surface of the upper lung
(Figures 22, 23), and is often associated with fi brosis and
may coexist with other types of emphysema. The patient is
usually asymptomatic, but the condition is considered to be
a cause of pneumothorax in young adults (Peters et al 1978;
Lesur et al 1990).
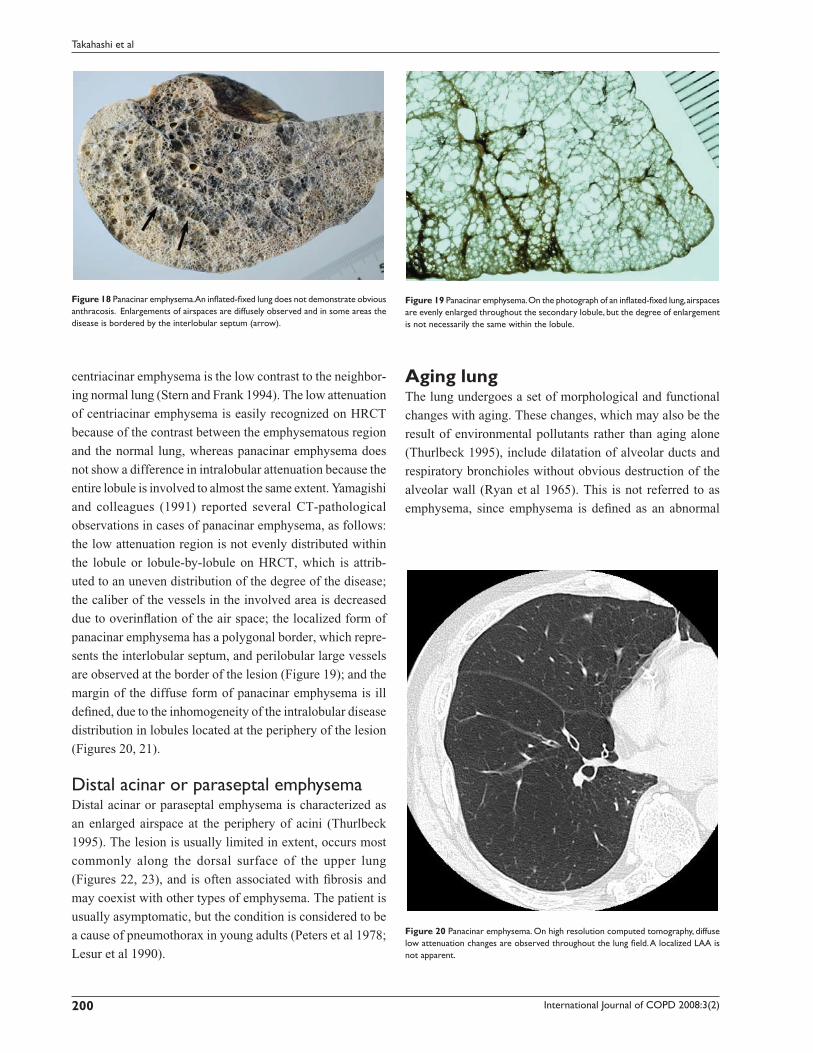
Figure 18 Panacinar emphysema. An infl ated-fi xed lung does not demonstrate obvious anthracosis. Enlargements of airspaces are diffusely observed and in some areas the disease is bordered by the interlobular septum (arrow).
Figure 19 Panacinar emphysema. On the photograph of an infl ated-fi xed lung, airspaces are evenly enlarged throughout the secondary lobule, but the degree of enlargement is not necessarily the same within the lobule.
Figure 20 Panacinar emphysema. On high resolution computed tomography, diffuse low attenuation changes are observed throughout the lung fi eld. A localized LAA is not apparent.
Aging lungThe lung undergoes a set of morphological and functional
changes with aging. These changes, which may also be the
result of environmental pollutants rather than aging alone
(Thurlbeck 1995), include dilatation of alveolar ducts and
respiratory bronchioles without obvious destruction of the
alveolar wall (Ryan et al 1965). This is not referred to as
emphysema, since emphysema is defi ned as an abnormal
International Journal of COPD 2008:3(2) 201
Imaging of pulmonary emphysema
enlargement of the air space accompanied by destruction of
the alveolar walls. In contrast to dilatation of alveolar ducts
and respiratory bronchioles, the size of the alveoli is reduced,
a process that has been referred to as “ductectasia” (Ryan
et al 1965) (Figures 24, 25). This aging change is refl ected
in the “rounds out” confi guration of the lung in which the
anteroposterior diameter is increased (Anderson et al 1964).
HRCT fi ndings of the aging lung have not been established,
probably because the difference in attenuation accompanying
the changes is small.
Imaging topics related to pulmonary emphysemaPhenotyping of COPD and imagingCOPD is considered to be a chronic infl ammatory process
throughout the airway and lung parenchyme, allowing
defi nition of two phenotypes involving primarily parenchymal
disease (emphysema) and primarily airway disease (Nakano
et al 2002; Hoffman et al 2006). These two pathologies
frequently coexist in a diseased lung. Pathological changes
of the large airway include enlarged mucus-secreting glands
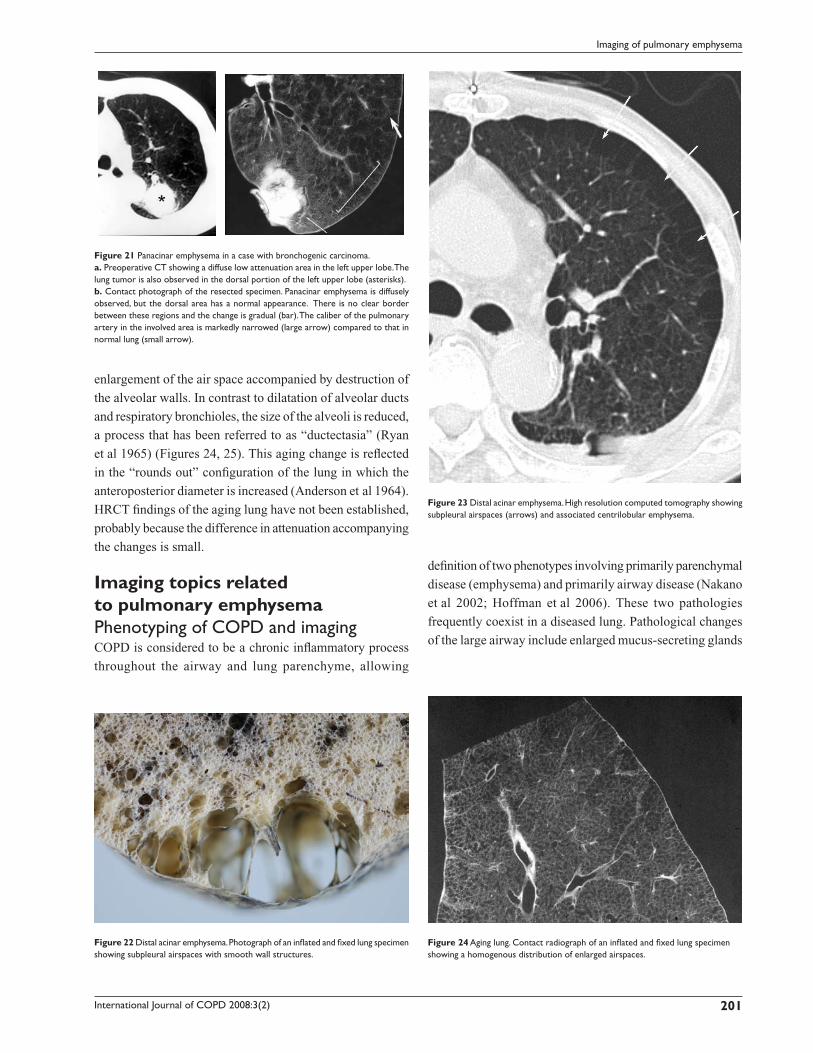
Figure 21 Panacinar emphysema in a case with bronchogenic carcinoma.a. Preoperative CT showing a diffuse low attenuation area in the left upper lobe. The lung tumor is also observed in the dorsal portion of the left upper lobe (asterisks).b. Contact photograph of the resected specimen. Panacinar emphysema is diffusely observed, but the dorsal area has a normal appearance. There is no clear border between these regions and the change is gradual (bar). The caliber of the pulmonary artery in the involved area is markedly narrowed (large arrow) compared to that in normal lung (small arrow).
Figure 22 Distal acinar emphysema. Photograph of an infl ated and fi xed lung specimen showing subpleural airspaces with smooth wall structures.
Figure 23 Distal acinar emphysema. High resolution computed tomography showing subpleural airspaces (arrows) and associated centrilobular emphysema.
Figure 24 Aging lung. Contact radiograph of an infl ated and fi xed lung specimen showing a homogenous distribution of enlarged airspaces.
International Journal of COPD 2008:3(2)202
Takahashi et al
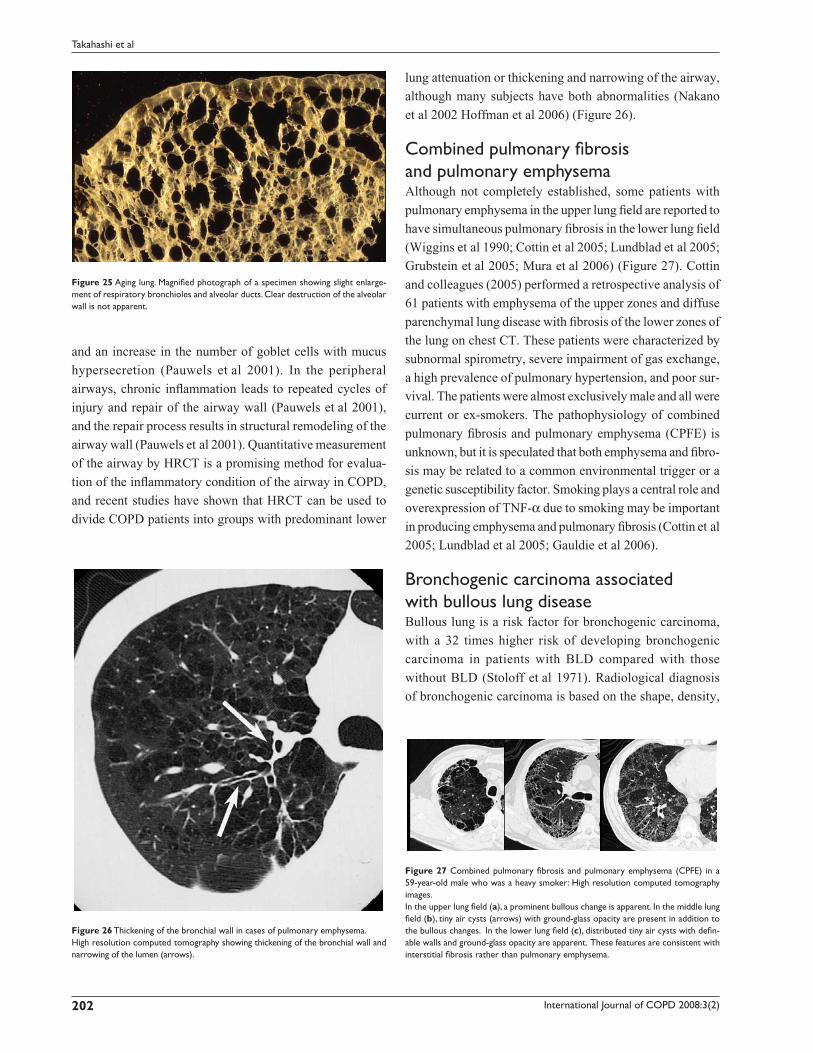
and an increase in the number of goblet cells with mucus
hypersecretion (Pauwels et al 2001). In the peripheral
airways, chronic infl ammation leads to repeated cycles of
injury and repair of the airway wall (Pauwels et al 2001),
and the repair process results in structural remodeling of the
airway wall (Pauwels et al 2001). Quantitative measurement
of the airway by HRCT is a promising method for evalua-
tion of the infl ammatory condition of the airway in COPD,
and recent studies have shown that HRCT can be used to
divide COPD patients into groups with predominant lower
lung attenuation or thickening and narrowing of the airway,
although many subjects have both abnormalities (Nakano
et al 2002 Hoffman et al 2006) (Figure 26).
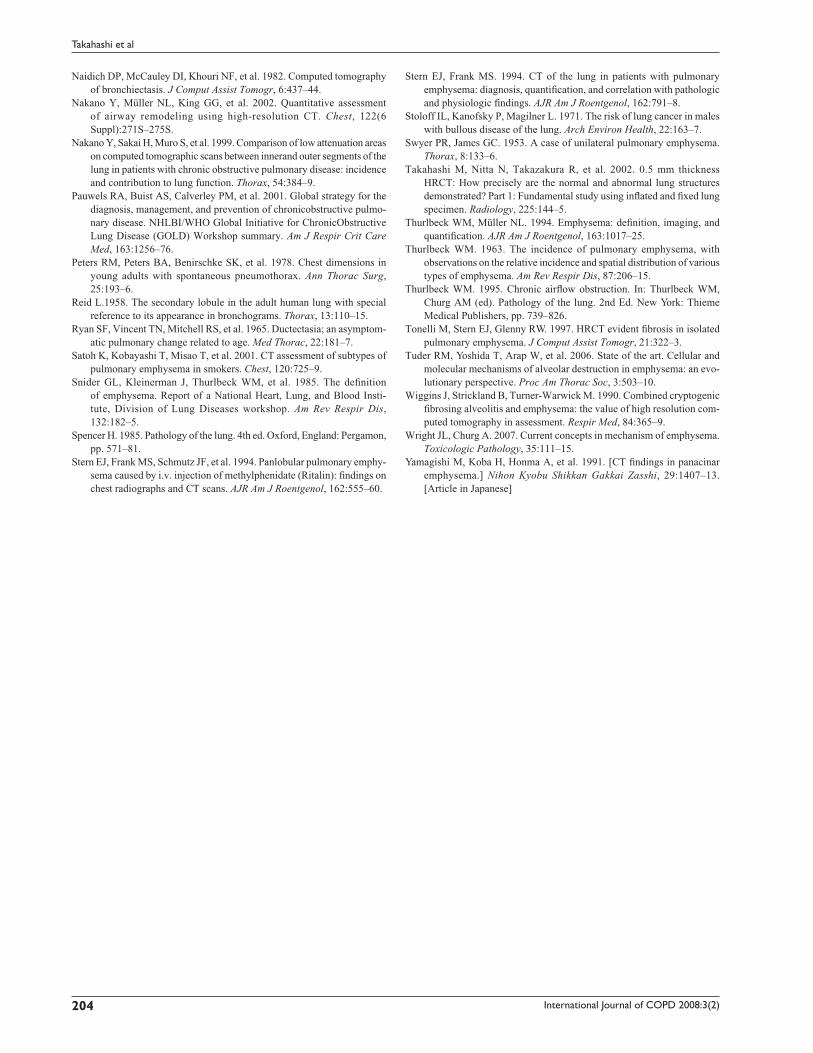
Combined pulmonary fi brosis and pulmonary emphysemaAlthough not completely established, some patients with
pulmonary emphysema in the upper lung fi eld are reported to
have simultaneous pulmonary fi brosis in the lower lung fi eld
(Wiggins et al 1990; Cottin et al 2005; Lundblad et al 2005;
Grubstein et al 2005; Mura et al 2006) (Figure 27). Cottin
and colleagues (2005) performed a retrospective analysis of
61 patients with emphysema of the upper zones and diffuse
parenchymal lung disease with fi brosis of the lower zones of
the lung on chest CT. These patients were characterized by
subnormal spirometry, severe impairment of gas exchange,
a high prevalence of pulmonary hypertension, and poor sur-
vival. The patients were almost exclusively male and all were
current or ex-smokers. The pathophysiology of combined
pulmonary fi brosis and pulmonary emphysema (CPFE) is
unknown, but it is speculated that both emphysema and fi bro-
sis may be related to a common environmental trigger or a
genetic susceptibility factor. Smoking plays a central role and
overexpression of TNF-α due to smoking may be important
in producing emphysema and pulmonary fi brosis (Cottin et al
2005; Lundblad et al 2005; Gauldie et al 2006).
Bronchogenic carcinoma associated with bullous lung diseaseBullous lung is a risk factor for bronchogenic carcinoma,
with a 32 times higher risk of developing bronchogenic
carcinoma in patients with BLD compared with those
without BLD (Stoloff et al 1971). Radiological diagnosis
of bronchogenic carcinoma is based on the shape, density,
Figure 25 Aging lung. Magnifi ed photograph of a specimen showing slight enlarge-ment of respiratory bronchioles and alveolar ducts. Clear destruction of the alveolar wall is not apparent.
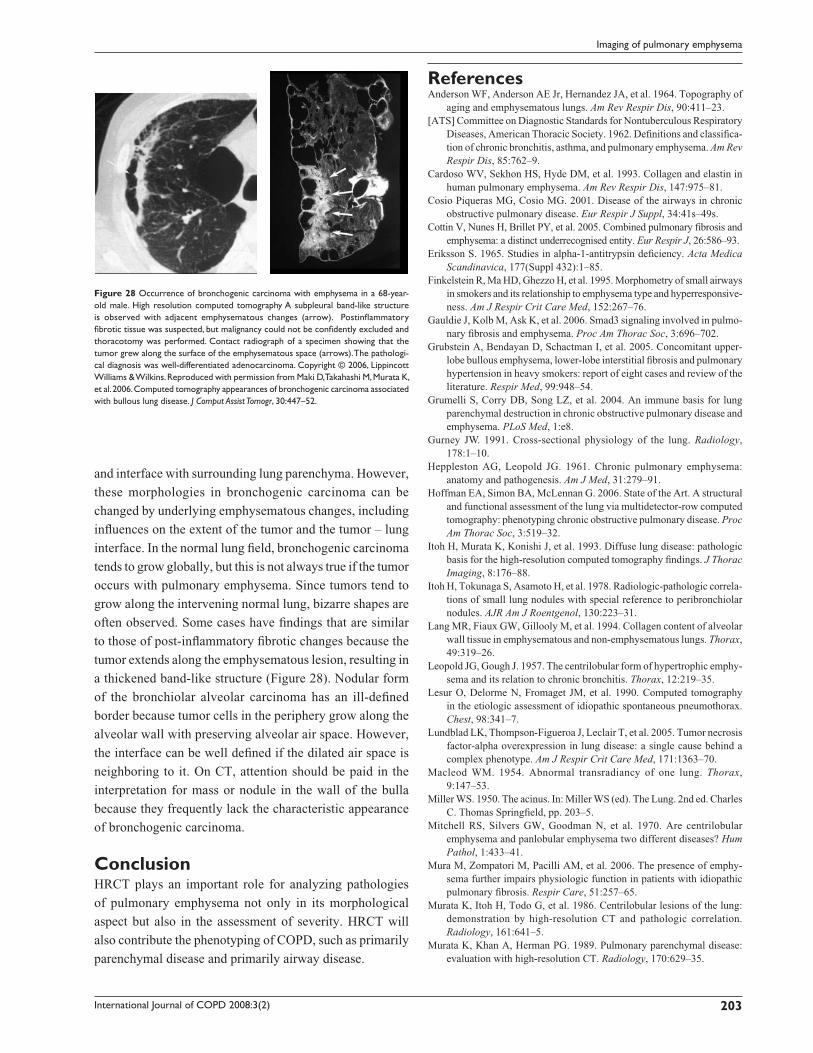
Figure 26 Thickening of the bronchial wall in cases of pulmonary emphysema.High resolution computed tomography showing thickening of the bronchial wall and narrowing of the lumen (arrows).
Figure 27 Combined pulmonary fi brosis and pulmonary emphysema (CPFE) in a 59-year-old male who was a heavy smoker: High resolution computed tomography images.In the upper lung fi eld (a), a prominent bullous change is apparent. In the middle lung fi eld (b), tiny air cysts (arrows) with ground-glass opacity are present in addition to the bullous changes. In the lower lung fi eld (c), distributed tiny air cysts with defi n-able walls and ground-glass opacity are apparent. These features are consistent with interstitial fi brosis rather than pulmonary emphysema.
International Journal of COPD 2008:3(2) 203
Imaging of pulmonary emphysema
and interface with surrounding lung parenchyma. However,
these morphologies in bronchogenic carcinoma can be
changed by underlying emphysematous changes, including
infl uences on the extent of the tumor and the tumor – lung
interface. In the normal lung fi eld, bronchogenic carcinoma
tends to grow globally, but this is not always true if the tumor
occurs with pulmonary emphysema. Since tumors tend to
grow along the intervening normal lung, bizarre shapes are
often observed. Some cases have fi ndings that are similar
to those of post-infl ammatory fi brotic changes because the
tumor extends along the emphysematous lesion, resulting in
a thickened band-like structure (Figure 28). Nodular form
of the bronchiolar alveolar carcinoma has an ill-defi ned
border because tumor cells in the periphery grow along the
alveolar wall with preserving alveolar air space. However,
the interface can be well defi ned if the dilated air space is
neighboring to it. On CT, attention should be paid in the
interpretation for mass or nodule in the wall of the bulla
because they frequently lack the characteristic appearance
of bronchogenic carcinoma.
ConclusionHRCT plays an important role for analyzing pathologies
of pulmonary emphysema not only in its morphological
aspect but also in the assessment of severity. HRCT will
also contribute the phenotyping of COPD, such as primarily
parenchymal disease and primarily airway disease.
ReferencesAnderson WF, Anderson AE Jr, Hernandez JA, et al. 1964. Topography of
aging and emphysematous lungs. Am Rev Respir Dis, 90:411–23.[ATS] Committee on Diagnostic Standards for Nontuberculous Respiratory
Diseases, American Thoracic Society. 1962. Defi nitions and classifi ca-tion of chronic bronchitis, asthma, and pulmonary emphysema. Am Rev Respir Dis, 85:762–9.
Cardoso WV, Sekhon HS, Hyde DM, et al. 1993. Collagen and elastin in human pulmonary emphysema. Am Rev Respir Dis, 147:975–81.
Cosio Piqueras MG, Cosio MG. 2001. Disease of the airways in chronic obstructive pulmonary disease. Eur Respir J Suppl, 34:41s–49s.
Cottin V, Nunes H, Brillet PY, et al. 2005. Combined pulmonary fi brosis and emphysema: a distinct underrecognised entity. Eur Respir J, 26:586–93.
Eriksson S. 1965. Studies in alpha-1-antitrypsin defi ciency. Acta Medica Scandinavica, 177(Suppl 432):1–85.
Finkelstein R, Ma HD, Ghezzo H, et al. 1995. Morphometry of small airways in smokers and its relationship to emphysema type and hyperresponsive-ness. Am J Respir Crit Care Med, 152:267–76.
Gauldie J, Kolb M, Ask K, et al. 2006. Smad3 signaling involved in pulmo-nary fi brosis and emphysema. Proc Am Thorac Soc, 3:696–702.
Grubstein A, Bendayan D, Schactman I, et al. 2005. Concomitant upper-lobe bullous emphysema, lower-lobe interstitial fi brosis and pulmonary hypertension in heavy smokers: report of eight cases and review of the literature. Respir Med, 99:948–54.
Grumelli S, Corry DB, Song LZ, et al. 2004. An immune basis for lung parenchymal destruction in chronic obstructive pulmonary disease and emphysema. PLoS Med, 1:e8.
Gurney JW. 1991. Cross-sectional physiology of the lung. Radiology, 178:1–10.
Heppleston AG, Leopold JG. 1961. Chronic pulmonary emphysema: anatomy and pathogenesis. Am J Med, 31:279–91.
Hoffman EA, Simon BA, McLennan G. 2006. State of the Art. A structural and functional assessment of the lung via multidetector-row computed tomography: phenotyping chronic obstructive pulmonary disease. Proc Am Thorac Soc, 3:519–32.
Itoh H, Murata K, Konishi J, et al. 1993. Diffuse lung disease: pathologic basis for the high-resolution computed tomography fi ndings. J Thorac Imaging, 8:176–88.
Itoh H, Tokunaga S, Asamoto H, et al. 1978. Radiologic-pathologic correla-tions of small lung nodules with special reference to peribronchiolar nodules. AJR Am J Roentgenol, 130:223–31.
Lang MR, Fiaux GW, Gillooly M, et al. 1994. Collagen content of alveolar wall tissue in emphysematous and non-emphysematous lungs. Thorax, 49:319–26.
Leopold JG, Gough J. 1957. The centrilobular form of hypertrophic emphy-sema and its relation to chronic bronchitis. Thorax, 12:219–35.
Lesur O, Delorme N, Fromaget JM, et al. 1990. Computed tomography in the etiologic assessment of idiopathic spontaneous pneumothorax. Chest, 98:341–7.
Lundblad LK, Thompson-Figueroa J, Leclair T, et al. 2005. Tumor necrosis factor-alpha overexpression in lung disease: a single cause behind a complex phenotype. Am J Respir Crit Care Med, 171:1363–70.
Macleod WM. 1954. Abnormal transradiancy of one lung. Thorax, 9:147–53.
Miller WS. 1950. The acinus. In: Miller WS (ed). The Lung. 2nd ed. Charles C. Thomas Springfi eld, pp. 203–5.
Mitchell RS, Silvers GW, Goodman N, et al. 1970. Are centrilobular emphysema and panlobular emphysema two different diseases? Hum Pathol, 1:433–41.
Mura M, Zompatori M, Pacilli AM, et al. 2006. The presence of emphy-sema further impairs physiologic function in patients with idiopathic pulmonary fi brosis. Respir Care, 51:257–65.
Murata K, Itoh H, Todo G, et al. 1986. Centrilobular lesions of the lung: demonstration by high-resolution CT and pathologic correlation. Radiology, 161:641–5.
Murata K, Khan A, Herman PG. 1989. Pulmonary parenchymal disease: evaluation with high-resolution CT. Radiology, 170:629–35.
Figure 28 Occurrence of bronchogenic carcinoma with emphysema in a 68-year-old male. High resolution computed tomography A subpleural band-like structure is observed with adjacent emphysematous changes (arrow). Postinfl ammatory fi brotic tissue was suspected, but malignancy could not be confi dently excluded and thoracotomy was performed. Contact radiograph of a specimen showing that the tumor grew along the surface of the emphysematous space (arrows). The pathologi-cal diagnosis was well-differentiated adenocarcinoma. Copyright © 2006, Lippincott Williams & Wilkins. Reproduced with permission from Maki D, Takahashi M, Murata K, et al. 2006. Computed tomography appearances of bronchogenic carcinoma associated with bullous lung disease. J Comput Assist Tomogr, 30:447–52.
International Journal of COPD 2008:3(2)204
Takahashi et al
Naidich DP, McCauley DI, Khouri NF, et al. 1982. Computed tomography of bronchiectasis. J Comput Assist Tomogr, 6:437–44.
Nakano Y, Müller NL, King GG, et al. 2002. Quantitative assessment of airway remodeling using high-resolution CT. Chest, 122(6 Suppl):271S–275S.
Nakano Y, Sakai H, Muro S, et al. 1999. Comparison of low attenuation areas on computed tomographic scans between innerand outer segments of the lung in patients with chronic obstructive pulmonary disease: incidence and contribution to lung function. Thorax, 54:384–9.
Pauwels RA, Buist AS, Calverley PM, et al. 2001. Global strategy for the diagnosis, management, and prevention of chronicobstructive pulmo-nary disease. NHLBI/WHO Global Initiative for ChronicObstructive Lung Disease (GOLD) Workshop summary. Am J Respir Crit Care Med, 163:1256–76.
Peters RM, Peters BA, Benirschke SK, et al. 1978. Chest dimensions in young adults with spontaneous pneumothorax. Ann Thorac Surg, 25:193–6.
Reid L.1958. The secondary lobule in the adult human lung with special reference to its appearance in bronchograms. Thorax, 13:110–15.
Ryan SF, Vincent TN, Mitchell RS, et al. 1965. Ductectasia; an asymptom-atic pulmonary change related to age. Med Thorac, 22:181–7.
Satoh K, Kobayashi T, Misao T, et al. 2001. CT assessment of subtypes of pulmonary emphysema in smokers. Chest, 120:725–9.
Snider GL, Kleinerman J, Thurlbeck WM, et al. 1985. The defi nition of emphysema. Report of a National Heart, Lung, and Blood Insti-tute, Division of Lung Diseases workshop. Am Rev Respir Dis, 132:182–5.
Spencer H. 1985. Pathology of the lung. 4th ed. Oxford, England: Pergamon, pp. 571–81.
Stern EJ, Frank MS, Schmutz JF, et al. 1994. Panlobular pulmonary emphy-sema caused by i.v. injection of methylphenidate (Ritalin): fi ndings on chest radiographs and CT scans. AJR Am J Roentgenol, 162:555–60.
Stern EJ, Frank MS. 1994. CT of the lung in patients with pulmonary emphysema: diagnosis, quantifi cation, and correlation with pathologic and physiologic fi ndings. AJR Am J Roentgenol, 162:791–8.
Stoloff IL, Kanofsky P, Magilner L. 1971. The risk of lung cancer in males with bullous disease of the lung. Arch Environ Health, 22:163–7.
Swyer PR, James GC. 1953. A case of unilateral pulmonary emphysema. Thorax, 8:133–6.
Takahashi M, Nitta N, Takazakura R, et al. 2002. 0.5 mm thickness HRCT: How precisely are the normal and abnormal lung structures demonstrated? Part 1: Fundamental study using infl ated and fi xed lung specimen. Radiology, 225:144–5.
Thurlbeck WM, Müller NL. 1994. Emphysema: defi nition, imaging, and quantifi cation. AJR Am J Roentgenol, 163:1017–25.
Thurlbeck WM. 1963. The incidence of pulmonary emphysema, with observations on the relative incidence and spatial distribution of various types of emphysema. Am Rev Respir Dis, 87:206–15.
Thurlbeck WM. 1995. Chronic airfl ow obstruction. In: Thurlbeck WM, Churg AM (ed). Pathology of the lung. 2nd Ed. New York: Thieme Medical Publishers, pp. 739–826.
Tonelli M, Stern EJ, Glenny RW. 1997. HRCT evident fi brosis in isolated pulmonary emphysema. J Comput Assist Tomogr, 21:322–3.
Tuder RM, Yoshida T, Arap W, et al. 2006. State of the art. Cellular and molecular mechanisms of alveolar destruction in emphysema: an evo-lutionary perspective. Proc Am Thorac Soc, 3:503–10.
Wiggins J, Strickland B, Turner-Warwick M. 1990. Combined cryptogenic fi brosing alveolitis and emphysema: the value of high resolution com-puted tomography in assessment. Respir Med, 84:365–9.
Wright JL, Churg A. 2007. Current concepts in mechanism of emphysema. Toxicologic Pathology, 35:111–15.
Yamagishi M, Koba H, Honma A, et al. 1991. [CT fi ndings in panacinar emphysema.] Nihon Kyobu Shikkan Gakkai Zasshi, 29:1407–13. [Article in Japanese]


![Acute or chronic pulmonary emphysema? Or both?—A ......emphysema or acute alveolar dilation, respectively [3 , 5]. In some cases, an interstitial emphysema is described [, 636]](https://img.pdfslide.net/doc/110x75/6138f505a4cdb41a985b64ce/acute-or-chronic-pulmonary-emphysema-or-bothaa-emphysema-or-acute-alveolar.jpg)