Embed Size (px)
Citation preview
©2014 International Monetary Fund
IMF Country Report No. 14/64
MONGOLIA 2013 ARTICLE IV CONSULTATION—STAFF REPORT; PRESS RELEASE AND STATEMENT BY THE EXECUTIVE DIRECTOR FOR MONGOLIA Under Article IV of the IMF’s Articles of Agreement, the IMF holds bilateral discussions with members, usually every year. In the context of the 2013 Article IV consultation with Mongolia, the following documents have been released and are included in this package: Staff Report for the 2013 Article IV consultation, prepared by a staff team of the IMF, for Executive Board’s consideration on November 15, 2013, following discussions that ended on September 24, 2013, with the officials of Mongolia on economic developments and policies. Based on information available at the time of these discussions, the staff report was completed on November 1, 2013.
Informational Annex prepared by the IMF.
Debt Sustainability Analysis prepared by the staffs of the IMF and the World Bank.
Press Release summarizing the views of the Executive Board as expressed during its November 15, 2013 consideration of the staff report that concluded the Article IV consultation with Mongolia.
Statement by the Executive Director for Mongolia.
The policy of publication of staff reports and other documents allows for the deletion of market-sensitive information.
Copies of this report are available to the public from
International Monetary Fund Publication Services 700 19th Street, N.W. Washington, D.C. 20431
Telephone: (202) 623-7430 Telefax: (202) 623-7201 E-mail: [email protected] Internet: http://www.imf.org
International Monetary Fund
Washington, D.C.
March 2014
MONGOLIA STAFF REPORT FOR THE 2013 ARTICLE IV CONSULTATION
KEY ISSUES Overview. Mongolia has made impressive progress in developing its economy over the past decade. Medium-term prospects remain promising given Mongolia’s large natural resource endowment, but macroeconomic policies have become unsustainably loose. The resulting balance of payments (BOP) pressures have been compounded by negative shocks to FDI and coal exports.
Outlook and Risks. Staff expect the economy to grow by 12 percent this year and 9½ percent in 2014, buoyed by the start of production at the Oyu Tolgoi (OT) copper and gold mine. Over the past two years, nonmining growth has been boosted by fiscal and monetary stimulus. In view of the uncertain external environment, Mongolia needs to change course to reduce its vulnerability to external shocks. Gross international reserves are still adequate for precautionary purposes, but they have been supported by external borrowing and the declining trend in net international reserves observed this year is not sustainable.
Policies. Securing sustainable growth while addressing macroeconomic risks requires a package of fiscal adjustment, unwinding of the monetary stimulus provided this year, and continued exchange rate flexibility. Banking sector vulnerabilities and weaknesses in the business climate also need to be addressed.
Some encouraging steps are being taken to tighten fiscal policy in the remainder of 2013 and by basing the 2014 budget on more realistic revenue projections. However, including off-budget spending by the Development Bank of Mongolia (DBM) the overall fiscal deficit in 2013 will likely again be over 10 percent of GDP. Implementation of the Fiscal Stability Law (FSL) is an urgent priority, with DBM spending to be included in the budget. Public investment projects should be reprioritized in view of constraints on absorptive and implementation capacity.
The Bank of Mongolia (BOM)’s large monetary stimulus, through its so-called “price stabilization program,” mortgage program, and liquidity injection, distorts markets and is bound to ratchet up inflation. The programs should be phased out and the BOM should focus on further strengthening the monetary policy framework while maintaining the increased exchange rate flexibility observed in recent months.
Banking sector vulnerabilities need to be addressed. They stem from weaknesses in banking supervision, inadequate provisioning, high levels of loan concentration and dollarization, and a high and rising credit-to-deposit ratio.
The government should build on the recent passage of the new investment law to further improve the business climate and encourage FDI inflows.
November 1, 2013
MONGOLIA
2 INTERNATIONAL MONETARY FUND
Approved By Markus Rodlauer and Masato Miyazaki
Discussions were held in Ulaanbaatar during September 10–24, 2013. The staff team comprised Messrs. Almekinders (head) and Yu (both APD), Ms. Kinoshita (OAP, who is in charge of the local office), and Messrs. Min (FAD), Quill (MCM), and Shin (OAP). Messrs. Rodlauer (APD), Yoon, and Moon (both OED) joined the last days of the mission. The team was assisted by Mses. Ardak, Khulan, and Selenge in the local office. Ms. Tolentino, Mr. George, and Ms. Choi (APD) assisted in the preparation of this report.
CONTENTS
RECENT ECONOMIC DEVELOPMENTS AND OUTLOOK ________________________________________ 4
A. Introduction _____________________________________________________________________________________4
B. Expansionary Policies and External Shocks Are Pressuring the BOP _____________________________5
C. Outlook and Risks _______________________________________________________________________________7
POLICY DISCUSSIONS __________________________________________________________________________ 10
A. Fiscal Policy ____________________________________________________________________________________ 10
B. Monetary and Exchange Rate Policy ___________________________________________________________ 11
C. Financial Sector Issues _________________________________________________________________________ 13
D. Structural Reforms and Statistics ______________________________________________________________ 14
STAFF APPRAISAL ______________________________________________________________________________ 15 BOXES 1. The Recent Failure of Savings Bank ____________________________________________________________ 17 2. Price Stabilization Program, Mortgage Program and Liquidity Injection _______________________ 18 3. The Monetary Policy Stance ___________________________________________________________________ 19 4. Exchange Rate Assessment ____________________________________________________________________ 20 5. Financial Soundness Indicators and Bank Stress Tests _________________________________________ 21 FIGURES 1. Real Sector Developments _____________________________________________________________________ 22 2. Fiscal and Monetary Sector Developments ____________________________________________________ 23 3. External Sector Developments _________________________________________________________________ 24 4. Inclusive Growth Indicators ____________________________________________________________________ 25 TABLES 1. Strong Policy and Weak Policy Scenarios, 2010–18 ______________________________________________8 2. Selected Economic and Financial Indicators, 2009-14 _________________________________________ 26
MONGOLIA
INTERNATIONAL MONETARY FUND 3
3. Summary Operations of the General Government, 2009–14 ___________________________________ 27 4. Statement of Operations and Stock Positions of the General Government, 2009–14 __________ 28 5. Monetary Aggregates, 2009–14 _______________________________________________________________ 29 6. Balance of Payments, 2011–18 _________________________________________________________________ 30 7. Selected Economic and Financial Indicators, 2009-18 _________________________________________ 31 8. Financial Soundness Indicators of the Banking Sector _________________________________________ 32 APPENDIXES I. Risk Assessment Matrix _________________________________________________________________________ 33 II. Mongolia’s New Fiscal Framework Anchored by the Fiscal Stability Law ______________________ 34
MONGOLIA
4 INTERNATIONAL MONETARY FUND
RECENT ECONOMIC DEVELOPMENTS AND OUTLOOK A. Introduction 1. Mongolia has made impressive progress in developing its economy (Figure 1). Spearheaded by foreign direct investment (FDI)-financed development of the mining sector, per capita income has increased five-fold, to more than US$3,000, over the past decade. Medium-term prospects are promising as mining output is projected to expand further over the next five years. Foreign investors’ optimism about Mongolia’s prospects was illustrated by successful international bond issuances in 2012. A private mining company, a private bank, the state-owned Development Bank (DBM), and the sovereign (the US$1.5 billion “Chinggis” bond) raised a total of US$3 billion (30 percent of GDP).
2. The strong growth of the economy has helped reduce poverty. Over the past two years, poverty has declined by more than 11 percentage points, to 27 percent of the population in 2012. However, indicators for inequality and unemployment suggest that there is scope to make growth more inclusive, despite relatively high social spending compared to Mongolia’s peers (Figure 4).
3. However, macroeconomic policies have been unsustainably loose the past two years. Government expenditure increased by 70 percent in real terms between 2010 and 2012, with growing importance of off-budget spending. In late-2012, the BOM embarked on a major monetary stimulus, which added to growing BOP pressures. During 2012 and the first half of 2013, BOP pressures were mostly reflected in a decline in the BOM’s Net International Reserves (NIR). In recent months, the exchange rate has become more flexible. Capitalization and liquidity of the banking system have improved. However, dollarization remains high and the provisioning regime for commercial banks lags Asian peers.
4. This year’s consultation focused on the need to adjust macroeconomic policies to rein in domestic demand growth, curtail balance of payments pressures, and contain inflation. In particular, discussions centered on the implementation of the 2010 Fiscal Stability Law (FSL)—which has now become effective and which prescribes a 2 percent of GDP limit on the structural fiscal deficit (Appendix II) 1—as well as the need for a significant correction in the monetary policy stance.
1 The new fiscal framework implied by the 2010 Fiscal Stability Law (FSL) was adopted in the aftermath of the 2008/09 balance of payments (BOP) crisis. It focuses on prudent natural resource management, taking into account absorptive capacity constraints—in particular, macroeconomic stability and overheating concerns, and concerns about the efficiency of scaled-up public investments, as well as intergenerational concerns. The framework was designed with substantial input from the IMF (FAD), consistent with the principles and international experience summarized in the 2012 IMF Policy Paper on Macroeconomic Policy Frameworks for Resource-Rich Developing Countries. In turn, that paper noted that the Mongolian fiscal policy framework anchored by the FSL constitutes a relevant example for other middle- and low-income countries with large revenue from nonrenewable resources.
Staff Recommendations Made in the Context of the Last Two Article IV Consultations Scale back the growth of total government spending in view of inflation and BOP pressures. Take off-budget spending into account when determining the macro-economically sustainable
level of total government spending. Monetary easing should be contingent on demand pressures abating and prudent fiscal policy. BOP pressures should be reflected more in movements in the exchange rate. Continue efforts to strengthen the soundness and resilience of the banking system.
MONGOLIA
INTERNATIONAL MONETARY FUND 5
Other key topics included a renewed focus on financial sector risks—illustrated by the recent failure of Savings Bank (Box 1)—and structural reforms to clarify the investment regime and boost non-mining growth. Staff liaised with Mongolia’s bilateral and multilateral development partners. While noting Mongolia’s longer-term infrastructure needs, they shared the staff’s concerns about the unsustainably loose macroeconomic policies.
5. A new government took over in 2012. The June 2012 parliamentary elections were won by the opposition Democratic Party, which formed a coalition government with three smaller parties and appointed a new central bank governor. With the June 2013 reelection of President Elbegdorj, the Democratic Party now essentially controls government for the next three years.
B. Expansionary Policies and External Shocks Are Pressuring the BOP
6. The Mongolian economy has continued to grow very rapidly. The economy expanded by 12½ percent in 2012 and by 11½ percent in the first half of 2013. Growth has been buoyed by a relatively mild winter boosting agriculture and highly expansionary fiscal and monetary policies. The latter have been deployed to compensate for the marked slowdown in coal exports and FDI-financed mining development—key drivers of growth in recent years.
7. However, BOP pressures have intensified and inflation is bound to rise:
Negative shocks to FDI and coal exports increased BOP pressures from mid-2012 onwards. These pressures have been compounded by highly expansionary fiscal and monetary policies that are boosting the demand for non-mining imports.
Inflation fell to a two-year low of 7 percent in July thanks to moderating food prices and the Bank of Mongolia’s (BOM) price stabilization program. However, the depreciation of the togrog of the past three months is likely to push up inflation in the coming months.
8. Monetary policy has been highly expansionary. To cushion the impact of declining FDI and to boost credit growth, the BOM took a two-pronged approach: it cut the policy rate three times by a total of 275 basis points to 10.5 percent; and it lent substantial sums to banks at below-market rates, including for on-lending to selected sectors through the price stabilization and mortgage programs (Box 2). If it wasn’t for a large decline in its international reserves, the BOM’s balance sheet and hence reserve money would have more than doubled in just 6 months. Commercial banks have been taking advantage of the large provision of cheap BOM funding, and private sector credit growth accelerated to 47 percent in August (y/y).
9. Fiscal policy has remained highly expansionary.
The overall fiscal deficit (including DBM operations) rose to 10.9 percent of GDP in 2012, 6 percent of GDP higher than in 2011:
The 2012 budget outturn recorded a deficit of 7.5 percent of GDP. Revenue growth decelerated on declining FDI inflows. On-budget expenditures rose by 20 percent, in part due to large increases in civil servants’ wages.
MONGOLIA
6 INTERNATIONAL MONETARY FUND
Off-budget spending by the government-owned DBM amounted to 3.4 percent of GDP in 2012. This spending should also be included in the assessment of the fiscal policy stance. The DBM’s debt is guaranteed by the government and has to be serviced by the government budget. A large part of DBM spending is on non-revenue-generating public investment projects such as roads. For several of the “revenue-generating projects” there is a substantial risk that the DBM will not be repaid, e.g. the US$200 million it has provided to the loss-making state-owned coal producer Erdenes Tavan Tolgoi.
Government spending continued to rise sharply during the first 8 months of 2013. Spending by the budget was unchanged from a year ago. However, including the more than MNT 1 trillion (6½ percent of GDP) spending by the DBM, total government spending rose by 30 percent compared to the same period last year.
Public debt has been rising rapidly. Excluding an additional foreign bond issuance under discussion, public debt is projected to reach 67 percent of GDP by the end of 2013, up from 39 percent just two years ago. Moreover, the cost and risk profile of the public debt have become less favorable. The share of concessional loans has declined, the bulk of the debt is denominated in foreign currency, and substantial refinancing risk has emerged for 2017. The IMF/World Bank Debt Sustainability Analysis (DSA) now indicates that Mongolia is at moderate risk of debt distress.
10. BOP pressures caused by the external shocks and expansionary policies have been absorbed by BOM foreign exchange sales financed from external borrowing and, more recently, increased exchange rate flexibility. Gross international reserves currently amount to US$2.4 billion (about 3.7 months of prospective imports), about the same level as a year ago. External borrowing has helped keep reserves at this level. For instance, the government deposited the sovereign “Chinggis” bond proceeds at the BOM. This helped to raise the BOM’s Gross International Reserves (GIR) to a record US$4.1 billion at end-2012. As a result of persistent sales of foreign exchange in the spot and forward market, GIR subsequently fell to US$2.4 billion (Figure 3). Over the past year, the exchange rate has depreciated by 22 percent vis-à-vis the U.S. dollar, with most of this occurring in the last four months.
11. International financial markets are becoming more concerned about developments in Mongolia. The key selling points for Mongolia’s successful maiden sovereign bond issuance in late-2012 were the new fiscal policy framework anchored by the FSL becoming operational in 2013 and the imminent start of exports from the Oyu Tolgoi (OT) copper mine. However, sentiment subsequently suffered with downward pressures on international reserves, the uncertain external outlook, and the Savings Bank failure. By mid-September, as yields on relatively risky assets rose in anticipation of the US Federal Reserve System starting to taper its asset purchases, Mongolia’s sovereign spread had widened about 140 basis points more than the average for emerging markets since the issuance. With the postponement of “Fed tapering”, the “excess spread” has narrowed again (Figure 3).
MONGOLIA
INTERNATIONAL MONETARY FUND 7
C. Outlook and Risks 12. The near-term outlook for growth is favorable but inflation will likely rise.
Growth is projected to remain in or near double digits in 2013 and 2014. Mineral GDP will be boosted by the start of commercial operations at the Oyu Tolgoi (OT) copper mine and expansion of coal production from the Tavan Tolgoi (TT) mine. Non-mineral GDP growth is projected at 11 percent in 2013, supported by expansionary monetary and fiscal policies. Non-mineral GDP growth in 2014 depends in part on the pace of DBM disbursements for investments in public investment projects and the extent to which the BOM’s stimulus programs are continued.
Inflation is projected to move above 10 percent and remain there through late-2014. In the context of continued strong growth of domestic demand, and notwithstanding the BOM’s continued operation of the price stabilization program, the depreciation of the exchange rate observed in recent months will likely spill over into higher inflation.
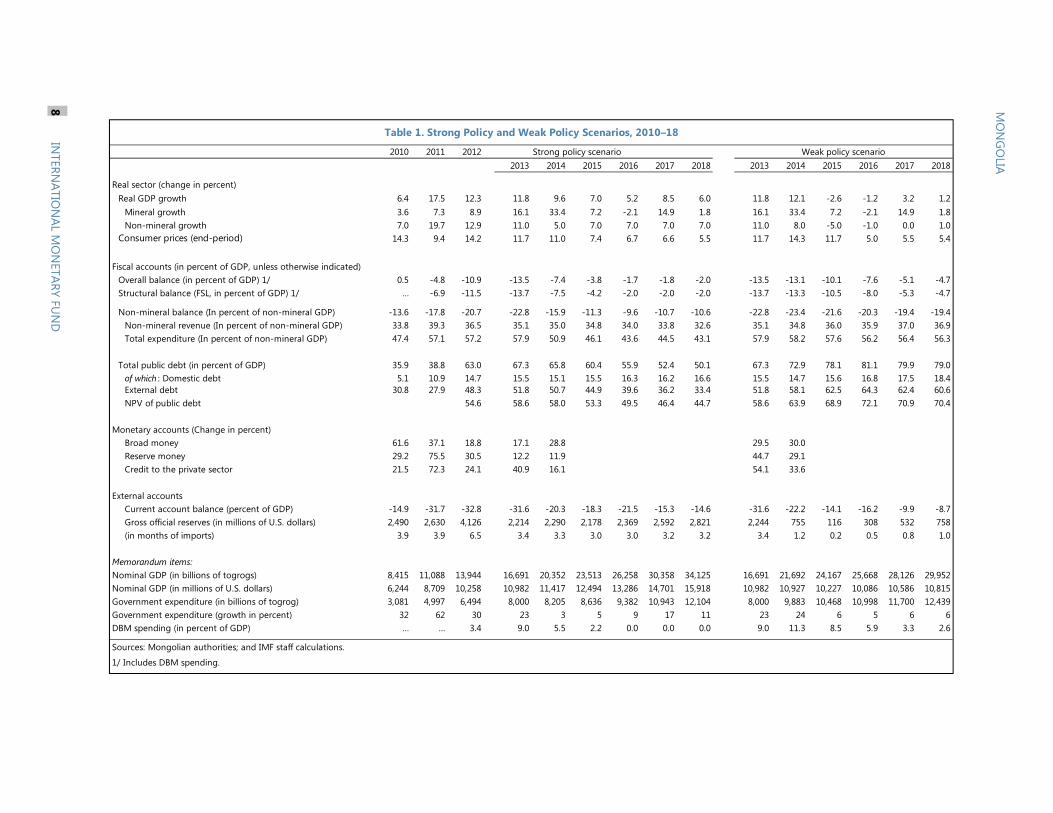
13. However, continuation of current policies could lead to a highly vulnerable situation. The important policy decisions facing the authorities are highlighted by a comparison of a “strong policy scenario” with a “weak policy scenario” (see Table 1 on next page):
In the strong policy scenario, which is quantified in more detail in Tables 2–7, the medium-term budget framework is consistent with the FSL. On-budget fiscal operations observe the FSL starting with a 2014 budget based on realistic revenue projections. The off-budget program of public investment projects is phased out by the end of 2015. To help ease demand and BOP pressures further, the BOM’s stimulus programs are phased out by mid-2014.
The weak policy scenario illustrates the risks of a continuation of current policies amid continued weakness of FDI inflows and coal exports. In this scenario, it takes the government two more years to bring on-budget fiscal operations in line with the FSL. In addition, the government continues to pursue its development strategy through the implementation of off-budget public investment projects. This would be broadly in line with the medium-term budget framework for 2014-16 which was approved in May and envisages continued large international bond issuances. Finally, the BOM’s stimulus measures are phased out only gradually (by 2015). In this scenario, non-mining growth in 2014 would be higher than in the strong policy scenario. However, Mongolia would run a progressively more serious risk of a BOP crisis. In case of crisis, the required large adjustment of absorption would cause a cumulative non-mining output loss of about 20 percentage points, compared to the strong policy scenario, over a 4 year horizon (calibrated on cross-country experiences summarized in WP/08/224 and the Board Paper on “Assessing Reserve Adequacy”). The larger exchange rate depreciation (compared to the strong policy scenario) would add to inflationary pressures. The implications of the weak policy scenario for key indicators of public external debt public are illustrated in the Debt-Sustainability Analysis.
14. In addition to the risks posed by the continuation of current policies, the outlook is subject to other downside near- and medium-term risks (see Risk Assessment Matrix, Appendix I):
2010 2011 2012 Strong policy scenario2013 2014 2015 2016 2017 2018 2013 2014 2015 2016 2017 2018
Real sector (change in percent)Real GDP growth 6.4 17.5 12.3 11.8 9.6 7.0 5.2 8.5 6.0 11.8 12.1 -2.6 -1.2 3.2 1.2
Mineral growth 3.6 7.3 8.9 16.1 33.4 7.2 -2.1 14.9 1.8 16.1 33.4 7.2 -2.1 14.9 1.8Non-mineral growth 7.0 19.7 12.9 11.0 5.0 7.0 7.0 7.0 7.0 11.0 8.0 -5.0 -1.0 0.0 1.0
Consumer prices (end-period) 14.3 9.4 14.2 11.7 11.0 7.4 6.7 6.6 5.5 11.7 14.3 11.7 5.0 5.5 5.4
Fiscal accounts (in percent of GDP, unless otherwise indicated)Overall balance (in percent of GDP) 1/ 0.5 -4.8 -10.9 -13.5 -7.4 -3.8 -1.7 -1.8 -2.0 -13.5 -13.1 -10.1 -7.6 -5.1 -4.7Structural balance (FSL, in percent of GDP) 1/ … -6.9 -11.5 -13.7 -7.5 -4.2 -2.0 -2.0 -2.0 -13.7 -13.3 -10.5 -8.0 -5.3 -4.7
Non-mineral balance (In percent of non-mineral GDP) -13.6 -17.8 -20.7 -22.8 -15.9 -11.3 -9.6 -10.7 -10.6 -22.8 -23.4 -21.6 -20.3 -19.4 -19.4Non-mineral revenue (In percent of non-mineral GDP) 33.8 39.3 36.5 35.1 35.0 34.8 34.0 33.8 32.6 35.1 34.8 36.0 35.9 37.0 36.9Total expenditure (In percent of non-mineral GDP) 47.4 57.1 57.2 57.9 50.9 46.1 43.6 44.5 43.1 57.9 58.2 57.6 56.2 56.4 56.3
Total public debt (in percent of GDP) 35.9 38.8 63.0 67.3 65.8 60.4 55.9 52.4 50.1 67.3 72.9 78.1 81.1 79.9 79.0of which : Domestic debt 5.1 10.9 14.7 15.5 15.1 15.5 16.3 16.2 16.6 15.5 14.7 15.6 16.8 17.5 18.4External debt 30.8 27.9 48.3 51.8 50.7 44.9 39.6 36.2 33.4 51.8 58.1 62.5 64.3 62.4 60.6NPV of public debt 54.6 58.6 58.0 53.3 49.5 46.4 44.7 58.6 63.9 68.9 72.1 70.9 70.4
Monetary accounts (Change in percent)Broad money 61.6 37.1 18.8 17.1 28.8 29.5 30.0Reserve money 29.2 75.5 30.5 12.2 11.9 44.7 29.1Credit to the private sector 21.5 72.3 24.1 40.9 16.1 54.1 33.6
External accountsCurrent account balance (percent of GDP) -14.9 -31.7 -32.8 -31.6 -20.3 -18.3 -21.5 -15.3 -14.6 -31.6 -22.2 -14.1 -16.2 -9.9 -8.7Gross official reserves (in millions of U.S. dollars) 2,490 2,630 4,126 2,214 2,290 2,178 2,369 2,592 2,821 2,244 755 116 308 532 758(in months of imports) 3.9 3.9 6.5 3.4 3.3 3.0 3.0 3.2 3.2 3.4 1.2 0.2 0.5 0.8 1.0
Memorandum items:Nominal GDP (in billions of togrogs) 8,415 11,088 13,944 16,691 20,352 23,513 26,258 30,358 34,125 16,691 21,692 24,167 25,668 28,126 29,952Nominal GDP (in millions of U.S. dollars) 6,244 8,709 10,258 10,982 11,417 12,494 13,286 14,701 15,918 10,982 10,927 10,227 10,086 10,586 10,815Government expenditure (in billions of togrog) 3,081 4,997 6,494 8,000 8,205 8,636 9,382 10,943 12,104 8,000 9,883 10,468 10,998 11,700 12,439Government expenditure (growth in percent) 32 62 30 23 3 5 9 17 11 23 24 6 5 6 6DBM spending (in percent of GDP) … … 3.4 9.0 5.5 2.2 0.0 0.0 0.0 9.0 11.3 8.5 5.9 3.3 2.6
Sources: Mongolian authorities; and IMF staff calculations.
1/ Includes DBM spending.
Table 1. Strong Policy and Weak Policy Scenarios, 2010–18
Weak policy scenario
MO
NG
OLIA
8 IN
TERNATIO
NAL M
ON
ETARY FUN
D
MONGOLIA
INTERNATIONAL MONETARY FUND 9
Spillovers from weakening external demand for commodities could further dampen mining export revenues. Advanced economies will eventually exit from the very supportive monetary policies implemented in recent years. China’s economy is expected to rebalance away from a mostly investment-based growth model toward a more consumption-based growth model. Both these factors will likely have significant spillovers globally and especially in the region. China accounts for more than 90 percent of Mongolia’s exports and the recent World Economic Outlook identifies Mongolia as one of the most vulnerable countries to a rebalancing of demand in China. Slowing growth in China would affect Mongolia via trade and FDI channels.
External shocks and/or the continuation of current policies could expose vulnerabilities in the banking system, exacerbating a negative shock to growth and financial stability.
15. Mongolia’s medium-term prospects remain promising. Mongolia’s large natural resource endowment and its proximity to the fastest-growing economies in the world provide ample opportunities for development. The start of copper production at the OT open pit mine, the development of the OT underground mine, and the ramp up of coal production from the TT mine are projected to keep the growth of mineral GDP at about 16 percent per annum, on average, during 2013-17. Activity outside the mining sector is also projected to remain buoyant, although this would need to be supported by continued reforms to strengthen the foundation of the economy and the business climate.
Authorities’ Views
16. The authorities expressed optimism about continued strong growth alongside a strengthening of the BOP in the course of 2014 and over the medium term. The centerpiece of their development strategy was scaled-up public investment, including in transportation infrastructure, financed by foreign borrowing, to be sustained by continued rapid economic growth and a recovery of export earnings. They pointed at their achievements, despite the external shocks, including continued double-digit economic growth, buoyed by sharply rising domestic investments, with inflation kept at manageable levels. The authorities projected the economy to grow by 15 percent per annum, on average, during 2013-2016. They expected mining and non-mining output to record average annual growth of 32 percent and 11 percent, respectively.
17. The authorities acknowledged the downside risks to the external outlook but indicated they were taking steps to address prevailing BOP pressures. Government spending was being curtailed for the remainder of the year (¶22). The BOM was discussing plans to unwind some of the monetary stimulus (¶30). The recent exchange rate depreciation was dampening the demand for imports (¶31). And Parliament passed a new Investment Law aimed at boosting FDI and domestic investment (¶38). New foreign borrowing in the coming months and an anticipated rebound in coal exports starting in the last quarter of this year would help holding immediate BOP pressures at bay. On that basis, the authorities did not consider necessary at this time an additional package of macroeconomic adjustments and reforms as outlined in the “strong policy scenario.”
MONGOLIA
10 INTERNATIONAL MONETARY FUND
POLICY DISCUSSIONS 18. Notwithstanding Mongolia’s promising medium-term prospects, macroeconomic policies are on an unsustainable path and need to be adjusted to rein in domestic demand growth, curtail balance of payments pressures, and contain inflation. The discussions centered on the need for a package of fiscal adjustment, unwinding of the monetary stimulus, and continued exchange rate flexibility. Banking sector vulnerabilities and uncertainties surrounding the foreign investment regime also need to be addressed.
A. Fiscal Policy
19. Some encouraging steps have recently been taken to tighten fiscal policy. These steps would moderate spending growth during the remainder of 2013 and provide a good foundation for the preparation of the 2014 budget:
The Minister of Finance announced plans to reduce budgetary spending by almost MNT 1 trillion (6 percent of GDP) so as to keep the 2013 budget within the FSL’s 2 percent of GDP ceiling for the structural fiscal deficit.
During the remainder of 2013, the DBM will not receive additional funding from the Chinggis-bond proceeds currently held by the government at the BOM. The DBM would pay out the cash it currently has on hand (MNT 0.4 trillion) on ongoing public investment projects.
The Ministry of Finance has initiated work on the 2014 budget based on a relatively conservative projection for government revenue.
20. However, given the sustained BOP pressures and the uncertain outlook, staff argued that further steps were needed. Even with the measures listed above, the fiscal deficit including DBM operations in 2013 would top last year’s level (10.9 percent of GDP) and public debt (including BOM external borrowing) would reach about 67 percent of GDP. This raises doubts about the consistency of fiscal policy with the FSL
DBM operations should be included in the budget starting with the 2014 budget. The DBM was founded after the FSL was adopted, and the FSL is not clear about whether the structural deficit rule applies to public sector off-budget activities. Lack of clarity on this issue in the FSL has led to off-budget public sector activities being excluded from the rule. However, the main purpose of the FSL is “ensuring fiscal stability” (Article 1), and the law envisages comprehensive coverage of public debt (Article 4.1.8). On that basis, off-budget activities through the DBM should be reflected in the calculation of all FSL requirements.
An ambitious and credible fiscal consolidation plan should be drawn up, consistent with the FSL. Budget operations and the operations of the DBM taken together should meet the 2 percent of GDP ceiling for the structural deficit in due course. Given the sustained BOP pressures, the planned adjustment needs to be adequately frontloaded, spearheaded by streamlining
MONGOLIA
INTERNATIONAL MONETARY FUND 11
subsidies and transfers and reprioritizing capital spending. Even so, the overall deficit (including DBM operations) and the public debt would likely exceed the FSL limits in the next 2–3 years, which should be transparently explained to Parliament. Over the medium term, and given also current economic conditions and vulnerabilities, the FSL ceilings for the deficit and public debt remain appropriate and should anchor adjustments to a sustainable policy path.
DBM spending should be re-phased and re-prioritized. DBM spending is projected to amount to 9 percent of GDP in 2013 and has contributed considerably to BOP pressures. To help ease these pressures, the Ministry of Economic Development and the DBM should prepare a prioritized list of capital expenditure items in their portfolios and only implement the projects with the highest payoff in terms of contributions to medium-term growth.
The Social Welfare Law (SWL) should be implemented. The 2012 SWL envisages replacing existing costly universal cash transfers with means-tested benefits that would reach the poorest households. This would help increase fiscal flexibility and reduce inequality.
21. The set up of a sovereign wealth fund (SWF) should be completed. The establishment of a SWF would be an important complement to the FSL’s countercyclical fiscal policy. Technical work on setting up a SWF should be finalized, building on technical assistance provided by the World Bank and the IMF.
Authorities’ Views
22. The authorities confirmed their commitment to observe the 2 percent of GDP ceiling for the structural deficit for on-budget operations in 2013 and 2014. Cuts of current and capital spending for the rest of the year had been decided through a Cabinet Resolution and would be reflected in a supplementary 2013 budget to be discussed by Parliament in November. Discussions on the 2014 budget had started based on realistic revenue projections.
23. They noted that DBM spending represented a key policy instrument to boost growth in the short- and medium term. DBM spending was approved by parliament and bringing it on-budget could be done in different ways. In view of the uncertain economic outlook, the authorities were not ready to commit to a target date by which the overall fiscal deficit including DBM operations would observe the 2 percent of GDP structural deficit ceiling. They were looking to issue another international bond to finance additional DBM spending until an expected pick up in exports and growth would kick in. The authorities expressed an interest in further discussing with staff the appropriateness of the FSL debt and deficit ceilings and the treatment of DBM operations under those ceilings.
B. Monetary and Exchange Rate Policy
24. The monetary policy framework has been strengthened. Earlier this year, the BOM introduced a policy interest rate corridor. The auctioning of treasury bills was modernized. And the adoption of the new Securities Law should facilitate secondary market trading of treasury bills. These measures are important in strengthening the interest rate channel of monetary policy.
MONGOLIA
12 INTERNATIONAL MONETARY FUND
25. However, the large monetary and quasi-fiscal stimulus provided through three new BOM programs creates risks and distortions, and should be unwound. The three programs loosen the monetary policy stance, creating inflationary and BOP pressures (Box 3). They also heighten banking sector vulnerabilities and could give rise to contingent liabilities for the public sector (Box 2).
26. Exchange rate flexibility has increased in recent months. The floating exchange rate regime and auction system should be maintained. Intervention should be limited to smoothing excessive exchange rate volatility. To support medium- and long-term external stability and the exchange rate regime, appropriate fiscal and monetary policies are key, along the lines recommended above.
27. The real exchange rate is assessed to be moderately overvalued, even in the strong policy scenario which assumes a tightening of monetary and fiscal policy (Box 4). The overvaluation, and the risk of a further large adjustment of the nominal exchange rate, would become more pronounced in case the loose fiscal and monetary policy implemented so far this year continued. This assessment takes into account the full development of the OT and TT mines. While the current account is projected to continue to show a large deficit over the five-year projection period, the long-term prospects are favorable, as the current account is expected to gradually move to a surplus.
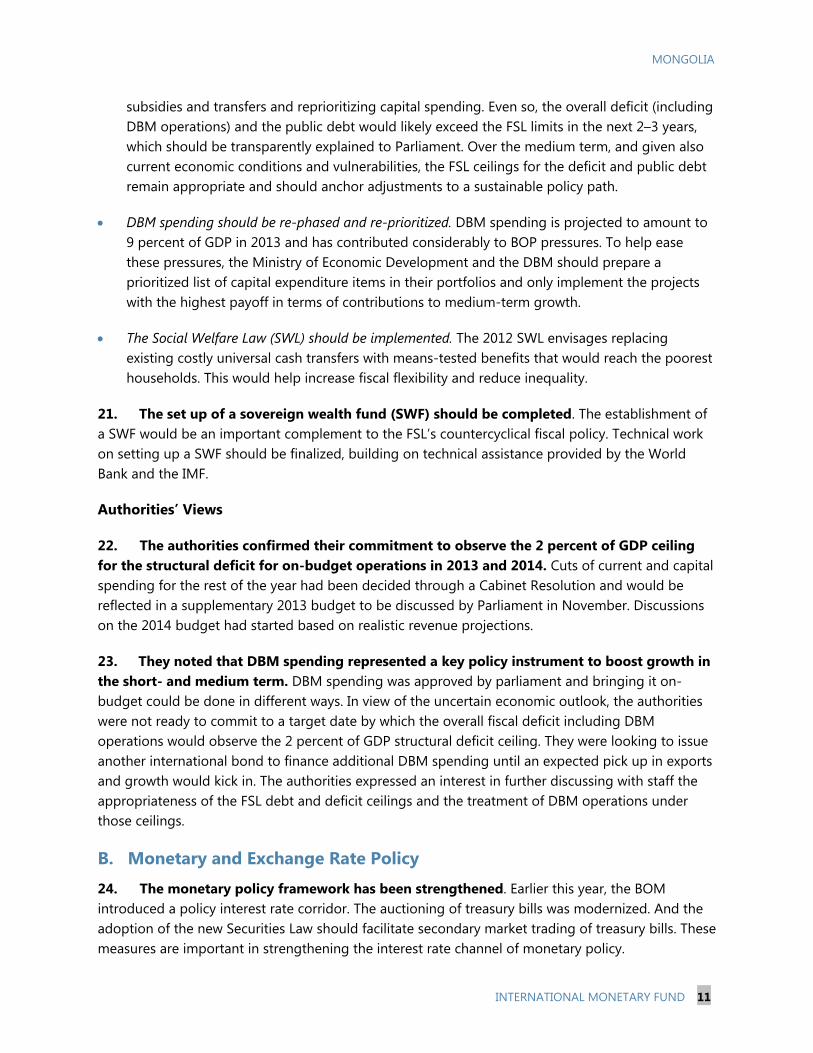
28. Even though international reserves have been on a downward trajectory, they are still adequate for precautionary purposes based on traditional assessment criteria. A recently developed risk-based metric of reserve adequacy (see SM/11/31) suggests that Mongolia may need to hold more reserves than it currently does. Moreover, the declining trend in net international reserves—taking into account the deposits taken from commercial banks and the BOM’s increasing foreign liabilities—is not sustainable, underscoring the need for policy adjustment.
Authorities’ Views
29. The authorities explained that countercyclical monetary policy had been implemented to prevent a serious economic downturn and a credit crunch. They noted that Mongolia faced a difficult economic outlook in late-2012, owing to the negative shocks to FDI and coal exports. The BOM’s stimulus programs had succeeded in reviving demand and supporting growth while keeping inflation on a downward trajectory.
30. The intention is to phase out the monetary stimulus programs over time. The BOM deposits placed with commercial banks would be pulled back in the coming months. The new mortgages sold by banks would be taken off their books through securitization operations, and
0
500
1,000
1,500
2,000
2,500
3,000
3,500
0
500
1,000
1,500
2,000
2,500
3,000
3,500
Import Cover Broad Money Short-term debt Risk Metric
Reserves Assessed Under Different Approaches (In millions of U.S. dollars)
Implied GIR
Actual GIR at end-September 2013
100 percent of short-term debt20 percent of
broad money
150 percent of metric coverage
3 months of imports
MONGOLIA
INTERNATIONAL MONETARY FUND 13
banks would be obliged to repay the freed-up funds to the BOM. The authorities were confident that the implications for banking-sector liquidity were manageable and that refinancing risks were not an issue, pointing at commercial banks’ large holdings of central bank bills. The BOM would continue to operate the price stabilization program pending the development of market-based, efficient warehouse financing with private-sector participation.
31. The authorities reaffirmed their commitment to the floating exchange rate regime. They expressed broad agreement with staff’s assessment of the exchange rate and reserve adequacy. While the exchange rate depreciation in July and August was due to a string of bad news, including with regard to the ongoing discussions among OT shareholders, the authorities noted that its dampening effect on import demand was already visible.
C. Financial Sector Issues
32. Good progress has been made in strengthening banks’ capitalization and liquidity, and reported non-performing loans are low (Box 5). The higher capital adequacy ratio (CAR) of 14 percent for the four largest, systemically important banks that was achieved by mid-2013 is providing welcome additional buffers. Moreover, the higher minimum paid-in capital requirement (MNT 16 billion) and higher Tier 1 capital ratio (9 percent) are helpful for the relatively more vulnerable small- and medium-size banks.
33. Nevertheless, as illustrated by the recent failure of Savings Bank, the banking sector harbors significant vulnerabilities. There is a need to strengthen corporate governance practices and enforcement of regulations, including single borrower limits. Mongolia’s loan-to-deposit ratio and level of dollarization are among the highest in Asia. Surging credit growth is likely to have posed a challenge to prudent underwriting practices and supervision. The currency depreciation of the past four months could adversely affect credit quality of foreign currency-denominated loans. In light of the relatively undiversified nature of the economy, the banking system also remains vulnerable to a downturn in the mining sector and a deceleration of government spending.
34. To contain financial sector risks, the regulatory and supervisory framework should be strengthened further:
The BOM should strictly enforce the existing prudential regulations and continue to improve prudential indicators. The existing lending limits on a single borrower and a bank-related party should be rigorously enforced. Focus should also be on strengthening underwriting practices as well as on addressing deficiencies in loan classifications and NPL recognition. The BOM should consider phasing in a more forward-looking provisioning scheme that takes into account the risks of losses on performing loans.
The newly expanded State Bank should be recapitalized promptly and plans should be developed toward its privatization.
The supervisory and bank resolution regimes should be enhanced. Following up on the implementation of the 2010 FSAP recommendations, a strategic plan should be developed to
MONGOLIA
14 INTERNATIONAL MONETARY FUND
implement a robust supervisory regime and strengthen the bank resolution framework. In addition, there is a need to develop a legal framework for prompt corrective actions that mandates progressively stronger supervisory actions as a bank’s capital declines. The recently established Deposit Insurance Corporation and the BOM, in collaboration with other appropriate entities, should develop a comprehensive framework to address standalone resolution requirements, as well as a systemic financial crisis.
Lending dollarization should be discouraged. Mongolia’s relatively high dollarization, in conjunction with the relatively small size of non-mining exports, suggests that the non-bank private sector may have a considerable foreign currency mismatch with attendant risks. Yet the 2010 FSAP recommendation to establish guidelines for foreign exchange lending still has to be followed up. Ideally, banks should only be allowed to lend in foreign currency to hedged borrowers. Alternatively, consideration could be given to additional prudential measures such as higher risk weights on foreign currency-denominated loans and caps on individual banks’ foreign currency loan-to-deposit ratio.
35. Efforts to strengthen the Anti-Money Laundering/Countering the Financing of Terrorism (AML/CFT) framework need to be stepped up. In October 2013, the Financial Action
Task Force (FATF) designated Mongolia as a jurisdiction not making sufficient progress in implementing
the agreed action plan to enhance its AML/CFT framework. There is a risk that, absent sufficient
progress by February 2014, the country will be placed on the FATF blacklist, which would lead to
heightened due diligence from foreign financial institutions regarding transactions with Mongolia.
Authorities’ Views
36. The authorities expressed broad satisfaction with their management of financial sector risks. Following the failure of Savings Bank there were no more banks under a Supervisory Action Plan. Adequate safeguards had been built into the mortgage program (e.g. minimum down-payment requirements and maximum loan-to-value ratios). The authorities also pointed out that the bulk of unhedged foreign-currency loans were to larger, more-diversified corporations who they considered able to internalize the foreign currency risk. They further noted that the timing was not right to adjust the provisioning regime.
D. Structural Reforms and Statistics
37. Efforts to improve the business climate and trade integration should continue. Mongolia ranks relatively high in the World Bank’s Doing Business Survey. However, there is scope to further streamline procedures and strengthen policy frameworks to boost private-sector-led non-mineral growth. For instance, trading across borders, getting electricity and dealing with construction permits remain relatively cumbersome.
38. Adoption of a new Investment Law on October 3 is a major milestone in the authorities’ quest to revive domestic and foreign direct investment. The recent extraordinary session of Parliament discussed a package of 5 laws aimed at boosting investment and gold exports by streamlining and stabilizing rules and procedures for domestic and foreign investors. These
MONGOLIA
INTERNATIONAL MONETARY FUND 15
discussions have been brought to fruition through the recent adoption of the new Investment Law and the Investment Fund Law.
39. Efforts to strengthen macroeconomics statistics should continue. Good progress is being made in upgrading national accounts and balance of payments statistics, building on recommendations made by technical assistance experts. Timely release of data on DBM spending is needed to facilitate comprehensive assessments of the fiscal policy stance.
STAFF APPRAISAL 40. Mongolia continues to be one of the fastest growing economies in Asia. Growth in 2012 and the first half of 2013 was buoyed by the development of new large mining projects, a relatively mild winter boosting agriculture, and highly expansionary fiscal and monetary policies. Inflation fell to a two-year low in July thanks to moderating food prices and the BOM’s price stabilization program. Poverty continued to decline in 2012.
41. However, BOP pressures have been intensifying and inflation is bound to rise again. To cushion the impact on domestic activity of declining FDI and coal exports, monetary and fiscal policy have been loosened markedly. Through mid-year, the resulting BOP pressures were met by intervention, supported by large sovereign and BOM external borrowing. More recently, the exchange rate has been allowed to depreciate, which will likely push up inflation in the coming months.
42. A continuation of current policies could lead to a highly vulnerable situation. The near-term outlook for growth is favorable. However, continued elevated fiscal spending, including through off-budget public investment projects, and failure to rein in credit growth could heighten risks to the economy and the financial sector. Given Mongolia’s exposure to external shocks, this could necessitate a costly and painful adjustment down the road. In particular, the outlook is subject to risks from the uncertain outlook for external demand for commodities which could negatively impact Mongolia via trade and FDI channels. There is also a risk that vulnerabilities in the banking system could be exposed, which could exacerbate a negative shock to growth and financial stability. The IMF/World Bank Debt Sustainability Analysis (DSA) now indicates that Mongolia is at a moderate risk of debt distress.
43. Putting the economy on a sustainable path requires implementation of a package of fiscal and monetary adjustment in the context of a flexible exchange rate regime, as outlined in the “strong policy scenario”. In this regard, some encouraging steps have been taken in recent months, particularly in the areas of fiscal policy and exchange rate policy. This signals a good start by the authorities to initiate the “strong policy scenario,” provided the monetary expansion and off-budget fiscal operations are reined in.
44. An ambitious and credible fiscal consolidation plan should be drawn up. Recently announced steps would moderate spending growth during the remainder of 2013 and provide a solid foundation for the preparation of the 2014 budget. However, further measures are urgently
MONGOLIA
16 INTERNATIONAL MONETARY FUND
needed. Even with the announced steps, this year’s fiscal deficit (including DBM operations) will still be very large and public debt, including external borrowing by the Bank of Mongolia, will reach about 67 percent of GDP this year, up from 39 percent of GDP in 2011. This raises doubts about the consistency of fiscal policy with the FSL. Budget operations and the operations of the DBM taken together should meet the 2 percent of GDP ceiling for the structural deficit over the next 2-3 years. Given the sustained BOP pressures, the planned adjustment needs to be adequately frontloaded, spearheaded by streamlining subsidies and transfers and reprioritizing capital spending.
45. Reform of the fiscal policy framework should continue. Implementation of the SWL would enhance fiscal flexibility and efficiency and reduce inequality. Establishment of a SWF would be an important complement to the FSL’s countercyclical fiscal policy framework.
46. The large monetary stimulus provided by the BOM should be unwound. The three BOM programs that have been launched over the past year have unduly loosened the monetary policy stance, creating inflationary and BOP pressures. Moreover, they create important distortions, heighten banking sector vulnerabilities, and could give rise to contingent liabilities for the public sector.
47. The increased exchange rate flexibility observed in recent months has helped absorb some of the BOP pressures. The floating exchange rate regime and auction system should be maintained, and intervention should be limited to smoothing excessive exchange rate volatility. While gross reserves remain adequate for precautionary purposes, net international reserves are on a downward trajectory that is not sustainable The real exchange rate is assessed to be moderately overvalued, even in a strong policy scenario which assumes a tightening of monetary and fiscal policy.
48. Efforts to contain financial sector risks should continue. Building on progress in strengthening banks’ capitalization and liquidity, the BOM should strictly enforce existing prudential regulations, including single-borrower limits. Focus should also be on strengthening underwriting practices, loan classifications, and NPL recognition. The BOM should consider phasing in a more forward-looking provisioning scheme that takes into account the risks of losses on performing loans. Lending dollarization should be discouraged. The bank resolution regime should be enhanced, and a legal framework developed for prompt corrective actions that mandates progressively stronger supervisory actions as a bank’s capital declines. Efforts to strengthen the AML/CFT framework need to be stepped up to avoid blacklisting by the FATF.
49. Mongolia’s medium-term prospects remain promising. Mongolia’s large natural resource endowment and its proximity to fast-growing economies provide ample opportunities for development. Mining GDP is projected to expand rapidly during the next five years thanks to large mining projects coming on stream. The sustained growth of activity outside the mining sector would need to be supported by continued reforms to strengthen the business climate, building on the government’s recent success in passing a new investment law. Efforts to strengthen macroeconomic statistics should continue.
50. It is recommended that the next Article IV consultation take place on the standard 12-month cycle.
MONGOLIA
INTERNATIONAL MONETARY FUND 17
Box 1. The Recent Failure of Savings Bank1
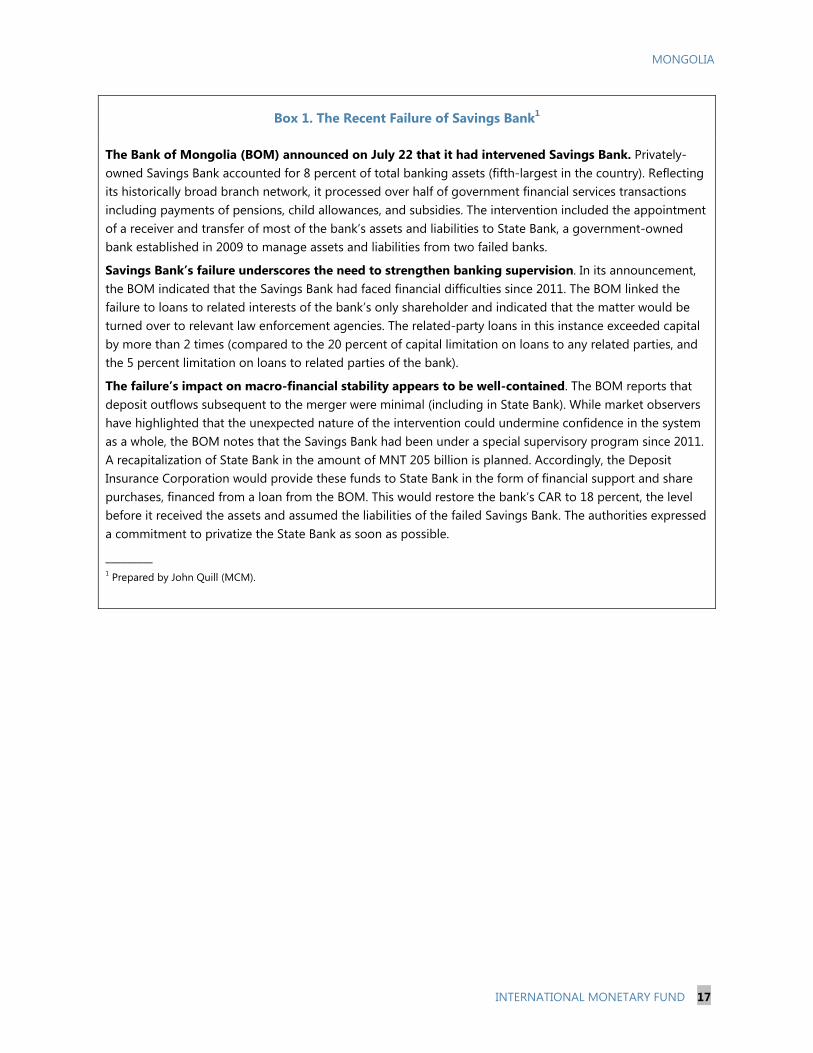
The Bank of Mongolia (BOM) announced on July 22 that it had intervened Savings Bank. Privately-owned Savings Bank accounted for 8 percent of total banking assets (fifth-largest in the country). Reflecting its historically broad branch network, it processed over half of government financial services transactions including payments of pensions, child allowances, and subsidies. The intervention included the appointment of a receiver and transfer of most of the bank’s assets and liabilities to State Bank, a government-owned bank established in 2009 to manage assets and liabilities from two failed banks.
Savings Bank’s failure underscores the need to strengthen banking supervision. In its announcement, the BOM indicated that the Savings Bank had faced financial difficulties since 2011. The BOM linked the failure to loans to related interests of the bank’s only shareholder and indicated that the matter would be turned over to relevant law enforcement agencies. The related-party loans in this instance exceeded capital by more than 2 times (compared to the 20 percent of capital limitation on loans to any related parties, and the 5 percent limitation on loans to related parties of the bank).
The failure’s impact on macro-financial stability appears to be well-contained. The BOM reports that deposit outflows subsequent to the merger were minimal (including in State Bank). While market observers have highlighted that the unexpected nature of the intervention could undermine confidence in the system as a whole, the BOM notes that the Savings Bank had been under a special supervisory program since 2011. A recapitalization of State Bank in the amount of MNT 205 billion is planned. Accordingly, the Deposit Insurance Corporation would provide these funds to State Bank in the form of financial support and share purchases, financed from a loan from the BOM. This would restore the bank’s CAR to 18 percent, the level before it received the assets and assumed the liabilities of the failed Savings Bank. The authorities expressed a commitment to privatize the State Bank as soon as possible.
_________ 1 Prepared by John Quill (MCM).
MONGOLIA
18 INTERNATIONAL MONETARY FUND
Box 2. Price Stabilization Program, Mortgage Program and Liquidity Injection
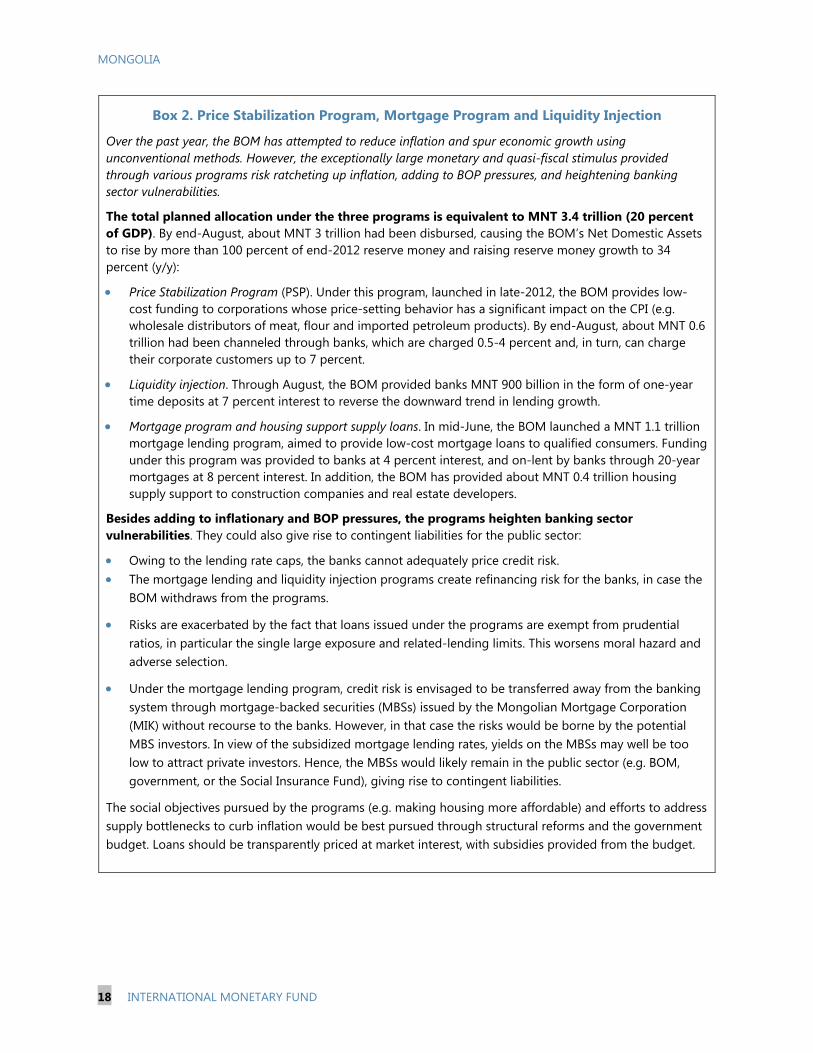
Over the past year, the BOM has attempted to reduce inflation and spur economic growth using unconventional methods. However, the exceptionally large monetary and quasi-fiscal stimulus provided through various programs risk ratcheting up inflation, adding to BOP pressures, and heightening banking sector vulnerabilities.
The total planned allocation under the three programs is equivalent to MNT 3.4 trillion (20 percent of GDP). By end-August, about MNT 3 trillion had been disbursed, causing the BOM’s Net Domestic Assets to rise by more than 100 percent of end-2012 reserve money and raising reserve money growth to 34 percent (y/y):
Price Stabilization Program (PSP). Under this program, launched in late-2012, the BOM provides low-cost funding to corporations whose price-setting behavior has a significant impact on the CPI (e.g. wholesale distributors of meat, flour and imported petroleum products). By end-August, about MNT 0.6 trillion had been channeled through banks, which are charged 0.5-4 percent and, in turn, can charge their corporate customers up to 7 percent.
Liquidity injection. Through August, the BOM provided banks MNT 900 billion in the form of one-year time deposits at 7 percent interest to reverse the downward trend in lending growth.
Mortgage program and housing support supply loans. In mid-June, the BOM launched a MNT 1.1 trillion mortgage lending program, aimed to provide low-cost mortgage loans to qualified consumers. Funding under this program was provided to banks at 4 percent interest, and on-lent by banks through 20-year mortgages at 8 percent interest. In addition, the BOM has provided about MNT 0.4 trillion housing supply support to construction companies and real estate developers.
Besides adding to inflationary and BOP pressures, the programs heighten banking sector vulnerabilities. They could also give rise to contingent liabilities for the public sector:
Owing to the lending rate caps, the banks cannot adequately price credit risk. The mortgage lending and liquidity injection programs create refinancing risk for the banks, in case the
BOM withdraws from the programs.
Risks are exacerbated by the fact that loans issued under the programs are exempt from prudential ratios, in particular the single large exposure and related-lending limits. This worsens moral hazard and adverse selection.
Under the mortgage lending program, credit risk is envisaged to be transferred away from the banking system through mortgage-backed securities (MBSs) issued by the Mongolian Mortgage Corporation (MIK) without recourse to the banks. However, in that case the risks would be borne by the potential MBS investors. In view of the subsidized mortgage lending rates, yields on the MBSs may well be too low to attract private investors. Hence, the MBSs would likely remain in the public sector (e.g. BOM, government, or the Social Insurance Fund), giving rise to contingent liabilities.
The social objectives pursued by the programs (e.g. making housing more affordable) and efforts to address supply bottlenecks to curb inflation would be best pursued through structural reforms and the government budget. Loans should be transparently priced at market interest, with subsidies provided from the budget.
MONGOLIA
INTERNATIONAL MONETARY FUND 19
0
0.5
1
1.5
2
2.5
3
3.5
1 2 3 4 5 6 7 8 9 10 11 12 13 14 15 16 17 18 19 20
Impulse Response of EMP to Reserve Money and Credit Growth (1 Cholesky SD)
Reserve money growth Credit growth
-120
-70
-20
30
80
-40
-30
-20
-10
0
10
20
30
Jan-
09
May
-09
Sep-
09
Jan-
10
May
-10
Sep-
10
Jan-
11
May
-11
Sep-
11
Jan-
12
May
-12
Sep-
12
Jan-
13
May
-13
EMP(3mma)
Credit Growth (y/y, RHS)
Reserve money growth(y/y, RHS)
Sources: Mongolian authorities; and IMF staff estimates.
Exchange Market Pressure Index and Credit Growth
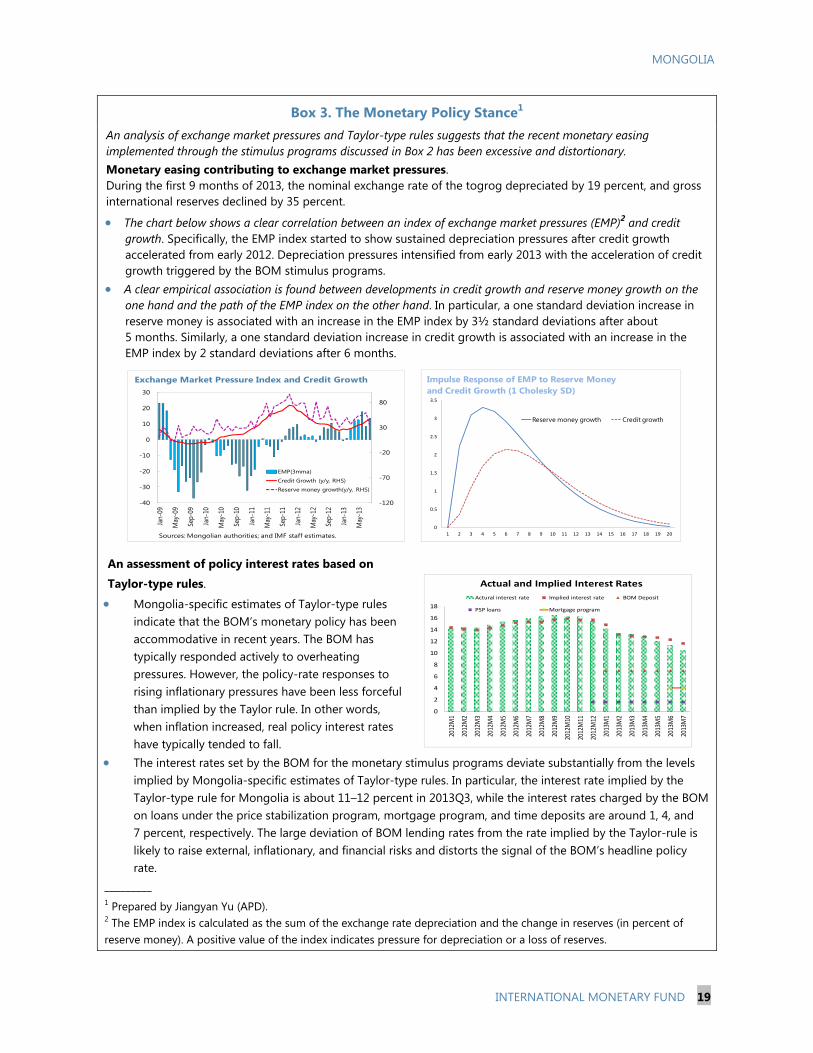
Box 3. The Monetary Policy Stance1 An analysis of exchange market pressures and Taylor-type rules suggests that the recent monetary easing implemented through the stimulus programs discussed in Box 2 has been excessive and distortionary. Monetary easing contributing to exchange market pressures. During the first 9 months of 2013, the nominal exchange rate of the togrog depreciated by 19 percent, and gross international reserves declined by 35 percent.
The chart below shows a clear correlation between an index of exchange market pressures (EMP)2 and credit growth. Specifically, the EMP index started to show sustained depreciation pressures after credit growth accelerated from early 2012. Depreciation pressures intensified from early 2013 with the acceleration of credit growth triggered by the BOM stimulus programs.
A clear empirical association is found between developments in credit growth and reserve money growth on the one hand and the path of the EMP index on the other hand. In particular, a one standard deviation increase in reserve money is associated with an increase in the EMP index by 3½ standard deviations after about 5 months. Similarly, a one standard deviation increase in credit growth is associated with an increase in the EMP index by 2 standard deviations after 6 months.
An assessment of policy interest rates based on
Taylor-type rules.
Mongolia-specific estimates of Taylor-type rules indicate that the BOM’s monetary policy has been accommodative in recent years. The BOM has typically responded actively to overheating pressures. However, the policy-rate responses to rising inflationary pressures have been less forceful than implied by the Taylor rule. In other words, when inflation increased, real policy interest rates have typically tended to fall.
The interest rates set by the BOM for the monetary stimulus programs deviate substantially from the levels implied by Mongolia-specific estimates of Taylor-type rules. In particular, the interest rate implied by the Taylor-type rule for Mongolia is about 11–12 percent in 2013Q3, while the interest rates charged by the BOM on loans under the price stabilization program, mortgage program, and time deposits are around 1, 4, and 7 percent, respectively. The large deviation of BOM lending rates from the rate implied by the Taylor-rule is likely to raise external, inflationary, and financial risks and distorts the signal of the BOM’s headline policy rate.
_________ 1 Prepared by Jiangyan Yu (APD). 2 The EMP index is calculated as the sum of the exchange rate depreciation and the change in reserves (in percent of reserve money). A positive value of the index indicates pressure for depreciation or a loss of reserves.
0
2
4
6
8
10
12
14
16
18
2012
M1
2012
M2
2012
M3
2012
M4
2012
M5
2012
M6
2012
M7
2012
M8
2012
M9
2012
M10
2012
M11
2012
M12
2013
M1
2013
M2
2013
M3
2013
M4
2013
M5
2013
M6
2013
M7
Actual and Implied Interest Rates
Actural interest rate Implied interest rate BOM Deposit
PSP loans Mortgage program
MONGOLIA
20 INTERNATIONAL MONETARY FUND
Box 4. Exchange Rate Assessment1
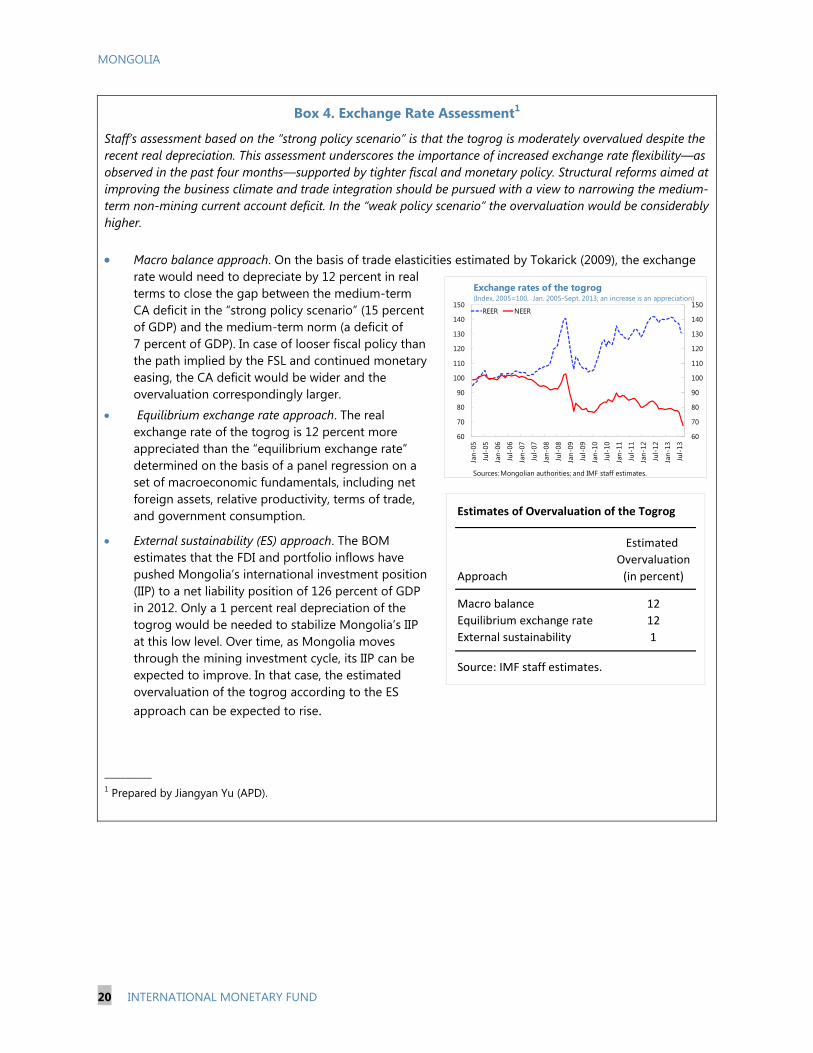
Staff’s assessment based on the “strong policy scenario” is that the togrog is moderately overvalued despite the recent real depreciation. This assessment underscores the importance of increased exchange rate flexibility—as observed in the past four months—supported by tighter fiscal and monetary policy. Structural reforms aimed at improving the business climate and trade integration should be pursued with a view to narrowing the medium-term non-mining current account deficit. In the “weak policy scenario” the overvaluation would be considerably higher.
Macro balance approach. On the basis of trade elasticities estimated by Tokarick (2009), the exchange
rate would need to depreciate by 12 percent in real terms to close the gap between the medium-term CA deficit in the “strong policy scenario” (15 percent of GDP) and the medium-term norm (a deficit of 7 percent of GDP). In case of looser fiscal policy than the path implied by the FSL and continued monetary easing, the CA deficit would be wider and the overvaluation correspondingly larger.
Equilibrium exchange rate approach. The real exchange rate of the togrog is 12 percent more appreciated than the “equilibrium exchange rate” determined on the basis of a panel regression on a set of macroeconomic fundamentals, including net foreign assets, relative productivity, terms of trade, and government consumption.
External sustainability (ES) approach. The BOM estimates that the FDI and portfolio inflows have pushed Mongolia’s international investment position (IIP) to a net liability position of 126 percent of GDP in 2012. Only a 1 percent real depreciation of the togrog would be needed to stabilize Mongolia’s IIP at this low level. Over time, as Mongolia moves through the mining investment cycle, its IIP can be expected to improve. In that case, the estimated overvaluation of the togrog according to the ES approach can be expected to rise.
_________ 1 Prepared by Jiangyan Yu (APD).
Estimates of Overvaluation of the Togrog
Estimated
Overvaluation
Approach (in percent)
Macro balance 12
Equilibrium exchange rate 12
External sustainability 1
Source: IMF staff estimates.
60
70
80
90
100
110
120
130
140
150
60
70
80
90
100
110
120
130
140
150
Jan-
05
Jul-
05
Jan-
06
Jul-
06
Jan-
07
Jul-
07
Jan-
08
Jul-
08
Jan-
09
Jul-
09
Jan-
10
Jul-
10
Jan-
11
Jul-
11
Jan-
12
Jul-
12
Jan-
13
Jul-
13
REER NEER
Sources: Mongolian authorities; and IMF staff estimates.
Exchange rates of the togrog(Index, 2005=100, Jan. 2005-Sept. 2013; an increase is an appreciation)
MONGOLIA
INTERNATIONAL MONETARY FUND 21
0
20
40
60
80
100
120
140Dec. 2010 Latest 1/
Sources: IFS, IMF; and IMF staff calculations.1/ Latest: August 2013 (Mongolia), April 2013 (Nepal), March 2013 (Indonesia, PNG, Bangladesh, Cambodia, Lao P.D.R.), February 2013 (Philippines), December 2012 (India, Sri Lanka, Vietnam).
Loan-to-Deposit Ratio(In percent)
8
10
12
14
16
18
20
Mongolia Philippines Malaysia Indonesia India
CAR Tier1 ratio
Capital Adequacy of Asian Banks(In percent, at end-2012)
Sources: Mongolian authorities; Haver Analytics; and IMF staff estimates.
0
10
20
30
40
50
60
70
80
90
100
Mongolia Vietnam 1/ Philippines 1/ Lao PDR Cambodia
2007
Latest
Sources: Mongolian authorities; CEIC; and IMF staff estimates.1/ Latest: September 2013 (Mongolia), December 2011 (Vietnam), March 2013 (Philippines, Cambodia), and December 2012 (Lao PDR); the first observation for the Philippines is March 2008.
Foreign Currency Deposits to Broad Money(In percent)
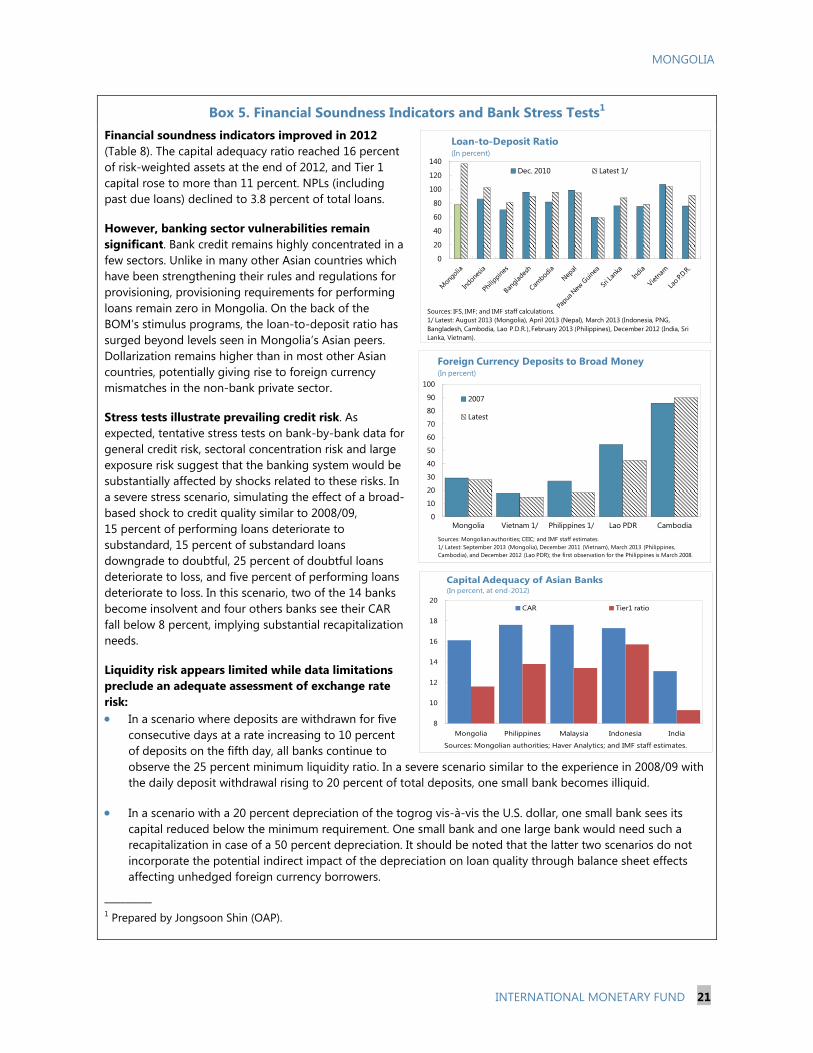
Box 5. Financial Soundness Indicators and Bank Stress Tests1 Financial soundness indicators improved in 2012 (Table 8). The capital adequacy ratio reached 16 percent of risk-weighted assets at the end of 2012, and Tier 1 capital rose to more than 11 percent. NPLs (including past due loans) declined to 3.8 percent of total loans.
However, banking sector vulnerabilities remain significant. Bank credit remains highly concentrated in a few sectors. Unlike in many other Asian countries which have been strengthening their rules and regulations for provisioning, provisioning requirements for performing loans remain zero in Mongolia. On the back of the BOM’s stimulus programs, the loan-to-deposit ratio has surged beyond levels seen in Mongolia’s Asian peers. Dollarization remains higher than in most other Asian countries, potentially giving rise to foreign currency mismatches in the non-bank private sector.
Stress tests illustrate prevailing credit risk. As expected, tentative stress tests on bank-by-bank data for general credit risk, sectoral concentration risk and large exposure risk suggest that the banking system would be substantially affected by shocks related to these risks. In a severe stress scenario, simulating the effect of a broad-based shock to credit quality similar to 2008/09, 15 percent of performing loans deteriorate to substandard, 15 percent of substandard loans downgrade to doubtful, 25 percent of doubtful loans deteriorate to loss, and five percent of performing loans deteriorate to loss. In this scenario, two of the 14 banks become insolvent and four others banks see their CAR fall below 8 percent, implying substantial recapitalization needs.
Liquidity risk appears limited while data limitations preclude an adequate assessment of exchange rate risk: In a scenario where deposits are withdrawn for five
consecutive days at a rate increasing to 10 percent of deposits on the fifth day, all banks continue to observe the 25 percent minimum liquidity ratio. In a severe scenario similar to the experience in 2008/09 with the daily deposit withdrawal rising to 20 percent of total deposits, one small bank becomes illiquid.
In a scenario with a 20 percent depreciation of the togrog vis-à-vis the U.S. dollar, one small bank sees its capital reduced below the minimum requirement. One small bank and one large bank would need such a recapitalization in case of a 50 percent depreciation. It should be noted that the latter two scenarios do not incorporate the potential indirect impact of the depreciation on loan quality through balance sheet effects affecting unhedged foreign currency borrowers.
_________ 1 Prepared by Jongsoon Shin (OAP).
MONGOLIA
22 INTERNATIONAL MONETARY FUND
-10
-5
0
5
10
15
20
25
-10
-5
0
5
10
15
20
25
2008
Q1
2008
Q2
2008
Q3
2008
Q4
2009
Q1
2009
Q2
2009
Q3
2009
Q4
2010
Q1
2010
Q2
2010
Q3
2010
Q4
2011
Q1
2011
Q2
2011
Q3
2011
Q4
2012
Q1
2012
Q2
2012
Q3
2012
Q4
2013
Q1
2013
Q2
AgricultureNon-mining industryServicesNet taxesMining industryGDP at market prices (y/y growth)
Sources: Mongolian authorities.
Real GDP Growth(Contribution and year-on-year percentage change, 2008Q1-2013Q2)
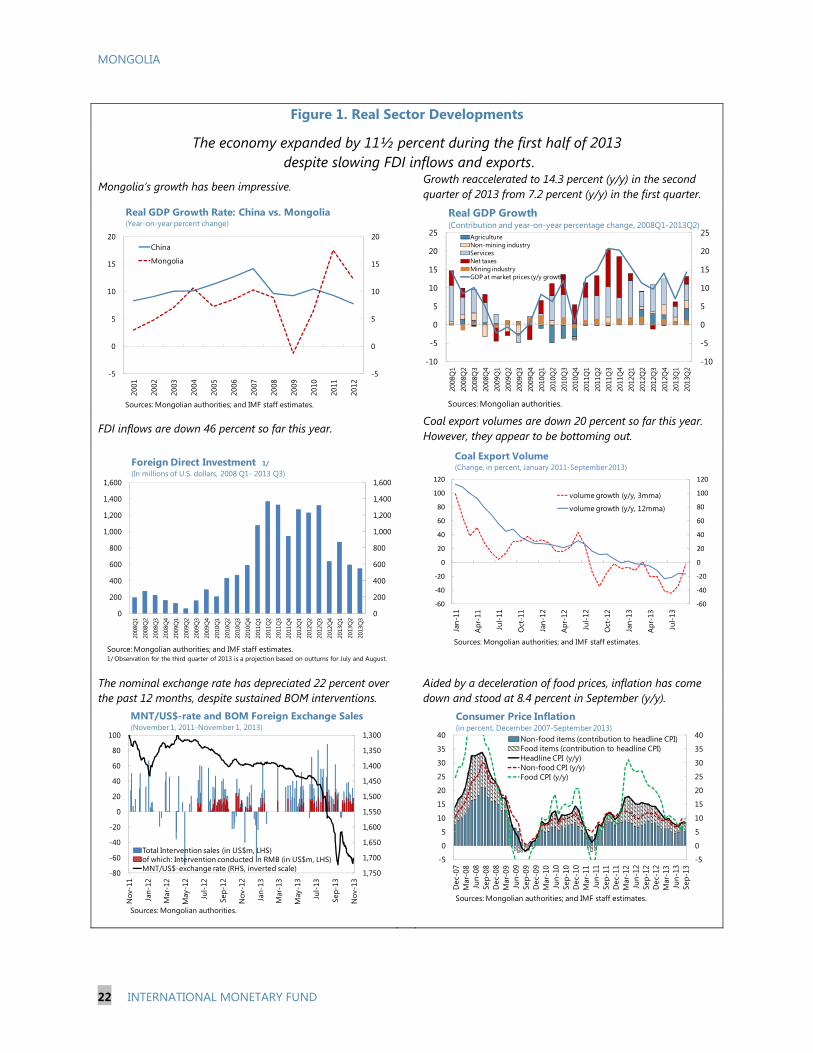
Figure 1. Real Sector Developments
The economy expanded by 11½ percent during the first half of 2013 despite slowing FDI inflows and exports.
Mongolia’s growth has been impressive. Growth reaccelerated to 14.3 percent (y/y) in the second quarter of 2013 from 7.2 percent (y/y) in the first quarter.
FDI inflows are down 46 percent so far this year. Coal export volumes are down 20 percent so far this year. However, they appear to be bottoming out.
The nominal exchange rate has depreciated 22 percent over the past 12 months, despite sustained BOM interventions.
Aided by a deceleration of food prices, inflation has come down and stood at 8.4 percent in September (y/y).
-5
0
5
10
15
20
-5
0
5
10
15
20
2001
2002
2003
2004
2005
2006
2007
2008
2009
2010
2011
2012
China
Mongolia
Sources: Mongolian authorities; and IMF staff estimates.
Real GDP Growth Rate: China vs. Mongolia(Year-on-year percent change)
0
200
400
600
800
1,000
1,200
1,400
1,600
0
200
400
600
800
1,000
1,200
1,400
1,600
2008
Q1
2008
Q2
2008
Q3
2008
Q4
2009
Q1
2009
Q2
2009
Q3
2009
Q4
2010
Q1
2010
Q2
2010
Q3
2010
Q4
2011
Q1
2011
Q2
2011
Q3
2011
Q4
2012
Q1
2012
Q2
2012
Q3
2012
Q4
2013
Q1
2013
Q2
2013
Q3
Foreign Direct Investment 1/(In millions of U.S. dollars, 2008 Q1- 2013 Q3)
Source: Mongolian authorities; and IMF staff estimates.1/ Observation for the third quarter of 2013 is a projection based on outturns for July and August.
-60
-40
-20
0
20
40
60
80
100
120
-60
-40
-20
0
20
40
60
80
100
120
Jan-
11
Apr
-11
Jul-
11
Oct
-11
Jan-
12
Apr
-12
Jul-
12
Oct
-12
Jan-
13
Apr
-13
Jul-
13
volume growth (y/y, 3mma)
volume growth (y/y, 12mma)
Sources: Mongolian authorities; and IMF staff estimates.
Coal Export Volume(Change, in percent, January 2011-September 2013)
1,300
1,350
1,400
1,450
1,500
1,550
1,600
1,650
1,700
1,750-80
-60
-40
-20
0
20
40
60
80
100
Nov
-11
Jan-
12
Mar
-12
May
-12
Jul-
12
Sep-
12
Nov
-12
Jan-
13
Mar
-13
May
-13
Jul-
13
Sep-
13
Nov
-13
Total Intervention sales (in US$m, LHS)of which: Intervention conducted in RMB (in US$m, LHS)MNT/US$-exchange rate (RHS, inverted scale)
Sources: Mongolian authorities.
MNT/US$-rate and BOM Foreign Exchange Sales(November 1, 2011-November 1, 2013)
-5
0
5
10
15
20
25
30
35
40
-5
0
5
10
15
20
25
30
35
40
Dec
-07
Mar
-08
Jun-
08Se
p-08
Dec
-08
Mar
-09
Jun-
09Se
p-09
Dec
-09
Mar
-10
Jun-
10Se
p-10
Dec
-10
Mar
-11
Jun-
11Se
p-11
Dec
-11
Mar
-12
Jun-
12Se
p-12
Dec
-12
Mar
-13
Jun-
13Se
p-13
Non-food items (contribution to headline CPI)Food items (contribution to headline CPI)Headline CPI (y/y)Non-food CPI (y/y)Food CPI (y/y)
Sources: Mongolian authorities; and IMF staff estimates.
Consumer Price Inflation (in percent, December 2007-September 2013)
MONGOLIA
INTERNATIONAL MONETARY FUND 23
0
10
20
30
40
50
60
70
0
10
20
30
40
50
60
70
2005 2006 2007 2008 2009 2010 2011 2012
Nominal public debt
NPV of public debt
Public Debt(in percent of GDP)
Sources: Mongolian authorities; and IMF staff esimates.
70
80
90
100
110
120
130
140
70
80
90
100
110
120
130
140
Dec
-07
Mar
-08
Jun-
08Se
p-08
Dec
-08
Mar
-09
Jun-
09Se
p-09
Dec
-09
Mar
-10
Jun-
10Se
p-10
Dec
-10
Mar
-11
Jun-
11Se
p-11
Dec
-11
Mar
-12
Jun-
12Se
p-12
Dec
-12
Mar
-13
Jun-
13Se
p-13
8-year average
Headline Loan-To-Deposit Ratio
Commercial Banks' Loan-To-Deposit (L/D) Ratio(Dec. 2007-Sep. 2013)
Sources: Mongolian authorities; and IMF staff estimates.
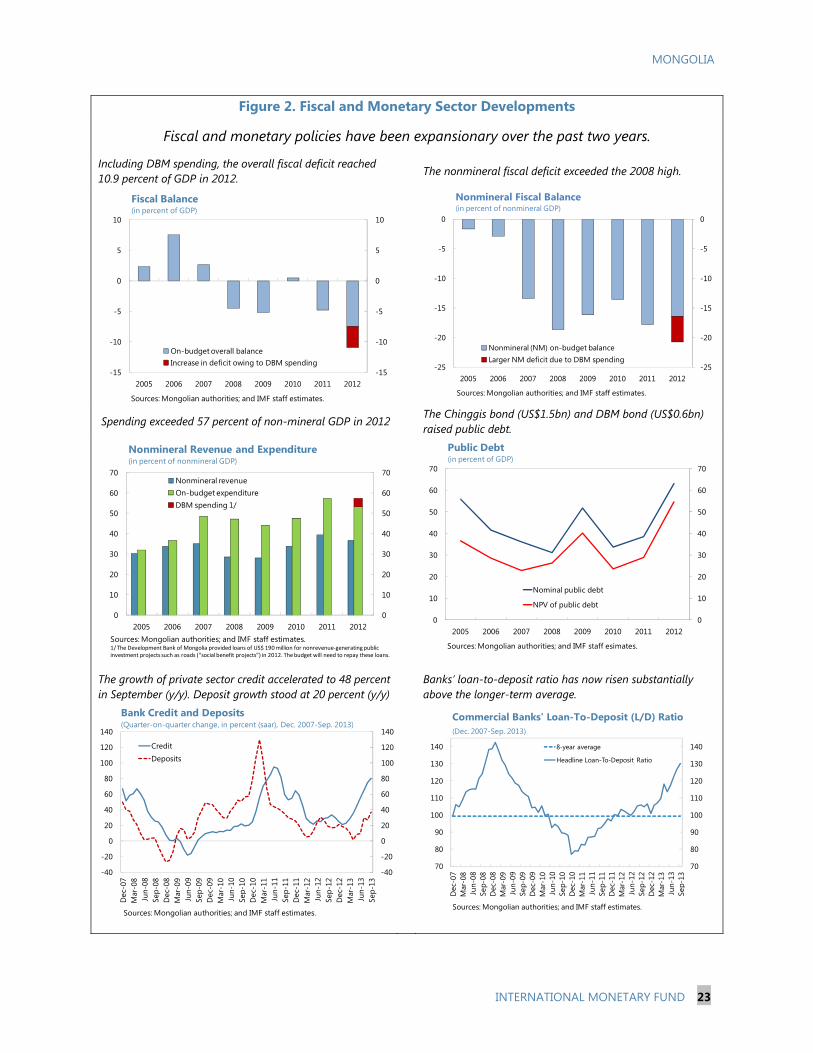
Figure 2. Fiscal and Monetary Sector Developments
Fiscal and monetary policies have been expansionary over the past two years.
Including DBM spending, the overall fiscal deficit reached 10.9 percent of GDP in 2012.
The nonmineral fiscal deficit exceeded the 2008 high.
Spending exceeded 57 percent of non-mineral GDP in 2012 The Chinggis bond (US$1.5bn) and DBM bond (US$0.6bn) raised public debt.
The growth of private sector credit accelerated to 48 percent in September (y/y). Deposit growth stood at 20 percent (y/y) Banks’ loan-to-deposit ratio has now risen substantially
above the longer-term average.
-15
-10
-5
0
5
10
-15
-10
-5
0
5
10
2005 2006 2007 2008 2009 2010 2011 2012
On-budget overall balanceIncrease in deficit owing to DBM spending
Sources: Mongolian authorities; and IMF staff estimates.
Fiscal Balance(in percent of GDP)
-25
-20
-15
-10
-5
0
-25
-20
-15
-10
-5
0
2005 2006 2007 2008 2009 2010 2011 2012
Nonmineral (NM) on-budget balanceLarger NM deficit due to DBM spending
Sources: Mongolian authorities; and IMF staff estimates.
Nonmineral Fiscal Balance(in percent of nonmineral GDP)
0
10
20
30
40
50
60
70
0
10
20
30
40
50
60
70
2005 2006 2007 2008 2009 2010 2011 2012
Nonmineral revenueOn-budget expenditureDBM spending 1/
Sources: Mongolian authorities; and IMF staff estimates.1/ The Development Bank of Mongolia provided loans of US$ 190 million for nonrevenue-generating public investment projects such as roads ("social benefit projects") in 2012. The budget will need to repay these loans.
Nonmineral Revenue and Expenditure(in percent of nonmineral GDP)
-40
-20
0
20
40
60
80
100
120
140
-40
-20
0
20
40
60
80
100
120
140
Dec
-07
Mar
-08
Jun-
08Se
p-08
Dec
-08
Mar
-09
Jun-
09Se
p-09
Dec
-09
Mar
-10
Jun-
10Se
p-10
Dec
-10
Mar
-11
Jun-
11Se
p-11
Dec
-11
Mar
-12
Jun-
12Se
p-12
Dec
-12
Mar
-13
Jun-
13Se
p-13
Credit
Deposits
Sources: Mongolian authorities; and IMF staff estimates.
Bank Credit and Deposits(Quarter-on-quarter change, in percent (saar), Dec. 2007-Sep. 2013)
MONGOLIA
24 INTERNATIONAL MONETARY FUND
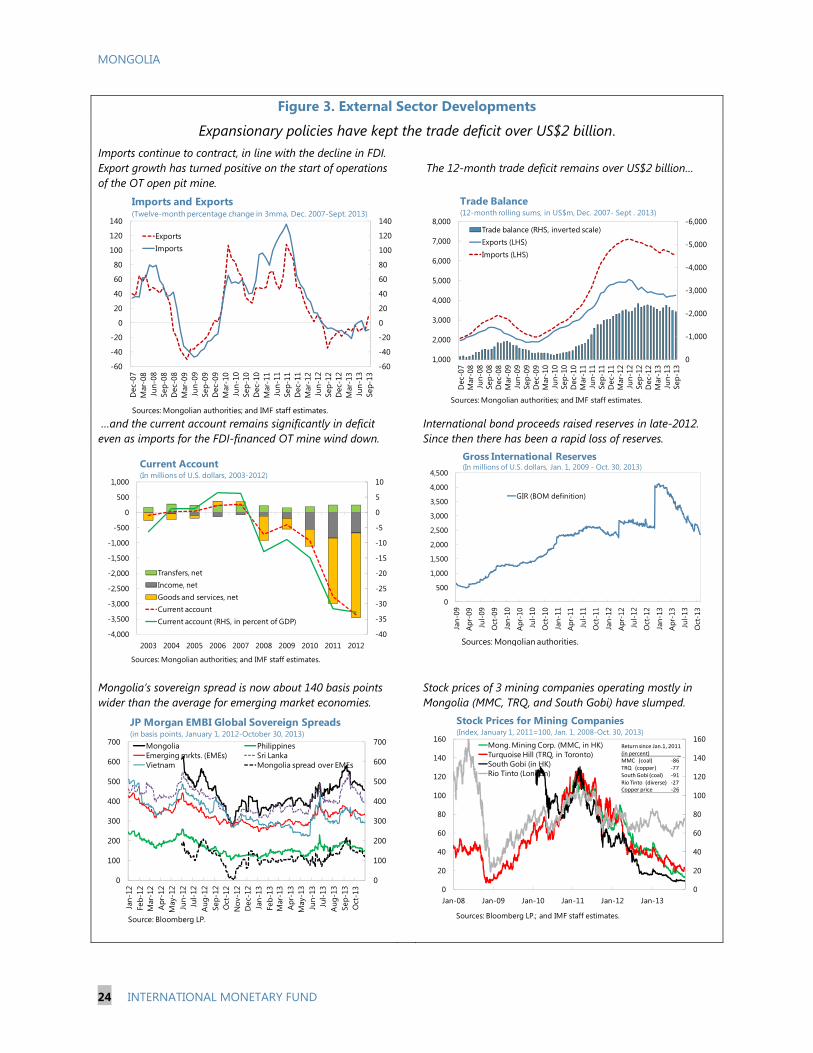
Figure 3. External Sector Developments
Expansionary policies have kept the trade deficit over US$2 billion. Imports continue to contract, in line with the decline in FDI.Export growth has turned positive on the start of operations of the OT open pit mine.
The 12-month trade deficit remains over US$2 billion…
…and the current account remains significantly in deficit even as imports for the FDI-financed OT mine wind down.
International bond proceeds raised reserves in late-2012. Since then there has been a rapid loss of reserves.
Mongolia’s sovereign spread is now about 140 basis points wider than the average for emerging market economies.
Stock prices of 3 mining companies operating mostly in Mongolia (MMC, TRQ, and South Gobi) have slumped.
-60
-40
-20
0
20
40
60
80
100
120
140
-60
-40
-20
0
20
40
60
80
100
120
140
Dec
-07
Mar
-08
Jun-
08Se
p-08
Dec
-08
Mar
-09
Jun-
09Se
p-09
Dec
-09
Mar
-10
Jun-
10Se
p-10
Dec
-10
Mar
-11
Jun-
11Se
p-11
Dec
-11
Mar
-12
Jun-
12Se
p-12
Dec
-12
Mar
-13
Jun-
13Se
p-13
ExportsImports
Sources: Mongolian authorities; and IMF staff estimates.
Imports and Exports(Twelve-month percentage change in 3mma, Dec. 2007-Sept. 2013)
-6,000
-5,000
-4,000
-3,000
-2,000
-1,000
01,000
2,000
3,000
4,000
5,000
6,000
7,000
8,000
Dec
-07
Mar
-08
Jun-
08Se
p-08
Dec
-08
Mar
-09
Jun-
09Se
p-09
Dec
-09
Mar
-10
Jun-
10Se
p-10
Dec
-10
Mar
-11
Jun-
11Se
p-11
Dec
-11
Mar
-12
Jun-
12Se
p-12
Dec
-12
Mar
-13
Jun-
13Se
p-13
Trade balance (RHS, inverted scale)Exports (LHS)Imports (LHS)
Trade Balance(12-month rolling sums, in US$m, Dec. 2007- Sept . 2013)
Sources: Mongolian authorities; and IMF staff estimates.
-40
-35
-30
-25
-20
-15
-10
-5
0
5
10
-4,000
-3,500
-3,000
-2,500
-2,000
-1,500
-1,000
-500
0
500
1,000
2003 2004 2005 2006 2007 2008 2009 2010 2011 2012
Transfers, netIncome, netGoods and services, netCurrent accountCurrent account (RHS, in percent of GDP)
Current Account (In millions of U.S. dollars, 2003-2012)
Sources: Mongolian authorities; and IMF staff estimates.
0
500
1,000
1,500
2,000
2,500
3,000
3,500
4,000
4,500
Jan-
09
Apr
-09
Jul-
09
Oct
-09
Jan-
10
Apr
-10
Jul-
10
Oct
-10
Jan-
11
Apr
-11
Jul-
11
Oct
-11
Jan-
12
Apr
-12
Jul-
12
Oct
-12
Jan-
13
Apr
-13
Jul-
13
Oct
-13
GIR (BOM definition)
Sources: Mongolian authorities.
Gross International Reserves(In millions of U.S. dollars, Jan. 1, 2009 - Oct. 30, 2013)
0
100
200
300
400
500
600
700
0
100
200
300
400
500
600
700
Jan-
12Fe
b-12
Mar
-12
Apr
-12
May
-12
Jun-
12Ju
l-12
Aug
-12
Sep-
12O
ct-1
2N
ov-1
2D
ec-1
2Ja
n-13
Feb-
13M
ar-1
3A
pr-1
3M
ay-1
3Ju
n-13
Jul-
13A
ug-1
3Se
p-13
Oct
-13
Mongolia PhilippinesEmerging mrkts. (EMEs) Sri LankaVietnam Mongolia spread over EMEs
Source: Bloomberg LP.
JP Morgan EMBI Global Sovereign Spreads(in basis points, January 1, 2012-October 30, 2013)
0
20
40
60
80
100
120
140
160
0
20
40
60
80
100
120
140
160
Jan-08 Jan-09 Jan-10 Jan-11 Jan-12 Jan-13
Mong. Mining Corp. (MMC, in HK) Turquoise Hill (TRQ, in Toronto)South Gobi (in HK)Rio Tinto (London)
Sources: Bloomberg LP.; and IMF staff estimates.
Stock Prices for Mining Companies(Index, January 1, 2011=100, Jan. 1, 2008-Oct. 30, 2013)
Return since Jan.1, 2011(in percent) _ MMC (coal) -86TRQ (copper) -77South Gobi (coal) -91Rio Tinto (diverse) -27Copper price -26
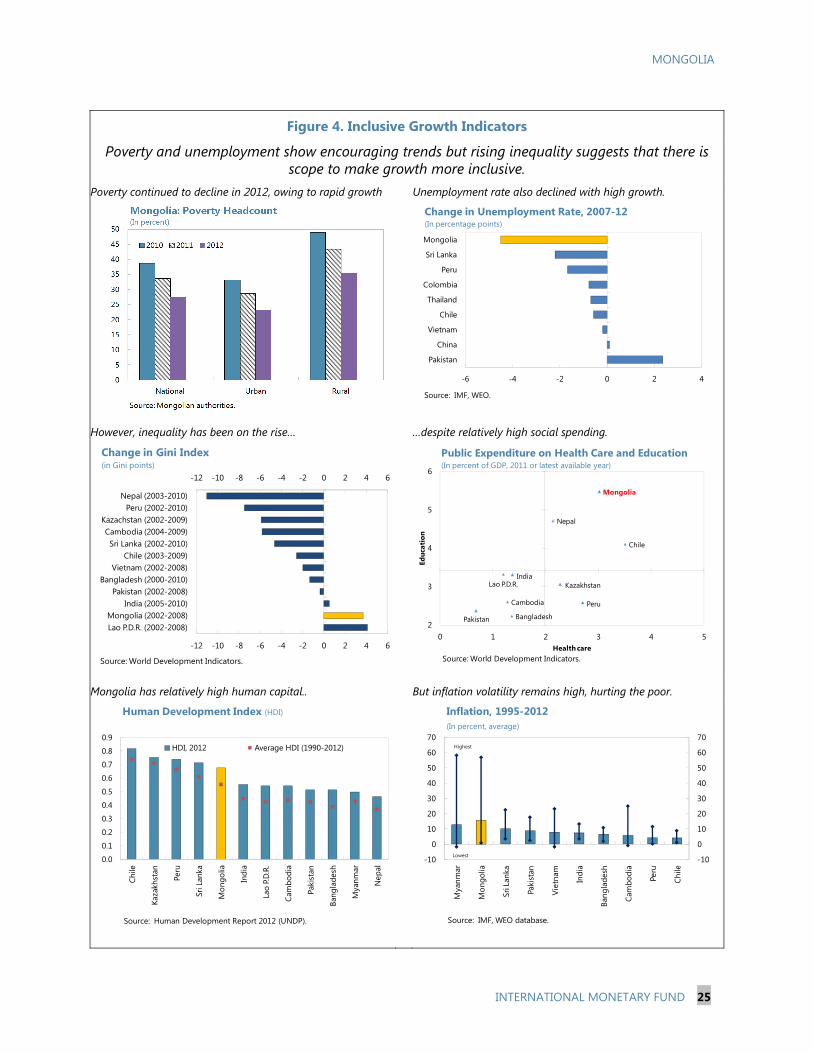
MONGOLIA
INTERNATIONAL MONETARY FUND 25
-6 -4 -2 0 2 4
Pakistan
China
Vietnam
Chile
Thailand
Colombia
Peru
Sri Lanka
Mongolia
Source: IMF, WEO.
Change in Unemployment Rate, 2007-12(In percentage points)
0.0
0.1
0.2
0.3
0.4
0.5
0.6
0.7
0.8
0.9
Chile
Kaza
khst
an
Peru
Sri L
anka
Mon
golia
Indi
a
Lao
P.D.R
.
Cam
bodi
a
Paki
stan
Bang
lade
sh
Mya
nmar
Nep
al
HDI, 2012 Average HDI (1990-2012)
Source: Human Development Report 2012 (UNDP).
Human Development Index (HDI)
-10
0
10
20
30
40
50
60
70
-10
0
10
20
30
40
50
60
70
Mya
nmar
Mon
golia
Sri L
anka
Paki
stan
Viet
nam
Indi
a
Bang
lade
sh
Cam
bodi
a
Peru
Chile
Source: IMF, WEO database.
Highest
Lowest
Inflation, 1995-2012 (In percent, average)
-12 -10 -8 -6 -4 -2 0 2 4 6
-12 -10 -8 -6 -4 -2 0 2 4 6
Lao P.D.R. (2002-2008)Mongolia (2002-2008)
India (2005-2010)Pakistan (2002-2008)
Bangladesh (2000-2010)Vietnam (2002-2008)
Chile (2003-2009)Sri Lanka (2002-2010)
Cambodia (2004-2009)Kazachstan (2002-2009)
Peru (2002-2010)Nepal (2003-2010)
Source: World Development Indicators.
Change in Gini Index(in Gini points)
Bangladesh
Cambodia
Chile
IndiaKazakhstan Lao P.D.R.
Mongolia
Nepal
Pakistan
Peru
2
3
4
5
6
0 1 2 3 4 5
Educ
atio
n
Health care
Public Expenditure on Health Care and Education (In percent of GDP, 2011 or latest available year)
Source: World Development Indicators.
Figure 4. Inclusive Growth Indicators
Poverty and unemployment show encouraging trends but rising inequality suggests that there is scope to make growth more inclusive.
Poverty continued to decline in 2012, owing to rapid growth Unemployment rate also declined with high growth.
However, inequality has been on the rise… …despite relatively high social spending.
Mongolia has relatively high human capital.. But inflation volatility remains high, hurting the poor.
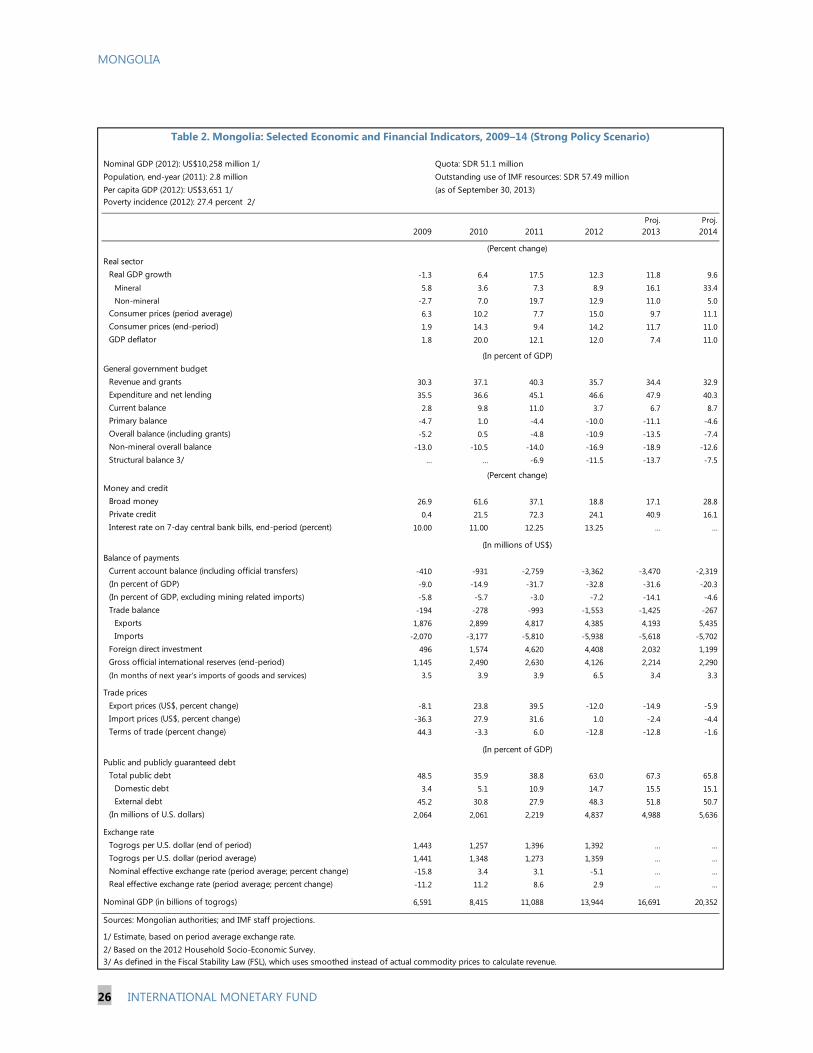
MONGOLIA
26 INTERNATIONAL MONETARY FUND
Nominal GDP (2012): US$10,258 million 1/ Quota: SDR 51.1 millionPopulation, end-year (2011): 2.8 million Outstanding use of IMF resources: SDR 57.49 millionPer capita GDP (2012): US$3,651 1/ (as of September 30, 2013)Poverty incidence (2012): 27.4 percent 2/
Proj. Proj.2009 2010 2011 2012 2013 2014
Real sectorReal GDP growth -1.3 6.4 17.5 12.3 11.8 9.6
Mineral 5.8 3.6 7.3 8.9 16.1 33.4
Non-mineral -2.7 7.0 19.7 12.9 11.0 5.0Consumer prices (period average) 6.3 10.2 7.7 15.0 9.7 11.1Consumer prices (end-period) 1.9 14.3 9.4 14.2 11.7 11.0GDP deflator 1.8 20.0 12.1 12.0 7.4 11.0
General government budgetRevenue and grants 30.3 37.1 40.3 35.7 34.4 32.9Expenditure and net lending 35.5 36.6 45.1 46.6 47.9 40.3Current balance 2.8 9.8 11.0 3.7 6.7 8.7Primary balance -4.7 1.0 -4.4 -10.0 -11.1 -4.6Overall balance (including grants) -5.2 0.5 -4.8 -10.9 -13.5 -7.4Non-mineral overall balance -13.0 -10.5 -14.0 -16.9 -18.9 -12.6Structural balance 3/ … … -6.9 -11.5 -13.7 -7.5
Money and credit Broad money 26.9 61.6 37.1 18.8 17.1 28.8Private credit 0.4 21.5 72.3 24.1 40.9 16.1Interest rate on 7-day central bank bills, end-period (percent) 10.00 11.00 12.25 13.25 … …
Balance of paymentsCurrent account balance (including official transfers) -410 -931 -2,759 -3,362 -3,470 -2,319(In percent of GDP) -9.0 -14.9 -31.7 -32.8 -31.6 -20.3(In percent of GDP, excluding mining related imports) -5.8 -5.7 -3.0 -7.2 -14.1 -4.6Trade balance -194 -278 -993 -1,553 -1,425 -267
Exports 1,876 2,899 4,817 4,385 4,193 5,435Imports -2,070 -3,177 -5,810 -5,938 -5,618 -5,702
Foreign direct investment 496 1,574 4,620 4,408 2,032 1,199Gross official international reserves (end-period) 1,145 2,490 2,630 4,126 2,214 2,290
(In months of next year's imports of goods and services) 3.5 3.9 3.9 6.5 3.4 3.3
Trade pricesExport prices (US$, percent change) -8.1 23.8 39.5 -12.0 -14.9 -5.9Import prices (US$, percent change) -36.3 27.9 31.6 1.0 -2.4 -4.4Terms of trade (percent change) 44.3 -3.3 6.0 -12.8 -12.8 -1.6
Public and publicly guaranteed debtTotal public debt 48.5 35.9 38.8 63.0 67.3 65.8
Domestic debt 3.4 5.1 10.9 14.7 15.5 15.1External debt 45.2 30.8 27.9 48.3 51.8 50.7
(In millions of U.S. dollars) 2,064 2,061 2,219 4,837 4,988 5,636
Exchange rateTogrogs per U.S. dollar (end of period) 1,443 1,257 1,396 1,392 ... ...Togrogs per U.S. dollar (period average) 1,441 1,348 1,273 1,359 ... ...Nominal effective exchange rate (period average; percent change) -15.8 3.4 3.1 -5.1 ... ...Real effective exchange rate (period average; percent change) -11.2 11.2 8.6 2.9 ... ...
Nominal GDP (in billions of togrogs) 6,591 8,415 11,088 13,944 16,691 20,352
Sources: Mongolian authorities; and IMF staff projections.
1/ Estimate, based on period average exchange rate.2/ Based on the 2012 Household Socio-Economic Survey.3/ As defined in the Fiscal Stability Law (FSL), which uses smoothed instead of actual commodity prices to calculate revenue.
Table 2. Mongolia: Selected Economic and Financial Indicators, 2009–14 (Strong Policy Scenario)
(In millions of US$)
(Percent change)
(In percent of GDP)
(Percent change)
(In percent of GDP)
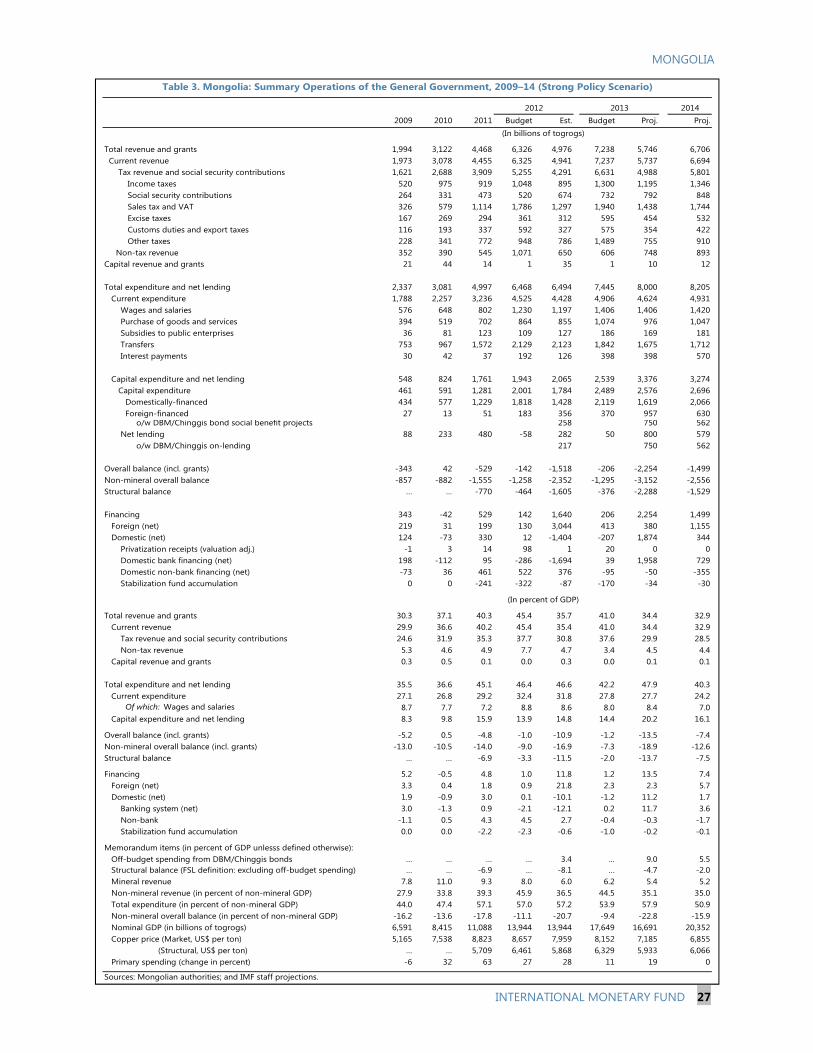
MONGOLIA
INTERNATIONAL MONETARY FUND 27
20142009 2010 2011 Budget Est. Budget Proj. Proj.
Total revenue and grants 1,994 3,122 4,468 6,326 4,976 7,238 5,746 6,706 Current revenue 1,973 3,078 4,455 6,325 4,941 7,237 5,737 6,694 Tax revenue and social security contributions 1,621 2,688 3,909 5,255 4,291 6,631 4,988 5,801 Income taxes 520 975 919 1,048 895 1,300 1,195 1,346 Social security contributions 264 331 473 520 674 732 792 848 Sales tax and VAT 326 579 1,114 1,786 1,297 1,940 1,438 1,744 Excise taxes 167 269 294 361 312 595 454 532 Customs duties and export taxes 116 193 337 592 327 575 354 422 Other taxes 228 341 772 948 786 1,489 755 910 Non-tax revenue 352 390 545 1,071 650 606 748 893Capital revenue and grants 21 44 14 1 35 1 10 12
Total expenditure and net lending 2,337 3,081 4,997 6,468 6,494 7,445 8,000 8,205 Current expenditure 1,788 2,257 3,236 4,525 4,428 4,906 4,624 4,931 Wages and salaries 576 648 802 1,230 1,197 1,406 1,406 1,420 Purchase of goods and services 394 519 702 864 855 1,074 976 1,047 Subsidies to public enterprises 36 81 123 109 127 186 169 181 Transfers 753 967 1,572 2,129 2,123 1,842 1,675 1,712 Interest payments 30 42 37 192 126 398 398 570
Capital expenditure and net lending 548 824 1,761 1,943 2,065 2,539 3,376 3,274 Capital expenditure 461 591 1,281 2,001 1,784 2,489 2,576 2,696 Domestically-financed 434 577 1,229 1,818 1,428 2,119 1,619 2,066 Foreign-financed 27 13 51 183 356 370 957 630
o/w DBM/Chinggis bond social benefit projects 258 750 562 Net lending 88 233 480 -58 282 50 800 579
o/w DBM/Chinggis on-lending 217 750 562
Overall balance (incl. grants) -343 42 -529 -142 -1,518 -206 -2,254 -1,499Non-mineral overall balance -857 -882 -1,555 -1,258 -2,352 -1,295 -3,152 -2,556Structural balance … … -770 -464 -1,605 -376 -2,288 -1,529
Financing 343 -42 529 142 1,640 206 2,254 1,499 Foreign (net) 219 31 199 130 3,044 413 380 1,155 Domestic (net) 124 -73 330 12 -1,404 -207 1,874 344 Privatization receipts (valuation adj.) -1 3 14 98 1 20 0 0 Domestic bank financing (net) 198 -112 95 -286 -1,694 39 1,958 729 Domestic non-bank financing (net) -73 36 461 522 376 -95 -50 -355 Stabilization fund accumulation 0 0 -241 -322 -87 -170 -34 -30
Total revenue and grants 30.3 37.1 40.3 45.4 35.7 41.0 34.4 32.9 Current revenue 29.9 36.6 40.2 45.4 35.4 41.0 34.4 32.9 Tax revenue and social security contributions 24.6 31.9 35.3 37.7 30.8 37.6 29.9 28.5 Non-tax revenue 5.3 4.6 4.9 7.7 4.7 3.4 4.5 4.4 Capital revenue and grants 0.3 0.5 0.1 0.0 0.3 0.0 0.1 0.1
Total expenditure and net lending 35.5 36.6 45.1 46.4 46.6 42.2 47.9 40.3 Current expenditure 27.1 26.8 29.2 32.4 31.8 27.8 27.7 24.2 Of which: Wages and salaries 8.7 7.7 7.2 8.8 8.6 8.0 8.4 7.0 Capital expenditure and net lending 8.3 9.8 15.9 13.9 14.8 14.4 20.2 16.1
Overall balance (incl. grants) -5.2 0.5 -4.8 -1.0 -10.9 -1.2 -13.5 -7.4Non-mineral overall balance (incl. grants) -13.0 -10.5 -14.0 -9.0 -16.9 -7.3 -18.9 -12.6Structural balance … … -6.9 -3.3 -11.5 -2.0 -13.7 -7.5
Financing 5.2 -0.5 4.8 1.0 11.8 1.2 13.5 7.4 Foreign (net) 3.3 0.4 1.8 0.9 21.8 2.3 2.3 5.7 Domestic (net) 1.9 -0.9 3.0 0.1 -10.1 -1.2 11.2 1.7 Banking system (net) 3.0 -1.3 0.9 -2.1 -12.1 0.2 11.7 3.6 Non-bank -1.1 0.5 4.3 4.5 2.7 -0.4 -0.3 -1.7 Stabilization fund accumulation 0.0 0.0 -2.2 -2.3 -0.6 -1.0 -0.2 -0.1
Memorandum items (in percent of GDP unlesss defined otherwise): Off-budget spending from DBM/Chinggis bonds … … … … 3.4 … 9.0 5.5 Structural balance (FSL definition: excluding off-budget spending) … … -6.9 … -8.1 … -4.7 -2.0 Mineral revenue 7.8 11.0 9.3 8.0 6.0 6.2 5.4 5.2 Non-mineral revenue (in percent of non-mineral GDP) 27.9 33.8 39.3 45.9 36.5 44.5 35.1 35.0 Total expenditure (in percent of non-mineral GDP) 44.0 47.4 57.1 57.0 57.2 53.9 57.9 50.9 Non-mineral overall balance (in percent of non-mineral GDP) -16.2 -13.6 -17.8 -11.1 -20.7 -9.4 -22.8 -15.9 Nominal GDP (in billions of togrogs) 6,591 8,415 11,088 13,944 13,944 17,649 16,691 20,352 Copper price (Market, US$ per ton) 5,165 7,538 8,823 8,657 7,959 8,152 7,185 6,855 (Structural, US$ per ton) … … 5,709 6,461 5,868 6,329 5,933 6,066 Primary spending (change in percent) -6 32 63 27 28 11 19 0
Sources: Mongolian authorities; and IMF staff projections.
Table 3. Mongolia: Summary Operations of the General Government, 2009–14 (Strong Policy Scenario)
20132012
(In billions of togrogs)
(In percent of GDP)
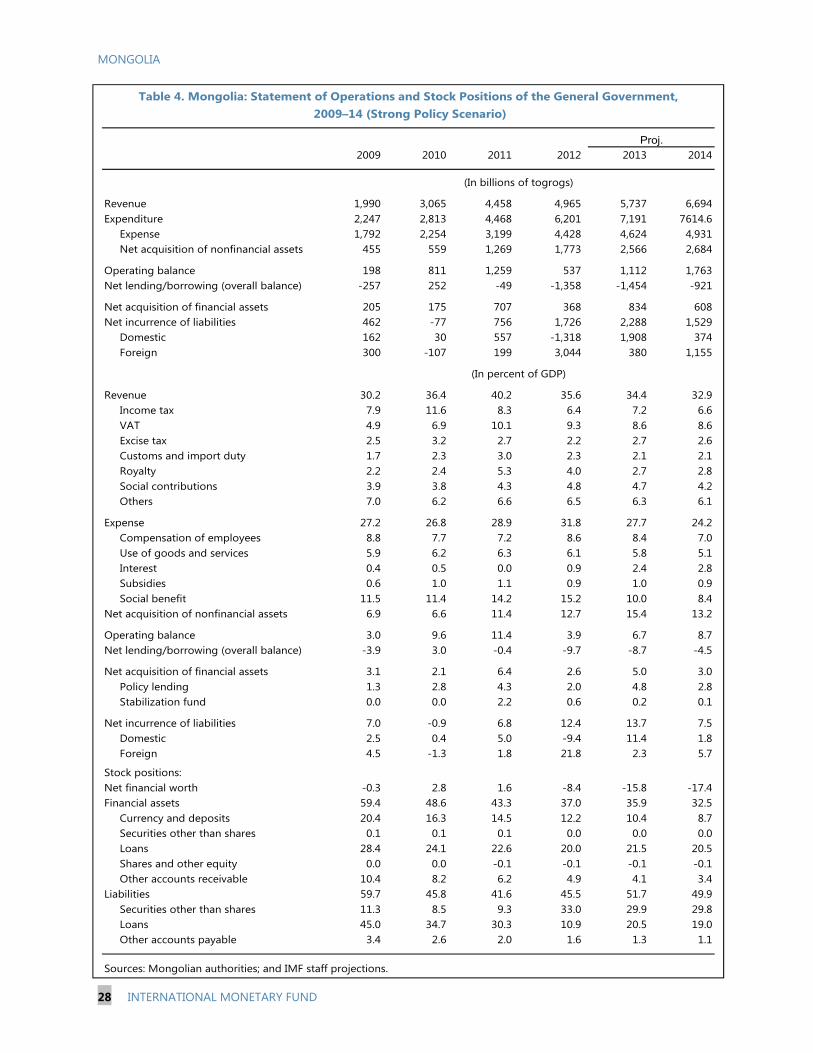
MONGOLIA
28 INTERNATIONAL MONETARY FUND
2009 2010 2011 2012 2013 2014
Revenue 1,990 3,065 4,458 4,965 5,737 6,694Expenditure 2,247 2,813 4,468 6,201 7,191 7614.6 Expense 1,792 2,254 3,199 4,428 4,624 4,931 Net acquisition of nonfinancial assets 455 559 1,269 1,773 2,566 2,684
Operating balance 198 811 1,259 537 1,112 1,763Net lending/borrowing (overall balance) -257 252 -49 -1,358 -1,454 -921
Net acquisition of financial assets 205 175 707 368 834 608Net incurrence of liabilities 462 -77 756 1,726 2,288 1,529 Domestic 162 30 557 -1,318 1,908 374 Foreign 300 -107 199 3,044 380 1,155
Revenue 30.2 36.4 40.2 35.6 34.4 32.9 Income tax 7.9 11.6 8.3 6.4 7.2 6.6 VAT 4.9 6.9 10.1 9.3 8.6 8.6 Excise tax 2.5 3.2 2.7 2.2 2.7 2.6 Customs and import duty 1.7 2.3 3.0 2.3 2.1 2.1 Royalty 2.2 2.4 5.3 4.0 2.7 2.8 Social contributions 3.9 3.8 4.3 4.8 4.7 4.2 Others 7.0 6.2 6.6 6.5 6.3 6.1
Expense 27.2 26.8 28.9 31.8 27.7 24.2 Compensation of employees 8.8 7.7 7.2 8.6 8.4 7.0 Use of goods and services 5.9 6.2 6.3 6.1 5.8 5.1 Interest 0.4 0.5 0.0 0.9 2.4 2.8 Subsidies 0.6 1.0 1.1 0.9 1.0 0.9 Social benefit 11.5 11.4 14.2 15.2 10.0 8.4Net acquisition of nonfinancial assets 6.9 6.6 11.4 12.7 15.4 13.2
Operating balance 3.0 9.6 11.4 3.9 6.7 8.7Net lending/borrowing (overall balance) -3.9 3.0 -0.4 -9.7 -8.7 -4.5
Net acquisition of financial assets 3.1 2.1 6.4 2.6 5.0 3.0 Policy lending 1.3 2.8 4.3 2.0 4.8 2.8 Stabilization fund 0.0 0.0 2.2 0.6 0.2 0.1
Net incurrence of liabilities 7.0 -0.9 6.8 12.4 13.7 7.5 Domestic 2.5 0.4 5.0 -9.4 11.4 1.8 Foreign 4.5 -1.3 1.8 21.8 2.3 5.7
Stock positions:Net financial worth -0.3 2.8 1.6 -8.4 -15.8 -17.4Financial assets 59.4 48.6 43.3 37.0 35.9 32.5 Currency and deposits 20.4 16.3 14.5 12.2 10.4 8.7 Securities other than shares 0.1 0.1 0.1 0.0 0.0 0.0 Loans 28.4 24.1 22.6 20.0 21.5 20.5 Shares and other equity 0.0 0.0 -0.1 -0.1 -0.1 -0.1 Other accounts receivable 10.4 8.2 6.2 4.9 4.1 3.4Liabilities 59.7 45.8 41.6 45.5 51.7 49.9 Securities other than shares 11.3 8.5 9.3 33.0 29.9 29.8 Loans 45.0 34.7 30.3 10.9 20.5 19.0 Other accounts payable 3.4 2.6 2.0 1.6 1.3 1.1
Sources: Mongolian authorities; and IMF staff projections.
Table 4. Mongolia: Statement of Operations and Stock Positions of the General Government, 2009–14 (Strong Policy Scenario)
(In billions of togrogs)
(In percent of GDP)
Proj.
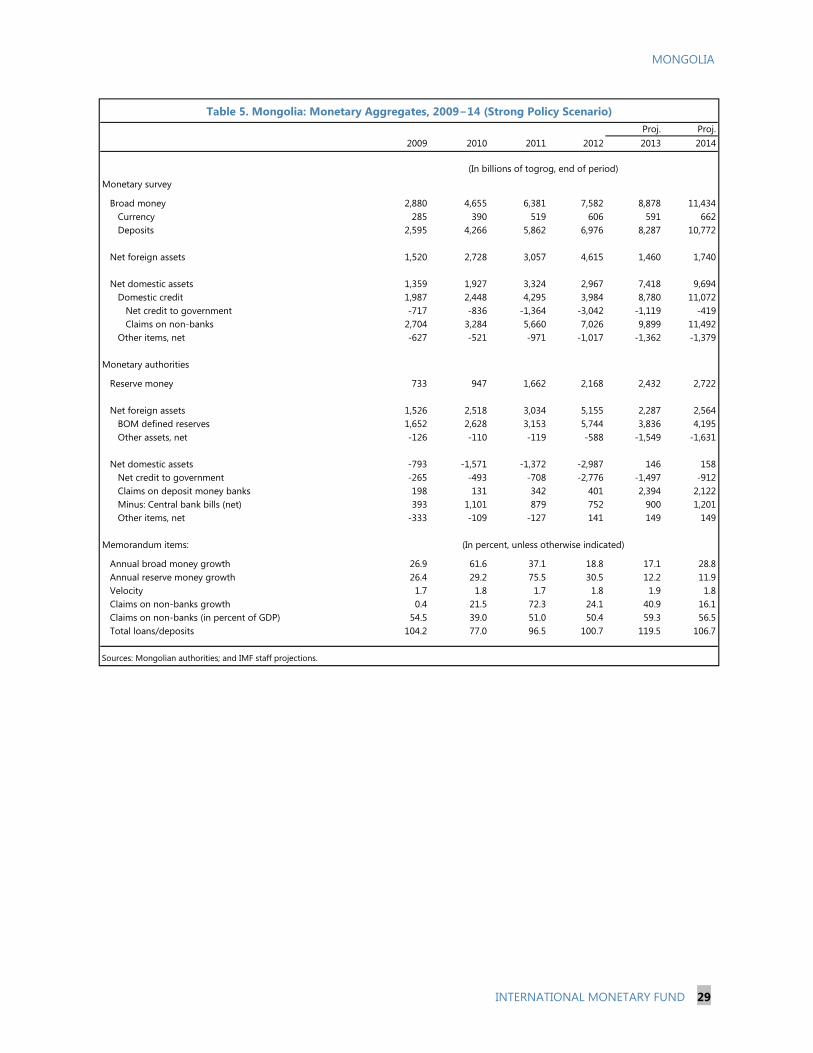
MONGOLIA
INTERNATIONAL MONETARY FUND 29
Proj. Proj.2009 2010 2011 2012 2013 2014
Monetary survey
Broad money 2,880 4,655 6,381 7,582 8,878 11,434 Currency 285 390 519 606 591 662 Deposits 2,595 4,266 5,862 6,976 8,287 10,772
Net foreign assets 1,520 2,728 3,057 4,615 1,460 1,740
Net domestic assets 1,359 1,927 3,324 2,967 7,418 9,694 Domestic credit 1,987 2,448 4,295 3,984 8,780 11,072 Net credit to government -717 -836 -1,364 -3,042 -1,119 -419 Claims on non-banks 2,704 3,284 5,660 7,026 9,899 11,492 Other items, net -627 -521 -971 -1,017 -1,362 -1,379
Monetary authorities
Reserve money 733 947 1,662 2,168 2,432 2,722
Net foreign assets 1,526 2,518 3,034 5,155 2,287 2,564 BOM defined reserves 1,652 2,628 3,153 5,744 3,836 4,195 Other assets, net -126 -110 -119 -588 -1,549 -1,631
Net domestic assets -793 -1,571 -1,372 -2,987 146 158 Net credit to government -265 -493 -708 -2,776 -1,497 -912 Claims on deposit money banks 198 131 342 401 2,394 2,122 Minus: Central bank bills (net) 393 1,101 879 752 900 1,201 Other items, net -333 -109 -127 141 149 149
Memorandum items:
Annual broad money growth 26.9 61.6 37.1 18.8 17.1 28.8 Annual reserve money growth 26.4 29.2 75.5 30.5 12.2 11.9 Velocity 1.7 1.8 1.7 1.8 1.9 1.8 Claims on non-banks growth 0.4 21.5 72.3 24.1 40.9 16.1 Claims on non-banks (in percent of GDP) 54.5 39.0 51.0 50.4 59.3 56.5 Total loans/deposits 104.2 77.0 96.5 100.7 119.5 106.7
Sources: Mongolian authorities; and IMF staff projections.
Table 5. Mongolia: Monetary Aggregates, 2009−14 (Strong Policy Scenario)
(In billions of togrog, end of period)
(In percent, unless otherwise indicated)
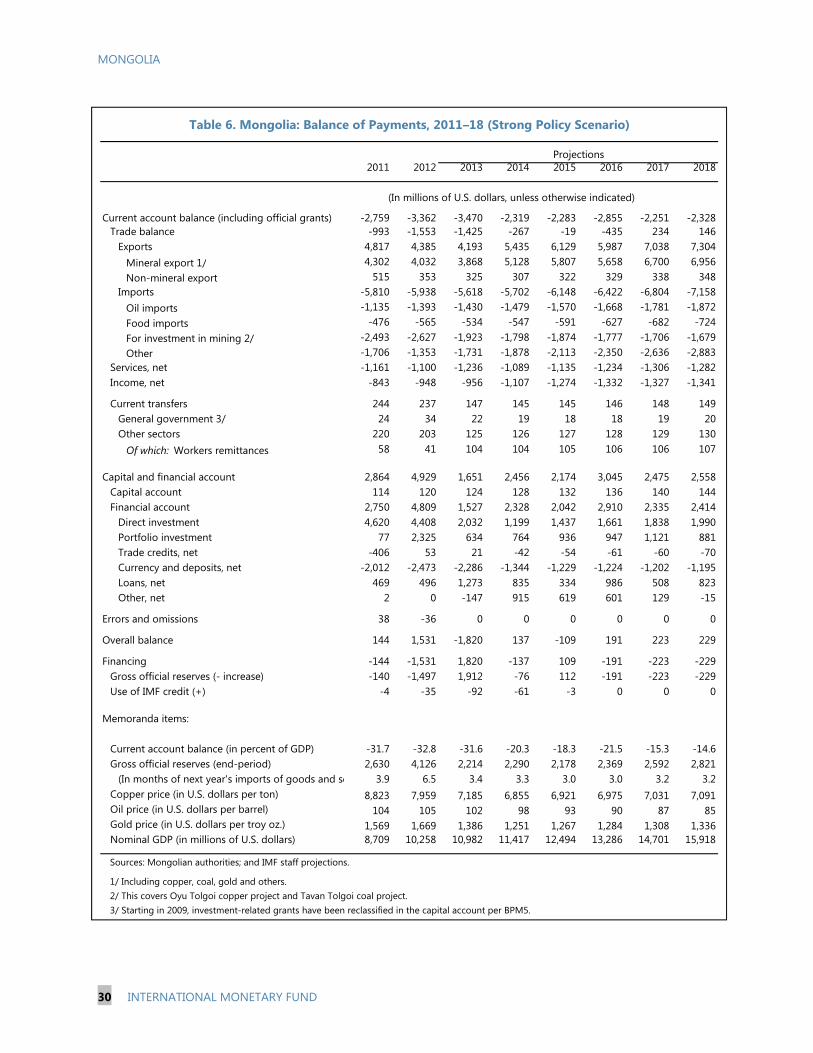
MONGOLIA
30 INTERNATIONAL MONETARY FUND
2011 2012 2013 2014 2015 2016 2017 2018
(In millions of U.S. dollars, unless otherwise indicated)
Current account balance (including official grants) -2,759 -3,362 -3,470 -2,319 -2,283 -2,855 -2,251 -2,328Trade balance -993 -1,553 -1,425 -267 -19 -435 234 146
Exports 4,817 4,385 4,193 5,435 6,129 5,987 7,038 7,304Mineral export 1/ 4,302 4,032 3,868 5,128 5,807 5,658 6,700 6,956Non-mineral export 515 353 325 307 322 329 338 348
Imports -5,810 -5,938 -5,618 -5,702 -6,148 -6,422 -6,804 -7,158Oil imports -1,135 -1,393 -1,430 -1,479 -1,570 -1,668 -1,781 -1,872Food imports -476 -565 -534 -547 -591 -627 -682 -724For investment in mining 2/ -2,493 -2,627 -1,923 -1,798 -1,874 -1,777 -1,706 -1,679Other -1,706 -1,353 -1,731 -1,878 -2,113 -2,350 -2,636 -2,883
Services, net -1,161 -1,100 -1,236 -1,089 -1,135 -1,234 -1,306 -1,282Income, net -843 -948 -956 -1,107 -1,274 -1,332 -1,327 -1,341
Current transfers 244 237 147 145 145 146 148 149General government 3/ 24 34 22 19 18 18 19 20Other sectors 220 203 125 126 127 128 129 130
Of which: Workers remittances 58 41 104 104 105 106 106 107
Capital and financial account 2,864 4,929 1,651 2,456 2,174 3,045 2,475 2,558Capital account 114 120 124 128 132 136 140 144Financial account 2,750 4,809 1,527 2,328 2,042 2,910 2,335 2,414
Direct investment 4,620 4,408 2,032 1,199 1,437 1,661 1,838 1,990Portfolio investment 77 2,325 634 764 936 947 1,121 881Trade credits, net -406 53 21 -42 -54 -61 -60 -70Currency and deposits, net -2,012 -2,473 -2,286 -1,344 -1,229 -1,224 -1,202 -1,195Loans, net 469 496 1,273 835 334 986 508 823Other, net 2 0 -147 915 619 601 129 -15
Errors and omissions 38 -36 0 0 0 0 0 0
Overall balance 144 1,531 -1,820 137 -109 191 223 229
Financing -144 -1,531 1,820 -137 109 -191 -223 -229Gross official reserves (- increase) -140 -1,497 1,912 -76 112 -191 -223 -229Use of IMF credit (+) -4 -35 -92 -61 -3 0 0 0
Memoranda items:
Current account balance (in percent of GDP) -31.7 -32.8 -31.6 -20.3 -18.3 -21.5 -15.3 -14.6Gross official reserves (end-period) 2,630 4,126 2,214 2,290 2,178 2,369 2,592 2,821
(In months of next year's imports of goods and se 3.9 6.5 3.4 3.3 3.0 3.0 3.2 3.2Copper price (in U.S. dollars per ton) 8,823 7,959 7,185 6,855 6,921 6,975 7,031 7,091Oil price (in U.S. dollars per barrel) 104 105 102 98 93 90 87 85Gold price (in U.S. dollars per troy oz.) 1,569 1,669 1,386 1,251 1,267 1,284 1,308 1,336Nominal GDP (in millions of U.S. dollars) 8,709 10,258 10,982 11,417 12,494 13,286 14,701 15,918
Sources: Mongolian authorities; and IMF staff projections.
1/ Including copper, coal, gold and others. 2/ This covers Oyu Tolgoi copper project and Tavan Tolgoi coal project.3/ Starting in 2009, investment-related grants have been reclassified in the capital account per BPM5.
Table 6. Mongolia: Balance of Payments, 2011–18 (Strong Policy Scenario)
Projections
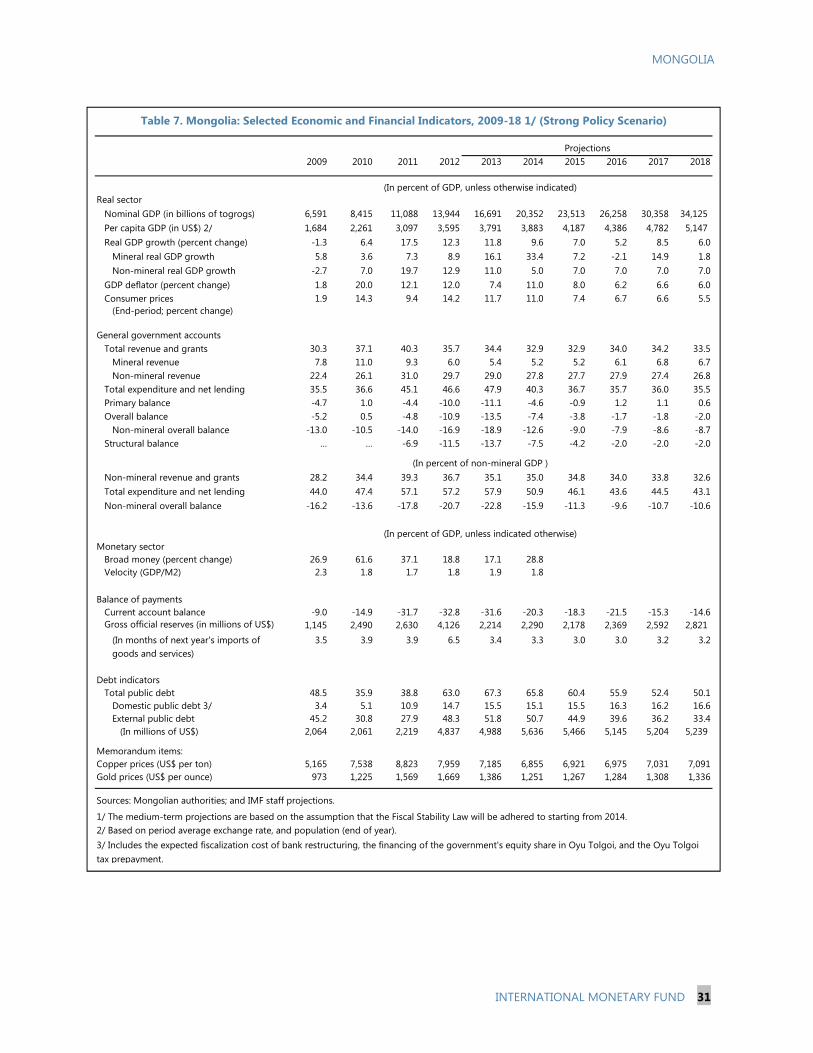
MONGOLIA
INTERNATIONAL MONETARY FUND 31
2009 2010 2011 2012 2013 2014 2015 2016 2017 2018
Real sector Nominal GDP (in billions of togrogs) 6,591 8,415 11,088 13,944 16,691 20,352 23,513 26,258 30,358 34,125 Per capita GDP (in US$) 2/ 1,684 2,261 3,097 3,595 3,791 3,883 4,187 4,386 4,782 5,147 Real GDP growth (percent change) -1.3 6.4 17.5 12.3 11.8 9.6 7.0 5.2 8.5 6.0 Mineral real GDP growth 5.8 3.6 7.3 8.9 16.1 33.4 7.2 -2.1 14.9 1.8 Non-mineral real GDP growth -2.7 7.0 19.7 12.9 11.0 5.0 7.0 7.0 7.0 7.0 GDP deflator (percent change) 1.8 20.0 12.1 12.0 7.4 11.0 8.0 6.2 6.6 6.0
Consumer prices 1.9 14.3 9.4 14.2 11.7 11.0 7.4 6.7 6.6 5.5 (End-period; percent change)
General government accounts Total revenue and grants 30.3 37.1 40.3 35.7 34.4 32.9 32.9 34.0 34.2 33.5 Mineral revenue 7.8 11.0 9.3 6.0 5.4 5.2 5.2 6.1 6.8 6.7 Non-mineral revenue 22.4 26.1 31.0 29.7 29.0 27.8 27.7 27.9 27.4 26.8 Total expenditure and net lending 35.5 36.6 45.1 46.6 47.9 40.3 36.7 35.7 36.0 35.5 Primary balance -4.7 1.0 -4.4 -10.0 -11.1 -4.6 -0.9 1.2 1.1 0.6 Overall balance -5.2 0.5 -4.8 -10.9 -13.5 -7.4 -3.8 -1.7 -1.8 -2.0 Non-mineral overall balance -13.0 -10.5 -14.0 -16.9 -18.9 -12.6 -9.0 -7.9 -8.6 -8.7 Structural balance … … -6.9 -11.5 -13.7 -7.5 -4.2 -2.0 -2.0 -2.0
Non-mineral revenue and grants 28.2 34.4 39.3 36.7 35.1 35.0 34.8 34.0 33.8 32.6 Total expenditure and net lending 44.0 47.4 57.1 57.2 57.9 50.9 46.1 43.6 44.5 43.1 Non-mineral overall balance -16.2 -13.6 -17.8 -20.7 -22.8 -15.9 -11.3 -9.6 -10.7 -10.6
Monetary sector Broad money (percent change) 26.9 61.6 37.1 18.8 17.1 28.8 Velocity (GDP/M2) 2.3 1.8 1.7 1.8 1.9 1.8
Balance of payments Current account balance -9.0 -14.9 -31.7 -32.8 -31.6 -20.3 -18.3 -21.5 -15.3 -14.6 Gross official reserves (in millions of US$) 1,145 2,490 2,630 4,126 2,214 2,290 2,178 2,369 2,592 2,821 (In months of next year's imports of 3.5 3.9 3.9 6.5 3.4 3.3 3.0 3.0 3.2 3.2 goods and services)
Debt indicators Total public debt 48.5 35.9 38.8 63.0 67.3 65.8 60.4 55.9 52.4 50.1 Domestic public debt 3/ 3.4 5.1 10.9 14.7 15.5 15.1 15.5 16.3 16.2 16.6 External public debt 45.2 30.8 27.9 48.3 51.8 50.7 44.9 39.6 36.2 33.4 (In millions of US$) 2,064 2,061 2,219 4,837 4,988 5,636 5,466 5,145 5,204 5,239
Memorandum items:Copper prices (US$ per ton) 5,165 7,538 8,823 7,959 7,185 6,855 6,921 6,975 7,031 7,091Gold prices (US$ per ounce) 973 1,225 1,569 1,669 1,386 1,251 1,267 1,284 1,308 1,336
Sources: Mongolian authorities; and IMF staff projections.
1/ The medium-term projections are based on the assumption that the Fiscal Stability Law will be adhered to starting from 2014.
Table 7. Mongolia: Selected Economic and Financial Indicators, 2009-18 1/ (Strong Policy Scenario)
(In percent of GDP, unless otherwise indicated)
(In percent of non-mineral GDP )
2/ Based on period average exchange rate, and population (end of year).
(In percent of GDP, unless indicated otherwise)
Projections
3/ Includes the expected fiscalization cost of bank restructuring, the financing of the government's equity share in Oyu Tolgoi, and the Oyu Tolgoi tax prepayment.
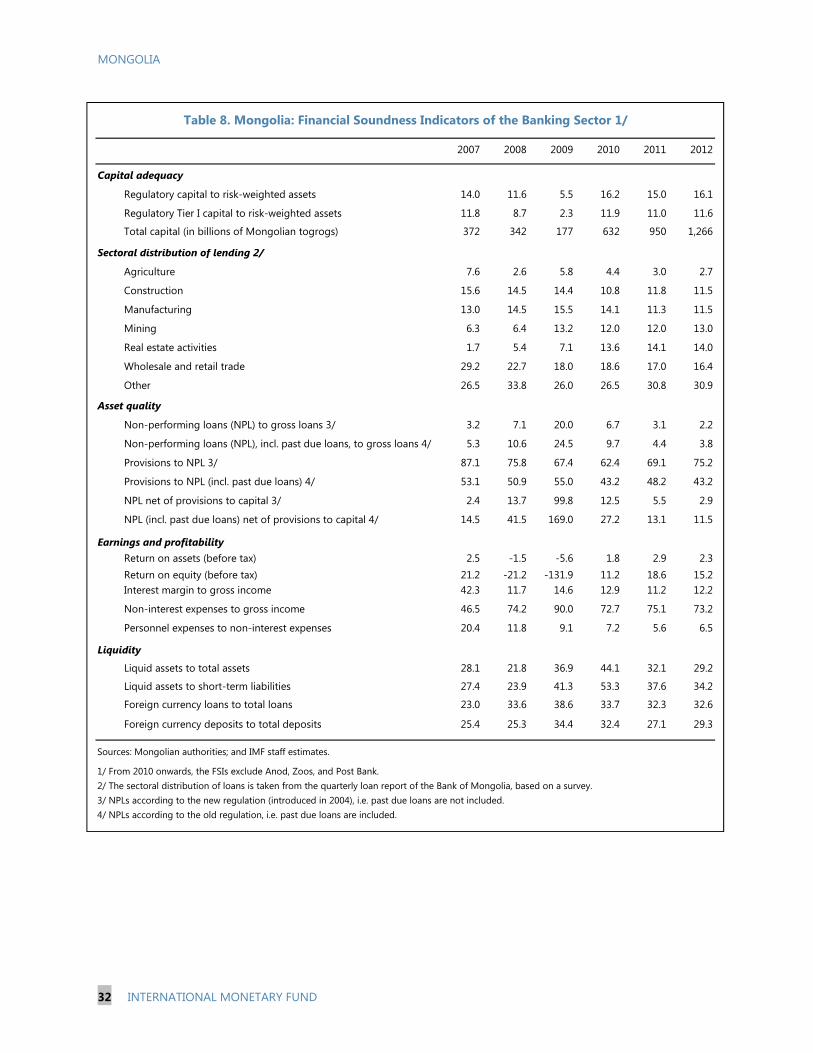
MONGOLIA
32 INTERNATIONAL MONETARY FUND
2007 2008 2009 2010 2011 2012
Capital adequacy
Regulatory capital to risk-weighted assets 14.0 11.6 5.5 16.2 15.0 16.1
Regulatory Tier I capital to risk-weighted assets 11.8 8.7 2.3 11.9 11.0 11.6
Total capital (in billions of Mongolian togrogs) 372 342 177 632 950 1,266
Sectoral distribution of lending 2/
Agriculture 7.6 2.6 5.8 4.4 3.0 2.7
Construction 15.6 14.5 14.4 10.8 11.8 11.5
Manufacturing 13.0 14.5 15.5 14.1 11.3 11.5
Mining 6.3 6.4 13.2 12.0 12.0 13.0
Real estate activities 1.7 5.4 7.1 13.6 14.1 14.0
Wholesale and retail trade 29.2 22.7 18.0 18.6 17.0 16.4
Other 26.5 33.8 26.0 26.5 30.8 30.9
Asset quality
Non-performing loans (NPL) to gross loans 3/ 3.2 7.1 20.0 6.7 3.1 2.2
Non-performing loans (NPL), incl. past due loans, to gross loans 4/ 5.3 10.6 24.5 9.7 4.4 3.8
Provisions to NPL 3/ 87.1 75.8 67.4 62.4 69.1 75.2
Provisions to NPL (incl. past due loans) 4/ 53.1 50.9 55.0 43.2 48.2 43.2
NPL net of provisions to capital 3/ 2.4 13.7 99.8 12.5 5.5 2.9
NPL (incl. past due loans) net of provisions to capital 4/ 14.5 41.5 169.0 27.2 13.1 11.5
Earnings and profitabilityReturn on assets (before tax) 2.5 -1.5 -5.6 1.8 2.9 2.3Return on equity (before tax) 21.2 -21.2 -131.9 11.2 18.6 15.2Interest margin to gross income 42.3 11.7 14.6 12.9 11.2 12.2
Non-interest expenses to gross income 46.5 74.2 90.0 72.7 75.1 73.2
Personnel expenses to non-interest expenses 20.4 11.8 9.1 7.2 5.6 6.5
Liquidity
Liquid assets to total assets 28.1 21.8 36.9 44.1 32.1 29.2
Liquid assets to short-term liabilities 27.4 23.9 41.3 53.3 37.6 34.2
Foreign currency loans to total loans 23.0 33.6 38.6 33.7 32.3 32.6
Foreign currency deposits to total deposits 25.4 25.3 34.4 32.4 27.1 29.3
Sources: Mongolian authorities; and IMF staff estimates.
1/ From 2010 onwards, the FSIs exclude Anod, Zoos, and Post Bank.2/ The sectoral distribution of loans is taken from the quarterly loan report of the Bank of Mongolia, based on a survey.3/ NPLs according to the new regulation (introduced in 2004), i.e. past due loans are not included.4/ NPLs according to the old regulation, i.e. past due loans are included.
Table 8. Mongolia: Financial Soundness Indicators of the Banking Sector 1/

MONGOLIA
INTERNATIONAL MONETARY FUND 33
Appendix I. Risk Assessment Matrix */
Source of Risks Likelihood Impacts Recommended Policy Response
Continued fiscal expansion M-H H. Continued fiscal expansion could intensify overheating pressures, undermine debt sustainability, and lead to macroeconomic instability.
Substantial fiscal consolidation is needed to bring fiscal policy back on track. Specifically, over time, expenditures should be reprioritized and reduced, consistent with the FSL ceilings.
Highly accommodative monetary policy
M-H H. Loose monetary policy conducted through non-market based quantitative easing and quasi-fiscal activity risks ratcheting up inflation expectation, distorting financial markets, and delaying structural reforms required to address supply-side bottlenecks. Persistent official foreign exchange sales during the first half of 2013 caused a rapid decline in foreign exchange reserves.
The BOM’s programs of monetary easing (price stabilization program, placement of 12-month term deposits at commercial banks and mortgage lending program) should be phased out. Monetary operations should be conducted mainly through open market operations. The BOM should continue to limit foreign exchange interventions to smoothing operations.
Financial stability risk M-H M-H. The banking sector harbors significant vulnerabilities arising from highly concentrated loan portfolios, inadequate provisioning, substantial dollarization and high loan-to-deposit ratios.
Banking supervision and regulation need to be strengthened in line with FSAP recommendations. Dollarization needs to be discouraged and the provisioning regime strengthened.
Business environment and political risks
M H. Foreign investors' uncertainty about the business climate could impede FDI inflows.
Build on the recent adoption of the new Investment Law to strengthen the business climate and stimulate FDI inflows.
Sharp slowdown in growth in China and/or sustained decline in commodity prices
M H. Slumping coal prices could cause closures of some mines. The uncertain outlook for commodity prices could hold back FDI inflows in the mining sector.
Policies should be geared toward building resilience against external shocks and realizing inclusive growth via diversification of the economy.
Protracted economic and financial volatility, especially for emerging markets
H M. Uncertainty in the global financing environment could stall foreign financing to Mongolia, causing delays to major mining projects and negatively impacting growth.
Building policy buffers, including prudent macroeconomic and financial policies, would help reduce economic volatility caused by fluctuations of capital flows.
Protracted period of slower European growth
H M. Weakening global demand could adversely affect current and capital flows.
Policies should be geared toward building policy buffers and resilience against external shocks.
Domestic
External
*/ The Risk Assessment Matrix (RAM) shows events that could materially alter the baseline path (the scenario most likely to materialize in the view of IMF staff). The relative likelihood of risks listed is the staff's subjective assessment of the risks surrounding the baseline ("low" is meant to indicate a probability below 10 percent, "medium" a probability between 10 and 30 percent, and "high" a probability of 30 percent or more). The RAM reflects staff views on the source of risks and overall level of concern as of the time of discussions with the authorities.
MONGOLIA
34 INTERNATIONAL MONETARY FUND
Appendix II. Mongolia’s New Fiscal Framework Anchored by the Fiscal Stability Law 1 2
A. Background to the Adoption of the Fiscal Stability Law (FSL) The mining sector’s share of Mongolia’s export earnings increased from about 55 percent in the early 2000s to 84 percent in 2008, and was expected to increase further with the imminent development of large untapped copper and coal deposits. Mining also contributed about 31 percent of total government revenues in 2008, with a further increase expected over the medium term. On this basis, many Mongolians expected the country’s mineral wealth to quickly lead to lasting economic prosperity.
However, the global financial crisis was associated with an abrupt end to the global commodity boom, causing the price of copper—Mongolia’s primary export—to decline by 70 percent from its July 2008 peak. The resulting decline in exports and the government’s mineral revenues weighed heavily on the economy and opened up large deficits in both fiscal and external accounts, heightening the risk of a disruptive contraction in economic activity. The macroeconomic policy framework was not robust enough to withstand an external shock of this magnitude. Government spending had expanded with the rise in mineral revenues, pushing the non-mineral deficit to nearly 10 percent of GDP in 2007; there was no ready replacement for a shortfall in mineral revenues.
Mongolia reformulated its framework for the management of mineral revenues in light of the lessons from the 2008/09 crisis and in anticipation of the Oyu Tolgoi (OT) project coming on stream. A FSL setting new fiscal rules and a stabilization (and savings) fund was approved by Mongolia’s Parliament in 2010. The FSL benefitted from technical assistance (TA) from various partners, including the Fund. However, as described below, some provisions in the final version of the law deviated from their advice.
B. Objectives of the FSL
The main objective of the FSL is to improve fiscal discipline and stability. The FSL aims to dampen the macroeconomic effects of mineral price fluctuations by smoothing spending (insulating the fiscal spending path from fluctuations in mineral revenue) in order to improve management of macroeconomic demand. The law imposes fiscal discipline to avoid the temptation to spend mineral revenue immediately and supports a stability-oriented fiscal policy. The FSL also aims to address a potentially large increase in revenue from copper and/or coal production when large mining projects mature, which, unless carefully managed, would infuse considerable additional demand into the economy.
1 Prepared by Kyung-Seol Min (FAD). 2 The annex borrows from Mongolia’s Fiscal Framework for Dealing with Nonrenewable Resources, published in a background paper to the August 2012 Board paper on Macroeconomic policy Frameworks for Resource-Rich Developing Countries.
MONGOLIA
INTERNATIONAL MONETARY FUND 35
In addition to numerical rules, the FSL also incorporates procedural and transparency reforms to strengthen budget discipline. For example, the law specifies that decisions on fiscal policy must be taken first within a medium-term fiscal framework. The budget is then decided on within the approved framework. The fact that amendments to the FSL require a two-thirds parliamentary majority signals that the authorities are fully committed to the rules-based approach.
C. Fiscal Rules in the FSL
The FSL put in place three complementary fiscal rules to function together to ensure fiscal discipline:
A ceiling on the structural deficit of 2 percent of GDP (effective from 2013);
A ceiling on expenditure growth linked to the rate of growth of non-mineral GDP (effective from 2013); and
A public debt ceiling of 40 percent of nominal GDP (in net present value (NPV) terms, effective from 2014).
The main fiscal rule targets a “structural” balance. The structural balance is defined as the difference between “structural” revenues and overall expenditures. Structural revenues are defined as revenues that would be received if the prices of major minerals3 were at a particular level, defined as a 16-year moving average of mineral prices.4 The use of structural revenues helps to insulate spending plans from revenue fluctuations caused by short-term changes in prices. Originally, a zero or positive target was recommended to allow the build-up of stabilization buffers and reduce debt-to-GDP ratios. However, the political process led to the approval of a 2 percent of GDP deficit target. Based on medium- to long-term simulations, that deficit target was deemed appropriate assuming Mongolia’s future borrowing strategy relies mostly on concessional borrowing to ensure stabilization of the debt-to-GDP and debt service ratios.
By restricting the maximum expansion of expenditures in any given year, the expenditure rule functions as a secondary check for managing macroeconomic demand. The rule constrains total expenditure growth to a rate consistent with the economy’s capacity to absorb the spending without triggering a surge in inflation or an overshooting of the real exchange rate. This rule is a critical complement to the structural (price-based) rule because of potentially substantial increases in total mineral revenue as large mining projects like OT mature. In the FSL, the expenditure growth ceiling is the greater of the current year’s nominal non-mineral GDP growth rate, and the 12-year moving average of nominal non-mineral GDP growth. This rule does not distinguish between current and capital expenditures.
3 Major minerals are the ones that generate revenues of at least 3 percent of total revenues. Copper and coal have been classified as major minerals through 2013. 4 This comprised actual prices of the past 12 years and projected prices for the current year and the next 3 years. This unusually long period was adopted on the political economy grounds of prudence. However, the use of a formula that looks back a long time may lead to major forecast errors and long periods of undershooting or overshooting of actual prices, which could eventually undermine the credibility of the rule.
MONGOLIA
36 INTERNATIONAL MONETARY FUND
The gross debt rule is a secondary constraint to ensure that policy under the fiscal rules is consistent with keeping debt sustainable. The primary guarantor of debt sustainability is the choice of the structural balance target itself, which determines the required financing and thereby the trajectory of public debt. The gross debt rule is a transparent, though indirect, anchor for fiscal policy by implicitly limiting the maximum deficit the structural balance rule can target. The NPV of public debt should be no greater than 40 percent of nominal GDP, and the coverage of public debt includes all the types of financial obligations (including government guarantees) of fully and partly state-owned legal entities. This provision takes effect in 2014. In the interim, to account for expected debt dynamics, the FSL sets ceilings of 50 percent of GDP in 2011, 60 percent in 2012, and 50 percent in 2013.
A further consideration is that fiscal rules have to strike a balance between economic strictness and political reality. Too strict and they risk breaking down due to political pressures; too lax and they provide no benefits to the economy. To ensure some inherent flexibility in the rules, the FSL foresees recalibrating the main fiscal target (the structural balance) every four years at the beginning of a new government term. The law also has an escape clause in case of national emergencies or economic crises.
A simulation in 2009 illustrated how fiscal indicators would have behaved for 2000–10 if the fiscal framework had been constrained by both a structural balance rule and an expenditure growth rule. The simulation implied substantive smoothing for both mineral revenue and expenditure due to the structural balance rule, which stabilizes fiscal policy even when mineral prices are very volatile. The expenditure rule was binding only occasionally because the price smoothing built into the structural balance rule was already very effective in limiting the effect of mineral price volatility on expenditures.
D. Fiscal Stability Fund (FSF)
The fiscal framework is supported by a stabilization fund for mineral revenue. When actual mineral revenue exceeds structural mineral revenue, the difference has to be placed in the stabilization fund. This applies even if there is an overall fiscal deficit, in which case the government has to borrow to make the transfers into the stabilization fund. On the other hand, when structural mineral revenue exceeds actual mineral revenue and there is an overall fiscal deficit, the fund can be used to finance that deficit.
The FSF is maintained at an account in the Bank of Mongolia (BOM) in accordance with the Law on Government Special Funds. The FSF balance is denominated in domestic currency and does therefore not contribute to international reserves. It amounted to MNT 360 billion at end-May 2013, which is equivalent to about 2 percent of GDP. The BOM is asked by the same Law to manage the FSF in order to ensure liquidity of the resources in the event of a withdrawal request, to mitigate risks, and to invest the balances efficiently on the international financial market. The FSL stipulates that no active management of FSF balances should occur until the balance reaches 10 percent of GDP. The BOM has paid no interest on this account.
MONGOLIA
INTERNATIONAL MONETARY FUND 37
An arrangement has now been made which governs FSF. Under a Minister’s Order, the share of mineral revenues that is to be distributed to the FSF is calculated twice a month. These new procedures promote more efficient and timely cash transfers to the FSF. However, a specific arrangement on the rule for withdrawals from the FSF is still lacking and no withdrawals have been made to date. Withdrawals might be made in 2013 because the actual price of some minerals (especially coal) has fallen below the structural price according to some measures.
The fund will also function as a savings account to build wealth for future generations. To promote a minimum savings effort by the government, the FSL requires the fund to be greater than 5 percent of GDP from FY 2018 onward, with excesses invested with a longer-term perspective. While there is no consensus yet within the government on withdrawal rules, the fund balance is expected to be used mainly after the mineral reserves are depleted. However, this provision could create inconsistencies among rules if a gap between actual and structural revenues is not high enough to meet the 5 percent of GDP floor.
E. Recent Developments
The FSL was a milestone in tackling the procyclicality of Mongolia’s fiscal policy, but there are serious questions concerning its full implementation in 2013 and beyond. The government-owned Development Bank of Mongolia (DBM), established in 2011, is used as an off-budget vehicle for spending outside the constraints of the FSL. In March 2012 the DBM raised US$580 million (5.5 percent of GDP) by issuing 5-year government-guaranteed bonds. Total government spending, including spending by the DBM, increased by 73 percent in real terms between 2010 and 2012. This caused the overall fiscal deficit (including DBM operations) to worsen to 10.9 percent of GDP and added to pressures on domestic demand and non-mining imports. The approved 2013 budget targets a structural deficit of 2 percent of GDP, in line with the FSL. However, the budget’s revenue projections are overly ambitious, and DBM spending which could reach 9 percent of GDP in 2013 is not included in the budget.
Other improvements in the structural underpinnings for fiscal policy have also suffered setbacks: The Integrated Budget Law (IBL) passed in December 2011 was aimed to help support fiscal
sustainability and implementation of the FSL by mandating that the budget meet the FSL’s requirements and by spelling out sanctions if they are violated. The IBL also aimed to strengthen capital budgeting, mandating that only projects that have gone through a proper appraisal process be considered for financing. According to the IBL, all financing decisions are then made by the Ministry of Finance (MOF), abiding by the good principle of the MOF as a single point of control on such matters. However, in September 2012 the Ministry of Economic Development (MED) was created and was put in charge of planning the capital budget. The MED was instrumental in launching the December 2012 sovereign bond issuance, drawing up a list of off-budget public investment projects, and channeling the bond proceeds through the DBM to start implementing these projects outside the budget.
MONGOLIA
38 INTERNATIONAL MONETARY FUND
The Social Welfare Law approved in January 2012 implied a significant step forward in efficiently fighting poverty by mandating a means-tested benefit to replace costly universal cash transfers. However, in September 2012 universal child benefits were reintroduced.
F. The Way Forward
Political commitment to macroeconomic stability and the FSL will be key to resist expenditure pressures. The FSL framework is comprehensive, focused on fiscal rules specifically tailored for producers of nonrenewable resources, and supported by a resource fund. The combination of a price-based rule and an expenditure growth limit is attractive in terms of public communication—because of its focus on highly visible mineral prices—while also delinking public expenditure from revenue volatility due to other factors (like the possibly large increase in mineral revenue over the medium term, once the OT mine starts to make dividend payments to the budget). The start of a new political cycle could provide a window of opportunity to return to stability-oriented macroeconomic policies.
The establishment of a sovereign wealth fund (SWF) would be an important complement to the FSL’s fiscal policy framework. The current fiscal architecture includes a fiscal stabilization fund held at the central bank in which revenue from higher-than-structural copper and coal prices are deposited. However, given the sizable fiscal deficits of the past few years, the 2 percent of GDP currently deposited in this fund has been funded from government borrowing and no net wealth has been accumulated. For the next few years, the priority should be to return the fiscal balance to the path prescribed by the FSL. In the longer run, when revenue from mining rises, the FSL’s structural deficit ceiling may need to be tightened to allow for a significant accumulation of net financial assets in the SWF. This would be consistent with recommendations made when the FSL was set up and with the policy advice included in the 2012 IMF Policy Paper on Macroeconomic Policy
Frameworks for Resource-Rich Developing Countries.
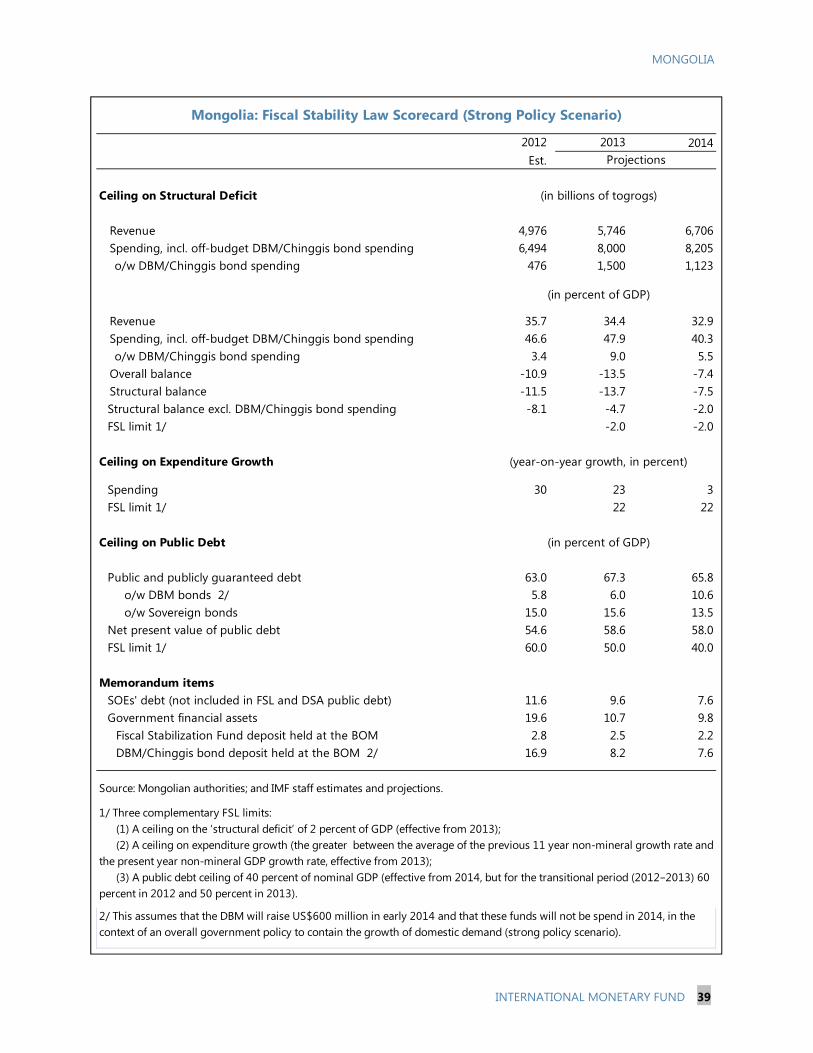
MONGOLIA
INTERNATIONAL MONETARY FUND 39
2014Est.
Ceiling on Structural Deficit
Revenue 4,976 5,746 6,706 Spending, incl. off-budget DBM/Chinggis bond spending 6,494 8,000 8,205
o/w DBM/Chinggis bond spending 476 1,500 1,123
Revenue 35.7 34.4 32.9 Spending, incl. off-budget DBM/Chinggis bond spending 46.6 47.9 40.3
o/w DBM/Chinggis bond spending 3.4 9.0 5.5 Overall balance -10.9 -13.5 -7.4 Structural balance -11.5 -13.7 -7.5
Structural balance excl. DBM/Chinggis bond spending -8.1 -4.7 -2.0FSL limit 1/ -2.0 -2.0
Ceiling on Expenditure Growth
Spending 30 23 3FSL limit 1/ 22 22
Ceiling on Public Debt
Public and publicly guaranteed debt 63.0 67.3 65.8o/w DBM bonds 2/ 5.8 6.0 10.6o/w Sovereign bonds 15.0 15.6 13.5
Net present value of public debt 54.6 58.6 58.0FSL limit 1/ 60.0 50.0 40.0
Memorandum itemsSOEs' debt (not included in FSL and DSA public debt) 11.6 9.6 7.6Government financial assets 19.6 10.7 9.8
Fiscal Stabilization Fund deposit held at the BOM 2.8 2.5 2.2DBM/Chinggis bond deposit held at the BOM 2/ 16.9 8.2 7.6
Source: Mongolian authorities; and IMF staff estimates and projections.
2/ This assumes that the DBM will raise US$600 million in early 2014 and that these funds will not be spend in 2014, in the context of an overall government policy to contain the growth of domestic demand (strong policy scenario).
Projections
1/ Three complementary FSL limits: (1) A ceiling on the ‘structural deficit’ of 2 percent of GDP (effective from 2013); (2) A ceiling on expenditure growth (the greater between the average of the previous 11 year non-mineral growth rate and the present year non-mineral GDP growth rate, effective from 2013); (3) A public debt ceiling of 40 percent of nominal GDP (effective from 2014, but for the transitional period (2012−2013) 60 percent in 2012 and 50 percent in 2013).
Mongolia: Fiscal Stability Law Scorecard (Strong Policy Scenario)
2012 2013
(in percent of GDP)
(year-on-year growth, in percent)
(in billions of togrogs)
(in percent of GDP)
MONGOLIA STAFF REPORT FOR THE 2013 ARTICLE IV CONSULTATION—INFORMATIONAL ANNEX Prepared By
Asia and Pacific Department (in collaboration with other Departments)
FUND RELATIONS ________________________________________________________________________ 2
WORLD BANK-IMF COLLABORATION ___________________________________________________ 5
RELATIONS WITH THE ASIAN DEVELOPMENT BANK __________________________________ 8
STATISTICAL ISSUES ____________________________________________________________________ 10
MILLENNIUM DEVELOPMENT GOALS _________________________________________________ 12
MAIN WEBSITES OF DATA _____________________________________________________________ 13
CONTENTS
November 1, 2013
MONGOLIA
2 INTERNATIONAL MONETARY FUND
FUND RELATIONS (As of September 30, 2013) Membership Status: Joined: February 14, 1991; Article VIII General Resources Account: SDR Million Percent Quota Quota 51.10 100.00
Fund Holdings of Currency 108.45 212.24 Reserve Position in Fund 0.14 0.27
SDR Department: SDR Million Percent Allocation Net cumulative allocation 48.76 100.00 Holdings 43.38 88.98 Outstanding Purchases and Loans: SDR Million Percent Quota Stand-by Arrangements 57.49 112.50 Latest Financial Arrangements: Approval Expiration Amount Approved Amount Drawn Type Date Date (SDR Million) (SDR Million) Stand-by 04/01/2009 10/01/2010 153.30 122.64 ECF 1/ 09/28/2001 07/31/2005 28.49 12.21 ECF 1/ 07/30/1997 07/29/2000 33.39 17.44 1/ Formerly PRGF. Projected Obligations to Fund: (SDR Million; based on existing use of resources and present
holdings of SDRs): Forthcoming 2013 2014 2015 2016 2017 Principal 15.33 40.24 1.92 0.00 0.00 Charges/interest 0.16 0.27 0.02 0.00 0.00 Total 15.49 40.51 1.93 0.00 0.00 Safeguards Assessments:
An update safeguards assessment of the Bank of Mongolia (BOM) finalized in June 2009 found that the BOM has continued to improve its safeguards framework since the previous assessment. The BOM’s financial reporting and audit practices generally comply with international standards. The assessment made recommendations to (i) strengthen certain aspects of the BOM’s oversight mechanism, (ii) remove external audit qualifications caused by lack of access to central bank’s vaults, and (iii) improve the timeliness of audit completion and publication of the bank’s financial statements. The authorities have since confirmed that the auditors were granted access to its vaults at end-2009 to end-2011, and the timing of audit completion has improved.
MONGOLIA
INTERNATIONAL MONETARY FUND 3
Exchange Arrangement:
On March 24, 2009, the BOM instituted a foreign exchange auction allowing the determination of the exchange rate mainly by market forces. The de facto and de jure exchange rate arrangements are currently both classified as floating. Mongolia accepted the obligations of Article VIII, Sections 2, 3, and 4 on February 1, 1996. Mongolia maintains two multiple currency practices (MCPs) subject to Fund jurisdiction. First, the modalities of the multi-price auction system give rise to an MCP since there is no mechanism in place that ensures that exchange rates of accepted bids at the multi-price auction do not deviate by more than 2 percent. The Executive Board approved the multi-price auction MCP until June 22, 2010 (Decision No. 14365 of June 23, 2009), and it’s further extension until March 15, 2012 or the next Article IV consultation whichever is earlier (Decision No. 14669 of June 23, 2010 and Decision No. 14365 of March 16, 2011). The MCP, however, could not be resolved by March 15, 2012, and would be continued as long as the multiple price foreign exchange auction mechanism remains in place. Therefore the MCP is unapproved, and since the criteria for approval of this MCP are not in place, staff does not recommend Executive Board approval of said measure. In addition, Mongolia has an official exchange rate (reference rate) that is mandatorily used for government transactions (as opposed to the commercial market rate). Therefore, by way of official action, the authorities have created a market segmentation. While Order #699 of the BOM issued on December 3, 2010, sets forth that the reference rate is determined based on the weighted average of market rates used from 4 PM of the previous day to 4 PM of the current day, staff is of the view that this Order does not eliminate the market segmentation and the multiplicity of effective rates arising from it. Accordingly, in the absence of a mechanism to ensure that the commercial rates and the reference rate do not deviate by more than 2 percent, the way the reference rate is used in government transactions gives rise to an MCP subject to Fund approval. Since the criteria for approval of this MCP are not in place, it remains unapproved. Mongolia imposes exchange restrictions for security reasons in accordance with United Nations Security Council Resolution No. 92/757 concerning certain transactions with the Federal Republic of Yugoslavia (Serbia and Montenegro) that have been notified to the Fund under Decision 144 (11/4/94). The BOM notes that hitherto there have been no cases where exchange rates of accepted bids at the multi-price auction deviate by more than 2 percent, and plans to introduce a mechanism to ensure the deviation would never exceed 2 percent. The BOM is also working on the development of an indicative spot exchange rate.
Article IV Consultation:
The 2012 Article IV consultation (IMF Country Report No. 12/320) was concluded by the Executive Board on November 16, 2012. Mongolia is on a 12–month cycle.
MONGOLIA
4 INTERNATIONAL MONETARY FUND
ROSC Assessments:
The following ROSC assessments have been undertaken: Data Dissemination (May 2001), Fiscal Transparency Module (November 2001), Fiscal update (May 2005), Data Dissemination (April 2008), Monetary and Fiscal Policy Transparency (September 2008), Banking Supervision (September 2008).
Recent Financial Arrangements:
An 18-month Stand-by Arrangement in an amount of equivalent to SDR 153.3 million (300 percent of quota) was approved on April 1, 2009. The Executive Board successfully completed the final review on September 8, 2010.
FSAP Participation:
Mongolia participates in the Financial Sector Assessment Program (FSAP). The first, second, and third FSAP missions took place in May 2007, September 2007 and November 2010 respectively. The latest report (IMF Country Report No. 11/107) was published in May 2011.
Technical Assistance since 2013:
Missions:
Extractive Industries Fiscal Regime (FAD), September 2013 Sovereign Wealth Fund (FAD), June 2013 Developing Medium Term Debt Management Strategy (MCM), April 2013 CPI/PPI (STA), April 2013 and September 2013 External Sector Statistics (STA), April 2013 Strengthening LTO operations (FAD), March 2013 and August 2013 AML/CTF (LEG), March 2013 and September 2013 Treasury operations (FAD), March 2013 National Accounts Statistics (STA), February 2013 and August 2013 Treasury operations (FAD), February 2013 Medium Term Budget Framework (FAD), January 2013 and March 2013
Resident Advisors:
Budget Planning (FAD), June 2009–June 2012
Resident Representative:
Since September 2011, the Fund no longer has a resident representative in Mongolia. Ms. Yuko Kinoshita, who is based in the IMF’s Regional Office for Asia and the Pacific in Tokyo, now serves as the non-resident representative for Mongolia and oversees the local office.
MONGOLIA
INTERNATIONAL MONETARY FUND 5
WORLD BANK-IMF COLLABORATION 1. The Bank and the Fund country teams maintain a close working relationship. The teams, led by Ms. Chorching Goh (Lead Economist, EASPR) and Mr. Gerard Almekinders (Mission Chief) collaborate on a range of macroeconomic and structural issues.
2. Cooperation and coordination is exemplary. It pertains to the following:
IMF surveillance. World Bank staff participates in Policy Consultation Meetings ahead of Article IV consultation missions and comments on staff reports. World Bank staff also participates in selected meetings of the Article IV mission team with the authorities. This facilitates the discussions, especially as regards policies in areas of mutual interest such as bank restructuring, social welfare reform, and fiscal policy.
Development Policy Credits (DPC) and Country Partnership Strategy (CPS). In turn, Fund staff participated in the design and review of the Bank’s DPCs and was kept informed about the development of the Bank’s new CPS for FY13−17.
Banking system issues. Both country teams have been active in this area, including by fielding technical assistance missions. The teams coordinate closely to provide the authorities with consistent advice while avoiding unnecessary duplication of efforts. The two teams also continue to educate the public and parliamentarians on banking sector issues in an effort to build support for reforms.
Structural reforms. Staffs of the Fund and the World Bank have worked together successfully to provide technical assistance in expenditure management, the Fiscal Stability Law, the Integrated Budget Law, the Social Welfare Law, the Investment Law , and taxation of the mineral sector and on-going work on the Sovereign Wealth Fund Law.
3. Based on the close collaboration, the Bank and the Fund share a common view about Mongolia’s macroeconomic and structural reform priorities. These include:
Promoting long-term growth. Managing the mineral wealth to ensure strong, sustainable, and equitable growth with low inflation. This includes the importance of avoiding the “resource curse” and the productive use of mineral wealth management.
Macro-economic stability. This includes ensuring that the boom-bust policies of the past are not repeated. The Fiscal Stability Law adopted in 2010 with the support of the Fund and the Bank is a key step, and it is critical that it be strictly adhered to from 2013, the first year the law is effective. At the same time, fiscal policy also has to be mindful of the macroeconomic policy mix and medium and long-term fiscal sustainability.
Monetary policy. The Bank of Mongolia (BOM)’s large monetary stimulus, through its so-called “price stabilization program,” mortgage program, and liquidity injection, distorts
MONGOLIA
6 INTERNATIONAL MONETARY FUND
markets and is bound to ratchet up inflation. The stimulus program should be phased out and the BOM should focus on further strengthening the monetary policy framework. The flexible exchange rate regime should be maintained.
Protecting the poor. The 2012 Social Welfare Law envisages replacing existing costly universal cash transfers with means-tested benefits that would reach the poorest households. Full implementation of the law would represent a big step forward in strengthening the social safety net and increasing fiscal flexibility. Concrete action following the adoption of the law is important from a socio-economic perspective as well as a fiscal perspective.
Strengthening the banking system. Key steps include continued improvement in bank regulation and supervision, ramping up risk disclosure and management—especially given elevated systemic risks in the sector illustrated by the recent failure of Saving Bank—and strengthening the newly established Mongolian Deposit Insurance Corporation.
4. The teams agreed to continue the close cooperation going forward. Table 1 details the specific activities planned by the two country teams over the period September 2013–August 2014 along with their expected deliveries. It was also agreed that further details on collaboration, as necessary, would be agreed at the technical level as work progresses.
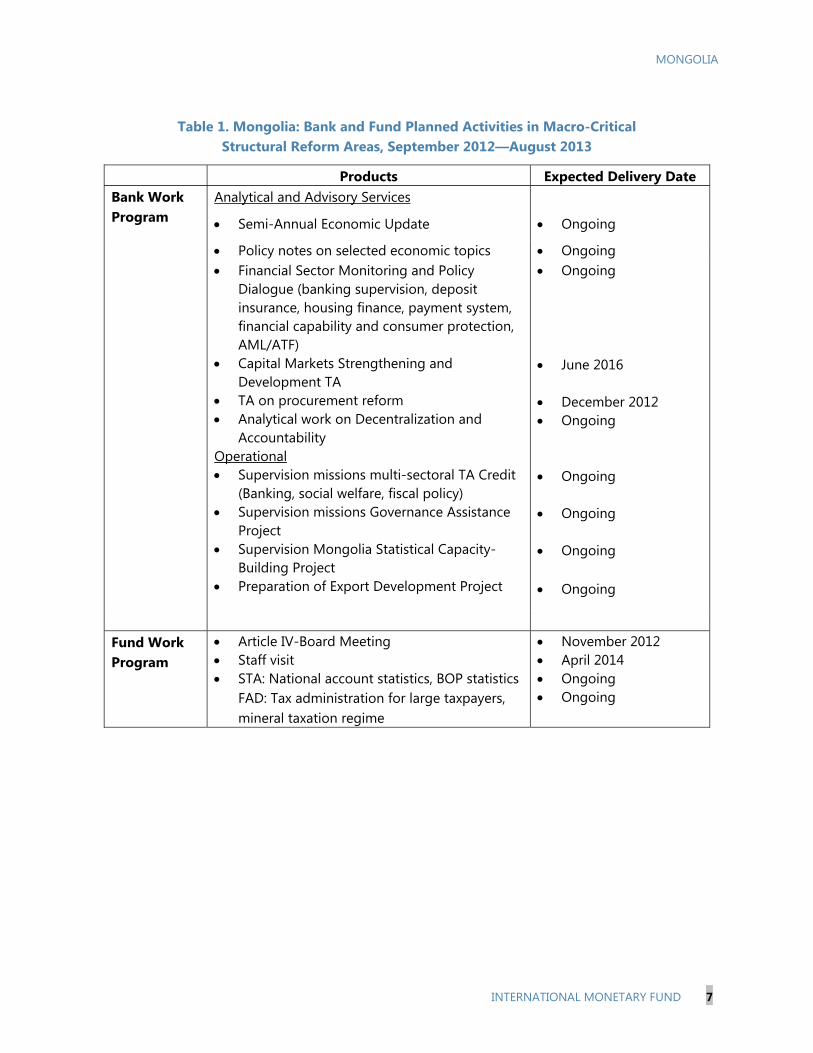
MONGOLIA
INTERNATIONAL MONETARY FUND 7
Table 1. Mongolia: Bank and Fund Planned Activities in Macro-Critical
Structural Reform Areas, September 2012—August 2013
Products Expected Delivery Date Bank Work Program
Analytical and Advisory Services
Semi-Annual Economic Update Ongoing
Policy notes on selected economic topics Ongoing Financial Sector Monitoring and Policy
Dialogue (banking supervision, deposit insurance, housing finance, payment system, financial capability and consumer protection, AML/ATF)
Capital Markets Strengthening and Development TA
TA on procurement reform Analytical work on Decentralization and
Accountability
Ongoing
June 2016
December 2012 Ongoing
Operational Supervision missions multi-sectoral TA Credit
(Banking, social welfare, fiscal policy) Supervision missions Governance Assistance
Project Supervision Mongolia Statistical Capacity-
Building Project Preparation of Export Development Project
Ongoing
Ongoing
Ongoing
Ongoing
Fund Work Program
Article IV-Board Meeting Staff visit STA: National account statistics, BOP statistics
FAD: Tax administration for large taxpayers, mineral taxation regime
November 2012 April 2014 Ongoing Ongoing
MONGOLIA
8 INTERNATIONAL MONETARY FUND
RELATIONS WITH THE ASIAN DEVELOPMENT BANK1 Mongolia became a member of the Asian Development Bank (AsDB) in February 1991. The AsDB has been Mongolia’s largest source of multilateral development finance for more than two decades and since Mongolia joined AsDB, the country has received 50 sovereign loans totaling US$955 million, 12 Asian Development Fund (ADF) grants for US$172 million and Japan Fund for Poverty Reduction grants for US$23.7 million.
In recognition of its sound economic performance and higher credit worthiness, in 2011 Mongolia gained access to AsDB’s ordinary capital resources (OCR), alongside AsDB’s concessional lending from ADF. Given its AAA credit rating, AsDB makes funding available for development projects on favorable terms. This change was welcomed by the Government of Mongolia as large amounts of capital are needed to finance infrastructure investments and the improvement of social services.
In the past, AsDB provided financial, technical and policy support in areas ranging from urban infrastructure, agriculture, energy, finance, education, health, to social protection and transport. AsDB has also provided private sector financing for commercial banks and supported trade through its Trade Finance Program.
The Mongolia Country Partnership Strategy 2012−16 was approved by AsDB’s board in April 2012, which is formulated in line with the National Development Strategy of Mongolia, with the focus on employment creation and support for economic diversification. AsDB’s investments are prioritizing (i) transport, energy, and water supply infrastructure; (ii) access to education and health; and (iii) regional economic cooperation in order to support sustainable and inclusive growth of economy.
In response to the change in government, after general elections in June 2012 and its priorities, a number of adjustments have been made to the lending and non-lending programs of AsDB. To reflect those new priorities in its operations, ADB is reviewing the current CPS and formulating new COBP for 2014−2016. For 2013, AsDB will provide loans for US$172.5 million and US$42.5 million from OCR and ADF funding sources, respectively. In addition, technical assistance worth US$7.9 million will be provided.
AsDB’s operations will concentrate on the following sectors in the following years:
Transport. Transport is the largest sector of AsDB operations in Mongolia. AsDB is financing construction of the country’s two main international road corridors, one in the east and the other in the west. These projects are also included as priority corridors under the Central Asia Regional Economic Cooperation (CAREC). Under the CAREC program, Mongolia is harmonizing cross-border transport procedures, and developing mentioned key economic corridors, linking to its neighboring economies. AsDB is also considering to develop a public transport system for Ulaanbaatar (UB), and 1 Data provided by Asian Development Bank staff.
MONGOLIA
INTERNATIONAL MONETARY FUND 9
supporting the construction of logistics infrastructure and systems in Zamyn-Uud at the border to the People’s Republic of China.
Urban Development. AsDB is helping to improve living conditions and greater access to basic services, including water, sanitation, and heating, of the poor people in urban areas, including secondary towns in the mineral-rich Gobi area, where communities are coping with a large population influx in response to new mining operations. AsDB is planning to extend basic urban infrastructure and construct socio-economic facilities in peri-urban area of the UB city, home of nearly half of the population, to upgrade existing sub-centers for improved economic, housing, and employment opportunities, and reduced environmental pollution.
Energy. Insufficient and unreliable power and heating are becoming bottlenecks to growth and threaten livelihoods. AsDB is improving energy efficiency and capacity in UB, through the country’s first major public–private partnership in constructing a new energy efficient combined heating and power plant in UB with proper emission reduction equipment. AsDB has been piloting the application of renewable energies, and is supporting Mongolia to access multilateral climate change funds.
Education. AsDB has supported the government’s efforts to reform and develop the education system in all the subsectors (pre-primary, primary, secondary, tertiary, technical and vocational education and training). To meet pressing labor market demands, AsDB is currently supporting reform of higher education and considering to help modernize vocational training.
Health and Social Protection. AsDB has made major investments to improve primary health services and is supporting policy reforms and investments in the hospital sector, drug and blood safety and hospitals hygiene. AsDB assisted the government in introduction of proxy means testing to target the poor, cancellation of several universal benefits, introduction of the food stamp program as the first poverty-targeted benefit in the country, and passage of the amended Social Welfare Law in January 2012 that legalized the reforms. AsDB will continue to support the efficiency and transparency of the delivery of social welfare and insurance services, through strengthened policy, systems and information technology.
In addition to above priority areas, AsDB is focusing on improved access to finance and economic diversification through support to the agribusinesses, in the fields of dairy, cashmere, carpet, meat and food production, to develop Mongolian brands and generate employment.
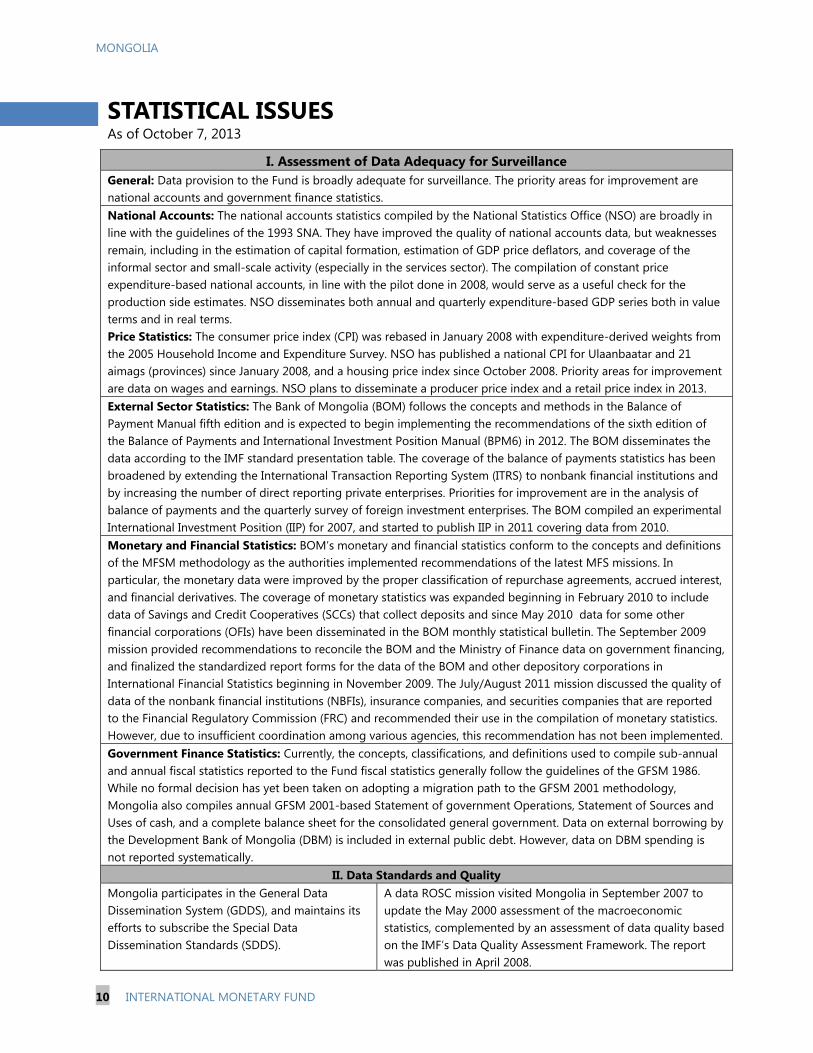
MONGOLIA
10 INTERNATIONAL MONETARY FUND
STATISTICAL ISSUESAs of October 7, 2013
I. Assessment of Data Adequacy for Surveillance General: Data provision to the Fund is broadly adequate for surveillance. The priority areas for improvement are national accounts and government finance statistics. National Accounts: The national accounts statistics compiled by the National Statistics Office (NSO) are broadly in line with the guidelines of the 1993 SNA. They have improved the quality of national accounts data, but weaknesses remain, including in the estimation of capital formation, estimation of GDP price deflators, and coverage of the informal sector and small-scale activity (especially in the services sector). The compilation of constant price expenditure-based national accounts, in line with the pilot done in 2008, would serve as a useful check for the production side estimates. NSO disseminates both annual and quarterly expenditure-based GDP series both in value terms and in real terms. Price Statistics: The consumer price index (CPI) was rebased in January 2008 with expenditure-derived weights from the 2005 Household Income and Expenditure Survey. NSO has published a national CPI for Ulaanbaatar and 21 aimags (provinces) since January 2008, and a housing price index since October 2008. Priority areas for improvement are data on wages and earnings. NSO plans to disseminate a producer price index and a retail price index in 2013. External Sector Statistics: The Bank of Mongolia (BOM) follows the concepts and methods in the Balance of Payment Manual fifth edition and is expected to begin implementing the recommendations of the sixth edition of the Balance of Payments and International Investment Position Manual (BPM6) in 2012. The BOM disseminates the data according to the IMF standard presentation table. The coverage of the balance of payments statistics has been broadened by extending the International Transaction Reporting System (ITRS) to nonbank financial institutions and by increasing the number of direct reporting private enterprises. Priorities for improvement are in the analysis of balance of payments and the quarterly survey of foreign investment enterprises. The BOM compiled an experimental International Investment Position (IIP) for 2007, and started to publish IIP in 2011 covering data from 2010. Monetary and Financial Statistics: BOM’s monetary and financial statistics conform to the concepts and definitions of the MFSM methodology as the authorities implemented recommendations of the latest MFS missions. In particular, the monetary data were improved by the proper classification of repurchase agreements, accrued interest, and financial derivatives. The coverage of monetary statistics was expanded beginning in February 2010 to include data of Savings and Credit Cooperatives (SCCs) that collect deposits and since May 2010 data for some other financial corporations (OFIs) have been disseminated in the BOM monthly statistical bulletin. The September 2009 mission provided recommendations to reconcile the BOM and the Ministry of Finance data on government financing, and finalized the standardized report forms for the data of the BOM and other depository corporations in International Financial Statistics beginning in November 2009. The July/August 2011 mission discussed the quality of data of the nonbank financial institutions (NBFIs), insurance companies, and securities companies that are reported to the Financial Regulatory Commission (FRC) and recommended their use in the compilation of monetary statistics. However, due to insufficient coordination among various agencies, this recommendation has not been implemented. Government Finance Statistics: Currently, the concepts, classifications, and definitions used to compile sub-annual and annual fiscal statistics reported to the Fund fiscal statistics generally follow the guidelines of the GFSM 1986. While no formal decision has yet been taken on adopting a migration path to the GFSM 2001 methodology, Mongolia also compiles annual GFSM 2001-based Statement of government Operations, Statement of Sources and Uses of cash, and a complete balance sheet for the consolidated general government. Data on external borrowing by the Development Bank of Mongolia (DBM) is included in external public debt. However, data on DBM spending is not reported systematically.
II. Data Standards and Quality Mongolia participates in the General Data Dissemination System (GDDS), and maintains its efforts to subscribe the Special Data Dissemination Standards (SDDS).
A data ROSC mission visited Mongolia in September 2007 to update the May 2000 assessment of the macroeconomic statistics, complemented by an assessment of data quality based on the IMF’s Data Quality Assessment Framework. The report was published in April 2008.
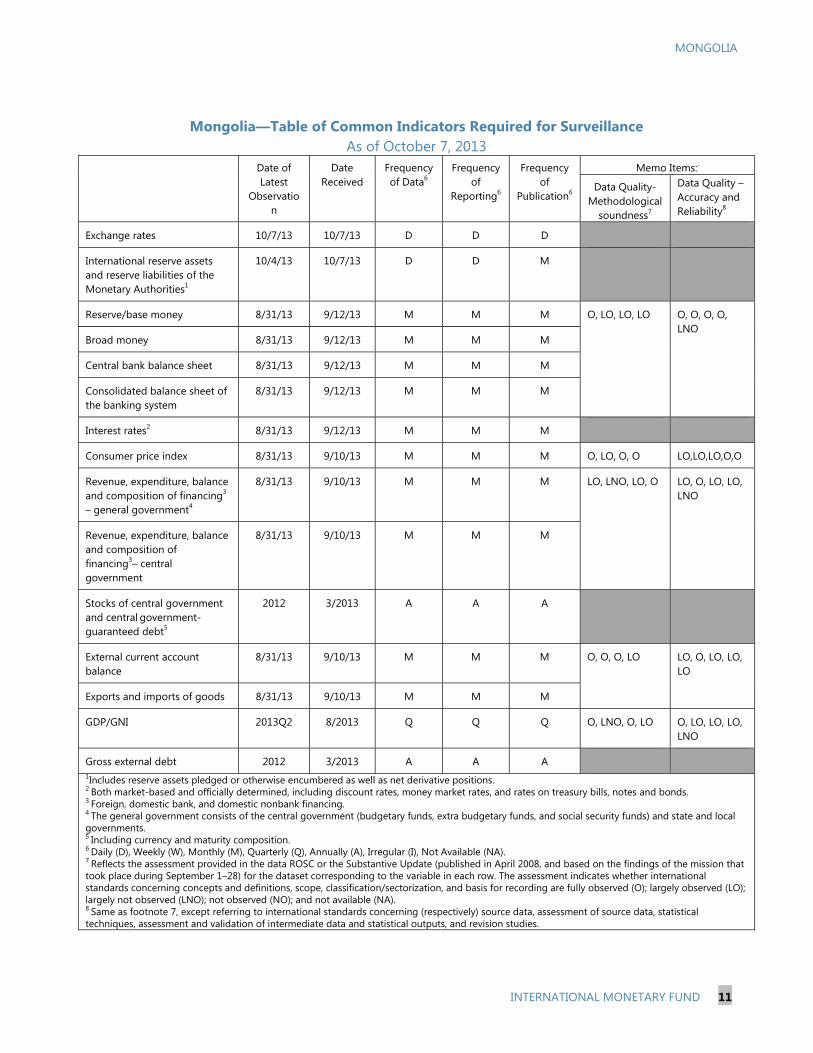
MONGOLIA
INTERNATIONAL MONETARY FUND 11
Mongolia—Table of Common Indicators Required for Surveillance
As of October 7, 2013 Date of
Latest Observatio
n
Date Received
Frequency of Data6
Frequency of
Reporting6
Frequency of
Publication6
Memo Items::
Data Quality- Methodological
soundness7
Data Quality – Accuracy and Reliability8
Exchange rates 10/7/13 10/7/13 D D D
International reserve assets and reserve liabilities of the Monetary Authorities1
10/4/13 10/7/13 D D M
Reserve/base money 8/31/13 9/12/13 M M M O, LO, LO, LO O, O, O, O, LNO
Broad money 8/31/13 9/12/13 M M M
Central bank balance sheet 8/31/13 9/12/13 M M M
Consolidated balance sheet of the banking system
8/31/13 9/12/13 M M M
Interest rates2 8/31/13 9/12/13 M M M
Consumer price index 8/31/13 9/10/13 M M M O, LO, O, O LO,LO,LO,O,O
Revenue, expenditure, balance and composition of financing3 – general government4
8/31/13 9/10/13 M M M LO, LNO, LO, O LO, O, LO, LO, LNO
Revenue, expenditure, balance and composition of financing3– central government
8/31/13 9/10/13 M M M
Stocks of central government and central government-guaranteed debt5
2012 3/2013 A A A
External current account balance
8/31/13 9/10/13 M M M O, O, O, LO LO, O, LO, LO, LO
Exports and imports of goods 8/31/13 9/10/13 M M M
GDP/GNI 2013Q2 8/2013 Q Q Q O, LNO, O, LO O, LO, LO, LO, LNO
Gross external debt 2012 3/2013 A A A 1Includes reserve assets pledged or otherwise encumbered as well as net derivative positions.2 Both market-based and officially determined, including discount rates, money market rates, and rates on treasury bills, notes and bonds. 3 Foreign, domestic bank, and domestic nonbank financing. 4 The general government consists of the central government (budgetary funds, extra budgetary funds, and social security funds) and state and local governments. 5 Including currency and maturity composition. 6 Daily (D), Weekly (W), Monthly (M), Quarterly (Q), Annually (A), Irregular (I), Not Available (NA). 7 Reflects the assessment provided in the data ROSC or the Substantive Update (published in April 2008, and based on the findings of the mission that took place during September 1–28) for the dataset corresponding to the variable in each row. The assessment indicates whether international standards concerning concepts and definitions, scope, classification/sectorization, and basis for recording are fully observed (O); largely observed (LO); largely not observed (LNO); not observed (NO); and not available (NA). 8 Same as footnote 7, except referring to international standards concerning (respectively) source data, assessment of source data, statistical techniques, assessment and validation of intermediate data and statistical outputs, and revision studies.
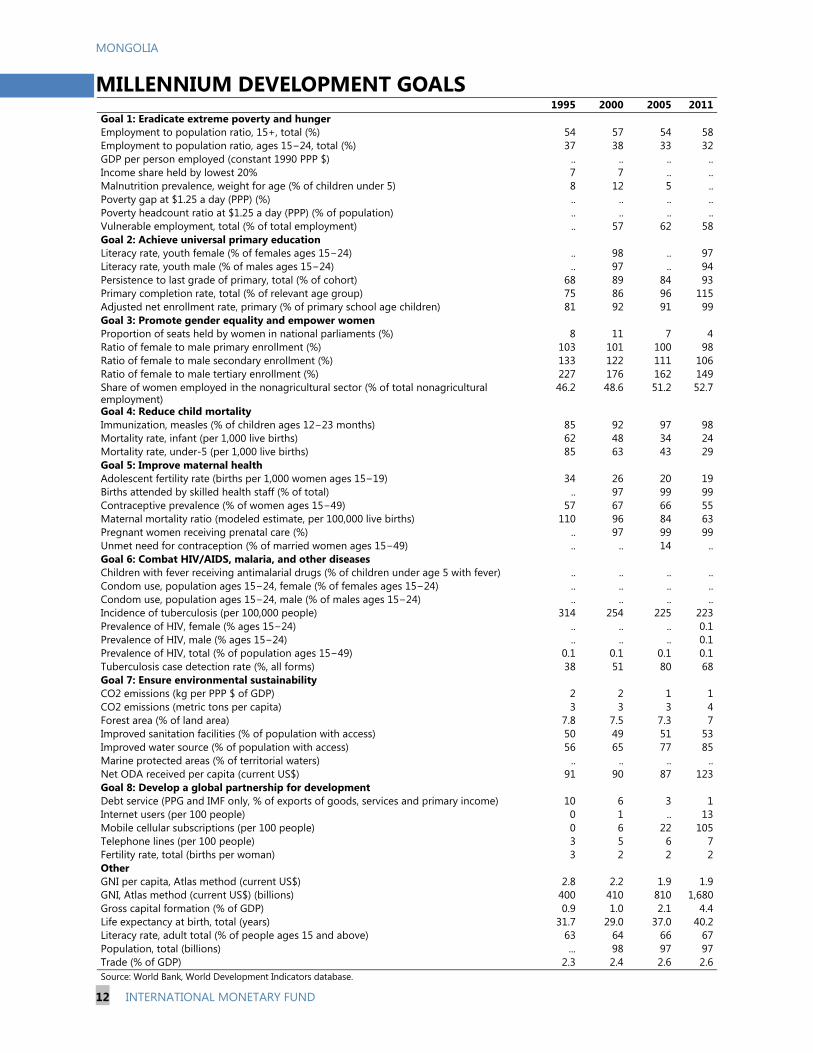
MONGOLIA
12 INTERNATIONAL MONETARY FUND
MILLENNIUM DEVELOPMENT GOALS 1995 2000 2005 2011Goal 1: Eradicate extreme poverty and hunger Employment to population ratio, 15+, total (%) 54 57 54 58Employment to population ratio, ages 15−24, total (%) 37 38 33 32GDP per person employed (constant 1990 PPP $) .. .. .. ..Income share held by lowest 20% 7 7 .. ..Malnutrition prevalence, weight for age (% of children under 5) 8 12 5 ..Poverty gap at $1.25 a day (PPP) (%) .. .. .. ..Poverty headcount ratio at $1.25 a day (PPP) (% of population) .. .. .. ..Vulnerable employment, total (% of total employment) .. 57 62 58Goal 2: Achieve universal primary education Literacy rate, youth female (% of females ages 15−24) .. 98 .. 97Literacy rate, youth male (% of males ages 15−24) .. 97 .. 94Persistence to last grade of primary, total (% of cohort) 68 89 84 93Primary completion rate, total (% of relevant age group) 75 86 96 115Adjusted net enrollment rate, primary (% of primary school age children) 81 92 91 99Goal 3: Promote gender equality and empower women Proportion of seats held by women in national parliaments (%) 8 11 7 4Ratio of female to male primary enrollment (%) 103 101 100 98Ratio of female to male secondary enrollment (%) 133 122 111 106Ratio of female to male tertiary enrollment (%) 227 176 162 149Share of women employed in the nonagricultural sector (% of total nonagricultural employment)
46.2 48.6 51.2 52.7
Goal 4: Reduce child mortality Immunization, measles (% of children ages 12−23 months) 85 92 97 98Mortality rate, infant (per 1,000 live births) 62 48 34 24Mortality rate, under-5 (per 1,000 live births) 85 63 43 29Goal 5: Improve maternal health Adolescent fertility rate (births per 1,000 women ages 15−19) 34 26 20 19Births attended by skilled health staff (% of total) .. 97 99 99Contraceptive prevalence (% of women ages 15−49) 57 67 66 55Maternal mortality ratio (modeled estimate, per 100,000 live births) 110 96 84 63Pregnant women receiving prenatal care (%) .. 97 99 99Unmet need for contraception (% of married women ages 15−49) .. .. 14 ..Goal 6: Combat HIV/AIDS, malaria, and other diseases Children with fever receiving antimalarial drugs (% of children under age 5 with fever) .. .. .. ..Condom use, population ages 15−24, female (% of females ages 15−24) .. .. .. ..Condom use, population ages 15−24, male (% of males ages 15−24) .. .. .. ..Incidence of tuberculosis (per 100,000 people) 314 254 225 223Prevalence of HIV, female (% ages 15−24) .. .. .. 0.1Prevalence of HIV, male (% ages 15−24) .. .. .. 0.1Prevalence of HIV, total (% of population ages 15−49) 0.1 0.1 0.1 0.1Tuberculosis case detection rate (%, all forms) 38 51 80 68Goal 7: Ensure environmental sustainability CO2 emissions (kg per PPP $ of GDP) 2 2 1 1CO2 emissions (metric tons per capita) 3 3 3 4Forest area (% of land area) 7.8 7.5 7.3 7Improved sanitation facilities (% of population with access) 50 49 51 53Improved water source (% of population with access) 56 65 77 85Marine protected areas (% of territorial waters) .. .. .. ..Net ODA received per capita (current US$) 91 90 87 123Goal 8: Develop a global partnership for development Debt service (PPG and IMF only, % of exports of goods, services and primary income) 10 6 3 1Internet users (per 100 people) 0 1 .. 13Mobile cellular subscriptions (per 100 people) 0 6 22 105Telephone lines (per 100 people) 3 5 6 7Fertility rate, total (births per woman) 3 2 2 2Other GNI per capita, Atlas method (current US$) 2.8 2.2 1.9 1.9GNI, Atlas method (current US$) (billions) 400 410 810 1,680Gross capital formation (% of GDP) 0.9 1.0 2.1 4.4Life expectancy at birth, total (years) 31.7 29.0 37.0 40.2Literacy rate, adult total (% of people ages 15 and above) 63 64 66 67Population, total (billions) ... 98 97 97Trade (% of GDP) 2.3 2.4 2.6 2.6Source: World Bank, World Development Indicators database.
MONGOLIA
INTERNATIONAL MONETARY FUND 13
MAIN WEBSITES OF DATA National Statistics Office (www.nso.mn) National Accounts Consumer Price Inflation Agricultural and Industrial Production Petroleum Imports Electricity Production and Consumption Coal Production Retail Prices Employment Exports and Imports Bank of Mongolia (www.mongolbank.mn) Monetary Survey Consolidated Balance Sheet of Commercial Banks Distribution of Bank Credit to the Nongovernment Sector Net Credit to Government Interest Rates Balance of Payments Services and Income Accounts Official Reserves of the Bank of Mongolia Selected Indicators of Commercial Bank Foreign Exchange Operations Nominal and Real Exchange Rates Securities Market Data Government Budget Accounts Ministry of Finance (www.mof.gov.mn) Government Budgetary Operations National Development and Innovation Committee (www.ndic.gov.mn) Long- and medium-term development strategy Economic and social policies Investment policy coordination Development Bank of Mongolia Financial Regulatory Commission (www.frc.mn) FRC decisions Total assets of regulated entities (insurance companies, securities and broker firms, non-
bank financial institutions, savings and credit unions) Consolidated income statements of regulated entities (insurance companies, securities and
broker firms, non-bank financial institutions, savings and credit unions)
MONGOLIA STAFF REPORT FOR THE 2013 ARTICLE IV CONSULTATION—DEBT SUSTAINABILITY ANALYSIS
This year’s debt sustainability analysis (DSA) concludes that Mongolia faces a moderate risk of debt distress. The DSAs prepared in recent years concluded that Mongolia’s risk of debt distress was low.1 However, the large international bond issuances by the Development Bank of Mongolia (DBM) and the sovereign have pushed up Mongolia’s public and publicly-guaranteed external debt. Moreover, the near and medium-term outlook for the balance of payments has deteriorated owing to negative shocks to FDI and coal exports and expansionary fiscal and monetary policies. As a result, even in a “strong policy scenario,” which is used as the baseline scenario in this DSA and which would require the authorities to tighten policies substantially from the current macroeconomic policy stance, Mongolia’s present value of external debt-to-GDP ratio and debt-service-to-revenue ratio breach the relevant policy-dependent indicative threshold in certain years.2 Some other debt-burden indicators breach the thresholds when standard stress tests are applied. Moreover, debt and debt-burden indicators would be even more unfavorable under an alternative “weak policy scenario,” which assumes a continuation of current expansionary macroeconomic policies. Under this “weak policy scenario,” Mongolia would need to be re-classified to a “high risk of debt distress.”
1 This DSA is based on end-2012 debt data. The fiscal year for Mongolia is January–December. The 2012 DSA (see IMF Country Report No. 12/320) was based on end-2011 debt data. 2 The low-income country debt sustainability framework (LIC DSF) recognizes that better policies and institutions allow countries to manage higher levels of debt, and thus the threshold levels are policy-dependent. Mongolia’s policies and institutions, as measured by the World Bank’s Country Policy and Institutional Assessment (CPIA), place it as a “medium performer”, with an average rating of 3.44 during 2010-12. The relevant indicative thresholds for this category are: 40 percent for the NPV of debt-to-GDP ratio, 150 percent for the NPV of debt-to-exports ratio, 250 percent for the NPV of debt-to-revenue ratio, 20 percent for the debt service-to-exports ratio, and 20 percent for the debt service-to-revenue ratio. These thresholds are applicable to public and publicly guaranteed external debt.
Approved By Markus Rodlauer and Masato Miyazaki (IMF) and Jeffrey Lewis and Sudhir Shetty (IDA)
The Debt Sustainability Analysis (DSA) has been prepared jointly by IMF and World Bank staff, in consultation with the authorities and the Asian Development Bank (AsDB), using the debt sustainability framework for low-income countries approved by the Boards of both institutions.
November 1, 2013
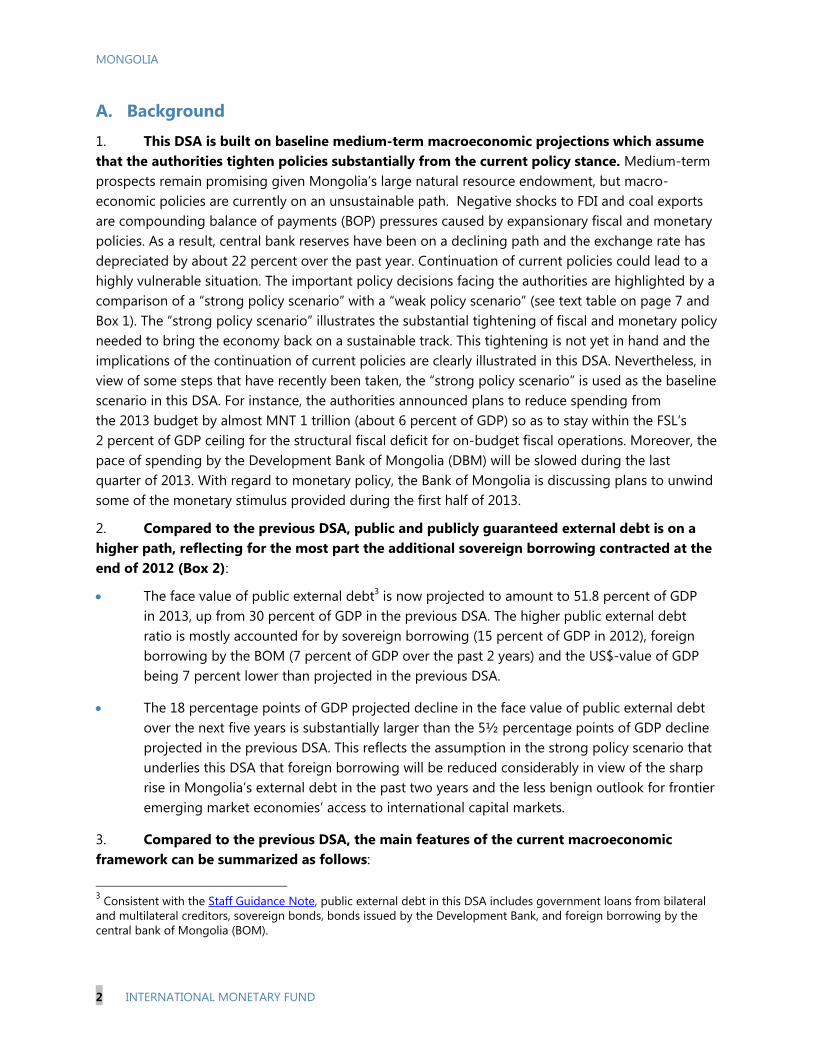
MONGOLIA
2 INTERNATIONAL MONETARY FUND
A. Background
1. This DSA is built on baseline medium-term macroeconomic projections which assume that the authorities tighten policies substantially from the current policy stance. Medium-term prospects remain promising given Mongolia’s large natural resource endowment, but macro-economic policies are currently on an unsustainable path. Negative shocks to FDI and coal exports are compounding balance of payments (BOP) pressures caused by expansionary fiscal and monetary policies. As a result, central bank reserves have been on a declining path and the exchange rate has depreciated by about 22 percent over the past year. Continuation of current policies could lead to a highly vulnerable situation. The important policy decisions facing the authorities are highlighted by a comparison of a “strong policy scenario” with a “weak policy scenario” (see text table on page 7 and Box 1). The “strong policy scenario” illustrates the substantial tightening of fiscal and monetary policy needed to bring the economy back on a sustainable track. This tightening is not yet in hand and the implications of the continuation of current policies are clearly illustrated in this DSA. Nevertheless, in view of some steps that have recently been taken, the “strong policy scenario” is used as the baseline scenario in this DSA. For instance, the authorities announced plans to reduce spending from the 2013 budget by almost MNT 1 trillion (about 6 percent of GDP) so as to stay within the FSL’s 2 percent of GDP ceiling for the structural fiscal deficit for on-budget fiscal operations. Moreover, the pace of spending by the Development Bank of Mongolia (DBM) will be slowed during the last quarter of 2013. With regard to monetary policy, the Bank of Mongolia is discussing plans to unwind some of the monetary stimulus provided during the first half of 2013.
2. Compared to the previous DSA, public and publicly guaranteed external debt is on a higher path, reflecting for the most part the additional sovereign borrowing contracted at the end of 2012 (Box 2):
The face value of public external debt3 is now projected to amount to 51.8 percent of GDP in 2013, up from 30 percent of GDP in the previous DSA. The higher public external debt ratio is mostly accounted for by sovereign borrowing (15 percent of GDP in 2012), foreign borrowing by the BOM (7 percent of GDP over the past 2 years) and the US$-value of GDP being 7 percent lower than projected in the previous DSA.
The 18 percentage points of GDP projected decline in the face value of public external debt over the next five years is substantially larger than the 5½ percentage points of GDP decline projected in the previous DSA. This reflects the assumption in the strong policy scenario that underlies this DSA that foreign borrowing will be reduced considerably in view of the sharp rise in Mongolia’s external debt in the past two years and the less benign outlook for frontier emerging market economies’ access to international capital markets.
3. Compared to the previous DSA, the main features of the current macroeconomic framework can be summarized as follows:
3 Consistent with the Staff Guidance Note, public external debt in this DSA includes government loans from bilateral and multilateral creditors, sovereign bonds, bonds issued by the Development Bank, and foreign borrowing by the central bank of Mongolia (BOM).
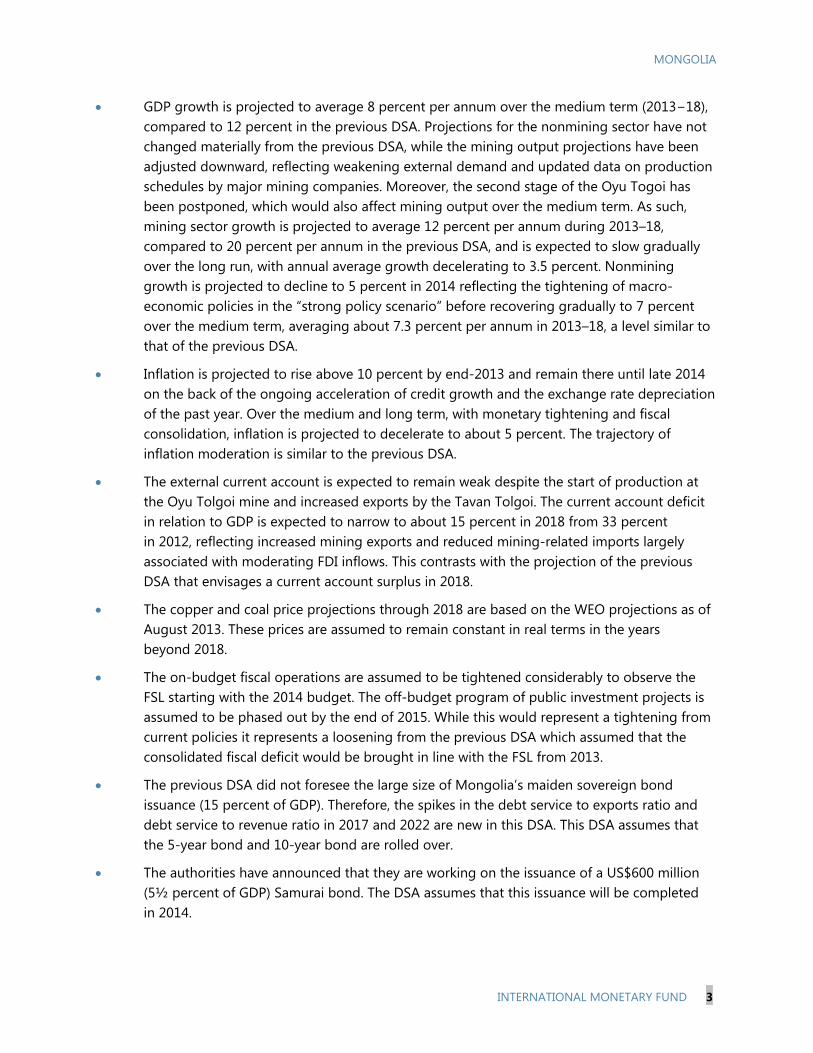
MONGOLIA
INTERNATIONAL MONETARY FUND 3
GDP growth is projected to average 8 percent per annum over the medium term (2013−18), compared to 12 percent in the previous DSA. Projections for the nonmining sector have not changed materially from the previous DSA, while the mining output projections have been adjusted downward, reflecting weakening external demand and updated data on production schedules by major mining companies. Moreover, the second stage of the Oyu Togoi has been postponed, which would also affect mining output over the medium term. As such, mining sector growth is projected to average 12 percent per annum during 2013–18, compared to 20 percent per annum in the previous DSA, and is expected to slow gradually over the long run, with annual average growth decelerating to 3.5 percent. Nonmining growth is projected to decline to 5 percent in 2014 reflecting the tightening of macro-economic policies in the “strong policy scenario” before recovering gradually to 7 percent over the medium term, averaging about 7.3 percent per annum in 2013–18, a level similar to that of the previous DSA.
Inflation is projected to rise above 10 percent by end-2013 and remain there until late 2014 on the back of the ongoing acceleration of credit growth and the exchange rate depreciation of the past year. Over the medium and long term, with monetary tightening and fiscal consolidation, inflation is projected to decelerate to about 5 percent. The trajectory of inflation moderation is similar to the previous DSA.
The external current account is expected to remain weak despite the start of production at the Oyu Tolgoi mine and increased exports by the Tavan Tolgoi. The current account deficit in relation to GDP is expected to narrow to about 15 percent in 2018 from 33 percent in 2012, reflecting increased mining exports and reduced mining-related imports largely associated with moderating FDI inflows. This contrasts with the projection of the previous DSA that envisages a current account surplus in 2018.
The copper and coal price projections through 2018 are based on the WEO projections as of August 2013. These prices are assumed to remain constant in real terms in the years beyond 2018.
The on-budget fiscal operations are assumed to be tightened considerably to observe the FSL starting with the 2014 budget. The off-budget program of public investment projects is assumed to be phased out by the end of 2015. While this would represent a tightening from current policies it represents a loosening from the previous DSA which assumed that the consolidated fiscal deficit would be brought in line with the FSL from 2013.
The previous DSA did not foresee the large size of Mongolia’s maiden sovereign bond issuance (15 percent of GDP). Therefore, the spikes in the debt service to exports ratio and debt service to revenue ratio in 2017 and 2022 are new in this DSA. This DSA assumes that the 5-year bond and 10-year bond are rolled over.
The authorities have announced that they are working on the issuance of a US$600 million (5½ percent of GDP) Samurai bond. The DSA assumes that this issuance will be completed in 2014.
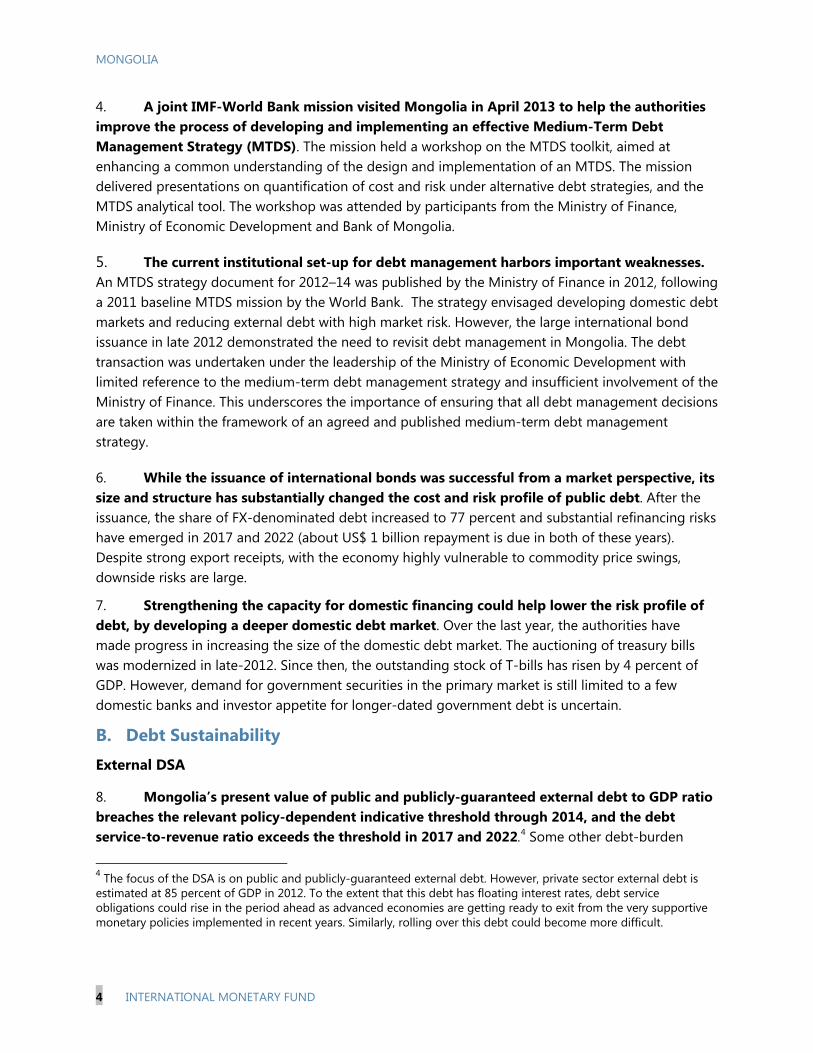
MONGOLIA
4 INTERNATIONAL MONETARY FUND
4. A joint IMF-World Bank mission visited Mongolia in April 2013 to help the authorities improve the process of developing and implementing an effective Medium-Term Debt Management Strategy (MTDS). The mission held a workshop on the MTDS toolkit, aimed at enhancing a common understanding of the design and implementation of an MTDS. The mission delivered presentations on quantification of cost and risk under alternative debt strategies, and the MTDS analytical tool. The workshop was attended by participants from the Ministry of Finance, Ministry of Economic Development and Bank of Mongolia.
5. The current institutional set-up for debt management harbors important weaknesses. An MTDS strategy document for 2012–14 was published by the Ministry of Finance in 2012, following a 2011 baseline MTDS mission by the World Bank. The strategy envisaged developing domestic debt markets and reducing external debt with high market risk. However, the large international bond issuance in late 2012 demonstrated the need to revisit debt management in Mongolia. The debt transaction was undertaken under the leadership of the Ministry of Economic Development with limited reference to the medium-term debt management strategy and insufficient involvement of the Ministry of Finance. This underscores the importance of ensuring that all debt management decisions are taken within the framework of an agreed and published medium-term debt management strategy.
6. While the issuance of international bonds was successful from a market perspective, its size and structure has substantially changed the cost and risk profile of public debt. After the issuance, the share of FX-denominated debt increased to 77 percent and substantial refinancing risks have emerged in 2017 and 2022 (about US$ 1 billion repayment is due in both of these years). Despite strong export receipts, with the economy highly vulnerable to commodity price swings, downside risks are large.
7. Strengthening the capacity for domestic financing could help lower the risk profile of debt, by developing a deeper domestic debt market. Over the last year, the authorities have made progress in increasing the size of the domestic debt market. The auctioning of treasury bills was modernized in late-2012. Since then, the outstanding stock of T-bills has risen by 4 percent of GDP. However, demand for government securities in the primary market is still limited to a few domestic banks and investor appetite for longer-dated government debt is uncertain.
B. Debt Sustainability
External DSA
8. Mongolia’s present value of public and publicly-guaranteed external debt to GDP ratio breaches the relevant policy-dependent indicative threshold through 2014, and the debt service-to-revenue ratio exceeds the threshold in 2017 and 2022.4 Some other debt-burden
4 The focus of the DSA is on public and publicly-guaranteed external debt. However, private sector external debt is estimated at 85 percent of GDP in 2012. To the extent that this debt has floating interest rates, debt service obligations could rise in the period ahead as advanced economies are getting ready to exit from the very supportive monetary policies implemented in recent years. Similarly, rolling over this debt could become more difficult.
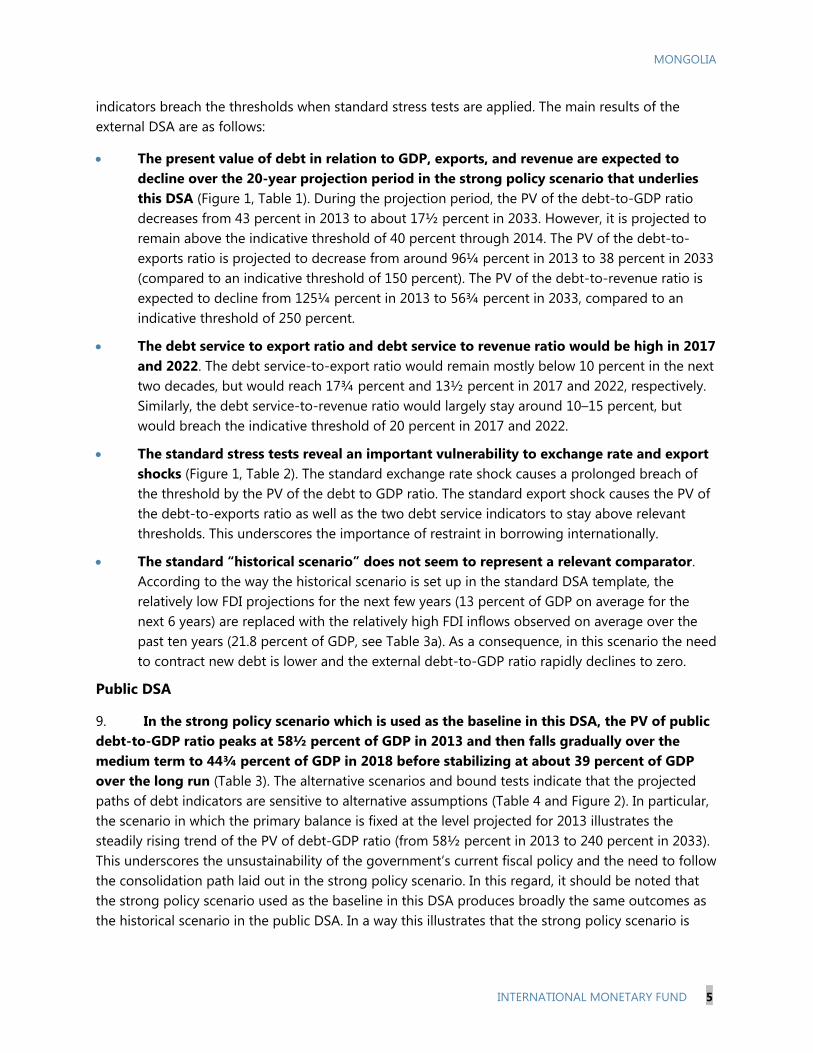
MONGOLIA
INTERNATIONAL MONETARY FUND 5
indicators breach the thresholds when standard stress tests are applied. The main results of the external DSA are as follows:
The present value of debt in relation to GDP, exports, and revenue are expected to decline over the 20-year projection period in the strong policy scenario that underlies this DSA (Figure 1, Table 1). During the projection period, the PV of the debt-to-GDP ratio decreases from 43 percent in 2013 to about 17½ percent in 2033. However, it is projected to remain above the indicative threshold of 40 percent through 2014. The PV of the debt-to-exports ratio is projected to decrease from around 96¼ percent in 2013 to 38 percent in 2033 (compared to an indicative threshold of 150 percent). The PV of the debt-to-revenue ratio is expected to decline from 125¼ percent in 2013 to 56¾ percent in 2033, compared to an indicative threshold of 250 percent.
The debt service to export ratio and debt service to revenue ratio would be high in 2017 and 2022. The debt service-to-export ratio would remain mostly below 10 percent in the next two decades, but would reach 17¾ percent and 13½ percent in 2017 and 2022, respectively. Similarly, the debt service-to-revenue ratio would largely stay around 10–15 percent, but would breach the indicative threshold of 20 percent in 2017 and 2022.
The standard stress tests reveal an important vulnerability to exchange rate and export shocks (Figure 1, Table 2). The standard exchange rate shock causes a prolonged breach of the threshold by the PV of the debt to GDP ratio. The standard export shock causes the PV of the debt-to-exports ratio as well as the two debt service indicators to stay above relevant thresholds. This underscores the importance of restraint in borrowing internationally.
The standard “historical scenario” does not seem to represent a relevant comparator. According to the way the historical scenario is set up in the standard DSA template, the relatively low FDI projections for the next few years (13 percent of GDP on average for the next 6 years) are replaced with the relatively high FDI inflows observed on average over the past ten years (21.8 percent of GDP, see Table 3a). As a consequence, in this scenario the need to contract new debt is lower and the external debt-to-GDP ratio rapidly declines to zero.
Public DSA
9. In the strong policy scenario which is used as the baseline in this DSA, the PV of public debt-to-GDP ratio peaks at 58½ percent of GDP in 2013 and then falls gradually over the medium term to 44¾ percent of GDP in 2018 before stabilizing at about 39 percent of GDP over the long run (Table 3). The alternative scenarios and bound tests indicate that the projected paths of debt indicators are sensitive to alternative assumptions (Table 4 and Figure 2). In particular, the scenario in which the primary balance is fixed at the level projected for 2013 illustrates the steadily rising trend of the PV of debt-GDP ratio (from 58½ percent in 2013 to 240 percent in 2033). This underscores the unsustainability of the government’s current fiscal policy and the need to follow the consolidation path laid out in the strong policy scenario. In this regard, it should be noted that the strong policy scenario used as the baseline in this DSA produces broadly the same outcomes as the historical scenario in the public DSA. In a way this illustrates that the strong policy scenario is
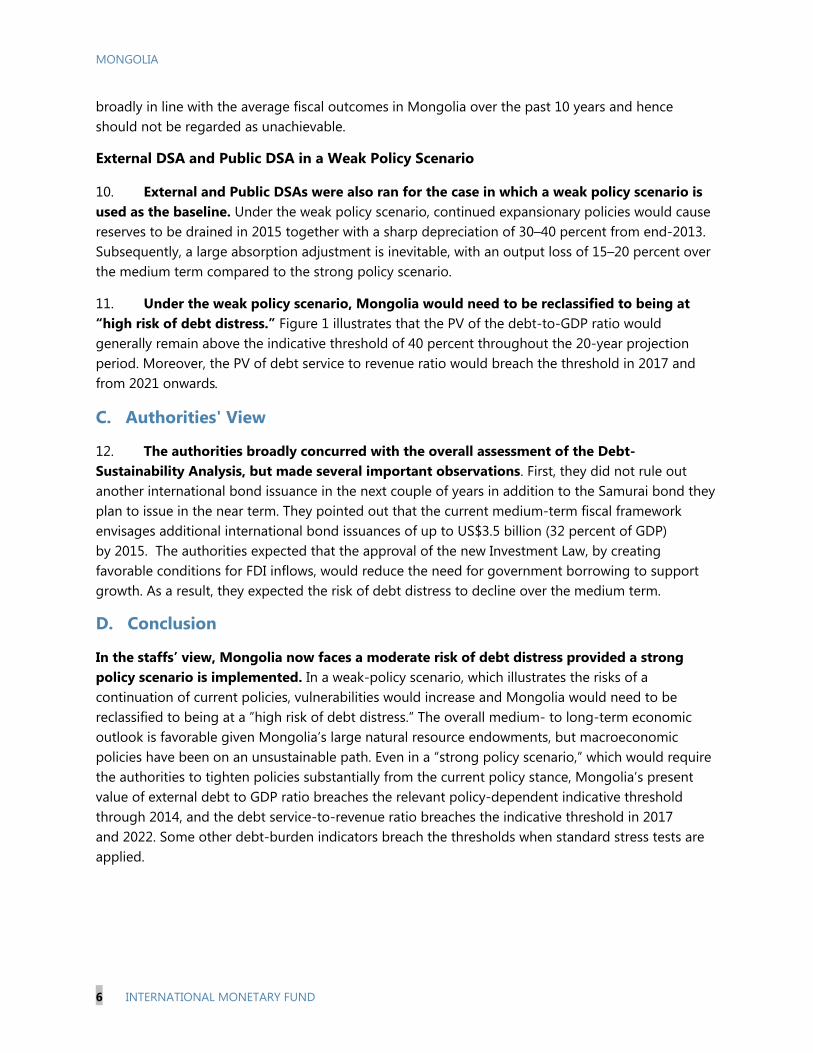
MONGOLIA
6 INTERNATIONAL MONETARY FUND
broadly in line with the average fiscal outcomes in Mongolia over the past 10 years and hence should not be regarded as unachievable.
External DSA and Public DSA in a Weak Policy Scenario
10. External and Public DSAs were also ran for the case in which a weak policy scenario is used as the baseline. Under the weak policy scenario, continued expansionary policies would cause reserves to be drained in 2015 together with a sharp depreciation of 30–40 percent from end-2013. Subsequently, a large absorption adjustment is inevitable, with an output loss of 15–20 percent over the medium term compared to the strong policy scenario.
11. Under the weak policy scenario, Mongolia would need to be reclassified to being at “high risk of debt distress.” Figure 1 illustrates that the PV of the debt-to-GDP ratio would generally remain above the indicative threshold of 40 percent throughout the 20-year projection period. Moreover, the PV of debt service to revenue ratio would breach the threshold in 2017 and from 2021 onwards.
C. Authorities' View
12. The authorities broadly concurred with the overall assessment of the Debt-Sustainability Analysis, but made several important observations. First, they did not rule out another international bond issuance in the next couple of years in addition to the Samurai bond they plan to issue in the near term. They pointed out that the current medium-term fiscal framework envisages additional international bond issuances of up to US$3.5 billion (32 percent of GDP) by 2015. The authorities expected that the approval of the new Investment Law, by creating favorable conditions for FDI inflows, would reduce the need for government borrowing to support growth. As a result, they expected the risk of debt distress to decline over the medium term.
D. Conclusion
In the staffs’ view, Mongolia now faces a moderate risk of debt distress provided a strong policy scenario is implemented. In a weak-policy scenario, which illustrates the risks of a continuation of current policies, vulnerabilities would increase and Mongolia would need to be reclassified to being at a ”high risk of debt distress.” The overall medium- to long-term economic outlook is favorable given Mongolia’s large natural resource endowments, but macroeconomic policies have been on an unsustainable path. Even in a “strong policy scenario,” which would require the authorities to tighten policies substantially from the current policy stance, Mongolia’s present value of external debt to GDP ratio breaches the relevant policy-dependent indicative threshold through 2014, and the debt service-to-revenue ratio breaches the indicative threshold in 2017 and 2022. Some other debt-burden indicators breach the thresholds when standard stress tests are applied.
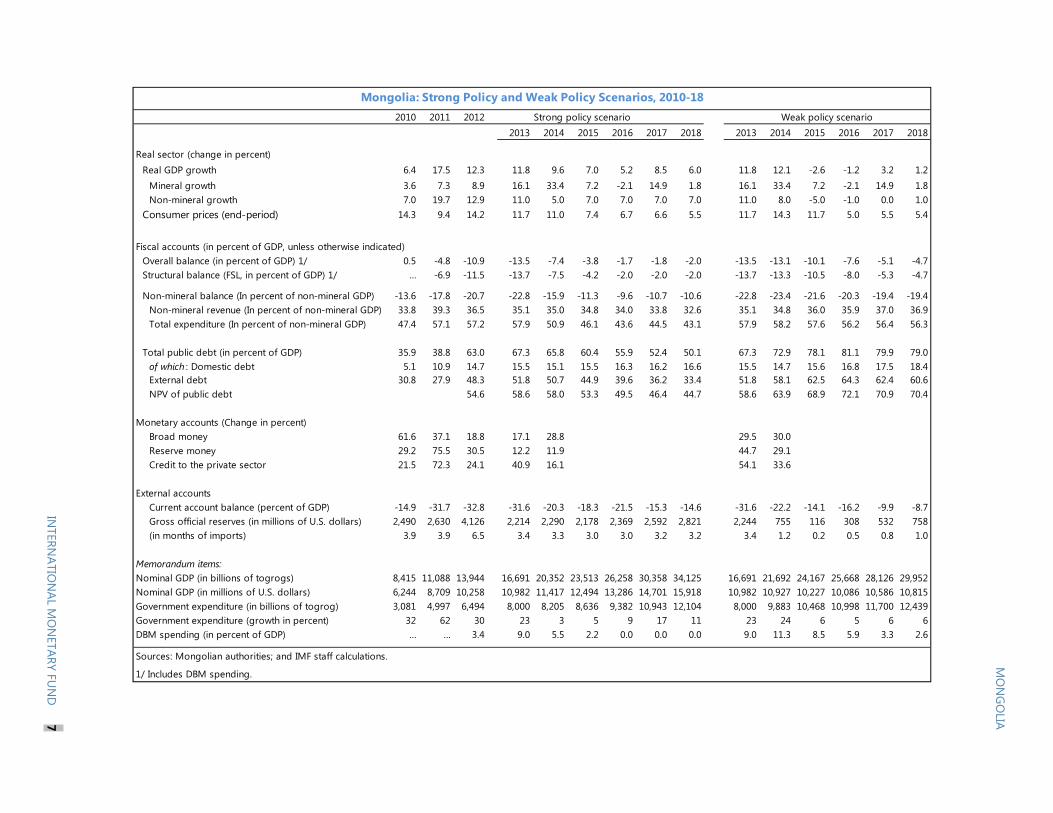
2010 2011 2012 Strong policy scenario2013 2014 2015 2016 2017 2018 2013 2014 2015 2016 2017 2018
Real sector (change in percent)Real GDP growth 6.4 17.5 12.3 11.8 9.6 7.0 5.2 8.5 6.0 11.8 12.1 -2.6 -1.2 3.2 1.2
Mineral growth 3.6 7.3 8.9 16.1 33.4 7.2 -2.1 14.9 1.8 16.1 33.4 7.2 -2.1 14.9 1.8Non-mineral growth 7.0 19.7 12.9 11.0 5.0 7.0 7.0 7.0 7.0 11.0 8.0 -5.0 -1.0 0.0 1.0
Consumer prices (end-period) 14.3 9.4 14.2 11.7 11.0 7.4 6.7 6.6 5.5 11.7 14.3 11.7 5.0 5.5 5.4
Fiscal accounts (in percent of GDP, unless otherwise indicated)Overall balance (in percent of GDP) 1/ 0.5 -4.8 -10.9 -13.5 -7.4 -3.8 -1.7 -1.8 -2.0 -13.5 -13.1 -10.1 -7.6 -5.1 -4.7Structural balance (FSL, in percent of GDP) 1/ … -6.9 -11.5 -13.7 -7.5 -4.2 -2.0 -2.0 -2.0 -13.7 -13.3 -10.5 -8.0 -5.3 -4.7
Non-mineral balance (In percent of non-mineral GDP) -13.6 -17.8 -20.7 -22.8 -15.9 -11.3 -9.6 -10.7 -10.6 -22.8 -23.4 -21.6 -20.3 -19.4 -19.4Non-mineral revenue (In percent of non-mineral GDP) 33.8 39.3 36.5 35.1 35.0 34.8 34.0 33.8 32.6 35.1 34.8 36.0 35.9 37.0 36.9Total expenditure (In percent of non-mineral GDP) 47.4 57.1 57.2 57.9 50.9 46.1 43.6 44.5 43.1 57.9 58.2 57.6 56.2 56.4 56.3
Total public debt (in percent of GDP) 35.9 38.8 63.0 67.3 65.8 60.4 55.9 52.4 50.1 67.3 72.9 78.1 81.1 79.9 79.0of which : Domestic debt 5.1 10.9 14.7 15.5 15.1 15.5 16.3 16.2 16.6 15.5 14.7 15.6 16.8 17.5 18.4External debt 30.8 27.9 48.3 51.8 50.7 44.9 39.6 36.2 33.4 51.8 58.1 62.5 64.3 62.4 60.6NPV of public debt 54.6 58.6 58.0 53.3 49.5 46.4 44.7 58.6 63.9 68.9 72.1 70.9 70.4
Monetary accounts (Change in percent)Broad money 61.6 37.1 18.8 17.1 28.8 29.5 30.0Reserve money 29.2 75.5 30.5 12.2 11.9 44.7 29.1Credit to the private sector 21.5 72.3 24.1 40.9 16.1 54.1 33.6
External accountsCurrent account balance (percent of GDP) -14.9 -31.7 -32.8 -31.6 -20.3 -18.3 -21.5 -15.3 -14.6 -31.6 -22.2 -14.1 -16.2 -9.9 -8.7Gross official reserves (in millions of U.S. dollars) 2,490 2,630 4,126 2,214 2,290 2,178 2,369 2,592 2,821 2,244 755 116 308 532 758(in months of imports) 3.9 3.9 6.5 3.4 3.3 3.0 3.0 3.2 3.2 3.4 1.2 0.2 0.5 0.8 1.0
Memorandum items:Nominal GDP (in billions of togrogs) 8,415 11,088 13,944 16,691 20,352 23,513 26,258 30,358 34,125 16,691 21,692 24,167 25,668 28,126 29,952Nominal GDP (in millions of U.S. dollars) 6,244 8,709 10,258 10,982 11,417 12,494 13,286 14,701 15,918 10,982 10,927 10,227 10,086 10,586 10,815Government expenditure (in billions of togrog) 3,081 4,997 6,494 8,000 8,205 8,636 9,382 10,943 12,104 8,000 9,883 10,468 10,998 11,700 12,439Government expenditure (growth in percent) 32 62 30 23 3 5 9 17 11 23 24 6 5 6 6DBM spending (in percent of GDP) … … 3.4 9.0 5.5 2.2 0.0 0.0 0.0 9.0 11.3 8.5 5.9 3.3 2.6
Sources: Mongolian authorities; and IMF staff calculations.
1/ Includes DBM spending.
Mongolia: Strong Policy and Weak Policy Scenarios, 2010-18Weak policy scenario
MO
NG
OLIA
INTERN
ATION
AL MO
NETARY FU
ND
7
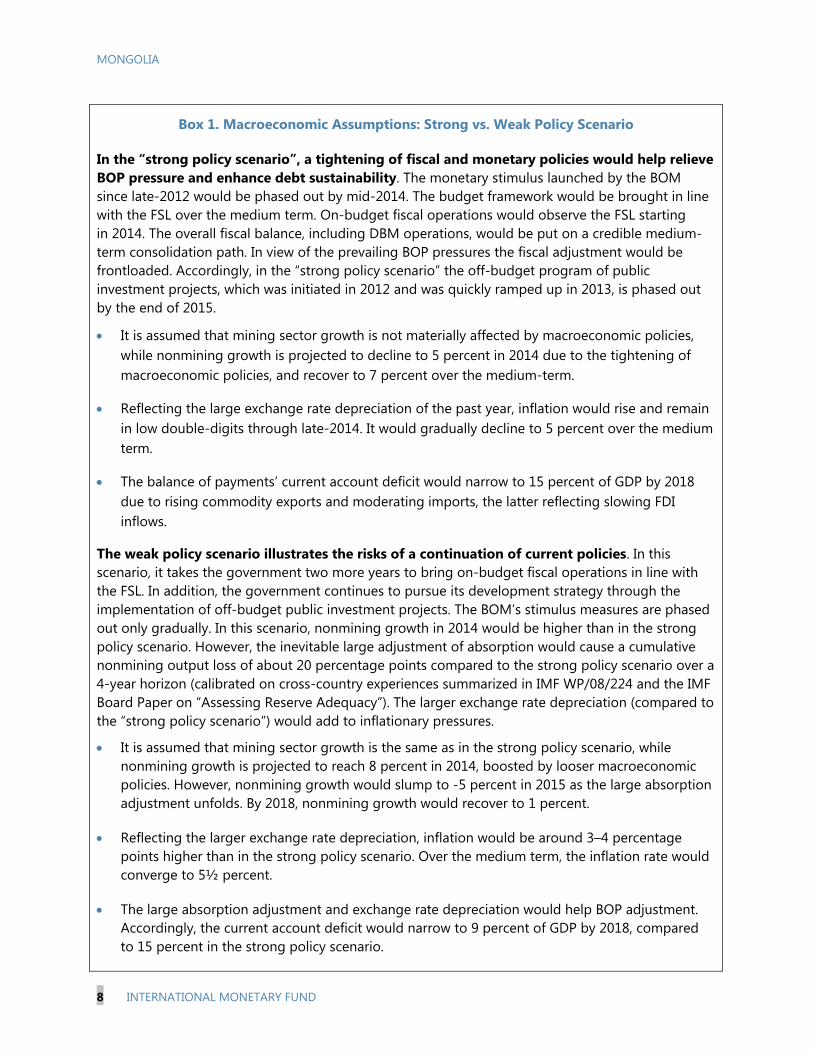
MONGOLIA
8 INTERNATIONAL MONETARY FUND
Box 1. Macroeconomic Assumptions: Strong vs. Weak Policy Scenario
In the “strong policy scenario”, a tightening of fiscal and monetary policies would help relieve BOP pressure and enhance debt sustainability. The monetary stimulus launched by the BOM since late-2012 would be phased out by mid-2014. The budget framework would be brought in line with the FSL over the medium term. On-budget fiscal operations would observe the FSL starting in 2014. The overall fiscal balance, including DBM operations, would be put on a credible medium-term consolidation path. In view of the prevailing BOP pressures the fiscal adjustment would be frontloaded. Accordingly, in the “strong policy scenario” the off-budget program of public investment projects, which was initiated in 2012 and was quickly ramped up in 2013, is phased out by the end of 2015.
It is assumed that mining sector growth is not materially affected by macroeconomic policies, while nonmining growth is projected to decline to 5 percent in 2014 due to the tightening of macroeconomic policies, and recover to 7 percent over the medium-term.
Reflecting the large exchange rate depreciation of the past year, inflation would rise and remain in low double-digits through late-2014. It would gradually decline to 5 percent over the medium term.
The balance of payments’ current account deficit would narrow to 15 percent of GDP by 2018 due to rising commodity exports and moderating imports, the latter reflecting slowing FDI inflows.
The weak policy scenario illustrates the risks of a continuation of current policies. In this scenario, it takes the government two more years to bring on-budget fiscal operations in line with the FSL. In addition, the government continues to pursue its development strategy through the implementation of off-budget public investment projects. The BOM’s stimulus measures are phased out only gradually. In this scenario, nonmining growth in 2014 would be higher than in the strong policy scenario. However, the inevitable large adjustment of absorption would cause a cumulative nonmining output loss of about 20 percentage points compared to the strong policy scenario over a 4-year horizon (calibrated on cross-country experiences summarized in IMF WP/08/224 and the IMF Board Paper on “Assessing Reserve Adequacy”). The larger exchange rate depreciation (compared to the “strong policy scenario”) would add to inflationary pressures.
It is assumed that mining sector growth is the same as in the strong policy scenario, while nonmining growth is projected to reach 8 percent in 2014, boosted by looser macroeconomic policies. However, nonmining growth would slump to -5 percent in 2015 as the large absorption adjustment unfolds. By 2018, nonmining growth would recover to 1 percent.
Reflecting the larger exchange rate depreciation, inflation would be around 3–4 percentage points higher than in the strong policy scenario. Over the medium term, the inflation rate would converge to 5½ percent.
The large absorption adjustment and exchange rate depreciation would help BOP adjustment. Accordingly, the current account deficit would narrow to 9 percent of GDP by 2018, compared to 15 percent in the strong policy scenario.
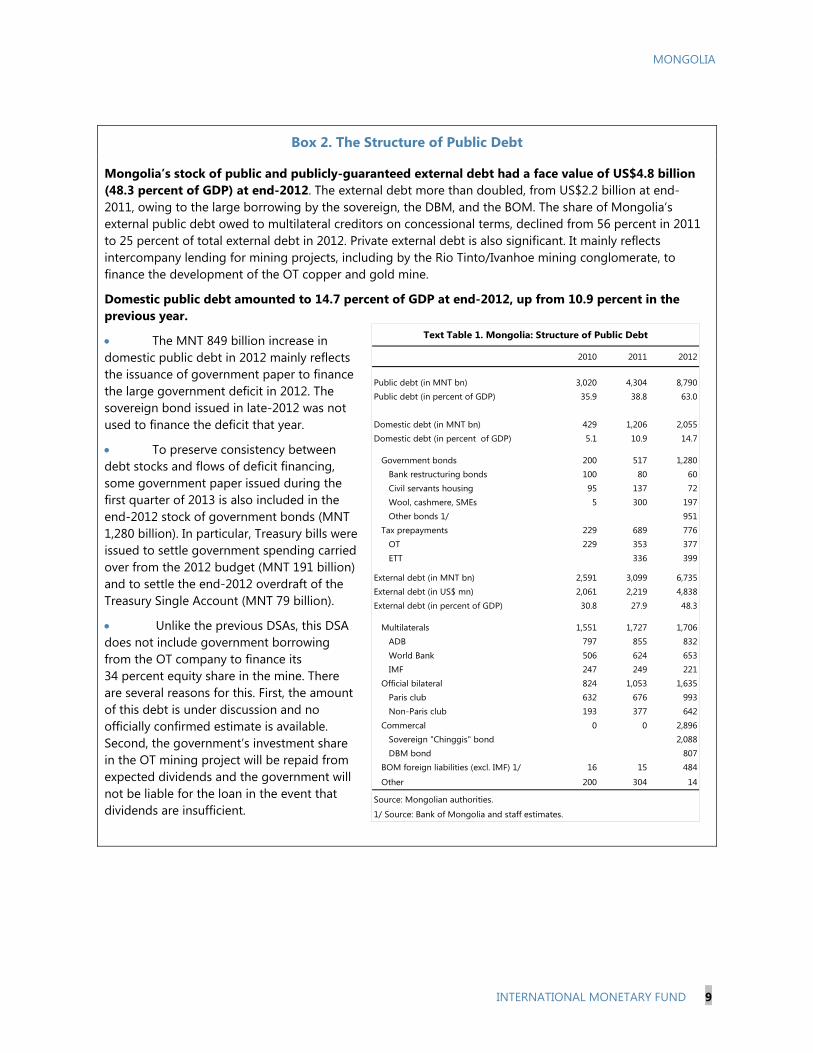
MONGOLIA
INTERNATIONAL MONETARY FUND 9
2010 2011 2012
Public debt (in MNT bn) 3,020 4,304 8,790Public debt (in percent of GDP) 35.9 38.8 63.0
Domestic debt (in MNT bn) 429 1,206 2,055Domestic debt (in percent of GDP) 5.1 10.9 14.7
Government bonds 200 517 1,280Bank restructuring bonds 100 80 60Civil servants housing 95 137 72Wool, cashmere, SMEs 5 300 197Other bonds 1/ 951
Tax prepayments 229 689 776OT 229 353 377ETT 336 399
External debt (in MNT bn) 2,591 3,099 6,735External debt (in US$ mn) 2,061 2,219 4,838External debt (in percent of GDP) 30.8 27.9 48.3
Multilaterals 1,551 1,727 1,706ADB 797 855 832World Bank 506 624 653IMF 247 249 221
Official bilateral 824 1,053 1,635Paris club 632 676 993Non-Paris club 193 377 642
Commercal 0 0 2,896Sovereign "Chinggis" bond 2,088DBM bond 807
BOM foreign liabilities (excl. IMF) 1/ 16 15 484
Other 200 304 14
Source: Mongolian authorities.
1/ Source: Bank of Mongolia and staff estimates.
Text Table 1. Mongolia: Structure of Public Debt
Box 2. The Structure of Public Debt
Mongolia’s stock of public and publicly-guaranteed external debt had a face value of US$4.8 billion (48.3 percent of GDP) at end-2012. The external debt more than doubled, from US$2.2 billion at end-2011, owing to the large borrowing by the sovereign, the DBM, and the BOM. The share of Mongolia’s external public debt owed to multilateral creditors on concessional terms, declined from 56 percent in 2011 to 25 percent of total external debt in 2012. Private external debt is also significant. It mainly reflects intercompany lending for mining projects, including by the Rio Tinto/Ivanhoe mining conglomerate, to finance the development of the OT copper and gold mine.
Domestic public debt amounted to 14.7 percent of GDP at end-2012, up from 10.9 percent in the previous year.
The MNT 849 billion increase in domestic public debt in 2012 mainly reflects the issuance of government paper to finance the large government deficit in 2012. The sovereign bond issued in late-2012 was not used to finance the deficit that year.
To preserve consistency between debt stocks and flows of deficit financing, some government paper issued during the first quarter of 2013 is also included in the end-2012 stock of government bonds (MNT 1,280 billion). In particular, Treasury bills were issued to settle government spending carried over from the 2012 budget (MNT 191 billion) and to settle the end-2012 overdraft of the Treasury Single Account (MNT 79 billion).
Unlike the previous DSAs, this DSA does not include government borrowing from the OT company to finance its 34 percent equity share in the mine. There are several reasons for this. First, the amount of this debt is under discussion and no officially confirmed estimate is available. Second, the government’s investment share in the OT mining project will be repaid from expected dividends and the government will not be liable for the loan in the event that dividends are insufficient.
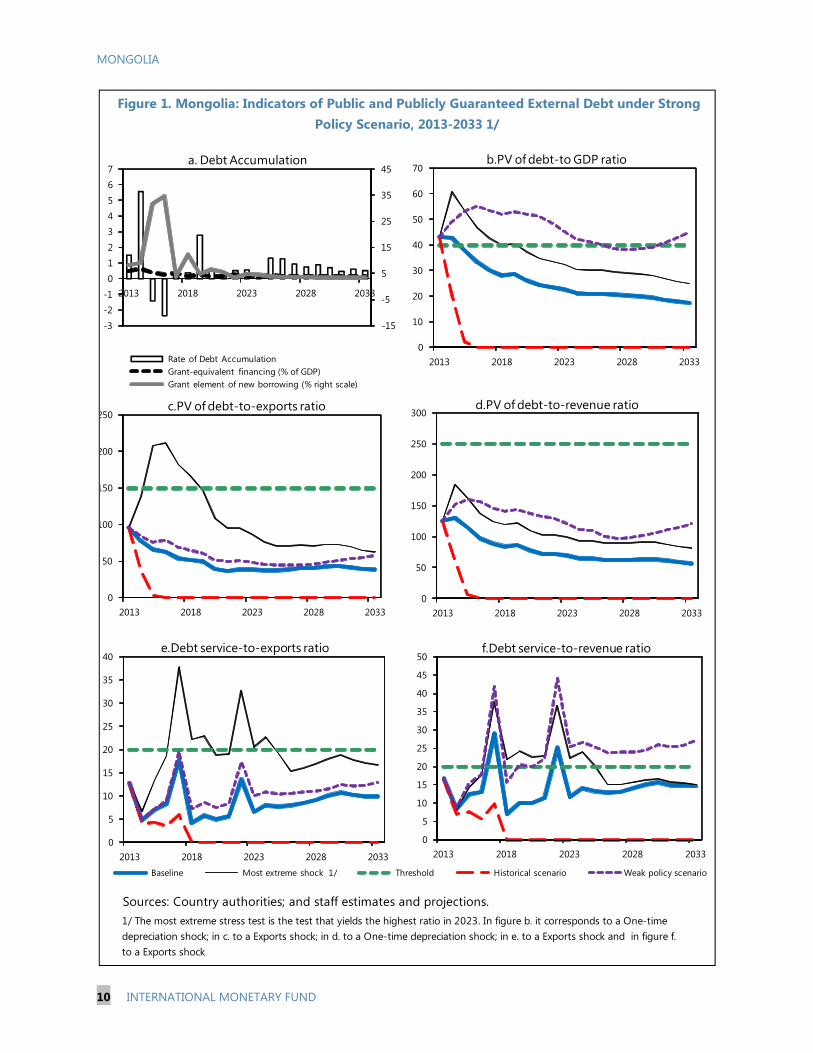
MONGOLIA
10 INTERNATIONAL MONETARY FUND
Sources: Country authorities; and staff estimates and projections.
Figure 1. Mongolia: Indicators of Public and Publicly Guaranteed External Debt under Strong Policy Scenario, 2013-2033 1/
1/ The most extreme stress test is the test that yields the highest ratio in 2023. In figure b. it corresponds to a One-time depreciation shock; in c. to a Exports shock; in d. to a One-time depreciation shock; in e. to a Exports shock and in figure f. to a Exports shock
0
5
10
15
20
25
30
35
40
45
50
2013 2018 2023 2028 2033
Baseline Most extreme shock 1/ Threshold Historical scenario Weak policy scenario
f.Debt service-to-revenue ratio
-15
-5
5
15
25
35
45
-3
-2
-1
0
1
2
3
4
5
6
7
2013 2018 2023 2028 2033
Rate of Debt Accumulation Grant-equivalent financing (% of GDP) Grant element of new borrowing (% right scale)
a. Debt Accumulation
0
10
20
30
40
50
60
70
2013 2018 2023 2028 2033
b.PV of debt-to GDP ratio
0
50
100
150
200
250
2013 2018 2023 2028 2033
c.PV of debt-to-exports ratio
0
50
100
150
200
250
300
2013 2018 2023 2028 2033
d.PV of debt-to-revenue ratio
0
5
10
15
20
25
30
35
40
2013 2018 2023 2028 2033
e.Debt service-to-exports ratio
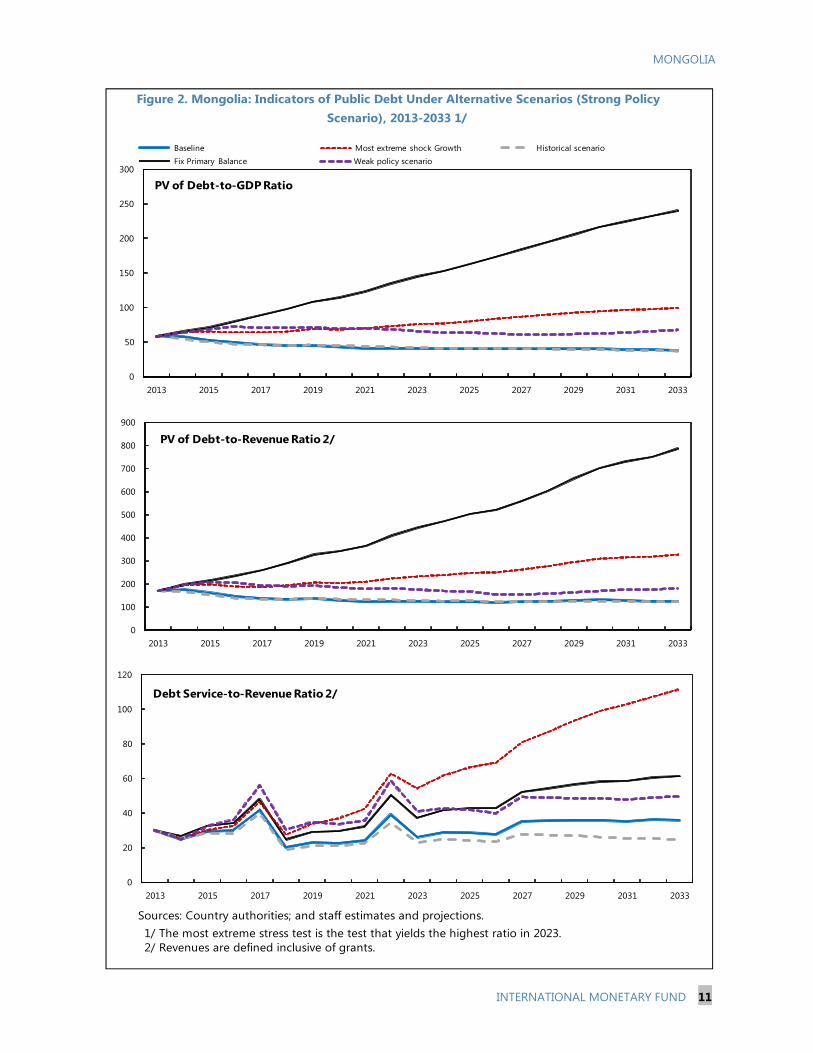
MONGOLIA
INTERNATIONAL MONETARY FUND 11
Sources: Country authorities; and staff estimates and projections.1/ The most extreme stress test is the test that yields the highest ratio in 2023. 2/ Revenues are defined inclusive of grants.
Figure 2. Mongolia: Indicators of Public Debt Under Alternative Scenarios (Strong Policy Scenario), 2013-2033 1/
0
100
200
300
400
500
600
700
800
900
2013 2015 2017 2019 2021 2023 2025 2027 2029 2031 2033
PV of Debt-to-Revenue Ratio 2/
0
50
100
150
200
250
300
2013 2015 2017 2019 2021 2023 2025 2027 2029 2031 2033
Baseline Most extreme shock Growth Historical scenario Fix Primary Balance Weak policy scenario
PV of Debt-to-GDP Ratio
0
20
40
60
80
100
120
2013 2015 2017 2019 2021 2023 2025 2027 2029 2031 2033
Debt Service-to-Revenue Ratio 2/
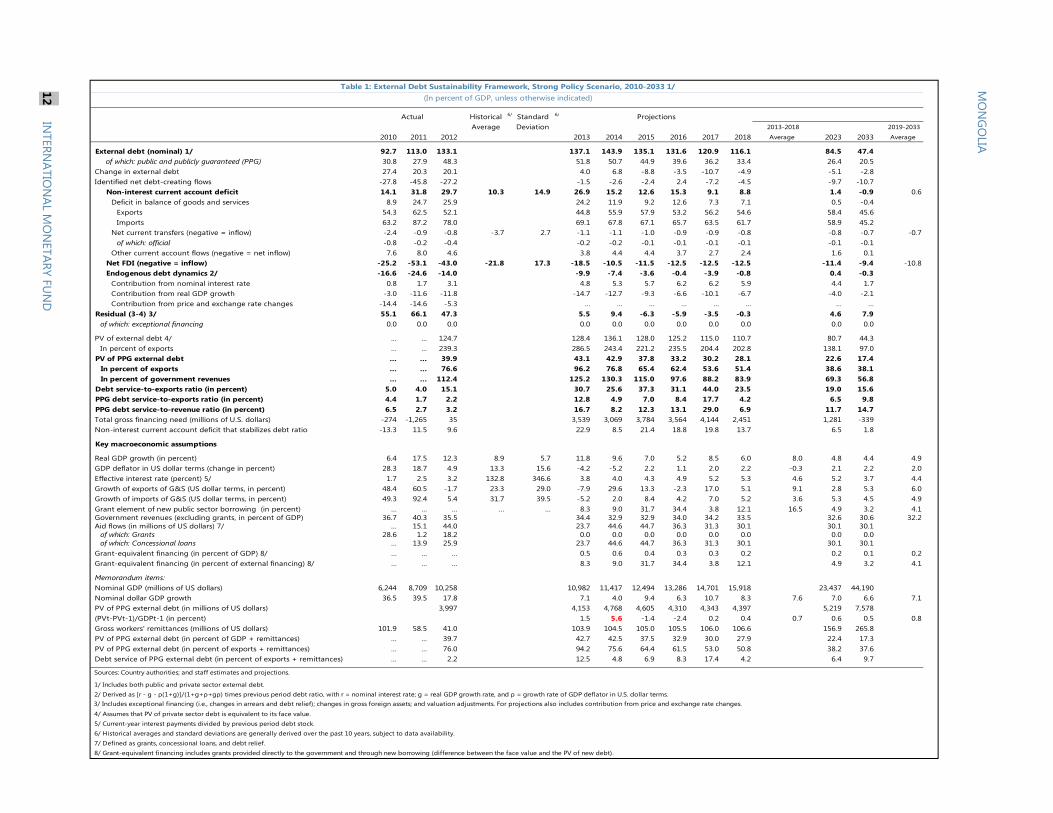
Historical 6/ Standard 6/
Average Deviation 2013-2018 2019-2033
2010 2011 2012 2013 2014 2015 2016 2017 2018 Average 2023 2033 Average
External debt (nominal) 1/ 92.7 113.0 133.1 137.1 143.9 135.1 131.6 120.9 116.1 84.5 47.4of which: public and publicly guaranteed (PPG) 30.8 27.9 48.3 51.8 50.7 44.9 39.6 36.2 33.4 26.4 20.5
Change in external debt 27.4 20.3 20.1 4.0 6.8 -8.8 -3.5 -10.7 -4.9 -5.1 -2.8Identified net debt-creating flows -27.8 -45.8 -27.2 -1.5 -2.6 -2.4 2.4 -7.2 -4.5 -9.7 -10.7
Non-interest current account deficit 14.1 31.8 29.7 10.3 14.9 26.9 15.2 12.6 15.3 9.1 8.8 1.4 -0.9 0.6Deficit in balance of goods and services 8.9 24.7 25.9 24.2 11.9 9.2 12.6 7.3 7.1 0.5 -0.4
Exports 54.3 62.5 52.1 44.8 55.9 57.9 53.2 56.2 54.6 58.4 45.6Imports 63.2 87.2 78.0 69.1 67.8 67.1 65.7 63.5 61.7 58.9 45.2
Net current transfers (negative = inflow) -2.4 -0.9 -0.8 -3.7 2.7 -1.1 -1.1 -1.0 -0.9 -0.9 -0.8 -0.8 -0.7 -0.7of which: official -0.8 -0.2 -0.4 -0.2 -0.2 -0.1 -0.1 -0.1 -0.1 -0.1 -0.1
Other current account flows (negative = net inflow) 7.6 8.0 4.6 3.8 4.4 4.4 3.7 2.7 2.4 1.6 0.1Net FDI (negative = inflow) -25.2 -53.1 -43.0 -21.8 17.3 -18.5 -10.5 -11.5 -12.5 -12.5 -12.5 -11.4 -9.4 -10.8Endogenous debt dynamics 2/ -16.6 -24.6 -14.0 -9.9 -7.4 -3.6 -0.4 -3.9 -0.8 0.4 -0.3
Contribution from nominal interest rate 0.8 1.7 3.1 4.8 5.3 5.7 6.2 6.2 5.9 4.4 1.7Contribution from real GDP growth -3.0 -11.6 -11.8 -14.7 -12.7 -9.3 -6.6 -10.1 -6.7 -4.0 -2.1Contribution from price and exchange rate changes -14.4 -14.6 -5.3 … … … … … … … …
Residual (3-4) 3/ 55.1 66.1 47.3 5.5 9.4 -6.3 -5.9 -3.5 -0.3 4.6 7.9of which: exceptional financing 0.0 0.0 0.0 0.0 0.0 0.0 0.0 0.0 0.0 0.0 0.0
PV of external debt 4/ ... ... 124.7 128.4 136.1 128.0 125.2 115.0 110.7 80.7 44.3In percent of exports ... ... 239.3 286.5 243.4 221.2 235.5 204.4 202.8 138.1 97.0
PV of PPG external debt ... ... 39.9 43.1 42.9 37.8 33.2 30.2 28.1 22.6 17.4In percent of exports ... ... 76.6 96.2 76.8 65.4 62.4 53.6 51.4 38.6 38.1In percent of government revenues ... ... 112.4 125.2 130.3 115.0 97.6 88.2 83.9 69.3 56.8
Debt service-to-exports ratio (in percent) 5.0 4.0 15.1 30.7 25.6 37.3 31.1 44.0 23.5 19.0 15.6PPG debt service-to-exports ratio (in percent) 4.4 1.7 2.2 12.8 4.9 7.0 8.4 17.7 4.2 6.5 9.8PPG debt service-to-revenue ratio (in percent) 6.5 2.7 3.2 16.7 8.2 12.3 13.1 29.0 6.9 11.7 14.7Total gross financing need (millions of U.S. dollars) -274 -1,265 35 3,539 3,069 3,784 3,564 4,144 2,451 1,281 -339Non-interest current account deficit that stabilizes debt ratio -13.3 11.5 9.6 22.9 8.5 21.4 18.8 19.8 13.7 6.5 1.8
Key macroeconomic assumptions
Real GDP growth (in percent) 6.4 17.5 12.3 8.9 5.7 11.8 9.6 7.0 5.2 8.5 6.0 8.0 4.8 4.4 4.9GDP deflator in US dollar terms (change in percent) 28.3 18.7 4.9 13.3 15.6 -4.2 -5.2 2.2 1.1 2.0 2.2 -0.3 2.1 2.2 2.0Effective interest rate (percent) 5/ 1.7 2.5 3.2 132.8 346.6 3.8 4.0 4.3 4.9 5.2 5.3 4.6 5.2 3.7 4.4Growth of exports of G&S (US dollar terms, in percent) 48.4 60.5 -1.7 23.3 29.0 -7.9 29.6 13.3 -2.3 17.0 5.1 9.1 2.8 5.3 6.0Growth of imports of G&S (US dollar terms, in percent) 49.3 92.4 5.4 31.7 39.5 -5.2 2.0 8.4 4.2 7.0 5.2 3.6 5.3 4.5 4.9Grant element of new public sector borrowing (in percent) ... ... ... ... ... 8.3 9.0 31.7 34.4 3.8 12.1 16.5 4.9 3.2 4.1Government revenues (excluding grants, in percent of GDP) 36.7 40.3 35.5 34.4 32.9 32.9 34.0 34.2 33.5 32.6 30.6 32.2Aid flows (in millions of US dollars) 7/ ... 15.1 44.0 23.7 44.6 44.7 36.3 31.3 30.1 30.1 30.1
of which: Grants 28.6 1.2 18.2 0.0 0.0 0.0 0.0 0.0 0.0 0.0 0.0of which: Concessional loans ... 13.9 25.9 23.7 44.6 44.7 36.3 31.3 30.1 30.1 30.1
Grant-equivalent financing (in percent of GDP) 8/ ... ... ... 0.5 0.6 0.4 0.3 0.3 0.2 0.2 0.1 0.2Grant-equivalent financing (in percent of external financing) 8/ ... ... ... 8.3 9.0 31.7 34.4 3.8 12.1 4.9 3.2 4.1
Memorandum items:Nominal GDP (millions of US dollars) 6,244 8,709 10,258 10,982 11,417 12,494 13,286 14,701 15,918 23,437 44,190Nominal dollar GDP growth 36.5 39.5 17.8 7.1 4.0 9.4 6.3 10.7 8.3 7.6 7.0 6.6 7.1PV of PPG external debt (in millions of US dollars) 3,997 4,153 4,768 4,605 4,310 4,343 4,397 5,219 7,578(PVt-PVt-1)/GDPt-1 (in percent) 1.5 5.6 -1.4 -2.4 0.2 0.4 0.7 0.6 0.5 0.8Gross workers' remittances (millions of US dollars) 101.9 58.5 41.0 103.9 104.5 105.0 105.5 106.0 106.6 156.9 265.8PV of PPG external debt (in percent of GDP + remittances) ... ... 39.7 42.7 42.5 37.5 32.9 30.0 27.9 22.4 17.3PV of PPG external debt (in percent of exports + remittances) ... ... 76.0 94.2 75.6 64.4 61.5 53.0 50.8 38.2 37.6Debt service of PPG external debt (in percent of exports + remittances) ... ... 2.2 12.5 4.8 6.9 8.3 17.4 4.2 6.4 9.7
Sources: Country authorities; and staff estimates and projections.
1/ Includes both public and private sector external debt.2/ Derived as [r - g - ρ(1+g)]/(1+g+ρ+gρ) times previous period debt ratio, with r = nominal interest rate; g = real GDP growth rate, and ρ = growth rate of GDP deflator in U.S. dollar terms.
4/ Assumes that PV of private sector debt is equivalent to its face value.5/ Current-year interest payments divided by previous period debt stock. 6/ Historical averages and standard deviations are generally derived over the past 10 years, subject to data availability. 7/ Defined as grants, concessional loans, and debt relief.8/ Grant-equivalent financing includes grants provided directly to the government and through new borrowing (difference between the face value and the PV of new debt).
Actual
Table 1: External Debt Sustainability Framework, Strong Policy Scenario, 2010-2033 1/ (In percent of GDP, unless otherwise indicated)
Projections
3/ Includes exceptional financing (i.e., changes in arrears and debt relief); changes in gross foreign assets; and valuation adjustments. For projections also includes contribution from price and exchange rate changes.
MO
NG
OLIA
12 IN
TERNATIO
NAL M
ON
ETARY FUN
D
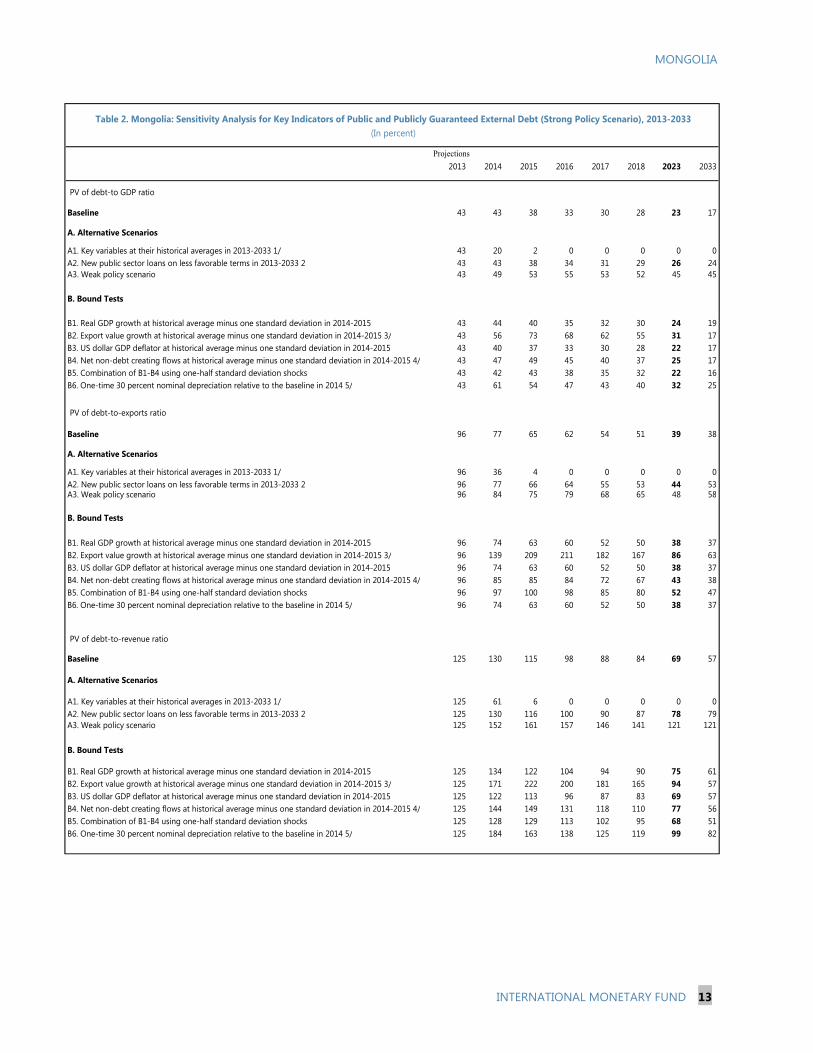
MONGOLIA
INTERNATIONAL MONETARY FUND 13
2013 2014 2015 2016 2017 2018 2023 2033
Baseline 43 43 38 33 30 28 23 17
A. Alternative Scenarios
A1. Key variables at their historical averages in 2013-2033 1/ 43 20 2 0 0 0 0 0A2. New public sector loans on less favorable terms in 2013-2033 2 43 43 38 34 31 29 26 24A3. Weak policy scenario 43 49 53 55 53 52 45 45
B. Bound Tests
B1. Real GDP growth at historical average minus one standard deviation in 2014-2015 43 44 40 35 32 30 24 19B2. Export value growth at historical average minus one standard deviation in 2014-2015 3/ 43 56 73 68 62 55 31 17B3. US dollar GDP deflator at historical average minus one standard deviation in 2014-2015 43 40 37 33 30 28 22 17B4. Net non-debt creating flows at historical average minus one standard deviation in 2014-2015 4/ 43 47 49 45 40 37 25 17B5. Combination of B1-B4 using one-half standard deviation shocks 43 42 43 38 35 32 22 16B6. One-time 30 percent nominal depreciation relative to the baseline in 2014 5/ 43 61 54 47 43 40 32 25
Baseline 96 77 65 62 54 51 39 38
A. Alternative Scenarios
A1. Key variables at their historical averages in 2013-2033 1/ 96 36 4 0 0 0 0 0A2. New public sector loans on less favorable terms in 2013-2033 2 96 77 66 64 55 53 44 53A3. Weak policy scenario 96 84 75 79 68 65 48 58
B. Bound Tests
B1. Real GDP growth at historical average minus one standard deviation in 2014-2015 96 74 63 60 52 50 38 37B2. Export value growth at historical average minus one standard deviation in 2014-2015 3/ 96 139 209 211 182 167 86 63B3. US dollar GDP deflator at historical average minus one standard deviation in 2014-2015 96 74 63 60 52 50 38 37B4. Net non-debt creating flows at historical average minus one standard deviation in 2014-2015 4/ 96 85 85 84 72 67 43 38B5. Combination of B1-B4 using one-half standard deviation shocks 96 97 100 98 85 80 52 47B6. One-time 30 percent nominal depreciation relative to the baseline in 2014 5/ 96 74 63 60 52 50 38 37
Baseline 125 130 115 98 88 84 69 57
A. Alternative Scenarios
A1. Key variables at their historical averages in 2013-2033 1/ 125 61 6 0 0 0 0 0A2. New public sector loans on less favorable terms in 2013-2033 2 125 130 116 100 90 87 78 79A3. Weak policy scenario 125 152 161 157 146 141 121 121
B. Bound Tests
B1. Real GDP growth at historical average minus one standard deviation in 2014-2015 125 134 122 104 94 90 75 61B2. Export value growth at historical average minus one standard deviation in 2014-2015 3/ 125 171 222 200 181 165 94 57B3. US dollar GDP deflator at historical average minus one standard deviation in 2014-2015 125 122 113 96 87 83 69 57B4. Net non-debt creating flows at historical average minus one standard deviation in 2014-2015 4/ 125 144 149 131 118 110 77 56B5. Combination of B1-B4 using one-half standard deviation shocks 125 128 129 113 102 95 68 51B6. One-time 30 percent nominal depreciation relative to the baseline in 2014 5/ 125 184 163 138 125 119 99 82
Table 2. Mongolia: Sensitivity Analysis for Key Indicators of Public and Publicly Guaranteed External Debt (Strong Policy Scenario), 2013-2033 (In percent)
PV of debt-to GDP ratio
Projections
PV of debt-to-exports ratio
PV of debt-to-revenue ratio
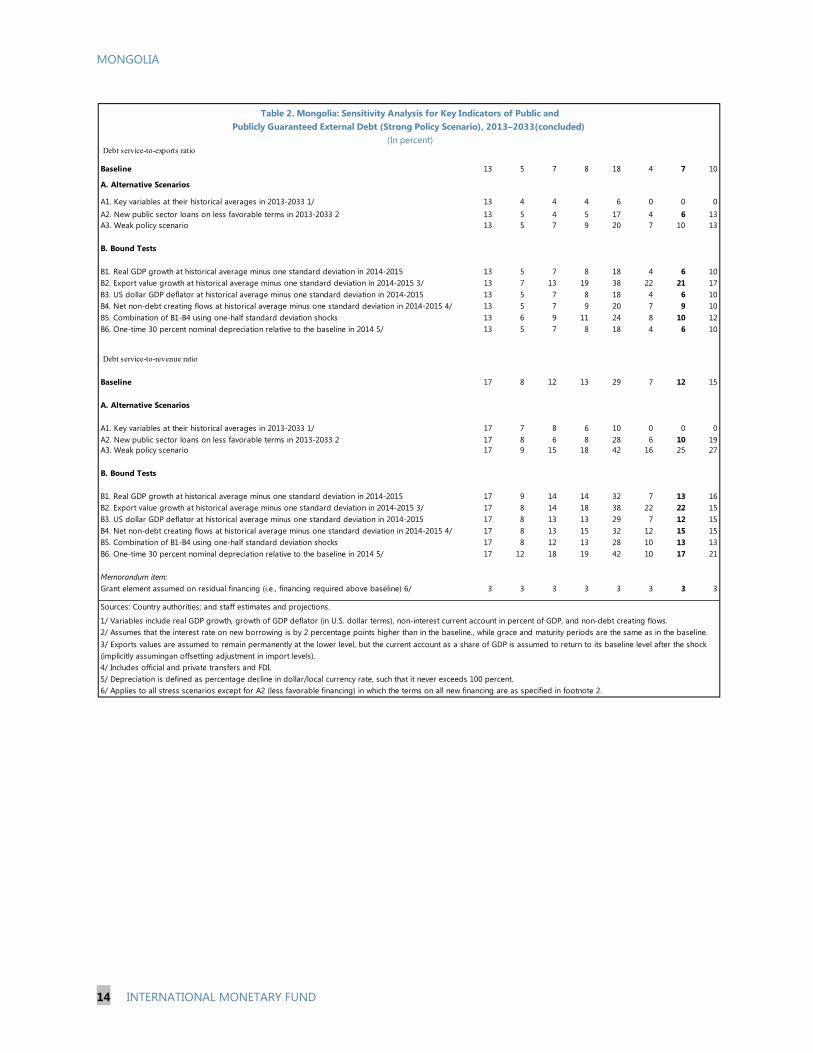
MONGOLIA
14 INTERNATIONAL MONETARY FUND
Baseline 13 5 7 8 18 4 7 10
A. Alternative Scenarios
A1. Key variables at their historical averages in 2013-2033 1/ 13 4 4 4 6 0 0 0A2. New public sector loans on less favorable terms in 2013-2033 2 13 5 4 5 17 4 6 13A3. Weak policy scenario 13 5 7 9 20 7 10 13
B. Bound Tests
B1. Real GDP growth at historical average minus one standard deviation in 2014-2015 13 5 7 8 18 4 6 10B2. Export value growth at historical average minus one standard deviation in 2014-2015 3/ 13 7 13 19 38 22 21 17B3. US dollar GDP deflator at historical average minus one standard deviation in 2014-2015 13 5 7 8 18 4 6 10B4. Net non-debt creating flows at historical average minus one standard deviation in 2014-2015 4/ 13 5 7 9 20 7 9 10B5. Combination of B1-B4 using one-half standard deviation shocks 13 6 9 11 24 8 10 12B6. One-time 30 percent nominal depreciation relative to the baseline in 2014 5/ 13 5 7 8 18 4 6 10
Baseline 17 8 12 13 29 7 12 15
A. Alternative Scenarios
A1. Key variables at their historical averages in 2013-2033 1/ 17 7 8 6 10 0 0 0A2. New public sector loans on less favorable terms in 2013-2033 2 17 8 6 8 28 6 10 19A3. Weak policy scenario 17 9 15 18 42 16 25 27
B. Bound Tests
B1. Real GDP growth at historical average minus one standard deviation in 2014-2015 17 9 14 14 32 7 13 16B2. Export value growth at historical average minus one standard deviation in 2014-2015 3/ 17 8 14 18 38 22 22 15B3. US dollar GDP deflator at historical average minus one standard deviation in 2014-2015 17 8 13 13 29 7 12 15B4. Net non-debt creating flows at historical average minus one standard deviation in 2014-2015 4/ 17 8 13 15 32 12 15 15B5. Combination of B1-B4 using one-half standard deviation shocks 17 8 12 13 28 10 13 13B6. One-time 30 percent nominal depreciation relative to the baseline in 2014 5/ 17 12 18 19 42 10 17 21
Memorandum item:Grant element assumed on residual financing (i.e., financing required above baseline) 6/ 3 3 3 3 3 3 3 3
Sources: Country authorities; and staff estimates and projections.
1/ Variables include real GDP growth, growth of GDP deflator (in U.S. dollar terms), non-interest current account in percent of GDP, and non-debt creating flows.
4/ Includes official and private transfers and FDI.5/ Depreciation is defined as percentage decline in dollar/local currency rate, such that it never exceeds 100 percent.6/ Applies to all stress scenarios except for A2 (less favorable financing) in which the terms on all new financing are as specified in footnote 2.
2/ Assumes that the interest rate on new borrowing is by 2 percentage points higher than in the baseline., while grace and maturity periods are the same as in the baseline.3/ Exports values are assumed to remain permanently at the lower level, but the current account as a share of GDP is assumed to return to its baseline level after the shock (implicitly assumingan offsetting adjustment in import levels).
Debt service-to-exports ratio
Table 2. Mongolia: Sensitivity Analysis for Key Indicators of Public and Publicly Guaranteed External Debt (Strong Policy Scenario), 2013–2033(concluded)
(In percent)
Debt service-to-revenue ratio
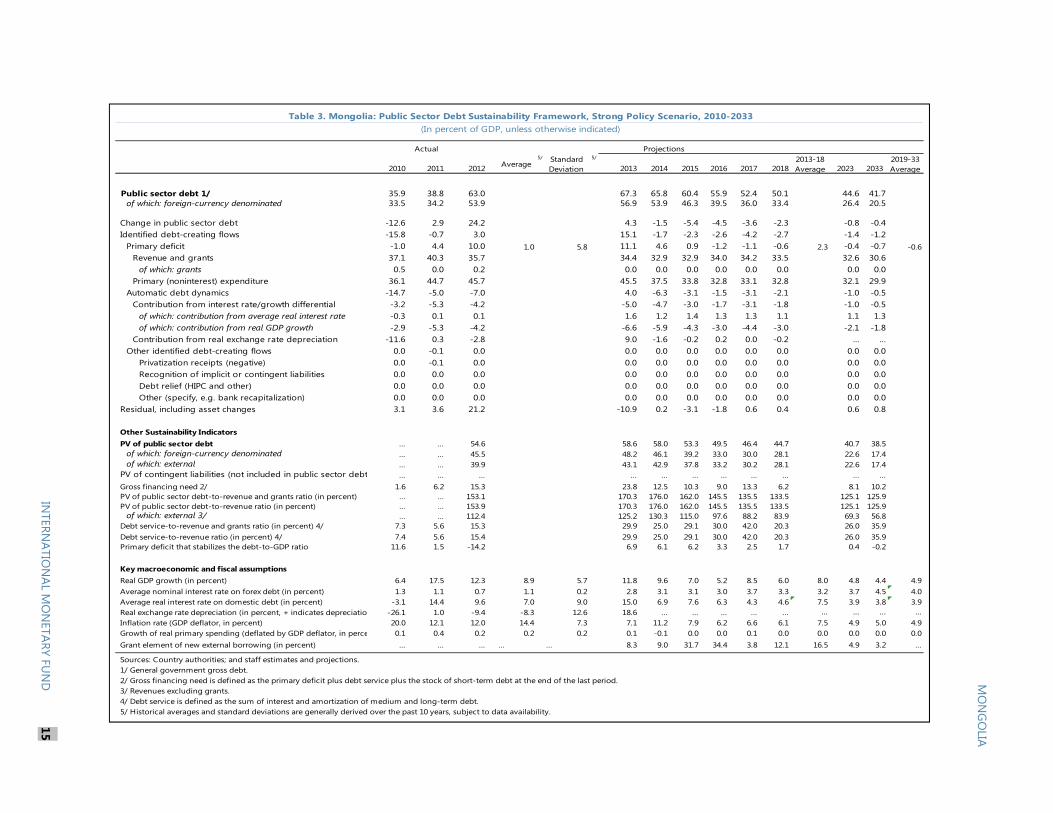
2010 2011 2012 Average5/ Standard
Deviation
5/
2013 2014 2015 2016 2017 20182013-18 Average 2023 2033
2019-33 Average
Public sector debt 1/ 35.9 38.8 63.0 67.3 65.8 60.4 55.9 52.4 50.1 44.6 41.7of which: foreign-currency denominated 33.5 34.2 53.9 56.9 53.9 46.3 39.5 36.0 33.4 26.4 20.5
Change in public sector debt -12.6 2.9 24.2 4.3 -1.5 -5.4 -4.5 -3.6 -2.3 -0.8 -0.4Identified debt-creating flows -15.8 -0.7 3.0 15.1 -1.7 -2.3 -2.6 -4.2 -2.7 -1.4 -1.2
Primary deficit -1.0 4.4 10.0 1.0 5.8 11.1 4.6 0.9 -1.2 -1.1 -0.6 2.3 -0.4 -0.7 -0.6Revenue and grants 37.1 40.3 35.7 34.4 32.9 32.9 34.0 34.2 33.5 32.6 30.6
of which: grants 0.5 0.0 0.2 0.0 0.0 0.0 0.0 0.0 0.0 0.0 0.0Primary (noninterest) expenditure 36.1 44.7 45.7 45.5 37.5 33.8 32.8 33.1 32.8 32.1 29.9
Automatic debt dynamics -14.7 -5.0 -7.0 4.0 -6.3 -3.1 -1.5 -3.1 -2.1 -1.0 -0.5Contribution from interest rate/growth differential -3.2 -5.3 -4.2 -5.0 -4.7 -3.0 -1.7 -3.1 -1.8 -1.0 -0.5
of which: contribution from average real interest rate -0.3 0.1 0.1 1.6 1.2 1.4 1.3 1.3 1.1 1.1 1.3of which: contribution from real GDP growth -2.9 -5.3 -4.2 -6.6 -5.9 -4.3 -3.0 -4.4 -3.0 -2.1 -1.8
Contribution from real exchange rate depreciation -11.6 0.3 -2.8 9.0 -1.6 -0.2 0.2 0.0 -0.2 ... ...Other identified debt-creating flows 0.0 -0.1 0.0 0.0 0.0 0.0 0.0 0.0 0.0 0.0 0.0
Privatization receipts (negative) 0.0 -0.1 0.0 0.0 0.0 0.0 0.0 0.0 0.0 0.0 0.0Recognition of implicit or contingent liabilities 0.0 0.0 0.0 0.0 0.0 0.0 0.0 0.0 0.0 0.0 0.0Debt relief (HIPC and other) 0.0 0.0 0.0 0.0 0.0 0.0 0.0 0.0 0.0 0.0 0.0Other (specify, e.g. bank recapitalization) 0.0 0.0 0.0 0.0 0.0 0.0 0.0 0.0 0.0 0.0 0.0
Residual, including asset changes 3.1 3.6 21.2 -10.9 0.2 -3.1 -1.8 0.6 0.4 0.6 0.8
Other Sustainability IndicatorsPV of public sector debt ... ... 54.6 58.6 58.0 53.3 49.5 46.4 44.7 40.7 38.5
of which: foreign-currency denominated ... ... 45.5 48.2 46.1 39.2 33.0 30.0 28.1 22.6 17.4of which: external ... ... 39.9 43.1 42.9 37.8 33.2 30.2 28.1 22.6 17.4
PV of contingent liabilities (not included in public sector debt ... ... ... ... ... ... ... ... ... ... ...Gross financing need 2/ 1.6 6.2 15.3 23.8 12.5 10.3 9.0 13.3 6.2 8.1 10.2PV of public sector debt-to-revenue and grants ratio (in percent) … … 153.1 170.3 176.0 162.0 145.5 135.5 133.5 125.1 125.9PV of public sector debt-to-revenue ratio (in percent) … … 153.9 170.3 176.0 162.0 145.5 135.5 133.5 125.1 125.9
of which: external 3/ … … 112.4 125.2 130.3 115.0 97.6 88.2 83.9 69.3 56.8Debt service-to-revenue and grants ratio (in percent) 4/ 7.3 5.6 15.3 29.9 25.0 29.1 30.0 42.0 20.3 26.0 35.9Debt service-to-revenue ratio (in percent) 4/ 7.4 5.6 15.4 29.9 25.0 29.1 30.0 42.0 20.3 26.0 35.9Primary deficit that stabilizes the debt-to-GDP ratio 11.6 1.5 -14.2 6.9 6.1 6.2 3.3 2.5 1.7 0.4 -0.2
Key macroeconomic and fiscal assumptionsReal GDP growth (in percent) 6.4 17.5 12.3 8.9 5.7 11.8 9.6 7.0 5.2 8.5 6.0 8.0 4.8 4.4 4.9Average nominal interest rate on forex debt (in percent) 1.3 1.1 0.7 1.1 0.2 2.8 3.1 3.1 3.0 3.7 3.3 3.2 3.7 4.5 4.0Average real interest rate on domestic debt (in percent) -3.1 14.4 9.6 7.0 9.0 15.0 6.9 7.6 6.3 4.3 4.6 7.5 3.9 3.8 3.9Real exchange rate depreciation (in percent, + indicates depreciatio -26.1 1.0 -9.4 -8.3 12.6 18.6 ... ... ... ... ... ... ... ... ...Inflation rate (GDP deflator, in percent) 20.0 12.1 12.0 14.4 7.3 7.1 11.2 7.9 6.2 6.6 6.1 7.5 4.9 5.0 4.9Growth of real primary spending (deflated by GDP deflator, in perce 0.1 0.4 0.2 0.2 0.2 0.1 -0.1 0.0 0.0 0.1 0.0 0.0 0.0 0.0 0.0Grant element of new external borrowing (in percent) ... ... ... … … 8.3 9.0 31.7 34.4 3.8 12.1 16.5 4.9 3.2 ...
Sources: Country authorities; and staff estimates and projections.1/ General government gross debt.2/ Gross financing need is defined as the primary deficit plus debt service plus the stock of short-term debt at the end of the last period. 3/ Revenues excluding grants.4/ Debt service is defined as the sum of interest and amortization of medium and long-term debt.5/ Historical averages and standard deviations are generally derived over the past 10 years, subject to data availability.
Table 3. Mongolia: Public Sector Debt Sustainability Framework, Strong Policy Scenario, 2010-2033 (In percent of GDP, unless otherwise indicated)
Actual Projections
MO
NG
OLIA
INTERN
ATION
AL MO
NETARY FU
ND
15
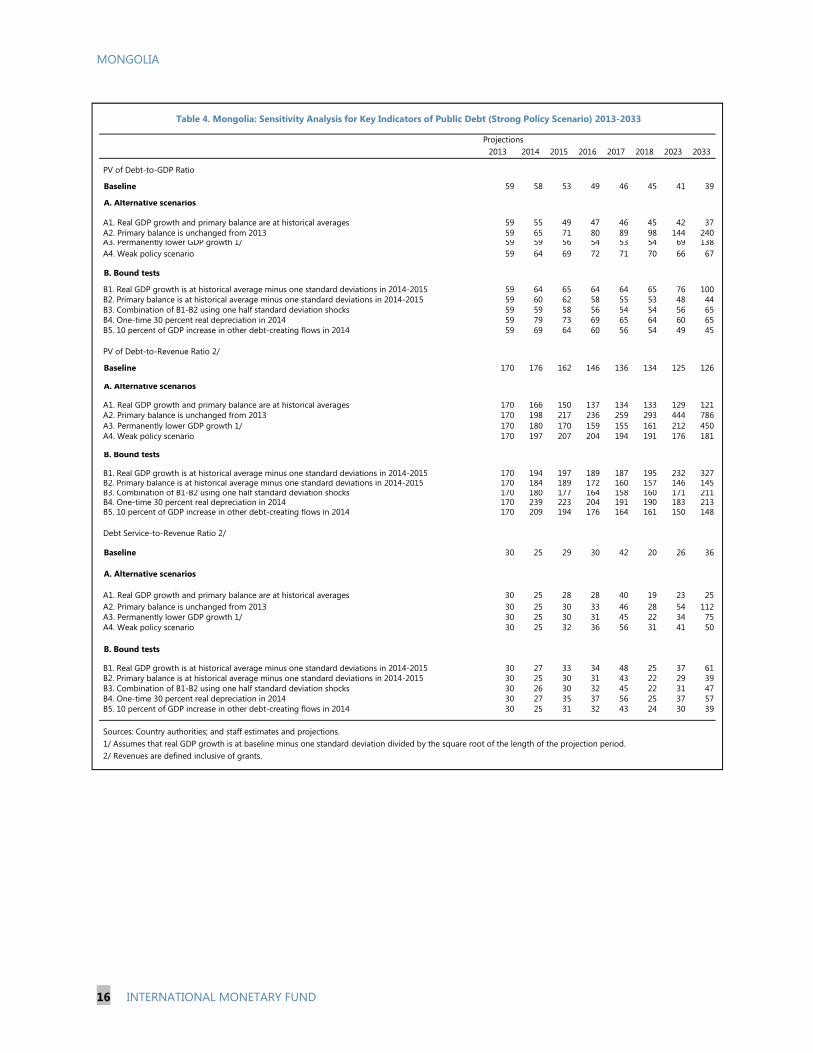
MONGOLIA
16 INTERNATIONAL MONETARY FUND
2013 2014 2015 2016 2017 2018 2023 2033
Baseline 59 58 53 49 46 45 41 39
A. Alternative scenarios
A1. Real GDP growth and primary balance are at historical averages 59 55 49 47 46 45 42 37A2. Primary balance is unchanged from 2013 59 65 71 80 89 98 144 240A3. Permanently lower GDP growth 1/ 59 59 56 54 53 54 69 138A4. Weak policy scenario 59 64 69 72 71 70 66 67
B. Bound tests
B1. Real GDP growth is at historical average minus one standard deviations in 2014-2015 59 64 65 64 64 65 76 100B2. Primary balance is at historical average minus one standard deviations in 2014-2015 59 60 62 58 55 53 48 44B3. Combination of B1-B2 using one half standard deviation shocks 59 59 58 56 54 54 56 65B4. One-time 30 percent real depreciation in 2014 59 79 73 69 65 64 60 65B5. 10 percent of GDP increase in other debt-creating flows in 2014 59 69 64 60 56 54 49 45
Baseline 170 176 162 146 136 134 125 126
A. Alternative scenarios
A1. Real GDP growth and primary balance are at historical averages 170 166 150 137 134 133 129 121A2. Primary balance is unchanged from 2013 170 198 217 236 259 293 444 786A3. Permanently lower GDP growth 1/ 170 180 170 159 155 161 212 450A4. Weak policy scenario 170 197 207 204 194 191 176 181
B. Bound tests
B1. Real GDP growth is at historical average minus one standard deviations in 2014-2015 170 194 197 189 187 195 232 327B2. Primary balance is at historical average minus one standard deviations in 2014-2015 170 184 189 172 160 157 146 145B3. Combination of B1-B2 using one half standard deviation shocks 170 180 177 164 158 160 171 211B4. One-time 30 percent real depreciation in 2014 170 239 223 204 191 190 183 213B5. 10 percent of GDP increase in other debt-creating flows in 2014 170 209 194 176 164 161 150 148
Baseline 30 25 29 30 42 20 26 36
A. Alternative scenarios
A1. Real GDP growth and primary balance are at historical averages 30 25 28 28 40 19 23 25A2. Primary balance is unchanged from 2013 30 25 30 33 46 28 54 112A3. Permanently lower GDP growth 1/ 30 25 30 31 45 22 34 75A4. Weak policy scenario 30 25 32 36 56 31 41 50
B. Bound tests
B1. Real GDP growth is at historical average minus one standard deviations in 2014-2015 30 27 33 34 48 25 37 61B2. Primary balance is at historical average minus one standard deviations in 2014-2015 30 25 30 31 43 22 29 39B3. Combination of B1-B2 using one half standard deviation shocks 30 26 30 32 45 22 31 47B4. One-time 30 percent real depreciation in 2014 30 27 35 37 56 25 37 57B5. 10 percent of GDP increase in other debt-creating flows in 2014 30 25 31 32 43 24 30 39
Sources: Country authorities; and staff estimates and projections.1/ Assumes that real GDP growth is at baseline minus one standard deviation divided by the square root of the length of the projection period.2/ Revenues are defined inclusive of grants.
Projections
PV of Debt-to-Revenue Ratio 2/
Debt Service-to-Revenue Ratio 2/
Table 4. Mongolia: Sensitivity Analysis for Key Indicators of Public Debt (Strong Policy Scenario) 2013-2033
PV of Debt-to-GDP Ratio
Press Release No. 13/526 FOR IMMEDIATE RELEASE
December 18, 2013
IMF Executive Board Concludes 2013 Article IV Consultation with Mongolia
On November 15, the Executive Board of the International Monetary Fund (IMF) concluded the 2013 Article IV Consultation1 with Mongolia.
Mongolia continues to be one of the fastest growing economies in the world. The economy expanded by 12½ percent in 2012 and by 11½ percent in the first half of 2013. Growth has been buoyed by a relatively mild winter boosting agriculture and expansionary fiscal and monetary policies. The latter have been deployed to compensate for the marked slowdown in coal exports and foreign direct investment (FDI)-financed mining development—key drivers of growth in recent years. The strong growth of the economy over the past two years has helped reduce poverty.
Adverse shocks to FDI inflows and exports, together with expansionary macroeconomic policies, have put pressure on the balance of payments. As a result, central bank reserves have come down considerably from record levels reached in late-2012 following Mongolia’s successful first sovereign bond issuance. In recent months, to help relieve the balance of payment pressures, the Bank of Mongolia has allowed more exchange rate flexibility. Looking ahead, real GDP growth for Mongolia is currently projected by the IMF at close to 12 percent in 2013 and by 9½ percent in 2014, buoyed by the start of production at the Oyu Tolgoi copper and gold mine.
Mongolia’s medium-term prospects remain promising given its large natural resource endowment. However, expansionary macro policies are likely to put pressure on inflation and the balance of payments in the period ahead. Also, Mongolia is facing an uncertain external environment. Advanced economies will eventually exit from the very supportive monetary policies implemented in recent years. China’s economy is expected to rebalance away from a mostly investment-based growth model toward a more consumption-based growth model. Both these factors are bound to have major spillovers globally and especially in the region. Spillover risks will particularly affect the more vulnerable emerging market economies.
1 Under Article IV of the IMF's Articles of Agreement, the IMF holds bilateral discussions with members, usually every year. A staff team visits the country, collects economic and financial information, and discusses with officials the country's economic developments and policies. On return to headquarters, the staff prepares a report, which forms the basis for discussion by the Executive Board.
International Monetary Fund
Washington, D.C. 20431 USA
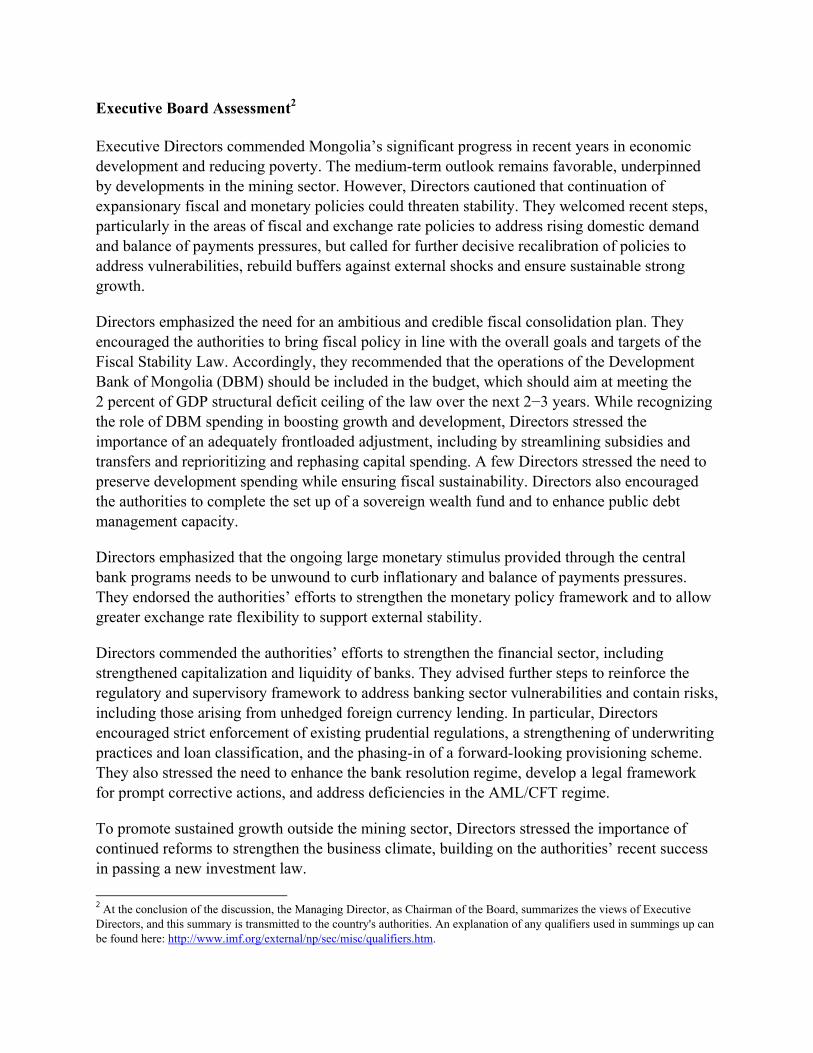
Executive Board Assessment2
Executive Directors commended Mongolia’s significant progress in recent years in economic development and reducing poverty. The medium-term outlook remains favorable, underpinned by developments in the mining sector. However, Directors cautioned that continuation of expansionary fiscal and monetary policies could threaten stability. They welcomed recent steps, particularly in the areas of fiscal and exchange rate policies to address rising domestic demand and balance of payments pressures, but called for further decisive recalibration of policies to address vulnerabilities, rebuild buffers against external shocks and ensure sustainable strong growth.
Directors emphasized the need for an ambitious and credible fiscal consolidation plan. They encouraged the authorities to bring fiscal policy in line with the overall goals and targets of the Fiscal Stability Law. Accordingly, they recommended that the operations of the Development Bank of Mongolia (DBM) should be included in the budget, which should aim at meeting the 2 percent of GDP structural deficit ceiling of the law over the next 2−3 years. While recognizing the role of DBM spending in boosting growth and development, Directors stressed the importance of an adequately frontloaded adjustment, including by streamlining subsidies and transfers and reprioritizing and rephasing capital spending. A few Directors stressed the need to preserve development spending while ensuring fiscal sustainability. Directors also encouraged the authorities to complete the set up of a sovereign wealth fund and to enhance public debt management capacity.
Directors emphasized that the ongoing large monetary stimulus provided through the central bank programs needs to be unwound to curb inflationary and balance of payments pressures. They endorsed the authorities’ efforts to strengthen the monetary policy framework and to allow greater exchange rate flexibility to support external stability.
Directors commended the authorities’ efforts to strengthen the financial sector, including strengthened capitalization and liquidity of banks. They advised further steps to reinforce the regulatory and supervisory framework to address banking sector vulnerabilities and contain risks, including those arising from unhedged foreign currency lending. In particular, Directors encouraged strict enforcement of existing prudential regulations, a strengthening of underwriting practices and loan classification, and the phasing-in of a forward-looking provisioning scheme. They also stressed the need to enhance the bank resolution regime, develop a legal framework for prompt corrective actions, and address deficiencies in the AML/CFT regime.
To promote sustained growth outside the mining sector, Directors stressed the importance of continued reforms to strengthen the business climate, building on the authorities’ recent success in passing a new investment law.
2 At the conclusion of the discussion, the Managing Director, as Chairman of the Board, summarizes the views of Executive Directors, and this summary is transmitted to the country's authorities. An explanation of any qualifiers used in summings up can be found here: http://www.imf.org/external/np/sec/misc/qualifiers.htm.
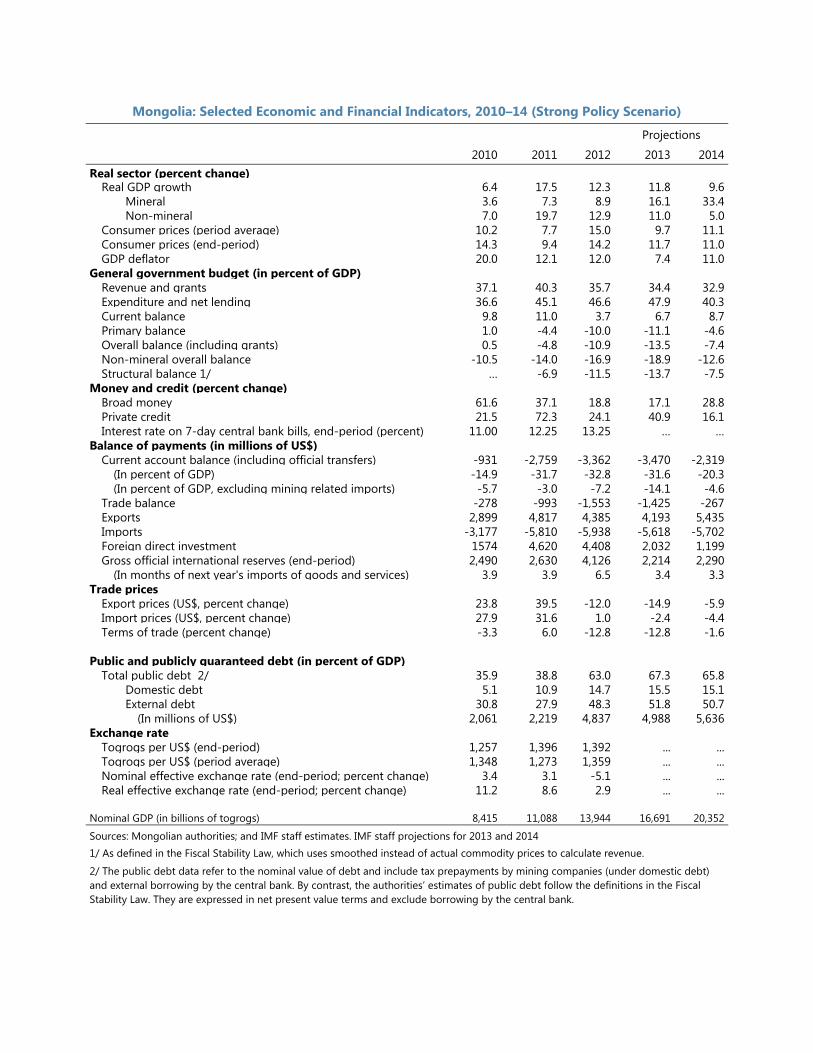
Mongolia: Selected Economic and Financial Indicators, 2010–14 (Strong Policy Scenario)
Projections
2010 2011 2012 2013 2014Real sector (percent change)
Real GDP growth 6.4 17.5 12.3 11.8 9.6Mineral 3.6 7.3 8.9 16.1 33.4Non-mineral 7.0 19.7 12.9 11.0 5.0
Consumer prices (period average) 10.2 7.7 15.0 9.7 11.1Consumer prices (end-period) 14.3 9.4 14.2 11.7 11.0GDP deflator 20.0 12.1 12.0 7.4 11.0
General government budget (in percent of GDP)Revenue and grants 37.1 40.3 35.7 34.4 32.9Expenditure and net lending 36.6 45.1 46.6 47.9 40.3Current balance 9.8 11.0 3.7 6.7 8.7Primary balance 1.0 -4.4 -10.0 -11.1 -4.6Overall balance (including grants) 0.5 -4.8 -10.9 -13.5 -7.4Non-mineral overall balance -10.5 -14.0 -16.9 -18.9 -12.6Structural balance 1/ … -6.9 -11.5 -13.7 -7.5
Money and credit (percent change) Broad money 61.6 37.1 18.8 17.1 28.8Private credit 21.5 72.3 24.1 40.9 16.1Interest rate on 7-day central bank bills, end-period (percent) 11.00 12.25 13.25 … …
Balance of payments (in millions of US$) Current account balance (including official transfers) -931 -2,759 -3,362 -3,470 -2,319
(In percent of GDP) -14.9 -31.7 -32.8 -31.6 -20.3(In percent of GDP, excluding mining related imports) -5.7 -3.0 -7.2 -14.1 -4.6
Trade balance -278 -993 -1,553 -1,425 -267Exports 2,899 4,817 4,385 4,193 5,435Imports -3,177 -5,810 -5,938 -5,618 -5,702Foreign direct investment 1574 4,620 4,408 2,032 1,199Gross official international reserves (end-period) 2,490 2,630 4,126 2,214 2,290
(In months of next year's imports of goods and services) 3.9 3.9 6.5 3.4 3.3Trade prices
Export prices (US$, percent change) 23.8 39.5 -12.0 -14.9 -5.9Import prices (US$, percent change) 27.9 31.6 1.0 -2.4 -4.4Terms of trade (percent change) -3.3 6.0 -12.8 -12.8 -1.6
Public and publicly guaranteed debt (in percent of GDP)Total public debt 2/ 35.9 38.8 63.0 67.3 65.8
Domestic debt 5.1 10.9 14.7 15.5 15.1External debt 30.8 27.9 48.3 51.8 50.7
(In millions of US$) 2,061 2,219 4,837 4,988 5,636Exchange rate
Togrogs per US$ (end-period) 1,257 1,396 1,392 ... ...Togrogs per US$ (period average) 1,348 1,273 1,359 ... ...Nominal effective exchange rate (end-period; percent change) 3.4 3.1 -5.1 ... ...Real effective exchange rate (end-period; percent change) 11.2 8.6 2.9 ... ...
Nominal GDP (in billions of togrogs) 8,415 11,088 13,944 16,691 20,352
Sources: Mongolian authorities; and IMF staff estimates. IMF staff projections for 2013 and 2014 1/ As defined in the Fiscal Stability Law, which uses smoothed instead of actual commodity prices to calculate revenue.
2/ The public debt data refer to the nominal value of debt and include tax prepayments by mining companies (under domestic debt) and external borrowing by the central bank. By contrast, the authorities’ estimates of public debt follow the definitions in the Fiscal Stability Law. They are expressed in net present value terms and exclude borrowing by the central bank.
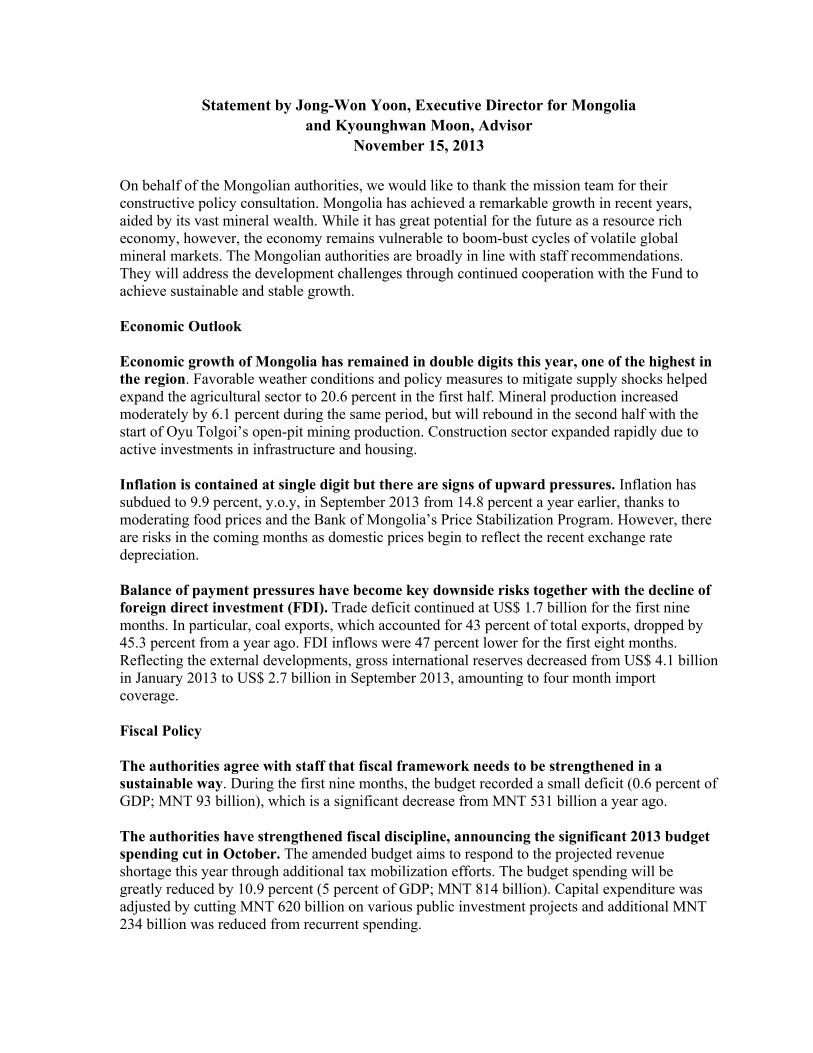
Statement by Jong-Won Yoon, Executive Director for Mongolia and Kyounghwan Moon, Advisor
November 15, 2013 On behalf of the Mongolian authorities, we would like to thank the mission team for their constructive policy consultation. Mongolia has achieved a remarkable growth in recent years, aided by its vast mineral wealth. While it has great potential for the future as a resource rich economy, however, the economy remains vulnerable to boom-bust cycles of volatile global mineral markets. The Mongolian authorities are broadly in line with staff recommendations. They will address the development challenges through continued cooperation with the Fund to achieve sustainable and stable growth. Economic Outlook Economic growth of Mongolia has remained in double digits this year, one of the highest in the region. Favorable weather conditions and policy measures to mitigate supply shocks helped expand the agricultural sector to 20.6 percent in the first half. Mineral production increased moderately by 6.1 percent during the same period, but will rebound in the second half with the start of Oyu Tolgoi’s open-pit mining production. Construction sector expanded rapidly due to active investments in infrastructure and housing. Inflation is contained at single digit but there are signs of upward pressures. Inflation has subdued to 9.9 percent, y.o.y, in September 2013 from 14.8 percent a year earlier, thanks to moderating food prices and the Bank of Mongolia’s Price Stabilization Program. However, there are risks in the coming months as domestic prices begin to reflect the recent exchange rate depreciation. Balance of payment pressures have become key downside risks together with the decline of foreign direct investment (FDI). Trade deficit continued at US$ 1.7 billion for the first nine months. In particular, coal exports, which accounted for 43 percent of total exports, dropped by 45.3 percent from a year ago. FDI inflows were 47 percent lower for the first eight months. Reflecting the external developments, gross international reserves decreased from US$ 4.1 billion in January 2013 to US$ 2.7 billion in September 2013, amounting to four month import coverage. Fiscal Policy The authorities agree with staff that fiscal framework needs to be strengthened in a sustainable way. During the first nine months, the budget recorded a small deficit (0.6 percent of GDP; MNT 93 billion), which is a significant decrease from MNT 531 billion a year ago. The authorities have strengthened fiscal discipline, announcing the significant 2013 budget spending cut in October. The amended budget aims to respond to the projected revenue shortage this year through additional tax mobilization efforts. The budget spending will be greatly reduced by 10.9 percent (5 percent of GDP; MNT 814 billion). Capital expenditure was adjusted by cutting MNT 620 billion on various public investment projects and additional MNT 234 billion was reduced from recurrent spending.
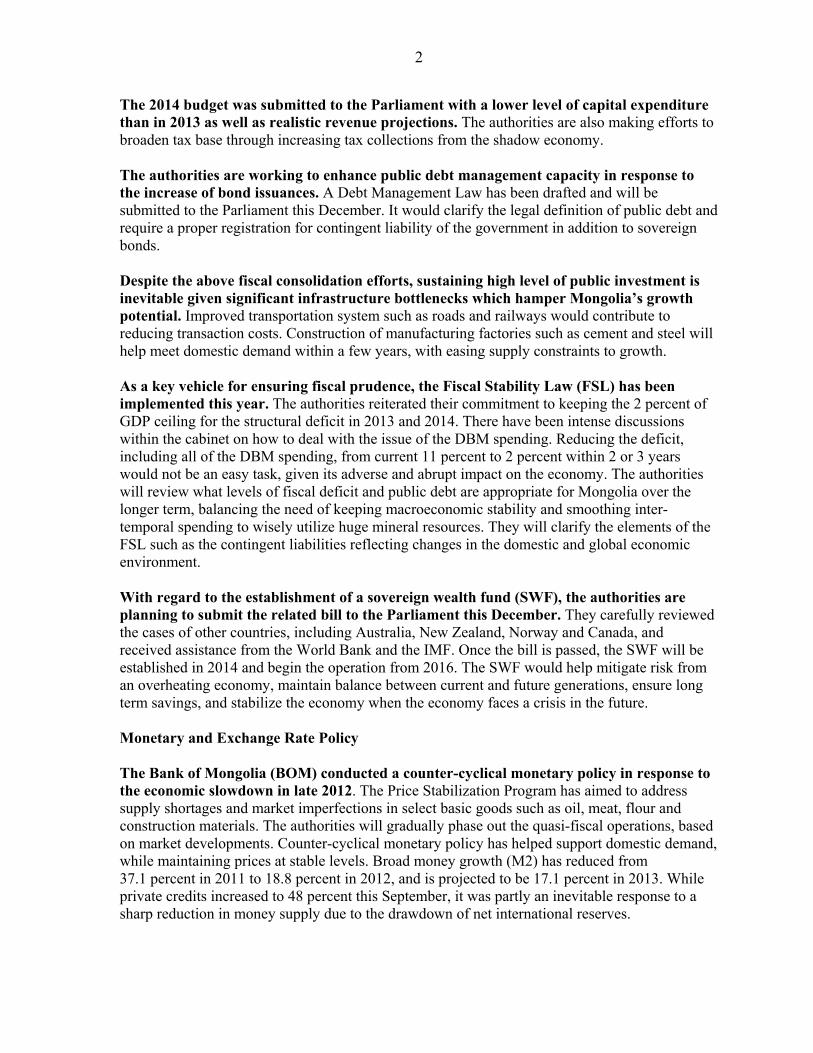
2
The 2014 budget was submitted to the Parliament with a lower level of capital expenditure than in 2013 as well as realistic revenue projections. The authorities are also making efforts to broaden tax base through increasing tax collections from the shadow economy. The authorities are working to enhance public debt management capacity in response to the increase of bond issuances. A Debt Management Law has been drafted and will be submitted to the Parliament this December. It would clarify the legal definition of public debt and require a proper registration for contingent liability of the government in addition to sovereign bonds. Despite the above fiscal consolidation efforts, sustaining high level of public investment is inevitable given significant infrastructure bottlenecks which hamper Mongolia’s growth potential. Improved transportation system such as roads and railways would contribute to reducing transaction costs. Construction of manufacturing factories such as cement and steel will help meet domestic demand within a few years, with easing supply constraints to growth. As a key vehicle for ensuring fiscal prudence, the Fiscal Stability Law (FSL) has been implemented this year. The authorities reiterated their commitment to keeping the 2 percent of GDP ceiling for the structural deficit in 2013 and 2014. There have been intense discussions within the cabinet on how to deal with the issue of the DBM spending. Reducing the deficit, including all of the DBM spending, from current 11 percent to 2 percent within 2 or 3 years would not be an easy task, given its adverse and abrupt impact on the economy. The authorities will review what levels of fiscal deficit and public debt are appropriate for Mongolia over the longer term, balancing the need of keeping macroeconomic stability and smoothing inter-temporal spending to wisely utilize huge mineral resources. They will clarify the elements of the FSL such as the contingent liabilities reflecting changes in the domestic and global economic environment. With regard to the establishment of a sovereign wealth fund (SWF), the authorities are planning to submit the related bill to the Parliament this December. They carefully reviewed the cases of other countries, including Australia, New Zealand, Norway and Canada, and received assistance from the World Bank and the IMF. Once the bill is passed, the SWF will be established in 2014 and begin the operation from 2016. The SWF would help mitigate risk from an overheating economy, maintain balance between current and future generations, ensure long term savings, and stabilize the economy when the economy faces a crisis in the future. Monetary and Exchange Rate Policy The Bank of Mongolia (BOM) conducted a counter-cyclical monetary policy in response to the economic slowdown in late 2012. The Price Stabilization Program has aimed to address supply shortages and market imperfections in select basic goods such as oil, meat, flour and construction materials. The authorities will gradually phase out the quasi-fiscal operations, based on market developments. Counter-cyclical monetary policy has helped support domestic demand, while maintaining prices at stable levels. Broad money growth (M2) has reduced from 37.1 percent in 2011 to 18.8 percent in 2012, and is projected to be 17.1 percent in 2013. While private credits increased to 48 percent this September, it was partly an inevitable response to a sharp reduction in money supply due to the drawdown of net international reserves.
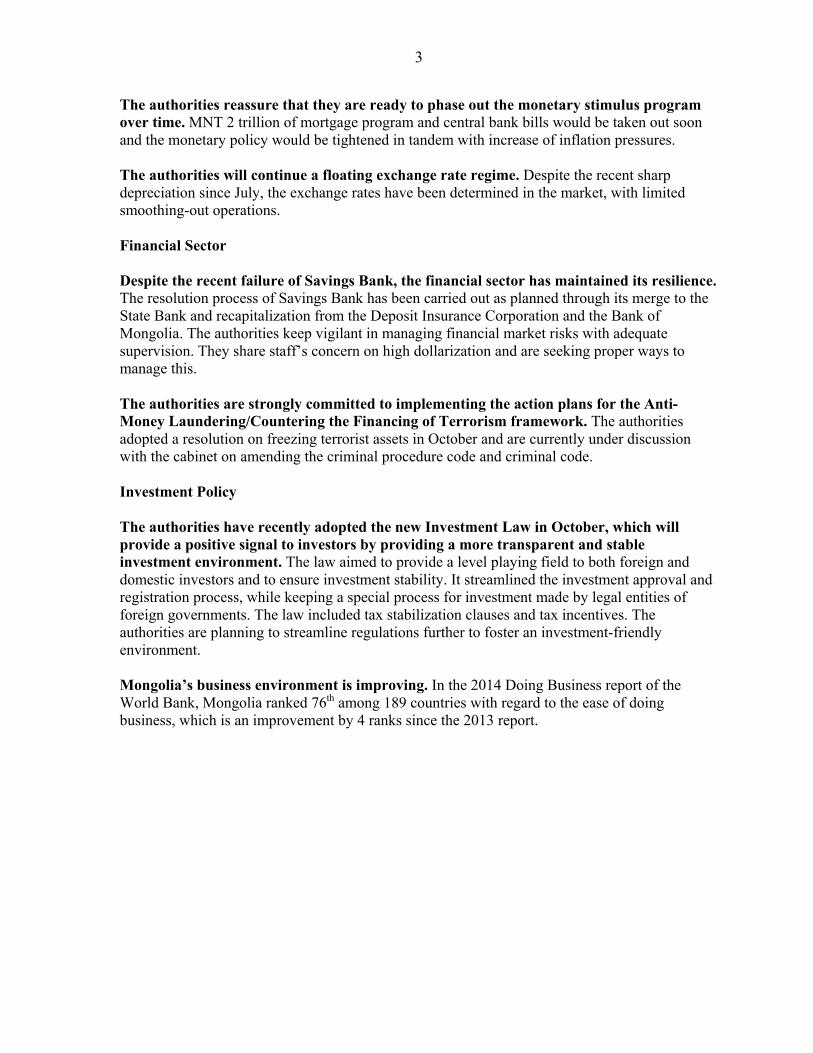
3
The authorities reassure that they are ready to phase out the monetary stimulus program over time. MNT 2 trillion of mortgage program and central bank bills would be taken out soon and the monetary policy would be tightened in tandem with increase of inflation pressures. The authorities will continue a floating exchange rate regime. Despite the recent sharp depreciation since July, the exchange rates have been determined in the market, with limited smoothing-out operations. Financial Sector Despite the recent failure of Savings Bank, the financial sector has maintained its resilience. The resolution process of Savings Bank has been carried out as planned through its merge to the State Bank and recapitalization from the Deposit Insurance Corporation and the Bank of Mongolia. The authorities keep vigilant in managing financial market risks with adequate supervision. They share staff’s concern on high dollarization and are seeking proper ways to manage this. The authorities are strongly committed to implementing the action plans for the Anti-Money Laundering/Countering the Financing of Terrorism framework. The authorities adopted a resolution on freezing terrorist assets in October and are currently under discussion with the cabinet on amending the criminal procedure code and criminal code. Investment Policy The authorities have recently adopted the new Investment Law in October, which will provide a positive signal to investors by providing a more transparent and stable investment environment. The law aimed to provide a level playing field to both foreign and domestic investors and to ensure investment stability. It streamlined the investment approval and registration process, while keeping a special process for investment made by legal entities of foreign governments. The law included tax stabilization clauses and tax incentives. The authorities are planning to streamline regulations further to foster an investment-friendly environment. Mongolia’s business environment is improving. In the 2014 Doing Business report of the World Bank, Mongolia ranked 76th among 189 countries with regard to the ease of doing business, which is an improvement by 4 ranks since the 2013 report.