Embed Size (px)
Citation preview
DI
SC
US
SI
ON
P
AP
ER
S
ER
IE
S
Forschungsinstitut zur Zukunft der ArbeitInstitute for the Study of Labor
Immigration, Unemployment and Growth in the Host Country: Bootstrap Panel Granger Causality Analysis on OECD Countries
IZA DP No. 5853
July 2011
Ekrame BoubtaneDramane CoulibalyChristophe Rault
Immigration, Unemployment and Growth in the Host Country:
Bootstrap Panel Granger Causality Analysis on OECD Countries
Ekrame Boubtane Paris School of Economics (University Paris 1)
Dramane Coulibaly
CEPII
Christophe Rault LEO - University of Orléans,
CESifo and IZA
Discussion Paper No. 5853 July 2011
IZA
P.O. Box 7240 53072 Bonn
Germany
Phone: +49-228-3894-0 Fax: +49-228-3894-180
E-mail: [email protected]
Any opinions expressed here are those of the author(s) and not those of IZA. Research published in this series may include views on policy, but the institute itself takes no institutional policy positions. The Institute for the Study of Labor (IZA) in Bonn is a local and virtual international research center and a place of communication between science, politics and business. IZA is an independent nonprofit organization supported by Deutsche Post Foundation. The center is associated with the University of Bonn and offers a stimulating research environment through its international network, workshops and conferences, data service, project support, research visits and doctoral program. IZA engages in (i) original and internationally competitive research in all fields of labor economics, (ii) development of policy concepts, and (iii) dissemination of research results and concepts to the interested public. IZA Discussion Papers often represent preliminary work and are circulated to encourage discussion. Citation of such a paper should account for its provisional character. A revised version may be available directly from the author.
IZA Discussion Paper No. 5853 July 2011
ABSTRACT
Immigration, Unemployment and Growth in the Host Country: Bootstrap Panel Granger Causality Analysis on OECD Countries* This paper examines the causality relationship between immigration, unemployment and economic growth of the host country. We employ the bootstrap panel Granger causality testing approach of Kónya (2006) that allows to test for causality on each individual country separably by accounting for dependence across countries. Using annual data over the period 1980-2005 for 22 OECD countries, we find that, only in Portugal, unemployment negatively causes immigration, while in any country, immigration does not cause unemployment. We also find that, in France, Iceland, Norway and United Kingdom, growth positively causes immigration, while in any country, immigration does not cause growth. JEL Classification: E20, F22, J61 Keywords: immigration, growth, unemployment, Granger causality Corresponding author: Christophe Rault LEO University of Orleans Rue de Blois-B.P.6739 45067 Orléans Cedex 2 France E-mail: [email protected]
* We are grateful to the participants of the CEPII internal seminar, and of the XXV annual conference of the European Society for Population Economics for very helpful comments and suggestions on a previous version of this paper. Usual disclaimer applies.
1 Introduction
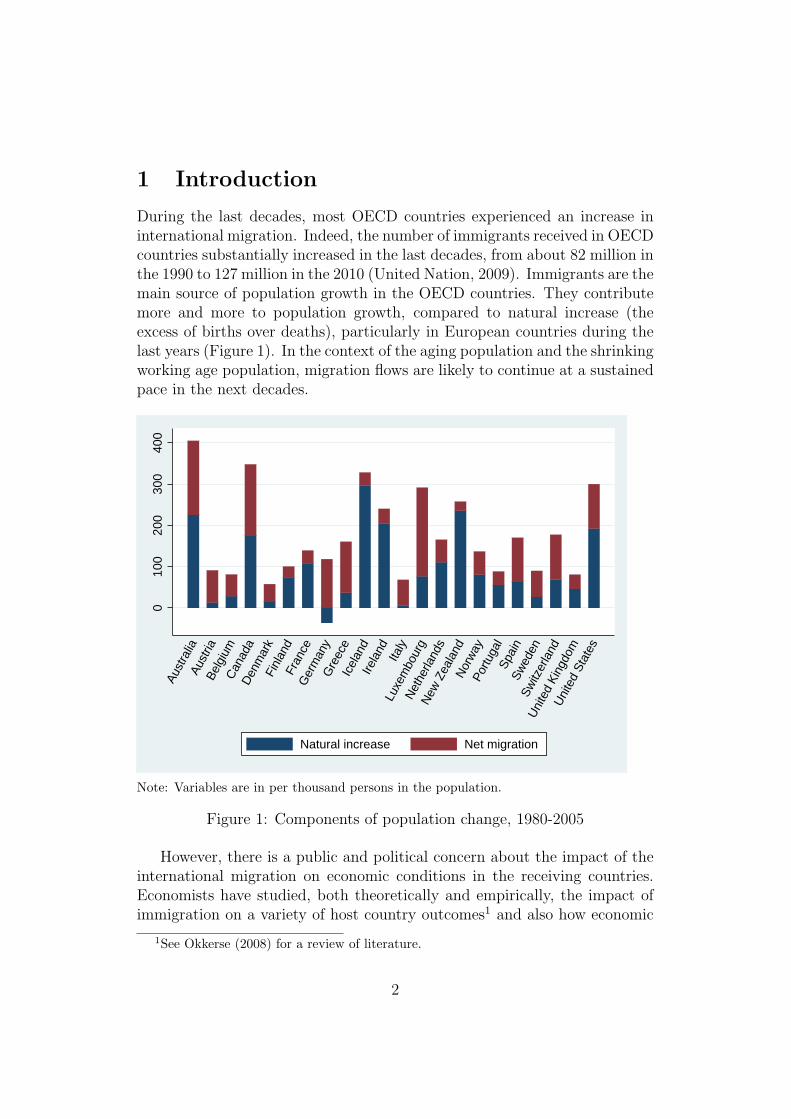
During the last decades, most OECD countries experienced an increase ininternational migration. Indeed, the number of immigrants received in OECDcountries substantially increased in the last decades, from about 82 million inthe 1990 to 127 million in the 2010 (United Nation, 2009). Immigrants are themain source of population growth in the OECD countries. They contributemore and more to population growth, compared to natural increase (theexcess of births over deaths), particularly in European countries during thelast years (Figure 1). In the context of the aging population and the shrinkingworking age population, migration flows are likely to continue at a sustainedpace in the next decades.
010
020
030
040
0Au
stra
liaAu
stria
Belg
ium
Can
ada
Den
mar
kFi
nlan
dFr
ance
Ger
man
yG
reec
eIc
elan
dIre
land
Italy
Luxe
mbo
urg
Net
herla
nds
New
Zea
land
Nor
way
Portu
gal
Spai
nSw
eden
Switz
erla
nd
Uni
ted
King
dom
Uni
ted
Stat
es
Natural increase Net migration
Note: Variables are in per thousand persons in the population.
Figure 1: Components of population change, 1980-2005
However, there is a public and political concern about the impact of theinternational migration on economic conditions in the receiving countries.Economists have studied, both theoretically and empirically, the impact ofimmigration on a variety of host country outcomes1 and also how economic
1See Okkerse (2008) for a review of literature.
2
conditions in the receiving countries affect migration flows.The theoretical studies do not draw unambiguous conclusion for the ef-
fects of immigrants on un(employment) rates among residents and natives(Harris and Todaro, 1970; Ortega, 2000). Generally, the empirical studies onthe impact of immigration on labour market in host countries conclude thatmigration flows do not reduce the labour market prospects of natives (Simonet al., 1993; Pischke and Velling, 1997; Dustmann et al., 2005; etc.).
The theoretical studies on the effect of immigration on growth show ifmigrants are skill an inflow of migrants will have a less negative effect ongrowth than that of natural increase in population(see Dolado et al., 1994;Barro and Sala-i-Martin, 1995). This result is corroborated by the findingsfrom the empirical papers (see Dolado et al., 1994 and Ortega and Peri, 2009among others).
Some empirical papers have examined the causality between immigrationand unemployment and growth on data from different countries (Pope andWithers, 1985 ; Marr and Siklos, 1994; Islam, 2007 and Morley, 2006). Theidea is based on the fact that migrants take into account job opportunitiesin their decision to migrate and the economic conditions are likely to havea significant impact on migrations policies. Generally, the empirical paperson causal link between immigration and host economic activity find no evi-dence of migration causing unemployment and growth, but find evidence ofcausation running in the opposite direction.
This paper contributes to the existing literature on immigration by in-vestigating the causality relationship between immigration and host countryeconomic conditions (unemployment and growth) using the panel Grangercausality testing approach recently developed by Konya (2006). This ap-proach has several advantages. Firstly, it does not assume that the panelis homogeneous and allows to test for Granger-causality on each individualpanel member separately by taking into account the possible contemporane-ous correlation across countries (therefore generating country specific boot-strap critical values). Therefore, it allows to test the causality relationshipbetween immigration and host economic variables by accounting for the het-erogeneity in term immigration policy of each host country. Secondly, thisapproach which extends the framework by Phillips (1995) that tests for non-causality in levels VARs, in a time series context, does not require pretestingfor unit roots and cointegration. This is an important feature since theunit-root and cointegration tests in general suffer from low power, and differ-ent tests often lead to contradictory outcomes. Thirdly, this panel Grangercausality approach allows to detect for how many and for which members ofthe panel there exists one-way Granger-causality, two-way Granger-causalityor no Granger-causality.
3
Using annual data over the period 1980-2005 for 22 OECD countries whichare the major migrants-recipients countries, our study provides evidence thatthe interaction between immigration and host economic activity depends onthe host country. Specifically, our finding suggests that, only in Portugal,unemployment negatively Granger causes immigration inflow, while in anycountry, immigration inflow does not Grange cause unemployment. More-over, our results indicate that in four countries (France, Iceland, Norwayand United Kingdom), economic growth positively Granger causes immigra-tion inflow, while in any country, immigration inflow does not Granger causeeconomic growth.
The remainder of the paper is organized as follows. The existing litera-ture on the interaction between immigration and unemployment and growthis reviewed in Section 2. Section 3 presents the econometric methodology.Section 4 describes the data and reports the empirical results. Finally, Sec-tion 5 offers some concluding remarks.
2 Literature review
Since the early 1980s a considerable literature on immigration has been de-veloped. The main concern is about the effect of immigration on labourmarket and economic growth in the host country.
The theoretical studies about the effects of immigration on unemploymentlead to ambiguous conclusion. Harris and Todaro (1970) use a two-sectormodel of migration and unemployment to describe the possible negative ef-fects of immigration on natives employment opportunities in the presence ofminimum wage. On the contrary, using a dynamic two-country labour match-ing model with free-entry of firms, Ortega (2000) finds a positive effect ofimmigration on natives employment opportunities. The theoretical papersby Johnson (1980), Borjas (1987), Schmidt et al. (1994) and Greenwoodand Hunt (1995)) show that the effects of immigrants on the employment ofresidents depend on whether immigrants and natives are substitutes or com-plements in production. If the labour supply of residents and that of recentimmigrants are substitutes, an inflow of immigrants will reduce the wage(assuming wage adjustment to clear the labour market) and will increase thetotal employment. If labour force participation rates are sensitive to realwage rates, part of adjustment will causes a decrease in natives unemploy-ment. On the contrary, if residents and immigrant workers are complementsin production (immigrants may be particularly adept at some types of jobs)the arrival of new immigrants may increase resident productivity and thenraise theirs wages and theirs employment opportunities.
4
Some theoretical works (Dolado et al., 1994; Barro and Sala-i-Martin,1995) use a Solow growth model augmented by human capital to analyze theeffects of immigrants on growth. They conclude that the effects of migrationon economic growth depend on the skill composition of immigrants. Themore migrants are educated, the more immigration has a positive effect ongrowth of host country.
Generally, empirical studies on the impact of immigration on labour mar-ket in host countries conclude that migration flows do not reduce the labourmarket prospects of natives. For example, the empirical studies based on thespatial correlation approach (Simon et al., 1993 for the U.S; Pischke and Vel-ling, 1997 for Germany; Dustmann et al., 2005 for the U.K.) find no adverseeffects of immigration on native unemployment. This result is corroboratedby finding from the studies on the natural experiments, i.e., immigrationcaused by political rather than economic factors (Card, 1990 for the MarielBoatlift2 and Hunt, 1992 for the repatriation of “pieds-noirs” form Algeriainto France). Contrary to the studies mentioned above that are conductedat the country level, Angrist and Kugler (2003) use a panel of 18 Europeancountries from 1983 to 1999 and find a slightly negative impact of immigrantson native labour market employment. Jean and Jimenez (2007) evaluate theunemployment impact of immigration (and its link with output and labourmarket policies) in 18 OECD countries over the period 1984−2003, and theydo not find any permanent effect of immigration.
Estimating an augmented Solow model on data from OECD economiesduring the period 1960-1985, Dolado et al. (1994) find empirical evidencethat corroborates its theoretical result. Their empirical result shows thatbecause of their human capital content, migration inflows have less than halfthe negative impact of comparable natural population increases. However,more recently, Ortega and Peri (2009) estimate a pseudo-gravity model on 14OECD countries over the period 1980-2005 and find that immigration doesnot affect income per capita.
Since migrants take into account job opportunities in their decision tomigrate and because the economic conditions in host countries are likelyto have a significant impact on migrations policies, some empirical papersexamine whether the migration flows respond to host country economic con-ditions. Particularly, some previews papers examine the Granger causalitylinks between immigration and unemployment using data on individual coun-try (Pope and Withers, 1985 for Australia; Marr and Siklos, 1994 and Islam,
2The Martiel Boatlift occurred in 1980 when Fidel Castro permitted that Cubans whowished to leave Cuba from free access to depart from the port of Mariel. Approximately,125000 Cubans, mostly unskilled workers, migrated to Miami. As a result, the Miami’slabour force increased by 7 percent
5
2007 for Canada). They find no evidence of migration causing higher aver-age rates of unemployment, but find evidence of causation running in theopposite direction. However, Shan et al. (1999) find no Granger-causalitybetween immigration and unemployment, using data from Austria and theNew Zealand. Morley (2006) finds evidence of a long-run Granger causalityrunning from per capita GDP to immigration on data for Australia, Canadaand the U.S.
Contrary to these previous empirical paper that examine the Grangercausality between immigration and unemployment and growth using data onindividual country, we employ here panel Granger causality techniques for apanel of OECD countries.
3 Econometric methodology
Three approaches can implemented to test for Granger-causality in a panelframework. The first one is based on the Generalized Method of Moments(GMM) that estimates (homogeneous) panel model by eliminating the fixedeffect. However, it does not account for neither heterogeneity nor the cross-sectional dependence3. A second approach that deal with heterogeneity wasproposed by Hurlin (2008), but its main drawback is that the possible cross-sectional dependence is not taken into account. The third approach devel-oped by Konya (2006) allows to account for both the cross-sectional depen-dence and the heterogeneity. It is based on Seemingly Unrelated Regressions(SUR) systems and Wald tests with country specific bootstrap critical valuesand eanbles to test for Granger-causality on each individual panel memberseparately, by taking into account the possible contemporaneous correlationacross countries. Given its generality, we will implement this last approachin this paper.
The panel causality approach by Konya (2006) that examine the relation-ship between Y and X can be studied using the following bivariate finite-order vector autoregressive (VAR) model:
yi,t = α1,i +ly1∑
s=1
β1,i,syi,t−s +lx1∑
s=1
γ1,i,sxi,t−s + ε1,i,t
xi,t = α2,i +ly2∑
s=1
β2,i,syi,t−s +lx2∑
s=1
γ2,i,sxi,t−s + ε2,i,t
(1)
3Moreover, as shown by Pesaran et al. (1999) the GMM estimators can lead to in-consistent and misleading estimated parameters unless the slope coefficients are in factidentical.
6
where the index i (i = 1, ..., N) denotes the country, the index t (t =1, ..., T ) the period, s the lag, and ly1, lx1, ly2 and lx2 indicate the laglengths. The error terms, ε1,i,t and ε2,i,t are supposed to be white-noises(i.e. they have zero means, constant variances and are individually seriallyuncorrelated) and may be correlated with each other for a given country.
In this study, we consider two bivariate systems. In the first bivariatesystem System 1 : Y = U,X = M where U and M denote unemploymentrate and net migration rate, respectively. In the second bivariate systemSystem 2 : Y = LGDP,X = M , where LGDP denotes the natural loga-rithm of per capita real GDP (or real income).
With respect to system (1) for instance, in country i there is one-wayGranger-causality running from X to Y if in the first equation not all γ1,i’s arezero but in the second all β2,i’s are zero; there is one-way Granger-causalityfrom Y to X if in the first equation all γ1,i’s are zero but in the second not allβ2,i’s are zero; there is two-way Granger-causality between Y and X if neitherall β2,i’s nor all γ1,i’s are zero; and there is no Granger-causality between Yand X if all β2,i’s and γ1,i’s are zero.
Since for a given country the two equations in (1) contain the same pre-determined, i.e. lagged exogenous and endogenous variables, the OLS esti-mators of the parameters are consistent and asymptotically efficient. Thissuggests that the 2N equations in the system can be estimated one-by-one, inany preferred order. Then, instead of N VAR systems in (1), we can considerthe following two sets of equations:
y1,t = α1,1 +ly1∑
s=1
β1,1,sy1,t−s +lx1∑
s=1
γ1,1,sx1,t−s + ε1,1,t
y2,t = α1,2 +ly1∑
s=1
β1,2,sy2,t−s +lx1∑
s=1
γ1,2,sx2,t−s + ε1,2,t
...
yN,t = α1,N +ly1∑
s=1
β1,N,syN,t−s +lx1∑
s=1
γ1,N,sxN,t−s + ε1,N,t
(2)
and
x1,t = α2,1 +ly2∑
s=1
β2,1,sy1,t−s +lx2∑
s=1
γ2,1,sx1,t−s + ε2,1,t
x2,t = α2,2 +ly2∑
s=1
β2,2,sy2,t−s +lx2∑
s=1
γ2,2,sx2,t−s + ε2,2,t
...
xN,t = α2,N +ly2∑
s=1
β2,N,syN,t−s +lx2∑
s=1
γ2,N,sxN,t−s + ε2,N,t
(3)
7
Compared to (1), each equation in (2), and also in (3), has differentpredetermined variables. The only possible link among individual regres-sions is contemporaneous correlation within the systems. Therefore, system2 and 3 must be estimated by (SUR) procedure to take into account contem-poraneous correlation within the systems (in presence of contemporaneouscorrelation the SUR estimator is more efficient than the OLS estimator). Fol-lowing Konya (2006), we use country specific bootstrap Wald critical valuesto implement Granger causality4.
This procedure has several advantages. Firstly, it does not assume thatthe panel is homogeneous, so it is possible to test for Granger-causality oneach individual panel member separately. However, since contemporaneouscorrelation is allowed across countries, it makes possible to exploit the extrainformation provided by the panel data setting. Therefore, country specificbootstrap critical values are generated. Secondly, this approach does notrequire pretesting for unit roots and cointegration, though it still requiresthe specification of the lag structure. This is an important feature since theunit-root and cointegration tests in general suffer from low power, and differ-ent tests often lead to contradictory outcomes. Thirdly, this panel Grangercausality approach allows the researcher to detect for how many and forwhich members of the panel there exists one-way Granger-causality, two-wayGranger-causality or no Granger-causality.
4 Data and Econometric investigation
We use annual data over the period 1980-2005 for 22 OECD countries whichare the major migrants-recipients countries. We use net migration, because,as mentioned by OECD, the main sources of information on migration varyacross countries, which poses problems for the comparability of available dataon inflows and outflows. Since the comparability problems is generally causedby short-term movements, as argued by OECD, taking net migration tendsto eliminate these movements that are the main source of non-comparability.Besides, compared to data on inflows and outflows, for the countries thatwe consider, there are long available series on data on net migration. Netmigration rate is measured as total annual arrivals less total departures,divided by the total population. Net migration data include immigrantsfrom OECD countries and do not make a distinction between nationals andforeigners. Entries of persons admitted on a temporary basis are not included
4See Appendix for the procedure regarding how bootstrap samples are generated foreach country
8
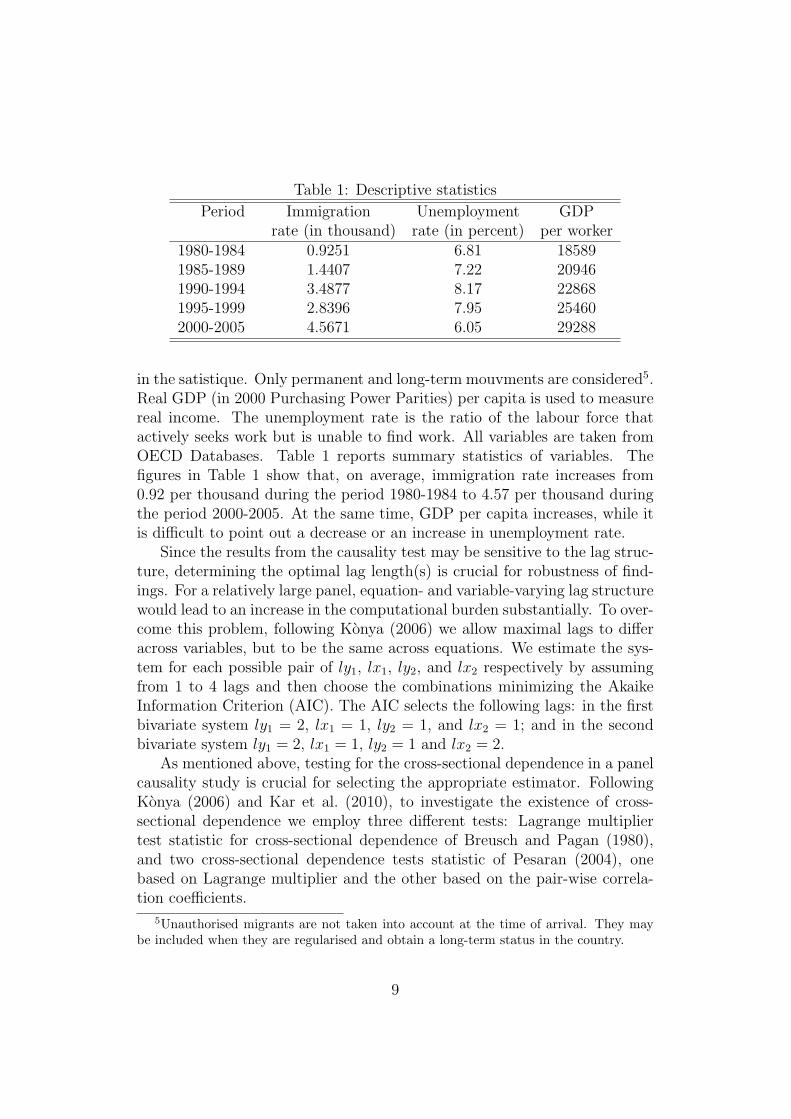
Table 1: Descriptive statistics
Period Immigration Unemployment GDPrate (in thousand) rate (in percent) per worker
1980-1984 0.9251 6.81 185891985-1989 1.4407 7.22 209461990-1994 3.4877 8.17 228681995-1999 2.8396 7.95 254602000-2005 4.5671 6.05 29288
in the satistique. Only permanent and long-term mouvments are considered5.Real GDP (in 2000 Purchasing Power Parities) per capita is used to measurereal income. The unemployment rate is the ratio of the labour force thatactively seeks work but is unable to find work. All variables are taken fromOECD Databases. Table 1 reports summary statistics of variables. Thefigures in Table 1 show that, on average, immigration rate increases from0.92 per thousand during the period 1980-1984 to 4.57 per thousand duringthe period 2000-2005. At the same time, GDP per capita increases, while itis difficult to point out a decrease or an increase in unemployment rate.
Since the results from the causality test may be sensitive to the lag struc-ture, determining the optimal lag length(s) is crucial for robustness of find-ings. For a relatively large panel, equation- and variable-varying lag structurewould lead to an increase in the computational burden substantially. To over-come this problem, following Konya (2006) we allow maximal lags to differacross variables, but to be the same across equations. We estimate the sys-tem for each possible pair of ly1, lx1, ly2, and lx2 respectively by assumingfrom 1 to 4 lags and then choose the combinations minimizing the AkaikeInformation Criterion (AIC). The AIC selects the following lags: in the firstbivariate system ly1 = 2, lx1 = 1, ly2 = 1, and lx2 = 1; and in the secondbivariate system ly1 = 2, lx1 = 1, ly2 = 1 and lx2 = 2.
As mentioned above, testing for the cross-sectional dependence in a panelcausality study is crucial for selecting the appropriate estimator. FollowingKonya (2006) and Kar et al. (2010), to investigate the existence of cross-sectional dependence we employ three different tests: Lagrange multipliertest statistic for cross-sectional dependence of Breusch and Pagan (1980),and two cross-sectional dependence tests statistic of Pesaran (2004), onebased on Lagrange multiplier and the other based on the pair-wise correla-tion coefficients.
5Unauthorised migrants are not taken into account at the time of arrival. They maybe included when they are regularised and obtain a long-term status in the country.
9
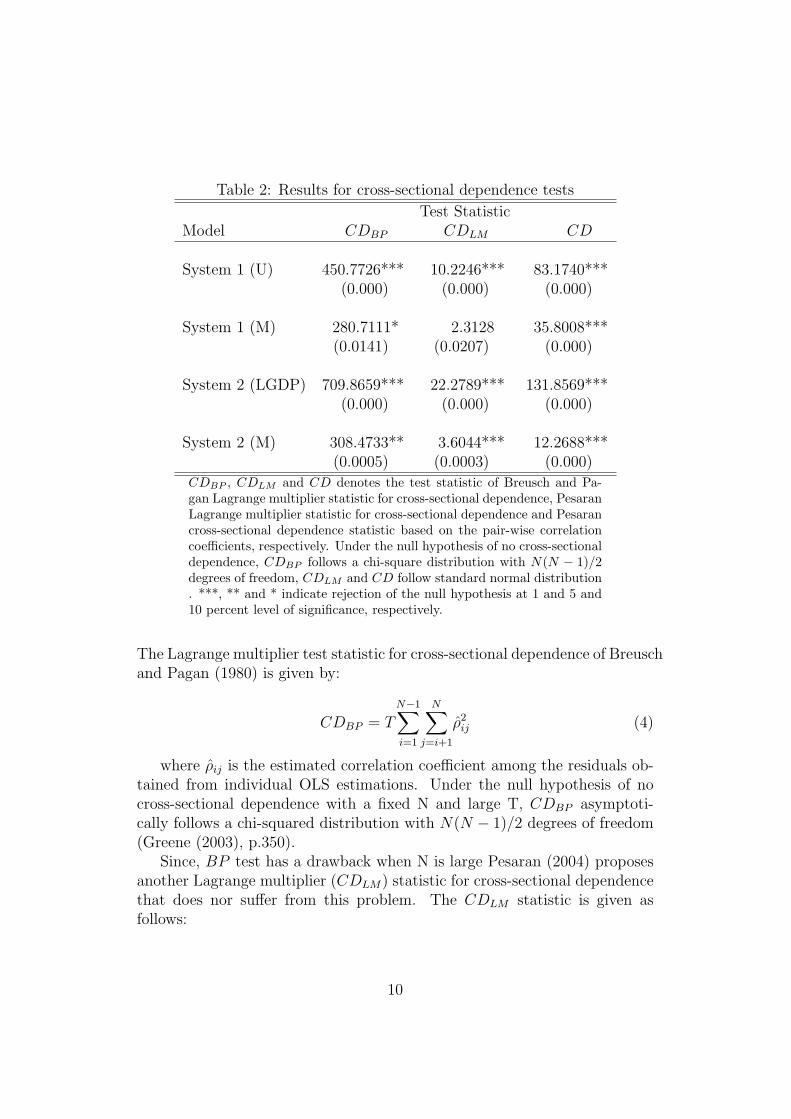
Table 2: Results for cross-sectional dependence tests
Test StatisticModel CDBP CDLM CD
System 1 (U) 450.7726*** 10.2246*** 83.1740***(0.000) (0.000) (0.000)
System 1 (M) 280.7111* 2.3128 35.8008***(0.0141) (0.0207) (0.000)
System 2 (LGDP) 709.8659*** 22.2789*** 131.8569***(0.000) (0.000) (0.000)
System 2 (M) 308.4733** 3.6044*** 12.2688***(0.0005) (0.0003) (0.000)
CDBP , CDLM and CD denotes the test statistic of Breusch and Pa-gan Lagrange multiplier statistic for cross-sectional dependence, PesaranLagrange multiplier statistic for cross-sectional dependence and Pesarancross-sectional dependence statistic based on the pair-wise correlationcoefficients, respectively. Under the null hypothesis of no cross-sectionaldependence, CDBP follows a chi-square distribution with N(N − 1)/2degrees of freedom, CDLM and CD follow standard normal distribution. ***, ** and * indicate rejection of the null hypothesis at 1 and 5 and10 percent level of significance, respectively.
The Lagrange multiplier test statistic for cross-sectional dependence of Breuschand Pagan (1980) is given by:
CDBP = T
N−1∑
i=1
N∑
j=i+1
ρ2ij (4)
where ρij is the estimated correlation coefficient among the residuals ob-tained from individual OLS estimations. Under the null hypothesis of nocross-sectional dependence with a fixed N and large T, CDBP asymptoti-cally follows a chi-squared distribution with N(N − 1)/2 degrees of freedom(Greene (2003), p.350).
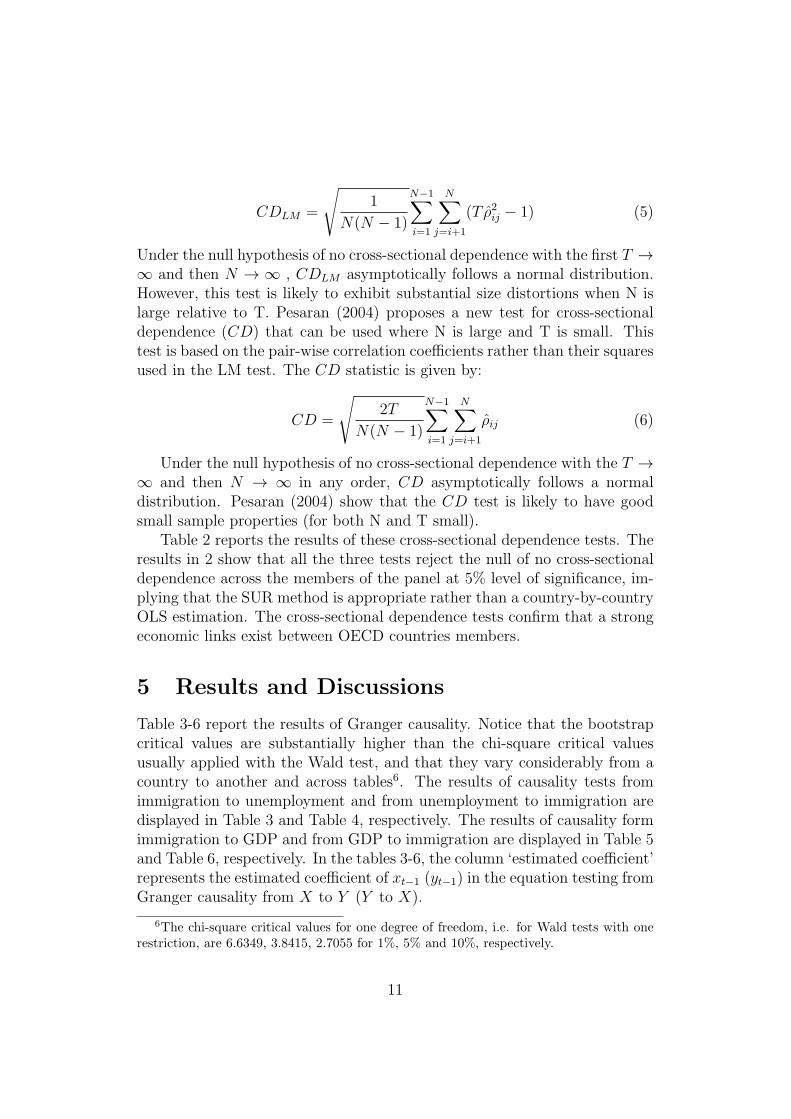
Since, BP test has a drawback when N is large Pesaran (2004) proposesanother Lagrange multiplier (CDLM) statistic for cross-sectional dependencethat does nor suffer from this problem. The CDLM statistic is given asfollows:
10
CDLM =
√
1
N(N − 1)
N−1∑
i=1
N∑
j=i+1
(T ρ2ij − 1) (5)
Under the null hypothesis of no cross-sectional dependence with the first T →
∞ and then N → ∞ , CDLM asymptotically follows a normal distribution.However, this test is likely to exhibit substantial size distortions when N islarge relative to T. Pesaran (2004) proposes a new test for cross-sectionaldependence (CD) that can be used where N is large and T is small. Thistest is based on the pair-wise correlation coefficients rather than their squaresused in the LM test. The CD statistic is given by:
CD =
√
2T
N(N − 1)
N−1∑
i=1
N∑
j=i+1
ρij (6)
Under the null hypothesis of no cross-sectional dependence with the T →
∞ and then N → ∞ in any order, CD asymptotically follows a normaldistribution. Pesaran (2004) show that the CD test is likely to have goodsmall sample properties (for both N and T small).
Table 2 reports the results of these cross-sectional dependence tests. Theresults in 2 show that all the three tests reject the null of no cross-sectionaldependence across the members of the panel at 5% level of significance, im-plying that the SUR method is appropriate rather than a country-by-countryOLS estimation. The cross-sectional dependence tests confirm that a strongeconomic links exist between OECD countries members.
5 Results and Discussions
Table 3-6 report the results of Granger causality. Notice that the bootstrapcritical values are substantially higher than the chi-square critical valuesusually applied with the Wald test, and that they vary considerably from acountry to another and across tables6. The results of causality tests fromimmigration to unemployment and from unemployment to immigration aredisplayed in Table 3 and Table 4, respectively. The results of causality formimmigration to GDP and from GDP to immigration are displayed in Table 5and Table 6, respectively. In the tables 3-6, the column ‘estimated coefficient’represents the estimated coefficient of xt−1 (yt−1) in the equation testing fromGranger causality from X to Y (Y to X).
6The chi-square critical values for one degree of freedom, i.e. for Wald tests with onerestriction, are 6.6349, 3.8415, 2.7055 for 1%, 5% and 10%, respectively.
11
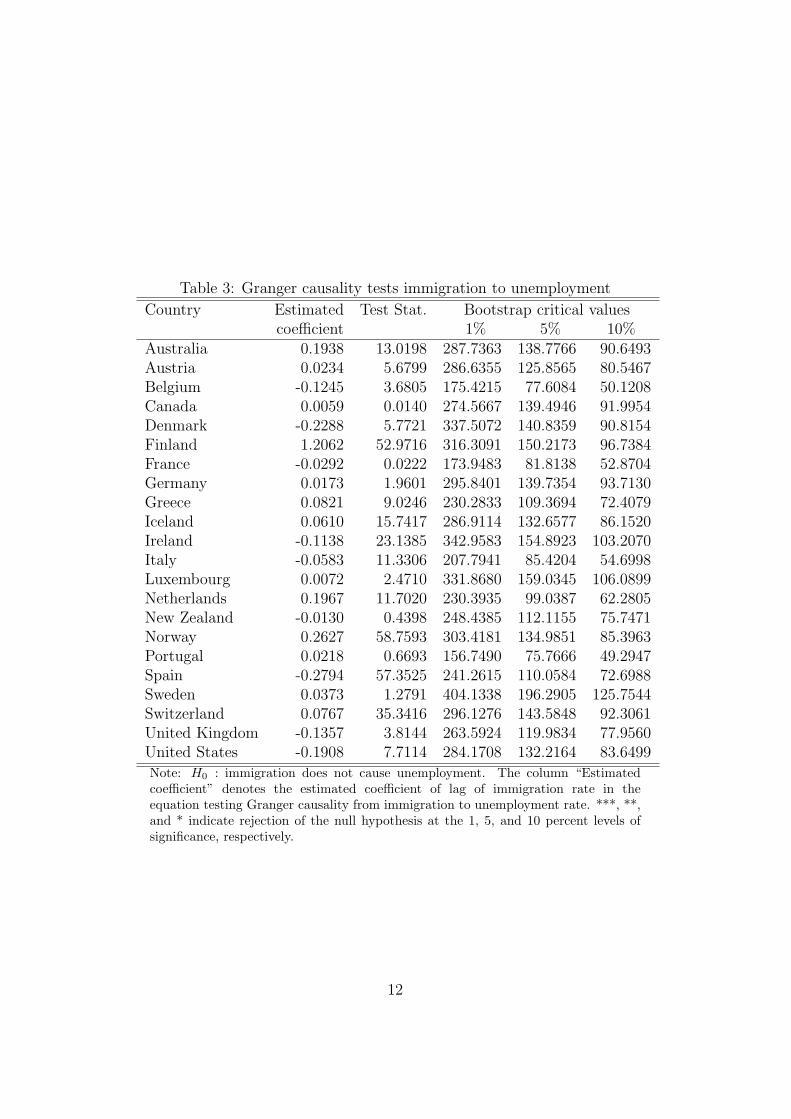
Table 3: Granger causality tests immigration to unemployment
Country Estimated Test Stat. Bootstrap critical valuescoefficient 1% 5% 10%
Australia 0.1938 13.0198 287.7363 138.7766 90.6493Austria 0.0234 5.6799 286.6355 125.8565 80.5467Belgium -0.1245 3.6805 175.4215 77.6084 50.1208Canada 0.0059 0.0140 274.5667 139.4946 91.9954Denmark -0.2288 5.7721 337.5072 140.8359 90.8154Finland 1.2062 52.9716 316.3091 150.2173 96.7384France -0.0292 0.0222 173.9483 81.8138 52.8704Germany 0.0173 1.9601 295.8401 139.7354 93.7130Greece 0.0821 9.0246 230.2833 109.3694 72.4079Iceland 0.0610 15.7417 286.9114 132.6577 86.1520Ireland -0.1138 23.1385 342.9583 154.8923 103.2070Italy -0.0583 11.3306 207.7941 85.4204 54.6998Luxembourg 0.0072 2.4710 331.8680 159.0345 106.0899Netherlands 0.1967 11.7020 230.3935 99.0387 62.2805New Zealand -0.0130 0.4398 248.4385 112.1155 75.7471Norway 0.2627 58.7593 303.4181 134.9851 85.3963Portugal 0.0218 0.6693 156.7490 75.7666 49.2947Spain -0.2794 57.3525 241.2615 110.0584 72.6988Sweden 0.0373 1.2791 404.1338 196.2905 125.7544Switzerland 0.0767 35.3416 296.1276 143.5848 92.3061United Kingdom -0.1357 3.8144 263.5924 119.9834 77.9560United States -0.1908 7.7114 284.1708 132.2164 83.6499
Note: H0 : immigration does not cause unemployment. The column “Estimatedcoefficient” denotes the estimated coefficient of lag of immigration rate in theequation testing Granger causality from immigration to unemployment rate. ***, **,and * indicate rejection of the null hypothesis at the 1, 5, and 10 percent levels ofsignificance, respectively.
12
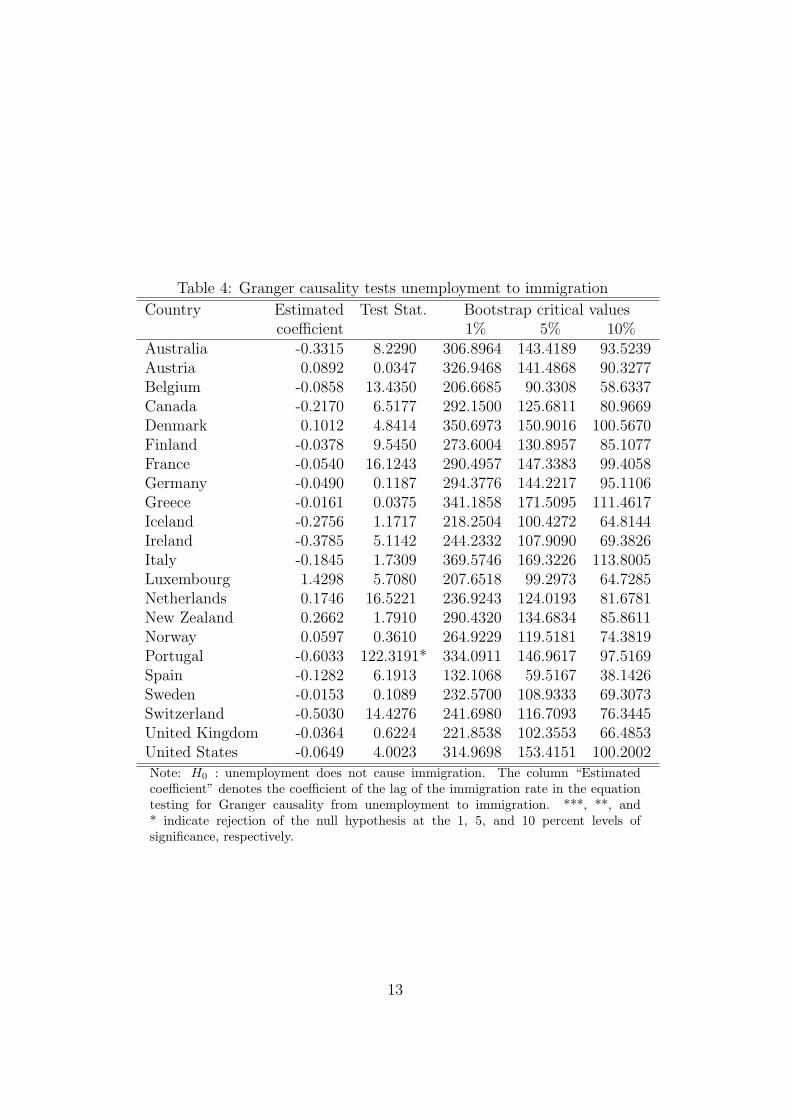
Table 4: Granger causality tests unemployment to immigration
Country Estimated Test Stat. Bootstrap critical valuescoefficient 1% 5% 10%
Australia -0.3315 8.2290 306.8964 143.4189 93.5239Austria 0.0892 0.0347 326.9468 141.4868 90.3277Belgium -0.0858 13.4350 206.6685 90.3308 58.6337Canada -0.2170 6.5177 292.1500 125.6811 80.9669Denmark 0.1012 4.8414 350.6973 150.9016 100.5670Finland -0.0378 9.5450 273.6004 130.8957 85.1077France -0.0540 16.1243 290.4957 147.3383 99.4058Germany -0.0490 0.1187 294.3776 144.2217 95.1106Greece -0.0161 0.0375 341.1858 171.5095 111.4617Iceland -0.2756 1.1717 218.2504 100.4272 64.8144Ireland -0.3785 5.1142 244.2332 107.9090 69.3826Italy -0.1845 1.7309 369.5746 169.3226 113.8005Luxembourg 1.4298 5.7080 207.6518 99.2973 64.7285Netherlands 0.1746 16.5221 236.9243 124.0193 81.6781New Zealand 0.2662 1.7910 290.4320 134.6834 85.8611Norway 0.0597 0.3610 264.9229 119.5181 74.3819Portugal -0.6033 122.3191* 334.0911 146.9617 97.5169Spain -0.1282 6.1913 132.1068 59.5167 38.1426Sweden -0.0153 0.1089 232.5700 108.9333 69.3073Switzerland -0.5030 14.4276 241.6980 116.7093 76.3445United Kingdom -0.0364 0.6224 221.8538 102.3553 66.4853United States -0.0649 4.0023 314.9698 153.4151 100.2002
Note: H0 : unemployment does not cause immigration. The column “Estimatedcoefficient” denotes the coefficient of the lag of the immigration rate in the equationtesting for Granger causality from unemployment to immigration. ***, **, and* indicate rejection of the null hypothesis at the 1, 5, and 10 percent levels ofsignificance, respectively.
13
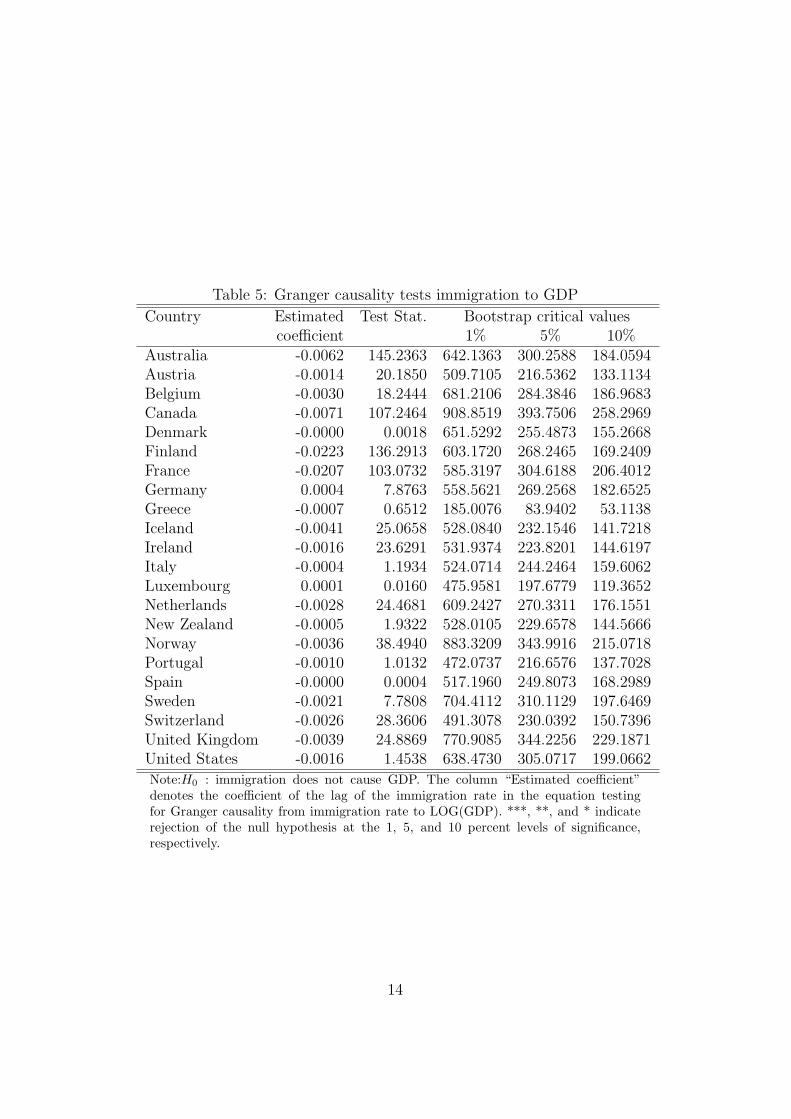
Table 5: Granger causality tests immigration to GDP
Country Estimated Test Stat. Bootstrap critical valuescoefficient 1% 5% 10%
Australia -0.0062 145.2363 642.1363 300.2588 184.0594Austria -0.0014 20.1850 509.7105 216.5362 133.1134Belgium -0.0030 18.2444 681.2106 284.3846 186.9683Canada -0.0071 107.2464 908.8519 393.7506 258.2969Denmark -0.0000 0.0018 651.5292 255.4873 155.2668Finland -0.0223 136.2913 603.1720 268.2465 169.2409France -0.0207 103.0732 585.3197 304.6188 206.4012Germany 0.0004 7.8763 558.5621 269.2568 182.6525Greece -0.0007 0.6512 185.0076 83.9402 53.1138Iceland -0.0041 25.0658 528.0840 232.1546 141.7218Ireland -0.0016 23.6291 531.9374 223.8201 144.6197Italy -0.0004 1.1934 524.0714 244.2464 159.6062Luxembourg 0.0001 0.0160 475.9581 197.6779 119.3652Netherlands -0.0028 24.4681 609.2427 270.3311 176.1551New Zealand -0.0005 1.9322 528.0105 229.6578 144.5666Norway -0.0036 38.4940 883.3209 343.9916 215.0718Portugal -0.0010 1.0132 472.0737 216.6576 137.7028Spain -0.0000 0.0004 517.1960 249.8073 168.2989Sweden -0.0021 7.7808 704.4112 310.1129 197.6469Switzerland -0.0026 28.3606 491.3078 230.0392 150.7396United Kingdom -0.0039 24.8869 770.9085 344.2256 229.1871United States -0.0016 1.4538 638.4730 305.0717 199.0662
Note:H0 : immigration does not cause GDP. The column “Estimated coefficient”denotes the coefficient of the lag of the immigration rate in the equation testingfor Granger causality from immigration rate to LOG(GDP). ***, **, and * indicaterejection of the null hypothesis at the 1, 5, and 10 percent levels of significance,respectively.
14
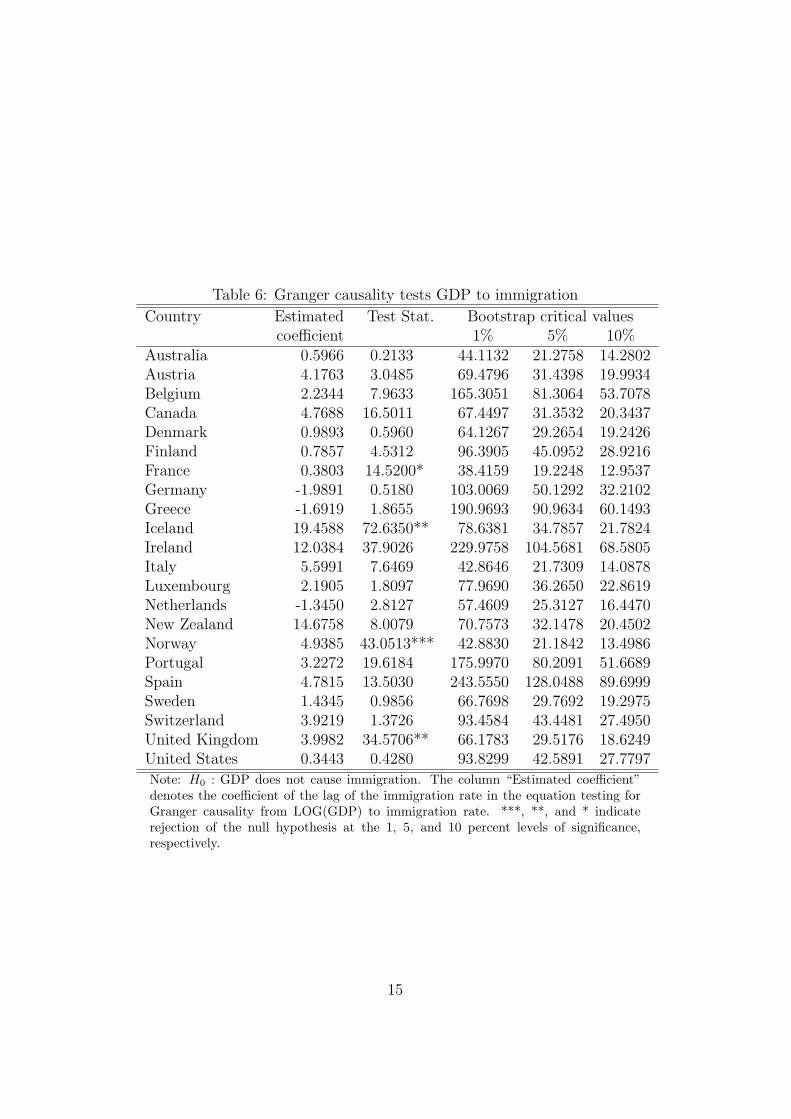
Table 6: Granger causality tests GDP to immigration
Country Estimated Test Stat. Bootstrap critical valuescoefficient 1% 5% 10%
Australia 0.5966 0.2133 44.1132 21.2758 14.2802Austria 4.1763 3.0485 69.4796 31.4398 19.9934Belgium 2.2344 7.9633 165.3051 81.3064 53.7078Canada 4.7688 16.5011 67.4497 31.3532 20.3437Denmark 0.9893 0.5960 64.1267 29.2654 19.2426Finland 0.7857 4.5312 96.3905 45.0952 28.9216France 0.3803 14.5200* 38.4159 19.2248 12.9537Germany -1.9891 0.5180 103.0069 50.1292 32.2102Greece -1.6919 1.8655 190.9693 90.9634 60.1493Iceland 19.4588 72.6350** 78.6381 34.7857 21.7824Ireland 12.0384 37.9026 229.9758 104.5681 68.5805Italy 5.5991 7.6469 42.8646 21.7309 14.0878Luxembourg 2.1905 1.8097 77.9690 36.2650 22.8619Netherlands -1.3450 2.8127 57.4609 25.3127 16.4470New Zealand 14.6758 8.0079 70.7573 32.1478 20.4502Norway 4.9385 43.0513*** 42.8830 21.1842 13.4986Portugal 3.2272 19.6184 175.9970 80.2091 51.6689Spain 4.7815 13.5030 243.5550 128.0488 89.6999Sweden 1.4345 0.9856 66.7698 29.7692 19.2975Switzerland 3.9219 1.3726 93.4584 43.4481 27.4950United Kingdom 3.9982 34.5706** 66.1783 29.5176 18.6249United States 0.3443 0.4280 93.8299 42.5891 27.7797
Note: H0 : GDP does not cause immigration. The column “Estimated coefficient”denotes the coefficient of the lag of the immigration rate in the equation testing forGranger causality from LOG(GDP) to immigration rate. ***, **, and * indicaterejection of the null hypothesis at the 1, 5, and 10 percent levels of significance,respectively.
15
The results in Table 3 show that, in any country, there is no causality fromimmigration to unemployment. Table 4 shows that, for only Portugal, thereis a significant (at the 10% level of significance) negative causality runningfrom unemployment to immigration, while for the other countries there is nosignificant causality running from unemployment to immigration.
The results in Table 5 suggest that, in any country, there is no significantcausality running from immigration to GDP. Table 6 shows that in fourcountries (France, Iceland, Norway and United Kingdom) there is a positivesignificant causality running from GDP to immigration; while in the othercountries there is no significant causality running from GDP to immigration.There is a positive causality running from GDP to immigration at 1 percentlevel of significance for Norway, 5 percent level of significance for Iceland andUnited Kingdom Norway and 10 percent level of significance for France.
Our study shows evidence that the interaction between immigration andhost economic activity depends on the host country that we consider. Ourfindings suggest that, only in Portugal, immigration inflow negatively re-sponds to unemployment, while in any country, unemployment does not re-spond to immigration inflow. Our results also find that, in four countries(France, Iceland, Norway and United Kingdom), immigration inflow posi-tively responds to economic growth, while in any country, economic growthdoes not respond to immigration inflow.
The fact that immigration does not impact host economic variables canbe explained by the evidence that the human capital content of migrationinflow is high in order to compensate the negative effects of immigration onoutput (Dolado et al., 1994). As a result there will be no negative impactof immigration on growth and employment. The findings from this papersupport the results from some previews studies (Simon et al., 1993; Doladoet al., 1994; Marr and Siklos, 1994; Pischke and Velling, 1997; Dustmann etal., 2005 Ortega and Peri (2009)).
The findings of causality from immigration to host economic variablescan be related to the characteristics of countries immigration policies. Forexample, the negative influence of unemployment on immigration in Por-tugal can be explained as follow. Portugal, a country with long history ofexpatiation, has become significant immigration country recently. Foremost,immigration flows to Portugal were mainly from its former colonies (Braziland Portuguese-Speaking African Countries (PALOP)). Since the 1990s, alarge proportion of “new” immigrants with economic reason come from Eu-rope and Asia. The needs of Portuguese employers play a significant role inthe recruitment process of the newly arrived immigrants. Accordingly, thePortuguese government adjusts its migration policy according to the require-ment of the labour market. Finally, immigrants, both Portuguese nationals
16
and foreign, are more likely to immigrate to a third European country whenthe labour market situation is less favorable.
For the four countries (France, Iceland, Norway and United Kingdom),the explanations of positive impact of growth on immigration are as follow.The positive influence of the economic growth on migration flows may berelated to the family reunification requirements. In France, family componentis the main channel of entry for long-term immigrants. In order to bring theirfamilies, immigrants have to satisfy a minimum level of income. During aperiod of higher growth, immigrants have great possibility to satisfy thisminimum level of income criteria. Moreover, economic migration to Francemainly includes immigrants from European countries (such as Portugal) thatare attracted by better economic prospects.
Norway and Iceland are two small countries with high incomes and highdemand for labour. So, the main attraction for immigrants to these two coun-tries is the high standard of living. A large percentage of labour immigrationis from Nordic neighbors and OECD countries. The booming economy andthe increased demand of labour in Norway and Island led authorities to admiteconomic immigrants during the last years.
Finally, the explanation of the result for the United-Kingdom can be ex-plained by the fact that the immigrants to the United Kingdom are moreattracted by the prospect of higher wages produced by the greater economicgrowth. In the United Kingdom, labour migration represents a sizable per-centage of total inflows (44 percent in 2005)7. If family members accompa-nying workers are taken into account, the percentage of economic migrationis around 60 percent in 2005. The inflow of labour migration increased from124 thousands on average per year in the 1980s to 200 thousands in the 1990s.From 2000 to 2005, the labour migration inflows reached 333 thousand peryear on average.
6 Concluding Remarks
This paper examines the causality between immigration and the economicconditions of host countries (unemployment and growth). We employ thepanel Granger causality testing approach recently developed by Konya (2006)that is based on SUR systems and Wald tests with country specific bootstrapcritical values. We use annual data over the period 1980-2005 for 22 OECDcountries which are the major migrants-recipients countries.
7The work category combines two IPS reasons for migration: “definite job” and “look-ing for work”. Authors’ calculation is based on Office for National Statistics (2008, 2009).
17
Our study provides evidence that the interaction between immigrationand host economic activity depends on the host country. On the one hand,our finding suggests that, only in Portugal, unemployment negatively Grangercauses immigration inflow, while in any country, immigration inflow does notGrange cause unemployment. On the other hand, our results find that, infour countries (France, Iceland, Norway and United Kingdom), economicgrowth positively Granger causes immigration inflow, while in any country,immigration inflow does not Granger cause economic growth.
Our results confirm that the levels of immigration tend to be highly reg-ulated (or migrants are selected contingent on theirs skills). Because of highskill of migrants, the human capital content of a migration inflow is high inorder to compensate the negative effects of immigration on economic growth(Dolado et al., 1994). As a result there will be no negative effect of immi-gration on host economic growth and employment.
In order to tackle the problem of aging population, many OECD coun-tries see immigration as a potential solution to compensate for the labourshortage. Our results indicate that immigration flows do not harm the em-ployment prospects of residents. Hence, OECD countries may receive moremigrants, without fearing about a potential negative impact on growth andemployment.
18
Appendix: The bootstrap procedure
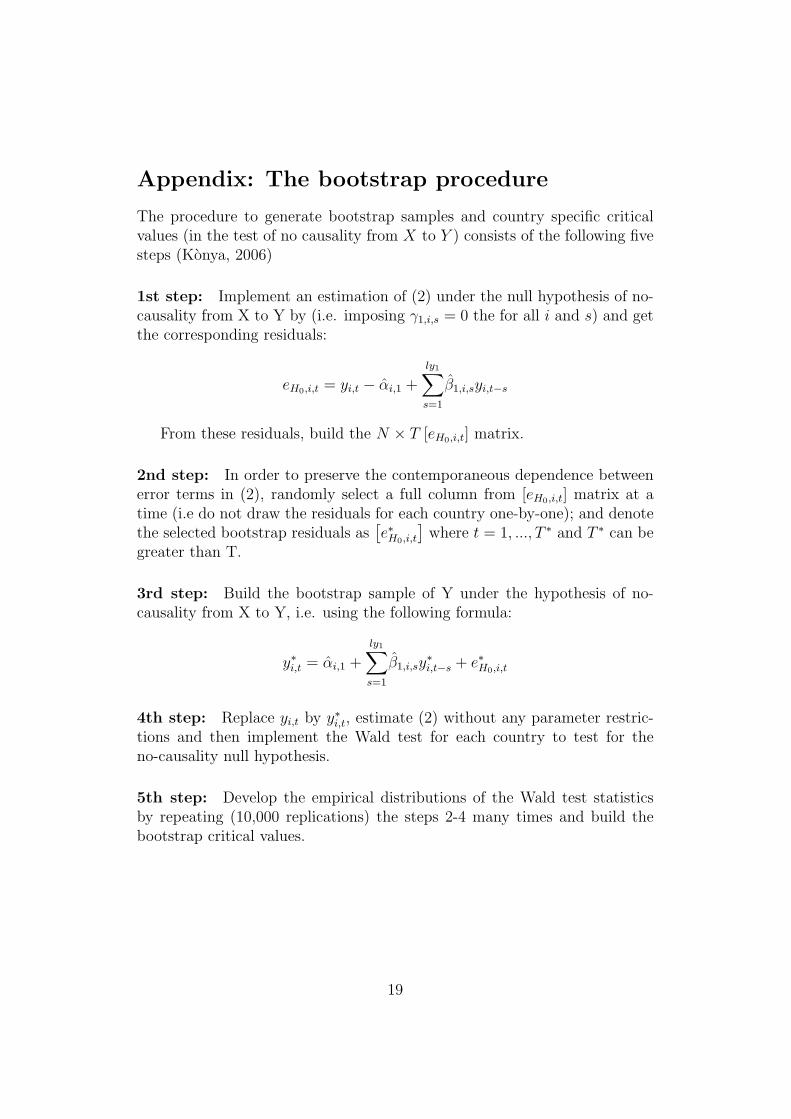
The procedure to generate bootstrap samples and country specific criticalvalues (in the test of no causality from X to Y ) consists of the following fivesteps (Konya, 2006)
1st step: Implement an estimation of (2) under the null hypothesis of no-causality from X to Y by (i.e. imposing γ1,i,s = 0 the for all i and s) and getthe corresponding residuals:
eH0,i,t = yi,t − αi,1 +
ly1∑
s=1
β1,i,syi,t−s
From these residuals, build the N × T [eH0,i,t] matrix.
2nd step: In order to preserve the contemporaneous dependence betweenerror terms in (2), randomly select a full column from [eH0,i,t] matrix at atime (i.e do not draw the residuals for each country one-by-one); and denotethe selected bootstrap residuals as
[
e∗H0,i,t
]
where t = 1, ..., T ∗ and T ∗ can begreater than T.
3rd step: Build the bootstrap sample of Y under the hypothesis of no-causality from X to Y, i.e. using the following formula:
y∗i,t = αi,1 +
ly1∑
s=1
β1,i,sy∗
i,t−s + e∗H0,i,t
4th step: Replace yi,t by y∗i,t, estimate (2) without any parameter restric-tions and then implement the Wald test for each country to test for theno-causality null hypothesis.
5th step: Develop the empirical distributions of the Wald test statisticsby repeating (10,000 replications) the steps 2-4 many times and build thebootstrap critical values.
19
References
Angrist, J.D. and A.D. Kugler. 2003. “Protective or counter-productive?Labour market institutions and the effect of immigration on EU natives?”Economic Journal, 113, 302-331.
Barro, R. and X. Sala-i-Martin. 1995. Economic Growth. McGraw-Hill. NewYork
Breusch, T. and A. Pagan. 1980. “The LM test and its applications to modelspecification in econometrics,” Review of Economic Studies, 47, 239-254.
Borjas, G. 1987. “Immigrants, minorities, and labor market competition,”Industrial and Labor Relations Review, 40, 382-392.
Card, D. 1990. “The impact of the Mariel boatlift on the Miami labor mar-ket,” Industrial and Labor Relations Review, 43, 245-257.
Card, D. 2001. “Immigrant inflows, native outflows and the local labor mar-ket impacts of higher immigration,” Journal of Labor Economics, 19, 22-64.
Dolado, J., A. Goria and A. Ichino. 1994. “Immigration, human capital andgrowth in the host country: evidence from pooled country Data,” Journalof Population Economics, 7, 193-215.
Dustmann, C., F. Fabbri and I. Preston. 2005. “The Impact of Immigrationon the British Labour Market,” The Economic Journal, 115, 324-341.
Greene, W.H., (2003). Econometric Analysis. 2nd ed. Prentice-Hall.
Greenwood, M.J and G.L Hunt. 1995. “Economic effects of immigrants onnative and foreign-born workers: Complementarity, substitutability, andother channels of influence,” Southern Economic Journal, 61, 1076-1097.
Grossman, J.B. 1982. “The Substitutability of Natives and Immigrants inProduction,” Review of Economics and Statistics, 64, 596-603.
Harris, J. and M. Todaro. 1970. “Migration, Unemployment and Develop-ment: A Two-sector Analysis,” American Economic Review, 60, 126-142.
Hunt, J. 1992. “The impact of the 1962 repatriates from Algeria on the Frenchlabor market,” Industrial and Labor Relations Review, 45, 556-572.
Hurlin, C. 2008. “Testing for Granger Non Causality in Heterogeneous Pan-els,” Mimeo, Department of Economics, University of Orleans.
Im, K., H. Pesaran and Y. Shin. 2003. “Testing for Unit Roots in Heteroge-neous Panels,” Journal of Econometrics, 115, 53-74.
Islam, A. (2007). “Immigration and Unemployment Relationship: Evidencefrom Canada,” Australian Economic Papers, 46, 52-66.
Jean, S. and M. Jimenez. 2007. “The Unemployment Impact of Immigrationin OECD Countries,” OECD Economics Department Working Paper, No.
20
563.
Johnson, G.E. 1980. “The labor market effects of immigration,” Industrialand Labor Relations Review, 33, 331-341.
Kar, M., S. Nazlogluc and H. Agr. 2010. “Financial development and eco-nomic growth nexus in the MENA countries: Bootstrap panel grangercausality analysis,” Economic Modelling, 28, 685-693.
Konya, L. 2006. “Exports and growth: Granger causality analysis on OECDCountries with a panel data approach,” Economic Modelling, 23, 978-992.
Marr, W. and P. Siklos. 1994. “The Link between Immigration and Unem-ployment in Canada,” Journal of Policy Modeling, 16, 1-26.
Morley, B. 2006. “Causality between economic growth and immigration: AnARDL bounds testing approach,” Economics Letters, 90, 72-76.
Office for National Statistics 2008. Long-term international migration esti-mates from the International Passenger Survey (IPS): 1975-1990.
———2009. Long-term international migration from International PassengerSurvey (IPS) tables: 1991-latest.
Okkerse, L. 2008. “How to measure labour market effects of immigration: Areview,” Journal of Economic Surveys, 22, 1-30.
Ortega, J. 2000. “Pareto Improving Immigration in an Economy with Equi-librium Unemployment,” The Economic Journal, 110, 92-112.
Ortega, F. and G. Peri. 2009. “The Causes and Effects of International Mi-grations: Evidence from OECD Countries 1980-2005,” NBER WorkingPaper No. 14833.
Pesaran, M.H. 2004. “General Diagnostic Tests for Cross Section Dependencein Panels,” CESifo Working Paper 1229; IZA Discussion Paper 1240.
Pesaran, M.H., Y. Shin and R.J. Smith. 1999. “Pooled Mean Group Estima-tion of Dynamic Heterogeneous Panels,” Journal of the American Statis-tical Association, 94, 621-634.
Pischke, J. and J. Velling. 1997. “Employment effects of immigration to Ger-many: an analysis based on local labor markets,” Review of Economicsand Statistics, 79, 594-604.
Phillips, P.C.B. 1995. “Fully modified least squares and vector autoregres-sion. Econometrica, 63, 1023-1078.
Pope, D. and Withers, G. 1985. “Immigration and Unemployment,” Eco-nomic Record, 61, 554-563.
Schmidt, M., A. Stilz and K. Zimmermann, 1994. “Mass migration, unions,and government intervention,” Journal of Public Economics, 55, 185-201.
21
Shan, J, A. Morris and F. Sun. 1999. “Immigration and Unemployment:New evidence from Australia and New Zealand,” International Review ofApplied Economics, 13, 253-258.
Simon, J.L., S. Moore and R. Sullivan. 1993. “The effect of immigration onaggregate native unemployment: an across-city estimation,” Journal ofLabor Research, 14, 299-316.
Zellner, A. 1962. “An efficient method of estimating seemingly unrelatedregressions and tests for aggregation bias,” Journal of the American Sta-tistical Association, 57, 348-368.
22