Embed Size (px)
Citation preview

Immunotherapy for Merkel Cell Cancer
Kelly Paulson, MD, PhD
Oncology Fellow, FHCRC/UW Combined Program Dr. Aude Chapuis Lab
WSMOS MeeGng 13 October 2017

Outline
• Merkel cell cancer: presentaGon, impact, pathogenesis • Adjuvant therapy: + radiaGon, -‐ chemotherapy, ADAM clinical trial • Monitoring for recurrence: serology assay • Advanced MCC: Checkpoint inhibitors in 1st line per 2018 NCCN • T cell therapies for MCC
• Current trials: endogenous T cell therapy • Sharing cures: transgenic T cell therapy
• QuesGons

Outline
• Merkel cell cancer: presenta.on, impact, pathogenesis • Adjuvant therapy: + radiaGon, -‐ chemotherapy, ADAM clinical trial • Monitoring for recurrence: serology assay • Advanced MCC: Checkpoint inhibitors in 1st line per 2018 NCCN • T cell therapies for MCC
• Current trials: endogenous T cell therapy • Sharing cures: transgenic T cell therapy
• QuesGons

Merkel cell carcinoma • Aggressive neuroendocrine skin cancer
• Typically presents as a red or purple, rapidly growing nodule1
• Incidence increased 3-‐10 fold in immunosuppressed populaGons, & outcomes worse in these populaGons2
• HOWEVER 90% of cases diagnosed in immunocompetent
Images: Paul Nghiem 1. Heath et al JAAD 2008 2. Paulson et al JID 2013

MCC Incidence Increasing: 2500 cases/year in USA
2000 2005 2010100
150
200
Year
Case
s Re
porte
d to
SEE
R-18
(%
cas
es in
yea
r 200
0)
MCC
All Solid Tumors
Melanoma
B.
+15%
+57%
+95%
SEER database

MCC incidence will conCnue to grow as baby boomers age in to MCC risk groups
20-24
25-29
30-34
35-39
40-44
45-49
50-54
55-59
60-64
65-69
70-74
75-79
80-84 85
+0
2
4
6
8
10
Age at Diagnosis (Years)
US A
nnua
l Inc
iden
ce R
ate
(Sex
Adj
uste
d)
Melanoma(per 6.7K)
MCC(per 100K)
A.
Baby boomers 2015
Baby boomers 2025
2000 2005 2010 2015 2020 20250
1000
2000
3000
4000
Year
MCC
Incid
ence
in U
S (#
Cas
es)
Calculated from Observed SEER-18 Incidence RatesProjected based on US Census Data
B.
Paulson et al, JAAD, in revision

MCC risk factors
• Age • Male sex • UV exposure • Immune suppression • Merkel cell polyomavirus – 80% of cases
Feng et al – Science 2008
Discovered in 2008 by Patrick Moore and Yuan Chang at U. Pia (who also discovered KSHV)

MCPyV – a common virus that breaks in a rare and special way to cause MCC
Virus associated MCCs are addicted to oncoprotein
expression
The virus in MCC tumors is broken and no longer
contagious

MCC Staging: Stage IIIB “unknown primary”
• Up to 50% of paGents presenGng with stage IIIB (palpable nodal, no distant) MCC have no idenGfiable skin primary
• These paGents are thought to have had an immune response leading to regression of a small skin primary
• Consistent with this, outcomes are beaer in this group
Chen et al, Am J Surgery 2013

Outline
• Merkel cell cancer: presentaGon, impact, pathogenesis • Adjuvant therapy: + radia.on, -‐ chemotherapy, ADAM clinical trial • Monitoring for recurrence: serology assay • Advanced MCC: Checkpoint inhibitors in 1st line per 2018 NCCN • T cell therapies for MCC
• Current trials: endogenous T cell therapy • Sharing cures: transgenic T cell therapy
• QuesGons

Risk of MCC recurrence is high! This is true even for early stage disease….
Nghiem et al, merkelcell.org Paul Nghiem, MD

Adjuvant radiaCon typically indicated: improved RFS and OS
BhaGa S et al, JNCI, 2016
*non-‐randomized data – randomized studies unlikely to be performed due to clear local control benefit

Adjuvant chemotherapy does not help and may hurt
• No clear survival benefit in any of the studies that have looked at adjuvant chemotherapy for MCC, even when straGfying to stage III disease (eg. BhaGa S et al, JNCI 2016)
• Based on emerging data, chemotherapy may reduce responsiveness to subsequent immunotherapy should recurrence develop….

Adjuvant immunotherapy is being tested
• ADAM trial: • Stage IIIB (palpable nodal) disease, within 4 months of surgical excision • +/-‐ radiaGon therapy OK • 100 paGents, randomized 1:1 placebo vs. avelumab (PD-‐L1 blockade)
• 2 years treatment -‐> 3 years follow-‐up • 14 US sites, being led by SCCA • Opens soon – we appreciate your kind referral of potenGally eligible stage IIIB paGents as we try to accrue for this rare disease!
Shailender BhaGa, MD

Outline
• Merkel cell cancer: presentaGon, impact, pathogenesis • Adjuvant therapy: + radiaGon, -‐ chemotherapy, ADAM clinical trial • Monitoring for recurrence: serology assay • Advanced MCC: Checkpoint inhibitors in 1st line per 2018 NCCN • T cell therapies for MCC
• Current trials: endogenous T cell therapy • Sharing cures: transgenic T cell therapy
• QuesGons
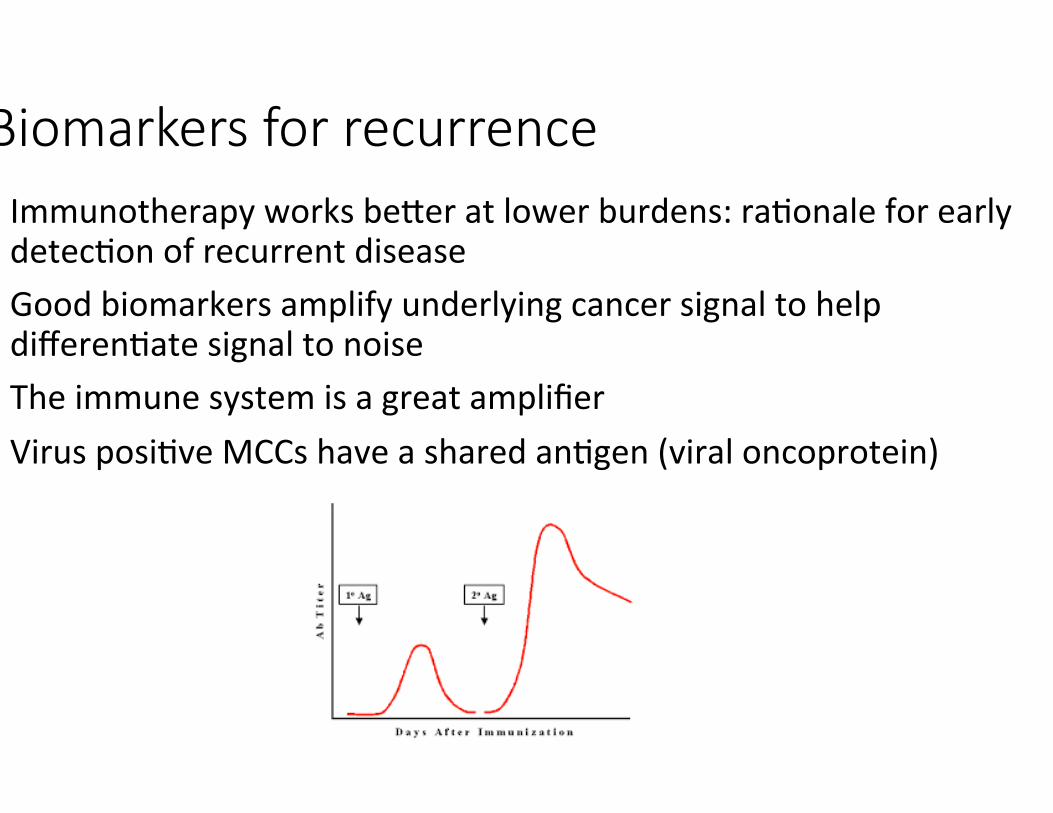
Biomarkers for recurrence • Immunotherapy works beaer at lower burdens: raGonale for early detecGon of recurrent disease
• Good biomarkers amplify underlying cancer signal to help differenGate signal to noise
• The immune system is a great amplifier • Virus posiGve MCCs have a shared anGgen (viral oncoprotein)

Serologic assay for MCC (“AMERK”) • At presentaGon, ~50% of paGents have circulaGng anGbodies to Merkel cell polyomavirus oncoproteins (T AnGgens)
• <1% of healthy individuals have these anGbodies
• SeronegaGve paGents have a high recurrence risk • Mixed group of virus negaGve paGents and poor immune response to MCC paGents
• For seroposiGve paGents, serial anGbody Gters can be used to detect recurrence
Paulson, Carter et al, Cancer Res 2010 Paulson et al, Cancer, 2017
Denise Galloway, PhD

Example paCents
NED
Recurrence

AMERK is clinically available (UW labmed) & listed as an opCon in 2018 NCCN guideline • If tesGng:
• Check iniGal level within 90 days of diagnosis – levels fall fast • Only check serial levels if iniGally seroposiGve • Validated only for detecGon of first recurrence, not for monitoring response to immunotherapy or detecGng subsequent recurrences
Conflict of interest statement: I was involved in the development of this assay. I have no personal financial interest in this assay.
Ordering: hMp://www.merkelcell.org/sero

Outline
• Merkel cell cancer: presentaGon, impact, pathogenesis • Adjuvant therapy: + radiaGon, -‐ chemotherapy, ADAM clinical trial • Monitoring for recurrence: serology assay • Advanced MCC: Checkpoint inhibitors in 1st line per 2018 NCCN • T cell therapies for MCC
• Current trials: endogenous T cell therapy • Sharing cures: transgenic T cell therapy
• QuesGons

Durability of chemotherapy response historically poor: addiConal treatment opCons needed
Iyer et al 2016

All MCC is immunogenic
• 80% (MCPyV+): Addicted to immunogenic viral oncoproteins • 20% (MCPyV-‐): Higher mutaGonal burden than any cancer type in TCGA (Goh et al, 2016)
MCC outcome, whereas peritumoral lymphocytes are not. This is alsotrue for other cancers, such as ovarian cancer and colon cancer.27,34
Second, immunohistochemical CD8! evaluation may be more sen-sitive and specific for identification of TILs than routine histology.This is because T cells can sometimes be indistinguishable from MCCtumor cells using hematoxylin and eosin staining.
This study has several limitations despite the fact that it is both thelargest molecular and immunohistochemical examination of MCCyet reported, to our knowledge. The median age of the patient popu-lation (66 years) was younger than that for MCC nationally (76years).3,11 This may in part reflect the fact that patients in this cohortwere ascertained because they sought specialty care or information/
A
C
B
0 1 2 3 4 5 6 7 8 9 10
TILs present (n = 86)* TILs absent (n = 44)M
CC-S
peci
fic S
urvi
val (
%)
Time Since Diagnosis (years)
25
50
75
100
0 1 2 3 4 5 6 7 8 9 10
MCC
-Spe
cific
Sur
viva
l (%
)
Time Since Diagnosis (years)
Local Regional Metastatic
25
50
75
100
0 1 2 3 4 5 6 7 8 9 10
MCC
-Spe
cific
Sur
viva
l (%
)
Time Since Diagnosis (years)
25
50
75
100
0 1 2 3 4 5 6 7 8 9 10
MCC
-Spe
cific
Sur
viva
l (%
)
Time Since Diagnosis (years)
25
50
75
100
0 1 2 3 4 5 6 7 8 9 10
MCC
-Spe
cific
Sur
viva
l (%
)
Time Since Diagnosis (years)
25
50
75
100
CD8+ brisk (IT, n = 26)†
CD8+ sparse (IT, n = 120)
CD8+ brisk (IT, n = 18)CD8+ sparse (IT, n = 60)
CD8+ brisk (IT, n = 6)CD8+ sparse (IT, n = 54)
CD8+ brisk (IT, n = 1)CD8+ sparse (IT, n = 5)
Fig 3. T-cell infiltration and Merkel cell carcinoma (MCC)–specific survival in an independent set of 146 patients. (A) Tumor infiltrating lymphocytes (TILs) analysis byroutine histology among 129 patients. (*) TILs were prognostically significant on univariate (P " .03) but not multivariate (P " .12) analysis. (B) Intratumoral (IT) CD8!lymphocyte infiltration. Brisk CD8s were defined as an intratumoral CD8 score of 3 to 5 (corresponding to approximately 60 or more CD8s per typical 40# high powerfield), sparse as 0 to 2. (†) IT CD8 infiltration was a statistically significant predictor of outcome on univariate (P $ .01) and multivariate (P " .01) regression analyses(Table 3). (C) Subgroup breakdown of (B), by extent of disease at presentation (as indicated). Extent of disease at presentation was not known for two patients.Statistical analysis was not performed on subgroups; instead, multivariate Cox regression is listed in Table 3.
Table 3. Multivariate Cox Regression Analysis Demonstrates Intratumoral CD8 Score Is an Independent Predictor of Merkel Cell Carcinoma Outcome
Characteristic
Univariate Multivariate
HR 95% CI P HR 95% CI P
StageII v I 0.8 0.1 to 5.0 .86 1.1 0.2 to 6.6 .92III v I 6.5 1.9 to 22.6 $ .01 5.5 1.4 to 21.2 .02IV v I 18.8 3.4 to 104.5 $ .01 31.5 6.8 to 147.0 $ .01
Female sex 0.4 0.1 to 1.0 .06 0.6 0.2 to 1.7 .31Age at diagnosis ! 65 years 1.1 0.5 to 2.3 .87 0.8 0.4 to 1.8 .62CD8, per increase on 0 to 5 scale
Peritumoral 0.8 0.6 to 1.0 .06 0.9 0.6 to 1.4 .79Intratumoral 0.5 0.5 to 0.7 $ .01 0.5 0.3 to 0.9 .01
NOTE. CD8! scoring scale is described in Methods and in the scoring guide provided as a Data Supplement. All variables listed in this table were included in themultivariate analysis.
Abbreviation: HR, hazard ratio.
Paulson et al
1544 © 2011 by American Society of Clinical Oncology JOURNAL OF CLINICAL ONCOLOGY
Downloaded from ascopubs.org by Fred Hutchinson Cancer Research Center on August 9, 2017 from 140.107.061.185Copyright © 2017 American Society of Clinical Oncology. All rights reserved.
Brisk intratumoral T cell response
Sparse intratumoral T cell response
Paulson et al, JCO 2011

Checkpoint inhibitors are effecCve in advanced MCC • Pembrolizumab (1st line)
• PD-‐1 inhibitor, q3 weeks, under FDA review for this indicaGon
• RR 56%
• Avelumab (2nd line) • PD-‐L1 inhibitor, FDA-‐indicated , q2 weeks
• RR 32%
Nghiem et al NEJM 2016
Kaufman et al Lancet Oncol 2016

ToxiciCes of checkpoint inhibitors are similar in MCC as to other cancers: faCgue, iRAEs including rare severe autoimmune reacCons

Checkpoint inhibitors are now first line in 2018 NCCN guideline
NCCN.org
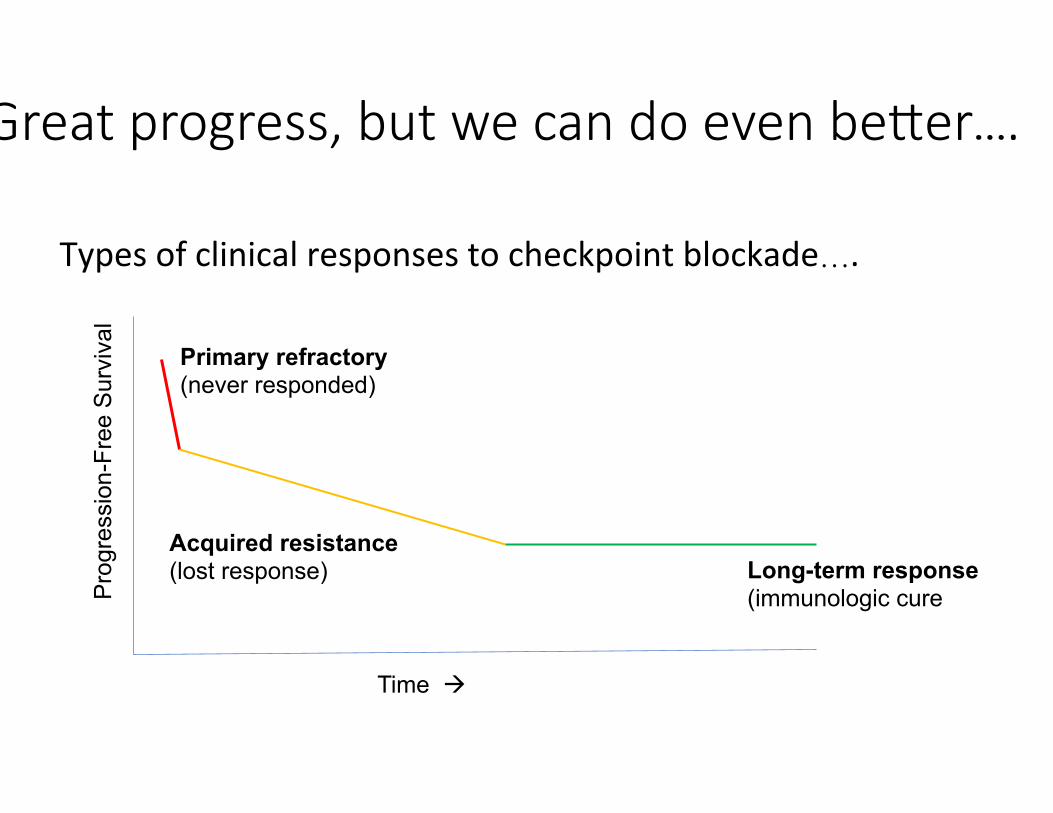
Great progress, but we can do even beaer….
Time à
Pro
gres
sion
-Fre
e S
urvi
val
Primary refractory (never responded)
Acquired resistance (lost response) Long-term response
(immunologic cure
Types of clinical responses to checkpoint blockade….

Reprising a previous slide
Poor T cell infiltrate (n=120)
Strong T cell infiltrate (n=26)
no T cells
T cells at edge
MCC outcome, whereas peritumoral lymphocytes are not. This is alsotrue for other cancers, such as ovarian cancer and colon cancer.27,34
Second, immunohistochemical CD8! evaluation may be more sen-sitive and specific for identification of TILs than routine histology.This is because T cells can sometimes be indistinguishable from MCCtumor cells using hematoxylin and eosin staining.
This study has several limitations despite the fact that it is both thelargest molecular and immunohistochemical examination of MCCyet reported, to our knowledge. The median age of the patient popu-lation (66 years) was younger than that for MCC nationally (76years).3,11 This may in part reflect the fact that patients in this cohortwere ascertained because they sought specialty care or information/
A
C
B
0 1 2 3 4 5 6 7 8 9 10
TILs present (n = 86)* TILs absent (n = 44)M
CC-S
peci
fic S
urvi
val (
%)
Time Since Diagnosis (years)
25
50
75
100
0 1 2 3 4 5 6 7 8 9 10
MCC
-Spe
cific
Sur
viva
l (%
)
Time Since Diagnosis (years)
Local Regional Metastatic
25
50
75
100
0 1 2 3 4 5 6 7 8 9 10
MCC
-Spe
cific
Sur
viva
l (%
)
Time Since Diagnosis (years)
25
50
75
100
0 1 2 3 4 5 6 7 8 9 10
MCC
-Spe
cific
Sur
viva
l (%
)
Time Since Diagnosis (years)
25
50
75
100
0 1 2 3 4 5 6 7 8 9 10
MCC
-Spe
cific
Sur
viva
l (%
)
Time Since Diagnosis (years)
25
50
75
100
CD8+ brisk (IT, n = 26)†
CD8+ sparse (IT, n = 120)
CD8+ brisk (IT, n = 18)CD8+ sparse (IT, n = 60)
CD8+ brisk (IT, n = 6)CD8+ sparse (IT, n = 54)
CD8+ brisk (IT, n = 1)CD8+ sparse (IT, n = 5)
Fig 3. T-cell infiltration and Merkel cell carcinoma (MCC)–specific survival in an independent set of 146 patients. (A) Tumor infiltrating lymphocytes (TILs) analysis byroutine histology among 129 patients. (*) TILs were prognostically significant on univariate (P " .03) but not multivariate (P " .12) analysis. (B) Intratumoral (IT) CD8!lymphocyte infiltration. Brisk CD8s were defined as an intratumoral CD8 score of 3 to 5 (corresponding to approximately 60 or more CD8s per typical 40# high powerfield), sparse as 0 to 2. (†) IT CD8 infiltration was a statistically significant predictor of outcome on univariate (P $ .01) and multivariate (P " .01) regression analyses(Table 3). (C) Subgroup breakdown of (B), by extent of disease at presentation (as indicated). Extent of disease at presentation was not known for two patients.Statistical analysis was not performed on subgroups; instead, multivariate Cox regression is listed in Table 3.
Table 3. Multivariate Cox Regression Analysis Demonstrates Intratumoral CD8 Score Is an Independent Predictor of Merkel Cell Carcinoma Outcome
Characteristic
Univariate Multivariate
HR 95% CI P HR 95% CI P
StageII v I 0.8 0.1 to 5.0 .86 1.1 0.2 to 6.6 .92III v I 6.5 1.9 to 22.6 $ .01 5.5 1.4 to 21.2 .02IV v I 18.8 3.4 to 104.5 $ .01 31.5 6.8 to 147.0 $ .01
Female sex 0.4 0.1 to 1.0 .06 0.6 0.2 to 1.7 .31Age at diagnosis ! 65 years 1.1 0.5 to 2.3 .87 0.8 0.4 to 1.8 .62CD8, per increase on 0 to 5 scale
Peritumoral 0.8 0.6 to 1.0 .06 0.9 0.6 to 1.4 .79Intratumoral 0.5 0.5 to 0.7 $ .01 0.5 0.3 to 0.9 .01
NOTE. CD8! scoring scale is described in Methods and in the scoring guide provided as a Data Supplement. All variables listed in this table were included in themultivariate analysis.
Abbreviation: HR, hazard ratio.
Paulson et al
1544 © 2011 by American Society of Clinical Oncology JOURNAL OF CLINICAL ONCOLOGY
Downloaded from ascopubs.org by Fred Hutchinson Cancer Research Center on August 9, 2017 from 140.107.061.185Copyright © 2017 American Society of Clinical Oncology. All rights reserved.
These individuals never need
immunotherapy
These individuals o3en respond to
checkpoint blockade
These individuals typically do not respond to checkpoint
blockade (primary refractory)

Outline
• Merkel cell cancer: presentaGon, impact, pathogenesis • Adjuvant therapy: + radiaGon, -‐ chemotherapy, ADAM clinical trial • Monitoring for recurrence: serology assay • Advanced MCC: Checkpoint inhibitors in 1st line per 2018 NCCN • T cell therapies for MCC
• Current trials: endogenous T cell therapy • Sharing cures: transgenic T cell therapy
• QuesGons
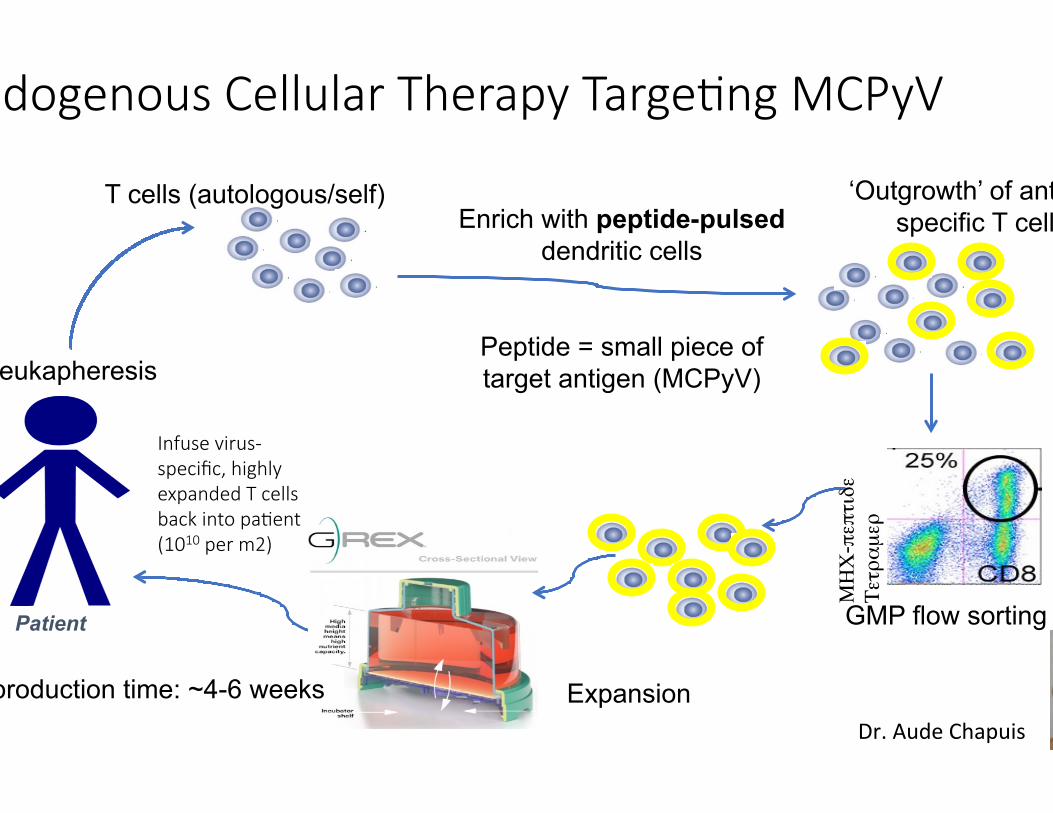
Endogenous Cellular Therapy TargeCng MCPyV
Patient
Leukapheresis
Enrich with peptide-pulsed dendritic cells
Peptide = small piece of target antigen (MCPyV)
Total production time: ~4-6 weeks
T cells (autologous/self) ‘Outgrowth’ of antigen-specific T cells
GMP flow sorting
Expansion Dr. Aude Chapuis
ΜΗΧ-πεπτιδε
Τετραµερ
Infuse virus-‐specific, highly expanded T cells back into paCent (1010 per m2)

How CD8+ T cells (“cytotoxic T lymphocytes”) work
(CTL)
(HLA)
i.e. T-‐cell receptor
Signal 1 = Trigger
Signal 2 = Safety
Target T cell PDL1 PD1
OFF – NO KILLING
Target T cell PD1
ON – KILLING

CombinaCon immunotherapy for advanced MCC
(CTL)
(HLA)
i.e. T-‐cell receptor
Signal 1 = Trigger
Signal 2 = Safety
Target T cell PDL1 PD1
OFF – NO KILLING
Our current T cell therapy trials have three parts (triple therapy): 1) CD8+ T cells (virus specific) 2) Class I MHC upregulaGon 3) Checkpoint inhibiGon

Infused T cells Persist and Function
Grey lines: with PD1 axis blockade Black lines: without PD1 axis blockade

Infused MCPyV T cells preferenCally localize to tumor
0
5
10Nu
mbe
r Inf
used
TC
R Cl
ones
Det
ecta
ble
Number of Infused Top 20 Clones Detectable
Peripheral BloodMCC Tumor Tissue
Pre-Treatment <1 month ~6 months post Post-Treatment Treatment (in CR)
2
0 01
5
90.001
0.01
0.1
1
Perce
nt TC
R Se
quen
ces
Corre
spon
ding t
o Top
20
Infus
ed S
eque
nces
Percent TCR Sequences Corresponding to Infused Product
Peripheral BloodMCC Tumor Tissue
Pre-Treatment <1 month ~6 months post Post-Treatment Treatment (in CR)
Tumor burden: +++ ++ 0
# detected infused clonotypes
% detected infused clonotypes 1
2
34567891011121314151617181920Remainder
Infusion product

Infused T cells trigger epitope spreading
34
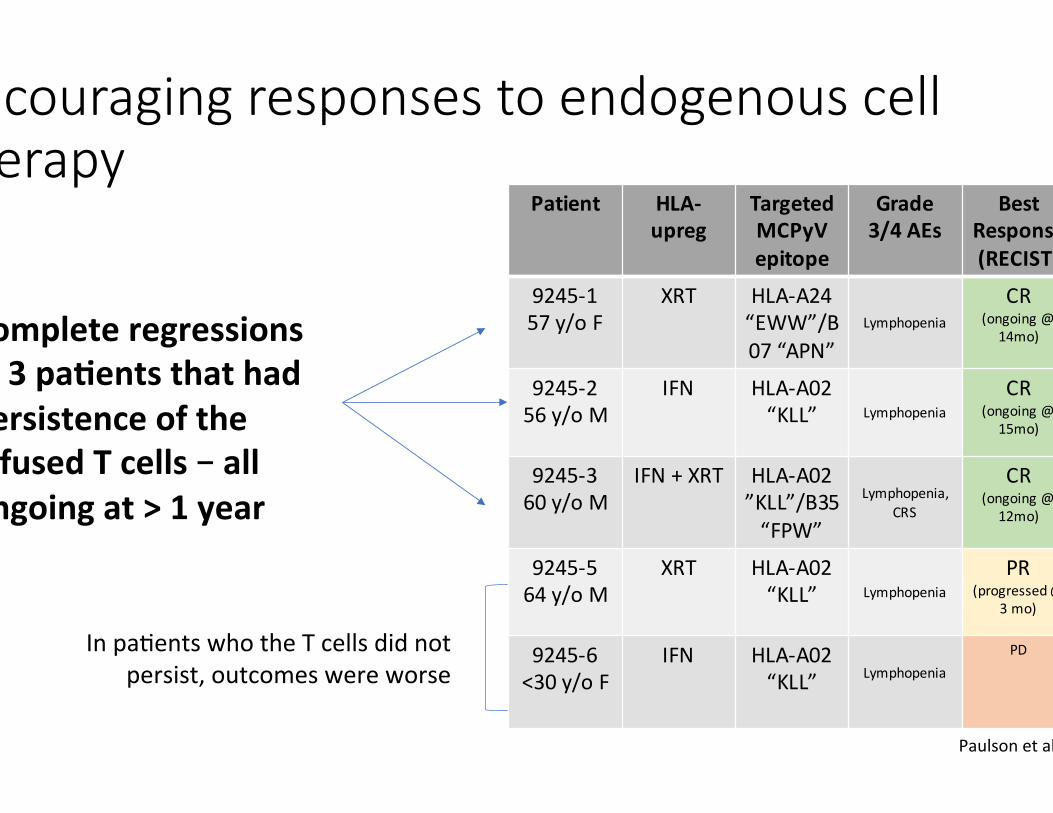
Patient HLA-upreg
TargetedMCPyVepitope
Grade3/4AEs
BestResponse(RECIST)
9245-157y/oF
XRT HLA-A24“EWW”/B07 “APN”
Lymphopenia
CR(ongoing@
14mo)
9245-256y/oM
IFN HLA-A02“KLL” Lymphopenia
CR(ongoing@
15mo)
9245-360y/oM
IFN+XRT HLA-A02”KLL”/B35“FPW”
Lymphopenia,CRS
CR(ongoing@
12mo)
9245-564 y/oM
XRT HLA-A02“KLL” Lymphopenia
PR(progressed@
3mo)
9245-6<30y/o F
IFN HLA-A02“KLL” Lymphopenia
PD
Encouraging responses to endogenous cell therapy
Complete regressions in 3 pa.ents that had persistence of the infused T cells – all ongoing at > 1 year
In paGents who the T cells did not persist, outcomes were worse
Paulson et al, ASCO 2017
Now 21 mo
Now 21 mo
Now 18 mo

Responses by iRRC
1 2 3 4 5 6 7 8 9 10 11 12
-100-75-50-25
0255075
Time from Treatment Initiation(Months)
Chan
ge in
Tu
mor
Bur
den
(%)
9245-19245-29245-39245-49245-59245-6
Response in Tumor Burden (irRC)
Closed Symbols=Received T cells
Stable Disease
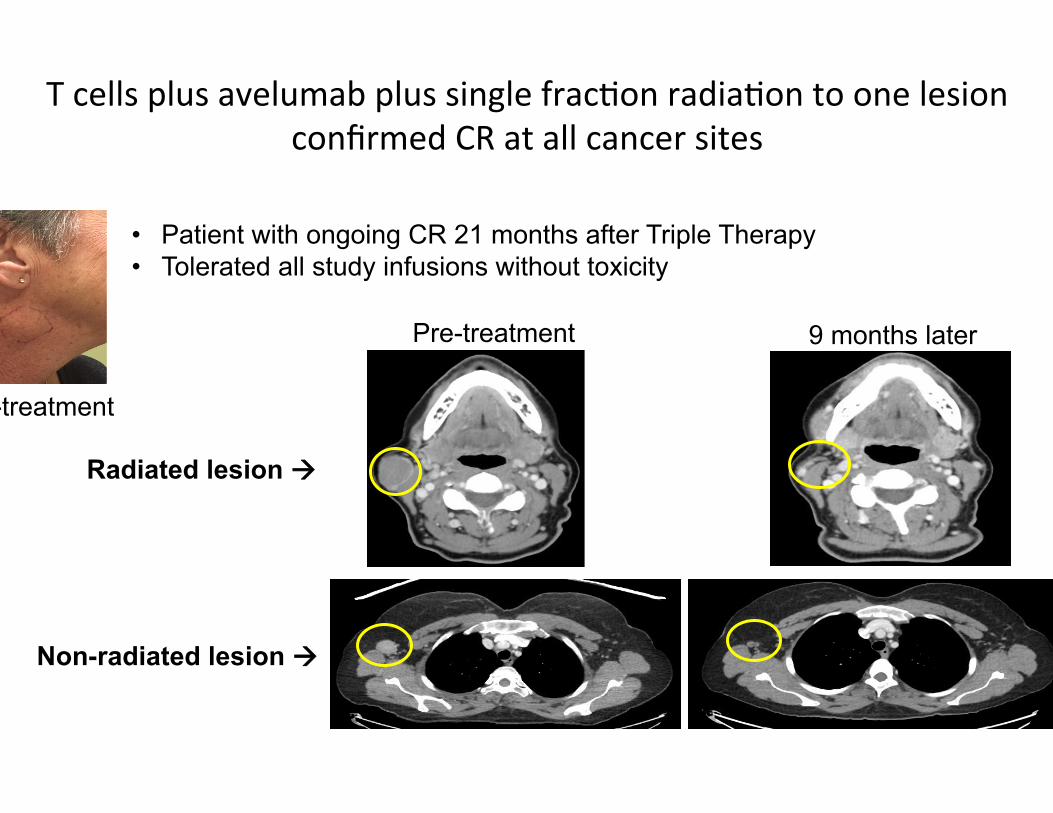
Pre-treatment
Pre-treatment 9 months later
Radiated lesion à
• Patient with ongoing CR 21 months after Triple Therapy • Tolerated all study infusions without toxicity
Non-radiated lesion à
T cells plus avelumab plus single fracGon radiaGon to one lesion confirmed CR at all cancer sites

LimitaCons of endogenous cell therapy
• Slow • Expensive • Difficult to deliver intended doses…. • Dependent on the paGent’s underlying immune response
• PaGent may have poor avidity or absence of underlying T cell responses

Transgenic T cell Therapy
Patient
Leukapheresis
Total production time: ~3 weeks
T cells (autologous/self)
GMP flow sorting
Non-specific expansion
TCR transduce (lentivirus)
TCR
Dr. Aude Chapuis

What TCR do you want? Sharing Cures
0
5
10
Num
ber I
nfus
ed
TCR
Clon
es D
etec
table
Number of Infused Top 20 Clones Detectable
Peripheral BloodMCC Tumor Tissue
Pre-Treatment <1 month ~6 months post Post-Treatment Treatment (in CR)
2
0 01
5
90.001
0.01
0.1
1
Perce
nt TC
R Se
quen
ces
Corre
spon
ding t
o Top
20
Infus
ed S
eque
nces
Percent TCR Sequences Corresponding to Infused Product
Peripheral BloodMCC Tumor Tissue
Pre-Treatment <1 month ~6 months post Post-Treatment Treatment (in CR)
Tumor burden: +++ ++ 0
# detected infused clonotypes
% detected infused clonotypes 1
2
34567891011121314151617181920Remainder
Infusion product
PaCent 9245-‐3 In pathologic CR 18
months aker therapy start

Problem: TCR alpha and beta on different chromosomes SoluCon: Single Cell RNA sequencing
Gel bead emulsions made on the bench top in a toaster sized machine

ATTACk-‐MCC Regimen: In development, anCcipaCng enrollment in 2018
• 16 paGents over 2 years • Autologous • Transgenic T cells • Avelumab • Class I MHC upregulaGon

Dr. Aude Chapuis Fred Hutch Dr Megan McAfee Dr Maurizio Perdicchio Felecia Wagener Daniel Hunter Marcus Lindberg Dr Paul Nghiem Fred Hutch/UW Dr Jayasri Iyer Natalie Vandeven Dr Candice Church Dr Rima Kulikauskas Dr Aric Colunga Hannah Thomas Dr Shailender Bhatia UW
Thank you!!!! Dr Jason Bielas Fred Hutch BJ Valente Dr Raphael Gottardo Fred Hutch Dr Valentin Voillet Dr Cassian Yee MD Anderson Dr Philip Greenberg Fred Hutch/UW 9245: EMD Serono Zhen Su MD, PhD Kevin Chin MD
Patients and their families Funding: NIH Bezos Family Foundation FHCRC EMD Serono (9245) MCC Gift Fund at University of Washington WSMOS
Dr Robert Pierce FHCRC Jean Campbell Kimberly Smythe Kim Melton FHCRC Genomics Core Andy Marty, PhD Dr. David Koelle Clinical Team Kieu-Thu Bui Judy Delismon Cari Morin Susan Lemmon Ana Radu Melanoma/Renal RNs Skin Oncology RNs