Embed Size (px)
Citation preview

HAL Id: tel-03137632https://tel.archives-ouvertes.fr/tel-03137632
Submitted on 10 Feb 2021
HAL is a multi-disciplinary open accessarchive for the deposit and dissemination of sci-entific research documents, whether they are pub-lished or not. The documents may come fromteaching and research institutions in France orabroad, or from public or private research centers.
L’archive ouverte pluridisciplinaire HAL, estdestinée au dépôt et à la diffusion de documentsscientifiques de niveau recherche, publiés ou non,émanant des établissements d’enseignement et derecherche français ou étrangers, des laboratoirespublics ou privés.
Impact of aging on the behaviour of wild band gappower transistors, application to the efficiency of
DC-DC convertersAl Mehdi Bouchour
To cite this version:Al Mehdi Bouchour. Impact of aging on the behaviour of wild band gap power transistors, applicationto the efficiency of DC-DC converters. Electronics. Normandie Université; Université AbdelmalekEssaâdi (Tétouan, Maroc), 2020. English. NNT : 2020NORMR045. tel-03137632

1
Thèse soutenue publiquement le 01/12/2020 devant le jury composé de
M. Zoubir KHATIR Directeur de recherche IFSTTAR, France Rapporteur M. Jamal ZBITOU Professeur, Université Hassan Premier, Faculté des
Sciences et Techniques de Settat, Maroc Rapporteur
M. Abdeljabbar CHERKAOUI Professeur, Université Abdelmalek Essaadi, ENSA de Tanger, Maroc
Rapporteur
M. Yassin LAAZIZ Professeur de l’enseignement supérieure, Université Abdelmalek Essaadi, ENSA de Tanger, Maroc
Examinateur
Mme. Mounira BERKANI Maître de conférences à l'Université Paris Est Créteil UPEC, ESPE de l'académie de Créteil, France
Examinateur
M. Olivier LATRY Professeur, GPM, Université de Rouen Normandie, France Directeur France M. Ahmed EL OUALKADI Professeur de l’enseignement supérieure, Université
Abdelmalek Essaadi, ENSA de Tanger, Maroc Directeur Maroc
M. Pascal DHERBECOURT Maitre de conférences - HDR, Université de Rouen Normandie, France
Co-directeur France
THESE EN CO-TUTELLE INTERNATIONALE
Pour obtenir le diplôme de doctorat
Spécialité Génie électrique, électronique, photonique et systèmes
Préparée au sein de Université de Rouen Normandie
et de Université de Abdelmalek Essaadi Tetouan
Impact du vieillissement sur le comportement des transistors de puissance
grand gap, application à l’efficacité des convertisseurs d’énergie
Présentée et soutenue par
AL MEHDI BOUCHOUR
Centre des Etudes Doctorales : ‹‹ Sciences et Techniques de l’ingénieur ››
Thèse dirigée par :
M. Ahmed El Oualkadi
M. Olivier Latry
M. Pascal Dherbécourt
Université Abdelmalek Essaadi Tétouan, Maroc
Université de Rouen Normandie, France
Université de Rouen Normandie, France

2

3
Acknowledgments
First of all, I would like to thank my supervisors Mr. Ahmed El Oualkadi, Mr. Pascal Dherbécourt and Mr. Olivier Latry for their assistance and support in this thesis. I would like also to thank my supervisors for all the interesting scientific discussions. Each of you have given of his time, energy, and expertise and I am grateful for it.
I would like to thank Mr. Yassin Laaziz, director of the LabTIC and Mr. Philipe Pareige director of the GPM, for allowing me to conduct my research work in excellent conditions.
I have also to thank PHC TOUBKAL project for funding this thesis.
Special thanks to Mr. Ahmed El Oualkadi for sharing with me his expertise. You were my teacher in ENSAT for 5 years and then my thesis supervisors for 3 years. I learned many things from you so thank you.
I must thank M. Pascal Dherbécourt for being not only my thesis supervisor but also my second family in France. I am very grateful to him for being very patient and for all his time that he spent in discussing the various subjects of this thesis, and for going through the numerous versions of this dissertation.
Thank you Mr. Olivier Latry for accepting me in the ERDEFI team and for offering me all the support to conduct my work in excellent conditions.
I would also like to extend my thanks to the GPM laboratory for providing materials and resources for my experiment measurements. Also, many thanks to the ERDEFI team in the GPM laboratory for their help.
This journey would not have been possible without the support of my family. I am especially grateful to my father Allal Bouchour and my mother Hafida Guerouat, who supported me emotionally. I always knew that you believed in me and wanted the best for me. Thank you for teaching me that my job in life was to learn and to be happy.
To my sister Safe Bouchour, thank you for encouraging me in all of my pursuits and inspiring me to follow my dreams. Thank you to my brother Reda Bouchour and my sister Salma Bouchour for their support and the joyful moments we have spent together.

4
Table of contents
Acknowledgments .................................................................................................................................. 3
Table of contents .................................................................................................................................... 4
List of figures ......................................................................................................................................... 8
List of tables ......................................................................................................................................... 12
List of symbols ..................................................................................................................................... 13
List of acronyms .................................................................................................................................. 15
Abstract ................................................................................................................................................ 16
Résumé ................................................................................................................................................. 17
Chapter 1: Introduction ...................................................................................................................... 23
1.1 GaN HEMT for power converter applications ....................................................................... 24
1.1.1. Normally-off challenge ...................................................................................................... 24
1.1.2 Power losses estimation ...................................................................................................... 24
1.1.3. Gate driver ......................................................................................................................... 25
1.1.4. Reliability challenges ......................................................................................................... 25
1.2. Thesis project description ........................................................................................................ 26
1.3. Objectives of this research work ............................................................................................. 26
1.4. Outline of the thesis ................................................................................................................. 26
1.5. References ................................................................................................................................. 28
Chapter 2: Context and state of art of GaN HEMT power transistors .......................................... 29
2.1. Introduction .............................................................................................................................. 29
2.2. Context of the study ................................................................................................................. 29
2.2.1. Improving energy efficiency through GaN technology .................................................. 29
2.2.2. GaN power converters market ......................................................................................... 30
2.2.3. GaN power converter applications .................................................................................. 32
2.3. GaN and SiC power devices comparison ................................................................................ 35
2.3.1. Static characteristics ......................................................................................................... 36
2.3.2. Switching characteristics .................................................................................................. 37
2.4. Physical properties of the power GaN HEMT ....................................................................... 41
2.4.1. Physical properties of GaN ............................................................................................... 42
2.4.2. GaN HEMT normally-on structure ................................................................................. 45
2.4.3. GaN HEMT normally-off ................................................................................................. 46
2.5. Aging of the GaN HEMT power transistors .......................................................................... 48
2.5.1. Short circuit stress ............................................................................................................. 49
2.5.2. Static stresses: HTGB, HTRB .......................................................................................... 49

5
2.5.3. Switching stress .................................................................................................................. 49
2.6. GaN HEMT power losses modeling ........................................................................................ 50
2.6.1. Power losses in DC power converter............................................................................... 51
2.6.2. Estimation of GaN power losses ....................................................................................... 52
2.7. Conclusion ................................................................................................................................. 55
2.8. References ................................................................................................................................. 55
Chapter 3: GaN HEMT power losses estimation for switching applications ................................. 61
3.1. Introduction .............................................................................................................................. 61
3.2. Static characterization of GaN HEMT ................................................................................... 61
3.2.1. Pulsed I-V Experiment setup ............................................................................................ 62
3.2.2. Temperature dependency of GaN HEMT static characteristics ................................... 64
3.2.2.1. On-state resistance RDS(ON) ....................................................................................... 65
3.2.2.2 Threshold voltage (VTH) ............................................................................................ 66
3.2.2.3 Transconductance (gm) .............................................................................................. 67
3.2.3. Modeling GaN HEMTs Power Transistors ..................................................................... 67
3.2.3.1. Modeling methodology ............................................................................................... 67
3.2.3.2. Results and discussions .............................................................................................. 70
3.3. Dynamic characterization of GaN HEMT ............................................................................. 77
3.3.1. C-V experimental setup .................................................................................................... 77
3.3.1.1. Calibration .................................................................................................................. 77
3.3.1.2. Initialization ................................................................................................................ 77
3.3.1.3. Measurement circuits for CGS, CGD and CDS ............................................................ 78
3.3.2. Temperature-dependent capacitance–voltage measurements ....................................... 79
3.3.2.1. CGS-VGS characteristic ................................................................................................ 79
3.3.2.2. CGD-VGD characteristic ............................................................................................... 80
3.3.2.3. CDS-VDS characteristics ............................................................................................... 81
3.3.3. Frequency dependent of C-V measurements .................................................................. 82
3.3.4. C-V modeling methodology .............................................................................................. 83
3.4. Leakage current characteristics .............................................................................................. 86
3.4.1. Low current experiment setup ......................................................................................... 86
3.4.2. Gate leakage current temperature dependency .............................................................. 86
3.4.3. Gate leakage current power estimation ........................................................................... 87
3.5. Estimation of the GaN HEMT power converters efficiency ................................................. 88
3.6. Conclusion ................................................................................................................................. 90
3.7. References ................................................................................................................................. 91

6
Chapter 4: Extraction of the power GaN HEMTs intrinsic and extrinsic elements using S-
parameter measurements ................................................................................................................... 95
4.1. Introduction .............................................................................................................................. 95
4.2. Small signal model of power GaN HEMT .............................................................................. 96
4.3. S-parameters experimental setup at the cold state ................................................................ 97
4.4. Measurement verification ........................................................................................................ 98
4.4.1. Measurement repeatability ................................................................................................. 98
4.4.2. Passive component test ....................................................................................................... 99
4.5. The proposed extraction methodology ................................................................................. 100
4.6. GaN HEMT S-parameters extraction .................................................................................. 101
4.6.1. Parasitic inductances ........................................................................................................ 103
4.6.2. Intrinsic capacitances ....................................................................................................... 105
4.6.3. Parasitic resistances ........................................................................................................ 107
4.6.4. Measurement methodology verification......................................................................... 109
4.7. Multiple bias model extraction .............................................................................................. 110
4.7.1. Multiple bias experiment setup ........................................................................................ 111
4.7.2. Linear model extraction methodology ............................................................................. 112
4.7.3. Non-linear intrinsic capacitance extraction .................................................................... 113
4.8. S-parameter modelling and simulation ............................................................................... 113
4.9. Conclusion ............................................................................................................................... 116
4.10. References ............................................................................................................................. 116
Chapter 5: Aging of the GaN HEMT under safe operational conditions ..................................... 120
5.1. Introduction ............................................................................................................................ 120
5.2. Aging methodology ................................................................................................................. 120
5.2.1. ID current and VDS voltage limitations ........................................................................... 121
5.2.2. Junction temperature limit ............................................................................................. 121
5.3. Impact of aging on static characteristics .............................................................................. 122
5.3.1. Static parameters degradation ....................................................................................... 122
5.3.2. Static characteristics aging modeling ............................................................................ 124
5.4. Impact of aging on dynamic characteristics......................................................................... 125
5.4.1. Parasitic capacitances degradation ................................................................................ 125
5.4.1.1. CGS-VGS characteristic .............................................................................................. 125
5.4.1.2. CGD-VGD characteristic ............................................................................................. 126
5.4.1.3. CDS-VDS characteristic .............................................................................................. 127
5.4.2. Dynamic characteristics aging modeling ....................................................................... 128
5.5. Impact of aging on S-parameters characteristics ................................................................ 129

7
5.5.1. S-parameters degradation .............................................................................................. 129
5.5.2. S-parameters aging modeling ......................................................................................... 131
5.6. Step stress tests ....................................................................................................................... 132
5.6.1. Frequency stress .............................................................................................................. 132
5.6.2. On-state stress .................................................................................................................. 133
5.6.3. Off-state stress ................................................................................................................. 134
5.7. Effect of aging the GaN HEMT on the efficiency of power converters ............................. 136
5.7.1. Conduction power losses aging effect ............................................................................ 138
5.7.2. Switching power losses aging effect ............................................................................... 139
5.7.3. Gate leakage current losses aging effect ........................................................................ 139
5.7.5. Efficiency aging impact ................................................................................................... 140
5.8. Conclusion ............................................................................................................................... 142
5.9. References ............................................................................................................................... 142
Chapter 6: Summary, conclusions and future work ...................................................................... 148
6.1 Summary .................................................................................................................................. 148
6.2 Conclusion ................................................................................................................................ 149
6.3 Thesis contribution .................................................................................................................. 149
6.4 Future work ............................................................................................................................. 150
List of publications and communications ........................................................................................ 151

8
List of figures
Fig. 2.1: Change in oil and electricity consumption outlook 2000-2040 [2-3]. .................................... 29
Fig. 2.2: Electric energy losses during the consumption flow [4]. ....................................................... 30
Fig. 2.3: Power losses in synchronous buck converter [5]. ................................................................... 30
Fig. 2.4: GaN power device market by application ($M) [6]. ............................................................... 31
Fig. 2.5: GaN size equipment compared to Si [13]: (a) 65 W AC power adapter, (b) 1 kW ESS converter, (c) 3-Phase AC power conversion modules. ............................................................... 32
Fig. 2.6: Power vs Frequency on electronics: technology positionning in 2018 [6]. ............................ 33
Fig. 2.7: GaN advantages in automotive applications compared to Si [18]. ......................................... 33
Fig. 2.8: Total renewable energy consumption outlook 2015-2040 [19]. ............................................. 34
Fig. 2.9: GaN advantages in renewable energy applications [20]. ........................................................ 34
Fig. 2.10: World Energy Consumption [11]. ........................................................................................ 35
Fig. 2.11: Simulated output characteristic at various temperatures varying from 25 °C to 105 °C : (a) GaN HEMT (GS66508P) ; (b) SiC MOSFET (SCT2120AF). .............................................................. 36
Fig. 2.12: Simulated RON comparison between GaN HEMT (GS66508P), SiC MOSFET (SCT2120AF). ....................................................................................................................................... 37
Fig. 2.13: Simulated conduction power losses comparison between GaN HEMT (GS66508P), SiC MOSFET (SCT2120AF). ...................................................................................................................... 37
Fig. 2.14: Double-pulse setup with inductive load [28]. ....................................................................... 38
Fig. 2.15: GaN HEMT (GS66508P) drain current and voltage simulated switching waveforms at 25°C: (a) turn-off; (b) turn-on. .............................................................................................................. 39
Fig. 2.16: SiC MOSFET (SCT2120AF) Drain current and voltage simulated switching waveforms at 25°C: (a) turn-off; (b) turn-on. .............................................................................................................. 39
Fig. 2.17: GaN HEMT (GS66508P) and SiC MOSFET (SCT2120AF) simulated switching energy losses versus the temperature: (a) turn-on (EON); (b) turn-off (EOFF). ................................................... 39
Fig. 2.18: Simulated power switching losses comparison between GaN HEMT (GS66508P), SiC MOSFET (SCT2120AF). ...................................................................................................................... 40
Fig. 2.19: Ciss and Coss capacitances comparison between GaN HEMT (GS66508P) and SiC MOSFET (SCT2120AF) [24-25]. ......................................................................................................... 41
Fig. 2.20: Comparison of GaN power performances limits: (a) RDS(ON) versus BV (b) BV versus cutoff frequency [30]. ...................................................................................................................................... 42
Fig. 2.21: Schematic of the wurzite GaN [32]. ..................................................................................... 43
Fig. 2.22: Generation of the GaN spontaneous polarization [35]. ........................................................ 43
Fig. 2.23: Generation of the GaN piezoelectric polarization [36]. ........................................................ 44
Fig. 2.24: AlGaN/GaN heterostructure: (a) cross section (b) Band diagram [37]. ............................... 44
Fig. 2.25: Cross section of the GaN HEMT structure. .......................................................................... 45
Fig. 2.26: Power converter efficiency comparison between Si IGBTs, SiC MOSFETs and GaN HEMTs: (a) T-type inverter topology (b) Efficiency comparison at 32 kHz [83]. ............................... 50
Fig. 2.27: GaN HEMT package and comparison to Si MOSFET parasitic elements [84]. .................. 51
Fig. 2.28: Boost DC/DC converter: (a) Circuit schematic (b) representation of the different operating regimes of the transistor in a boost converter. ....................................................................................... 51
Fig. 2.29: Distribution of power losses in Boost DC/DC converter with VIN = 16 V; VOUT = 34 V and POUT = 15 W [89]. ........................................................................................................................... 53
Fig. 2.30: GaN HEMT SPICE model [93]. ........................................................................................... 53
Fig. 2.31: Compact physical GaN HEMT model [94]. ......................................................................... 54
Fig. 3.1: I-V pulsed bench with associated instruments. ....................................................................... 62
Fig. 3.2: I-V pulse chronogram. ............................................................................................................ 63

9
Fig. 3.3: Principle of pulsed I-V measurements. ................................................................................... 64
Fig. 3.4: GS66508P package [7]: (a) Top view; (b) bottom view. ........................................................ 64
Fig. 3.5: Schematic illustration of the tested GaN HEMT power transistor structure [6]. ................... 65
Fig. 3.6: Measured (a) Output characteristics at VGS = 6V; (b) Transfer characteristics at VDS = 2 V of GaN HEMT for various temperatures: 5 °C, 25 °C, 75 °C and 105 °C. ............................................... 66
Fig. 3.7: Normalized RDS(ON) as a function of temperature at VGS = 6V. ............................................... 66
Fig. 3.8: (a) Threshold voltage; (b) Transconductance as a function of temperature at VDS = 2 V. ..... 67
Fig. 3.9: Proposed methodology for estimating the GaN HEMT power losses. ................................... 68
Fig. 3.10: (a) Schematic of the switching bench; (b) Current and voltage waveforms on DUTM for switching conditions: 50 kHz, duty-cycle = 50 %, and 14 A / 24 V operating conditions. .................. 69
Fig. 3.11: Switching bench platform and associated instruments. ........................................................ 70
Fig. 3.12: Comparison between measurements, Constructor model and MET model: (a) Transfer characteristics (b) Output characteristics. .............................................................................................. 71
Fig. 3.13: Comparisons of Mean Relative Error between constructor model and MET model for both transfer and output static characteristics. ............................................................................................... 72
Fig. 3.14: Comparisons of Mean Relative Error between MET model, constructor static model and literature for the output characteristic at VGS = 3 V and 25 °C. ............................................................. 72
Fig. 3.15: Comparisons between MET model (dot), constructor model (dashed) and measurements (solid): (a) Transfer characteristic for VDS = 7 V at 55 °C and 115 °C; (b) Output characteristic for VGS = 6 V at 55 °C and 115 °C. .................................................................................................................... 73
Fig. 3.16: Evolution of the device parameters K and P when varying temperature from 25 °C to 115 °C. .......................................................................................................................................................... 73
Fig. 3.17: Comparisons of conduction power loss between measurements, MET model and constructor model for three values of TJ: 57 °C, 69 °C and 86 °C. ......................................................................... 75
Fig. 3.18: Conduction losses estimation: (a) power losses at three temperatures: 25 °C, 65 °C and 115 °C; (b) energy losses at f = 50 kHz, Duty-cycle = 50 %, VDS = 200 V. ................................................ 76
Fig. 3.19: C-V experimental setup: (a) CV bench; (b) detrapping setup. ............................................. 78
Fig. 3.20: Measurement circuit for the C-V characteristics: (a) CGS-VGS; (b) CGD-VGD; (c) CDS-VDS. . 78
Fig. 3.21: (a) Gate to source capacitance CGS; (b) Derivative of CGS-VGS plot. .................................... 79
Fig. 3.22: (a) CGS-VGS characteristics for various temperatures: 5°C, 45°C, 85°C and 115 °C. (b) CGS(Max) as a versus temperature. ............................................................................................................ 80
Fig. 3.23: (a) CGD-VGD characteristics for various temperatures: 5°C, 45°C, 85°C and 115 °C. (b) CGD(Max) as a versus temperature. ........................................................................................................... 81
Fig. 3.24: (a) CDS-VDS characteristics for various temperatures: 5°C, 45°C, 85°C and 115 °C. (b) CDS versus temperature at VDS equals 10 V. ................................................................................................. 82
Fig. 3.25: (a) C-V-f measurements; (b) Measured CGS-VGS characteristics at 1 MHz and at room temperature. Solid curves correspond to the voltage sweep from negative to positive values of VGS and dashed curves correspond to the opposite sweep direction. .................................................................. 83
Fig. 3.26: CGS capacitance model parameters. ...................................................................................... 84
Fig. 3.27: Comparison between measured and modelled capacitances at 25 °C: (a) CGS-VGS; (b) CGD-VGD; (c) CDS-VDS. .......................................................................................................................... 85
Fig. 3.28: Turn-on switching losses estimation at 25 °C, f = 50 kHz, Duty-cycle = 50 % and VDS = 200 V: (a) switching times, (b) power losses. .............................................................................................. 85
Fig. 3.29: Leakage current measurement bench.................................................................................... 86
Fig. 3.30: Gate leakage current: (a) temperature dependency at VGS = 6V; (b) IGSS Model as a function of VGS at 25 °C. ................................................................................................................................ 87
Fig. 3.31: Gate power losses estimation versus temperature at VGS = 6 V. .......................................... 88
Fig. 3.32: Solar energy application with a 30V/200V DC-DC converter stage. ................................... 88

10
Fig. 3.33: DC-DC boost converter, with L = 170 mH, C = 850 µF and R = 20 Ω, at 50 kHz switching frequency, 30 V input voltage and 200 V output voltage. ..................................................................... 89
Fig. 3.34: Efficiency estimation of a GaN HEMT 30 V/ 200 V DC-DC boot converter versus Iout at 50 kHz and 25 °C. ................................................................................................................................. 90
Fig. 4.1: GaN HEMT package [9]: (a) extrinsic parameters, (b) intrinsic parameters. ......................... 97
Fig. 4.2: (a) VNA measurement setup for GaN HEMT; (b) DUT test fixture; (c) Test fixture using TO-220 connector. ................................................................................................................................. 98
Fig. 4.3: Measured GaN HEMT Z11 coefficient before and after 24 hours VNA measurement session: (a) Z11 Magnitude and (b) Z11 Phase. ..................................................................................................... 99
Fig. 4.4. GaN HEMT small signal model extraction methodology. ................................................... 101
Fig. 4.5: Tested 650 V / 30 A GaN HEMT. ........................................................................................ 102
Fig. 4.6: Frequency responses of the tested power GaN HEMT for 100 kHz < f < 200 MHz: (a) Z11, (b) Z12, (c) Z21 and (d) Z22 Magnitudes and phases. ....................................................................... 103
Fig. 4.7: Equivalent circuit of the DUT at high frequency [27]. ......................................................... 103
Fig. 4.8: Inductances extraction of the tested power GaN HEMT: (a) LS, (b) LG and (c) LD frequency responses. ............................................................................................................................................ 104
Fig. 4.9: Equivalent circuit of the DUT at high frequency using star connection [30]: CG, CS and CD. ............................................................................................................................................................. 105
Fig. 4.10: Delta connection of the extracted capacitances [31]: CGS, CGD and CDS. ........................... 106
Fig. 4.11: Capacitances extraction of the tested power GaN HEMT: (a) CGS, (b) CGD and CDS frequency responses. ........................................................................................................................... 107
Fig. 4.12 : Equivalent circuit of the DUT at SRF frequency [34]: RG, RS, RD. ................................... 107
Fig. 4.13: Resistances extraction of the tested power GaN HEMT: (a) RS, (b) RG and (c) RD frequency responses. ............................................................................................................................................ 109
Fig. 4.14: Tested 1200 V SiC MOSFET ............................................................................................. 109
Fig. 4.15: GaN HEMT load line IDS-VDS characteristic. ..................................................................... 111
Fig. 4.16: Multiple bias S-parameters bench. ...................................................................................... 111
Fig. 4.17: Small signal equivalent circuit model of GaN HEMTs [51]. ............................................. 112
Fig. 4.18: Evolution of GaN HEMT CGS intrinsic capacitance. .......................................................... 113
Fig. 4.19: S-parameter simulation setup at QP4 bias point. ................................................................. 114
Fig. 4.20: Optimized S11 and S22 parameters for the tested GaN HEMT at QP4 bias point: (a) S11 Real, (b) S11 imaginary, (c) S22 Real, (d) S22 imaginary. ............................................................................... 114
Fig. 4.21: Optimized S12 and S21 parameters for the tested GaN HEMT at QP4 bias point: (a) S12 Real, (b) S12 imaginary, (c) S21 Real, (d) S21 imaginary. ............................................................................... 115
Fig. 5.1. (a) Aging switching bench; (b) ID and VDS waveforms of DUTM over one period for switching conditions: 100 kHz, duty-cycle = 50 %, and 10 A / 200 V operating conditions. ............................. 122
Fig. 5.2. Evolution of the static parameters during 720 h of aging: (a) RDS(ON) and gm; (b) IDS at VGS = 6 V and VDS = 0.76 V. ............................................................................................................................ 123
Fig. 5.3. (a) IDS-VGS characteristics measured at VDS equals to 1V and 7V; (b) IDS-VDS characteristics for various quiescent bias points at 25°C in the dark. ......................................................................... 123
Fig. 5.4. Experiment and model: (a) Output characteristics IDS-VDS; (b) transfer characteristics IDS-VGS before and after 720 h of aging............................................................................................................ 125
Fig. 5.5: (a) Evolution of CGS-VGS characteristic before and after aging; (b) Evolution of CGS(Max) during aging. ........................................................................................................................................ 126
Fig. 5.6: (a) Evolution of CGD-VGD characteristic before and after aging; (b) Evolution of CGD(Max)
during aging. ........................................................................................................................................ 127
Fig. 5.7: (a) Evolution of CGD-VGD characteristic before and after aging; (b) Evolution of CDS @ VDS = 10 V during aging. ............................................................................................................................... 128

11
Fig. 5.8: Experiment and model before and after 720 h of aging: (a) CGS-VGS characteristics; (b) CGD-VGD characteristics; (c) CDS-VDS characteristics. ................................................................................. 128
Fig. 5.9: Evolution of the S parameters during 720 h of aging: (a) S11 Magnitude, (b) S11 Phase, (c) S12 Magnitude, (d) S12 Phase, (e) S21 Magnitude, (f) S21 Phase, (g) S22 Magnitude, (h) S22 Phase. 130
Fig. 5.10: Experiment and model of S11 and S12 parameters: (a) Before aging; (b) after 720 h of aging. ................................................................................................................................................... 132
Fig. 5.11: (a) On-state stepp stress bench, (b) Off-state step stress bench [73]. ................................. 134
Fig. 5.12: Evolution of IGSS current at VGS = 6 V during on-state stress. ............................................ 134
Fig. 5.13: Evolution of IDSS current at VDS = 200 V during off-state stress. ........................................ 135
Fig. 5.14: Wind energy application with a 200 V/ 24 V DC-DC converter stage for electric vehicle charging stations. ................................................................................................................................. 137
Fig. 5.15: DC-DC buck converter, with L = 170 mH, C = 850 µF and R = 20 Ω, at 100 kHz switching frequency, 200 V input voltage and 24 V output voltage. ................................................................... 137
Fig. 5.16. Conduction power losses of DC-DC buck converter before and after 720 h of aging for different output current: 10 A, 12 A and 14 A. .................................................................................. 138
Fig. 5.17: Switching power losses of DC-DC buck converter before and after 720 h of aging for different output current: 10 A, 12 A and 14 A. ................................................................................... 139
Fig. 5.18: Estimated gate power losses before and after 720 h of on-state step stress aging. ............. 140
Fig. 5.19: Estimated gate power losses before and after 720 h of off-state step stress aging. ............ 140
Fig. 5.20: GaN HEMT total power losses of DC-DC buck converter before and after 720 h of aging for various output current: 10 A, 12 A and 14 A. ................................................................................ 141

12
List of tables
Table 2.1: Comparison of the investigated transistors characteristics of GaN HEMT and SiC MOSFET [24-25]. ................................................................................................................................. 36
Table 2.2: Simulated switching time TON and TOFF of GaN HEMT (GS66508P) and SiC MOSFET (SCT2120AF). ....................................................................................................................................... 38
Table 2.3: Material properties of Si, GaN and SiC [31]. ...................................................................... 42
Table 2.4: GaN HEMT substrate comparison: Si, SiC and GaN. ......................................................... 46
Table 2.5: Comparison of GaN HEMT structures. ............................................................................... 47
Table 2.6: The most critical failure mode and effects analysis of the GaN HEMT. ............................ 48
Table 2.7: Comparison of available GaN SPICE models [97]. ............................................................ 55
Table 3.1: I-V pulse timing. ................................................................................................................. 63
Table 3.2: Static parameters comparison between measurements, constructor model and MET model. ............................................................................................................................................................... 71
Table 3.3: Extracted MET model parameters at 25°C. ......................................................................... 72
Table 3.4: Extracted MET thermal model temperature coefficients. ................................................... 73
Table 3.5: Switching conditions applied to DUTM at: VDS(OFF) = 24 V, f = 50 kHz and Duty-cycle = 50 %. ........................................................................................................................................................... 75
Table 3.6: Measurements, MET model and constructor model comparisons of conduction power losses. .................................................................................................................................................... 75
Table 3.7: Extracted parameters of the estimated conduction power losses PCond(IDS,T). .................... 76
Table 3.8: Extracted values of CGS, CGD and CDS at 25°C. ................................................................... 84
Table 3.9: Extracted IGSS model parameters at 25°C. ........................................................................... 87
Table 3.10 : Total losses in DC-DC boost converter with GaN HEMT at 25°C and Iout = 10 A. ......... 90
Table 4.1: Comparison between impedance meter and S-parameter measurements of the tested passive component at 1 MHz: capacitance, inductance and resistance. ................................................ 99
Table 4.2: Self resonance frequency of the tested power GaN HEMT. ............................................. 103
Table 4.3: GaN HEMT extracted parasitic inductances LS, LG and LD at 200 MHz. ......................... 105
Table 4.4: GaN HEMT extracted parasitic capacitances CGS, CGD and CDS at 1 MHz. ...................... 107
Table 4.5: GaN HEMT extracted parasitic resistances RS, RG and RD at SRF frequency. ................. 109
Table 4.6: GaN HEMT extracted pad parasitic capacitances Cpg and Cpd at 1 MHz ..... Error! Bookmark
not defined.
Table 4.7: Tested SiC MOSFET parasitic elements extraction results summarization. ..................... 110
Table 4.8: Load line bias points QP1, QP2, QP3 and QP4. ...................................................................... 110
Table 4.9: linear model parameters of the GaN HEMT at multiple quiescent points: QP1, QP2, QP3 and QP4. ...................................................................................................................................................... 112
Table 4.10: Comparison between measured and simulated extracted parasitic elements of the GaN HEMT at QP4 bias point. ...................................................................................................................... 115
Table 5.1: Applied switching conditions on DUTM. .......................................................................... 122
Table 5.2: 720 hours aging results for DUTM. .................................................................................... 124
Table 5.3: Extracted Static Model Parameters at 25 °C for the Fresh State (t = 0) and Aged State (t = 720 h) ................................................................................................................................................... 125
Table 5.4: Extracted values of CGS, CGD and CDS model before and after 720 h of aging. ................. 129
Table 5.5: Extracted values of parasitic parameters before and after 720 h of aging. ........................ 131
Table 5.6: Failure mode and effects analysis (FMEA) of the GaN HEMT during 1000 h of step stress aging. ................................................................................................................................................... 136
Table 5.7: DC-DC buck converter conduction power losses, before and after 720 h of aging for output current: 10 A, 12 A and 14 A. ............................................................................................................. 138

13
Table 5.8: Total losses in DC-DC buck converter with GaN HEMT at 25°C, 10 A. ......................... 141
List of symbols
C: Capacitance of the supercapacitor [F]
C0: Initial value of C [F]
ESR: Equivalent Series Resistance of the supercapacitor [Ω]
ESR0: Initial value of ESR [Ω]
Ciss: Input capacitance [F]
Coss: Output capacitance [F]
Crss: Reverse transfer capacitance [F]
CGS: Gate to source capacitance [F]
CGD: Gate to drain capacitance [F]
CDS: Drain to source capacitance [F]
D: Duty cycle
DC: Direct current
fs: Switching frequency [Hz]
IDS: Drain to source current [A]
IGSS: Gate leakage current [A]
IDSS: Drain leakage current [A]
IOUT: Inverter output current [A]
L: Output filter inductance [H]
PGaN, PSiC, PSi: Device power losses [Watt]
Pg: Gate power losses [Watt]
Qg: Gate charge [C]
RDS(on): Drain to source on-state resistance [Ω]
gm: Transconductance [S]
ns: 2DEG carrier density [cm]
PPZ: Piezoelectric polarization [C.cm-2]
PSP: Spontaneous polarization [C.cm-2]
q: elementary charge [C]

14
σ2DEG: 2DEG charge density [cm-2]
σAlGaN/GaN: Polarization charge density at the interface [cm-2]
σSURF: Surface charge density [cm-2]
Ta: Ambient temperature [°C]
Tj: Junction temperature [°C]
VGS: Gate to source voltage [V]
VDS: Drain to source voltage [V]
VTH: Threshold voltage [V]

15
List of acronyms
2D: Two dimensions
2DEG: Two-dimensional electron gas
GaN: Gallium nitride
AlGaN: Aluminum gallium nitride
HEMT: High-electron-mobility transistor
III-V: Material being formed by elements from the 3rd and 5th column of the table of elements
DUT: Device under test
IGBT: Insulated-gate bipolar transistor
JFET: Junction gate field-effect transistor
MOSFET: Metal oxide semiconductor field-effect transistor
Si: Silicon
SiC: Silicon carbide
WBG: Wide-bandgap
SPICE: Simulation Program with Integrated Circuit Emphasis
SOA: Safe Operating Area
IGBT: Insulated-gate bipolar transistor
JFET: Junction gate field-effect transistor
MOSFET: Metal oxide semiconductor field-effect transistor
FMECA: Failure Modes, Effects and Criticality Analysis
PWM: Pule width modulation
RF: Radio frequency

16
Abstract
In this thesis, we have studied the impact of aging the GaN HEMT on the power converter efficiency. For that, we have developed an experimental methodology to estimate the power losses of the GaN HEMT for switching circuit applications. The estimation of the power losses is performed by a SPICE simulation approach using a non-segmented Electro-thermal model. The developed methodology enables the estimation of both the static and dynamic power losses in power converter applications.
Additionally, we have implemented an accurate method for extracting both the intrinsic and extrinsic elements of the GaN HEMT power transistors. The experimental setup includes: Vector Network Analyzer, IVCAD measurement modules, drain and gate bias tees. The developed S-parameter setup enables the extraction of the parasitic elements of the power GaN HEMT at multiple bias conditions. The Annealing algorithm is chosen for the optimization of the model parameters. This method enables to study the effect of aging on both the parasitic elements of the GaN HEMT.
Moreover, we have investigated the aging of a 650 V, 30 A GaN HEMT power transistor under operational switching conditions. The switching stress respects the Safe Operation Area (SOA) of the tested transistor. Various types of stress are performed, such as: continuous operational switching stress, on-state, off-state and frequency step stresses. The aging campaigns lasted 1000 h and was carried out through a developed switching application with high power efficiency. During aging, several electrical characterizations were performed for monitoring both the dynamic and static characteristics of the device under test, including: pulsed I-V, leakage current, C-V, S-parameters, temporal switching measurements. The effects of this degradation on power converters are studied for both the static and dynamic characteristics of the aged GaN HEMT. Using the developed SPICE model, the conduction power losses, switching power losses, leakage current gate and drain power losses are estimated before and after of aging. The accuracy and consistent convergence of the developed SPICE model provide a good way to investigate the reliability of GaN HEMTs by simulation.
Keywords: GaN, HEMT, S-parameter, DC-DC power converters, aging, SOA, power losses.

17
Résumé
Ce travail de recherche s’inscrit dans la problématique de l’efficacité énergétique des
convertisseurs de puissance à base des transistors GaN-HEMTs, cette thématique représente
une importance primordiale pour des domaines tels que les transports, les énergies
renouvelables ou encore les télécommunications.
Les travaux développés dans cette thèse se déroulent en cotutelle entre l’Université
Abdelmalek Essaadi de Tétouan-Maroc et l’Université de Rouen Normandie-France, ce travail
représente un intérêt réel pour les industriels internationaux et pour l’agence marocaine pour
l’énergie durable au Maroc, puisqu’il traite une problématique actuelle qui est celle de la
fiabilité et l’efficacité énergétique des convertisseurs de puissance. Notre travail s’inscrit donc
dans le développement de la technologie électronique dans le cadre d’un partenariat Maroc-
France.
Actuellement, les composants de puissance de nouvelle génération de technologie GaN
(nitrure de gallium) ou SiC (carbure de silicium) remplacent peu à peu les technologies usuelles
à base silicium. Des modèles électriques rencontrés en littérature sont adaptés à ces composants,
cependant leur intégration dans les systèmes de conversion d’énergie nécessite de connaitre
avec précision l’évolution de ces modèles face au stress subi, en premier lieu thermique et
électrique.
Ce travail de recherche consiste dans un premier temps à étudier l’impact des dégradations
sur les éléments du modèle du composant à l’étude. Puis, dans un second temps, à partir du
modèle, nous analysons l’impact des dégradations sur les performances d’un convertisseur de
puissance.
Concernant les applications mobiles alimentées par batterie comme les véhicules électriques,
les avions « plus électriques » ou les applications photovoltaïques, une haute efficacité
énergétique combinée à un poids faible et une conception compacte sont des exigences clés.
En utilisant des semi-conducteurs à grand gap comme le GaN, il est possible de travailler
avec des fréquences de commutation plus élevées. Par conséquent, le volume et le poids des
composants magnétiques et des condensateurs peuvent être réduits de manière significative.

18
En raison de leurs caractéristiques, les composants de technologie GaN constituent un choix
crucial pour les convertisseurs DC-DC fonctionnants à des fréquences de commutation allant
au-delà de quelques centaines de100 kHz jusqu'au MHz.
Malgré les nombreux avantages qu’apporte la technologie GaN comparée par la technologie
Si, la fiabilité doit encore être démontrée. Cela est dû d’une part à l’évolution continue du
processus technologique adopté, et d’autre part en raison du manque d’information concernant
les modes et les mécanismes de défaillance.
La contribution de ce travail de recherche se situe essentiellement au niveau de l’étude de
l’impact du vieillissement d’un composant GaN HEMT commercial sur l’efficacité énergétique
des convertisseurs DC-DC. L’étude consiste à la réalisation des tests de vieillissement en
commutation dans des conditions opérationnelles de fonctionnement. Les pertes dynamiques et
statiques du composant sont estimées avant et après les tests du vieillissement. Par conséquent,
l’impact du vieillissement sur le rendement du convertisseur DC-DC est déterminé.
Afin de réaliser ce travail, le banc de mesure des caractéristiques courant-tension (I-V) pulsé
est exploité afin d’estimer les pertes de puissance de conduction à l’état passant d’un composant
GaN HEMT commercial. La caractérisation I-V en mode pulsé permet de placer le transistor
sous test dans un mode de fonctionnement très proche de celui de son utilisation réelle.
La caractérisation expérimentale constitue un atout indéniable pour réussir ce projet de thèse.
A ce sujet, le banc de mesure des caractéristiques capacité-tension (C-V) est exploité afin
d’estimer les pertes de commutation du GaN HEMT.
La technologie des transistors GaN HEMTs représente une importance primordiale pour les
applications de convertisseurs de puissance. Cependant, comme toute technologie émergente,
la question de la fiabilité des transistors GaN HEMTs s'impose, car il y a peu de retour
d'expérience sur cette technologie et une instabilité sur la maîtrise des processus de fabrication,
notre étude s'intègre dans cette démarche de fiabilité.
Pour aborder cette problématique, nous avons réalisé des tests de vieillissement en
commutation dans des conditions opérationnelles. Le comportement statique et dynamique du
transistor est impacté par les dégradations physiques causées par le stress thermique et
électrique.

19
Les objectifs de cette thèse sont :
• Étudier le vieillissement du transistor GaN HEMT 650V, 30A en conditions
opérationnelles de fonctionnement.
• Réaliser plusieurs campagnes de vieillissement dans diverses conditions
opérationnelles.
• Suivre l’évolution des caractéristiques dynamiques et statiques du transistor de test
pendant 1000 h de vieillissement.
• Étudier les indicateurs de défaillance du GaN HEMT à partir des caractérisations
expérimentales et comparer les résultats obtenus avec la littérature.
• Pour aider à répondre à ces objectifs, mettre en place au sein du laboratoire un banc
expérimental d'extraction automatique des éléments parasites de transistors de
puissance en utilisant des paramètres S à multiples points de polarisation.
• Mettre en œuvre une méthodologie expérimentale de mesure des caractéristiques C-V
des transistors GaN HEMT.
• Concevoir un modèle SPICE précis de GaN HEMT de puissance pour les applications
de convertisseurs de puissance.
• Identifier l'impact du vieillissement du GaN HEMT sur l'efficacité des convertisseurs
de puissance. Ceci est d'un très grand intérêt pour les concepteurs de circuits de
commutation, car il est alors possible de prendre en compte les effets de la dégradation
des transistors GaN de puissance sur leurs systèmes.
Pour répondre aux objectifs, cette thèse est organisée en six chapitres :
Le chapitre 1 présente l’introduction générale. Dans ce chapitre, les challenges majeurs de
la technologie GaN HEMT dans les applications de convertisseurs de puissance sont présentés.
Aussi, les objectifs de ce projet de thèse sont définis et une description du plan de ce rapport de
thèse est donnée.
Le chapitre 2 présente l'état de l’art des transistors de puissance GaN HEMT. Une étude du
marché des convertisseurs du puissance est présentée afin de justifier le besoin des nouvelles
technologies de transistors à base du GaN. De plus, ce chapitre décrit les propriétés physiques
du matériau GaN ainsi que les avantages et les principales applications du GaN HEMT. Les
limites des composants au Silicium et le besoin de technologies émergentes telles que : le GaN

20
et le SiC sont analysées dans ce chapitre. Les avantages et les principales applications des GaN
HEMTs sont présentés.
Ensuite, une comparaison des performances statiques et dynamiques entre le GaN et son
concurrent SiC est développée en utilisant une approche de simulation SPICE. Cette étude est
suivie par la présentation des propriétés physiques du matériau GaN. La formation du gaz
d'électrons bidimensionnel (2DEG) est expliquée sur la base de l'interaction d'une couche de
GaN avec une couche mince de l’AlGaN.
Une description de la structure physique GaN HEMT est développée. Une étude comparative
des différentes technologies du GaN HEMTs est présentée. De même, les différentes modes de
défaillance du GaN HEMT dans des conditions de commutation sont synthétisées suivant une
analyse AMDEC. En outre, les diverses techniques de vieillissement pour évaluer la fiabilité
des GaN HEMT de puissance sont discutées. Aussi, pour l’estimation des pertes du puissance
du GaN HEMT selon une approche de simulation, plusieurs modèles du GaN HEMT sont
comparés aux données issues de la littérature.
Le chapitre 3 présente une méthodologie complète pour l'estimation des pertes de puissance
du GaN HEMT basée sur des mesures expérimentales. Le banc de commutation et les bancs de
mesure I-V et C-V sont présentés. Les caractérisations I-V pulsé, C-V et le courant de fuite sont
réalisées à différentes températures variant de 5 ° C à 115 ° C par pas de 10 ° C. L’effet de la
température sur les caractéristiques statiques et dynamiques du GaN HEMT est étudié et
comparé aux données présentes dans la littérature. L’effet de la fréquence sur les mesures C-V
est étudié.
Le modèle SPICE choisi pour le GaN HEMT présente des faibles erreurs par rapport aux
mesures expérimentales. Une étude comparative du modèle électrothermique utilisé avec
d’autres modèles de la littérature est réalisée. Le modèle utilisé montre une bonne convergence
avec les mesures expérimentales. Aussi, le modèle prend en considération l’effet de la
température ce qui permet l’estimation des pertes de puissances avec une grande précision.
Les pertes de puissance du transistor sous test sont estimées sur la base d'une approche de
simulation SPICE pour les applications de convertisseur de puissance. L'évolution des pertes
de conduction et de commutation est modélisée en fonction de la température variant entre 5°C
et 115 °C et pour un courant de sortie variant de 0 à 20A.
Sur cette base, nous avons construit un modèle précis de pertes de puissance du GaN HEMT
basé sur des mesures expérimentales. Le rendement d'un convertisseur de puissance DC-DC
30 V / 200 V à base du GaN HEMT est estimé pour une application d’énergie solaire.

21
La méthodologie proposée pour l'estimation des pertes de puissance sera exploitée dans le
chapitre 5 pour étudier l'impact du vieillissement du GaN HEMT en condition de commutation
opérationnelle sur le rendement des convertisseurs de puissance.
Le chapitre 4 présente une méthodologie expérimentale pour extraction des éléments
intrinsèques et extrinsèques du GaN HEMT de puissance sur une large gamme de fréquences :
de 100 kHz à 200 MHz par un pas de 100 kHz. La méthodologie de mesure des paramètres S
est vérifiée sur des composants passifs, tels que : un condensateur, une inductance, une
résistance et sur des composants actifs, comme : les transistors GaN HEMT et SiC MOSFET.
Après description de la procédure de calibration, l’étude de la répétabilité des mesures est
effectuée. Ensuite, la mesure des résistances d'accès et des inductances ainsi que des capacités
est présentée. La mesure des paramètres S est effectuée sur le GaN HEMT à la fois à l'état froid
et à de multiples points de polarisation.
Le banc de mesure des paramètres S réalisé permet l’extraction automatique des paramètres
parasites d’un transistor à multiples points de polarisations et utilisant l’algorithme
d’optimisation « Annealing ».
La modélisation des éléments parasites de GaN HEMT est donc réalisée en utilisant
l'approche de simulation des paramètres S. L'extraction des éléments parasites du GaN HEMT
est réalisée avec une grande précision. Cette méthode est utilisée dans le chapitre 5 pour étudier
l'effet du vieillissement du GaN HEMT dans des conditions de commutation opérationnelle sur
les éléments parasites du GaN HEMT.
Dans le chapitre 5, nous présentons les effets du vieillissement du transistor de puissance
GaN HEMT dans des conditions de commutation opérationnelles à fort courant et à haute
tension. De telles études sont d'une grande importance, car le GaN HEMT est soumis à des
conditions similaires à ce qui serait vécu dans une application réelle de convertisseurs de
puissance.
De plus, pour classifier les mécanismes de dégradation du GaN HEMT pour les applications
de convertisseur de puissance, nous avons réalisé plusieurs campagnes de vieillissement, à
savoir : stress en commutation continue, step-stress sur la grille, sur le drain et en fréquence de
commutation.
Aussi, une analyse des modes de défaillance et de leurs effets (AMDEC) du GaN HEMT
pendant 1000 h de vieillissement en commutation est présentée. Au cours des campagnes de
vieillissement, nous avons surveillé les changements des caractéristiques I-V, C-V et
des paramètres S. Les caractéristiques électriques statiques et dynamiques du GaN HEMT sont
mesurées en fonction du temps de stress et sont modélisées.

22
L’impact du vieillissement sur l’efficacité énergétique des convertisseurs de puissance à base
du GaN HEMT est estimé pour une application d’énergie renouvelable. Les pertes de
conduction et commutation sont calculées avant et après vieillissement.
Le chapitre 6 présente une conclusion générale de la thèse et les études futures possibles sur
les transistors GaN HEMT de puissance. Aussi, les contributions majeures de la thèse sont
définies et présentées comme suit :
• Développement d’une méthodologie d’estimation des pertes de puissance statiques et
dynamiques du GaN HEMT. Cette méthode est basée sur des caractérisations
expérimentales I-V pulsé, C-V et du courant de fuites. La précision et la convergence
cohérente du modèle SPICE utilisé fournissent un bon moyen d'étudier l’impact du
vieillissement du GaN HEMT sur le rendement des convertisseurs de puissance par une
approche de simulation.
• Développement d’un banc expérimental de caractérisation des paramètres S. Ce banc
permet l’extraction des éléments parasites du GaN HEMT automatiquement et à
multiples points polarisation. La méthode développée pour l’extraction des paramètres
intrinsèques et extrinsèques est générique et peut être appliquée à plusieurs types de
composants de puissance.
• La plupart des études existantes dans la littérature concernent la fiabilité du GaN HEMT
dans des conditions statiques. Ce travail étudie le vieillissement du GaN HEMT de
puissance dans les conditions de commutation opérationnelles des convertisseurs de
tension DC-DC.
• Le banc de vieillissement proposé permet d'étudier l'impact des électrons chauds sur le
GaN HEMT à haute courant et tension avec une faible consommation d'énergie.
• Les divers types de vieillissement réalisés permettent de classifier les modes de
défaillance du GaN HEMT pour chaque mode de fonctionnement dans les applications
de convertisseur de puissance.
Mots clés : GaN, HEMT, paramètres S, convertisseurs de puissance DC-DC, vieillissement, SOA, pertes de puissance.

23
Chapter 1: Introduction
Investigating the impact of aging the power GaN HEMTs under operational switching conditions is receiving an increasing interest from research laboratories worldwide. The attention of academics and industrials on the power converters efficiency is accelerated by the impressive growth of GaN HEMTs market, due to their high superior performances compared to those of Silicon power transistors. Their applications are in various domains, such as renewable energy and high-power engineering.
The estimation of power losses with high convergence to measurements is necessary to design efficient power converters using GaN transistors. The authors in [1] have proposed an estimation of power losses based on a look-up tables of energy losses to estimate the switching losses of IGBTs. Also, the authors in [2] have estimated and compared the switching power losses of GaN HEMTs to equivalent Si devices such as IGBT and MOSFETs.
For that, an accurate model is necessary. In the literature, several behavioral models of GaN transistor have been proposed. References [3] and [4] show a simple and accurate segmented behavioral model, which include the important static parameters of the GaN HEMTs. However, these models suffer from the discontinuity of the simulated curves, because the used equations are divided into three segments according to cutoff, linear and saturation regions.
In this work, we estimate both the static and dynamic losses of power GaN HEMTs. Moreover, we used a smooth and continuous behavioral model to estimate the efficiency of DC-DC power converter circuits before and after operational switching aging.
Moreover, to validate the robustness of power GaN HEMTs, JEDEC standardized tests for Si power transistors are used [5]. However, the standardized tests for Si are not enough to guarantee the robustness of GaN transistors when they are used in power converter applications, because the reliability of GaN under switching operation is different from that of Si transistors [6]. Therefore, running GaN HEMTs power transistors under accelerated conditions would cause many non-GaN failures.
In the literature, the reliability of GaN HEMTs has been improved. Reference [7] classifies the degradation modes of GaN HEMT in switching mode DC power converter into three classes: on-state, off-state and semi-off state. According to [8], one of the major disadvantages limiting the reliability of GaN HEMTs for switching power applications is hot electron effects that occurs during the switching state. In [9], this degradation result in decreased DC and RF performance.
According to [10], it is important to study the reliability of GaN HEMT for power conversion circuits. This work presents a developed reliability methodology under operational switching conditions. The proposed aging switching bench presents high power efficiency. The effects of aging GaN HEMT transistor on a power converter application are studied by SPICE simulation approach.
The devices investigated on this thesis are based on the gallium nitride (GaN) material. GaN is a III-V compound semiconductor with various physical properties such as wide band gap, large breakdown electric field, strong mechanical and thermal stability and good heat conductivity. In this first chapter, a general overview of the GaN power devices is given. Therefore, the objectives and the outline of this research work are presented.

24
1.1 GaN HEMT for power converter applications
Power switching devices are used in DC-DC converters to convert voltages. In order to provide an efficient conversion, an ideal switching device should guarantee zero static and dynamic losses. The static losses are due to the parasitic resistance of the device (RON) when it is in the on-state and due to the leakage current when is in the off-state. However, the dynamic power loss is induced during the switching from the on-state to the off-state and vice versa.
Furthermore, the possibility of having a power switching device able to operate at high switching frequencies would allow to reduce the size of passive components present in today DC-DC converts, this can significantly reduce the overall converter size. Nowadays, the Si MOSFET technology is reaching the limit [11]. Hence, emergent technologies have to be considered to go beyond the limit of Si devices.
Due to the large critical electric field, the GaN material is considered to replace Si technology. The large critical electric field of the GaN is combined with the high two-dimensional electron gas (2DEG) density, which is spontaneously generated at the AlGaN/GaN heterostructure interface, hence, with intrinsically low resistivity.
As a result, due to the high-density and low-resistivity 2DEG in comparison to the Si technology for the same current target value, AlGaN/GaN HEMTs guarantee a smaller on-resistance with smaller overall device area. Moreover, a smaller parasitic capacitance compared to other Si devises. Only the SiC based devices appear to be able to compete with the GaN. However, the GaN has lower dynamic losses, highest density and switching frequency.
Despite the high performances of the GaN HEMT in power converter applications, this technology still has various challenges to overcome for both a wide use and highly confident in the power converter market. The GaN HEMT challenges are presented in the following.
1.1.1. Normally-off challenge
One of the challenges that the GaN technology had to overcome in order to enhance its performances on the power switching market was the creation of the GaN normally-off devices. In fact, naturally GaN transistors are normally-on devices and most of the advantages of this technology are due to the spontaneous formation of the 2DEG channel without applying any gate voltage. However, for switching applications normally-off devices are required for safety reasons. Today, various companies have commercialized normally-off devices with high operating voltage (1000 V). Their performances in term of dynamic and static losses are better than the Si devices for the same operating voltage. According to the power GaN HEMT roadmap [12], it is recommended to study the normally-off GaN HEMT technology for power converter circuits. This thesis fulfils the recommendation of the GaN power roadmap. For that, we have investigated both the reliability and the power efficiency of the p-GaN normally-off technology as required in the power converter market.
1.1.2 Power losses estimation
The estimation of the GaN HEMT losses offers to the power converter designers the possibility to estimate the power losses of GaN HEMT with high accuracy without the use of

25
the complex switching bench, which reduces the time to market and cost. To accurately design a power converter with GaN HEMT, it is important to calculate the power losses of the device. For that, we have presented in chapter 3 an experimental methodology for the estimation of both the static and dynamic power losses of the GaN HEMT using C-V and I-V measurement. The impact of the GaN HEMT losses on the efficiency of power converts are modelled using SPICE simulation approach. This accurate methodology enables to identify the impact of aging the GaN HEMT on the efficiency of power converts.
1.1.3. Gate driver
Another major constraint is driving the GaN high speed transistors. The studied power GaN HEMT is a GaNPX package [13] and not a standard wire-bonded, leaded packages, such as TO-220. Integrating the GaN HEMT in such package reduces parasitic inductances and optimizes switching performance. However, to design the gate driver and for the estimation of total power losses of the device, it is important to accurately evaluate the parasitic element of the device. In chapter 4, we have presented an accurate method based on the S-parameters measurements for the extraction of the GaN package parasitic resistances, capacitances and inductances.
1.1.4. Reliability challenges
Reliability is essential for the application of GaN power devices to critical electronic systems, for high voltage energy conversion, control of electrical engines, automotive electronics. However, the main challenge of GaN-HEMTs for wide commercialization, concerns the study of reliability.
The reliability of AlGaN/GaN HEMTs can be limited by several breakdown mechanisms, which can be mainly summarized in [14] as:
• The current collapse has been one of the critical issues for GaN transistors, where the drain current is reduced and thus ON-state resistance is increased once a high drain bias is applied to a GaN transistor. The current collapse is caused by the negative charge trapping in the structure under high-voltage stress. The increase in dynamic RDS(on)
elevates the device temperature, which in turn can result in a thermal instability and finally device destruction. The current collapse has been investigated in this thesis under operational switching conditions.
• Degradation at the gate edge: this failure mode takes place in the off-state, results in an increase of leakage current, and is accelerated by the electric field. This can be induced by trap creation and formation of conductive paths between the gate and channel.
• In hard switching conditions, GaN HEMTs may be simultaneously subject to high drain voltage and nonnegligible drain current. The electrons injected from the source are accelerated by the electric field thus becoming “hot”. The hot electrons may induce both a recoverable degradation, when they are trapped in the gate-drain access region, or a permanent degradation, if their energy is sufficient to promote the generation of lattice defects.

26
1.2. Thesis project description
This thesis project takes place in joint supervision between the Abdelmalek Essaadi University of Tetouan-Morocco and the University of Rouen Normandy France. The thesis research was performed in collaboration between the Laboratory for Communication Information Technologies (LabTIC) in Tangier, and the Group Laboratory for Materials Physics (GPM) in Rouen. The thesis work took place under the supervision of Mr. Olivier Latry, Mr. Ahmed El Oualkadi and Mr. Pascal Dherbecourt. During this thesis, I benefited from the PHC TOUBKAL scholarship. Also, two six-month and additional three month stays in France are funded through the PHC TOUBKAL project.
1.3. Objectives of this research work
This thesis objectives are:
- Study the aging of a 650V, 30A GaN HEMT transistors in real operating conditions. - Perform multiple aging campaigns at various operational conditions. - Monitor the dynamic and static characteristics of the DUT during 1000 h of aging. - Investigate the failure mechanisms of the GaN HEMT based on experimental
characterizations and compare the obtained results to the literature. - Develop an accurate methodology for measuring both the dynamic and static power
losses of the GaN HEMT in power converter applications. - Estimate the impact of aging the GaN HEMT on the efficiency of power converters. - Implement in the GPM laboratory an experimental bench for extracting the parasitic
elements automatically of power devices using S-parameters at multi-bias. - Develop a generic methodology for the extraction of both the intrinsic and extrinsic
elements of power GaN HEMT for both at the cold state and under multiple bias conditions.
- Implement in the GPM laboratory an experimental methodology for measuring the C-V characteristics of the GaN HEMT transistors.
- Design an accurate SPICE Model of power GaN HEMT for switching circuit applications.
- Take into account the evolution of the elements of the model following aging in the simulated temporal waveform.
- Identify the impact of aging the GaN HEMT on the efficiency of power converts. This are of very high interest to circuit and system designers, as they will be eager to understand the effects of device degradation on their systems.
1.4. Outline of the thesis
This manuscript is organized as follows:
- Chapter 2 shows the state of the art concerning the GaN HEMT power transistors. Moreover, this chapter describes the fundamental properties of the GaN material as well the advantages and the major applications of the GaN HEMT power transistors.

27
- Chapter 3 presents a complete methodology for the estimation of the GaN HEMT power losses based on experimental measurement. The pulsed I-V, C-V and low current characterizations are performed at various temperatures: from 5 °C to 115 °C by a step of 10 °C. The power losses of the DUT are estimated based on a SPICE simulation approach for switching circuit applications. The evolution of the conduction losses and switching losses in power converter applications is modelled as a function of the junction temperature and the output current. As a result, we have built an accurate power losses model of the GaN HEMT based on experimental measurements, which include the major power losses in power converter applications. Using the extracted power losses model of the GaN HEMT, we have estimated the efficiency of a 30 V / 200 V DC-DC converter stage with GaN HEMT. The proposed methodology for the estimation of the GaN HEMT power losses is used in chapter 5 to study the impact of aging the power GaN HEMT under operational switching condition on the power converters efficiency.
- Chapter 4 presents an experimental methodology to extract parasitic elements of a packaged GaN power transistor over a wide frequency ranges: from 100 kHz to 200 MHz by a step of 100 kHz. In order to reach the best accuracy on the extraction of very low GaN device parasitics, a method based on S-parameter measurements and a specific calibration process using low-cost test fixtures are proposed. The S-parameters measurement methodology are verified on both passive components, such as: capacitor, inductor, resistor and on the tested GaN HEMT power. After detailing the calibration procedure, measurement of access resistances and inductances as well as voltage-dependent capacitances are presented. The S-parameters measurement are performed on the GaN HEMT in both the cold state and the multiple bias conditions. The non-linear model of the power GaN HEMT is extracted at multiple bias points which correspond to the power switching application load line. The modeling of parasitic elements of GaN HEMT is performed using S-parameters simulation approach. The extraction of the parasitic elements of the GaN HEMT with high accuracy using S-parameter method is used in chapter 5 to study the effect of aging the GaN HEMT under operational switching conditions on the parasitic component of the GaN HEMT.
- In chapter 5, we studied the effects of aging GaN HEMT power transistor under operational switching conditions at both high current and high voltage. Such studies are of great importance as the device is subjected to conditions similar to what would be experienced in a real application of power converters. Additionally, to separate the degradation mechanisms of the GaN HEMT in switching power converter mode, we have performed three step stress aging campaigns: frequency step stress, on-state step stress, off-state step stress. A failure mode and effects analysis (FMEA) of the GaN HEMT during 1000 h of step stress aging are presented. During the aging campaigns we have monitored the changes of the current-voltage (I-V), capacitance-voltage (C-V) and S-parameters characteristics. Both static and dynamic electrical characteristics of the devices are measured as a function of stress time and are modeled. Notably, these results are used to simulate the efficiency of a DC-DC buck converter using both fresh and aged devices.
- Chapter 6 summarizes the results presented in this thesis and possible future studies on the AlGaN/GaN technology.

28
1.5. References
[1] Azzopardi, S., Jamet, C., Vinassa, J. M., & Zardini, C. (1998, May). Switching performances comparison of 1200 V punch-through and nonpunch-through IGBTs under hard-switching at high temperature. In PESC 98 Record. 29th Annual IEEE Power Electronics Specialists Conference (Cat. No. 98CH36196) (Vol. 2, pp. 1201-1207). IEEE.
[2] Mitova, R., Ghosh, R., Mhaskar, U., Klikic, D., Wang, M. X., & Dentella, A. (2013). Investigations of 600-V GaN HEMT and GaN diode for power converter applications. IEEE transactions on power electronics, 29(5), 2441-2452.
[3] Shah, Krushal, and Krishna Shenai. "Simple and accurate circuit simulation model for gallium nitride power transistors." IEEE Transactions on Electron Devices 59.10 (2012): 2735-2741.
[4] Peng, Kang, Soheila Eskandari, and Enrico Santi. "Characterization and modeling of a gallium nitride power HEMT." IEEE Transactions on Industry Applications 52.6 (2016): 4965-4975.
[5] JEDEC standard, JESD22 (2016)
[6] Meneghini, Matteo, and Enrico Zanoni. "Gallium Nitride-enabled High Frequency and High E ciency Power Conversion." Integrated Circuits and Systems (2018): ISBN 978-3-319-77993-5.
[7] Meneghini, Matteo, et al. "Reliability and failure analysis in power GaN-HEMTs: An overview." Reliability Physics Symposium (IRPS), 2017 IEEE International. IEEE, 2017.
[8] Meneghesso, Gaudenzio, Matteo Meneghini, and Enrico Zanoni. "Reliability and instabilities in GaN-based HEMTs." Electron Devices and Solid-State Circuits (EDSSC), 2014 IEEE International Conference on. IEEE, 2014.
[9] U. K. Mishra, L. Shen, T. E. Kazior, and Y.-F. Wu, “GaN-based RF power devices and amplifiers,” Proc. IEEE, vol. 96, no. 2, pp. 287–305, Feb. 2008.
[10] Bahl, Sandeep R., Daniel Ruiz, and Dong Seup Lee. "Product-level reliability of GaN devices." Reliability Physics Symposium (IRPS), 2016 IEEE International. IEEE, 2016.
[11] Spaziani, L., & Lu, L. (2018, May). Silicon, GaN and SiC: There's room for all: An application space overview of device considerations. In 2018 IEEE 30th International Symposium on Power Semiconductor Devices and ICs (ISPSD) (pp. 8-11). IEEE.
[12] Amano, H., Baines, Y., Beam, E., Borga, M., Bouchet, T., Chalker, P. R., ... & De Santi, C. (2018). The 2018 GaN power electronics roadmap. Journal of Physics D: Applied Physics, 51(16), 163001.
[13] GaN systems Inc. GN002 Application Note, Thermal Design for GaN Systems’ Top. GaN systems. 2020
[14] Meneghini, M., Rossetto, I., De Santi, C., Rampazzo, F., Tajalli, A., Barbato, A., ... & Meneghesso, G. (2017, April). Reliability and failure analysis in power GaN-HEMTs: An overview. In 2017 IEEE International Reliability Physics Symposium (IRPS) (pp. 3B-2). IEEE.

29
Chapter 2: Context and state of art of GaN HEMT power
transistors
2.1. Introduction
In this chapter, the state of art of the power GaN HEMT in power converter applications is discussed. Firstly, the limitations of Silicon devices and the need of emerging technology such as: GaN and SiC in the power switching market are analyzed. Also, the advantages and the major applications of the GaN HEMT devices are presented. Then, a comparison of both the static and dynamic performances between the GaN and its SiC competitor technologies is studied using a SPICE simulation approach. This is followed by presenting the physical properties of the GaN material. The formation of the two-dimensional electron gas (2DEG) is explained based on the interaction of a GaN layer with a thin layer of aluminum gallium nitride (AlGaN). Moreover, a description of the GaN HEMT physical structure is provided. Subsequently, the various degradations of power GaN HEMT under switching conditions are summarized. Furthermore, the diverse aging technics for evaluating the reliability of the GaN power devices are discussed. Finally, a brief description of the power losses modelling of the GaN HEMT is presented.
2.2. Context of the study
2.2.1. Improving energy efficiency through GaN technology
According to the international energy agency (IEA). The world energy demand rises by 1 % per year to 2040 [1]. The electrical energy consumption will increase from 47.21 % in 2018 to 68.87 % in 2040 compared to oil. As shown in Fig. 2.1, electricity uses grows at more than double of overall energy demand between 2000 and 2040 [2-3], confirming its place at the heart of modern economies.
Fig. 2.1: Change in oil and electricity consumption outlook 2000-2040 [2-3].
However, 60 % of the produced electric energy is wasted before achieving the end-use stage for consumption [4]. Fig. 2.2 shows the electric energy losses during the conversion steps of the consumption flow: production, generation, transmission until the end-use consumption. The
0
200
400
600
800
1000
Oil Electricity
Mill
ion
Ton
nes
of O
il E
quiv
alen
t
Change in oil and electricity consumption, 2000 - 2018
0
200
400
600
800
1000
1200
1400
Oil Electricity
Mill
ion
Ton
nes
of O
il E
quiv
alen
t
Change in oil and electricity consumption, 2018 - 2040
518
1146
919
822
(a) (b)

30
reduction of losses in power conversion applications is the key to improve the energy efficiency in order to ensure the increased demand of electric energy.
Fig. 2.2: Electric energy losses during the consumption flow [4].
Power converters are essential to ensure world electric consumption demand. They enable to distribute and use electric power, and to generate electrical energy from renewable sources (wind, solar, etc.). As shown in Fig. 2.3, power Si MOSFETs account for more than half the power loss in a buck converter application [5]. For more than five decades, power converters with silicon (Si) has been the dominant semiconductor for power electronics devices. However, today the increased demand for higher current, voltage and power density capability, as well as the need of a better energy efficiency to reduce the global energy consumption, are the driving forces to introduce new semiconductor, such as GaN technology in power electronics and to overcome the inherent limitations of Si-based devices.
Fig. 2.3: Power losses in synchronous buck converter [5].
2.2.2. GaN power converters market
According to [6], the power GaN Market is expected to be multiplied 24 times between 2016 and 2022, from 12 million dollars in 2016 to 450 Million dollars in 2022. As illustrated in Fig. 2.4, the expansion of the GaN Market is mainly driven by the power converts applications DC-DC and AC-DC for power supply. Additional markets, including solar (PV), electric and hybrid electric vehicles (EV/HEV), are also driving forces behind this growth.
Inductor
10%
Capacitor
30%
Driver
1%
Control
MOSFET (Q1)
36%
Synchronous
MOSFET (Q2)
23%

31
Fig. 2.4: GaN power device market by application ($M) [6].
However, with US$ 12 million in 2016, the GaN power market remains small compared to the US$ 30 billion silicon power semiconductor market [7]. But the fast growth of the GaN market between the period of 2016 and 2020 is a sign for the beginning of the competition between GaN and Si markets.
To understand the reason of the fast expansion of the GaN market, we have analyzed the major GaN events that happened in the last few years. We have observed that the GaN technology has been successively achieved for a high operating voltage, high operating current, high power density, high switching frequency, and strong reliability.
In the following, we present the most relevant improvement of the GaN technology during the period between 2017 to 2020.
High voltage requirements:
Before 2017, the GaN device market has been mainly dominated by low voltage devices < 600 V [7]. Hence, increasing the voltage capability of the GaN devices is a requirement for power system applications. In 2017, Transfom produces the first 900 V GaN product in the market for high voltage power conversion applications [8]. This product has earned the confidence of both renewable and the automotive industry since is the first GaN JEDEC and AEC-Q101 qualified. According to [9], the result of integrating this high voltage GaN product in a single-phase DC converter shows a high total efficiency of 99 %.
High current requirements:
The high current requirements in power converters application is essential to meet the needs of systems in areas such as: electric vehicles, renewable energy, industrial motors electronics that are consuming ever more power. In 2019, Toyoda Gosei in Japan [10] has developed a vertical gallium nitride (GaN) power semiconductor device with high current operation of 100 A on a single chip. Which has doubled the electric current capacity from the previous 50 A to 100 A on a single chip. Also, in 2020, GaN System has announced world’s highest current rated GaN Power transistor [11]. The emergent 120 A, 650 V GaN E-HEMT, offers much higher power levels in the automotive, industrial, and renewable energy industries.

32
High power density requirements:
In 2018, EPC has introduced a 350 V GaN power transistor 20 times smaller than comparable silicon [12]. This 1.95 mm x 1.95 mm (3.72 mm2) product enables five times less area of power conversion circuits than a comparable silicon solution. Despite the small size of this product can handle thermal conditions more efficiently than plastic packaged MOSFETs.
Fig. 2.5 shows the size reduction of the GaN power converters compared to those with Si [13]. As shown in Fig. 2.5 (a), the use of GaN power devices in designing AC power adapter enables lighter and up to quarter the current size with Si devices. In Fig. 2.5 (b), the size and weight of energy storage systems with GaN for renewable energy applications is reduced 3 times compared to equivalent Si systems. Fig. 2.5 (c) shows power conversion module for industrial application. As shown in this figure, using GaN power devices results in power supplies that are more efficient and higher power density. This results in significant system size reductions including opportunities to integrate functions into a single system.
Fig. 2.5: GaN size equipment compared to Si [13]: (a) 65 W AC power adapter, (b) 1 kW ESS converter, (c) 3-Phase AC power conversion modules.
High switching frequency requirements:
In 2020, 6 MHz buck converter evaluation board (GSWP050W-EVBPA) using GaN Systems 100V E-Mode GaN transistor and integrated high-speed driver [14]. This evaluation board exhibits much higher efficiencies than Si MOSFETs and exceeds performance in terms of switching speed, parasitic capacitance, switching loss, and thermal characteristics.
High reliability requirements:
In 2019, the JEDEC wide bandgap power semiconductor committee publishes its first document [15]: test method for dynamic resistance of GaN HEMT for power conversion applications. This JEDEC committee establishes standards across suppliers for datasheet, qualification, and test methods for the consistent measurement of Drain-to-Source Resistance in the ON-state RDS(ON) encompassing dynamic effects. These dynamic effects are characteristic of GaN power FETs, and the value of the resulting measured RDS(ON) is method dependent.
2.2.3. GaN power converter applications
Fig. 2.6 shows the applications of Si, SiC and GaN devices in power electronics market based on power and frequency ranges. The migration from Si to WBG devices such as GaN and SiC, has been accelerated in the last few years. However, Si devices like Thyristors, IGBT and Si bipolar still be used in high power applications which do not require high switching frequency,
(a) (b) (c)

33
for example: power grid and wind energy. In the other side, SiC and GaN dominate the high frequency applications. Currently, GaN-transistors are ideal for high frequency power converts up to 1000 V, like: power supplies and audio amplifiers while SiC is rather suited for discrete devices or modules with breakdown voltages above 1000 V, such as: train transportation and photovoltaic.
Fig. 2.6: Power vs Frequency on electronics: technology positionning in 2018 [6].
The GaN advantages in automotive, renewable energy and power converter markets are presented in the following:
Automotive GaN market:
The number of electric and hybrid vehicles has increased rapidly in the world over the past few years and continues to accelerate. The electric vehicles market is expected to increase from 5 million electric vehicles in 2018 to reach 250 million new electric vehicles sold in 2030 [16]. The electricity consumption that accompanies that will rise from 58 TWh in 2018 to 640 TWh in 2030 [17]. That will require a new solutions of power devices to improve electricity pricing for vehicle charging, as well as new storage and efficient power converters systems.
For the automotive industry [18], GaN offers 3 times smaller power systems, 50 % power losses reduction and 20 % lower system cost. This means high performance electric vehicles with high energy efficiency and low cost. Fig. 2.7 shows the GaN advantages in the automotive applications industry.
The GaN ability to reduce size, weight and improve electricity consumption are increasingly being used in EV and HEV applications such as chargers and power converters.
3X Power density
50% Power losses
reduction
20% Lower system
coast
Fig. 2.7: GaN advantages in automotive applications compared to Si [18].

34
Renewable energy GaN market:
Figure 2.8 shows the total renewable energy consumption outlook with projections to 2040. As can be shown, the renewable energy consumption will increase by 113.17 % between 2015 and 2040 [19]. Moreover, more than 25 % of global electricity generation is expected to come from renewable sources by 2020 [20]. This increased demand of renewable energy from 2165 trillion Megawatt-hour (MWh) in 2015 to 3845 trillion MWh in 2040, makes efficient power conversion systems with GaN devices more attractive for renewable energy industry.
Fig. 2.8: Total renewable energy consumption outlook 2015-2040 [19].
For the renewable energy industry, GaN power transistors enable the design of simpler, lower cost, and more efficient energy storage systems that are not achievable with silicon [20]. Fig. 2.9 shows the GaN advantages in the renewable energy industry.
Energy GaN market:
Energy is the main engine for economy and the most important factor for the national security. According to the International Energy Outlook [21], the word energy demand will continue to rise up to 5% by 2040 and the natural gas and oil will still be the dominant source of energy for the next twenty years (Fig. 2.10). Therefore, the easy recoverable of gas and oil will be reduced, and their recovery will be from deep wells with hundreds of kilometers depth and high temperature varying from 180°C to 450°C.
0
500
1000
1500
2000
2500
3000
3500
4000
4500
2015 2017 2019 2021 2023 2025 2027 2029 2031 2033 2037 2040
Tri
llio
nM
egaw
att-
hour
(M
Wh)
Years
20% Power density
50% Power losses
reduction
10% Lower system
coast
Fig. 2.9: GaN advantages in renewable energy applications [20].

35
Fig. 2.10: World Energy Consumption [11].
In such a harsh, high temperature and high-pressure environment, electronic power converters based on Silicon (Si) cannot survive and the drillers have to explore these deep wells without an appropriate instrumentation. Drilling in this manner is very costly, slow and inaccurate. The GaN power converters can support high temperature and robust environment.
2.3. GaN and SiC power devices comparison
Silicon has been reached its limits and wide bandgap semiconductors will take the next step [22]. The first power device, a silicon carbide (SiC) Schottky-diode, became commercially available in 2001. Since then, also a variety of SiC switches became commercially available. Gallium nitride (GaN) emerged as another alternative wide bandgap material for power devices and the first commercial power GaN devices have been introduced to the market by EPC in 2010 [23].
In this section, we compare both the static and switching characteristics of two power transistors: GS66508P GaN HEMT from GaN SYSTEMS [24] and SCT2120AF SiC MOSFET from ROHM SEMICONDUCTOR [25]. The investigated devices have both similar breakdown voltages 650 V and maximum drain current 30 A. Table 2.1 summarizes the electrical characteristics of the investigated transistors.
The performance of GaN and SiC transistors can be compared using the figure-of–merit (FOM). The FOM factor is calculated using (2.1) [26]:
( ) (2.1)DS ON gFOM R Q=
Where: RDS(ON) is the on-state resistance (Ω) and Qg is the gate charge (nC). Table 2.1 shows the comparison between the GaN and SiC FOM factor. As observed, the GaN HEMT FOM is 25 times lower than that of SiC MOSFET. This is due to both the low resistance and gate charge of the GaN HEMT compared to thus of SiC MOSFET. According to [27], the low FOM factor of the GaN HEMT compared to SiC MOSFET enables lower power losses, thus a high energy efficiency for power converters.

36
Table 2.1: Comparison of the investigated transistors characteristics of GaN HEMT and SiC MOSFET [24-25].
Parameters GaN HEMT (GS66508P) SiC MOSFET (SCT2120AF)
IDS(max) (A) 30 29
VDS(max) (V) 650 650
RDS(ON) (mΩ) 50 120
Qg (nC) 5.8 61
FOM (Ω*nC) 0.29 7.32
In the following, we have compared using SPICE simulation both the static and dynamic
characteristics of the selected GaN and SiC transistors presented in Table 2.1.
2.3.1. Static characteristics
The simulated I-V static characteristics of the studied GaN and SiC transistors at various temperatures varying from 25 °C to 105 °C are shown in Fig. 2.11. As observed, the SiC MOSFETs has a low temperature coefficient of ON resistance compared to the GaN HEMT. For the SiC MOSFET, on-resistance only increases by 12 % between 25 °C and 105 °C as shown in Fig. 2.11. However, the GaN HEMT on-resistance increases by 14.78 % between 25 °C and 105 °C.
Fig. 2.11: Simulated output characteristic at various temperatures varying from 25 °C to 105 °C : (a) GaN HEMT (GS66508P) ; (b) SiC MOSFET (SCT2120AF).
From the simulated output characteristic in Fig. 2.11, we have calculated the RON resitance using (2.2):
1
( ) (2.2)
DS V
DSDS ON
DS V
VR
I=
=
Where: VDS is the drain to source voltage and IDS is the drain to source current. Fig. 2.12 shows the simulated on-state resistance temperature dependence for both the GaN HEMT and SiC MOSFET. As observed, the SiC MOSFET has 35.03 % higher RDS(ON) than that of GaN HEMT. This enables to GaN power converter applications lower conduction losses compared to thus with SiC MOSFET.
(b) (a)

37
Fig. 2.12: Simulated RON comparison between GaN HEMT (GS66508P), SiC MOSFET (SCT2120AF).
By using GaN HEMT transistors in power converters, the conduction power losses are reduced 50 % than by using SiC MOSFET as shown in Fig. 2.13.
Fig. 2.13: Simulated conduction power losses comparison between GaN HEMT (GS66508P), SiC MOSFET (SCT2120AF).
To summarize this section of static characteristics, the SiC MOSFET has a lower temperature dependency of the RDS(ON) resistance. However, the GaN HEMT has lower RDS(ON)
resistance, which enables reduced conduction power losses for power switching applications compared to SiC MOSFET.
2.3.2. Switching characteristics
The double-pulse test (DPT) has been used to compare and analyze the switching characteristics between the SiC MOSFET and GaN HEMT. A double-pulse test circuit is shown in Fig. 2.14. The DPT analyze enables to observe the switching transients of a the DUT without the self-heating of the device [28]. This test is done with a purely inductive load. This mode enables a similar electrical waveform on the DUT, which could exist in DC-DC power converters.

38
Fig. 2.14: Double-pulse setup with inductive load [28].
The first pulse turns on the DUT transistor in Fig. 2.14 and charge a current through the inductor. The first pulse should be a wide pulse, which charges the load current to the magnitude. Then, a short break followed by a second short pulse appears.
The double pulse setup was implemented in SPICE simulator, which enables the comparison of the switching characteristics between both the studied GaN and SiC transistors. Fig. 2.15 and Fig. 2.16 show both the turn-off and turn-on waveforms at 400 V drain-to-source voltage and 20 A drain current for GaN HEMT and SiC MOSFET respectively. The switching losses in a power transistor depend on its turn-on (TON) and turn-off (TOFF) transient times. The TON
and TOFF times are defined by (2.3) [29]:
(2.3)ON ri fv
OFF rv fi
T t t
T t t
= + = +
Where tri is the current rise time and tfv is the voltage fall time at turn-on. For TOFF, trv is the
voltage rise time and tfi is the current fall time at turn-off. The rise time tr and the fall time tf are measured from 10 % to 90 % of the waveform switching level [29].
Based on the simulated switching waveforms in Fig. 2.15 and Fig. 2.16, the TON and TOFF switching times of both the GaN and SiC are calculated and presented in Table 2.2. As can be observed, The GaN has a lower switching time TON and TOFF, which enables lower switching losses energy for power switching applications whith GaN HEMT. Table 2.2: Simulated switching time TON and TOFF of GaN HEMT (GS66508P) and SiC MOSFET (SCT2120AF).
GaN EOFF TOFF1 SiC EOFF TOFF2 GaN EON TON1 SiC EON TON2
Time width (µs) 0.015 0.2 0.03 0.5

39
Fig. 2.15: GaN HEMT (GS66508P) drain current and voltage simulated switching waveforms at 25°C: (a) turn-off; (b) turn-on.
Fig. 2.16: SiC MOSFET (SCT2120AF) Drain current and voltage simulated switching waveforms at 25°C: (a) turn-off; (b) turn-on.
Fig. 2.17 shows the comparison of both the turn-on and turn-off switching losses energy between GaN HEMT and SiC MOSFET. As observed, EON losses of SiC MOSFET are 115 times higher compared to GaN HEMT. Similarly, the EOFF losses of SiC MOSFET are 14 times higher compared to GaN HEMT.
Fig. 2.17: GaN HEMT (GS66508P) and SiC MOSFET (SCT2120AF) simulated switching energy losses versus the temperature: (a) turn-on (EON); (b) turn-off (EOFF).
TOFF1 =15ns
GaN turn-off energy
(b) (a)
TON2=500ns TOFF2 =200ns
SiC turn-on energy SiC turn-off energy
(b) (a)
(b) (a)

40
The high turn-on and turn-off energy losses of SiC compared to GaN is due to the high switching times of the SiC MOSFET. As shown in Table 2.2, the GaN has lower switching times compared to SiC, which enables high energetic efficiency for GaN power switching applications.
To compare the switching losses of GaN HEMT and SiC MOSFET, we have calculated the total switching losses PSW from the simulated switching IDS current and VDS voltage waveforms in Fig. 2.15 and Fig. 2.16. PSW is defined by (2.4) [29].
( ) ( )
0 0
1 1 (2.4)
ON OFFT T
SW SW on SW off ds ds ds ds
ON OFF
P P P i v dt i v dtT T
= + = +
Where vDS and iDS are the simulated drain-to-source voltage and the drain current, TON is the
turn-on time and and TOFF is the turn-off time. The value of TON and TOFF for both the GaN HEMT and the SiC MOSFET are obtained from Table 2.2. The evolution of the simulated switching losses for both GaN and SiC for a range of frequency varying from 50 kHz to 200 MHz is shown in Fig. 2.18. This interval of frequencies is very used in power switching applications. Fig. 2.18 shows that the switching losses of SiC transistors increases by 38.46 % from 50 kHz to 200 MHz compared to GaN power transistor.
The responsible mechanism for this phenomenon is the high parasitic capacitances of the SiC compared to GaN. As shown in Fig. 2.19, the GaN has lower input capacitance (Ciss) and output capacitance (Coss) compared to SiC MOSFET. This results in low switching power losses for GaN power switching applications.
Fig. 2.18: Simulated power switching losses comparison between GaN HEMT (GS66508P), SiC MOSFET (SCT2120AF).

41
Fig. 2.19: Ciss and Coss capacitances comparison between GaN HEMT (GS66508P) and SiC MOSFET (SCT2120AF) [24-25].
In this section, we have demonstrated using SPICE simulation the high performances of the power GaN HMET in both static and dynamic characteristics compared to those of SiC MOSFET. Furthermore, we have found using SPICE simulation that the GaN has a lower switching time TON and TOFF, which enables lower switching losses energy. Moreover, the GaN HEMT has a lower on-state resistance compared to the SiC MOSFET, which offers lower conduction losses energy for DC power converter applications. This makes the GaN HEMT very attractive for power switching applications market. Next, we will study the physical properties and the structure of the GaN HEMT power transistor.
2.4. Physical properties of the power GaN HEMT
To understand the origin of the GaN HEMT devices performances compared to those of SiC and Si MOSFET, we have studied in this suction the GaN material properties and compare it to the SiC and Si semiconductor materials. Fig. 2.20 (a) shows the on-resistance (RON) versus the BV of Si, 4H-SiC, 6H-SiC, and GaN material [30]. As shown in the limit chart, both the SiC and GaN materials have higher power performances in comparison with conventional Si material. The GaN enables low on-resistance and higher BV, which make it an attractive candidate for replacing Si power devices in power applications. Fig. 2.20 (b) shows the limits of the cutoff frequency and BV. As observed, the GaN combine both the high-speed and high-voltage performances compared to Si.

42
Fig. 2.20: Comparison of GaN power performances limits: (a) RDS(ON) versus BV (b) BV versus cutoff frequency [30].
Table 2.3 shows the five key electrical properties of three semiconductor materials Si, GaN and SiC contending for the power management market [31]. The superior physical properties of the GaN semiconductor offer a higher band gab, a higher electric breakdown field, a larger electron mobility, a lower permittivity and a good thermal conductivity, when compared to silicon (Table 2.3). Table 2.3: Material properties of Si, GaN and SiC [31].
Parameter Unit Si GaN SiC
Band gap Eg eV 1.12 3.39 3.26
Critical field ECrit MV/cm 0.23 3.3 2.2
Electron mobility µn cm2/V.s 1400 1500 950
Permittivity εr 11.8 9 9.7
Thermal conductivity W/cm.K 1.5 1.3 3.8
2.4.1. Physical properties of GaN
The GaN is a hexagonal crystalline structure named “wurtzite” (Fig. 2.21). This structure is very chemically stable [32], it is mechanically robust and can withstand high temperatures [33]. This crystal structure also gives GaN piezoelectric properties that lead to its ability to achieve very high conductivity compared with other semiconductor materials [34].
(b) (a)

43
Fig. 2.21: Schematic of the wurzite GaN [32].
Spontaneous polarization:
Since nitrogen has a higher electronegativity than gallium, Ga and N atoms have anionic (+) and cationic (−) characteristics, respectively, resulting in causing electric polarization.
1P , 2P
, 3P and
4P are the internal polarization vectors of the GaN. As shown in Fig. 2.22, the noncoincident center of the positive charge and negative charge leads to spontaneous polarization [35]. And its polarization direction depends on its material growth direction.
Fig. 2.22: Generation of the GaN spontaneous polarization [35].
Piezoelectric polarization:
In addition to spontaneous polarization, piezoelectric effects were considered to be responsible for the sheet carrier densities in GaN devices. The mechanical stress inside the epitaxial layers with different lattice constants causes new type of polarization, which is referred to as piezoelectric polarization [36]. Fig. 2.23 explains how the piezoelectric polarization is caused in nitride semiconductors. As shown in the left figure, the resultant internal polarization vectors P1 + P2 + P3 + P4 become zero in a freestanding tetrahedral structure due to the crystal symmetry. However, when the crystal is deformed by the lattice mismatch, as shown in the right-hand side, the angle θ become widened when tensile stress is applied. Thus, the internal electric field becomes unbalanced to appear the piezoelectric field PPE appears as P1 + P2 + P3 + P4 = PPE.

44
Fig. 2.23: Generation of the GaN piezoelectric polarization [36].
Heterojunction AlGaN/GaN:
The GaN material combined both the spontaneous and piezoelectric polarizations, which lead to its ability to achieve very high conductivity compared to other semiconductor materials. The total polarization of the GaN material is given by (2.5) [36]:
(2.5)total SP PEP P P= +
Where PSA is spontaneous polarization and PPE is the piezoelectric polarization. Fig. 2.24 (a) shows the directions of the spontaneous and piezoelectric polarization for the AlGaN/GaN heterostructures. As observed, two-dimensional electron gas (2DEG) is created at the interface AlGaN/GaN. This is due to the strain-induced polarization at the interface between the two materials. A negative density of charge is created due to the gradient of polarization between the AlGaN and GaN layers defined by (2.6) [37]: 𝜎𝐴𝑙𝐺𝑎𝑁/𝐺𝑎𝑁 = 𝛻𝑃𝐴𝑙𝐺𝑎𝑁/𝐺𝑎𝑁 = 𝑃𝐴𝑙𝐺𝑎𝑁𝑆𝑃 + 𝑃𝐴𝑙𝐺𝑎𝑁𝑃𝐸 − 𝑃𝐺𝑎𝑁𝑆𝑃 + 𝑃𝐺𝑎𝑁𝑃𝐸 (2.6)
As shown in the band diagram of the AlGaN/GaN heterostructure in Fig. 2.24 (b). The strong piezoelectric and spontaneous polarization enables the confinement of the electrons in a deep and narrow quantum wells. This creates a two-dimensional electron gas (2DEG) with a high density of electrons at the interface AlGaN/GaN. The high concentration of electrons with very high mobility is the basis for the HEMT.
Fig. 2.24: AlGaN/GaN heterostructure: (a) cross section (b) Band diagram [37]. (b) (a)

45
2.4.2. GaN HEMT normally-on structure
GaN HEMT has a heterojunction AlGaN/GaN and a GaN buffer layer deposited on a substrate and the source, gate, and drain contacts. Fig. 2.25 shows a cross section of the GaN HEMT normally-on structure.
Fig. 2.25: Cross section of the GaN HEMT structure.
Schottky contacts
The gate of the GaN HEMT is a Schottky contact. This gate metal with high Schottky barrier height enables a low gate leakage current in the GaN device. Ni/Au is the most widely used Schottky gate metal in GaN HEMTs due to its good thermal stability [38].
Ohmic contacts
Both the drain and source of the GaN HEMT are ohmic contacts. The standard ohmic metal for GaN HEMTs is Ti/Al/Ni/Au [39]. The drain and source ohmic contacts constitute parasitic elements in the GaN HEMT, it is essential to minimize the contact resistance (Rc) in order to promote a good performance. To improve the ohmic contacts, several studies have focused on recessed ohmic contact. In [40], a recess etching by inductive coupled plasma etching (ICP) was performed before metal deposition and obtained a Rc of 0.3 Ωmm. Furthermore, in [41] a very low Rc of 0.26 Ωmm was obtained due to direct contact between ohmic electrode and the 2DEG channel.
Passivation
The passivation layer reduces the surface traps in the gate–drain access region. SiN is most commonly used for surface passivation in GaN HEMTs [42]. The effects of un-passivated devices are [43]: (1) Decrease of drain current capability; (2) Reduction of the 2DEG density (3) Activation of surface traps (4) Increase of leakage current.
Heterojunction AlGaN/GaN
The principle feature of this structure is the AlGaN/GaN heterojunction. At the interface between these two layers, a layer of high-mobility electrons called “two-dimensional electron gas” (2DEG) forms as a result of spontaneous and piezoelectric polarizations of GaN material properties.

46
Transition (Buffer) layer
The buffer layer serves to prevent injection of electrons into a substrate during high Voltage operation, thereby improving performance of the GaN transistor during high Voltage operation [44]. AlN is preferably used as a component of this transition layer [45].
Substrate
The used substrate for the GaN HEMT can be Si, GaN or SiC. The criteria for substrate choice are: (1) low lattice-mismatch relative to the materials of the device layers; (2) good thermal conductivity; (3) low price per area.
Based on the literature [46-51], we have compared in Table 2.4 the various substrate materials used for the GaN HEMTs, such as: Si, SiC and GaN substrates. As observed in Table
2.4, the GaN substrate still the best choice for the GaN HEMT due to its low lattice mismatch and its good thermal conductivity. However, the price of GaN substrate is very expensive compared to Si. The use of SiC as substrate for the GaN HEMT can improve its thermal performances due to its good thermal conductivity properties. Also, SiC substrate has a much smaller lattice mismatch (~3%), is in principle a more suitable substrate, but is available only in small diameters and is very expensive. At the present, the silicon is widely used as a substrate for GaN HEMT because of their commercial availability and excellent surface preparation. However, the use of Si produces high lattice-mismatch. This causes the occurrence of dislocations and cracking of the grown layer due to the lattice mismatch and the difference in the thermal expansion coefficient between GaN and the substrate. Increasing device leakage [48] and promoting metal diffusion along the dislocation sites [49]. Table 2.4: GaN HEMT substrate comparison: Si, SiC and GaN.
Substrate Si SiC GaN
Advantage Low price (<100$) [46]. Good thermal conductivity [47].
Low lattice mismatch [50].
Good thermal conductivity.
Challenge • Poor thermal conductivity [47] • Large lattice mismatch (~16%)
[51]. • Increased leakage current [48]. • Metal diffusion along
dislocation sites [49].
• Existence of lattice mismatch (~3%) [51].
• High price (100$ to 200$) [46].
• High price (200$) [46].
2.4.3. GaN HEMT normally-off
For safety reasons, the GaN HEMT used in power converters should be normally-off devices. In this way, if the gate driver fails and its output goes to zero, the HEMT switches to the off-state. If a simple AlGaN/GaN heterojunction is used to fabricate a HEMT, the device shows a normally-on behavior. Several solutions have been proposed throughout the years to achieve normally-off operation. In Table 2.5, we have compared based on the literature the various GaN HEMT technologies. As observed section 2.4.2, the normally-on devices have a simple structure and do not require complicated gate drive configuration. However, even when the gate bias is equal to zero volt, a current is formed in the 2DEG channel due to the spontaneous and piezoelectric polarization of the GaN material, which is not safe for power converter applications.

47
The implantation of fluorine ions under the gate results in normally-off behavior. However, this technic suffers from both the instability of the doped F-ions with high temperature [52] and the instability of VTH over the time [53].
Cascode structure is a hybrid technology between Si MOSFET and GaN HEMT transistors, which connect a low-voltage Si MOSFET to the gate of a high-voltage GaN HEMT. This hybrid configuration, demonstrates a normally-off behavior. Moreover, the structure is compatible with existing Si gate drivers [54].
The use of a p-GaN or p-AlGaN layer on top of the AlGaN/GaN heterojunction enables a positive shift of the VTH voltage ranging from 1 to 3 V with the applied gate voltage larger than 5 V. Table 2.5: Comparison of GaN HEMT structures.
Normally-on F doped gate P-type gate Cascode
Structure
Advantage Simple structure Simple process
(see section II.4.2.)
Positive VTH. Normally-off. Lower gate
leakage current.
High positive Vth (Vth>1).
Normally-off. Stable VTH. Lower gate
leakage current.
High positive VTH. Normally-off. Gate driver.
compatible with that of Si devices.
Good reliability.
Challenge Complex gate drive configuration.
Unsafe for switching appellations: current flow at VGS =0V [55].
Instability of doped F-ions with high temperature [52].
Instability of Vth over the time [53].
Limited high speed [54]. High fabrication cost.
Manufacturer Cree [56]
MACOM [57]
Academic project [58-59]
GaN system [60]
Panasonic [61]
EPC
Transform [62]
The p-GaN GaN HEMT normally-off approach is finding wide consensus within the
scientific and industrial community. Nowadays, the p-GaN technology is the most attractive in the GaN HEMT market [63]. For this reason, it is important to investigate the main issues related to the stability of these devices. In the next section, we have presented the main degradation mechanisms that take place in GaN HEMT with p-GaN gate for power switching applications.

48
2.5. Aging of the GaN HEMT power transistors
To understand the various degradations of power GaN HEMT under switching conditions, we have performed a failure mode and effects analysis (FMEA). Table 2.6 summarizes the most critical degradation processes that are induced by off-state, on state and semi-on state stress, along with the related failure modes. As shown in this table, the most critical failure mode is the increase of the on-state resistance (RDS(On)) due to the trapping of hot electrons under the gate [64] and the generation of lattice defects [65]. This may induce an elevation in the device temperature due to the increase of power conduction losses generated by the on-state resistance RDS(On). Another critical failure mode of the GaN HEMT is the negative shift of the threshold voltage VTH. This is caused by the trapping of electrons in the gate area [66]. This may induce a safety critical failure in the gate driving circuit of the power converter with GaN HEMT. The time-dependent failure mode is another issue facing the GaN HEMT power transistors. This degradation is due to the generation of short circuit paths in the GaN HEMT structure. This may increase the leakage current in the power converter circuit with GaN HEMT. Table 2.6: The most critical failure mode and effects analysis of the GaN HEMT.
Component Failure mode Failure cause Failure effect
GaN HEMT power transistor
Increase in RDS(On) -Trapping of hot electrons under the gate.
and at the gate edge [64].
-Generation of lattice defects [65].
- Elevation in the device temperature.
- High conduction power losses.
VTH shift - Trapping/detrapping of electrons in the gate area [66].
-Normally-on behavior.
Decrease in gm -Buffer trapping [67].
-Surface trapping [68].
- RF performance degradation.
- Current collapse.
Time-dependent
Degradation
- Generation of source-drain current paths [69].
- Short circuits between gate and channel [70].
Increase of IDSS leakage current until the vertical (drain to substrate) breakdown.
Time-dependent
gate breakdown
- Generation of defects/leakage paths in the p-GaN/AlGaN gate stack [71].
Increase of IGSS leakage current until the gate breakdown.
In the literature including the GPM laboratory, various work were performed to evaluate the reliability of the GaN power devices, including: short-circuit, HTRB, HTGB and switching stresses [72].

49
2.5.1. Short circuit stress
Short-circuit stresses enable to evaluate the robustness of power GaN HEMT transistors under high drain current pulses with short duration. In [73], a repetitive and non-destructive short-circuit aging test were applied on a 600 V GaN Gate Injection Transistor (GIT). The evolutions of C-V and I-V characteristics during the repetitive short-circuit tests show significant degradations before and after the test. During this test the DUT is maintained at on-state during a 4 ms short-circuit phase with the drain voltage VDS equal to 35 V. After the aging test, the saturate region of IDS(sat) decreases obviously, which is due to the increase of the on-state resistance RDS(ON). Also, the CGS capacitance was increased due to the charge trapping and de-trapping between the gate-source [74].
2.5.2. Static stresses: HTGB, HTRB
High Temperature Gate Bias (HTGB) and High Temperature Reverse Bias (HTRB) tests are JEDEC standards qualification tests for electronic devices [75]. During the aging, the Devices Under Test were placed in an environmental chamber which provided a constant temperature of 150 °C and in the meantime, they were bias stressed by applying a gate-source DC voltage with drain shorted to source for HTGB stress or by applying a drain-source DC voltage with gate shorted to source for HTRB stress [76].
In [72], HTRB stress experiments are performed on a power GaN HEMT to investigate the degradation phenomena. Several degradation characteristics of DC parameters such as the reduction of saturated drain current, the increase of gate leakage current and on-resistance and the shift of threshold voltage are identified. The degradation mechanism is ascribed to the trapping of electrons in the region under the gate and the access region of gate to drain. These mechanisms may significantly limit the performance of power GaN HEMTs when they are operated at high drain voltage and frequency levels [77].
In [78], the threshold voltage instability during high temperature gate bias (HTGB) test has been investigated for a power GaN HEMT. The negative threshold voltage shift, occurring at large positive gate biases, has been attributed to holes generated by impact ionization in the high-field depleted p-GaN region and accelerated toward the AlGaN layer [79]. Authors in [80] have demonstrated the suppression of the negative VTH shift by optimizing the etching and passivation of the p-GaN layer.
2.5.3. Switching stress
In [81], a switching aging stress was performed under the Safe Operating Area (SOA) of a 600 V / 30 A power GaN HEMT. The used switching bench offers a low energy consumption because no load is used. Also, it places a similar electrical waveform on DUTM, which could exist in a large class of power management products such as DC-DC power converters. A 1000 h aging campaign has shown degradation of the DUT electrical characteristics, such as increase of RDS(ON), IDSS and IGSS. As presented in [82], these degradations are related to a self-heating activated mechanism.
In chapter 5, we have studied the aging of power GaN HEMT under operational switching conditions. We have extended our investigation of the aging of GaN HEMT not only in static characteristics but also in the dynamic aspect. For this, we have implemented both C-V and S

50
parameters measurements in the GPM laboratory. Also, in this work, we have studied the impact of aging the DUT in power converters application by a modeling approach.
2.6. GaN HEMT power losses modeling
Significant improvements in efficiency of power converters can be achieved due to the superior switching properties of GaN HEMT. The authors in [83] studied the efficiency of a T-type inverter with Si IGBT, SiC MOSFET and GaN HEMT at 600 V blocking voltage range.
Fig. 2.26 (a) shows the schematic of the T-Type converter and Fig. 2.26 (b) shows the efficiency analysis at 32 kHz for Si IGBT, SiC MOSFET and GaN HEMT. At 32 kHz, GaN HEMT brings up to 1.6 % efficiency gain and up to 0.75 % when using SiC MOSFET. This is due to the poor switching performance of Si IGBT.
Fig. 2.26: Power converter efficiency comparison between Si IGBTs, SiC MOSFETs and GaN HEMTs: (a) T-type inverter topology (b) Efficiency comparison at 32 kHz [83].
The high efficiency of power converters with GaN HEMT are due to the GaN advantage technology over silicon devices. As shown in Fig. 2.27, the gate capacitance at the input of the GaN HEMT is about four times lower than for a comparable silicon-based solution [84], yielding a higher switching rate and higher efficiency as a result of reduced gate drive losses [85].
Another important benefit is low-output capacitance, which results in higher switching frequencies and helps to reduce switching losses [86]. Additionally, RDS(on) is about two times lower than for Si devices, resulting in lower conduction losses [87]. Finally, the use of GaN transistors enable to eliminate the integrated “body” diode. In consequence, achieving higher power efficiency by eliminating the reverse recovery loss [88].
(a) (b)

51
Fig. 2.27: GaN HEMT package and comparison to Si MOSFET parasitic elements [84].
2.6.1. Power losses in DC power converter
In a switching mode power converter, such as Boost DC/DC converter topology shown in Fig. 2.28 (a), the transistor is continuously switched from the off-state to the on-state and vice versa. When the transistor is in the off-state, a high voltage (up to 650 V) is applied between drain and substrate, drain and source, and between drain and gate. On the other hand, in the on-state, the gate is positively biased at voltages higher than 5-6 V (in case of normally-off transistors) and a high current (up to 30 A) flow between the drain and source. Finally, when the transistor switches from the off-state to the on-state, it crosses a semi-on condition, in which the voltage and current on the drain may be simultaneously high (grey areas in Fig. 2.28 (b)).
Fig. 2.28: Boost DC/DC converter: (a) Circuit schematic (b) representation of the different operating regimes of the transistor in a boost converter.
This Boost DC/DC switching application will be used in chapter 5 to evaluate the effect of aging of the GaN HEMT power transistors on the power converter efficiency. In this topology, the conduction power losses are defined in [89] by:
• Losses in the inductor:2 (2.7)L L INP R I=
IDS VDS
Switching losses
Conduction losses
(a)
(b)

52
• Losses in the transistor: 2
( ) (2.8)T DS on INP R I D=
• Losses in the diode: ( ) ( )2 1 (2.9) D D IN f INP R I V I D= + −
• Duty cycle: (2.10)ONTD
T=
The switching power losses are defined by:
• Turn-on switching losses: 0.5 (2.11)rr OUT IN
tP V I
T=
• Turn-off switching losses: 0.5 (2.12)f
f OUT IN
tP V I
T=
Where RL is the dc inductor resistance, RDS(on) is the transistor on-resistance, RD is the diode series resistance, D is the duty-cycle, and VF is the diode forward voltage. tf and tr are the fall and rise times of the transistor drain current, respectively, while T is the period of the control signal and TON is the on-state period. The approximate expression for the converter efficiency is given in [89] by:
(2.13)OUT
OUT L D T f r
P
P P P P P P =
+ + + + +
where POUT is the output power of the converter.
2.6.2. Estimation of GaN power losses
The estimation of power losses with high convergence to measurements is necessary to design efficient power converters using GaN transistors. The authors in [90] have proposed an estimation of power losses based on a look-up tables of energy losses to estimate the switching losses of the IGBTs. Also, the authors in [91] have estimated and compared the power switching energy of GaN HEMTs to equivalent Si devices such as IGBT and MOSFETs. In chapter 3, we estimate both the static and dynamic power losses of GaN HEMTs, which are most significant in DC-DC power converter with GaN HEMT [92].
The distribution of power losses in the Boost DC/DC converter of Fig. 2.28 (a) with GaN HEMT transistors for VIN = 16 V, VOUT = 34 V and POUT = 15 W are shown in Fig. 2.29 [89]. As observed, the majority of losses in the power converter are due to both the conduction losses and switching losses of the GaN HEMT.
In order to study the effect of GaN power losses on the efficiency of power converter, an efficient approach for the estimation of losses is necessary. Furthermore, the estimation of the GaN HEMT power losses offers to the power converter designers the possibility to estimate the power losses of GaN HEMT with high accuracy without the use of complex switching bench, which reduces both the time to market and cost.

53
Fig. 2.29: Distribution of power losses in Boost DC/DC converter with VIN = 16 V; VOUT = 34 V and POUT = 15 W [89].
The power losses of the GaN HEMT can be estimated using SPICE simulation approach. This approach consists of building the compact model of the DUT in a SPICE simulator software, such as: LTspice, Orcad, and ADS. The SPICE model of the GaN HEMT is given in [93] and described in Fig. 2.30, where RD, RG and Rs are the parasitic resistances at the gate, drain and source, respectively. The current source iD determines the current from drain to source, which is a function of VGS and VDS. CGS, CGD and CDS are the capacitances between the gate and source, the gate and drain and the drain and source, respectively. These capacitances are nonlinear functions of VGS, VGD and VDS.
Fig. 2.30: GaN HEMT SPICE model [93].
SPICE models of the GaN-based HEMT is constructed on the basis of experimental data. Then, the static and dynamic characteristics are obtained by simulation for any power conversion switching application.
Another model that enables the estimation of the GaN HEMT power losses by simulation is the compact physical model [94]. This model includes both the current–voltage (I–V) and the charge–voltage (Q–V) formulations. Fig. 2.31 shows the topology of the complete GaN HEMT compact model. Conduction current is represented by Icon between the drain and source electrodes. The capacitances are integrated into charges and used to calculate the displacement currents. Reverse conduction between gate and source is represented by Irev. Forward conduction from gate to source is represented by Ifor. The current generator Itun between drain and gate represents current leakage. Finally, the current generator Ichbd between drain and source represents channel breakdown.
GaN HEMT conduction losses
GaN HEMT switching losses
Diode losses
Inductor losses
31%
39%
11%
19%

54
Fig. 2.31: Compact physical GaN HEMT model [94].
The physics-based compact GaN HEMT model allows the estimation by simulation of both the conduction and switching power losses of the GaN HEMT. However, this model requires detailed information about material properties and internal structure of the device. Otherwise, SPICE model does not require information about the physical structure of the device, since it based on behavioral equations of the GaN transistor.
In the literature, various GaN HEMT SPICE models have been proposed for modeling the GaN HEMT static and dynamic power losses. References [95] and [96] show a simple and accurate segmented behavioral model, which include the important static parameters of the GaN HEMTs. However, these models suffer from the discontinuity of the simulated curves, because the used equations are divided into three segments according to cutoff, linear and saturation regions.
A comparison of existing SPICE model is shown in Table 2.7 as given in [97]. According to this table, the least number of parameters, 59, corresponds to the Curtice model. However, the Curtice model does not take into account the electro-thermal effects of the GaN HEMT device parameters. Consequently, the Curtice model cannot be used for the estimation of the GaN HEMT power losses at various temperature.
All models have a substantial number of parameters. The Angelov model has a higher number of parameters compared to both Curtice and MET models. The larger parameter number of the Angelov model introduces a longer parameter extraction time, which is not suitable in switching power converter applications. Finally, the Motorola Electrothermal (MET) combines both a lower number of parameters and high electrothermal sensitivity of the GaN HEMT device parameters, which makes the MET model very attractive for modeling both the static and dynamic power losses of the GaN HEMT in power converter applications.
In chapter 3, we have adopted the SPICE electro-thermal model of Motorola for the estimation of the GaN HEMT power losses. Furthermore, The MET SPICE model is used in chapter 5 to study the impact of aging the power GaN HEMT under operational switching conditions on the power converter efficiency.

55
Table 2.7: Comparison of available GaN SPICE models [97].
SPICE Model Number of parameters Electrothermal model Origin device context
Curtice 59 No GaAs MESFET
Motorola Electrothermal (MET)
62 Yes GaN HEMT
Angelov 90 Yes GaN HEMT
2.7. Conclusion
This chapter presents the state of art of GaN HEMT power transistors in power converter applications. Firstly, it has been reported that the GaN HEMT devices satisfy the requirement of the power converter market for a high operating voltage, high operating current, high power density, high switching frequency, and strong reliability, which makes the GaN technology an attractive candidate for replacing Si power devices in power applications. However, SiC technology has always been a hot candidate for GaN in high power and high temperature applications. However, the high frequency applications are the main market of GaN and this huge market is pushing the GaN to dominate both the Si and SiC markets. Furthermore, the increased demand of efficient power conversion systems, makes the GaN devices more attractive for automotive and renewable energy industry. Next, the physical properties of the GaN semiconductor are presented and compared with those of Si and SiC. It is found that the GaN combine both the high-speed and high-voltage performances. This is followed by a description of the working principle of the AlGaN/GaN HEMT. Moreover, a comparison of the various GaN HEMT normally-off technologies are reported. Next, the various technics for aging the GaN HEMT transistors are presented. Furthermore, the major degradations of power GaN HEMT under switching conditions are summarized. Finally, the SPICE modeling approach enables the estimation of the GaN HEMT power losses with high accuracy. The SPICE simulation tool can be used for studying the impact of the aging the GaN HEMT on the efficiency of power converter applications. In the next chapter, an experimental methodology for the estimation of the GaN HEMT power losses based on experimental static and dynamic measurements using SPICE simulation approach will be presented.
2.8. References
[1] International Energy Agency (IEA), "World Energy Outlook 2019", IEA, Paris. 2019.
[2] International Energy Agency (IEA), "Change in oil and electricity consumption, 2000 - 2018", IEA, Paris. 2019.
[3] International Energy Agency (IEA), "Change in oil and electricity consumption in the Stated Policies Scenario, 2018-2040", IEA, Paris. 2019.
[4] Saving Energy Through Innovation and Technology. Infineon Technologies North America Corp. 2008.
[5] Maric, D., & Monteiro, R. 20V MOSFETs for DC-DC converters in desktop computers and servers. In APEC. Seventeenth Annual IEEE Applied Power Electronics Conference and Exposition (Vol. 2, pp. 872-877). IEEE. 2002.

56
[6] Power GaN: Epitaxy, Devices, Applications and Technology Trends report, Yole Development. 2020
[7] Dr. Hong Lin, Technology & Market Analyst at Yole Développement (Yole). “Supply chain of the GaN power device industry is acting to support the growth”. 2018.
[8] Yole Development news. “Transphorm ships over half a million GaN power devices for multi-kilowatt class applications”. 2019.
[9] Yole Development news. “Transphorm adds second 900V GaN FET, targeting three-phase industrial power supplies and automotive converters”. 2019.
[10] Yole Development news. “Toyoda Gosei doubles operating current in vertical GaN power device from 50A to 100A”. 2019.
[11] Yole Development news. “GaN Systems announces world’s highest current rated GaN Power transistor”. 2018.
[12] Yole Development news. “EPC introduces 350 V eGaN power transistor − 20 times smaller than comparable silicon”. 2018.
[13] Gallium Nitride Power Transistors in the EV World. GaN Systems Inc, 2017.
[14] Yole Development news. “Shorter time to market now in play with new GaN Systems’ high-performance buck converter evaluation board”. 2018.
[15] Yole Development news. “JEDEC wide bandgap power semiconductor committee publishes its first document: test method for dynamic resistance of GaN HEMT”. 2019.
[16] International Energy Agency (IEA), "Electric vehicle stock in the EV30@30 scenario, 2018-2030", IEA, Paris. 2019.
[17] International Energy Agency (IEA), "Global EV Outlook 2019", IEA, Paris. 2019.
[18] GaN Systems report. “GaN automotive market”. 2020.
[19] International Energy Agency (IEA), "Renewables 2019", IEA, Paris. 2019.
[20] GaN renewable energy market, GaN Systems Inc, 2019.
[21] Annual Energy Outlook 2017, U.S. Energy Information Administration, 2017.
[22] Shockley, W.: Introductory Remarks in Silicon Carbide, A High Temperature Semiconductor, Pergamon Press, 1960.
[23] Yole Development news. “GaN power devices applications are just starting to tick upwards”. 2017
[24] GS66508P Preliminary Datasheet, GaN_Systems_Inc. 2020.
[25] SCT2120AF Preliminary Datasheet, Rohm Semiconductor Inc. 2020
[26] Sarnago, H., Lucía, Ó., Mediano, A., & Burdío, J. M. (2014, March). Full-bridge quasi-resonant class-DE inverter for optimized high frequency operation with GaN HEMT devices. In 2014 IEEE Applied Power Electronics Conference and Exposition-APEC 2014 (pp. 1299-1303). IEEE.
[27] Zhang, Liqi, et al. "Comparative study of temperature sensitive electrical parameters (TSEP) of Si, SiC and GaN power devices." 2016 IEEE 4th Workshop on Wide Bandgap Power Devices and Applications (WiPDA). IEEE, 2016.
[28] Lautner, J., & Piepenbreier, B. (2015, June). Analysis of GaN HEMT switching behavior. In 2015 9th International Conference on Power Electronics and ECCE Asia (ICPE-ECCE Asia) (pp. 567-574). IEEE.
[29] Hasari, S. A. S., Salemnia, A., & Hamzeh, M. (2017). Applicable method for average switching loss calculation in power electronic converters. Journal of Power Electronics, 17(4), 1097-1108.
[30] Yu, Hongyu, and Tianli Duan, eds. Gallium Nitride Power Devices. CRC Press, 2017.
[31] Chow, T. P., Khemka, V., Fedison, J., Ramungul, N., Matocha, K., Tang, Y., & Gutmann, R. J. (2000). SiC and GaN bipolar power devices. Solid-State Electronics, 44(2), 277-301.

57
[32] Paskova, Tanya, ed. Nitrides with nonpolar surfaces: growth, properties, and devices. John Wiley & Sons, 2008.
[33] Yonenaga, Ichiro, and Kensaku Motoki. "Yield strength and dislocation mobility in plastically deformed bulk single-crystal GaN." Journal of Applied Physics 90.12 (2001): 6539-6541.
[34] Wood, Colin, and Debdeep Jena, eds. Polarization effects in semiconductors: from ab initio theory to device applications. Springer Science & Business Media, 2007.
[35] Park, S. H., & Chuang, S. L. (2000). Spontaneous polarization effects in wurtzite GaN/AlGaN quantum wells and comparison with experiment. Applied Physics Letters, 76(15), 1981-1983.
[36] Meneghini, Matteo, Gaudenzio Meneghesso, and Enrico Zanoni. Power GaN Devices. Springer, 2017.
[37] Ambacher, O., et al. "Two-dimensional electron gases induced by spontaneous and piezoelectric polarization charges in N-and Ga-face AlGaN/GaN heterostructures." Journal of applied physics 85.6 (1999): 3222-3233.
[38] Miura, Naruhisa, et al. "Thermal annealing effects on Ni/Au based Schottky contacts on n-GaN and AlGaN/GaN with insertion of high work function metal." Solid-State Electronics 48.5 (2004): 689-695.
[39] Jacobs, B., Kramer, M. C. J. C. M., Geluk, E. J., & Karouta, F. Optimisation of the Ti/Al/Ni/Au ohmic contact on AlGaN/GaN FET structures. Journal of Crystal Growth, 241(1-2), 15-18. 2002.
[40] Zhang, J., Wang, L., Wang, Q., Jiang, Y., Li, L., Zhu, H., & Ao, J. P. Plasma-assisted ohmic contact for AlGaN/GaN heterostructure field-effect transistors. Semiconductor Science and Technology, 31(3), 035015. 2016.
[41] Wang, L., Kim, D. H., & Adesida, I. Direct contact mechanism of Ohmic metallization to AlGaN/GaN heterostructures via Ohmic area recess etching. Applied Physics Letters, 95(17), 172107. 2009.
[42] Kim, Hyungtak, et al. "Effects of SiN passivation and high-electric field on AlGaN-GaN HFET degradation." IEEE Electron device letters 24.7 (2003): 421-423.
[43] Tilak, V., et al. "Effect of passivation on AlGaN/GaN HEMT device performance." 2000 IEEE international symposium on compound semiconductors. Proceedings of the IEEE twenty-seventh international symposium on compound semiconductors (Cat. No. 00TH8498). IEEE, 2000.
[44] Smart, Joseph, et al. "High voltage GaN-based transistor structure." U.S. Patent No. 7,026,665. 11 Apr. 2006.
[45] Roberts, John C., et al. "AlGaN transition layers on Si (111) substrates-observations of microstructure and impact on material quality." MRS Online Proceedings Library Archive 1068 (2008).
[46] Duboz, J‐Y. "GaN as seen by the industry." physica status solidi (a) 176.1 (1999): 5-14.
[47] Binari, S. C., et al. "AlGaN/GaN HEMTs grown on SiC substrates." Electronics Letters 33.3 (1997): 242-243.
[48] J. W. P. Hsu, M. J. Manfra, R. J. Molnar, B. Heying, and J. S. Speck, “Direct imaging of reverse bias leakage through pure screw dislocations in GaN films grown by molecular beam epitaxy on GaN templates,” Appl. Phys. Lett., vol. 81, pp. 79–81, July 2002.
[49] C. Y. Hsu, W. H. Lan, and Y. C. S. Wu, “Effect of thermal annealing of Ni/Au ohmic contact on the leakage current of GaN based light emitting diodes,” Appl. Phys. Lett., vol. 83, pp. 2447–2449, Sept. 2003.
[50] Chu, K. K., et al. "9.4-W/mm power density AlGaN-GaN HEMTs on free-standing GaN substrates." IEEE Electron Device Letters 25.9 (2004): 596-598.
[51] Steckl, A. J., et al. "SiC rapid thermal carbonization of the (111) Si semiconductor‐on‐insulator structure and subsequent metalorganic chemical vapor deposition of GaN." Applied Physics Letters 69.15 (1996): 2264-2266.
[52] Lorenz, Anne, et al. "Influence of thermal anneal steps on the current collapse of fluorine treated enhancement mode SiN/AlGaN/GaN HEMTs." physica status solidi c 6.S2 2 (2009): S996-S998.
[53] CAI, Yong, ZHOU, Yugang, LAU, Kei May, et al. Control of threshold voltage of AlGaN/GaN HEMTs by fluoride-based plasma treatment: From depletion mode to enhancement mode. IEEE transactions on electron devices, 2006, vol. 53, no 9, p. 2207-2215.

58
[54] Huang, Xiucheng, et al. "Evaluation and application of 600 V GaN HEMT in cascode structure." IEEE
Transactions on Power Electronics 29.5 (2014)
[55] Su, Ming, Chingchi Chen, and Siddharth Rajan. "Prospects for the application of GaN power devices in hybrid electric vehicle drive systems." Semiconductor Science and Technology 28.7 (2013): 074012.
[56] CG2H40010 Preliminary Datasheet, Cree_Inc. 2020
[57] MAGE-102425-300S00Preliminary Datasheet, MACOM Gallium Nitride (GaN). 2020.
[58] Ma, C.; Chen, H.; Zhou, C.; Huang, S.; Yuan, L.; Roberts, J.; Chen, K.J. ON-state critical gate overdrive voltage for fluorine-implanted enhancement-mode AlGaN/GaN high electron mobility transistors. J. Appl. Phys. 2011, 110, 114514.
[59] Wang, M.J.; Yuan, L.; Chen, K.J.; Xu, F.J.; Shen, B. Diffusion mechanism and the thermal stability of fluorine ions in GaN after ion implantation. J. Appl. Phys. 2009, 105, 083519.
[60] GS-065-150-1-D Preliminary Datasheet, GaN_Systems_Inc. 2020.
[61] PGA26E06BA Preliminary Datasheet. Panasonic_Inc. 2018
[62] TP65H035G4WS Preliminary Datasheet. Transphorm_Inc. 2020
[63] Amano, H., Baines, Y., Beam, E., Borga, M., Bouchet, T., Chalker, P. R., ... & De Santi, C.. The 2018 GaN power electronics roadmap. Journal of Physics D: Applied Physics, 51(16), 163001. 2018.
[64] Ruzzarin, M., Meneghini, M., Rossetto, I., Van Hove, M., Stoffels, S., Wu, T. L., ... & Zanoni, E. Evidence of hot-electron degradation in GaN-based MIS-HEMTs submitted to high temperature constant source current stress. IEEE Electron Device Letters, 37(11), 1415-1417. 2016.
[65] Y. S. Puzyrev, T. Roy, M. Beck, B. R. Tuttle, R. D. Schrimpf, D. M. Fleetwood, and S. T. Pantelides, “Dehydrogenation of defects and hot-electron degradation in GaN high-electron-mobility transistors,” J. Appl. Phys., vol. 109, no. 3, pp. 0–8, 2011.
[66] M. Meneghini, I. Rossetto, D. Bisi, M. Ruzzarin, M. Van Hove, S. Stoffels, T. Wu, D. Marcon, S. Decoutere, G. Meneghesso, and E. Zanoni, “Negative Bias-Induced Threshold Voltage Instability in GaN-on-Si Power HEMTs,” IEEE Electron Device Lett., vol. 37, no. 4, pp. 474–477, 2016.
[67] G. Meneghesso, M. Meneghini, I. Rossetto, D. Bisi, S. Stoffels, M. Van Hove, S. Decoutere, and E. Zanoni, “Reliability and parasitic issues in GaN-based power HEMTs: a review,” Semicond. Sci. Technol., vol. 31, p. 093004, 2016.
[68] G. Meneghesso, M. Meneghini, D. Bisi, I. Rossetto, A. Cester, U. K. Mishra, and E. Zanoni, “Trapping phenomena in AlGaN / GaN HEMTs: a study based on pulsed and transient measurements,” Semicond. Sci. Technol., vol. 074021, 2013.
[69] M. Meneghini, S. Member, G. Cibin, M. Bertin, A. G. M. Hurkx, P. Ivo, J. Šonský, J. A. Croon, G. Meneghesso, and E. Zanoni, “OFF -State Degradation of AlGaN / GaN Power HEMTs: Experimental Demonstration of time-dependent drain-source breakdown,” IEEE Trans. Electron Devices, vol. 61, no. 6, pp. 1987–1992, 2014.
[70] I. Rossetto, M. Meneghini, S. Member, S. Pandey, M. Gajda, G. A. M. Hurkx, J. A. Croon, J. Šonský, G. Meneghesso, and E. Zanoni, “Field-Related Failure of GaN-on-Si HEMTs: Dependence on Device Geometry and Passivation,” IEEE Trans. Electron Devices, vol. 64, no. 1, pp. 73–77, 2017.
[71] I. Rossetto, M. Meneghini, S. Dalcanale, E. Zanoni, O. Hilt, E. Bahat-treidel, J. Wuerfl, and F. Institut, “Failure in p-type GaN High Electron Mobility Transistors under high forward bias stress,” Proc. 2016 28th Int. Symp. Power Semicond. Devices ICs June 12– 16, 2016, Prague, Czech Repub., pp. 35–38, 2016.
[72] XueYang, L., YuanSheng, W., Chang, Z., RuGuan, L., Yiqiang, C., Ping, L., ... & YunHui, E. (2014, June). Investigation of high-temperature-reverse-bias (HTRB) degradation on AlGaN/GaN HEMTs. In 2014 IEEE International Conference on Electron Devices and Solid-State Circuits (pp. 1-2). IEEE, 2014.
[73] Li, H., Li, X., Wang, X., Wang, J., Alsmadi, Y., Liu, L., & Bala, S. E-mode GaN HEMT short circuit robustness and degradation. In 2017 IEEE Energy Conversion Congress and Exposition (ECCE) (pp. 1995-2002). IEEE. October, 2017.

59
[74] JZ, Fu, et al. "Evolution of CV and IV characteristics for a commercial 600 V GaN GIT power device under repetitive short-circuit tests." Microelectronics Reliability 88 (2018): 652-655.
[75] JEDEC Standard JESD22-B111. Board level drop test method of components for handheld electronic products, 2016.
[76] El Hami, Abdelkhalak, David Delaux, and Henri Grzeskowiak. Fiabilité des systèmes mécatroniques de forte puissance 1: Application automobile et aéronautique simulation, modélisation et optimisation. Vol. 1. ISTE Press, 2018.
[77] RuGuan, L., YuanSheng, W., Chang, Z., XueYang, L., Ping, L., & Yun, H. (2014, June). Impact of high temperature reverse bias (HTRB) stress on the degradation of AlGaN/GaN HEMTs. In 2014 IEEE International Conference on Electron Devices and Solid-State Circuits (pp. 1-2). IEEE, 2014.
[78] Tallarico, A. N., Stoffels, S., Posthuma, N., Decoutere, S., Sangiorgi, E., & Fiegna, C. (2019). Threshold voltage instability in GaN HEMTs with p-Type gate: Mg doping compensation. IEEE Electron Device Letters, 40(4), 518-521. 2019
[79] A. N. Tallarico, S. Stoffels, N. Posthuma, P. Magnone, D. Marcon, S. Decoutere, E. Sangiorgi, and C. Fiegna, “PBTI in GaN-HEMTs with p-type gate: Role of the aluminum content on VT H and underlying degradation mechanisms,” IEEE Trans. Electron Devices, vol. 65, no. 1, pp. 38–44, 2018.
[80] A. Tajalli, E. Canato, A. Nardo, M. Meneghini, A. Stockman, P. Moens, E. Zanoni, and G. Meneghesso, “Impact of sidewall etching on the dynamic performance of GaN-on-Si E-mode transistors,” Microelectron. Rel., vols. 88–90, pp. 572–576, Sep. 2018
[81] Echeverri, A. (2018). Reliability study of power AlGaN/GaN HEMT transistors under operational condition, PHD thesis University of Rouen Normandie, Rouen, France.
[82] Y. Wu, C.-Y. Chen, and J. A. del Alamo, ‘Temperature-Accelerated Degradation of GaN HEMTs under High-Power Stress: Activation Energy of Drain-Current Degradation’, JEDEC Solid State Technology Association, pp. 69–73, 2014.
[83] Gurpinar, E., & Castellazzi, A. Single-phase T-type inverter performance benchmark using Si IGBTs, SiC MOSFETs, and GaN HEMTs. IEEE Transactions on Power Electronics, 31(10), 7148-7160. 2015.
[84] Rick Pierson. “Design Efficient High-Density Power Solutions with GaN”. Efficient Power Conversion (EPC). Jun 11, 2019
[85] Huang, X., Li, Q., Liu, Z., & Lee, F. C. Analytical loss model of high voltage GaN HEMT in cascode configuration. IEEE Transactions on Power Electronics, 29(5), 2208-2219. 2013.
[86] Brandelero, J., Cougo, B., Meynard, T., & Videau, N. A non-intrusive method for measuring switching losses of GaN power transistors. In IECON 2013-39th Annual Conference of the IEEE Industrial Electronics Society (pp. 246-251). IEEE. November, 2013.
[87] Saito, W., Kuraguchi, M., Takada, Y., Tsuda, K., Omura, I., & Ogura, T. High breakdown voltage undoped AlGaN-GaN power HEMT on sapphire substrate and its demonstration for DC-DC converter application. IEEE Transactions on Electron Devices, 51(11), 1913-1917. 2004.
[88] Bahat-Treidel, E., Hilt, O., Zhytnytska, R., Wentzel, A., Meliani, C., Wurfl, J., & Trankle, G. Fast-switching GaN-based lateral power Schottky barrier diodes with low onset voltage and strong reverse blocking. IEEE Electron Device Letters, 33(3), 357-359. 2012.
[89] Gamand, Florent, LI, Ming Dong, et Gaquiere, Christophe. A 10-MHz GaN HEMT DC/DC boost converter for power amplifier applications. IEEE Transactions on Circuits and Systems II: Express Briefs, 2012, vol. 59, no 11, p. 776-779.
[90] Azzopardi, S., Jamet, C., Vinassa, J. M., & Zardini, C. Switching performances comparison of 1200 V punch-through and nonpunch-through IGBTs under hard-switching at high temperature. In PESC 98 Record. 29th Annual IEEE Power Electronics Specialists Conference (Vol. 2, pp. 1201-1207). IEEE. May, 1998.
[91] Mitova, R., Ghosh, R., Mhaskar, U., Klikic, D., Wang, M. X., & Dentella, A. Investigations of 600-V GaN HEMT and GaN diode for power converter applications. IEEE transactions on power electronics, 29(5), 2441-2452. 2013.

60
[92] Esposto, M., Chini, A., & Rajan, S. Analytical model for power switching GaN-based HEMT design. IEEE Transactions on Electron Devices, 58(5), 1456-1461. 2011.
[93] Okamoto, Masayuki, et al. "Loss evaluation of an AC-AC direct converter with a new GaN HEMT SPICE model." 2011 IEEE Energy Conversion Congress and Exposition. IEEE, 2011.
[94] Hou, D., Bilbro, G. L., & Trew, R. J. A compact physical AlGaN/GaN HFET model. IEEE transactions on electron devices, 60(2), 639-645. 2012.
[95] Shah, Krushal, and Krishna Shenai. "Simple and accurate circuit simulation model for gallium nitride power transistors." IEEE Transactions on Electron Devices 59.10 (2012): 2735-2741.
[96] Peng, Kang, Soheila Eskandari, and Enrico Santi. "Characterization and modeling of a gallium nitride power HEMT." IEEE Transactions on Industry Applications 52.6 (2016): 4965-4975.
[97] L. Dunleavy, C. Baylis, W. Curtice, and R. Connick, “Modeling GaN: Powerful but challenging," Microwave Magazine, IEEE, vol. 11, no. 6, pp. 82-96, 2010.

61
Chapter 3: GaN HEMT power losses estimation for switching
applications
3.1. Introduction
In the previous chapter, the importance of the estimation the GaN HEMT power losses for power converter application has been shown. As discussed, various SPICE models have been proposed in the literature for estimating the GaN HEMT power losses. However, these models do not take into consideration both the static and dynamic behavior of the GaN HEMT. In this chapter, a complete methodology for the estimation of the GaN HEMT power losses based on experimental measurement is proposed and described.
First, the pulsed I-V experimental setup is presented. The temperature dependency of the DUT static characteristics are discussed at various temperatures: from 5 °C to 115 °C by a step of 10 °C. The conduction power losses of the DUT is estimated based on a SPICE simulation approach for switching circuit applications. The evolution of the conduction losses is modelled as a function of both the junction temperature and output current.
Additionally, the C-V experimental setup is implemented in order to take into account the switching losses in the designed SPICE model of the GaN HEMT. The evolution of the switching losses is modelled as a function of the output current. The temperature dependence of the C-V characteristics is investigated using a Peltier heater plate in the temperature range from 5 °C to 115 °C. Moreover, the frequency dependency of the C-V measurements is carried out using HP 4192A impedance analyzer in the frequency range from 100 kHz to 10 MHz.
Next, the low current experimental bench is carried out for measuring the gate leakage current (IGSS) of the GaN HEMT. The IGSS current is studied at various temperatures and voltages. The gate power losses of the GaN HEMT has been modelled by measuring experimentally the gate leakage current of the DUT.
As a result, we have built an accurate power losses model of the GaN HEMT based on experimental measurements, which include the major power losses in power converter applications. This approach offers to the power converter designers the possibility to estimate the power losses of GaN HEMT with high accuracy without the use of complex switching bench, which reduces both the time to market and cost. Finally, using the extracted power losses model of the GaN HEMT, we have estimated the efficiency of a 30 V / 200 V DC-DC converter stage with GaN HEMT for a solar energy application.
3.2. Static characterization of GaN HEMT
In this section, the conduction power losses of the GaN HEMT have been estimated by modelling the static I-V characteristics of the GaN HEMT. First, the I-V experimental setup has been presented. The estimation of the conduction power losses is performed by a SPICE simulation using a non-segmented Electro-thermal model. Then, the temperature dependency of the I-V characteristic is studied from a low temperature (5˚C) to a high temperature (105˚C) using a Peltier heater plate. Furthermore, the modelled device is verified in a real switching

62
application using a developed efficient switching bench. Finally, the evolution of the GaN HEMT power losses in switching applications is modelled as a function of the temperature and output current.
3.2.1. Pulsed I-V Experiment setup
The Current-Voltage (I-V) characterization has been performed by using AMCAD pulsed I-V system [1]. The system consists of two independently operating mode: Pulsed or DC. Fig. 3.1 shows the I-V pulsed bench with associated instruments.
Fig. 3.1: I-V pulsed bench with associated instruments.
The I-V pulsed bench is composed of:
• AMCAD System: is the main unit;
• Data capture and analysis computer: enable the control and configuration of the AMCAD System using the IVCAD interface. Also, they offer the treatment and analysis of the measured data using integrated tools, such as: visualization of measurement, pre-treatment of data and modeling;
• Peltier heater plate: provides a uniform distribution of temperature on bottom surface of the DUT. The temperature range is between 5 °C and 150 °C.
Fig. 3.2 shows the I-V pulse chronogram. The I-V measurement is performed during TM period (measurement window). The drain pulse is larger than the gate pulse because the drain response time is lower than the gate response time. The drain current is measured near to the end of the flat top of the transient pulse.

63
Fig. 3.2: I-V pulse chronogram.
Table 3.1 shows the used configuration of the I-V pulse timing. The measurement frequency is equal to 100 Hz. The measurement window time is equal to 0.4 µs.
Table 3.1: I-V pulse timing.
Gate pulse (TG) Drain pulse (TD) Measurement window (TM) Pulse period (T) Time 2.5 µs 4.0 µs 0.4 µs 100 ms
Pulsed I-V measurements are the most relevant characterization technique compared to conventional DC measurements [2], since they enable the elimination of both the effects of self-heating and traps during the measurement. The pulsed I-V measurements allow output characteristic (IDS-VDS), transfer characterization (IDS-VGS), characterization of thermal phenomena and trapping. The main characteristics of the AMCAD bench for pulsed I-V measurements are:
• Measurement probes 1k V / 30 A.
• Pulses less than 200 ns.
• All measurements are easy to perform, store and view with IVCAD software [3].
• Integrated measurement units provide high-bandwidth, high voltage accuracy and current measurements simultaneously: 50 MHz bandwidth, 16-bit resolution, 0.1% high accuracy, and fast acquisition.
The principle of pulsed I-V measurements is illustrated in Fig. 3.3 It consists of the I-V characteristics measured under isothermal conditions at a given polarization point, defined by its quiescent voltages Vdsq and Vgsq. To characterize the I-V network at given polarization points, both the gate and drain control voltages are pulsed from these polarization points to new instantaneous values named Vgsi, Vdsi, Igsi and Idsi.

64
Fig. 3.3: Principle of pulsed I-V measurements.
3.2.2. Temperature dependency of GaN HEMT static characteristics
The investigation of the temperature dependency of GaN HEMT power transistors is vital to the use in power converter applications. Such an investigation is important particularly to understand the cause of deterioration of their electrical performances at elevated temperatures [4]. In this section, the I-V characteristics of a GaN HEMT power transistor at operating temperatures are studied experimentally. Moreover, the physics underlying various high-temperature operations of the I-V characteristics is discussed.
The DUT is a GS66508P from GaN Systems [5]. It is a p-type gate normally-off AlGaN/GaN power transistor which operates in the range of 650V/30A. Fig. 3.4 shows both a bottom and top views of the used GaN transistor package. The device package allows to study the temperature dependency of the GaN HEMT characteristics from low temperature (5˚C) to high temperature (105˚C). Fig. 3.5 shows the p-AlGaN gate formed over the undoped AlGaN/GaN heterostructure [6]. The p-AlGaN lifts up the potential at the channel, which enables normally-off operation.
Fig. 3.4: GS66508P package [7]: (a) Top view; (b) bottom view.
(a) (b)

65
Fig. 3.5: Schematic illustration of the tested GaN HEMT power transistor structure [6].
As mentioned before, the static characterization is performed using AMCAD pulsed I-V system. The pulses setting is fixed at a pulse frequency of 100 Hz with a gate pulse duty cycle of 0.04%. A pulse width of 4 μs is short enough to ensure iso-thermal measurement of pulsed I-V GaN HEMT characteristics. The used I-V pulsed probes have a high measurement accuracy, which is equal to ±100mA.
The used GaN HEMT is characterized at various temperatures ranging from 5 ˚C to 105 ˚C in order to study the effect of temperature on GaN power transistors. The temperature is fixed by a Peltier heater plate.
The measured output characteristic curves for a gate-to-source voltage (VGS) equals to 6V under operating temperatures equal to 5 °C, 25 °C, 75 °C and 105 °C are shown in Fig. 3.6 (a). As observed, the drain current ID is modulated by the voltage VGS. The transfer characteristic curves are obtained for a drain-source voltage (VDS) equals to 2V and for various temperatures equal to 5 °C, 25 °C, 75 °C and 105 °C see Fig. 3.6 (b). The tested device has the advantage of safe normally-off operation for temperature up to 105˚C.
According to the output characteristics (Fig. 3.6 (a)), the evolutions of the following electrical parameters are extracted: the on-state resistance (RDS(ON)), the threshold voltage (VTH). From the transfer characteristic (Fig. 3.6 (b)), the evolution of the transconductance gm versus temperature is determined.
3.2.2.1. On-state resistance RDS(ON)
The RDSON is defined as the inverse of the slope of output characteristics in the linear region and is calculated at VGS = 6 V by [8]:
1
( )6 , 0
. (3.1)GS DS
DDS ON
DS V V V V
IR
V
−
= →
=

66
Fig. 3.6: Measured (a) Output characteristics at VGS = 6V; (b) Transfer characteristics at VDS = 2 V of GaN HEMT for various temperatures: 5 °C, 25 °C, 75 °C and 105 °C.
The measurement conditions of normalized RDS(ON) are: VGS = 6V and varying temperature from 5 °C to 105 °C. Fig. 3.7 shows the variation of the normalized RDS(ON) versus temperature. An increasing of 180 % in on-state resistance at 105 °C can be observed compared to its value at 5 °C.
The temperature dependency of RDS(ON) is due to the impact of temperature on the channel between the source and gate contacts [9]. In fact, if the device temperature is raised, the low-field electron mobility in the channel is decreased [7], and a proportional increase of the channel resistance related to the drain-source resistance (RDS) can be expected. This result is also confirmed in reference [10] which has suggested to use GaN HEMT transistors with higher 2-D electron gas (2DEG) channel density for enhanced performances.
Fig. 3.7: Normalized RDS(ON) as a function of temperature at VGS = 6V.
3.2.2.2 Threshold voltage (VTH) The VTH is extracted using Extrapolation in the Linear Region (ELR) method [11]. The
temperature dependency of the extracted threshold voltage is given in Fig. 3.8 (a). The threshold voltage of GaN HEMT at 105 °C decreases about 12 % compared to their values at 5 °C.
(a) (b)

67
The dependency of VTH on temperature is mainly due to holes injected from the metal to the p-GaN layer [12]. The injected holes are accumulated at the p-GaN/AlGaN interface. This leads to a negative shift in threshold voltage, which can also be observed in [12]. Recent studies [13] show that using hydrogen plasma treatment instead of etching technology may compensate holes in the p-GaN layer above the two-dimensional electron gas (2DEG) channel to release electrons in the 2DEG channel and form high resistivity area to reduce leakage current and increase threshold voltage stability.
3.2.2.3 Transconductance (gm) The gm quantifies the drain current variation with a gate-source voltage variation while
keeping the drain-source voltage constant. The transconductance gm is defined as the maximum first derivative of the transfer characteristic in the saturation region and is calculated at VDS = 7 V using the following equation while VDS is the bias voltage [8]:
7
. (3.2)DS
Dm
GS V V
Ig
V =
=
Fig. 3.8 (b) shows the variations of the transconductance gm as a function of temperature.
The transconductance gm at 105 °C decreases about 58.38 % compared to their values at 5 °C. The decreasing of gm with the increase of temperature is mainly due to the decrease of both the electron mobility in the channel and the electron velocity [14]. The decrease of the transconductance when increasing temperature is observed in [15] which has confirmed that the channel mobility decreases with the increase of temperature [16].
Fig. 3.8: (a) Threshold voltage; (b) Transconductance as a function of temperature at VDS = 2 V.
3.2.3. Modeling GaN HEMTs Power Transistors
3.2.3.1. Modeling methodology
The proposed methodology for modeling power GaN HEMTs is shown in Fig. 3.9, which is composed of seven steps.
(a) (b)

68
Step 1: The first one concerns the choice of the DUT. For that, a fresh GS66508P from GaN
Systems [5], which is a p-type gate normally-off AlGaN/GaN power transistor in the range of 650 V/30 A is selected.
Step 2: The second step is to fix experimentally the temperature of the DUT at 25 °C using a Peltier heater plate.
Step 3: The third step is to perform Pulsed I-V measurements using AMCAD pulsed I-V system at a pulse frequency of 100 Hz with a gate pulse duty cycle of 0.04 %. The pulse width of 4 μs is shorted enough to ensure iso-thermal measurement of pulsed I-V GaN HEMT characteristics. The used I-V pulsed probes have a high measurement accuracy, which is equal to ±100 mA.
Step 4: The fourth step is to import the experimental output characteristic (IDS-VDS) and transfer characteristic (IDS-VGS) to a data analyzer software, where the data will be treated and analyzed.
Step 5: The fifth step is to fit the experimental I-V static characteristic curves, then we extract the drain current model parameters. In order to develop the thermal model, we repeat the same previous stages for different temperature starting from 5 °C until we reach the maximum allowed temperature which is equal to 115 °C with a step of 10 °C.
The proposed drain current model is based on a non-segmented, smooth and continuous equation inspired from the Motorola Electro-Thermal Model (MET) developed by Curtice et al. [17] and described in [18], the specific equation is given by:
( )( ) DS
..log 1 exp . , V 0 (3.3)
1 . .GS DSGS
DS
GS DS
m nV VV bI K
c P d eV V
+−= +
+ +
Fixing the temperature of DUTM
Pulsed I-V measurement
Tested device choice
Input and output characteristics analysis
Curve fitting & model parameter extraction
Temp < 115 °C
++Temp
5
4
3
2
1
Parameters extraction of the MET Model
Estimation of the power losses 7
Exploitation of the MET Model to
estimate the power losses for
and
Validation of the MET model
Experimental validation of the MET Model for three temperatures:
57 °C, 69 °C and 86 °C
6
Fig. 3.9: Proposed methodology for estimating the GaN HEMT power losses.

69
Where ID is the drain to source current, VDS is the drain to source voltage, VGS is the gate to source voltage K is the device forward transconductance (A.V-1) parameter at 25 °C, P is the output conductance (V-1) at 25 °C, b and c are related parameters of the transfer characteristic, while m, n, d and e are related parameters of the output characteristic. These parameters are obtained by using the Levenberg-Marquardt (L-M) algorithm [19], which is an optimization algorithm appropriate to solve non-linear equations such as Eq. (3.3).
Step 6: The sixth stage of the proposed methodology concerns the experimental validation of the electro-thermal model in a real power switching application. Fig. 3.10 (a) shows the schematic of the developed switching bench [20], this circuit offers a low energy consumption because no load is used. Also, it uses similar electrical waveforms on DUTM, which could exist in a large class of power management products such as DC-DC power converters [21]. Moreover, it enables dynamic measurement of the RDS(ON), hence the calculation of conduction power losses. The electrical signals on DUTM are limited by two DC supplies. A microcontroller unit [22] generates Pulse Width Modulation (PWM) signals with a frequency range from 0 to 128 kHz and a duty cycle with 1/128 resolution. The DUTV switches with signal PWM2, the complimentary signal of PWM1 switches both DUTM and DUTC. The Galvanic isolated drivers separate control and power blocks [23].
The DUTM current and voltage experimental waveforms are shown in Fig. 3.10 (b). The VDS voltage switches from 1.14 V to 24 V with a rise time equals to 53.46 ns and IDS current switches from 0 A to 14 A with a rise time equals to 3.94 μs. The studied switching conditions have been chosen to allow the DUTM switches in the operational switching conditions of power converters.
Fig. 3.10: (a) Schematic of the switching bench; (b) Current and voltage waveforms on DUTM for switching conditions: 50 kHz, duty-cycle = 50 %, and 14 A / 24 V operating conditions.
The developed switching bench with associated instruments and power supplies are shown in Fig. 3.11.
(b) (a)

70
Fig. 3.11: Switching bench platform and associated instruments.
Step 7: The last stage is the estimation of the power losses of the GaN HEMT in a switching circuit application as a function of both temperature and output current.
3.2.3.2. Results and discussions
In this section, we present the results of the extracted MET model and comparisons to the literature. Also, we study the temperature dependency of the GaN HEMT and we describe the MET thermal model. The efficiency of the extracted electro-thermal model is then validated in a real switching application for three chosen temperatures: 57 °C, 69 °C and 86 °C. To evaluate the performance of the curve fitting, the error between measurements and model is given by:
1
Error
Mean Relative Error
100 (%)
100 (%)
(3.4)n
i i
i i
E M
E
E M
n E=
=
−
−
=
Where E is the experimental value, M is the modelled value and n is the number of fitted points. The error reduction is defined as the difference between the constructor model (given by the manufacture) error and the MET model error. The equation of the drain current constructor model is given in [24] by:
( ) ( )( )( )
1
0 1 2 3
log 1 exp , 0 1 max ,
(3.5)GS DS
DS DS
GS DS
c V b VI K T V
slp x x V c c V
−= +
+ + +
Where c1, b, slp, x0, x1, c2 and c3 are related parameters of the output characteristic. The application of both the Levenberg-Marquardt algorithm [25] and Orthogonal Distance Regression algorithm on the constructor model did not show convergence of fitting to the experimental data. The proposed MET Model has the advantage to have less parameters compared to the constructor model.

71
(a) (b)
a) Static characteristics
Fig. 3.12 (a) and (b) show the comparisons of output and transfer characteristics of GaN HEMT obtained by: constructor model (dashed lines), MET model (dot) and measurements (solid lines). Table 3.2 summarized the static parameters comparison between measurements, constructor model and MET model. The constructor model suffers from an important mismatch compared to measurements, which produces high relative error to the static characteristics. Then, to improve simulation accuracy, we propose the electro-thermal model based on Eq. (3.3). Table 3.3 shows the extracted static model parameters at 25 °C.
From Table 3.2, the MET model shows a good convergence to measurements, which enables an error reduction of RDS(on) by 15.2 %, gm by 10.19 % and VTH by 6.6 % compared to the constructor model static characteristics. Moreover, the mismatch between the MET model and measurements is significantly reduced compared to the constructor model as shown in Fig. 3.13 by calculating the mean relative error of constructor model and MET model for static characteristics using Eq. (3.4). By comparing the curve fitting of the MET model with others models provided in the literature [26-27] using the mean relative error given in Eq. 3.4 (Fig. 3.14), we conclude that the MET model shows lower mean relative error for the output characteristic at VGS = 3 V and 25 °C. The accuracy of the MET SPICE model is due to the convergence of the model parameters in Eq. (3.5) with the experimental data. As observed, the MET model uses a non-segmented and smooth continuous equations to describe the static characteristic of GaN HEMT.
Fig. 3.12: Comparison between measurements, Constructor model and MET model: (a) Transfer characteristics (b) Output characteristics.
Table 3.2: Static parameters comparison between measurements, constructor model and MET model.
Parameter RDS(on) (mΩ) gm (S) VGS(TH) (V)
Measurements 43.26 21.58 1.82 Constructor model 50.65 25.63 1.65 Constructor model Error (%) 17.08 18.76 9.34 MET model 42.46 23.43 1.77 MET model Error (%) 1.84 8.57 2.74
VDS=7V@25°C
VDS=1V@25°C
VGS=6V@25°C
VGS=3V@25°C

72
Table 3.3: Extracted MET model parameters at 25°C.
Parameter K B c M n P d E
Value 1.42 1.65 0.14 8.12 -1.15 0.75 1.94 -0.35
Fig. 3.13: Comparisons of Mean Relative Error between constructor model and MET model for both transfer and output static characteristics.
Fig. 3.14: Comparisons of Mean Relative Error between MET model, constructor static model and literature for the output characteristic at VGS = 3 V and 25 °C.
b) Thermal characteristics
To take into consideration the thermal behavior of the tested device in the MET model, the device model should include the temperature dependence of device parameters. However, it is observed from Fig. 3.15 (a) and (b) that the constructor thermal model suffers from high mismatch compared to measurements. We performed experimentally in Fig. 3.16
the evolution of the device parameters K and P versus temperature. The results in Fig. 3.16 are obtained by calculating experimentally the MET model parameters K and P at various temperatures: started from 5 °C to 105 °C by a step of 10 °C. The K and P parameters are extracted using a curve fitting of the MET model to the experimental output and transfer characteristics at each temperature. No temperature dependency was observed for others MET model parameters b, c, m, n, d and e. To overcome this mismatch of constructor thermal model, a quadratic fit of the device parameters (K and P) as a function of temperature is given in [28] by:

73
( ) ( )
( ) ( ) ( )
21 2
2
3 4
1 . 25. ( 25) (3.6)
. 1 . 25 25
C C
C C
T TK T K T T
P T P T T T T
+ − +
= −
= + − + −
Where TC1, TC2, TC3 and TC4 are temperature coefficients, which are extracted using Levenberg-Marquardt algorithm and given in Table 3.4. The K and P parameters are uniformly decreased when increasing temperature as shown in Fig. 3.16.
From Fig. 3.15 (a) and (b), the MET thermal model shows a good convergence to measurements in term of temperature dependency. The MET model fit very well to measurements at two temperatures for both output and transfer characteristics.
Fig. 3.15: Comparisons between MET model (dot), constructor model (dashed) and measurements (solid): (a) Transfer characteristic for VDS = 7 V at 55 °C and 115 °C; (b) Output characteristic for VGS = 6 V at 55 °C and 115 °C.
Table 3.4: Extracted MET thermal model temperature coefficients.
Parameter TC1 TC2 TC3 TC4
Value -8.02E-3 3.22E-5 -3.75E-3 4.01E-6
Fig. 3.16: Evolution of the device parameters K and P when varying temperature from 25 °C to 115 °C.
c) Validation of the model
In order to verify the accuracy of the extracted MET model, we implement the switching circuit of Fig. 3.10 (a) in the LTspice simulator under the switching conditions described in Table 3.5. The off-state voltage VDS(OFF) is chosen equal to 24 V, which is low enough to
(b) (a)

74
ensure the non-effect of traps on dynamic measurements [29]. Also, the chosen frequency of 50 kHz and the duty-cycle of 50 % could be applied to a large application of power converters.
The estimation of the junction temperature TJ from measurements is necessary in order to compare the conduction power losses between measurements, MET and constructor electro-thermal models. The temperature TJ is estimated using the thermal model of DUTM described in [30]. By using the thermal Ohm’s law, we obtain:
(3.7) J JA AlossT P T= +
Where ϴJA is the total thermal resistance from junction to ambient, which is equal to 3.63 °C/W based on manufacturer datasheets and SPICE model [7], TA is the ambient temperature fixed at 25 °C by heatsink cooling, and Ploss is the experimental total power loss of DUTM over one period in watts. From measurements, Ploss is calculated using Eq. (3.8), TJ is calculated using Eq. (3.7), and the device parameters (K and P) that correspond to the temperature TJ are calculated using Eq. (3.6). Table 3.5 shows the calculated values of Ploss, TJ, K and P for the three different switching profiles.
0
1 (3.8)T
loss ds dsP i v dt
T=
After ensuring that the DUTM switches under the same electrical and thermal conditions in both experimental and simulation, a comparison of the conduction power loss (PCond) between measurements, constructor model and MET model is achieved. The PCond is defined in [31] by:
2 (3.9)DCond dynP R I D=
The dynamic resistance (Rdyn) is calculated by:
( ) (3.10)
DS ON
dynDS
VR
I=
Where VDS(ON) and IDS are the drain-to-source voltage and the drain current during the on state respectively and D is the duty-cycle. From current and voltage temporal waveforms of DUTM, the experimental and simulated power PCond for both constructor and MET models are calculated using Eq. (3.9) and shown in Fig. 3.17 for three junction temperatures of 57 °C, 69 °C and 86 °C. A good convergence of conduction power loss was achieved using the MET model.
Table 3.6 compares the conduction losses between simulation and measurements of the tested device at three junction temperatures: 57 °C, 69 °C and 86 °C. As can be observed, the conduction power losses error between the measurements and MET model is much lower to that of the constructor model at various junction temperatures. The error reduction is defined as the difference between the constructor model error and the MET model error.

75
Table 3.5: Switching conditions applied to DUTM at: VDS(OFF) = 24 V, f = 50 kHz and Duty-cycle = 50 %.
Parameter IDS (A) Ploss (W) TJ (°C) K (A.V-1) P (V-1) Profile 1 8 8.70 57 1.11 0.67 Profile 2 12 12.20 69 1.01 0.63 Profile 3 14 16.68 86 0.90 0.54
Fig. 3.17: Comparisons of conduction power loss between measurements, MET model and constructor model for
three values of TJ: 57 °C, 69 °C and 86 °C.
Table 3.6: Measurements, MET model and constructor model comparisons of conduction power losses.
Conduction power loss (W) 57 °C 69 °C 86 °C
Measurements 3.22 5.31 8.37
MET model 3.55 5.27 7.46
Constructor model 2.60 3.83 5.39
Error reduction (%) 1.55 27.11 24.73
d) Estimation of the power losses
The conduction power losses are estimated in a switching power application. For that, we calculate by simulation the PCond of the extracted MET electrothermal model in the switching
circuit of Fig. 3.10 (a) for 0, 20DS
I A and 5 ,115T C C . Fig. 3.18 (a) shows the evolution of the PCond for various values of IDS at three temperatures: 25 °C, 65 °C and 115 °C. Fig. 3.18 (b) shows a 3D graphical representation of the conduction energy losses (ECond) at the following switching conditions: f = 50 kHz, Duty-cycle = 50 % and VDS = 200 V.
From the results shown in Fig. 3.18 (a), we estimate the conduction power losses as a function of the drain current IDS and the temperature T using a second order polynomial relationship given by Eq (3.11) [32]. Also, we estimate the conduction energy losses as a function of the drain current IDS and the junction temperature TJ using a 2D polynomial relationship Eq (3.12).

76
( ) ( ) ( ) ( )( )
2 2 2 21 2 3 1 2 3 1 2 3
2 20
, (3.11)
, (3.12)
DS DSDSCond
J J JDS DS DSCond JDS
P I T a T a T a I b T b T b I c T c T c
E I T z a I b T c I d T f I T
= + + + + + + + +
= + + + + +
Where a, b and c are coefficients extracted using the L-M algorithm. Table 3.7 presents the extracted parameters of both the estimated conduction power losses PCond(IDS,T) and the conduction energy losses ECond(IDS,T).
Fig. 3.18: Conduction losses estimation: (a) power losses at three temperatures: 25 °C, 65 °C and 115 °C; (b) energy losses at f = 50 kHz, Duty-cycle = 50 %, VDS = 200 V.
Table 3.7: Extracted parameters of the estimated conduction power losses PCond(IDS,T).
Parameter a1 a2 a3 b1 b2 b3 c1 c2
Value 8.22E-9 1.64E-4 0.05948 1.47E-6 5.67E-5 0.02813 -3.94E-6 1.49E-4
Parameter c3 z0 A b C d f
Value -0.05323 6.63 E-3 -1.69E-3 -1.40E-4 7.00E-4 2.81E-7 3.34E-5
To summarize, based only on experimental I-V pulsed static characterization, the proposed
model of losses enables the estimation of the conduction power losses of GaN HEMT in power switching applications for a specified operational value of current and temperature.
(a) (b)

77
3.3. Dynamic characterization of GaN HEMT
In this section, the switching power losses of the GaN HEMT have been estimated by modelling the dynamic C-V characteristics of the GaN HEMT. First, the C-V experimental setup has been presented. Then, both the temperature and frequency dependencies of the C-V characteristic are studied. Finally, the evolution of the power switching losses has been modelled for various values of IDS.
3.3.1. C-V experimental setup
The accuracy of the developed SPICE model has been improved by modelling of dynamic characteristics in order to take into consideration the switching losses when designing power converters with GaN HEMTs. Fig. 3.19 (a) shows the C-V bench with the associated instruments, which include: the HP 4192A impedance analyzer, Data capture and analysis computer, Ground connector and DUT.
The HP 4192A is widely used for the measurement of the C-V characteristics of the transistors [33]. This impedance analyzer offers broad frequency range from 5 Hz to 13 MHz and it is very convenient since it can be fully computer controlled [34]. The C-V measurements were performed using HP 4192A impedance analyzer at a frequency of 1 MHz.
Prior to the C-V measurements, both calibration and initialization steps should be performed.
3.3.1.1. Calibration
The analyzer was calibrated at the short and open modes. The calibration improves the precision of measurements by eliminating the parasitic elements [35].
3.3.1.2. Initialization
Before performing the C-V measurement, the DUT is first initialized and then characterized. The device initialization process consists of passing a low current in the drain for a short period in the range of 2 seconds in order to avoid a self-heating of the device.
The proposed initializing process enables the detrapping of charge under the gate. This step allows to create a “stable” and reproducible initial state for the device. Fig. 3.19 (b) shows the experimental detrapping setup which consists of a DC voltage generator and both IDS current and VDS voltage measurements.

78
Fig. 3.19: C-V experimental setup: (a) CV bench; (b) detrapping setup.
To confirm that the detrapping method is effective and complete, we have periodically remeasured the CGS-VGS characteristic at room temperature for various length of time: 0, 5 min, 10 min, 15 min and 20 min. The resulting C-V measurements have been reproducible with a mean relative error equals to 2.08 %.
3.3.1.3. Measurement circuits for CGS, CGD and CDS
The measurement circuits for CGS-VGS, CGD-VGD and CDS-VDS characteristics based on an impedance meter (HP4292A) are shown in Fig. 3.20. In case of CGS capacitance measurement, an AC signal is injected at the gate via the high side of the impedance meter and the AC current flowing into the source is sensed at the low side of the meter, which is at ground potential. The drain is also connected to ground but the AC current into this terminal is not sensed by the meter. Thus, the impedance meter measures only CGS as a function of the gate-to-source bias VGS. The stray capacitances on chip (e.g. gate and source pads capacitances) are measured. These capacitances are constants and not affect the extraction process [36].
Fig. 3.20: Measurement circuit for the C-V characteristics: (a) CGS-VGS; (b) CGD-VGD; (c) CDS-VDS.
(a) (b)
(a) (b) (c)

79
3.3.2. Temperature-dependent capacitance–voltage measurements
Understanding the temperature dependence of the GaN HEMT C-V characteristics is of a great importance to the successful design and manufacture of the devices. Thus, it is necessary to investigate the C-V characteristics over a wide temperature range in order to understand the capacitance temperature dependency and the nature of parasitic capacitances at the metal semiconductor interface [37]. For this, the forward and reverse bias C-V measurements of the GaN HEMT contacts have been performed in the temperature range from 5 °C to 115 °C. The temperature is fixed by a Peltier heater plate. 3.3.2.1. CGS-VGS characteristic
The CGS is a measure of the variation of the gate charge QG with respect to VGS, and is given by [38]:
(3.13)GGS
GS
QC
V
=
The maximum of /GS GSC V corresponds to the point when QG is changing most rapidly
due to the applied VGS. This represents the onset of strong inversion in the channel 2DEG. Hence, the VTH can be defined as the VGS at which /GS GSC V is maximum. Fig. 3.21 (a)
shows the measured CGS-VGS plot of the tested GaN HEMT and Fig. 3.21 (b) shows the corresponded derivative of CGS-VGS plot. The extracted VTH is equal to 1.3 V. As can be observed, bellow VTH, QG is negligible due to the lack of electrons in the channel under the gate. Thus, CG is also small. Above VTH, CGS quickly rises as electrons are induced in the 2-DEG channel. After the 2-DEG channel is fully turned-on, CGS exhibits a gradual decrease as VGS rises [39].
Fig. 3.21: (a) Gate to source capacitance CGS; (b) Derivative of CGS-VGS plot.
Fig 3.22 (a) shows the measured CGS-VGS characteristics versus VGS, which sweeps from -3V to 7V under operating temperatures equal to 5°C, 45°C, 85°C and 115 °C. The CGS is the maximum of CGS capacitance at 5 °C. It is observed that the CGS(Max) decreases when increasing the temperature and the trends of capacitance versus voltage are similar. Fig 3.22 (b) shows the
(a) (b)

80
variation of CGS(Max) versus temperature. A decreasing of 8.22% in CGS(Max) at 115°C can be observed compared to its value at 5°C.
Fig. 3.22: (a) CGS-VGS characteristics for various temperatures: 5°C, 45°C, 85°C and 115 °C. (b) CGS(Max) as a versus temperature.
3.3.2.2. CGD-VGD characteristic
The temperature dependency of the measured CGD-VGD under operating temperatures equal to 5°C, 45°C, 85°C and 115 °C is shows in Fig 3.23 (a). The gate-to-drain voltage (VGD) sweeps from -3V to 7V by a step of 0.1V. It is observed that CGD capacitance in the inversion region of the tested GaN HEMT at 105 °C decreases when increasing the temperature. Fig 3.23 (b) shows the variation of CGD(Max) versus temperature. A decreasing of 9.34% in CGD(Max) at 115°C can be observed compared to its value at 5°C.
The decrease of both the gate capacitances CGS and CGD when increasing the temperature is also observed in [40] and is related to the variation of Mg-doped p-GaN mobility under the Schottky contact of the GaN HEMT. The expression of the Schottky gate capacitance CG is given by [41]:
( )2
(3.14)2
sG
bi
q A NC
V V
=
+
Where 𝑉bi is the built-in potential, 𝑁 is the carrier concentration, 𝑞 is the electronic charge, 𝐴 is the area of the Schottky contact, and 𝜀s is the permittivity of the semiconductor for AlGaN barrier layer.
Authors in [42] have calculated the temperature dependence of the carrier concentration 𝑁 parameter. They found that the carrier concentration decreases with temperature, and the values of 𝑁 vary from 2.767×1021 cm−3 to 1.952×1021 cm−3 in the temperature range from 223 K to 398 K.
(a) (b)

81
Fig. 3.23: (a) CGD-VGD characteristics for various temperatures: 5°C, 45°C, 85°C and 115 °C. (b) CGD(Max) as a versus temperature.
3.3.2.3. CDS-VDS characteristics
The measured CDS-VDS characteristics at various temperatures equal to 5°C, 45°C, 75°C and 115 °C is shown in Fig. 3.24 (a). The VDS sweeps from 0V to 20V by a step of 1V. As can be observed, the maximum CDS capacitance increases when increasing the temperature. Fig. 3.24 (b) shows the variation of CDS capacitance with regard to the temperature. An increasing of 0.62% in CDS at 115°C can be observed compared to its value at 5°C.
According to [43], the depletion width of the AlGaN layer affects the value of CDS. Authors in [42], have observed that the depletion width of the ALGaN layer decreases with temperature, and varies from 4.675 nm to 4.644 nm in the temperature range from 223 K to 398 K. The AlGaN parasitic capacitance is given in [43] by:
0 (3.15)AlGaN AlGaN
AlGaN
AC
d =
Where dAlGaN is the depletion width of the AlGaN layer and ε0 is dielectric constant of vacuum (ε0 = 8.85 1014 F/cm) and εAlGaN dielectric constant of the AlGaN (εAlGaN = 8.8).
From Eq. (3.15), the decrease of the depletion region with temperature induces a positive change of CDS capacitance, which is confirmed in [43].
(a) (b)

82
Fig. 3.24: (a) CDS-VDS characteristics for various temperatures: 5°C, 45°C, 85°C and 115 °C. (b) CDS versus temperature at VDS equals 10 V.
3.3.3. Frequency dependent of C-V measurements
With the aim to investigate the parasitic frequency-dependent switching losses, C–V measurements are carried out using HP 4192A impedance analyzer on a fresh GaN HEMT in the frequency range from 100 kHz to 10 MHz. Fig. 3.25 (a) shows the frequency-dependent C-V measurements. The capacitance was measured with an AC signal with amplitude of 50 mV at frequencies ranging 100 kHz, 1 MHz and 10 MHz. The gate voltage was swept from depletion (−3 V) to accumulation (7 V) by a step of 0.1 V. As can be shown in Fig. 3.25 (a), the C-V characteristic of the DUT presents a frequency dependency by increasing the ac signal frequency from 1 MHz to 100 kHz. It can be noticed that the C-V characteristic in the inverse-bias (VGS < VTH) significantly increases when increasing the frequency from 100 kHz to 10 MHz. This distortion in the C-V characteristic when increasing the frequency is mainly originates from the increased gate leakage and insufficient ac-signal frequency [42]. Thus, to obtain the C-V characteristics within a wide bias range, it is necessary to boost the measurement frequency up to 1 MHz. However, when biased at forward voltages (VGS > 0 V), the measured capacitance did not show a significant dependency on the frequency.
Fig. 3.25 (b) shows C-V characteristics measured on a tested GaN HEMT at 1 MHz and at room temperature. The data were taken for the two voltage sweep directions (the direction is marked by the arrow near each curve). As can be observed, the VTH hysteresis with a shift of 0.72 V when the bias swept from −3 V to 7 V and 7 V to −3 V. According to [44], The hysteresis in the C-V measurement is induced by the charge trapped near the p-GaN interface, which induces the threshold voltage instability due to their different electron capture/emission time when measured in different directions.
(a) (b)

83
Fig. 3.25: (a) C-V-f measurements; (b) Measured CGS-VGS characteristics at 1 MHz and at room temperature. Solid curves correspond to the voltage sweep from negative to positive values of VGS and dashed curves
correspond to the opposite sweep direction.
3.3.4. C-V modeling methodology
In power transistor models, it is very important that device capacitances are modelled accurately so that switching losses and gate timing requirements of the converter can be accurately determined [45]. The modeling of the dynamic behavior of the power GaN HEMT required sensitive C-V measurements, since the GaN transistors have lower parasitic capacitances in the range of 100 pF [24] compared to Si devices which are in the range of 1000 pF [46]. This makes the GaN technology very attractive for both RF markets and power converter applications with high speed and low power switching losses. For that, an accurate dynamic model is necessary. In the literature, several capacitance models of GaN transistor have been proposed. References [47] and [48] have modelled the GaN HEMT capacitance by the series combination of a fixed capacitance, representing the oxide capacitance of a MOS gate and a SPICE model for the diode to represent the field-dependent semiconductor capacitance [49]. However, these models do not fit the C-V measurements of the studied DUT, because the C-V characteristic of the p-GaN gate HEMTs are different to that of Si MOS gate transistors, due to the Mg doper concentration under the gate of the studied GaN transistor which enables a normally-off behavior of the GaN HEMTs.
The proposed methodology for modeling the non-linear capacitance of the GaN HEMT is to extract the one-dimension model. In fact, the gate to drain capacitance CGD depends only on VGD voltage that will be selected close to the application range area between -3 V and 7 V. The CGS depends on intrinsic VGS voltage, chosen close to the application range area between -3 V and 7 V. The output Capacitance CDS depend on VDS voltage, selected close to the application range area between 0 V and 20 V. This approach reduces significantly the complexity of the model, and improves both the speed and convergence behavior of the simulation. The nonlinear functions chosen to fit the extracted CGS, CGD and CDS capacitances are based on the equations given by [50].
(a) (b)

84
( )( ) ( )( )
( )( ) ( )( )
1 0 1 20
1 0 20
0
2
1 tanh 1 tanh (3.16)2 2
1 tanh 1 tanh (3.17)2 2
1
GS GS GS GS
GSTH PGS GS GS GS GS
GD GD GD
GDTH PGD GD GD GD GS
DSDS DS DS
C C C CC C A V V B V V
C C CC C A V V B V V
C C a V b V
− −= + + + − + +
−= + + + − + +
= + + (3.18)
Where, C0, C1, C2, A, B are related parameters of the CGS-VGS and CGD-VGD characteristics and the VP is the pinch-off voltage. Fig. 3.26 shows the representation of these parameters on the CGS-VGS characteristic.
Fig. 3.26: CGS capacitance model parameters.
The extrapolation of the model parameters of (Eq.3.16-3.17) is performed using the Trust-Region algorithm [51]. The initial values of the algorithm are extracted manually in order to reduce the calculation steps. Table 3.8 shows the extracted values of the CGS, CGD and CDS at 25 °C.
Table 3.8: Extracted values of CGS, CGD and CDS at 25°C.
Parameters 0GSC 1
GSC AGS VTH
2GSC BGS VP
Value 221.5 pF 790 pF 469.22 pF/V 1.3 V 622.6 pF -43.02 pF/V 5 V
Parameters 0GDC 1
GDC AGD
2GDC BGD
0DSC a B
Value 98.41pF 838.76 pF 3.001 pF/V 200.95 pF 0.63 pF/V 434.316 -1.43E-3 2.39E-5
In a SPICE simulator [52], we have simulated the modelled CGS(VGS), CGD(VGD) and CDS(VDS) capacitances. As shown in Fig. 3.27, the modelled capacitances fit with high convergence the measured capacitances at 25 °C. The modeling of the dynamic behavior of the

85
DUT, enables the estimation of the switching power losses of the GaN HEMT with high accuracy using a simulation approach.
Fig. 3.27: Comparison between measured and modelled capacitances at 25 °C: (a) CGS-VGS; (b) CGD-VGD; (c) CDS-VDS.
In order to estimate the switching power losses of the GaN HEMT in a switching power application, we have implemented in a SPICE simulator the modelled static characteristic obtained in section I and parasitic capacitances of the GaN HEMT obtained in section II.
Fig. 3.28 (a) shows the GaN HEMT current and voltage simulated switching waveforms during the turn-on. The existence of both the current and voltage simultaneously during the turn-on time (TSW(on)) generates power switching losses. Based on Fig. 3.28 (a), we have calculated by simulation the power losses PSW(on) as a function of the drain current IDS at the temperature of 25 °C by calculating the turn-on power switching losses using Eq. (3.19) [53].
( )
( )( ) 0
1 (3.19)SW onT
SW on ds dsSW on
P i v dtT
=
Where, PSW(on) is the turn-on power switching losses in (Watt) and TSW(on) is the turn-on switching time. Fig. 3.28 (b) shows the evolution of the switching power losses PSW(on) as a function of drain to source current at 25 °C. The proposed model of the switching losses enables the estimation of the GaN HEMT power converter efficiency with high accuracy, by taking into consideration the effect of C-V characteristics in the GaN HEMT SPICE model.
Fig. 3.28: Turn-on switching losses estimation at 25 °C, f = 50 kHz, Duty-cycle = 50 % and VDS = 200 V: (a) switching times, (b) power losses.
(a) (b) (c)
(a) (b)

86
3.4. Leakage current characteristics
In this section, the gate power losses of the GaN HEMT have been estimated by modelling the gate leakage current characteristics of the GaN HEMT. First, the low current experimental setup has been presented. Then, both the temperature and voltage dependencies of the leakage current characteristic are studied. Finally, the evolution of the gate power losses has been modelled for various values of temperature.
3.4.1. Low current experiment setup
The low current measurement was performed using Keithley 6485A SourceMeter. Fig. 3.29 shows the leakage current bench with associated instruments, including: voltage source, Multimeter, interface circuit, measurement interface and Keithley 6485A Source meter [54].
Fig. 3.29: Leakage current measurement bench.
3.4.2. Gate leakage current temperature dependency
The gate leakage current (IGSS) is defined as the leakage that occurs when the specified voltage is applied across the gate and source with drain and source short-circuited. It is used to evaluate the gate blocking capacity of the device. The leakage current measurements were performed by using Keithly 6485 A SourceMeter at VGS = 6 V and VDS = 0 V. Fig. 3.30 (a) shows the evolution of the gate leakage current as a function of temperature. As shown, the current IGSS is increased by 77.77 % when varying temperature from 5 °C to 105 °C. It was demonstrated in reference [55] that increasing temperature may reduce the schottky barrier height at the metal/p-GaN contact and, consequently, increase the gate leakage current. Moreover, in p-GaN/AlGaN/ GaN heterostructure, the reduction of the Schottky barrier height at the metal/p-GaN gate enhances the tunneling of holes through the barrier [56]. Then, as highlighted by Hwang et al. [57], the enhancement of holes injection leads not only to a negative shift of the VTH but also to an increase in the leakage current in p-GaN HEMT. The increase in

87
the leakage gate current when increasing temperature is also observed in [58], which is attributed to the lowering of the Schottky barrier height of the metal/p-GaN gate.
Fig. 3.30: Gate leakage current: (a) temperature dependency at VGS = 6V; (b) IGSS Model as a function of VGS at 25 °C.
3.4.3. Gate leakage current power estimation
To accurately estimate the efficiency of GaN HEMT power converters, it is important to calculate the gate power losses caused by the leakage current in the gate. The IGSS current in GaN HEMTs can be modelled as a voltage dependent current source by [59]:
( )2 30 . 1 . . . (3.20)GSS
GSS GS GS GSI I aV bV cV= + + +
Where 0GSSI is the gate leakage current at VGS = 0 V and a, b, c are polynomial coefficients
parameters of IGSS current. Table 3.9 shows the extracted values of the IGSS current model of Eq. (3.20). As observed in Fig. 3.30 (b), the IGSS current model fit with high convergence the measurements of IGSS at 25 °C. Indeed, the modeling of the gate leakage current, enables the estimation of the gate power losses of the GaN HEMT with high accuracy using a simulation approach. Table 3.9: Extracted IGSS model parameters at 25°C.
Parameter 0GSSI a b C
Value 4.58 µA -0.87 0.18 -6.39E-3
The gate power loss is defined in [60] by:
(3.21) GSS GSS GSP I V=
Fig. 3.31 shows the evolution of the gate power losses as a function of temperature at VGS = 6 V. As can be observed, the gate power losses are very low compared to the conduction
(a) (b)

88
and switching losses of the GaN transistors at various junction temperatures. This result enables the estimation of the GaN power converters efficiency with high accuracy, by taking into account the gate power losses when calculating the efficiency of the power converters.
Fig. 3.31: Gate power losses estimation versus temperature at VGS = 6 V.
3.5. Estimation of the GaN HEMT power converters efficiency
In this section, we have built an accurate power losses model of the GaN HEMT based on experimental measurements, which includes the major power losses in power switching applications: conduction power losses, switching power losses and gate power losses.
Using the extracted power losses model of the GaN HEMT, we have estimated the efficiency of a 30 V / 200 V DC-DC converter stage using the GaN HEMT. Fig. 3.32 shows a solar energy application which include a solar photovoltaic panel that produce an output voltage of 30 V. This voltage is boosted to 200 V using a power DC-DC converter for charging electrical devices in smart houses. The solar energy application shown in Fig. 3.32 is a use case example for applying the developed methodology for estimating the GaN HEMT power losses in power switching applications based on experimental measurements.
Fig. 3.32: Solar energy application with a 30V/200V DC-DC converter stage.
The power efficiency of the DC-DC power converter shown in the solar application has been investigated by calculating the power losses of each component in the DC-DC converter, including the power losses in the diode, inductor, capacitor, GaN HEMT and output load.
DC-DC Converter
200 V 30 V

89
Fig. 3.33 shows the DC-DC converter circuit, which is a 30 V / 200 V boost converter. The DUTM is the extracted SPICE model of the GaN HEMT.
Fig. 3.33: DC-DC boost converter, with L = 170 mH, C = 850 µF and R = 20 Ω, at 50 kHz switching frequency, 30 V input voltage and 200 V output voltage.
The power losses in the inductor, capacitor and diode are given respectively by [61].
( )
22
2
(3.22)12
(3.23)12
1
LL out L
LC C
D D out
IP I R
IP R
P V I D
= +
=
= − (3.24)
Where Iout is the output current, LI is the inductor current ripple, which assumed equals to
30% of the maximum output current, D is the duty-cycle, RC is the equivalent series resistance of the capacitor, equals to 30 mΩ, RL is the equivalent series resistance of the inductor, equals to 0.2 mΩ, VD is the forward voltage of the diode, equals to 0.7 V. Table 3.10 summarizes the total losses and calculates the efficiency of a 30 V / 200 V DC-DC boost converter with GaN HEMT at 25°C and Iout = 10 A.
The efficiency estimation of a GaN HEMT 30 V / 200 V DC-DC boot converter versus output current is shown in Fig. 3.34. The average efficiency has been estimated to be equal to 92.09 %.
Similar efficiency of 92 % was obtained experimentally in [62] at an output power of 2 kW in a 400V-to-12V DC-DC converter using same tested device GaN HEMT GS66508P.
According to [62], the calculation of the power converter efficiency experimentally required important investments on equipment such as: high power DC supplies and loads. Also, running experimental power converter required high energy consumption, which is also a concern in energy efficiency, for example a 1000 hours campaign could consume as much as 20 MWh.

90
Table 3.10 : Total losses in DC-DC boost converter with GaN HEMT at 25°C and Iout = 10 A.
Output power Pout 2000 W
Power lost in the inductor PL 20.05 mW
Power lost in the capacitor PC 22.5 mW
Power lost in the diode PD 1.05 W
Conduction power losses of the GaN HEMT
PCond 6.66 W
Switching power losses of the GaN HEMT
PSW 163.8 W
Gate power losses of the GaN HEMT
PGSS 27.91 µW
Total power losses of the GaN HEMT
PGAN = PCond + PSW + PG 170.46 W
Total power lost Plost 171.55 W
Input power Pin = Plost + Pout 2170.55 W
Efficiency out
in
P
P =
92.14 %
Fig. 3.34: Efficiency estimation of a GaN HEMT 30 V/ 200 V DC-DC boot converter versus Iout at 50 kHz and 25 °C.
3.6. Conclusion In this chapter, an experimental method is used to estimate the power losses of the GaN HEMTs in switching applications. The proposed approach is based on experimental I-V pulsed, C-V and low current characterizations. The static characteristics of the GaN HEMT have been modelled in section 3.2. The MET drain current model has shown high convergence compared

91
to the experimental measurement, which enables the estimation of the power conduction losses with high accuracy. The switching power losses of the GaN HEMT have been estimated by modelling the dynamic characteristics of the GaN HEMT. The modelled CGS, CGD and CDS capacitances show high convergence compared to the experimental measurements. The gate power losses of the GaN HEMT have been modelled by measuring experimentally the gate leakage current of the DUT. As a result of this study, both the static and dynamic power losses of the GaN HEMT can be estimated. The impact of the conduction power losses, switching power losses and gate power losses on the efficiency of power converts are modelled using SPICE simulation approach. The evolution of the GaN HEMT power efficiency in renewable energy application switching applications is modelled as a function of the output current. The accuracy and good convergence of simulation to experimental measurements provide a good way to design power converters with GaN HEMTs. Moreover, this approach offers to the power converter designers the possibility to estimate the power losses of GaN HEMT with high accuracy without the use of complex switching bench, which reduces the time to market and cost. The proposed methodology for the estimation of the GaN HEMT power losses is used in chapter 5 to study the impact of aging the power GaN HEMT under operational switching condition on the power converters efficiency. In the next chapter, The SPICE model is completed by adding the effects of the parasitic elements of the GaN HEMT. The parasitic resistances, inductances and capacitances of the DUT are extracted using S-parameters characterization.
3.7. References
[1] MauryMicrowaves. IVCAD Advanced Measurement & Modeling Software. 2008.
[2] F. De Groote, J.-P. Teyssier, T. Gasseling, O. Jardel, and J. Verspecht, “Introduction to measurements for power transistor characterization,” IEEE Microwave Magazine, vol. 9, no. 3, pp. 70–85, Jun. 2008.
[3] IVCAD-3.3.7, “IVCAD operation manual MT930M1 Linear & MT930M2 Nonlinear FET model extraction tool,” AMCAD engineering, 2012.
[4] Ioinovici, Adrian. Power Electronics and Energy Conversion Systems: Fundamentals and Hard-switching Converters. Volume 1. Wiley, 2013.
[5] GS66508P Preliminary Datasheet, GaN_Systems_Inc. 2018.
[6] Uemoto, Yasuhiro, et al. "Gate injection transistor (GIT)—A normally-off AlGaN/GaN power transistor using conductivity modulation." IEEE Transactions on Electron Devices 54.12 (2007): 3393-3399.
[7] J. D. Albrecht, R. P. Wang, R. P. Ruden, M. Farahmand, and K. F. Brennan, “Electron transport characteristics of GaN for high temperature device modeling,” J. Appl. Phys., vol. 83, pp. 4777–4781, 1998.
[8] BOUCHOUR, Al Mehdi., et al. Modeling of power GaN HEMT for switching circuits applications using Levenberg-Marquardt Algorithm. In : 2018 International Symposium on Advanced Electrical and Communication Technologies (ISAECT). IEEE, 2018. p. 1-6.
[9] Kuzmik, J., et al. "Determination of channel temperature in AlGaN/GaN HEMTs grown on sapphire and silicon substrates using DC characterization method." IEEE transactions on electron devices 49.8 (2002): 1496-1498.
[10] Wong, King-Yuen, Wanjun Chen, and Kevin J. Chen. "Characterization and analysis of the temperature-dependent on-resistance in AlGaN/GaN lateral field-effect rectifiers." IEEE Transactions on Electron Devices 57.8 (2010): 1924-1929.

92
[11] Ortiz-Conde, Adelmo, et al. "A review of recent MOSFET threshold voltage extraction methods." Microelectronics Reliability”, 42.4-5 (2002): 583-596.
[12] Matteo Meneghini, Oliver Hilt, Joachim Wuerfl and Gaudenzio Meneghesso, “Technology and Reliability of Normally-Off GaN HEMTs with p-Type Gate “, mdpi,energie 2017, pp. 15-17, 2017
[13] Hao, Ronghui, et al. "Normally-off p-GaN/AlGaN/GaN high electron mobility transistors using hydrogen plasma treatment." Applied Physics Letters 109.15 (2016): 152106.
[14] Arulkumaran, S., et al. "High-temperature effects of AlGaN/GaN high-electron-mobility transistors on sapphire and semi-insulating SiC substrates." Applied physics letters 80.12 (2002): 2186-218
[15] Kühn, Jutta. AlGaN-GaN-HEMT Power Amplifiers With Optimized Power-Added Efficiency for X-Band Applications. Vol. 62. KIT Scientific Publishing, 2011.
[16] Maeda, Narihiko, et al. "High-temperature electron transport properties in AlGaN/GaN heterostructures." Applied Physics Letters 79.11 (2001): 1634-1636.
[17] Curtice, W. R., Pla, J. A., Bridges, D., Liang, T., & Shumate, E. E. “A New Dynamic Electro-Thermal Nonlinear Model for Silicon RF LDMOS FETs,” IEEE MTT-S International Microwave Symposium Digest, 1999, p. 419.
[18] Li, H., Zhao, X., Su, W., Sun, K., You, X., & Zheng, T. Q. "Nonsegmented PSpice Circuit Model of GaN HEMT With Simulation Convergence Consideration." IEEE Transactions on Industrial Electronics 64.11 (2017): 8992-9000.
[19] Jouha, W., El Oualkadi, A., Dherbécourt, P., Joubert, E., & Masmoudi, M. "Silicon Carbide Power MOSFET Model: An Accurate Parameter Extraction Method Based on Levenberg-Marquardt Algorithm." IEEE Transactions on Power Electronics (2018).
[20] Echeverri, A. (2018). Reliability study of power AlGaN/GaN HEMT transistors under operational condition, PHD thesis University of Rouen Normandie, Rouen, France.
[21] Ma, Chao-Tsung, and Zhen-Huang Gu. "Review of GaN HEMT applications in power converters over 500 W." Electronics 8.12 (2019): 1401.
[22] Silicon laboratories Inc, Si823x Data sheet, 2020
[23] ATmega328P 8-bit AVR Microcontroller Datasheet, [online] Available: http://www.microchip.com/
[24] GS66508P LTspice Model, GaN Systems Inc. 2020.
[25] Moré, J. J. (1978). The Levenberg-Marquardt algorithm: implementation and theory. In Numerical analysis (pp. 105-116). Springer, Berlin, Heidelberg.
[26] Li, H., Zhao, X., Su, W., Sun, K., You, X., & Zheng, T. Q. "Nonsegmented PSpice Circuit Model of GaN HEMT With Simulation Convergence Consideration." IEEE Transactions on Industrial Electronics 64.11 (2017): 8992-9000.
[27] Shah, Krushal, and Krishna Shenai. "Simple and accurate circuit simulation model for gallium nitride power transistors." IEEE Transactions on Electron Devices 59.10 (2012): 2735-2741.
[28] Peng, K., Eskandari, S., & Santi, E. (2016). Characterization and modeling of a gallium nitride power HEMT. IEEE Transactions on Industry Applications, 52(6), 4965-4975.
[29] Meneghini, M., Cibin, G., Bertin, M., Hurkx, G. A. M., Ivo, P., Šonský, J., ... & Zanoni, E. (2014). OFF-state degradation of AlGaN/GaN power HEMTs: Experimental demonstration of time-dependent drain-source breakdown. IEEE Transactions on Electron Devices, 61(6), 1987-1992.
[30] Bouchour, Al Mehdi, Dherbécourt, P., Echeverri, A., El Oualkadi, A., & Latry, O.. “Modeling of power GaN HEMT for switching circuits applications using Levenberg-Marquardt Algorithm”. International Symposium on Advanced Electrical and Communication Technologies (ISAECT), 2018 International Conference on. IEEE, 2018.
[31] Shenai, K., & Shah, K. (2011, May). Smart DC micro-grid for efficient utilization of distributed renewable energy. In IEEE 2011 EnergyTech (pp. 1-6). IEEE.

93
[32] Konstantinos Giannouloudis (2015), Power Losses and Thermal Impedance Characterization of Power Modules, Master’s thesis in Electric Power Engineering of Chalmers University of Technology, Gothenburg, Sweden 2015
[33] Grosse, Constantino, and Mónica Tirado. "Improved calibration of impedance analyzers for measurements on highly conductive liquids." IEEE Transactions on Instrumentation and Measurement 50.5 (2001): 1329-1333. [34] 4192A Data sheet. 4192A LF Impedance Analyzer, 5 Hz to 13 MHz. Keysight Technology.
[35] Grosse, C., & Tirado, M. C. (1996). Measurement of the dielectric properties of polystyrene particles in electrolyte solution. MRS Online Proceedings Library Archive, 430.
[36] Shen, L., Chen, B., Sun, L., & Gao, J. (2015). Device modeling of high electron mobility transistors: small signal and noise modeling. Journal of Computational and Theoretical Nanoscience, 12(10), 3547-3555.
[37] Zhao, M., Liu, X. Y., Zheng, Y. K., Li, Y., & Ouyang, S. (2013). Analysis of the device characteristics of AlGaN/GaN HEMTs over a wide temperature range. Materials Science and Engineering: B, 178(7), 465-470.
[38] Lau, M. M., Chiang, C. Y. T., Yeow, Y. T., & Yao, Z. Q. (1999, March). Measurement of V/sub T/and L/sub eff/using MOSFET gate-substrate capacitance. In ICMTS 1999. Proceedings of 1999 International Conference on Microelectronic Test Structures (Cat. No. 99CH36307) (pp. 152-155). IEEE.
[39] T.-L. Wu, B. Bakeroot, H. Liang, N. Posthuma, S. You, N. Ronchi, S. Stoffels, D. Marcon, and S. Decoutere, “Analysis of the Gate Capacitance-Voltage Characteristics in p-GaN/AlGaN/GaN Heterostructures,” IEEE Electron Device Lett., vol. 38, no. 12, pp. 1696–1699, Dec 2017, doi: 10.1109/LED.2017.2768099.
[40] Tang, G., Kwan, M. H., Su, R. Y., Yao, F. W., Lin, Y. M., Yu, J. L., ... & Kalnitsky, A. (2018). High-Capacitance-Density p-GaN Gate Capacitors for High-Frequency Power Integration. IEEE Electron Device Letters, 39(9), 1362-1365.
[41] Rhoderick E H and Williams R H 1988 Metal-Semiconductor Contacts (Oxford: Oxford University Press)
[42] Miao, Z., & Xin-Yu, L. (2015). Analysis of Capacitance-Voltage-Temperature Characteristics of GaN High-Electron-Mobility Transistors. Chinese Physics Letters, 32(4), 048501.
[43] Alim, M. A., Rezazadeh, A. A., & Gaquiere, C. (2016). Temperature Effect on DC and Equivalent Circuit Parameters of Gate Length GaN/SiC HEMT for Microwave Applications. IEEE Transactions on Microwave Theory and Techniques, 64(11), 3483-3491.
[44] Sang, L., Ren, B., Liao, M., Koide, Y., & Sumiya, M. (2018). Suppression in the electrical hysteresis by using CaF2 dielectric layer for p-GaN MIS capacitors. Journal of Applied Physics, 123(16), 161423.
[45] Yeo, H. L., & Tseng, K. J. (2016, March). Modelling technique utilizing modified sigmoid functions for describing power transistor device capacitances applied on GaN HEMT and silicon MOSFET. In 2016 IEEE Applied Power Electronics Conference and Exposition (APEC) (pp. 3107-3114). IEEE
[46] SCT2120AF Preliminary Datasheet, Rohm Semiconductor Inc. 2020
[47] Ahsan, S. A., Ghosh, S., Sharma, K., Dasgupta, A., Khandelwal, S., & Chauhan, Y. S. (2015). Capacitance modeling in dual field-plate power GaN HEMT for accurate switching behavior. IEEE Transactions on Electron Devices, 63(2), 565-572.
[48] Aflaki, P., Negra, R., & Ghannouchi, F. M. (2009). Dedicated large-signal GaN HEMT model for switching-mode circuit analysis and design. IEEE Microwave and Wireless Components Letters, 19(11), 740-742.
[49] Rustagi, S. C., & Leung, C. C. C. (2000). Accumulation mode MOS varactor SPICE model for RFIC applications. Electronics letters, 36(20), 1735-1736.
[50] I. Angelov, N. Rorsman, J. Stenarson, M. Garcia, and H. Zirath, “An empirical table-based FET model,” IEEE Trans. Microw. Theory Tech., vol. 47, no. 12, pp. 2350–2357, Dec. 1999.
[51] Popov, A., Bilevich, D., Salnikov, A., Dobush, I., Goryainov, A., & Kalentyev, A. (2019). Automatic large-signal GaAs HEMT modeling for power amplifier design. AEU-International Journal of Electronics and Communications, 100, 138-143.

94
[52] Ahsan, S. A., Ghosh, S., Sharma, K., Dasgupta, A., Khandelwal, S., & Chauhan, Y. S. (2015). Capacitance modeling in dual field-plate power GaN HEMT for accurate switching behavior. IEEE Transactions on Electron Devices, 63(2), 565-572.
[53] Huang, X., Li, Q., Liu, Z., & Lee, F. C. (2013). Analytical loss model of high voltage GaN HEMT in cascode configuration. IEEE Transactions on Power Electronics, 29(5), 2208-2219.
[54] Reference Manual, Series 2600A System SourceMeter. Keithley, 2008
[55] Aktas, Ozgur, et al. "High temperature characteristics of AlGaN/GaN modulation doped field‐effect transistors." Applied Physics Letters 69.25 (1996): 3872-3874.
[56] Greco, Giuseppe, et al. "Effects of annealing treatments on the properties of Al/Ti/p-GaN interfaces for normally off p-GaN HEMTs." IEEE Transactions on Electron Devices 63.7 (2016): 2735-2741.
[57] Giuseppe Greco, Ferdinando Iucolano, Fabrizio Roccaforte, "Review of technology for normally-off HEMTs with p-GaN gate", Materials Science in Semiconductor Processing, pp. , 2017, ISSN 13698001.
[58] I. Hwang et al., “p-GaN gate HEMTs with tungsten gate metal for high threshold voltage and low gate current,” IEEE Electron Device Lett., vol. 34, no. 2, pp. 202–204, Feb. 2013
[59] Wilson, I. M. (1989, August). Analog behavioral modeling using PSPICE. In Proceedings of the 32nd Midwest Symposium on Circuits and Systems, (pp. 981-984). IEEE.
[60] Liu, H. Y., Chou, B. Y., Hsu, W. C., Lee, C. S., Sheu, J. K., & Ho, C. S. (2012). Enhanced AlGaN/GaN MOS-HEMT performance by using hydrogen peroxide oxidation technique. IEEE transactions on electron devices, 60(1), 213-220.
[61] Texas Instrument. Understanding Buck power stage in switchmode power supply. 1999.
[62] Xue, F., Yu, R., & Huang, A. Q. Loss analysis of a high efficiency GaN and Si device mixed isolated bidirectional DC-DC converter. In 2016 IEEE Applied Power Electronics Conference and Exposition (APEC) (pp. 3677-3683). IEEE. 2016.

95
Chapter 4: Extraction of the power GaN HEMTs intrinsic and
extrinsic elements using S-parameter measurements
4.1. Introduction
The GaN transistors constitute an enabling technology for efficient power conversion at switching frequencies higher than the megahertz. However, their very low switching times (a few nanoseconds) generate high disturbances by interaction with parasitic elements. Thus, in order to accurately simulate the transistor behavior in power converters and estimate the power losses, it is of great interest to accurately determine the parasitic elements of the device such as: resistances, inductances, and capacitances.
In order to investigate the impact of the high switching frequency on the power converters efficiency, parasitic elements of GaN HEMT devices should be accurately evaluated. This chapter reports the characterization of a GaN packaged power transistor using S-parameters. Because the transistor is packaged, a calibration technique is carried out using specific test fixtures designed on FR4 printed circuit board (PCB). The proposed method is suitable for a wide range of power devices.
According to [1], the finite-element analysis (FEA) is a method to estimate parasitic elements of packaged transistors. However, this method requires the knowledge of the internal transistor topology and other technological data that are not available from the manufacturer. Although, the impedance meter measurement is a well-known technique to determine parasitic elements of the device [2], it is difficult to separate different parasitic values especially if they are very low. The S-parameter measurements have shown their capability to extract the transistor parasitic elements as well as intrinsic small-signal equivalent circuit [3].
Fast switching performance of GaN power transistors is critically determined by the values of parasitic inductances and capacitances. Negative effects of these elements such as overvoltage, overcurrent, and oscillations occur during transitions [1]. Recent works used S-parameter measurements to extract the access inductances and capacitances of SiC packaged devices [4]. The authors show the capability of S-parameters to extract very low inductances and capacitances values. However, the parasitic inductances of new GaN power transistors packaging have values under the nanohenry and Miller capacitance under the picofarad. These elements still remain challenging to measure.
The access resistances play an important role in the high-frequency operation of GaN HEMT degradation [5], because they add charging and discharging delays during switching. Furthermore, the source and drain parasitic resistances are a major part of ON-state resistance. Therefore, these values must be known with a good precision to estimate conduction losses and they also must be well separated from channel resistance for accurate modeling. Several works are based on S-parameters to extract the access resistance values and their temperature dependence [6].

96
This chapter reports an experimental methodology to extract both intrinsic and extrinsic parasitic elements of a packaged GaN power transistor. For that, we have developed two experimental setups for the measurements of the GaN HEMT parasitic elements. The first experimental setup enables the extraction of the GaN HEMT extrinsic elements at the cold state. The second experimental setup is based on optimization algorithm and offers an automatic extraction of the intrinsic parameters of the DUT at multiple bias conditions. Furthermore, the developed experimental setups for extracting both the intrinsic and extrinsic parameters are used in the next chapter for investigating the impact of aging the GaN HEMT on the S-parameter characteristics of the DUT.
Moreover, to reach the best accuracy on the extraction of very low GaN HEMT parasitics, we have proposed a method based on S-parameter measurements and a specific calibration process using low-cost test fixtures.
After detailing the calibration procedure, measurements of access resistances and inductances as well as voltage-dependent capacitances are presented. The modeling of parasitic elements of GaN HEMT is performed using S-parameter simulation approach. The proposed method is suitable for a wide range of power devices. Furthermore, these results provide power circuit designers with a set of packaging parasitic elements to include for accurate design of power converters using GaN HEMT.
4.2. Small signal model of power GaN HEMT
Several small signal models were used for measuring the parasitic elements of the Si devices [7]. However, GaN HEMT devices shows different S-parameters characteristics due to the GaN device structure and physical properties.
In [8], An accurate small signal equivalent circuit model for power GaN HEMT at low frequency up to 200 MHz has been proposed. In this model, the parasitic elements were determined from S-parameters without the need for additional measurements or separate characterizations. Authors in [8] have demonstrated that the low frequency small signal topology is appropriate to describe the device S-parameter characteristics of power GaN HEMT up to 200 MHz.
The parasitic elements of the GaN HEMT equivalent model at low frequency (f ≤ 200 MHz) are presented in [9] and shown in Fig. 4.1. The equivalent circuit can be divided into intrinsic part and extrinsic part. In the circuit, Cpg and Cpd parasitic capacitances are due to the pad connections, while Cgs, Cgd and Cds respectively account for inter-electrode and cross over capacitances between gate, source and drain. Lg, Ld and Ls represent parasitic inductances due to the contacts of gate, drain and source.
Therefore, three additional resistances Rg, Rs and Rd are added into intrinsic elements for consideration of the gate leakage current. The parasitic gate, source, and drain resistances and inductances are assumed to be independent of the biasing conditions. Thus, they can be determined from the measurement under cold condition.

97
Fig. 4.1: GaN HEMT package [9]: (a) extrinsic parameters, (b) intrinsic parameters.
The proposed low frequency model is used in [10] for extracting the parasitic inductances of the power SiC MOSFET at 200f MHz . Moreover, authors in [10] suggests that the proposed
low frequency small signal model is suitable for characterizing accurate extraction of high-speed power devices parasitic inductances. In this chapter, we have used the proposed small signal topology at low frequencies in the range of 100 kHz ≤ f ≤ 200 MHz for extracting both the extrinsic and intrinsic parameters of the power GaN HEMT.
4.3. S-parameters experimental setup at the cold state
The Keysight VNA (E5080B) [11] was used to experimentally characterize the S-parameters of the GaN power HEMT. The studied frequency interval sweeps between 100 kHz and 200 MHz by a step of 100 kHz. This frequency range is widely used in various power converter applications [12].
Fig. 4.2 (a) shows the experimental setup for GaN HEMT. Before the S-parameters measurement, several preparation steps are required.
The first requirement is the development of a custom test fixture to ensure reliable and low inductance connections between the device terminals and VNA [13]. Fig. 4.2 (b) shows the designed printed circuit board (PCB) test fixture for interfacing the VNA to the DUT. Two 50 Ω SMA female adaptors are used.
For a good connectivity, the DUT is soldered to the test fixture. We have also designed a test fixture for TO-220 style devices (see Fig. 4.2 (c)), but the results were non-reproducible due to the non-stability of the connection between the TO-220 connector and the DUT pads.
(a) (b)

98
Fig. 4.2: (a) VNA measurement setup for GaN HEMT; (b) DUT test fixture; (c) Test fixture using TO-220 connector.
The second requirement is the VNA calibration. Through calibration, the VNA performs an error correction in the VNA itself and the test cables, adapters, and fixture that are between the VNA and the DUT [14]. The full two ports SOLT calibration [15] (Short-Open-Load-Through) was performed using the designed calibration Kit. This calibration enables the exclusion of the influence beyond the DUT from measurements.
4.4. Measurement verification
In the following, the verification of both the measurement repeatability and the calibration is performed in order to ensure that the S-parameter experimental setup is operational.
4.4.1. Measurement repeatability
Degradation of the VNA calibration over time is known as drift [16]. The validation of the S-parameter measurements repeatability aims to establish confidence with the user that the methods are fit for their intended purposes. Fig. 4.3 shows the GaN HEMT Z11 coefficient before and after 24 h VNA measurement session. The closeness of the traces shown in this figure indicates the absence of short-term drift in the measurement setup, and thus the repeatability of the S-parameter characterizations at the cold state using the VNA.
(a) (c)
(b)

99
Fig. 4.3: Measured GaN HEMT Z11 coefficient before and after 24 hours VNA measurement session: (a) Z11 Magnitude and (b) Z11 Phase.
4.4.2. Passive component test
In order to verify the accuracy of the developed S parameter measurements, a verification test is performed using passive components: resistance of 3.25 kΩ, capacitance of 22.72 pF, inductance 56.68 μH. The values of the resistance, capacitance and inductance are pre-measured by a the HP4192A impedance meter at 1 MHz [17]. Table 4.1 shows a comparison between impedance meter and S-parameter measurements of the tested passive component at 1 MHz. The measured value of the tested passive component using S-parameters is closed to the measured value using the impedance analyser at 1 MHz, with a small shift. The error between the impedance meter and S-parameter measurements is due to the parasitic elements of the passive component model, which are accurately considered using S-parameter measurements [18].
Table 4.1: Comparison between impedance meter and S-parameter measurements of the tested passive component at 1 MHz: capacitance, inductance and resistance.
Impedance meter S-parameter Error
Capacitance 22.72 pF 18.46 pF 18,75 %
Inductance 56.68 μH 57.86 µH 2.08 %
Resistance 3.25 kΩ 3.264 kΩ 0.43 %
According to [19], the S-parameters measured by a vector network analyzer (VNA) have shown their capability to extract the parasitic elements of passive components with high accuracy as well as intrinsic small-signal equivalent circuit. Compared to the impedance meter measurement method, which is not able to separate different parasitic values especially if they are very low [2]. The accuracy and good results of the S-parameters method when applied on passive components provide a good way to research the parasitic elements of power devices in order to investigate their impact on power converter application. In the next section, we apply the S-parameters method on power transistors, such as: GaN HEMT and SiC MOSFT.
(a) (b)

100
As shown in this section, we have verified the measurement repeatability before and after 24 h of a VNA measurement session. Also, we have compared the value of passive component obtained from S-parameters measurements using the VNA and we compare it to those obtained from the impedance meter, including: resistor, capacitor and inductor. The results show a good convergence of measurements. In the next section, the extraction methodology of the power GaN HEMT parasitic elements is presented.
4.5. The proposed extraction methodology
The proposed methodology for extracting both the small signal model of power GaN HEMTs is shown in Fig. 4.4, which is composed of eight steps. The model extraction process is composed of seven steps:
Step 1: Parasitic parameters extraction at the cold state for VDS = 0 V, VGS = 0 V and
100 , 200f KHz MHz . This step enables to define the boundaries of both the intrinsic capacitances (CGS, CGD, CDS) and the extrinsic elements (CPD, CPD RG, RS, RD, LS, LD, LG) before launching the optimizations.
Step 2: Using the AMCAD bench, the output characteristic (IDS-VDS) linked with a set of S parameters are measured for V 0 , 4DS V V and 100 , 200f KHz MHz . V 0 , 4DS V V is
selected in order to not exceed the allowed maximum current of the bias Tee (IDS(Max) = 2 A).
Step 3: The linear modeling process start by chosen one quiescent point QP from the measured output characteristic (IDS-VDS) linked with a set of S parameters. The selected QP point is chosen in order to get the linear model close to the bias point that will be used in the power switching application.
Step 4: The fourth step is to optimize the extracted model parameters. The Annealing algorithm [20] is chosen for the optimization of fitting. During the optimization process, a comparison between the model and the measurement is performed. If the convergence is not good, a new set of extrinsic and intrinsic parameters is provided, until measurement and model are consistent convergence.
Step 5: After the optimization process, the compact model of the DUT at one QP point of the power switching application is extracted. The extracted model parameters must respect two criteria:
• The value should be physical (no negative value); • Intrinsic parameters are independent of the frequency. These intrinsic and extrinsic
parameters should be close to the average values that have been found into the cold state in step 1 of this methodology.
Step 6: In order to validate both the extracted extrinsic and intrinsic model, an S-parameters simulation and verification are performed using S-parameters simulator.
Step 7: The selection of one quiescent point QP provides a higher model extraction speed, but can lead to unrealistic determination of extrinsic and intrinsic model parameters. The selection of several points forces the solution to be more realistic. The same optimization can be launched simultaneously for all the points selected.

101
Step 8: Once the linear model has been extracted, the nonlinear intrinsic parameters CGS(VGS), CGD(VGD) and CDS(VDS) have been extracted. The Multi-bias extraction step enables to visualize the intrinsic parameters in multi bias conditions.
4.6. GaN HEMT S-parameters extraction
In this section, we apply the cold state (VDS = 0 V and VGS = 0 V) S-parameters method on power GaN transistor after verification of this technic on both the calibration kit and passive components. For that, we have selected a fresh 650 V / 30 A GaN HEMT (GaN Systems GS66508P) [21]. Fig. 4.5 shows the tested GaN HEMT mounted on the test fixture. The DUT is soldered to an Aluminium PCB, allowing more efficient conduction of heat compared to fibreglass PCB.
Measurement of IDS-VDS characteristic linked with a
set of S parameter
Intrinsic and extrinsic parameters extraction at the
cold state: CGS, CGD, CDS, RG, RD, RS, LS, LD, LG, CPG, CPD
Pre-determination of the extracted parameters boundaries
using the VNA for VDS = 0V,
VGS=0V 100 , 200f KHz MHz
IDS-VDS linked with S-parameters measurements are performed using AMCAD bench at multiple bias points V 0 , 4
DSV V and
100 , 200f KHz MHz
S-parameters simulation verification of the optimized
compact model
Parameters optimization at one quiescent point QP
Fitting effect
Extracted GaN HEMT compact model at one QP
point of the power switching application
The quiescent point QP is chosen in same conditions of power
switching applications.
The Annealing algorithm is chosen for the optimization of
fitting.
Parameters optimization at multiple quiescent points of
the application load line
Non-linear model extraction: CGS(VGS), CGD(VGD) and
CDS(VDS)
Extraction of the intrinsic capacitances at multiple bias.
S-parameters simulation is used to verify the accuracy of the optimized
model by a simulation approach
1
2
3
5
6
7
8
4
Fig. 4.4. GaN HEMT small signal model extraction methodology.

102
Fig. 4.5: Tested 650 V / 30 A GaN HEMT.
The VNA measurement yields S-parameters instead of Z-parameters. The conversion to Z parameters is carried out by (4.1)-(4.4) [22]. Where Z0 is the characteristic impedance which is equal to 50 Ω:
The magnitude and phases of the Z parameters are defined by (5) [23], where ZRe is real part and ZIm is the imaginary part of the Z parameter.
( )
2 2Re Im
Im
Re
( ) (4.5)
( ) 20 log( ) (4.6)
( ) arctan
Z Z Z
Z dB Z
ZZ
Z
= +
=
= (4.7)
The frequency response of the tested power GaN HEMT is shown in Fig. 4.6. At high frequencies (> SRF) the GaN HEMT has an inductive behaviour [24]. At the SRF frequency, the DUT has a resistive behaviour. For low frequencies (< SRF), the DUT has a capacitive behaviour [25]. The extracted self-resonance frequency of each parameter Z11, Z12, Z21 and Z22 are shown in Table 4.2. The non-equal SRF between Z11 and Z22, is due to the non-symmetrical parasitic element between both the source-gate side and the drain-gate side [26].
Parasitic elements of the GaN HEMT are determined from Z-parameters plot computed from the S-parameters. The extracting of the parasitic inductances, resistances and capacitances of the GaN HEMT are presented in the next section. We start by extracting the inductance at high frequency (= 200 MHz). Then, we extract the parasitic resistance at the SRF frequency. We finish by extracting the parasitic capacitance at low frequency (= 1 MHz).

103
Fig. 4.6: Frequency responses of the tested power GaN HEMT for 100 kHz < f < 200 MHz: (a) Z11, (b) Z12, (c) Z21 and (d) Z22 Magnitudes and phases.
Table 4.2: Self resonance frequency of the tested power GaN HEMT.
Z-parameters Z11 Z12 Z21 Z22 SRF 72.58 - 72.81 MHz 69.92 – 70.14 MHz 69.69 – 69.92 MHz 55.02 – 55.24 MHz
4.6.1. Parasitic inductances
For the extraction of the parasitic inductances of GaN HEMT, we used the simplified two-port network representation of the GaN HEMT equivalent circuit for inductance extraction at high frequency (> SRF), as shown in Fig. 4.7. At high frequency, the inductor impedance dominates while the capacitances and resistances can be neglected [27].
Fig. 4.7: Equivalent circuit of the DUT at high frequency [27].
(a) (b)
(c) (d)

104
The inductance effect of the DUT at high frequency for the two-port network Z-parameters are defined as follows [28]:
( )2
1
111( )
1 0
112( )
2 0
21( )
2 (4.8)
2 (4.9)
G S
S
high L L G S
I
high L S
I
high
VZ X X f L L
I
VZ X f L
I
Z
=
=
= = + = +
= = =
=
( )
2
1
2
1 0
222( )
2 0
2 (4.10)
2 (4.11)
S
D S
L S
I
high L L D S
I
VX f L
I
VZ X X f L L
I
=
=
= =
= = + = +
The extracted parasitic inductances of the tested GaN HEMT at 200 MHz are shown in
Fig. 4.8: source inductance (LS), gate inductance (LG) and drain inductance (LD). Table 4.3 shows the measured parasitic inductances of GaN HEMT at high frequency 200 MHz. The low parasitic inductance LS, LG, LD of the GaN HEMT enable best performance at high switching frequencies, which result in lower switching energy dissipation [29].
Fig. 4.8: Inductances extraction of the tested power GaN HEMT: (a) LS, (b) LG and (c) LD frequency responses.
(a) (b)
(c)

105
Table 4.3: GaN HEMT extracted parasitic inductances LS, LG and LD at 200 MHz.
Inductances LS LG LD GaN HEMT 3.44 nH @ 200 MHz 9.87 H @ 200 MHz 14.66 nH @ 200 MHz
4.6.2. Intrinsic capacitances
For the extraction of the parasitic capacitances of GaN HEMT, we used the equivalent circuit of GaN HEMT at low frequency (< SRF) (See Fig. 4.9). At low frequency, the capacitor impedance dominates while the inductances and resistances can be neglected [30].
Fig. 4.9: Equivalent circuit of the DUT at low frequency using star connection [30]: CG, CS and CD.
The capacitance effect of the GaN HEMT at low frequency for the two-port network Z-parameters
are defined by [28]:
2
1
2
111( )
1 0
112( )
2 0
221( )
1 0
(4.12)
(4.13)
G S
S
S
low C C
I
low C
I
low C
I
VZ X X
I
VZ X
I
VZ X
I
=
=
=
= = +
= =
= =
1
222( )
2 0
(4.14)
(4.15)D Slow C C
I
VZ X X
I=
= = +
The conversion from star connection (Fig. 4.9) to delta connection (Fig. 4.10) enable to find the intrinsic capacitance CGS, CGD and CDS. These capacitances are calculated by [31]:
(4.16)
(4.17)
G S G D S D
GSD
G S G D S D
GDS
G S G D S D
DSG
C C C C C CC
C
C C C C C CC
C
C C C C C CC
C
X X X X X XX
X
X X X X X XX
X
X X X X X XX
X
+ + =
+ + =
+ + = (4.18)

106
Fig. 4.10: Delta connection of the extracted capacitances [31]: CGS, CGD and CDS.
The extracted parasitic capacitances of the GaN HEMT at 1 MHz are presented in Fig. 4.11: source capacitance (CGS), gate capacitance (CGD) and drain capacitance (CDS). The measured CGS is a combination of the intrinsic gate capacitance and the pad capacitance CPG. Furthermore, the measured CDS is a combination of the intrinsic drain capacitance and the pad capacitance CPD. Table 4.4 presents a comparison between the VNA and impedance analyzer measurements of the extracted parasitic capacitances at 1 MHz.
For the comparison, we used the same frequency of extracting the parasitic capacitances in literature [32], which is 1 MHz. Both the VNA and impedance analyzer measurements are performed at the cold state, which are VGS = 0 V and VDS = 0 V. The measurements with VNA are close to those performed using the impedance analyzer, with a mean error of 16.89 %. This error is due to the inability of the impedance analyzer measurement to separate different parasitic values especially if they are very low, which is the case of the GaN HEMT transistors [2]. However, S-parameters measured using a vector network analyzer (VNA), have shown their capability to extract the transistor parasitic capacitances [33].
(a) (b)

107
Fig. 4.11: Capacitances extraction of the tested power GaN HEMT: (a) CGS, (b) CGD and CDS frequency responses.
Table 4.4: GaN HEMT extracted parasitic capacitances CGS, CGD and CDS at 1 MHz.
GaN HEMT Capacitances CGS CGD CDS VNA measurements 218.36 pF 65.67 pF 422.38 pF Impedance analyser measurements 236 pF 109.36 pF 436.6 pF Error (%) 7.47 % 39.95 % 3.25 %
4.6.3. Parasitic resistances
For the extraction of the parasitic resistances of GaN HEMT, we used the equivalent circuit of the GaN HEMT at SRF frequency (See Fig. 4.12). At the SRF frequency in Table 4.2, the resistance impedance dominates while the inductances and capacitances can be neglected [34].
Fig. 4.12 : Equivalent circuit of the DUT at SRF frequency [34]: RG, RS, RD.
The resistance effect of the GaN HEMT at SRF frequency for the two-port network Z-parameters
are defined by [28]:
(c)

108
2
1
2
111( )
1 0
112( )
2 0
221( )
1 0
(4.19)
(4.20)
G S
S
S
SRF R R G S
I
SRF R S
I
SRF R
I
VZ X X R R
I
VZ X R
I
VZ X
I
=
=
=
= = + = +
= = =
= =
1
222( )
2 0
(4.21)
(4.22)D S
S
SRF R R D S
I
R
VZ X X R R
I=
=
= = + = +
The extracted parasitic resistances of the GaN HEMT at the SRF frequency are shown in Fig. 4.13: source resistance (RS), gate resistance (RG) and drain resistance (RD). Table 4.5 presents the measured parasitic resistances of GaN HEMT at the corresponding SRF frequency of each parameter: RS, RG and RD. The parasitic resistances RD and RS are connected in series with the internal channel resistance, which play a vital role in determining device conduction losses [35].
In general, the drain parasitic resistance RD is much larger than the source parasitic resistance RS, which is confirmed in [36]. The parasitic gate resistance RG value has a significant impact on the switching transients for fast switching power converters [37]. It is shown in [38] that a higher gate resistance reduces the switching speed and consequently causes higher switching losses at the DUT.
(a) (b)

109
Fig. 4.13: Resistances extraction of the tested power GaN HEMT: (a) RS, (b) RG and (c) RD frequency responses.
Table 4.5: GaN HEMT extracted parasitic resistances RS, RG and RD at SRF frequency.
Parameters RS RG RD GaN HEMT 112.82 mΩ @ 70.36 MHz 2.48 Ω @ 74.59 MHz 354.59 mΩ @ 55.91 MHz
In the next section, we have evaluated the accuracy of the used S-parameters extracting methodology for GaN HEMT by comparing the extracted parasitic parameters of a known DUT with those shown in the literature.
4.6.4. Measurement methodology verification
Authors in [39] have extracted the parasitic inductances, capacitances, and resistances of a SiC power MOSFET by measuring the S-parameters using a VNA and then convert them into Z-parameters. In order to evaluate the accuracy of our S-parameter characterization at the cold state, we have compared the extracting methodology with those presented in [39]. For that, we have selected a second generation of a 1200 V SiC (Wolfspeed’s C2M0160120D). The selected Gen 2 SiC MOSFET is the same used in [39]. Fig. 4.14 shows the tested 1200V SiC MOSFET mounted on the test fixture.
Fig. 4.14: Tested 1200 V SiC MOSFET
Table 4.7 shows a comparison between both the measurements and the literature of the extracted parasitic inductances, capacitance and resistances of the Gen 2 1200 V SiC MOSFET. The used frequency for extracting the parasitic inductances is not specified in [39]. We used
(c)
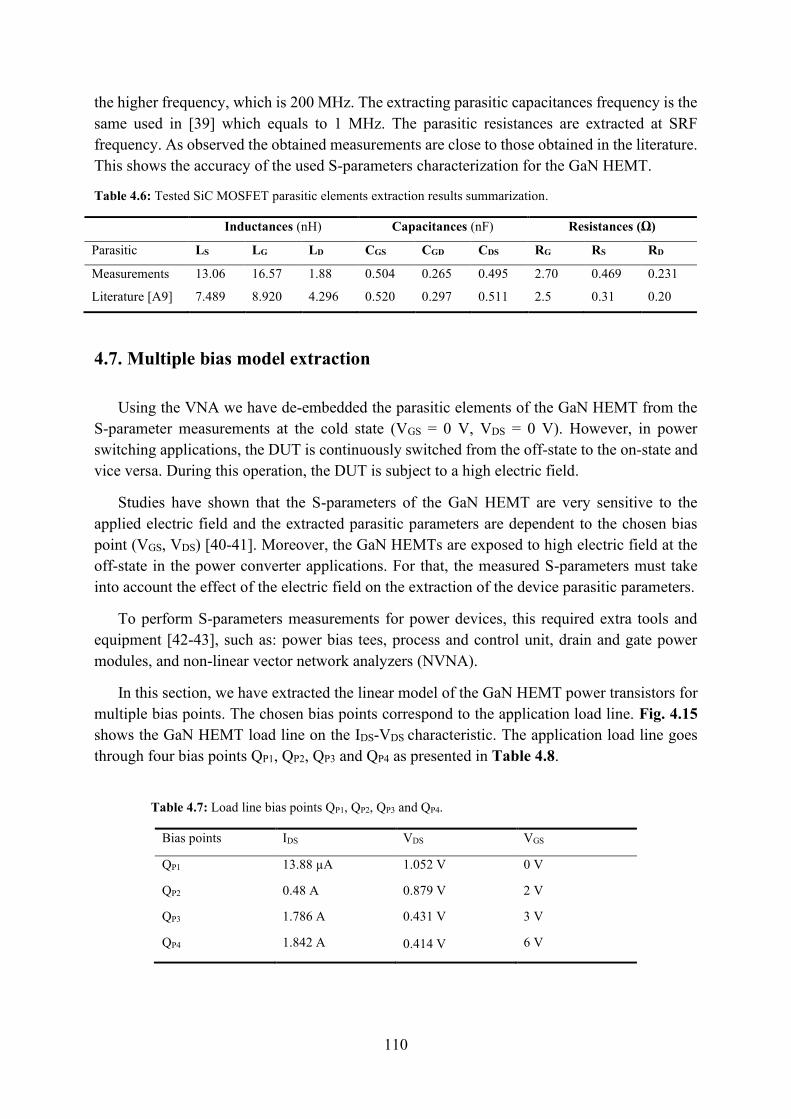
110
the higher frequency, which is 200 MHz. The extracting parasitic capacitances frequency is the same used in [39] which equals to 1 MHz. The parasitic resistances are extracted at SRF frequency. As observed the obtained measurements are close to those obtained in the literature. This shows the accuracy of the used S-parameters characterization for the GaN HEMT.
Table 4.6: Tested SiC MOSFET parasitic elements extraction results summarization.
Inductances (nH) Capacitances (nF) Resistances (Ω)
Parasitic LS LG LD CGS CGD CDS RG RS RD
Measurements 13.06 16.57 1.88 0.504 0.265 0.495 2.70 0.469 0.231
Literature [A9] 7.489 8.920 4.296 0.520 0.297 0.511 2.5 0.31 0.20
4.7. Multiple bias model extraction
Using the VNA we have de-embedded the parasitic elements of the GaN HEMT from the S-parameter measurements at the cold state (VGS = 0 V, VDS = 0 V). However, in power switching applications, the DUT is continuously switched from the off-state to the on-state and vice versa. During this operation, the DUT is subject to a high electric field.
Studies have shown that the S-parameters of the GaN HEMT are very sensitive to the applied electric field and the extracted parasitic parameters are dependent to the chosen bias point (VGS, VDS) [40-41]. Moreover, the GaN HEMTs are exposed to high electric field at the off-state in the power converter applications. For that, the measured S-parameters must take into account the effect of the electric field on the extraction of the device parasitic parameters.
To perform S-parameters measurements for power devices, this required extra tools and equipment [42-43], such as: power bias tees, process and control unit, drain and gate power modules, and non-linear vector network analyzers (NVNA).
In this section, we have extracted the linear model of the GaN HEMT power transistors for multiple bias points. The chosen bias points correspond to the application load line. Fig. 4.15 shows the GaN HEMT load line on the IDS-VDS characteristic. The application load line goes through four bias points QP1, QP2, QP3 and QP4 as presented in Table 4.8.
Table 4.7: Load line bias points QP1, QP2, QP3 and QP4.
Bias points IDS VDS VGS
QP1 13.88 µA 1.052 V 0 V
QP2 0.48 A 0.879 V 2 V
QP3 1.786 A 0.431 V 3 V
QP4 1.842 A 0.414 V 6 V

111
Fig. 4.15: GaN HEMT load line IDS-VDS characteristic.
4.7.1. Multiple bias experiment setup
The multiple bias experimental S-parameters bench is shown in Fig. 4.16, which includes: vector network analyzer, AMCAD bench, data capture and analysis computer, gate and drain bias T, gate and drain probes, test fixture. The small-signal S-parameter measurements were performed under continuous waveform (CW) operation at room temperature. Calculated S-parameters were measured at various frequencies starting from 100 kHz to 200 MHz by a step of 100 kHz.
The selected frequencies are widely used in power switching application. External bias tees were used with high drain current capability in the range of 2 A [44]. Bias conditions were set by the internal DC-voltage sources of the AMCAD bench. The Keysight E5080A ENA was used to measure the S-parameters [45]. VNA calibration of S-parameter measurements was carried out applying the SOLT technique [46], using a Keysight 85032F type N calibration kit which included open, short, thru circuits and a 50 Ω load.
Fig. 4.16: Multiple bias S-parameters bench.

112
4.7.2. Linear model extraction methodology
The model adopted in this study corresponds to the conventional small-signal equivalent circuit of a field effect transistor in the saturated zone. Fig. 4.17 shows the conventional small-signal equivalent circuit model for HEMTs [47], which can be partitioned into two parts: extrinsic and intrinsic parameters. The extrinsic elements LG, RG, CPG, LS, RS, RS, LD, RD, CPD are independent of the biasing condition [48]. The intrinsic elements CGS, CGD, CDS and are bias dependent [49]. The various components in the model are defined in the following list [50]: CPG: gate pad capacitance, CPD: drain pad capacitance, LG: gate inductance, LD: drain inductance, LS: source inductance, RG: gate resistance, RD: drain to channel resistance, RS: source to channel resistance.
Fig. 4.17: Small signal equivalent circuit model of GaN HEMTs [47].
The Annealing algorithm [51] is chosen for the optimization of fitting. During the optimization process, a comparison between the model and the measurement is performed. If the convergence is not good, a new set of extrinsic and intrinsic parameters is provided, until measurement and model are consistent convergent. The model optimization required the specification of the parameter boundaries at the cold state for VDS = 0 V, VGS = 0 V. The GaN
HEMT intrinsic and extrinsic parameters 100 , 200f KHz MHz
are calculated in section 4.6.
Table 4.9 shows the mean value of the linear model parameters at multiple quiescent points: QP1, QP2, QP3 and QP4 of the GaN HEMT. For a good convergence of the extracted linear model with measurement, the value of RD, RG, RS, LD, LS, LG, CGS, CGD, CDS, CPD and CPG are specified from the cold state parameters extracting in the previous section. The Annealing algorithm is used for the extraction of the linear model.
Table 4.8: linear model parameters of the GaN HEMT at multiple quiescent points: QP1, QP2, QP3 and QP4.
Parameters RD RG RS LD LS LG
Optimized value 54.332 mΩ 723.37 mΩ 9.48 mΩ 8.068 Nh 3.17 nH 382.72 pH
Parameters CPD CPG CGS CGD CDS
Optimized value 28.03 pF 18.549 pF 353.39 pF 12.815 pF 74.045 pF
After extracting the GaN HEMT linear model parameters at multiple quiescent voltages, we have completed in the next section the developed model by extracting the non-linear capacitance characteristics of the GaN HEMT.

113
4.7.3. Non-linear intrinsic capacitance extraction
The S-parameter characterization is an accurate technique to extract the parasitic capacitances for power modules and eliminate the uncertainty and inaccuracy associated with the impedance meter measurement approach [52]. In this section, we have extracted the CGS capacitance using multibias S-parameter measurements.
Fig. 4.18 shows the extracted CGS at various bias points: VDS = 0 V and VGS start from 0 V to 7 V with a step of 0.1 V. As shown in this figure, we have obtained similar curves of the p-GaN HEMT that have been found in chapter 3 using C-V impedance meter.
The lower value obtained using S-parameters compared to impedance meter are due the CPG and CPD capacitances, which are not taken into account when using the impedance meter. This makes the measurement of parasitic capacitance using S-parameters highly accurate compared to the impedance meter.
According to the literature, the one-port configuration with shorted terminal using the impedance meter is no longer practical for the power module extraction due to the more complex structure with more parasitic capacitances [53]. Therefore, two-port extraction using S-parameters is the ideal method for power modules measurement.
Fig. 4.18: Evolution of GaN HEMT CGS intrinsic capacitance.
4.8. S-parameter modelling and simulation
To validate the extracted linear model of the tested GaN HEMT, we have simulated the equivalent circuit in frequency domain using an S-parameters circuit simulator. We have first built a small-signal equivalent circuit of a power GaN HEMT with a set of predefined parasitic inductance, capacitance, and resistance values. Fig. 4.19 shows the simulated power GaN equivalent circuit with extracted parameters given in Table 4.9. The GaN HEMT circuit setup

114
is biased at QP4 bias point, where VGS = 6 V, VDS = 0.414 V. The frequency domain simulation is carried out in the frequency range of 100 kHz to 200 MHz. We then run the frequency domain simulation to generate a set of S-parameters. Finally, we use the proposed approach to extract the parasitic values from these simulated S-parameters data. We then compare the extracted component values with the original predefined values to validate our derived mathematical formulas and extraction methodology.
Fig. 4.19: S-parameter simulation setup at QP4 bias point.
The comparison between the measured and optimized S-parameters using Annealing algorithm are shown in Fig. 4.20 for S11 and S22 parameters and in Fig. 4.21 for S12 and S21 parameters. The blue dashed line corresponds to the optimized S-parameters and the black line corresponds to the measured S-parameters. As can be observed, the optimized GaN HEMT model shows good convergence with measurement.
Fig. 4.20: Optimized S11 and S22 parameters for the tested GaN HEMT at QP4 bias point: (a) S11 Real, (b) S11 imaginary, (c) S22 Real, (d) S22 imaginary.
(a) (b)
(c) (d)

115
Fig. 4.21: Optimized S12 and S21 parameters for the tested GaN HEMT at QP4 bias point: (a) S12 Real, (b) S12 imaginary, (c) S21 Real, (d) S21 imaginary.
From the S-parameters plots in Fig. 4.20 and Fig. 4.21, we extract the parasitic component values following steps given of the extraction methodology described in section 4.5. Table 4.10 summarizes the extracted values in comparison with the given values in the original circuit. It is noted that the extracted inductances, capacitances and resistances are reasonably accurate with the difference less than 10.61 %, giving us sufficient confidence with our proposed extraction method.
Table 4.9: Comparison between measured and simulated extracted parasitic elements of the GaN HEMT at QP4 bias point.
Parameters Measurement Simulation Error (%) LS (nH) 3.27 3.12 4.58 LG (nH) 120.34 78.76 34.55 LD (nH) 10.61 12.57 18.47 RS (mΩ) 11.82 12.59 8.29 RG (mΩ) 634.37 587.76 7.34 RD (mΩ) 72.82 86.59 18.90 CGS (pF) 317.36 318.52 0.42 CGD (pF) 17.67 15.85 10.18 CDS (pF) 103.38 102.43 0.91 CPG (pF) 21.09 19.13 9.29 CPD (pF) 30.957 29.764 3.85
(c) (d)
(a) (b)

116
4.9. Conclusion
In this chapter, an accurate methodology based on an accurate S-parameters calibration procedure is proposed to determine parasitic resistances, inductances, and capacitances of a packaged GaN power transistor. Two experimental setups have developed for the measurements of the GaN HEMT parasitic elements. The first one enables the extraction of the GaN HEMT extrinsic elements at the cold state. The second experimental setup is based on optimization algorithm and offers an automatic extraction of the intrinsic parameters of the DUT at multiple bias conditions. The obtained results show the possibility to extract very low device parasitics which may influence switching mechanisms in power converters. Good agreement is achieved between extracted values and technical data provided in the literature. Moreover, modeling equations are proposed for the nonlinear model parameters. The proposed method has the capability to be applied to any packaged GaN power transistor fabricated by different manufacturers. In this context, this method was already applied to extract SiC MOSFET parasitic elements. Furthermore, the method offers the possibility to extend the characterization to devices that have two terminals, such as: commercial inductances, capacitances and resistances. The characterization results and modeling approach presented in this chapter will be used in the next chapter to study the effect of aging the parasitic elements of GaN packaged power transistor on the efficiency and the design of power converter.
4.10. References
[1] Z. Liu, X. Huang, F. C. Lee, and Q. Li, “Package parasitic inductance extraction and simulation model development for the high-voltage Cascode GaN HEMT,” IEEE Trans. Power Electron., vol. 29, no. 4, pp. 1977–1985, Apr. 2014. doi: 10.1109/TPEL.2013.2264941.
[2] W. Lin and P. C. Chan, “On the measurement of parasitic capacitances of device with more than two external terminals using an LCR meter,” IEEE Trans. Electron Devices, vol. 38, no. 11, pp. 2573–2575, Nov. 1991. doi: 10.1109/16.97429
[3] M. Thorsell, K. Andersson, H. Hjelmgren, and N. Rorsman, “Electrothermal access resistance model for GaN-Based HEMTs,” IEEE Trans. Electron Devices, vol. 58, no. 2, pp. 466–472, Feb. 2011. doi: 10.1109/TED.2010.2093012.
[4] C. Salcines, Y. Pathak, and I. Kallfass, “Characterization of power transistors intrinsic parasitics based on 2-Port S-parameter measurements,” in Proc. 19th Eur. Conf. Power Electro Appl. (EPE’17 ECCE Europe), Warsaw, poland, May 2016, pp. 1–8. doi: 10.23919/EPE17ECCEEurope.2017.8098949
[5] Caesar, M., Dammann, M., Polyakov, V., Waltereit, P., Bronner, W., Baeumler, M., ... & Ambacher, O. (2012, April). Generation of traps in AlGaN/GaN HEMTs during RF-and DC-stress test. In 2012 IEEE International Reliability Physics Symposium (IRPS) (pp. CD-6). IEEE.
[6] N. K. Subramani et al., “Characterization of parasitic resistances of AlN/GaN/AlGaN HEMTs through TCAD-based device simulations and on-wafer measurements,” IEEE Trans. Microw. Theory Techn., vol. 64, no. 5, pp. 1351–1358, May 2016. doi: 10.1109/TMTT.2016.2549528.
[7] DANIELS, Robert R., YANG, Andrew T., et HARRANG, Jeff P. A universal large/small signal 3-terminal FET model using a nonquasistatic charge-based approach. IEEE Transactions on Electron Devices, 1993, vol. 40, no 10, p. 1723-1729.
[8] Kompa, Gunter. Parameter Extraction and Complex Nonlinear Transistor Models. Artech House, 2019.

117
[9] Lu, J., Wang, Y., Ma, L., & Yu, Z. (2008). A new small-signal modeling and extraction method in AlGaN/GaN HEMTs. Solid-State Electronics, 52(1), 115-120.
[10] Liu, Tianjiao, Thomas TY Wong, and Z. John Shen. "A new characterization technique for extracting parasitic inductances of SiC power MOSFETs in discrete and module packages based on two-port S-parameters measurement." IEEE Transactions on Power Electronics 33.11 (2018): 9819-9833.
[11] E5080B ENA Series Vector Network Analyzer, 9 kHz to 20 GHz. Keysight Technology Datasheet. 2020.
[12] Cai, Yichen, Andrew J. Forsyth, and Rebecca Todd. "Impact of GaN HEMT dynamic on-state resistance on converter performance." 2017 IEEE Applied Power Electronics Conference and Exposition (APEC). IEEE, 2017.
[13] Ye, X. (2012). De-embedding errors due to inaccurate test fixture characterization. IEEE Electromagnetic Compatibility Magazine, 1(4), 75-78.
[14] Wollensack, M., Hoffmann, J., Ruefenacht, J., & Zeier, M. (2012, June). VNA Tools II: S-parameter uncertainty calculation. In 79th ARFTG Microwave Measurement Conference (pp. 1-5). IEEE.
[15] Stenarson, J., & Yhland, K. (2007, June). Residual error models for the SOLT and SOLR VNA calibration algorithms. In 2007 69th ARFTG Conference (pp. 1-7). IEEE.
[16] FLORES, Jaime Alberto Zamudio. Device characterization and modeling of large-size GaN HEMTs. kassel university press GmbH, 2012.
[17] LF impedance meter (5 Hz to 13 MHz) HP4192A. HP Agilent 4192A Datasheet. 2020
[18] Wei, T., Stapleton, S., & Berolo, E. (1993). Equivalent circuit and capacitance of double barrier resonant tunneling diode. Journal of applied physics, 73(2), 829-834.
[19] RAYMOND, Wong Jee Keen, CHAKRABARTY, Chandan Kumar, HOCK, Goh Chin, et al. Complex permittivity measurement using capacitance method from 300 kHz to 50 MHz. Measurement, 2013, vol. 46, no 10, p. 3796-3801.
[20] CHEN, Jun et LIU, Xun-chun. HFET Small Signal Model Extraction from S Parameters Using Simulated Annealing Algorithm. CHINESE JOURNAL OF SEMICONDUCTORS-CHINESE EDITION-, 2001, vol. 22, no 1, p. 79-82.
[21] GS66508P Preliminary Datasheet, GaN_Systems_Inc. 2020.
[22] Frickey, Dean A. "Conversions between S, Z, Y, H, ABCD, and T parameters which are valid for complex source and load impedances." IEEE Transactions on microwave theory and techniques 42.2 (1994): 205-211.
[23] Gersing, E. et Osypka, M. EIT using magnitude and phase in an extended frequency range. Physiological measurement, 1994, vol. 15, no 2A, p. A21.
[24] Demirezen, S., & Altındal, Ş. (2010). On the temperature dependent profile of interface states and series resistance characteristics in (Ni/Au)/Al0. 22Ga0. 78N/AlN/GaN heterostructures. Physica B: Condensed Matter, 405(4), 1130-1138.
[25] Brady, R. G., Oxley, C. H., & Brazil, T. J. (2008). An improved small-signal parameter-extraction algorithm for GaN HEMT devices. IEEE Transactions on Microwave Theory and Techniques, 56(7), 1535-1544.
[26] Menozzi, R., Umana-Membreno, G. A., Nener, B. D., Parish, G., Sozzi, G., Faraone, L., & Mishra, U. K. (2008). Temperature-dependent characterization of AlGaN/GaN HEMTs: Thermal and source/drain resistances. IEEE Transactions on Device and Materials Reliability, 8(2), 255-264.
[27] Lu, J., Wang, Y., Ma, L., & Yu, Z. (2008). A new small-signal modeling and extraction method in AlGaN/GaN HEMTs. Solid-State Electronics, 52(1), 115-120.
[28] Liu, T., Wong, T. T., & Shen, Z. J. (2018). A new characterization technique for extracting parasitic inductances of SiC power MOSFETs in discrete and module packages based on two-port S-parameters measurement. IEEE Transactions on Power Electronics, 33(11), 9819-9833.

118
[29] Sørensen, C., Fogsgaard, M. L., Christiansen, M. N., Graungaard, M. K., Nørgaard, J. B., Uhrenfeldt, C., & Trintis, I. (2015, June). Conduction, reverse conduction and switching characteristics of GaN E-HEMT. In 2015 IEEE 6th International Symposium on Power Electronics for Distributed Generation Systems (PEDG) (pp. 1-7). IEEE.
[30] van Raay, F., Quay, R., Seelmann-Eggebert, M., Schwantuschke, D., Peschel, D., Schlechtweg, M., & Ambacher, O. (2012). New low-frequency dispersion model for AlGaN/GaN HEMTs using integral transform and state description. IEEE transactions on microwave theory and techniques, 61(1), 154-167.
[31] Kothari, D. P., and I. J. Nagrath. Theory and Problems of Basic Electrical Engineering. PHI Learning Pvt. Ltd., 1998.
[32] Haryani, N., Zhang, X., Burgos, R., & Boroyevich, D. (2016, March). Static and dynamic characterization of GaN HEMT with low inductance vertical phase leg design for high frequency high power applications. In 2016 IEEE Applied Power Electronics Conference and Exposition (APEC) (pp. 1024-1031). IEEE.
[33] Pace, L., Defrance, N., Videt, A., Idir, N., & Dejaeger, J. C. (2018, June). S-parameter characterization of gan hemt power transistors for high frequency modeling. In PCIM Europe 2018; International Exhibition and Conference for Power Electronics, Intelligent Motion, Renewable Energy and Energy Management (pp. 1-8). VDE.
[34] Zarate-de Landa, A., Zuniga-Juarez, J. E., Loo-Yau, J. R., Reynoso-Hernandez, J. A., del Carmen Maya-Sanchez, M., & del Valle-Padilla, J. L. (2009). Advances in linear modeling of microwave transistors. IEEE Microwave Magazine, 10(2), 100-102.
[35] Pace, L., Defrance, N., Videt, A., Idir, N., De Jaeger, J. C., & Avramovic, V. (2019). Extraction of Packaged GaN Power Transistors Parasitics Using S-Parameters. IEEE Transactions on Electron Devices, 66(6), 2583-2588.
[36] Peng, K., Eskandari, S., & Santi, E. (2016). Characterization and modeling of a gallium nitride power HEMT. IEEE Transactions on Industry Applications, 52(6), 4965-4975.
[37] Han, D., Morris, C. T., Lee, W., & Sarlioglu, B. (2016). A case study on common mode electromagnetic interference characteristics of GaN HEMT and Si MOSFET power converters for EV/HEVs. IEEE Transactions on Transportation Electrification, 3(1), 168-179.
[38] Lautner, J., & Piepenbreier, B. (2015, June). Analysis of GaN HEMT switching behavior. In 2015 9th International Conference on Power Electronics and ECCE Asia (ICPE-ECCE Asia) (pp. 567-574). IEEE.
[39] Liu, Tianjiao, Thomas TY Wong, and Z. John Shen. "A new characterization technique for extracting parasitic inductances of SiC power MOSFETs in discrete and module packages based on two-port S-parameters measurement." IEEE Transactions on Power Electronics 33.11 (2018): 9819-9833.
[40] Cojocaru, V. I., & Brazil, T. J. (1994). A large-signal model for GaAs MESFET's and HEMT's valid at multiple DC bias-points.
[41] Gibiino, G. P., Santarelli, A., & Filicori, F. (2019). Charge-conservative GaN HEMT nonlinear modeling from non-isodynamic multi-bias S-parameter measurements. International Journal of Microwave and Wireless Technologies, 11(5-6), 431-440.
[42] Fernandez, T., Newport, Y., Zamanillo, J. M., Mediavilla, A., & Tazon, A. (1993, September). High speed automated pulsed I/V measurement system. In 1993 23rd European Microwave Conference (pp. 494-496). IEEE.
[43] IVCAD NVNA and X parameter -Load Pull. Getting Started v3.6. AMCAD Engineer.
[44] PSPL5580 Data sheet, Tektronix, 2013.
[45] E5080A ENA Vector Network Analyzer Data Sheet, Keysight Technologies, Nov. 2017, 5992-0291EN
[46] Ridler, Nick M., and Nils Nazoa. "Using simple calibration load models to improve accuracy of vector network analyzer measurements." 2006 67th ARFTG Conference. IEEE, 2006.

119
[47] Alim, M. A., Rezazadeh, A. A., & Gaquiere, C. (2016). Small signal model parameters analysis of GaN and GaAs based HEMTs over temperature for microwave applications. Solid-State Electronics, 119, 11-18.
[48] Jarndal, A., Essaadali, R., & Kouki, A. B. (2015). A reliable model parameter extraction method applied to AlGaN/GaN HEMTs. IEEE Transactions on Computer-Aided Design of Integrated Circuits and Systems, 35(2), 211-219.
[49] Ahsan, S. A., Ghosh, S., Khandelwal, S., & Chauhan, Y. S. (2017). Physics-based multi-bias RF large-signal GaN HEMT modeling and parameter extraction flow. IEEE Journal of the Electron Devices Society, 5(5), 310-319.
[50] Shen, L., Chen, B., Sun, L., & Gao, J. (2015). Device modeling of high electron mobility transistors: small signal and noise modeling. Journal of Computational and Theoretical Nanoscience, 12(10), 3547-3555.
[51] Bilbro, G. L., Steer, M. B., Trew, R. J., Chang, C. R., & Skaggs, S. G. (1990). Extraction of the parameters of equivalent circuits of microwave transistors using tree annealing. IEEE transactions on microwave theory and techniques, 38(11), 1711-1718.
[52] Callet, G., Faraj, J., Jardel, O., Charbonniaud, C., Jacquet, J. C., Reveyrand, T., ... & Quéré, R. (2010). A new nonlinear HEMT model for AlGaN/GaN switch applications. International journal of microwave and wireless technologies, 2(3-4), 283-291.
[53] G. Dambrine, A. Cappy, F. Heliodore and E. Playez, "A new method for determining the FET small-signal equivalent circuit," in IEEE Transactions on Microwave Theory and Techniques, vol. 36, no. 7, pp. 1151-1159, Jul 1988.

120
Chapter 5: Aging of the GaN HEMT under safe operational
conditions
5.1. Introduction
The attention of academics and industrials on reliability of GaN HEMT is accelerated by the impressive growth of GaN HEMTs market, due to their high superior performances compared to those of Silicon power transistors. Their applications are in various domains, such as green energy and RF engineering.
To validate the robustness of power GaN HEMTs transistors, JEDEC standardized tests for Si power transistors are used [1]. However, the standardized tests for Si are not enough to guarantee the robustness of GaN transistors when they are used in power converter applications, because the reliability of GaN under switching operation is different from that of Si transistors [2]. Moreover, running power GaN HEMTs under accelerated conditions would cause many non-GaN failures.
In the literature, the reliability of GaN HEMTs has been improved. Reference [3] classifies the degradation modes of GaN HEMT in switching mode DC power converter into three classes: on-state, off-state and semi-off state. According to [4], one of the major disadvantages limiting the reliability of GaN HEMTs for switching power applications is hot electron effects that occurs during the switching state. In [5], this degradation result in decreased DC and RF performance.
According to [6], it is important to study the reliability of GaN HEMT for power conversion circuits. This paper presents a developed reliability methodology under operational switching conditions. The proposed aging switching bench presents high power efficiency. The effects of aging GaN HEMT on a power converter application are studied by SPICE simulation approach.
In this chapter, we studied the effects of aging power GaN HEMT under switching conditions at both high current and voltage. Such studies are of great importance as the device is subjected to conditions similar to what would be experienced in a real application of power converters. During the aging campaign, we have monitored the changes of the current-voltage (I-V), capacitance-voltage (C-V) and S-parameters characteristics. Both static and dynamic electrical characteristics of the devices are measured as a function of stress time and are modeled. Notably, these results are used to simulate the efficiency of a DC-DC buck converter using both fresh and aged devices. The investigation of the impact of aging the GaN HEMT on the efficiency of power converts are of very high interest to circuit and system designers, as they will be eager to understand the effects of device degradation on their systems.
5.2. Aging methodology
Tested transistor is a fresh GS66508P from GaN Systems [7], which is a p-type gate normally-off AlGaN/GaN power transistor operating in the range of 650V/30A. In the following lines, the aged GaN HEMT will be noted DUTM. The evolution of the electrical parameters of the DUTM from the new state to the aged state is monitored using a pulsed I-V measurements at a pulse frequency of 100 Hz and a pulse width of 4 µs, which is short enough to ensure iso-thermal measurement of pulsed I-V GaN HEMT characteristics. Moreover, to separate trapping effects on measurements, pulsed I-V characteristics were performed at DC-bias levels VGS0 = 0 and VDS0 = 0. At this bias condition, trapping is expected to be negligible.
During aging, three DC characteristics were measured successively at the fresh state (t = 0), 216 h, and 720 h. The second characterizations are performed at 216 h, which is short enough
121
to ensure a regular aging monitoring in the infant stage [8]. The last characterization is performed after 504h before the second one so that the aging process is not interrupted and thus the degradations of the device can be detected.
Fig. 5.1 (a) shows the developed aging switching bench, which is described in [9]. The gate driver proposed in [10] has been used to drive the power GaN HEMTs. PWM1 and PWM2 are two complementary pulse width modulated signals. The proposed switching circuit enables to investigate the impact of hot electrons on GaN HEMTs with low energy consumption compared to that in [11] because no load is used. The used switching conditions presented in Table 5.1 have been chosen to ensure that the DUTM switches under its Safe Operating Area (SOA). As shown in Fig. 5.1 (b), the developed switching bench places similar stresses on the DUTM, which could exist in a large class of power management products such as power converters: on-state stress, semi-off state stress and off-state stress. In the on-state, DUTM is on, ID is equal to 10 A and VDS is equal to 1.14V. In the semi-off state, DUTM is turning-on, when both high current and high voltage exist simultaneously. In the off-state, DUTM is off, ID is null and VDS is equal to 200 V. The current rise time is equal to 3.94 µs and the voltage rise time is equal to 53.46 ns. To ensure that the aging of the DUTM respects the SOA, the measurements of the junction temperature TJ, ID current and VDS voltage are performed.
5.2.1. ID current and VDS voltage limitations
At the on-state, the ID current is equal to 10A. At the off-state, the VDS voltage is equal to 200 V. The choice of a high drain current (IDS = 10 A) and a high drain-source voltage (200 V) enables to study both the degradations caused by thermal dissipation and that caused by high electric field.
According to the SOA of the DUTM in [7], it can be seen that the used 10 A, 200 V pulse (see Table 5.1) is located beyond SOA boundary. This indicates that the pulse is placed within acceptable limits of ID and VDS given by the constructor. 5.2.2. Junction temperature limit
Under the switching conditions in Table 5.1, the temperature TJ is estimated using the thermal model of DUTM package mounted on a PCB and a heatsink described in [12]. By using the thermal Ohm’s law:
(5.1)totJ JA AT P T= +
Where ϴJA is the total thermal resistance from junction to ambient, which is equal to 3.63°C/W based on both manufacturer datasheets and SPICE model, TA is the ambient temperature fixed at 25°C by heatsink cooling, and Ptot is the experimental total power loss of DUTM over one period in watts, which is calculated by
0
1 (5.2)T
tot ds dsP i v dt
T=
Where, T is the period, ids and vds are the instantaneous drain current and drain-source voltage, respectively.
From experimental measurements (Fig. 5.1 (b)), Ptot is equal to 16.68 W, the corresponded TJ is calculated using (1) and is equal to 86 °C, which is below the allowable TJ limit of 150°C. Once the switching conditions are fixed, the effect of aging the GaN HEMT under switching safe operational conditions can be investigated.

122
Fig. 5.1. (a) Aging switching bench; (b) ID and VDS waveforms of DUTM over one period for switching conditions: 100 kHz, duty-cycle = 50 %, and 10 A / 200 V operating conditions.
Table 5.1: Applied switching conditions on DUTM.
VDS(OFF) IDS frequency tpulse duty-cycle
200 V 10 A 100 kHz 5µs 50%
5.3. Impact of aging on static characteristics
5.3.1. Static parameters degradation
The on-state resistance RDS(ON) is calculated in the linear region of the IDS-VDS characteristic, using (3).
1
( )6 , 0
(5.3)GS DS
DDS ON
DS V V V V
IR
V
−
= →
=
Fig. 5.2 (a) shows the evolution of RDS(ON) during 720 h of aging under the switching conditions described in Table 5.1. As can be seen, RDS(ON) increases by 15.00% after aging. According to [13], the observed increase of RDS(ON) is ascribed to trapping of hot electrons in the gate–drain access region during semi-off state. The trapping of electrons in the buffer due to the off-state bias may also induce the increase of RDS(ON). This may lead to the increase of power conduction losses and thus the device temperature elevation, resulting in reduced power GaN HEMTs efficiency and lower DC performances.
The transconductance gm is defined as the maximum first derivative of the input characteristic in the saturation region. Fig. 5.2 (a) shows the evolution of gm during 720 h of aging under the switching conditions presented in Table 5.1. The resulted gm after aging is reduced by 17.86% compared to its values before aging. The decrease in gm is mainly due to the presence of hot electrons caused by the semi-off state, when both channel current and high electric field are present in the device [14], which could generate defects typically highest at the end of the gate on the gate–drain side [15], resulting in reduced RF performances.
(a) (b)

123
The drain current ID is determined from the measured IDS-VDS static characteristic at VGS = 6V and VDS = 0.76V. Fig. 5.2 (b) shows the evolution of the current ID during 720 h of aging under the switching conditions described in Table 5.1. As can be noticed, ID decreases by 8.57 % after aging. This phenomenon is called current collapse, where ID is reduced due to hot electrons during switching [16]. The reduction in ID after aging can be observed in the ID-VGS static characteristic (Fig. 5.3 (a)). According to [17], the current collapse can be suppressed by hole injection from drain.
From Fig. 5.3 (b), the existence of trapped charge after aging in the gate-drain access region is experimentally demonstrated by pulsing from various quiescent voltages (VGSQ;VDSQ): (0;0), (-8V;100V) and (-8V;300V). The exposition to both a negative VGSQ and a high VDSQ fosters the trapping of electrons in the drain access region of the DUTM, while the reference condition is VGSQ=0V and VDSQ=0V. Measurements were carried out at 25 °C in the dark.
Fig. 5.2. Evolution of the static parameters during 720 h of aging: (a) RDS(ON) and gm; (b) IDS at VGS = 6 V and VDS = 0.76 V.
Fig. 5.3. (a) IDS-VGS characteristics measured at VDS equals to 1V and 7V; (b) IDS-VDS characteristics for various quiescent bias points at 25°C in the dark.
From Fig. 5.3 (a), a small shift of the threshold voltage VTH is observed. Before aging VTH
was equal to 1.81V this value rises to 1.89 V after aging, with an increase of 4.17%. The small shift of VTH voltage is also noticed in [18]. According to [19], the negative shift of VTH is due
(a) (b)

124
to the creation of defects under the gate caused by hot electrons during semi-off stress. In reference [20], the charge trapping at the p-GaN/AlGaN interface due to the bias-temperature instability (BTI) may also produce the shift of the VTH.
Moreover, a negligible increase in the gate current leakage is measured using Keithly 2636B SourceMeter, we found that IGSS was equal to 11.69 µA before aging and equals to 12.08 µA after aging. The slight increase in IGSS current is also confirmed in [21]. As presented in [22], the resulted degradation of IGSS current is attributed to the generation of defects/leakage paths in the p-type/AlGaN gate interface due to hot electrons.
Table 5.2 summarizes the values of RDS(ON), gm, ID, Vth and IGSS before and after 720 h of aging DUTM under the switching conditions presented in Table 5.1. The re-measurement of the static parameters after a long relaxation period shows no reversibility of the phenomena. The absolute relative degradation can be calculated by
( )(%) (5.4)ab
b
x xDegradation
x
−=
Where xa and xb are the DUTM parameter values after and before aging respectively.
Table 5.2: 720 hours aging results for DUTM.
RDS(ON) (mΩ) gm (S) IDS (A) Vth (V) Igss (µA)
t = 0 40.93 23.46 16.26 1.81 11.69
t = 720 h 47.07 19.27 14.86 1.89 12.08
Degradation (%) 15.00 17.86 8.57 4.17 3.16
5.3.2. Static characteristics aging modeling
The proposed drain current model of DUTM is a non-segmented, smooth and continuous equation inspired from the Motorola Electrothermal Model (MET) [23], the specific equation is shown as follows:
( )( )
log 1 exp , V 0 (5.5)1
GS DSGSDS DS
GS DS
m n V VV bI K
c P d e V V
+ −= +
+ +
Where K is the device forward transconductance parameter at 25 °C, P is the output conductance at 25 °C, b and c are related parameters of the transfer characteristic, while m, n, d and e are related parameters of the output characteristic. The different parameters are extracted using an accurate method based on the Levenberg-Marquardt algorithm, which is described in [24].
The extracted static model parameters at 25 °C for the fresh state (t =0) and the aged state (t = 720 h) are shown in Table 5.3. The modelled output and transfer characteristics of DUTM before and after 720 h of aging are shown in Fig. 5.4. As can be observed, the developed aged SPICE model shows good convergence compared to experiment. The fresh and aged models of the DUTM are implemented using LTspice simulator.

125
Table 5.3: Extracted Static Model Parameters at 25 °C for the Fresh State (t = 0) and Aged State (t = 720 h)
K P b c m n d e
t =0 2.24 0.58 1.69 0.16 6.39 -0.92 2.59 -0.44
t= 720h 0.76 0.39 1.74 0.12 11.63 -1.68 3.21 -0.55
Fig. 5.4. Experiment and model: (a) Output characteristics IDS-VDS; (b) transfer characteristics IDS-VGS before and after 720 h of aging.
5.4. Impact of aging on dynamic characteristics
To have a better understanding of the impact of aging on the dynamic behavior of the DUT, we have investigated the Capacitance-Voltage (C-V) characteristics of the p-GaN HEMT tested device as a function of the stress time. The aged C-V characteristics were modelled using a SPICE simulation tool and used to estimate the power switching losses before and after aging for a power switching application. The C-V measurements were performed using HP 4192A impedance analyzer at a frequency of 1 MHz. 5.4.1. Parasitic capacitances degradation
5.4.1.1. CGS-VGS characteristic
Fig. 5.5 (a) shows the evolutions of CGS-VGS characteristic before and after aging. No significant change is observed in the inversion region below the threshold voltage VTH < 1.7 V. Otherwise, a significant positive shift of the CGS-VGS characteristic is observed in the accumulation region. Also, a slight positive shift of the threshold voltage VTH can be observed. Fig. 5.5 (b) shows the evolution of the maximum CGS capacitance during aging. The CGS(Max)
resistance is increased by 6.72 % from the fresh state to the aged state.
Authors in [25] have modelled the Mg doped concentration in the p-GaN structure using Eq (7). Based on this model, the increase of the gate capacitance profiles during aging is due to the increase in doping concentration [26].
(b) (a)

126
( )2
2 (5.6)
1/N
d Cq
dV
=
Where ε is GaN dielectric constant, C is the measured capacitance, N is the doping concentration, q is the electron charge and V is the forward voltage used in the Cg-Vg measurement.
According to previous literature reports [27-28], we attribute this mechanism to the activation of the p-type dopant during aging, induced by the flow of a high density of carriers within the active region of the devices. To understand this interpretation, we have to consider that after the growth of a p-type layer, only part of the Magnesium acceptor atoms are electrically active, due to the fact that many Mg atoms are passivated by hydrogen, through the formation of Mg-H bonds, where the hydrogen is located at the nitrogen anti-bonding site [29-30]. To achieve a better activation of Mg, both high temperature annealing and low energy electron beam irradiation (LEEBI [31-32]) can be carried out. Even after these treatments, part of the Mg atoms can remain electrically inactive [33-34]. The increase of the gate capacitance can be responsible for efficiency loss [35].
During the off-state stress electrons can accumulate in traps, creating a virtual gate resulting in a threshold voltage shift. A leakage path can be formed at the edge of the Schottky contact, where the lateral component of the electric field is high. For very high negative voltages, additional trap states or defects near the Schottky contact can be created.
Fig. 5.5: (a) Evolution of CGS-VGS characteristic before and after aging; (b) Evolution of CGS(Max) during aging.
5.4.1.2. CGD-VGD characteristic
From Fig. 5.6 (a) the evolutions of CGD-VGD characteristic before and after aging is similar to those of CGS-VGS characteristic. The input capacitances CGS and CGD have not changed for a gate voltage below VTH. For VGS beyond VTH, CGS and CGD show significant increase. Fig. 5.6 (b) shows the evolution of the maximum CGD capacitance during aging. The CGD(Max)
resistance is increased by 6.32 % from the fresh state to the aged state.
(a) (b)

127
Similarly, to the variation in CGS capacitance, the degradation of the CGD capacitance during aging are attributed to the activation of the p-type dopant during aging [36-39]. The increase of the Mg dopant concentration in the p-GaN structure can be modelled using Eq (7). As a consequence of aging, the charge distribution in the active layer can be modified [40] due to the generation/propagation of defective states that can contribute to the degradation of the dynamic characteristics of the GaN HEMT [41]. Furthermore, A leakage path can be formed at the edge of the Schottky contact, where the lateral component of the electric field is high [42]. For high voltages additional trap states or defects near the Schottky contact can be created.
Fig. 5.6: (a) Evolution of CGD-VGD characteristic before and after aging; (b) Evolution of CGD(Max) during aging.
5.4.1.3. CDS-VDS characteristic
Fig. 5.7 (a) shows the evolution of the CDS-VDS characteristic during aging. Compared to the input capacitances CGS and CGD, an opposite evolution during aging of the output capacitance is observed. Fig. 5.7 (b) shows the evolution of the CDS capacitance at VDS = 10 V during aging. The CDS resistance is decreased by 0.90 % from the fresh state to the aged state.
This change in CDS capacitance after aging was attributed to the extension of the depletion region due to the effect of the traps in the 2-dimension electron gas (2DEG) channel below the gate [43].
The additional extending depletion region could be attributed to locally ionized acceptor-like traps under the gate following the application of a 200 V stress during the off-state. The ionized traps formed a negative potential to deplete 2DEG. Using TCAD simulation it is observed in [44] that electrons were trapped into the AlGaN layer underneath the gate edge at the drain side after the device endured high VDS off-state stress. The injected electrons in the AlGaN are trapped by acceptor-like traps. These trapped electrons caused the decrease of the 2DEG concentration [45-46]. Thus, the extension in the depletion region, which induce the decrease in CDS–VDS characteristics.
(a) (b)

128
Fig. 5.7: (a) Evolution of CGD-VGD characteristic before and after aging; (b) Evolution of CDS @ VDS = 10 V during aging.
5.4.2. Dynamic characteristics aging modeling
Using a C-V simulator, we have simulated the modelled CGS(VGS), CGD(VGD) and CDS(VDS) capacitances before and after aging. As shown in Fig. 5.8, the modelled capacitances fit with high convergence the measured experimental capacitances during aging. Eq. (16-17) of chapter II are used for fitting the C-V characteristics during aging. Table 5.4 shows the extracted values of the CGS, CGD and CDS model before and after 720 h of aging. The modeling of the dynamic behavior of the DUT during aging, enables to evaluate the impact of aging on the switching power losses of the GaN HEMT using a simulation approach.
Fig. 5.8: Experiment and model before and after 720 h of aging: (a) CGS-VGS characteristics; (b) CGD-VGD characteristics; (c) CDS-VDS characteristics.
(a) (b)
(a) (b) (c)

129
Table 5.4: Extracted values of CGS, CGD and CDS model before and after 720 h of aging.
Parameters 0GSC 1
GSC AGS VTH
2GSC
BGS VP
t = 0 229.79 pF 896.86 pF 2.79 pF/V 1.44 V 242.61 pF 0.54 pF/V 4.61V
t = 720 h 231.54 pF 941.32 pF 3.74 pF/V 1.28 V 280.22 pF 0.51 pF/V 4.36 V
Parameters 0GDC 1
GDC AGD
2GDC
BGD 0DSC
a b
t = 0 99.70 pF 886.26 pF 3.53 pF/V 228.48 pF 0.59 pF/V 435.61 pF -1.2E-3 2.06E-5
t = 720 h 100.27pF 937.41 pF 4.14 pF/V 275.68 pF 0.52 pF/V 433.74 pF -1.56E-3 1.04E-5
5.5. Impact of aging on S-parameters characteristics
The evaluation of the package parasitic elements during aging is of vital importance to power switching performances of GaN HEMT power converters that operate at high frequency. In this section, we have performed an experimental S-parameters characterization before and after 720 h. Based on the measured S-parameters, we have monitored during aging the GaN HEMT parasitic inductances, resistance and capacitance. This enables to evaluate the impact of aging the GaN HEMT parasitic elements on the power efficiency of power converters. The S parameter measurements were performed using Keysight E5080B vectoral network impedance analyzer at a frequency sweep between 100 kHz and 200 MHz by a step of 100 kHz.
5.5.1. S-parameters degradation
Fig. 5.9 shows the magnitude and the phase of the four S-parameters of the device, before and after 720 h of aging.
The degradation of S12 and S21 can be explained by the decrease of transconductance (gm) and the increase of gate to drain capacitance (CGD) [47,48]. The Miller capacitance CGD is composed of two parts, the p-GaN capacitance (Cp-GaN) and the drift region capacitance (CAlGaN) [49]. The interface state generation after stress are responsible of the degradation of both gm, GGD [50]. By simulating the temperature distribution of the GaN structure using TCAD physical simulator, it is demonstrated in [51] a local hot spot in the drift after aging. The electrons are accelerated to high velocities by this high electric field. They become highly energized and should be accelerated away from their normal directional flow. These highly energized electrons may create interface states by breaking AlGaN bonds [52] or be injected into generated surface traps (hot electron injection) at the p-GaN/AlGaN interface [53]. The trapped electrons reduce the electric charge density and therefore the total charge in the area affected by the trapped carriers. As results, the capacitance characteristics are shifted by the trapped charges.
The S12 and S21 phase were shifted to the left after aging. This shift means that the resonant frequency SRF of the test device has been changed due “hot-carrier stressing times” [54]. As a consequence, the parasitic elements have been changed during aging. This change in parasitic elements is confirmed in Table 5.5.

130
Fig. 5.9: Evolution of the S parameters during 720 h of aging: (a) S11 Magnitude, (b) S11 Phase, (c) S12 Magnitude, (d) S12 Phase, (e) S21 Magnitude, (f) S21 Phase, (g) S22 Magnitude, (h) S22 Phase.
(a) (b)
(c) (d)
(e) (f)
(g) (h)

131
The parasitic parameters of GaN transistor are increasingly sensitive to defects bound to the presence of charges in the p-GaN/AlGaN interface and at the drift region [55]. The hot carriers produce an additional interface trap density and trapped electron charge which results in a degradation of the parasitic elements of the device [56]. As shown in Table 5.5, the parasitic inductances Lg, Ls, Ld have been increased after aging. In [57] they have studied the impact of each parasitic inductance on the power efficiency of power GaN HEMTs. Based on this study, by eliminating the impact of Ld or Lg, the reduction of turn-on switching loss is negligible (around 1%). On the other hand, when the critical parasitic inductance like LS, is removed, the turn-on switching loss will reduce significantly (around 9%).
From Table 6, the extracted parasitic capacitances CGS, CGD and CDS using the S-parameters technics shows similar degradation to that extracted using the impedance meter in the previous section. The degradation of the GaN HEMT parasitic capacitances increases the switching power losses of the device [58]. During the turn-on transition, the energy stored in the CGD and CDS capacitances is discharged through the channel of the device, which generates switching loss [59].
As shown in Table 5.5, the parasitic resistances Rg, Rs, Rd have been increased after 750 h of aging. The increased parasitic resistances are caused by the degradation of the GaN HEMT ohmic contacts [60]. Losses in the parasitic resistances increase the conduction power losses and reduce the efficiency of power converters [61].
According to the literature [62, 63], the most probable cause of degradation for power GaN HEMT parasitic elements is attributed to hot electron-induced interface state generation and/or impact ionization.
Table 5.5: Extracted values of parasitic parameters before and after 720 h of aging.
Parameters Ls (nH) Lg (nH) Ld (nH) Cgs (pF) Cgd (pF) Cds (pF) Rg(mΩ) Rs(mΩ) Rd(mΩ) t = 0 1.66 1.98 4.49 238.24 67.20 439.69 367.25 110.39 159.94
t = 720 h 2.02 1.93 4.96 244.68 69.23 431.12 617.4 120.25 249.67
Degradation (%) 21.68↑ 2.52↑ 10.46↑ 2.70↑ 3.02↑ 1.94↓ 68.11↑ 8.93↑ 56.10↑
5.5.2. S-parameters aging modeling
Using an S-parameters simulator, we have implemented the extracted parasitic element during aging shown in Table 5.5 in the GaN HEMT small-signal equivalent circuit presented in chapter 3. The frequency response (S-parameters) of the aged device are simulated using Keysight Advanced Design System (ADS) high frequency circuit simulator. The modeling of the S-parameters of the DUT before and after aging, enables to evaluate the impact of aging on the RF performances of the GaN HEMT using a simulation approach. As shown in Fig. 5.10, the modelled S11 an S12 fit with high convergence the measured experimental S-parameters during aging.

132
Fig. 5.10: Experiment and model of S11 and S12 parameters: (a) Before aging; (b) after 720 h of aging.
5.6. Step stress tests
To summarize, in the previous section we have performed a constant aging campaign under fixed stress conditions, which respect the SOA zone of the device. Tests at constant stress conditions required long aging time to activate the failure mechanisms [64]. In this section, we have investigated the aging of the power GaN HEMT using step stress tests. This technique is of interest because it allows us to quickly obtain aging information in weeks, rather than months of intensive activities as normally required from constant stress tests [65]. This enables to reduce test time and to assure that failures occur quickly enough. By performing two kinds of aging technics (constant stress and step stress), this enables the possibility to compare the degradation generated by different aging technics.
In a switching mode power converter, the transistor is continuously switched from the off-state to the on-state and vice versa. During this operation, the DUT are subject to three types of stresses: on-state stress; semi-on stress and off-state stress. To understand the failure modes that can be generated in each state, we have performed three step stress aging campaigns:
• Frequency step stress; • On-state step stress; • Off-state step stress.
Each aging campaign lasts 1000 h. The aging time of 1000 h is used by the JEDEC standard [66]. The aging is monitored every 200 hours by performing I-V, C-V and low leakage current characterizations. The characterization step of 200 h is also used in [67]. The aging campaign is monitored at the following times: 0, 200 h, 400 h, 600 h, 800 h and 1000 h.
5.6.1. Frequency stress
There is an increasing market pressure to reduce the size of power converter circuits with high reliability [68]. In order to address these needs, it is necessary to increase the switching frequency of the power switching circuits.
(a) (b)

133
In this section, we have studied the effects of increasing the switching frequency on the degradation mechanism of the power GaN HEMTs.
The switching frequencies used during aging are: 100 kHz, 200 kHz, 300 kHz and 400 kHz. This frequency range is widely used in power converter applications [69]. The used frequency step stress bench is presented in Fig. 5.1 (a). The PWM1 signal and its complementary PWM2 are generated by programming the Arduino board to produce complementary PWM output signals at various frequency: 100 kHz, 200 kHz, 300 kHz and 400 kHz. The switching aging conditions are: VDS = 200 V, IDS = 10 A and Duty-cycle = 50 %.
During the frequency step stress, we have observed similar trend of degradations that were found in the constant stress. After 200 h switching at 400 kHz, RDSON is 9.55 % higher as compared to switching at 100 kHz. The increase in dynamic RDS(on) is thus stronger under constant switching conditions than for a step stress switching frequency.
In literature [70,71], it is known that the GaN HEMTs often suffer from an increased dynamic on-state resistance after switching from high-bias off-state. The phenomenon is based on trapping effects [72], and the electron trapping can be found at different places in the GaN transistor, at the 2DEG interface, in the AlGaN barrier layer or in the GaN buffer layer. This may result in increased conduction power losses of the device and an increase in temperature. Table 5.6 summarizes the most critical degradation processes that are induced in the frequency step stress along with the related failure modes, causes and their effects on the efficiency of GaN HEMT power converters.
5.6.2. On-state stress
In energy conversion applications, it is important to have a low IGSS gate leakage current to reduce on-state power losses. The purpose of performing an on-state step stress is to evaluate the degradation of the current IGSS as a function of stress time.
In the on-state stress, the drain is short circuited with the source VDS = 0 V and an increasing voltage is applied to the gate [73]. The voltages applied to the gate respect the SOA zone: 1.75 V, 3.5 V, 5.25 V and 7 V. Fig. 5.11 (a) shows the proposed the stress bench schematic for the on-state step stress. After every 200 h, the grid voltage is increased by a step of 1.75 V. During the aging stress I(V) and C(V) and low current characteristics are monitored at times: 0, 200 h, 400 h, 600 h, 800 h and 1000 h.
The investigation of the effect of high electric field on GaN HEMT is mandatory to distinguish experimentally between the degradations caused by self-heating mechanism at high current and low voltage, and those caused by high voltage switching conditions as well.

134
Fig. 5.11: (a) On-state stepp stress bench, (b) Off-state step stress bench [73].
The on-state stress makes it possible to extract the degradations that may exist on the gate of the component when a positive voltage is applied. The resulted degradations after aging were: increase of the gate leakage current IGSS; negative shift of the threshold voltage VTH. Fig. 5.12 shows the evolution of the IGSS current during on-state aging. The IGSS current is increased by 79.62 % from the fresh state to the aged state. As observed, a non-negligible increase in the gate current leakage is measured using Keithly 2636B SourceMeter, we found that IGSS was equal to 3.96 µA before aging and equals to 14.03 µA after aging. The resulted degradation of IGSS current is attributed to the generation of defects/leakage paths in the p-type/AlGaN gate interface due to hot electrons [74,75]. According to [76], this may also induce a negative shift of the threshold voltage VTH. Table 5.6 summarizes the most critical degradation processes that are induced in the on-state step stress along with the related failure modes, causes and their effects on the efficiency of GaN HEMT power converters.
Fig. 5.12: Evolution of IGSS current at VGS = 6 V during on-state stress.
5.6.3. Off-state stress
In GaN HEMT power converter applications, the GaN transistors must be continuously switched from the off-state under a high drain voltage to the on-state with a gate bias. The optimization of the GaN HEMTs allows:
(a) (b)

135
• Improved energy efficiency of GaN HEMT power converters by reducing power losses due to leakage currents.
• Get a wide range of voltage.
The off-state step stress enables to evaluate the degradations that may exist when the component is subjected to a high electric field. Fig. 5.11 (b) shows the off-state stress bench schematic.
In this type of stress, the gate is short circuited with the source VGS = 0 V and an increasing voltage is applied to the drain. After every 200h the drain voltage is increased by a step of 100 V. The voltages applied on the drain respect the SOA zone: 100 V, 200 V, 300 V and 400 V. During aging, pulsed I (V), C (V) and low current characteristics are monitored at times: 0, 200 h, 400 h, 600 h, 800 h and 1000 h.
IDSS is defined as the drain leakage current when the rated voltage is applied to the drain-source. Fig. 5.13 shows the evolution of the IDSS current during off-state aging. The IDSS current is increased by 95.60 % from the fresh state to the aged state.
Using Electroluminescence microscopic analysis in [79], it is observed a severe degradation located at the drain-side gate edge when applying high electric field in the drain side region. Off-state voltage stress induced the generation of source-drain current paths [80] and short circuits between gate and channel [81].
To explain this phenomenon, electrons in the channel are accelerated by the applied electric field (i.e., drain voltage), gaining sufficient energy to cross the AlGaN barrier and getting trapped below the gate (edge) and in the gate-to-drain region [82]. This effect results in increasing of drain leakage current and drain parasitic capacitance. Table 5.6 summarizes the most critical degradation processes that are induced in the off-state step stress along with the related failure modes, causes and their effects on the efficiency of GaN HEMT power converters.
Fig. 5.13: Evolution of IDSS current at VDS = 200 V during off-state stress.

136
Table 5.6: Failure mode and effects analysis (FMEA) of the GaN HEMT during 1000 h of step stress aging.
STRESS TYPE FAILURE MODE FAILURE CAUSE FAILURE EFFECT
Frequency step stress
- Increase in RDS(on) by 9.55%.
- Decrease in IDS(Max) by 15.45%.
- Increase in CGS(MAX) by 6.72%.
- Increase in CGD(MAX) by 6.32%.
- Decrease in CDS(Max) by 2.06%.
- Trapping of hot electrons under the gate and at the gate edge [83].
- Generation of lattice defects [84].
- Buffer trapping [85].
- Surface trapping [86].
- Elevation in the device temperature.
- Increase of the switching losses.
- High conduction power losses.
- RF performance degradation.
On-state step stress
- Increase in IGSS gate leakage current by 79.62%.
- Negative shift of the VTH voltage by 12.44%.
- Increase in CGS(MAX) by 3.81%.
- Increase in CGD(MAX) by 4.08%.
- No change in CDS capacitance.
- Generation of defects/leakage paths in the p-GaN/AlGaN gate stack [60].
- Trapping/detrapping of electrons in the gate area [61].
- Increase of the gate power losses.
- Normally-on behavior.
- Gate breakdown.
Off-state step stress
- Increase in IDSS drain leakage current by 95.60%.
- Increase in CGS(MAX) by 4.62%.
- Increase in CGD(MAX) 5.16%.
- Increase in CDS(Max) is increased by 95.60%.
- Generation of source-drain current paths [87].
- Short circuits between gate and channel [88].
- Elevation in the off-state power losses.
- Drain breakdown.
5.7. Effect of aging the GaN HEMT on the efficiency of power converters
Both the static and dynamic characteristics of the GaN HEMT have been modelled by measuring experimentally the I-V, C-V, S-parameters, drain and gate leakage currents characteristics of the DUT during 720 h of aging. As a result, we have built an accurate power losses model for the aging of the GaN HEMT based on experimental measurements, which include the major power losses in power switching applications: conduction power losses (PCond), switching power losses (PSW), Gate power losses (PGSS), Off-state power losses (PDSS). In this section, the effects of aging the GaN HEMT on power converters are studied by modeling the power losses before and after 720 h of aging.
Using the extracted power losses model of the GaN HEMT, we have estimated the impact of aging the GaN HEMT on the efficiency of a 200 V / 24 V DC-DC converter stage with GaN HEMT. Fig. 5.14 shows a wind energy application which produces an output voltage of 200 V.

137
This voltage is stepped down to 24 V using a buck DC-DC converter for electric vehicle charging stations.
Fig. 5.14: Wind energy application with a 200 V/ 24 V DC-DC converter stage for electric vehicle charging stations.
To remain the same switching conditions of the studied aging campaign, a 200 V converter application is used. Fig. 5.15 shows the used DC-DC converter, which is a 200 V / 24 V buck converter. The DUTM is the SPICE model of the aged GaN HEMT.
Fig. 5.15: DC-DC buck converter, with L = 170 mH, C = 850 µF and R = 20 Ω, at 100 kHz switching frequency, 200 V input voltage and 24 V output voltage.
The power losses in the inductor, capacitor and diode are given respectively by the following equations [89].
( )
22
2
(5.7)12
(5.8)12
1
LL out L
LC C
D D out
IP I R
IP R
P V I D
= +
=
= − (5.9)
Where Iout is the output current, LI is the inductor current ripple, which assumed equals to
30% of the maximum output current (A), D is the duty-cycle, RC is the equivalent series resistance of the capacitor, equals to 30 mΩ, RL is the equivalent series resistance of the inductor, equals to 0.2 mΩ, VD is the forward voltage of the diode, equals to 0.7 V.
DC-DC Converter
24 V 200 V

138
5.7.1. Conduction power losses aging effect
The purpose of this part is to model the aging of the DUTM in order to evaluate the effects
of aging the GaN HEMT under SOA on the power conduction losses of the DC-DC converters by a SPICE simulation approach. The conduction power losses PC is calculated by [90]:
0
1P =
(5.10)
onT
C ds dson t
con
i v dtT
dT
f
=
=
Where Ton is the conduction time, dc is the duty cycle and f is the frequency.
Figure 5.16 shows the measurement of PC at three output currents in the studied DC-DC buck converter. The effect of aging the GaN HEMT in the SOA during 720 h is that it produces an increase of PC losses after aging. The increase of PC is due to the increase of the DUTM on-state resistance after aging. Resulting in decreased power converter efficiency. From Table 5.7, an average increase of PC equals to 7.42 % is observed between the before aging state and the after aging state for various output currents: 10 A, 12 A and 14 A.
Fig. 5.16. Conduction power losses of DC-DC buck converter before and after 720 h of aging for different output current: 10 A, 12 A and 14 A.
Table 5.7: DC-DC buck converter conduction power losses, before and after 720 h of aging for output current: 10 A, 12 A and 14 A.
PC (W) 10 A 12 A 14 A
Before aging (t=0) 6.32 9.09 12.35
After aging (t=720h) 6.79 9.77 13.26
Degradation (%) 7.43 7.48 7.36

139
5.7.2. Switching power losses aging effect
In order to investigate the impact of aging the GaN HEMT on the switching power losses in a switching power application, we have implemented in SPICE simulator both the modelled static characteristic obtained in section 5.3 and parasitic capacitances of the GaN HEMT obtained in section 5.4 before and after 720 h of aging. The switching power losses PSW(on) is calculated by [91]:
( )
( )( ) 0
1 (19)SW onT
SW on ds dsSW on
P i v dtT
=
Where, PSW(on) is the turn-on power switching losses in (Watt) and TSW(on) is the turn-on switching time. Figure 5.17 shows the measurement of switching power losses (PSW) at three output currents in the studied DC-DC buck converter. From Fig. 5.17, the effect of aging the GaN HEMT in the SOA during 720 h is that it produces an increase of PSW losses after aging. The increase of PC is due to the degradations of the DUTM parasitic capacitances after aging. Resulting in decreased power conversion efficiency. The average increase of PSW is estimated to be equal to 7.42 % before aging state and the after aging state for various output currents: 10 A, 12 A and 14 A.
Fig. 5.17: Switching power losses of DC-DC buck converter before and after 720 h of aging for different output current: 10 A, 12 A and 14 A.
5.7.3. Gate leakage current losses aging effect
To accurately evaluate the impact of the on-state aging on the efficiency of GaN HEMT power converters, we have calculated the gate power losses caused by the gate leakage current before and after 720 h of aging. Fig. 5.18 shows the measurement of the gate power losses (PGSS) before and after 720 h of on-state aging. The effect of aging the GaN HEMT in the SOA during 720 h is that it produces an increase of gate losses after aging. This is due to the degradations generation of defects/leakage paths in the p-GaN/AlGaN gate stack [77] and the

140
trapping/detrapping of electrons in the gate area [78]. Resulting in decreased power conversion efficiency. The average increase of the gate power losses is estimated to be equals to 2.62 % before aging state and after the aging state.
Fig. 5.18: Estimated gate power losses before and after 720 h of on-state step stress aging.
5.7.4. Drain leakage current losses aging effect
To accurately evaluate the impact of the off-state aging on the efficiency of GaN HEMT power converters, we have calculated the off-state power losses caused by the drain leakage current before and after 720 h of aging. Fig. 5.19 shows the measurement of the off-state power losses before and after 720 h of off-state aging. The effect of aging the GaN HEMT in the SOA during 720 h is that it produces an increase of off-state power losses after aging. This is due to the degradations generation of source-drain current paths [80] and short circuits between gate and channel [81]. Resulting in decreased power converter efficiency. The average increase of the gate power losses is estimated to be equal to 21.83 % before and after the aging state
Fig. 5.19: Estimated gate power losses before and after 720 h of off-state step stress aging.
5.7.5. Efficiency aging impact
The following table summarizes the total losses and calculates the efficiency of a 200 V / 24 V DC-DC buck converter with GaN HEMT at 25 °C and 10 A.

141
Table 5.8: Total losses in DC-DC buck converter with GaN HEMT at 25°C, 10 A.
Power losses Before aging After aging
Pout 2000 W 2000 W
PL 20.05 mW 20.05 mW
PC 22.5 mW 22.5 mW
PD 1.05 W 1.05 W
PCond 6.32 W 6.79 W
PSW 73.37 W 80.79 W
PG 22.92 µW 83.08 µW
Poff 1.32 mW 30.14 mW
PGAN = PCond + PSW + PG + Poff 79.69 W 87.61 W
Plost 80.78 W 88.70 W
Pin = Plost + Pout 2080.78 W 2088.70 W
out
in
P
P =
96.11 % 95.75 %
The total power losses estimation before and after aging of the GaN HEMT 200 V / 24 V DC-DC buck converter for various output currents: 10 A, 12 A and 14 A are shown in Fig. 5.20.
The average increase in the total power losses after aging has been estimated to be equal to 8.26 %.
Fig. 5.20: GaN HEMT total power losses of DC-DC buck converter before and after 720 h of aging for various output current: 10 A, 12 A and 14 A.

142
5.8. Conclusion
This chapter investigates the reliability of power GaN HEMT under operational switching conditions, which could exist in a large class of power management products such as power converters. The switching conditions respect the safe operating area of the tested device given by the constructor, which provides a useful information about the degradation of GaN HEMT under use conditions. The proposed switching bench gives an efficient way with low power consumption to study the reliability of power GaN HEMT under switching conditions. The aging campaign lasted 720 h and it has resulted on a degradation of both the static and dynamic characteristics of the device which is attributed to the hot electron generated during the switching state. The major causes that affect the reliability of the GaN HEMT are hard switching, long time of test and high intensity of the stress. The existence of trapped charge in the gate-drain access region after aging is experimentally demonstrated by pulsing from various quiescent voltages. Moreover, we studied the effect of aging GaN HEMT on the efficiency of a DC-DC power converter by a simulation approach. It is found that the aged devices result in decreased performances of power converters.
5.9. References
[1] JEDEC standard, JESD22 (2016) [2] Meneghini, Matteo, and Enrico Zanoni. "Gallium Nitride-enabled High Frequency and High Efficiency Power Conversion." [3] Meneghini, Matteo, et al. "Reliability and failure analysis in power GaN-HEMTs: An overview." Reliability Physics Symposium (IRPS), 2017 IEEE International. IEEE, 2017. [4] Meneghesso, Gaudenzio, Matteo Meneghini, and Enrico Zanoni. "Reliability and instabilities in GaN-based HEMTs." Electron Devices and Solid-State Circuits (EDSSC), 2014 IEEE International Conference on. IEEE, 2014. [5] U. K. Mishra, L. Shen, T. E. Kazior, and Y.-F. Wu, “GaN-based RF power devices and amplifiers,” Proc. IEEE, vol. 96, no. 2, pp. 287–305, Feb. 2008. [6] Bahl, Sandeep R., Daniel Ruiz, and Dong Seup Lee. "Product-level reliability of GaN devices." Reliability
Physics Symposium (IRPS), 2016 IEEE International. IEEE, 2016. [7] GS66508P Datasheet, GaN Systems Inc. 2018 [8] Yang, Shaoyong, et al. "Condition monitoring for device reliability in power electronic converters: A review." IEEE Transactions on Power Electronics 25.11 (2010): 2734-2752. [9] Echeverri, A. Reliability study of power AlGaN/GaN HEMT transistors under operational condition, PHD Thesis, University of Rouen Normandie, Rouen, France, 2018. [10] Silicon laboratories Inc, Si823x Data sheet, 2018 [11] Hwang, Injun, et al. "Impact of channel hot electrons on current collapse in AlGaN/GaN HEMTs." IEEE Electron Device Letters 34.12 (2013): 1494-1496. [12] Bouchour, Al Mehdi, et al. “Modeling of power GaN HEMT for switching circuits applications using Levenberg-Marquardt Algorithm,” In : International Symposium on Advanced Electrical and Communication Technologies (ISAECT), 2018 International Conference on. IEEE, 2018. [13] Rossetto, I., et al. "Evidence of hot-electron effects during hard switching of AlGaN/GaN HEMTs." IEEE
transactions on electron devices 64.9 (2017): 3734-3739. [14] Meneghesso, Gaudenzio, et al. "Reliability of GaN high-electron-mobility transistors: State of the art and perspectives." IEEE Transactions on Device and Materials Reliability 8.2 (2008): 332-343. [15] Y. Puzyrev et al., “Gate bias dependence of defect-mediated hot carrier degradation in GaN HEMTs,” IEEE
Trans. Electron Devices, vol. 61, no. 5, pp. 1316–1320, May 2014. [16] Joh, Jungwoo, et al. "Current collapse in GaN heterojunction field effect transistors for high-voltage switching applications." Reliability Physics Symposium, 2014 IEEE International. IEEE, 2014.

143
[17] Tanaka, Kenichiro, et al. "Suppression of current collapse by hole injection from drain in a normally-off GaN-based hybrid-drain-embedded gate injection transistor." Applied Physics Letters 107.16 (2015): 163502. [18] Y. S. Puzyrev, T. Roy, M. Beck, B. R. Tuttle, R. D. Schrimpf, D. M. Fleetwood, and S. T. Pantelides, “Dehydrogenation of defects and hot electron degradation in GaN high-electron-mobility transistors,” J. Appl.
Phys., vol. 109, no. 3, pp. 0–8, 2011. [19] Y. S. Puzyrev, B. R. Tuttle, R. D. Schrimpf, D. M. Fleetwood, and S. T. Pantelides, “Theory of hot-carrier-induced phenomena in GaN high-electron-mobility transistors,” Appl. Phys. Lett., vol. 96, p. 053505, 2010. [20] Guo, Alex, and Jesús A. del Alamo. "Positive bias temperature instability (PBTI) of GaN MOSFETs." 2015 IEEE International Reliability Physics Symposium. IEEE, 2015. [21] Chou, Y. C., et al. "Degradation of AlGaN/GaN HEMTs under elevated temperature lifetesting." Microelectronics Reliability44.7 (2004): 1033-1038. [22] D. Marcon et al., “A comprehensive reliability investigation of the voltage-, temperature- and device geometry-dependence of the gate degradation on state-of-the-art GaN-on-Si HEMTs,” Tech. Dig. - Int. Electron Devices Meet. IEDM, pp. 472–475, 2010. [23] W. Curtice et al., “A New Dynamic Electro-Thermal Nonlinear Model for Silicon RF LDMOS FETs,” IEEE MTT-S International Microwave Symposium Digest, 1999, p. 419. [24] Jouha, Wadia, et al. "Silicon Carbide Power MOSFET Model: An Accurate Parameter Extraction Method Based on the Levenberg–Marquardt Algorithm." IEEE Transactions on Power Electronics 33.11 (2018): 9130-9133. [25] Meneghesso, G., Meneghini, M., Levada, S., Zanoni, E., Cavallini, A. D., Castaldini, A., ... & Zehnder, U. (2004, October). Study of short-term instabilities of InGaN/GaN light-emitting diodes by means of capacitance-voltage measurements and deep-level transient spectroscopy. In Fourth International Conference on Solid State Lighting (Vol. 5530, pp. 251-259). International Society for Optics and Photonics.
[26] Castaldini, A., Cavallini, A., Rigutti, L., Meneghini, M., Levada, S., Meneghesso, G., ... & Zehnder, U. (2005). Short term instabilities of InGaN GaN light emitting diodes by capacitance–voltage characteristics and junction spectroscopy. physica status solidi (c), 2(7), 2862-2865.
[27] De Santi, C., Meneghini, M., Carraro, S., Vaccari, S., Trivellin, N., Marconi, S., ... & Zanoni, E. (2013). Variations in junction capacitance and doping activation associated with electrical stress of InGaN/GaN laser diodes. Microelectronics Reliability, 53(9-11), 1534-1537.
[28] Rossi F, Pavesi M, Meneghini M, Salviati G, Manfredi M, Meneghesso G, et al. Influence of short-term low current dc aging on the electrical and optical properties of InGaN blue light-emitting diodes. J Appl Phys 2006;99(5):053104–7.
[29] Neugebauer J, Van de Walle CG. Hydrogen in GaN: novel aspects of a common impurity. Phys Rev Lett 1995;75(24):4452.
[30] Gotz W, Johnson NM, Bour DP, McCluskey MD, Haller EE. Local vibrational modes of the Mg–H acceptor complex in GaN. Appl Phys Lett 1996;69:3725.
[31] Amano H, Kito M, Hiramatsu K, Akasaki I. P-Type conduction in Mg-doped GaN treated with low-energy electron beam irradiation (LEEBI). Jpn J Appl Phys 1989;28:L2112–4.
[32] Li X, Coleman JI. Time-dependent study of low energy electron beam irradiation of Mg-doped GaN grown by metalorganic chemical vapor deposition. Appl Phys Lett 1996;69:1605.
[33] Castiglia A, Carlin J-F, Grandjean N. Role of stable and metastable Mg–H complexes in p-type GaN for cw blue laser diodes. Appl Phys Lett 2011;98:213505.
[34] Lin Y. Activation mechanism of annealed Mg-doped GaN in air. Appl Phys Lett 2004;84:15.
[35] Mizoguchi, T., Naka, T., Tanimoto, Y., Okada, Y., Saito, W., Miura-Mattausch, M., & Mattausch, H. J. (2016, June). Analysis of GaN-HEMTs switching characteristics for power applications with compact model including parasitic contributions. In 2016 28th International Symposium on Power Semiconductor Devices and ICs (ISPSD) (pp. 267-270). IEEE.
144
[36] Orita K, Meneghini M, Ohno H, Trivellin N, Ikedo N, Takigawa S, et al. analysis of diffusion-related gradual degradation of InGaN-based laser diodes. IEEE J Quant Electr 2012;48(9):1169–76.
[37] Tomiya S, Hino T, Goto S, Takeya M, Ikeda M. dislocation related issues in the degradation of GaN-based laser diodes. IEEE J Sel Top Quantum Electron 2004;10:1277.
[38] Meneghini M, de Santi C, Trivellin N, Orita K, Takigawa S, Tanaka T, et al. Investigation of the deep level involved in InGaN laser degradation by deep level transient spectroscopy. Appl Phys Lett 2011;99:093506.
[39] Liu L, Ling M, Yang J, Xiong W, Jia W, Wang G. Efficiency degradation behaviors of current/thermal co-stressed GaN-based blue light emitting diodes with vertical-structure. J Appl Phys 2012;111:093110.
[40] Meneghini, M., Trivellin, N., Trevisanello, L., Lunev, A., Yang, J., Bilenko, Y., ... & Meneghesso, G. (2008, April). Combined optical and electrical analysis of AlGaN-based deep-UV LEDs reliability. In 2008 IEEE International Reliability Physics Symposium (pp. 441-445). IEEE.
[41] F. Rossi, et al., “Influence of short-term low-current dcaging on the electrical and optical properties of InGaN blue Light-Emitting Diodes”, J. Appl. Phys., vol. 99, pp. 053104-1-7, 2006.
[42] Florovič, M., Kováč, J., Benko, P., Chvála, A., Škriniarová, J., & Kordó, P. (2014). Electrical properties of recessed AlGaN/GaN Schottky diodes under off–state stress. Journal of Electrical Engineering, 65(5), 313-316.
[43] Liao, W. C., Chyi, J. I., & Hsin, Y. M. (2015). Trap-profile extraction using high-voltage capacitance–voltage measurement in AlGaN/GaN heterostructure field-effect transistors with field plates. IEEE Transactions on Electron Devices, 62(3), 835-839.
[44] Liao, W. C., Chen, Y. L., Chen, C. H., Chyi, J. I., & Hsin, Y. M. (2014). The behavior of off-state stress-induced electrons trapped at the buffer layer in AlGaN/GaN heterostructure field effect transistors. Applied Physics Letters, 104(3), 033503.
[45] Miczek, M., Mizue, C., Hashizume, T., & Adamowicz, B. (2008). Effects of interface states and temperature on the C-V behavior of metal/insulator/AlGaN/GaN heterostructure capacitors. Journal of Applied Physics, 103(10), 104510.
[46] Mizue, C., Hori, Y., Miczek, M., & Hashizume, T. (2011). Capacitance–voltage characteristics of Al2O3/AlGaN/GaN structures and state density distribution at Al2O3/AlGaN interface. Japanese Journal of Applied Physics, 50(2R), 021001.
[47] Grupen, M. (2016). GaN high electron mobility transistor simulations with full wave and hot electron effects. IEEE Transactions on Electron Devices, 63(8), 3096-3102.
[48] Yuk, K., Branner, G. R., & McQuate, D. (2009, June). An improved empirical large-signal model for high-power GaN HEMTs including self-heating and charge-trapping effects. In 2009 IEEE MTT-S International Microwave Symposium Digest (pp. 753-756). IEEE.
[49] Jiann-Shiun Yuan, L. Jiang, Evaluation of hot-electron effect on LDMOS device and circuit performances, IEEE Trans. Electron Devices (2008) 1519–1523.
[50] J.P. Walko, et al., RF S-parameter degradation under hot carrier stress, Proc. IEEE Int. Reliability Physics Symp, 2004.
[51] Belaïd, M. A. (2018). Performance analysis of S-parameter in N-MOSFET devices after thermal accelerated tests. Microelectronics Reliability, 91, 8-14.
[52] Daniel García, et al., Impact of Hot Carrier Degradation on MOSFET Small-Signal Input, Output, and Transmission Features, IEEE Conf. Devices, Circuits and Systems, (2014), pp. 1–5.
[53] Zhou, L., San, Z. W., Hua, Y. J., Lin, L., Zhang, S., Zhao, Z. G., ... & Yin, W. Y. (2016). Investigation on failure mechanisms of GaN HEMT caused by high-power microwave (HPM) pulses. IEEE Transactions on Electromagnetic Compatibility, 59(3), 902-909.

145
[54] Kwan, W. S., & Deen, M. J. (1998). Hot-carrier effects on the scattering parameters of lightly doped drain n-type metal–oxide–semiconductor field effect transistors. Journal of Vacuum Science & Technology B: Microelectronics and Nanometer Structures Processing, Measurement, and Phenomena, 16(2), 628-632.
[55] Ruzzarin, M., Meneghini, M., Barbato, A., Padovan, V., Haeberlen, O., Silvestri, M., ... & Zanoni, E. (2018). Degradation mechanisms of GaN HEMTs with p-type gate under forward gate bias overstress. IEEE Transactions on Electron Devices, 65(7), 2778-2783.
[56] Kim, H., Vertiatchikh, A., Thompson, R. M., Tilak, V., Prunty, T. R., Shealy, J. R., & Eastman, L. F. (2003). Hot electron induced degradation of undoped AlGaN/GaN HFETs. Microelectronics Reliability, 43(6), 823-827.
[57] Liu, Z., Huang, X., Lee, F. C., & Li, Q. (2013). Package parasitic inductance extraction and simulation model development for the high-voltage cascode GaN HEMT. IEEE Transactions on Power Electronics, 29(4), 1977-1985.
[58] Hou, Ruoyu, Juncheng Lu, and Di Chen. "Parasitic capacitance Eqoss loss mechanism, calculation, and measurement in hard-switching for GaN HEMTs." 2018 IEEE Applied Power Electronics Conference and Exposition (APEC). IEEE, 2018.
[59] M. Okamoto, G. Toyoda, E.Hiraki, T. Tanaka, T.Hashizume, and T. Kachi, “Loss evaluation of an AC-AC direct converter with a new GaN HEMT SPICE model,” in Proc. IEEE Energy Convers. Congr. Expo., 2012, pp. 1795–1800.
[60] Wu, Y. F., Keller, B. P., Keller, S., Kapolnek, D., Kozodoy, P., Denbaars, S. P., & Mishra, U. K. (1997). High power AlGaN/GaN HEMTs for microwave applications. Solid-State Electronics, 41(10), 1569-1574.
[61] Kuroda, Kenta, Ryo Ishikawa, and Kazuhiko Honjo. "High-efficiency GaN-HEMT class-F amplifier operating at 5.7 GHz." 2008 38th European Microwave Conference. IEEE, 2008.
[62] Sozza, A., Dua, C., Morvan, E., Delage, S., Rampazzo, F., Tazzoli, A., ... & Malbert, N. (2005, December). Evidence of traps creation in GaN/AlGaN/GaN HEMTs after a 3000 hour on-state and off-state hot-electron stress. In IEEE InternationalElectron Devices Meeting, 2005. IEDM Technical Digest. (pp. 4-pp). IEEE.
[63] Bisi, D., Chini, A., Soci, F., Stocco, A., Meneghini, M., Pantellini, A., ... & Tordjman, M. (2015). Hot-electron degradation of AlGaN/GaN high-electron mobility transistors during RF operation: Correlation with GaN buffer design. IEEE Electron Device Letters, 36(10), 1011-1014.
[64] Nelson, Wayne. "Accelerated life testing-step-stress models and data analyses." IEEE transactions on reliability 29.2 (1980): 103-108.
[65] Gao, Frank, and Peter Ersland. "Step-stress accelerated testing in ion implanted GaAs self-aligned gate MESFETs." 1999 GaAs Reliability Workshop. Proceedings (Cat. No. 00TH8459). IEEE, 1999.
[66] JEDEC standard, JESD22
[67] Marcon, Denis, et al. "Reliability of AlGaN/GaN HEMTs: Permanent leakage current increase and output current drop." Proceedings of the 20th IEEE International Symposium on the Physical and Failure Analysis of Integrated Circuits (IPFA). IEEE, 2013.
[68] Mitova, R., Ghosh, R., Mhaskar, U., Klikic, D., Wang, M. X., & Dentella, A. (2013). Investigations of 600-V GaN HEMT and GaN diode for power converter applications. IEEE transactions on power electronics, 29(5), 2441-2452.
[69] Cai, Yichen, Andrew J. Forsyth, and Rebecca Todd. "Impact of GaN HEMT dynamic on-state resistance on converter performance." 2017 IEEE Applied Power Electronics Conference and Exposition (APEC). IEEE, 2017.
[70] D. Jin and J. A. del Alamo, “Methodology for the Study of Dynamic ON-Resistance in High-Voltage GaN Field-Effect Transistors”, IEEE TRANSACTIONS ON ELECTRON DEVICES, VOL. 60, NO. 10, OCTOBER 2013.

146
[71] O. Hilt, P. Kotara, F. Brunner, A. Knauer, R. Zhytnytska, and J. Würfl, "Improved Vertical Isolation for Normally-off High Voltage GaNHFETs on n-SiC Substrates", IEEE Transactions on Electron Devices, vol. 60, no. 10, pp. 3084-3090, 2013.
[72] G. Meneghesso, M. Meneghini, D. Bisi, R. Silvestri, A. Zanandrea, O. Hilt, E. Bahat-Treidel, F. Brunner, A. Knauer, J. Wuerfl, E. Zanoni, „GaN-based power HEMTs: Parasitic, Reliability and high field issues”, ECS Transactions, 58 (4) 187-198 (2013)
[73] Chang, Chih-Yang, et al. "Electric-field-driven degradation in off-state step-stressed AlGaN/GaN high-electron mobility transistors." IEEE Transactions on Device and Materials reliability 11.1 (2011): 187-193.
[74] Rossetto, Isabella, et al. "Time-dependent failure of GaN-on-Si power HEMTs with p-GaN gate." IEEE Transactions on Electron Devices 63.6 (2016): 2334-2339.
[75] Wu, Tian-Li, et al. "Comprehensive investigation of on-state stress on D-mode AlGaN/GaN MIS-HEMTs." 2013 IEEE International Reliability Physics Symposium (IRPS). IEEE, 2013.
[76] Douglas, E. A., et al. "AlGaN/GaN high electron mobility transistor degradation under on-and off-state stress." Microelectronics Reliability 51.2 (2011): 207-211
[77] X. Li, G. Xie, C. Tang, and K. Sheng, “Charge trapping related channel modulation instability in P-GaN gate HEMTs,” Microelectron. Reliab., vol. 65, pp. 35–40, 2016.
[78] C. Fleury, R. Zhytnytska, S. Bychikhin, M. Cappriotti, O. Hilt, D. Visalli, G. Meneghesso, E. Zanoni, J. Würfl, J. Derluyn, G. Strasser, and D. Pogany, “Statistics and localisation of vertical breakdown in AlGaN/GaN HEMTs on SiC and Si substrates for power applications,”
[79] Meneghini, M., et al. (2017, April). Reliability and failure analysis in power GaN-HEMTs: An overview. In 2017 IEEE International Reliability Physics Symposium (IRPS) (pp. 3B-2). IEEE.
[80] S. R. Bahl, M. Van Hove, X. Kang, D. Marcon, M. Zahid, and S. Decoutere, “New source-side breakdown mechanism in AlGaN/GaN insulated-gate HEMTs,” Proc. Int. Symp. Power Semicond. Devices ICs, no. 408, pp. 419–422, 2013.
[81] M. Meneghini, I. Rossetto, F. Hurkx, J. Šonský, J. A. Croon, G. Meneghesso, and E. Zanoni, “Extensive Investigation of Time-Dependent Breakdown of GaN-HEMTs Submitted to OFF -State Stress,” IEEE Trans. Electron Devices, vol. 62, no. 8, pp. 2549– 2554, 2015.
[82] Wu, T. L., Marcon, D., Zahid, M. B., Van Hove, M., Decoutere, S., & Groeseneken, G. (2013, April). Comprehensive investigation of on-state stress on D-mode AlGaN/GaN MIS-HEMTs. In 2013 IEEE International Reliability Physics Symposium (IRPS) (pp. 3C-5). IEEE.
[83] M. Ruzzarin, M. Meneghini, I. Rossetto, M. Van Hove, S. Stoffels, T. Wu, S. Decoutere, G. Meneghesso, and E. Zanoni, “Evidence of Hot-Electron Degradation in GaN- Based MIS-HEMTs Submitted to High Temperature Constant Source Current Stress,” IEEE Electron Device Lett., vol. 37, no. 11, pp. 1415–1417, 2016.
[84] Y. S. Puzyrev, B. R. Tuttle, R. D. Schrimpf, D. M. Fleetwood, and S. T. Pantelides, “Theory of hot-carrier-induced phenomena in GaN high-electron-mobility transistors,” Appl. Phys. Lett., vol. 96, p. 053505, 2010.
[85] P. Moens, A. Banerjee, M. J. Uren, M. Meneghini, S. Karboyan, I. Chatterjee, P. Vanmeerbeek, M. Cäsar, C. Liu, A. Salih, E. Zanoni, G. Meneghesso, M. Kuball, and M. Tack, “Impact of buffer leakage on intrinsic reliability of 650V AlGaN / GaN HEMTs,” IEEE Electron Devices Meet., pp. 903–906, 2015.
[86] G. Meneghesso, M. Meneghini, D. Bisi, I. Rossetto, A. Cester, U. K. Mishra, and E. Zanoni, “Trapping phenomena in AlGaN / GaN HEMTs: a study based on pulsed and transient measurements,” Semicond. Sci. Technol., vol. 074021, 2013.
[87] M. Meneghini, S. Member, G. Cibin, M. Bertin, A. G. M. Hurkx, P. Ivo, J. Šonský, J. A. Croon, G. Meneghesso, and E. Zanoni, “OFF -State Degradation of AlGaN / GaN Power HEMTs: Experimental Demonstration of time-dependent drain-source breakdown,” IEEE Trans. Electron Devices, vol. 61, no. 6, pp. 1987–1992, 2014.

147
[88] M. Meneghini, I. Rossetto, F. Hurkx, J. Šonský, J. A. Croon, G. Meneghesso, and E. Zanoni, “Extensive Investigation of Time-Dependent Breakdown of GaN-HEMTs Submitted to OFF -State Stress,” IEEE Trans. Electron Devices, vol. 62, no. 8, pp. 2549–2554, 2015.
[89] Texas Instrument. Understanding Buck power stage in switchmode power supply. 1999.
[90] Shenai, K., & Shah, K. (2011, May). Smart DC micro-grid for efficient utilization of distributed renewable energy. In IEEE 2011 EnergyTech (pp. 1-6). IEEE.
[91] Huang, X., Li, Q., Liu, Z., & Lee, F. C. (2013). Analytical loss model of high voltage GaN HEMT in cascode configuration. IEEE Transactions on Power Electronics, 29(5), 2208-2219.

148
Chapter 6: Summary, conclusions and future work
6.1 Summary
This work explores the impact of aging the GaN HEMTs under operational switching conditions on the efficiency of DC-DC power converters.
As reported in chapter 1, the GaN HEMTs combine in one technology high voltage capability, large current and both high operational frequency and temperature. These features make the GaN HEMT highly suitable for power switching applications.
The state of the art of the GaN HEMT power transistors has been presented in Chapter 2. As reported in this chapter, the GaN HEMT devices satisfy the requirements of the power converter market for a high operating voltage, high operating current, high power density, high switching frequency, and strong reliability, which makes the GaN technology an attractive candidate for replacing Si devices in power applications. The physical properties of the GaN semiconductor enables both high-speed and high-voltage performances. The p-GaN HEMT normally-off structure is finding wide consensus within the scientific and industrial communities. For that, we have investigated the main issues related to the aging of these devices. Finally, the SPICE modeling approach enables the estimation of the GaN HEMT power losses with high accuracy.
In chapter 3, an experimental method is used to estimate the power losses of the GaN HEMTs in switching applications. The proposed approach is based on experimental I-V pulsed, C-V and low current characterizations. As a result of this study, both the static and dynamic power losses of the GaN HEMT are estimated. The impact of the conduction power losses, switching power losses and gate power losses on the efficiency of power converters are modelled using SPICE simulation approach. The accuracy and good convergence of simulation to experimental measurements provide a good way to design power converters with GaN HEMTs. Moreover, this approach offers to the power converter designers the possibility to estimate the power losses of GaN HEMT with high accuracy without the use of complex switching bench, which reduces both the time to market and cost.
In chapter 4, an accurate methodology based on an accurate S-parameters calibration procedure has been proposed to determine parasitic resistances, inductances, and capacitances of a packaged GaN power transistor. The obtained results show the possibility to extract very low device parasitic inductances which may influence switching mechanisms in power converters. Good agreement has been found between extracted values and technical data provided in the literature. Moreover, modeling equations are proposed for the nonlinear model parameters. The proposed method has the capability to be applied to any packaged GaN power transistor fabricated by different manufacturers. Furthermore, the method offers the possibility to extend the characterization to devices that have two terminals, such as: commercial inductances, capacitances and resistances.
Chapter 5 has investigated the reliability of GaN HEMT power transistor under operational switching conditions, which could exist in a large class of power management products such as power converters. The switching conditions respect the safe operating area of the tested device given by the constructor, which provide a useful information about the degradation of GaN HEMT transistor under use conditions. The proposed switching bench gives an efficient way to

149
study the reliability of power GaN HEMT under switching conditions. The aging campaign lasted 720 h and it has resulted on a degradation of both the static and dynamic characteristics of the device which is attributed to the hot electron generated during the switching state. The major causes that affect the reliability of the GaN HEMT are hard switching, long time of test and high intensity of the stress. The existence of trapped charge in the gate-drain access region after aging is experimentally demonstrated by pulsing from various quiescent voltages. Moreover, we studied the effect of aging GaN HEMT on the efficiency of a DC-DC power converter by a simulation approach. It is found that the aged devices result in decreased performances of power converters.
6.2 Conclusion
This work investigates the reliability of the GaN HEMT power transistor under operational switching conditions, which could exist in a large class of power converter applications. The switching conditions respect the safe operating area of the tested device given by the constructor, which provide a useful information about the degradation of GaN HEMT under safe optional conditions. The proposed switching bench gives an efficient way with low power consumption to study the reliability of power GaN HEMT under switching conditions. The aging campaigns lasted 1000 h and it has resulted on a degradation of the static parameters RDS(ON), gm, ID, VTH and IGSS which is attributed to the hot electron generated during the switching state. The existence of trapped charge in the gate-drain access region after aging is experimentally demonstrated by pulsing from various quiescent voltages. Additionally, we have monitored the evolution of the package parasitic elements during the aging of the GaN HEMT using the S-parameters method. The measurement of the S-parameters before and after aging shows the degradation of S12 and S21, which can be explained by the decrease of transconductance (gm) and the increase of the gate to drain parasitic capacitance (CGD). The change in the CGD capacitance due to the trapped charges was confirmed by applying C-V measurement on the aged DUT. Using the proposed methodology in chapter 5 for the estimation of the GaN HEMT both static and dynamic power losses, we have studied the effect of aging GaN HEMT on the efficiency of a DC-DC power converter by a SPICE simulation approach.
6.3 Thesis contribution
The major contributions of this thesis are presented as follows:
• The developed methodology for estimating both the dynamic and static power losses of the GaN HEMT in power converter applications is accurate and based on experimental characterizations.
• The accuracy and consistent convergence of the developed SPICE model provide a good way to investigate the reliability of GaN HEMTs by a simulation approach.
• The developed experimental bench for S-parameters characterization enables the extraction of the parasitic elements of power devices automatically and at multi-bias.
• The extraction methodology of the intrinsic and extrinsic elements can be applied to a large class of power devices.
• Most existing studies investigate the reliability of the GaN HEMT at static conditions. This works investigates the aging of a 650V, 30A GaN HEMT power transistor under operational switching conditions of DC-DC power converters.

150
• The proposed aging bench enables to investigate the impact of aging the GaN HEMTs for both at high current and voltage and with low energy consumption.
• The presented modeling methodology of aging the GaN HEMT is generic and can be applied to other aging campaign for other components of various voltage ranges.
• The monitoring of the S parameters characteristic during aging enables to evaluate the impact of aging stress on the DUT packages.
• We have extended our investigation of the aging of GaN HEMT not only in static characteristics but also in the dynamic aspect.
6.4 Future work
As prospects for this study, the accuracy of the developed SPICE model can be improved by modelling of trapping effects and by modelling of dynamic characteristics in order to take into consideration the switching losses and the trapping effects when designing power converters using GaN HEMTs. Also, it is interesting to perform additional switching campaigns at various switching frequencies to study the effect of hard switching on GaN HEMT power converters. Moreover, the accuracy of the estimate efficiency can be completed by designing a DC-DC converter to calculate experimentally the impact of aging the GaN HEMT on the efficiency of power switching circuits using an experimental approach and compare it to the estimate efficiency using the SPICE approach.

151
List of publications and communications
Journal articles:
• Al Mehdi Bouchour, Ahmed El Oualkadi, Olivier Latry, Pascal Dherbecourt, Andres Echeverri. Estimation of losses of GaN HEMT in power switching applications based on experimental characterization. Computers & Electrical Engineering, 84, 106622. (2020)
• Al Mehdi Bouchour, Ahmed El Oualkadi, Pascal Dherbecourt, Olivier Latry, Andres Echeverri. Investigation of the aging of power GaN HEMT under operational switching conditions, impact on the power converters efficiency. Microelectronics Reliability, 100, 113403. (2019)
Peer reviewed international conferences:
• Al Mehdi Bouchour, Pascal Dherbecourt, Ahmed El Oualkadi, Olivier Latry. Parasitic Elements Extraction of the GaN HEMT Packaged Power Transistors based on S-parameter measurements. In 2020 International Symposium on Advanced Electrical and Communication Technologies (ISAECT) (pp. 1-6). IEEE. (2020).
• Al Mehdi Bouchour, Pascal Dherbecourt, Olivier Latry, Ahmed El Oualkadi. Temperature Effects of GaN HEMTs on the Design of Power Converters. In Third International Conference on Computing and Wireless Communication Systems, ICCWCS 2019. European Alliance for Innovation (EAI). (2019).
• Al Mehdi Bouchour, Ahmed El Oualkadi, Pascal Dherbecourt, Olivier Latry, Andres Echeverri. Investigation of the aging of power GaN HEMT under operational switching conditions, impact on the power converters efficiency. Poster presentation in the 30th European Symposium on Reliability of Electron Devices, Failure Physics and Analysis, ESREF 2019, in Toulouse (France) from September 23th to September 26th, (2019)
• Pascal Dherbecourt, Ahmed El Oualkadi, Eric Joubert, Al Mehdi Bouchour, Wadia Jouha, Mohamed Masmoudi, Olivier Latry. New Technologies of Power Transistors for Efficiency Increase of Power Converters: The Reliability Consideration. In ICCWCS 2019: Third International Conference on Computing and Wireless Communication Systems, ICCWCS 2019, April 24-25, 2019, Faculty of Sciences, Ibn Tofaïl University-Kénitra-Morocco (p. 131). European Alliance for Innovation. (2019).
• Al Mehdi Bouchour, Andres Echeverri, Olivier Latry, Pascal Dherbecourt, Ahmed El Oualkadi. Modeling of power GaN HEMT for switching circuits applications using Levenberg-Marquardt Algorithm. In 2018 International Symposium on Advanced Electrical and Communication Technologies (ISAECT) (pp. 1-6). IEEE. 2018.
National communications:
• Al Mehdi Bouchour, Pascal Dherbecourt, Olivier Latry, Ahmed El Oualkadi, « Impact de la température et du vieillissement en conditions opérationnelles de fonctionnement sur les

152
transistors GaN HEMTs de puissance », Oral presentation in the « JDD’19 », UFR Sciences et Techniques, Saint Etienne du Rouvray (France), (2019).
• Al Mehdi Bouchour, Ahmed El Oualkadi, Pascal Dherbecourt, Olivier Latry « Etude et modélisation du comportement du GaN HEMT de puissance soumis à des contraintes thermiques et électriques », Poster in the « Ecole Thématique CNRS2019 », Fiabilité et Sûreté de Fonctionnement, FiabSurf 2019: Jun 17-21th, Saint-Pierre d’Oléron –France, 2019.