Embed Size (px)
Citation preview
Impact of Base Station Antenna
Azimuth Beamwidth on the
Performance of 3-Sector Site LTE
Deployments
Minya Gavrilovic
November 6th, 2014
COMMUNICATION
COMPONENTS INCExtending Wireless Coverage
Page 2
Why Sectorize RF Networks?
3 x omni antennas per site
• Site covers a single sector
• 1 × Tx antenna
• 2 × Rx antennas
• Rx antenna separation 12-20
3 x directional antennas per site
• 3 × Tx/Rx antennas – one per
sector
Capacity!
COMMUNICATION
COMPONENTS INCExtending Wireless Coverage
Page 3
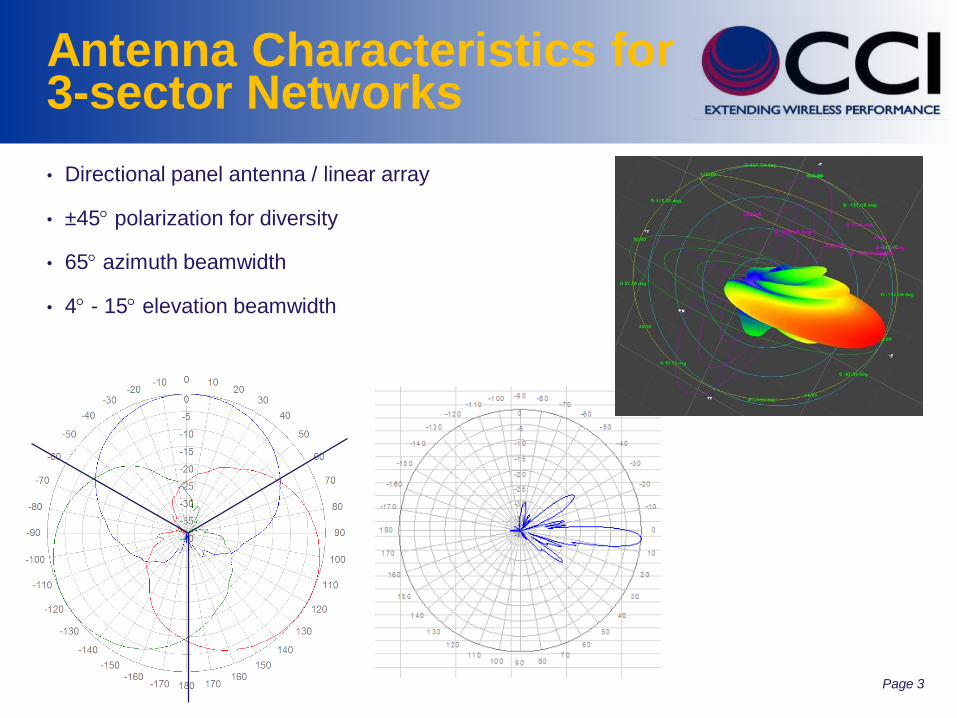
• Directional panel antenna / linear array
• ±45 polarization for diversity
• 65 azimuth beamwidth
• 4 - 15 elevation beamwidth
Antenna Characteristics for 3-sector Networks
COMMUNICATION
COMPONENTS INCExtending Wireless Coverage
Page 4
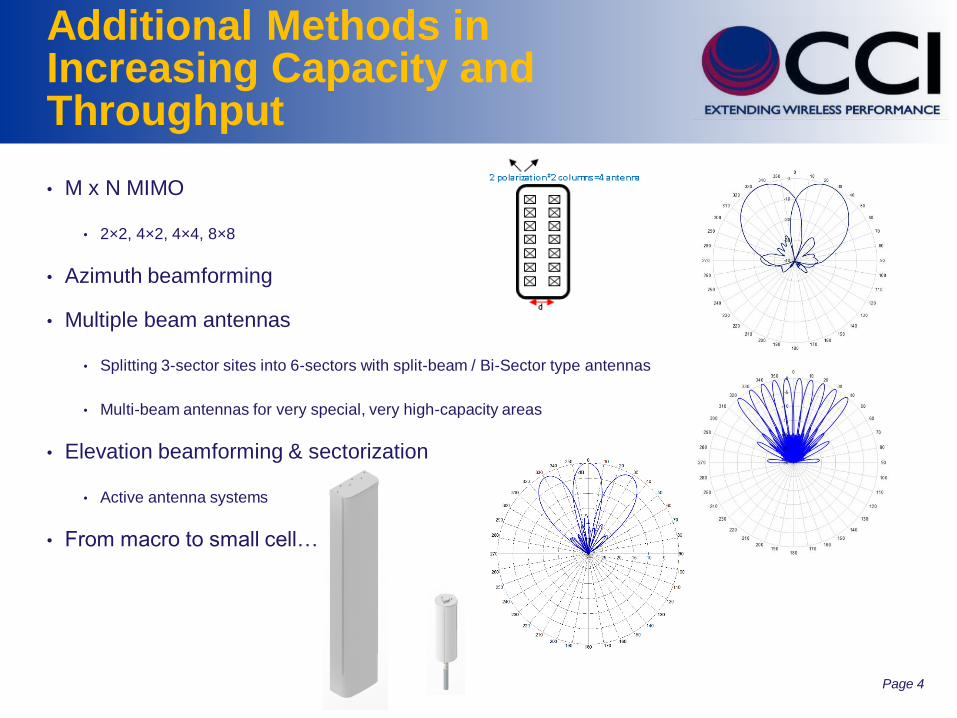
• M x N MIMO
• 2×2, 4×2, 4×4, 8×8
• Azimuth beamforming
• Multiple beam antennas
• Splitting 3-sector sites into 6-sectors with split-beam / Bi-Sector type antennas
• Multi-beam antennas for very special, very high-capacity areas
• Elevation beamforming & sectorization
• Active antenna systems
• From macro to small cell…
Additional Methods in Increasing Capacity and Throughput
COMMUNICATION
COMPONENTS INCExtending Wireless Coverage
Page 5
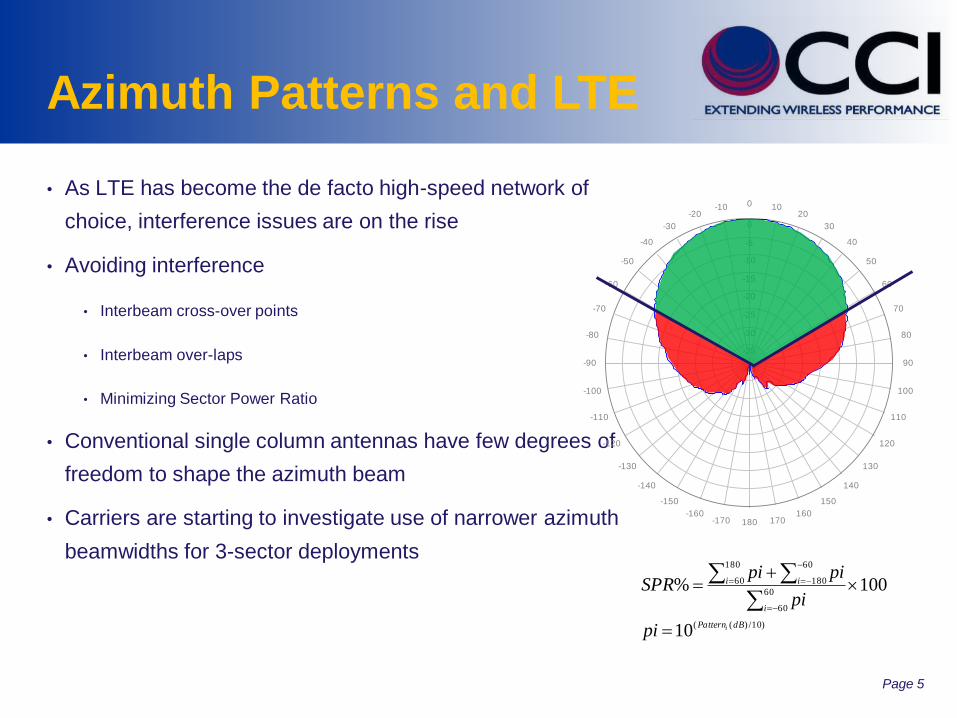
• As LTE has become the de facto high-speed network of
choice, interference issues are on the rise
• Avoiding interference
• Interbeam cross-over points
• Interbeam over-laps
• Minimizing Sector Power Ratio
• Conventional single column antennas have few degrees of
freedom to shape the azimuth beam
• Carriers are starting to investigate use of narrower azimuth
beamwidths for 3-sector deployments
Azimuth Patterns and LTE
0 1020
30
40
50
60
70
80
90
100
110
120
130
140
150
160170180-170
-160
-150
-140
-130
-120
-110
-100
-90
-80
-70
-60
-50
-40
-30
-20-10
-40
-35
-30
-25
-20
-15
-10
-5
0
0
10
20
30
40
50
60
708090100
110
120
130
140
150
160
170
180
-170
-160
-150
-140
-130
-120
-110-100 -90 -80
-70
-60
-50
-40
-30
-20
-10
-40
-35
-30
-25
-20
-15
-10
-5
0
)10/)((
60
60
180
60
60
180
10
100%
dBPattern
i
i i
ipi
pi
pipiSPR
COMMUNICATION
COMPONENTS INCExtending Wireless Coverage
Page 6
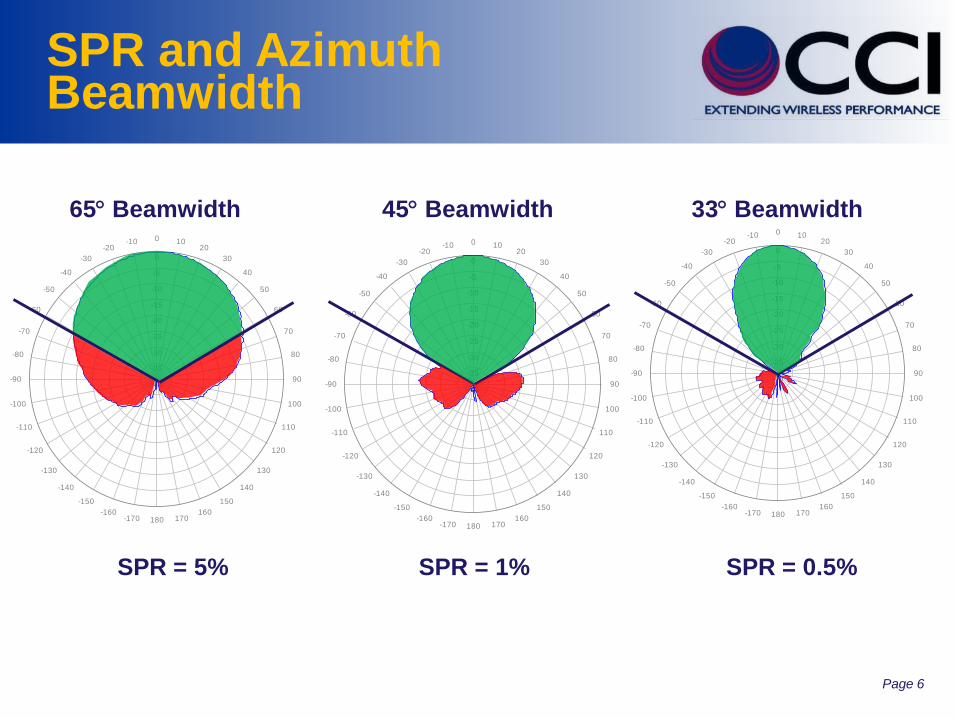
SPR and Azimuth Beamwidth
0 1020
30
40
50
60
70
80
90
100
110
120
130
140
150
160170180-170
-160
-150
-140
-130
-120
-110
-100
-90
-80
-70
-60
-50
-40
-30
-20-10
-40
-35
-30
-25
-20
-15
-10
-5
0
0
10
20
30
40
50
60
708090100
110
120
130
140
150
160
170
180
-170
-160
-150
-140
-130
-120
-110-100 -90 -80
-70
-60
-50
-40
-30
-20
-10
-40
-35
-30
-25
-20
-15
-10
-5
0
65 Beamwidth 45 Beamwidth 33 Beamwidth
SPR = 5% SPR = 1% SPR = 0.5%
COMMUNICATION
COMPONENTS INCExtending Wireless Coverage
Page 7
• Investigate performance differences of base station antennas
of different azimuth beamwidths for 3-sector wireless network
• Focus on relatively dense cell site to site spacing
• Illustrate advantages vs. disadvantages in both LTE and
UMTS networks
• Assess impacts to performance and coverage area
• In particular, reduced coverage in 120 sectors by antennas of beamwidths
< 65
Goals of Investigation
COMMUNICATION
COMPONENTS INCExtending Wireless Coverage
Page 8
• Network of hexagonal cell, based on cell radii of:
• 200 m, 300 m, 500 m and 600 m
• Each cell site is assigned a fixed height of 30 m with standard azimuth pointing directions
0, 120 and 240
• Focus Area consists of 9 cell sites of 3-sectors
• Forsk ATOLL Planning Tool used for all simulations
• Different traffic models were created for each scenario
• Monte Carlo simulation generates subscribers that could be serviced for both LTE & UMTS technologies
• All simulations performed with clutter (rather than plain earth)
• Geographic area selected is suburban neighborhood of Toronto with moderate to low density trees
Simulation Network and Assumptions
COMMUNICATION
COMPONENTS INCExtending Wireless Coverage
Page 9
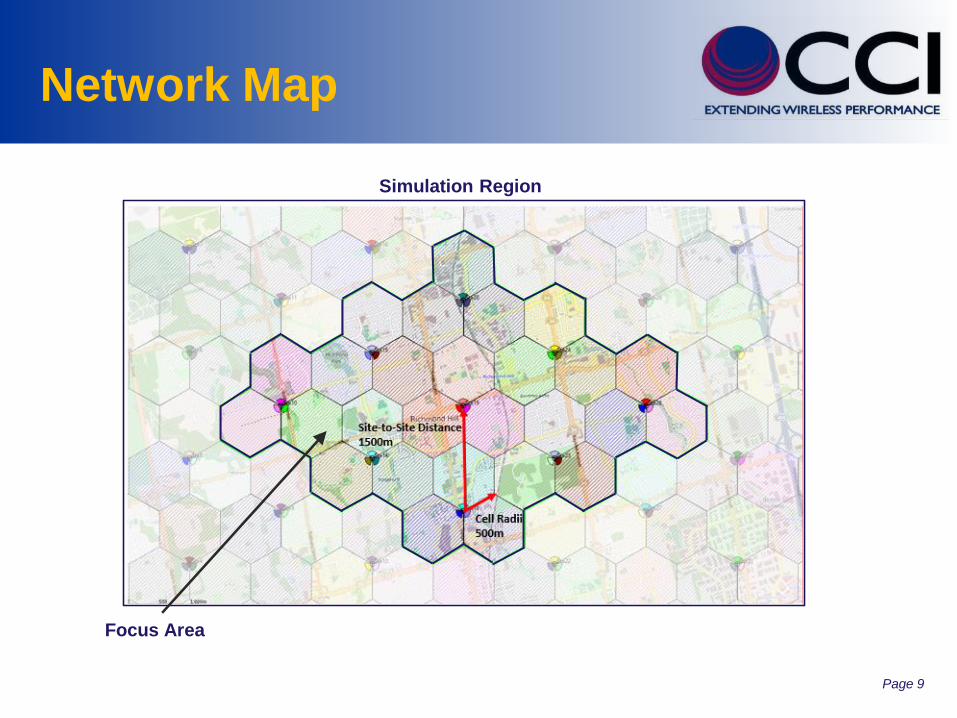
Network Map
Simulation Region
Focus Area
COMMUNICATION
COMPONENTS INCExtending Wireless Coverage
Page 10
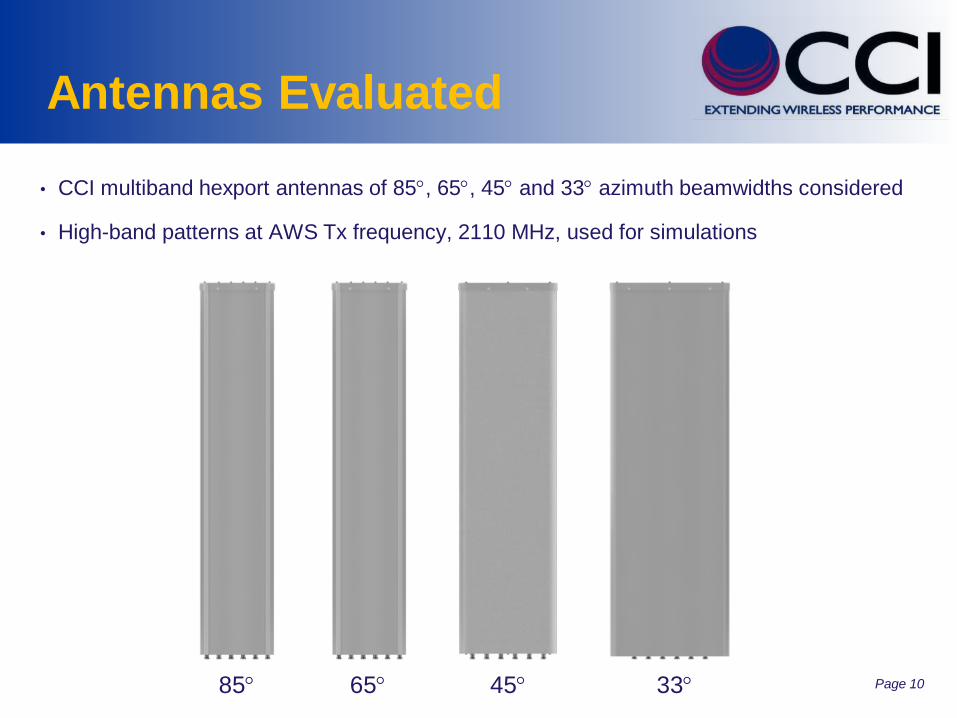
Antennas Evaluated
• CCI multiband hexport antennas of 85, 65, 45 and 33 azimuth beamwidths considered
• High-band patterns at AWS Tx frequency, 2110 MHz, used for simulations
85 65 45 33
COMMUNICATION
COMPONENTS INCExtending Wireless Coverage
Page 11
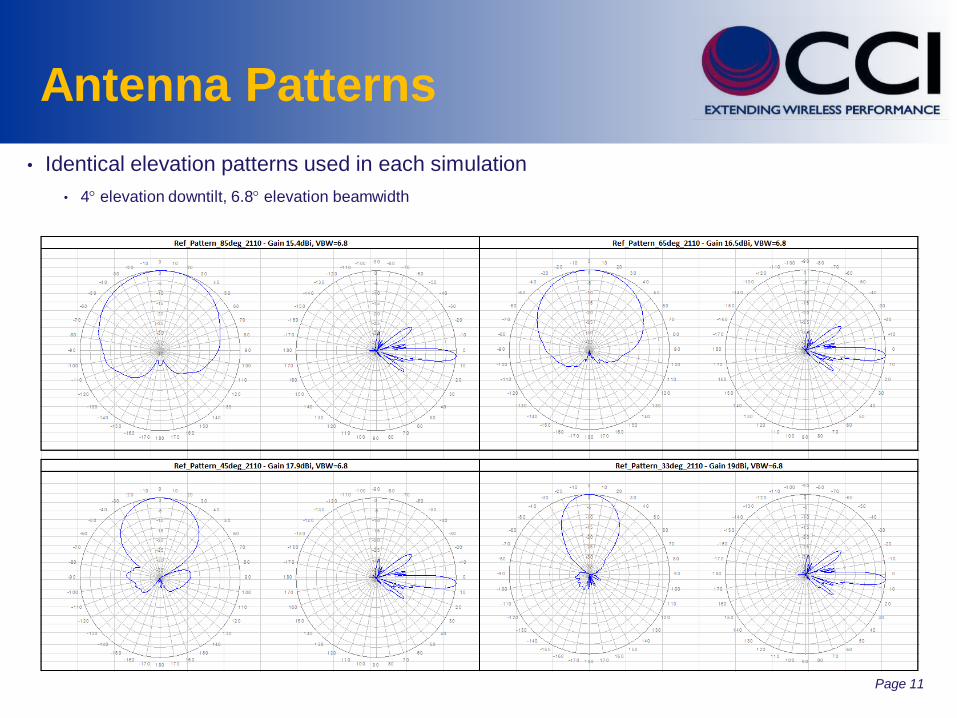
Antenna Patterns
• Identical elevation patterns used in each simulation
• 4 elevation downtilt, 6.8 elevation beamwidth
COMMUNICATION
COMPONENTS INCExtending Wireless Coverage
Page 12
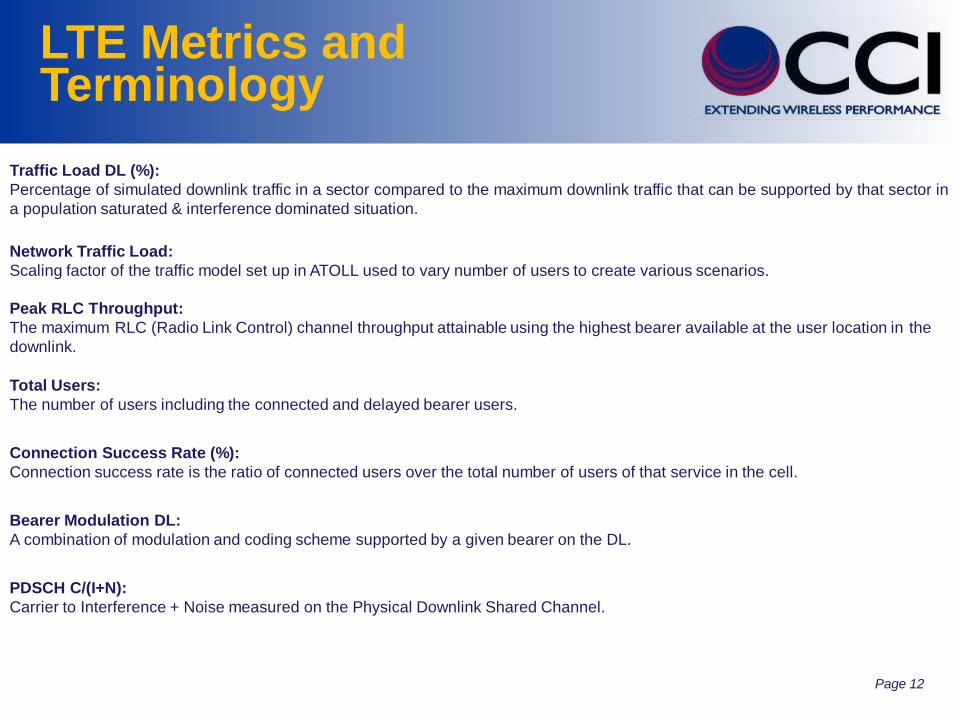
LTE Metrics and Terminology
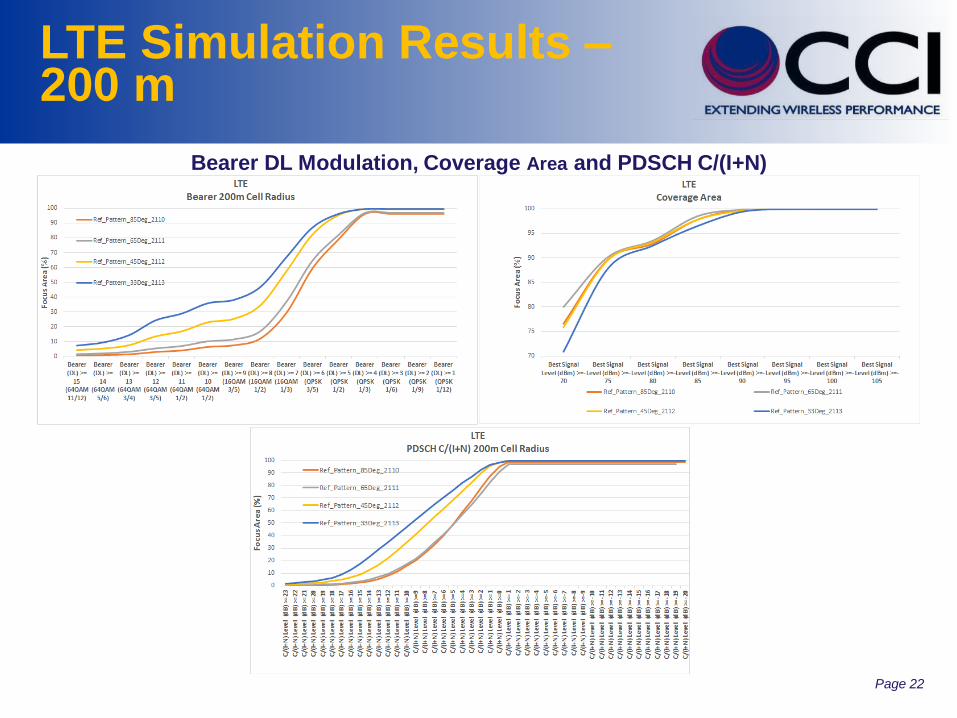
PDSCH C/(I+N):
Carrier to Interference + Noise measured on the Physical Downlink Shared Channel.
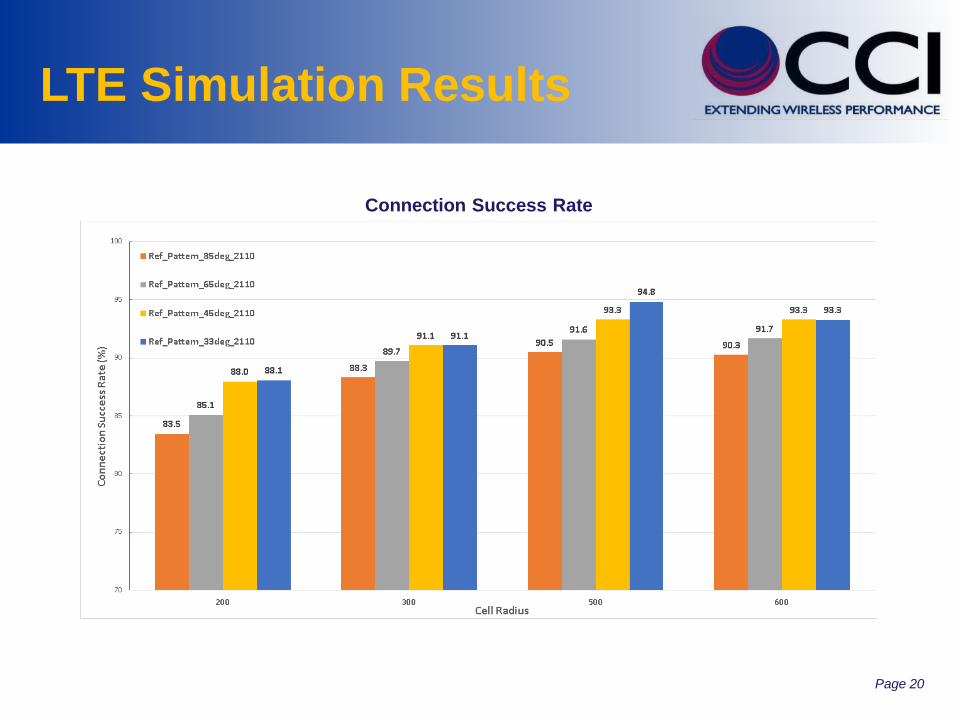
Connection Success Rate (%):
Connection success rate is the ratio of connected users over the total number of users of that service in the cell.
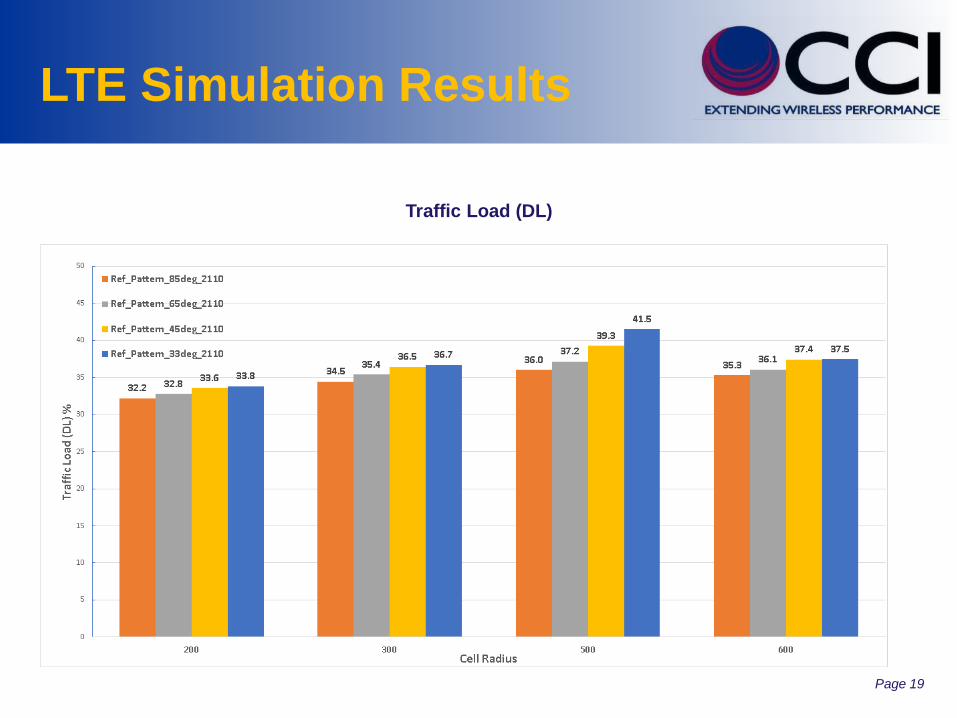
Traffic Load DL (%):
Percentage of simulated downlink traffic in a sector compared to the maximum downlink traffic that can be supported by that sector in
a population saturated & interference dominated situation.
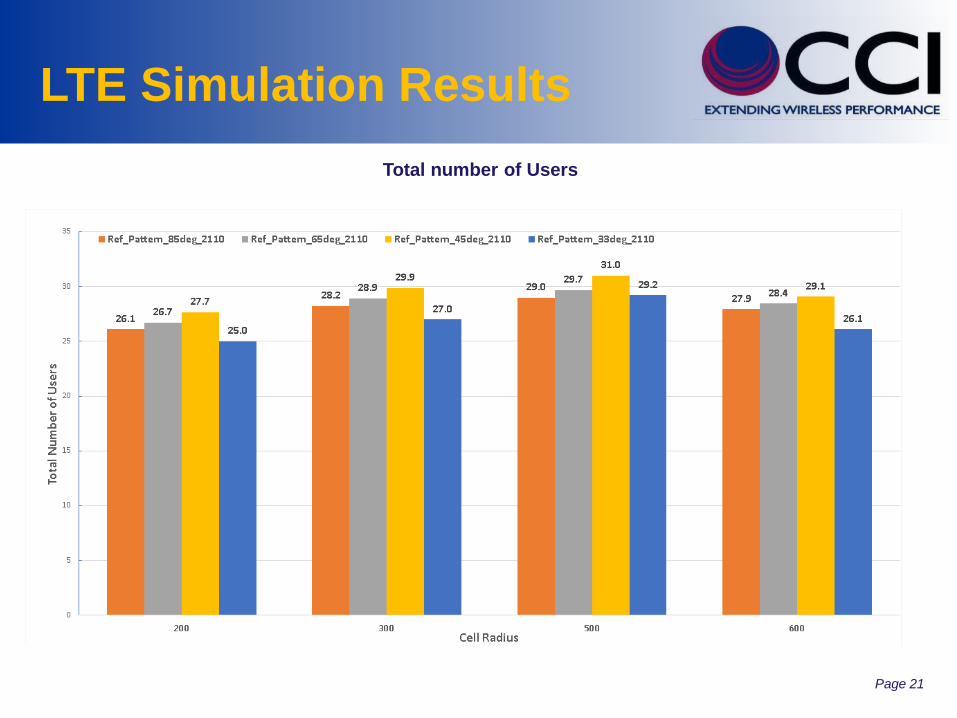
Total Users:
The number of users including the connected and delayed bearer users.
Bearer Modulation DL:
A combination of modulation and coding scheme supported by a given bearer on the DL.
Peak RLC Throughput:
The maximum RLC (Radio Link Control) channel throughput attainable using the highest bearer available at the user location in the
downlink.
Network Traffic Load:
Scaling factor of the traffic model set up in ATOLL used to vary number of users to create various scenarios.
COMMUNICATION
COMPONENTS INCExtending Wireless Coverage
Page 13
LTE Simulation Results Format
• LTE channel bandwidth used in simulation is 10 MHz
• Simulations carried out for Network Traffic Load = 0.1 to 3 in steps of 0.1
• 50 Monte Carlo simulations per Network Traffic Load
• Performance summary plots based on average performance over all Network Loads 0.1
to 3
• Results are presented per sector averaged over all sectors within the focus area
• Modulation, C/(I+N) and Coverage curves / plots provided only for Network Traffic Load =
1.0
COMMUNICATION
COMPONENTS INCExtending Wireless Coverage
Page 14
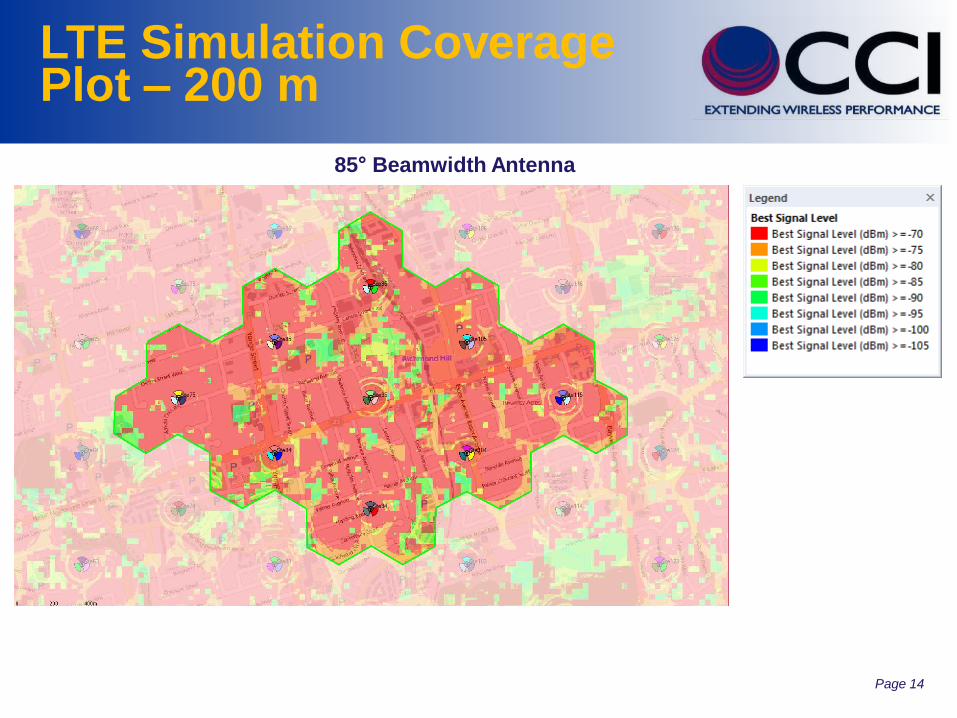
LTE Simulation Coverage Plot – 200 m
85° Beamwidth Antenna
COMMUNICATION
COMPONENTS INCExtending Wireless Coverage
Page 15
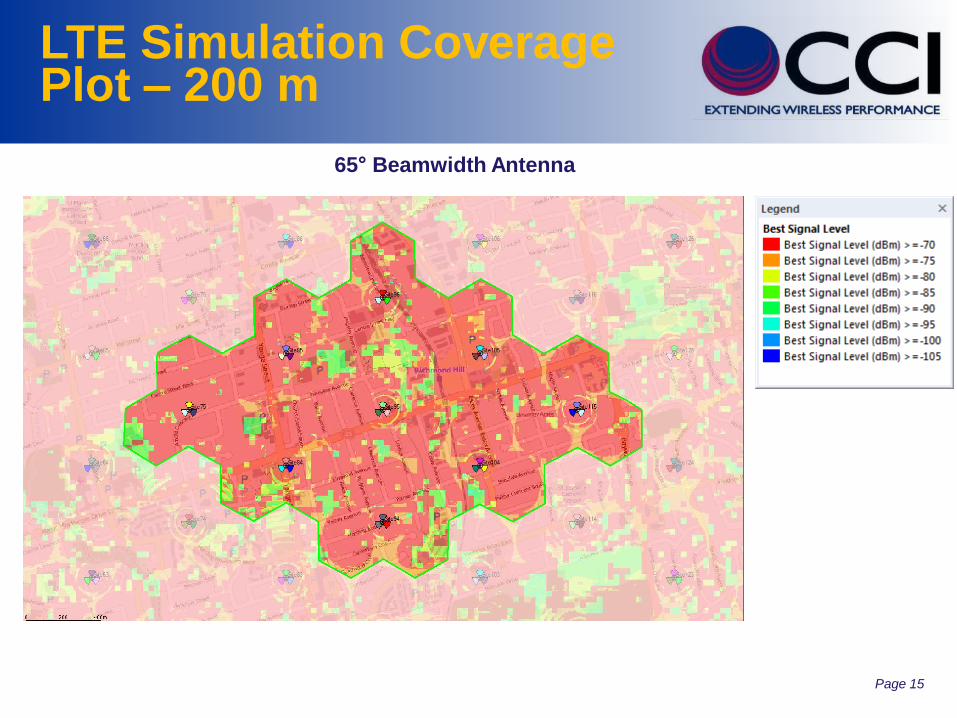
LTE Simulation Coverage Plot – 200 m
65° Beamwidth Antenna
COMMUNICATION
COMPONENTS INCExtending Wireless Coverage
Page 16
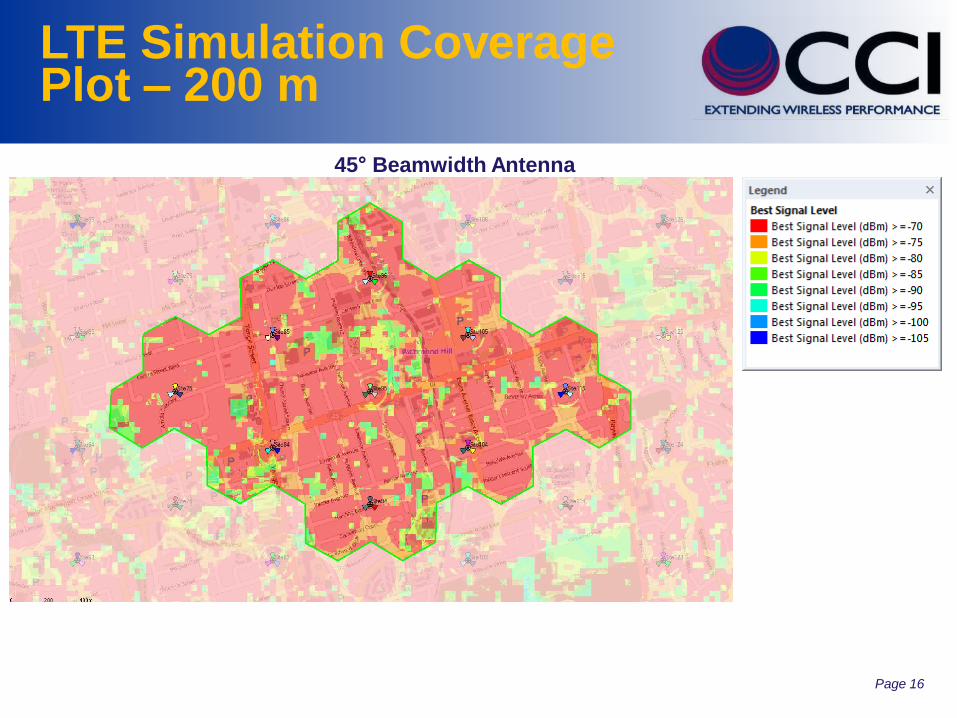
LTE Simulation Coverage Plot – 200 m
45° Beamwidth Antenna
COMMUNICATION
COMPONENTS INCExtending Wireless Coverage
Page 17
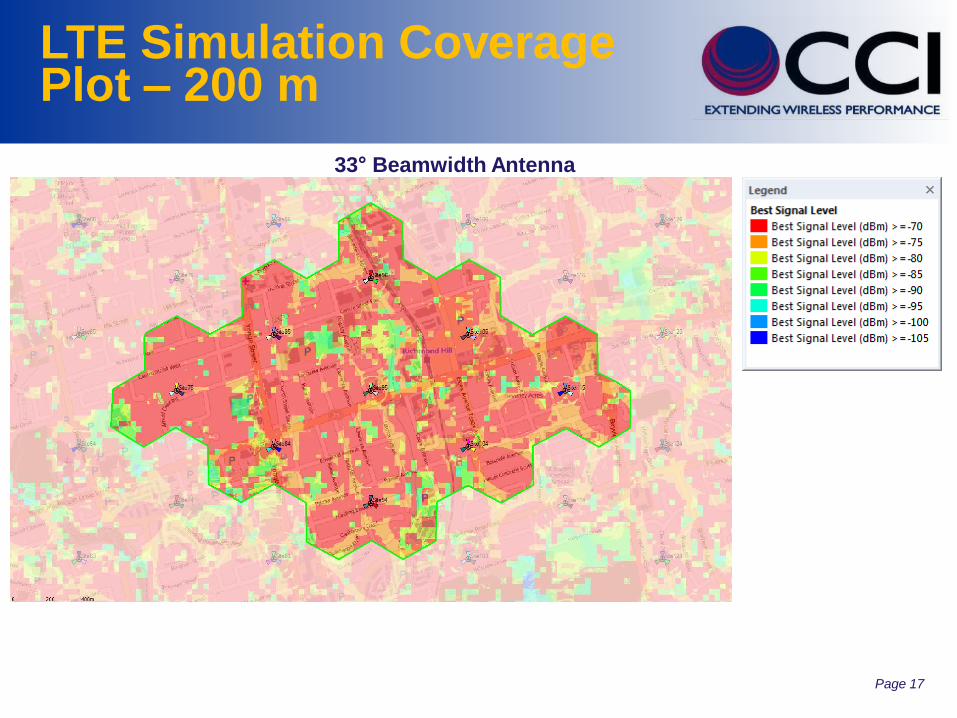
LTE Simulation Coverage Plot – 200 m
33° Beamwidth Antenna
COMMUNICATION
COMPONENTS INCExtending Wireless Coverage
Page 18
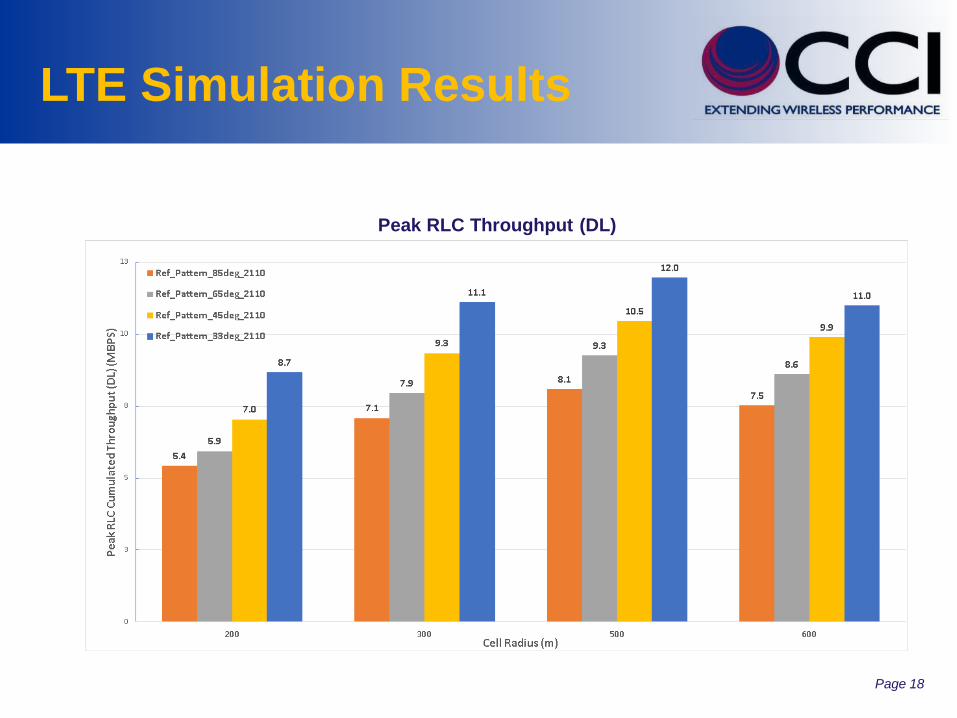
LTE Simulation Results
Peak RLC Throughput (DL)
COMMUNICATION
COMPONENTS INCExtending Wireless Coverage
Page 19
LTE Simulation Results
Traffic Load (DL)
COMMUNICATION
COMPONENTS INCExtending Wireless Coverage
Page 20
LTE Simulation Results
Connection Success Rate
COMMUNICATION
COMPONENTS INCExtending Wireless Coverage
Page 21
LTE Simulation Results
Total number of Users
COMMUNICATION
COMPONENTS INCExtending Wireless Coverage
Page 22
LTE Simulation Results –200 m
Bearer DL Modulation, Coverage Area and PDSCH C/(I+N)
COMMUNICATION
COMPONENTS INCExtending Wireless Coverage
Page 23
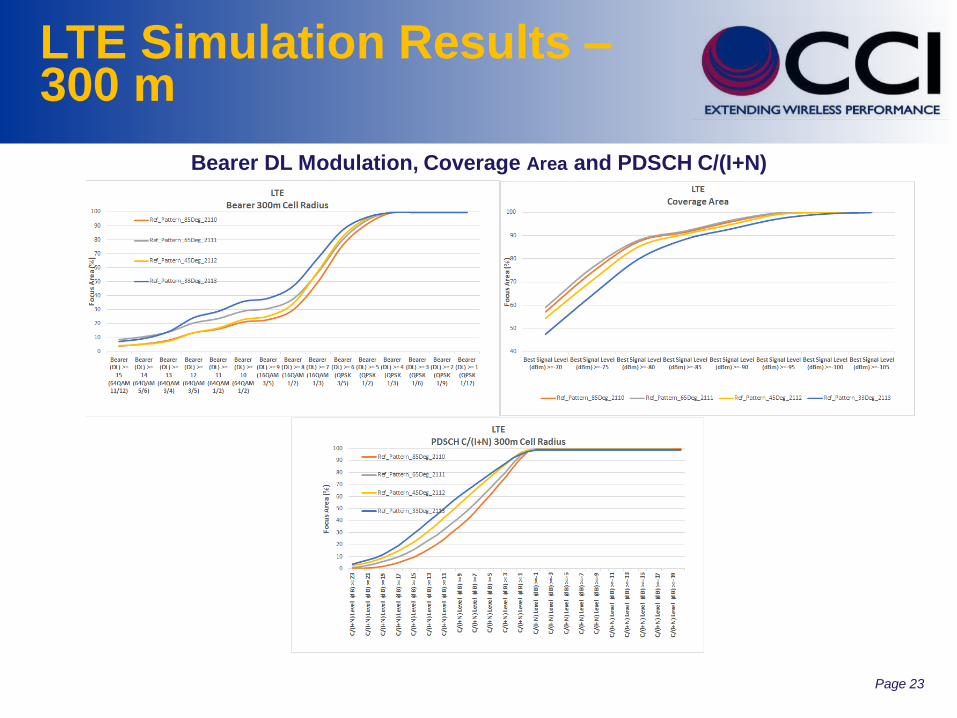
LTE Simulation Results –300 m
Bearer DL Modulation, Coverage Area and PDSCH C/(I+N)
COMMUNICATION
COMPONENTS INCExtending Wireless Coverage
Page 24
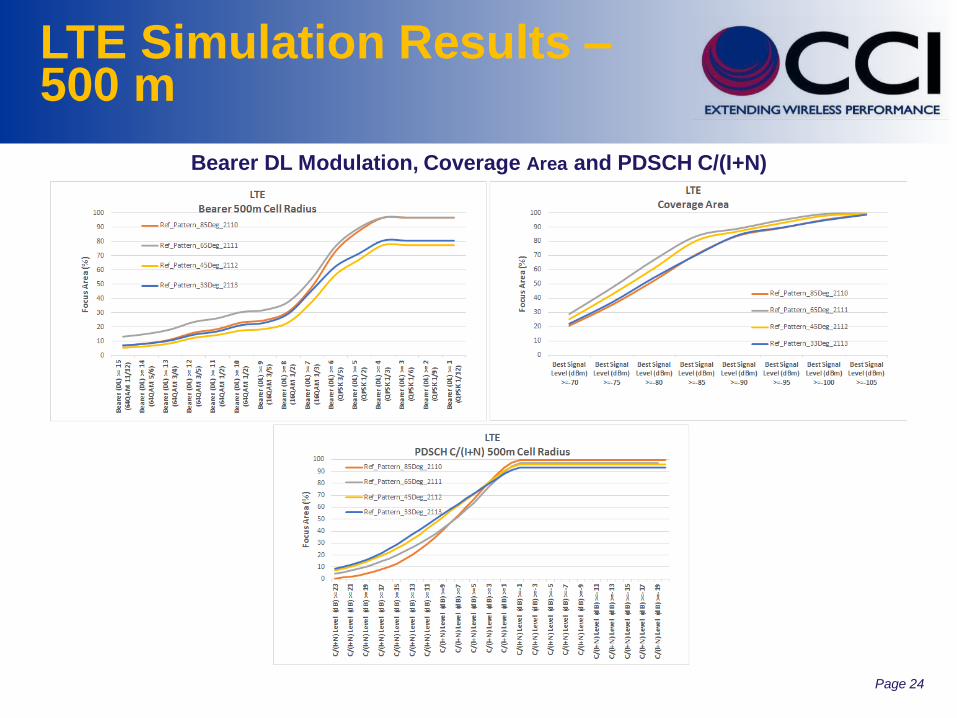
LTE Simulation Results –500 m
Bearer DL Modulation, Coverage Area and PDSCH C/(I+N)

COMMUNICATION
COMPONENTS INCExtending Wireless Coverage
Page 25
LTE Simulation Results –600 m
Bearer DL Modulation, Coverage Area and PDSCH C/(I+N)
COMMUNICATION
COMPONENTS INCExtending Wireless Coverage
Page 26
UMTS Metrics and Terminology
CQI (Channel Quality Indicator):
A measure of the quality of the channel used by the User Equipment to measure the link quality based on C/I.
Average TCH Power (dBm):
The average power allocated to a traffic channel for supplying services.
COMMUNICATION
COMPONENTS INCExtending Wireless Coverage
Page 27
UMTS Simulation Results Format
• Simulations carried out for Network Traffic Load = 0.1 to 3 in steps of 0.1
• 50 Monte Carlo simulations per Network Traffic Load
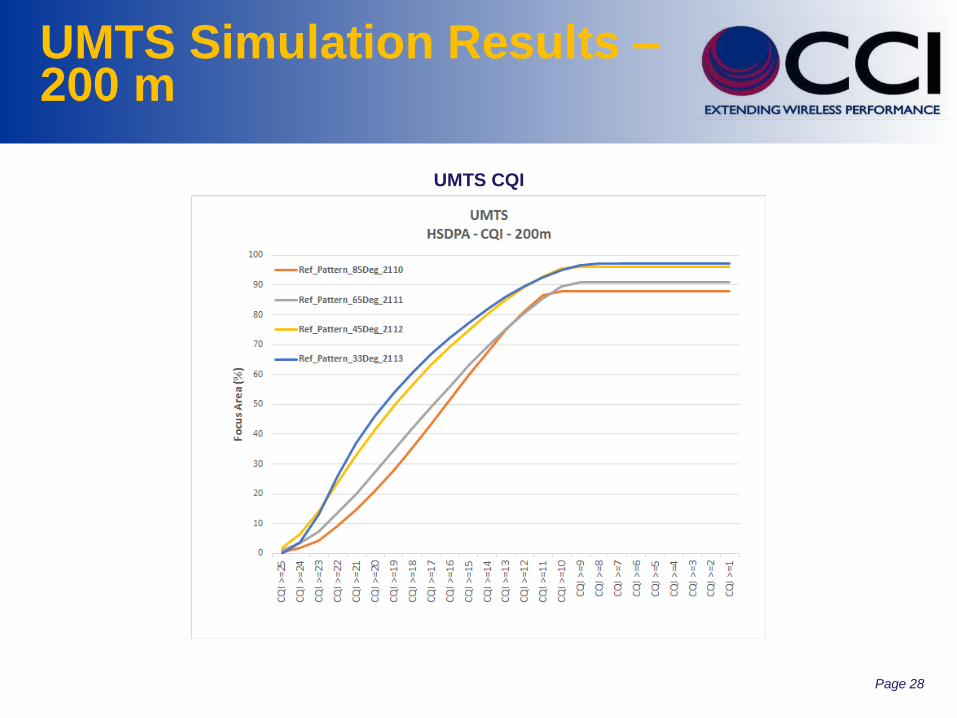
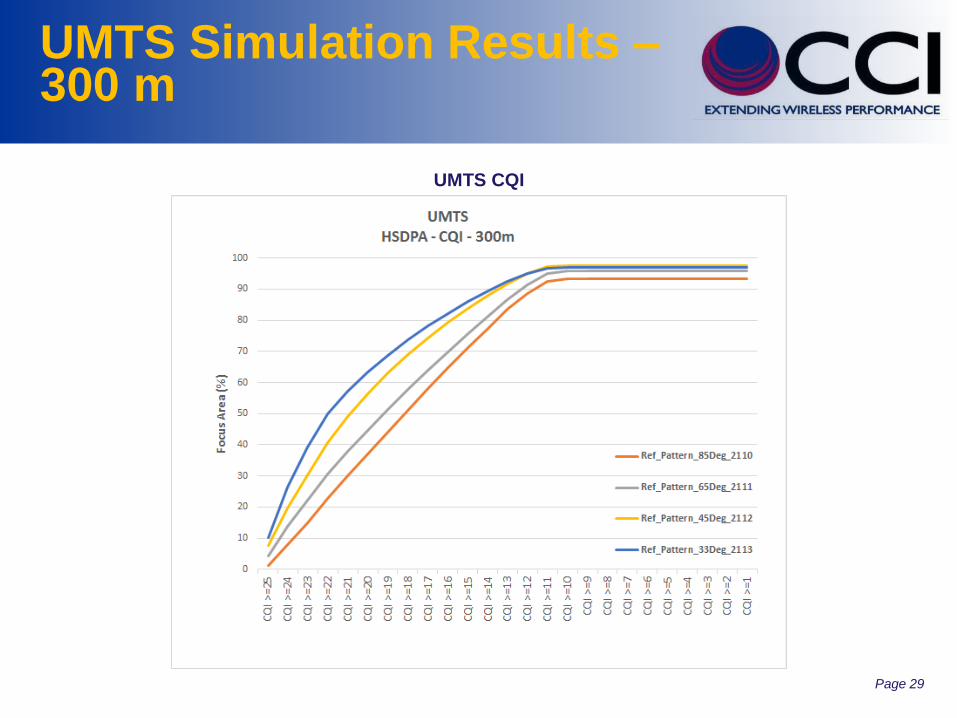
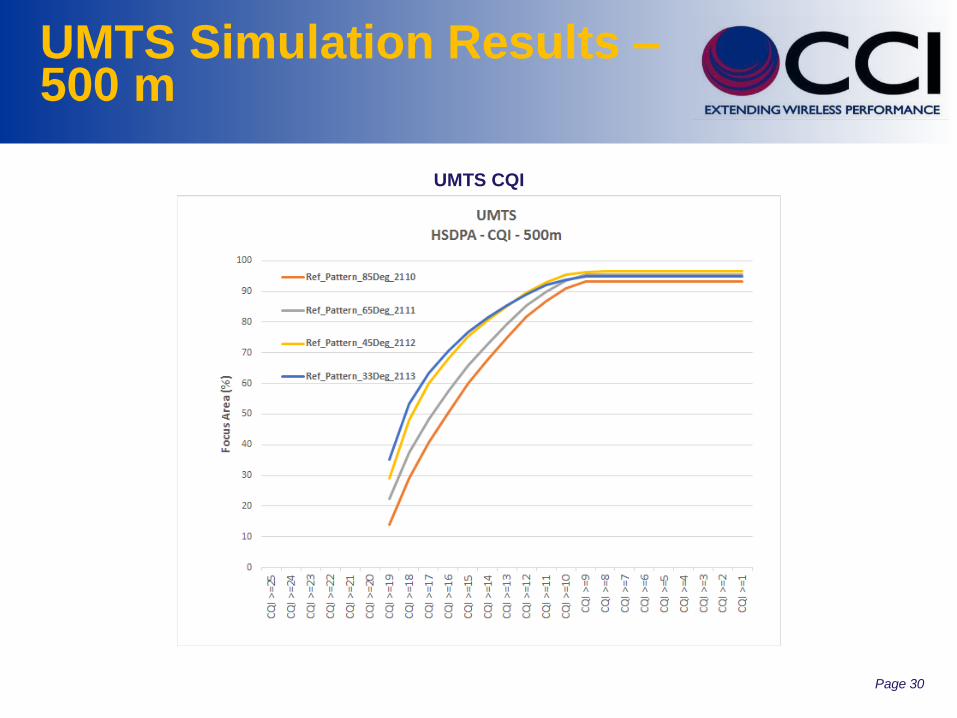
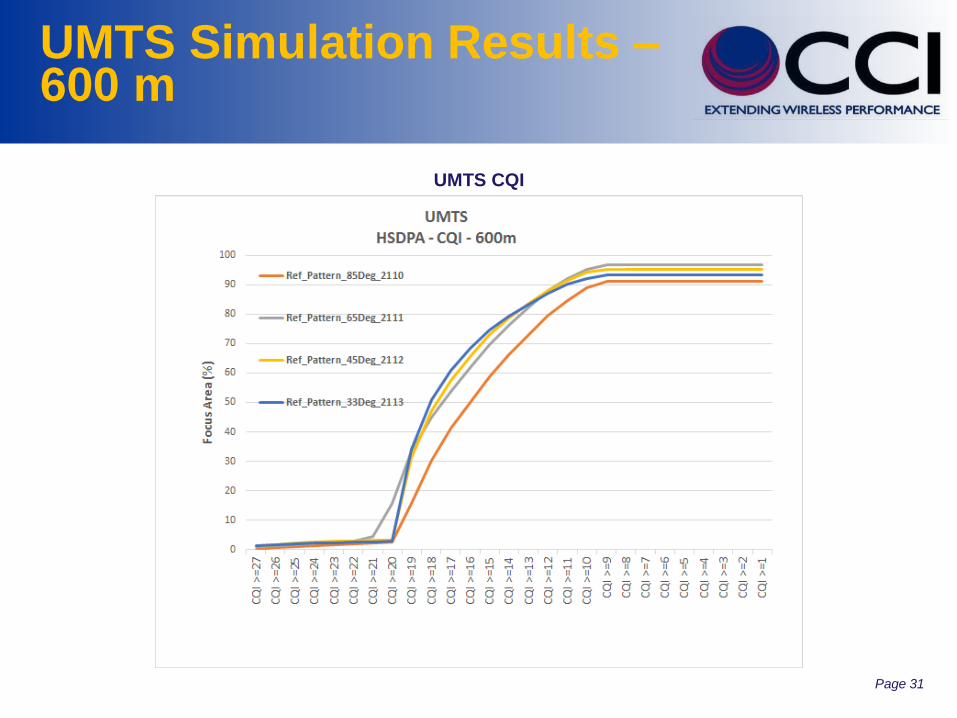
• Only CQI plots are provided for Network Traffic Load = 1.0
COMMUNICATION
COMPONENTS INCExtending Wireless Coverage
Page 28
UMTS Simulation Results –200 m
UMTS CQI
COMMUNICATION
COMPONENTS INCExtending Wireless Coverage
Page 29
UMTS Simulation Results –300 m
UMTS CQI
COMMUNICATION
COMPONENTS INCExtending Wireless Coverage
Page 30
UMTS Simulation Results –500 m
UMTS CQI
COMMUNICATION
COMPONENTS INCExtending Wireless Coverage
Page 31
UMTS Simulation Results –600 m
UMTS CQI
COMMUNICATION
COMPONENTS INCExtending Wireless Coverage
Page 32
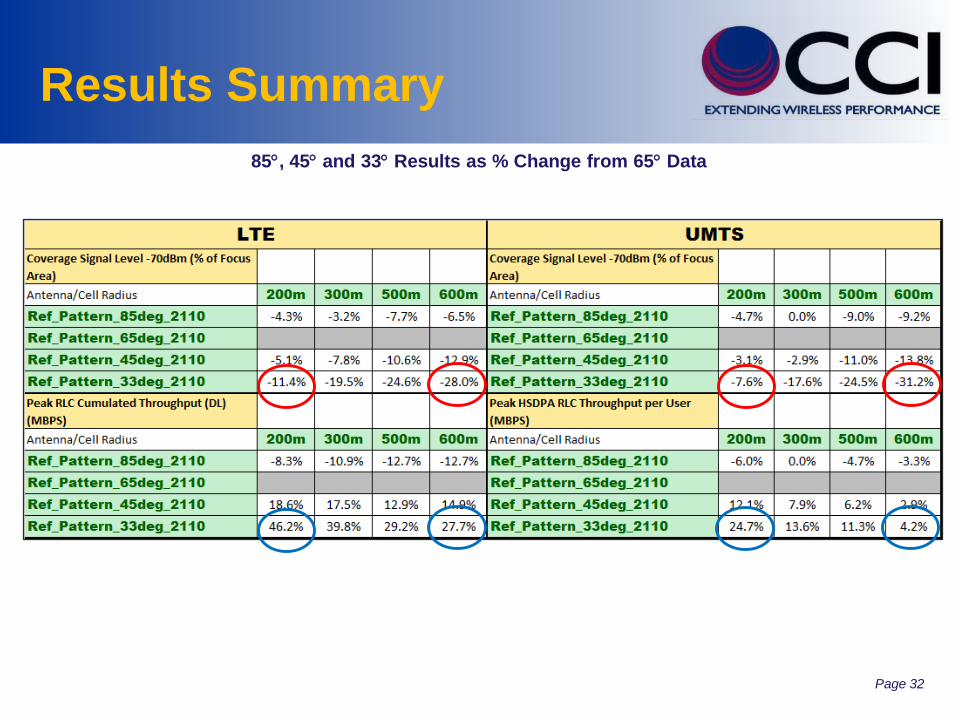
Results Summary
85, 45 and 33 Results as % Change from 65 Data
COMMUNICATION
COMPONENTS INCExtending Wireless Coverage
Page 33
Conclusions and Future Work
• Antennas of narrower azimuth beamwidth:
• More suitable for smaller cells
• Improved throughput
• Reduced coverage
• LTE vs UMTS
• Advantages of narrower beamwidth is clearer in LTE than UMTS
• For UMTS, narrow beamwidth does not work well for larger cells
• Future work:
• Optimize network for different scenarios (downtilt, elevation beamwidth, gain)
• Compare differences between networks with flat earth and clutter
• Investigation with larger cell radii
• Higher number of sectors / site