Embed Size (px)
Citation preview
1
EGM on the Role of ICT on SocioEGM on the Role of ICT on Socio--economic Development, 9economic Development, 9--10 April 201310 April 2013
Rami Zaatari
Measuring the Impact of eMeasuring the Impact of e--Services Services on Socioon Socio--economic Developmenteconomic DevelopmentAn upcoming study covering the Arab RegionAn upcoming study covering the Arab Region
Souheil MarineICT Division - [email protected]
Telecom & ICT4D [email protected]
Outline• Measuring the Information Society and its socio-
economic outcomeseconomic outcomes• Selected e-services in the ESCWA region:
• e-government• e-commerce and use of ICT in the business sector• Mobile apps
• Policy initiatives aimed at improving impact leveraging the transformation and Innovation potential of ICT
• Recommendations• Conclusion
2
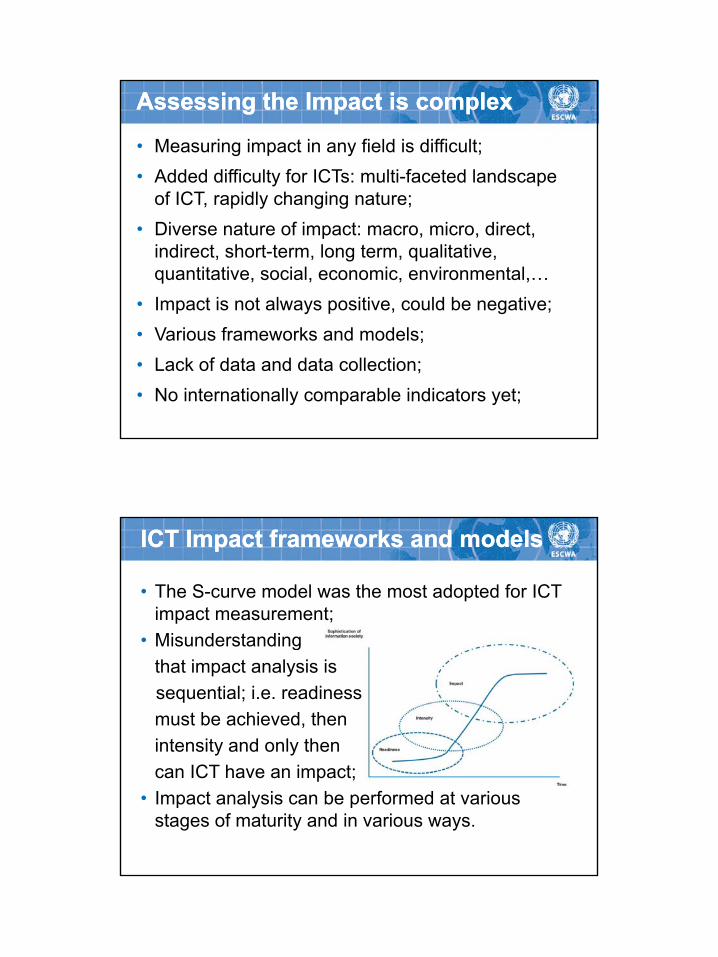
• Measuring impact in any field is difficult;• Added difficulty for ICTs: multi-faceted landscape
of ICT rapidly changing nature;
Assessing the Impact is complexAssessing the Impact is complex
of ICT, rapidly changing nature;• Diverse nature of impact: macro, micro, direct,
indirect, short-term, long term, qualitative, quantitative, social, economic, environmental,…
• Impact is not always positive, could be negative;• Various frameworks and models;• Lack of data and data collection;• No internationally comparable indicators yet;
ICT Impact frameworks and modelsICT Impact frameworks and models
• The S-curve model was the most adopted for ICT impact measurement;Misunderstanding• Misunderstandingthat impact analysis is sequential; i.e. readinessmust be achieved, thenintensity and only thencan ICT have an impact;
• Impact analysis can be performed at various stages of maturity and in various ways.
3
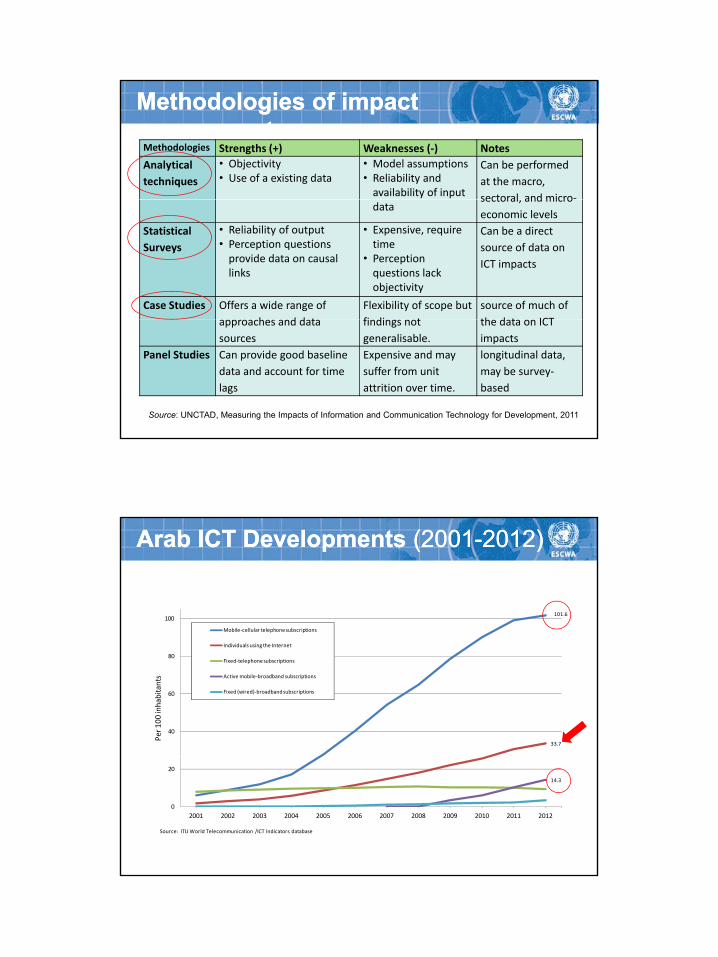
Methodologies of Methodologies of impact impact assessment assessment
Methodologies Strengths (+) Weaknesses (‐) NotesAnalytical techniques
• Objectivity• Use of a existing data
• Model assumptions• Reliability and
availability of input
Can be performed at the macro, sectoral and micro‐
datasectoral, and microeconomic levels
Statistical Surveys
• Reliability of output• Perception questions
provide data on causal links
• Expensive, require time
• Perception questions lack objectivity
Can be a direct source of data on ICT impacts
Case Studies Offers a wide range of h d d t
Flexibility of scope but fi di t
source of much of th d t ICT
Source: UNCTAD, Measuring the Impacts of Information and Communication Technology for Development, 2011
approaches and data sources
findings not generalisable.
the data on ICT impacts
Panel Studies Can provide good baseline data and account for time lags
Expensive and may suffer from unit attrition over time.
longitudinal data, may be survey‐based
101.6100
Mobile‐cellular telephone subscriptions
Arab ICT Developments Arab ICT Developments (2001(2001--2012)2012)
33.7
40
60
80
Per 1
00 in
habi
tant
s
Individuals using the Internet
Fixed‐telephone subscriptions
Active mobile‐broadband subscriptions
Fixed (wired)‐broadband subscriptions
14.3
0
20
2001 2002 2003 2004 2005 2006 2007 2008 2009 2010 2011 2012
Source: ITU World Telecommunication /ICT Indicators database
4
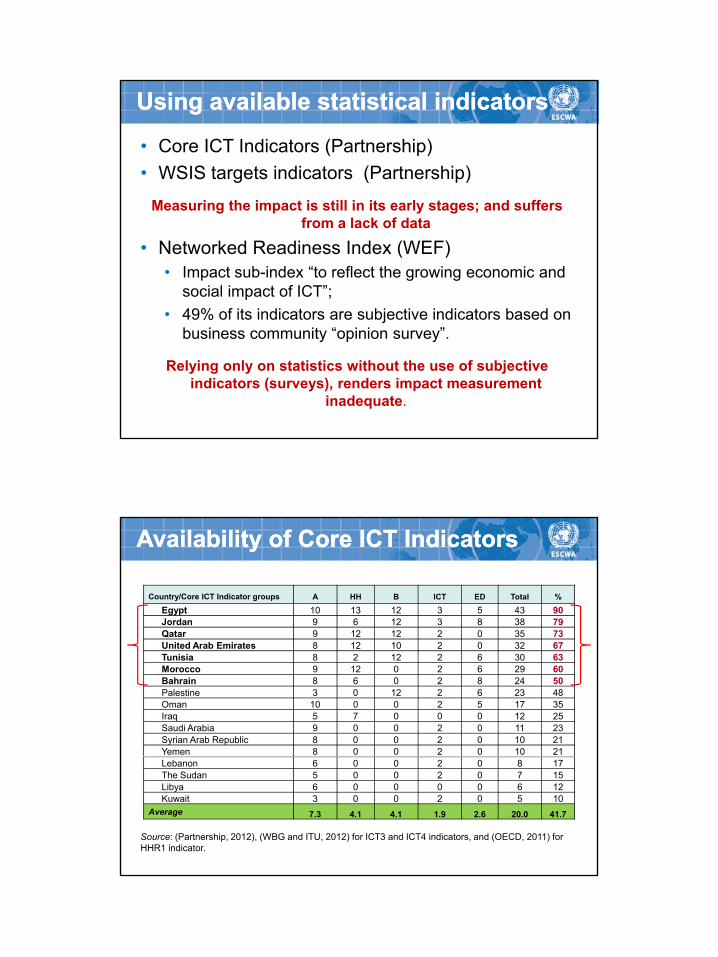
• Core ICT Indicators (Partnership)• WSIS targets indicators (Partnership)
Using available statistical indicatorsUsing available statistical indicators
Measuring the impact is still in its early stages; and suffers from a lack of data
• Networked Readiness Index (WEF)• Impact sub-index “to reflect the growing economic and
social impact of ICT”;• 49% of its indicators are subjective indicators based on49% of its indicators are subjective indicators based on
business community “opinion survey”.
Relying only on statistics without the use of subjective indicators (surveys), renders impact measurement
inadequate.
Country/Core ICT Indicator groups A HH B ICT ED Total %
Egypt 10 13 12 3 5 43 90Jordan 9 6 12 3 8 38 79Qatar 9 12 12 2 0 35 73
Availability of Core ICT IndicatorsAvailability of Core ICT Indicators
Qata 9 0 35 3United Arab Emirates 8 12 10 2 0 32 67Tunisia 8 2 12 2 6 30 63Morocco 9 12 0 2 6 29 60Bahrain 8 6 0 2 8 24 50Palestine 3 0 12 2 6 23 48Oman 10 0 0 2 5 17 35Iraq 5 7 0 0 0 12 25Saudi Arabia 9 0 0 2 0 11 23Syrian Arab Republic 8 0 0 2 0 10 21Yemen 8 0 0 2 0 10 21Lebanon 6 0 0 2 0 8 17The Sudan 5 0 0 2 0 7 15Libya 6 0 0 0 0 6 12Kuwait 3 0 0 2 0 5 10
Average 7.3 4.1 4.1 1.9 2.6 20.0 41.7
Source: (Partnership, 2012), (WBG and ITU, 2012) for ICT3 and ICT4 indicators, and (OECD, 2011) for HHR1 indicator.
5
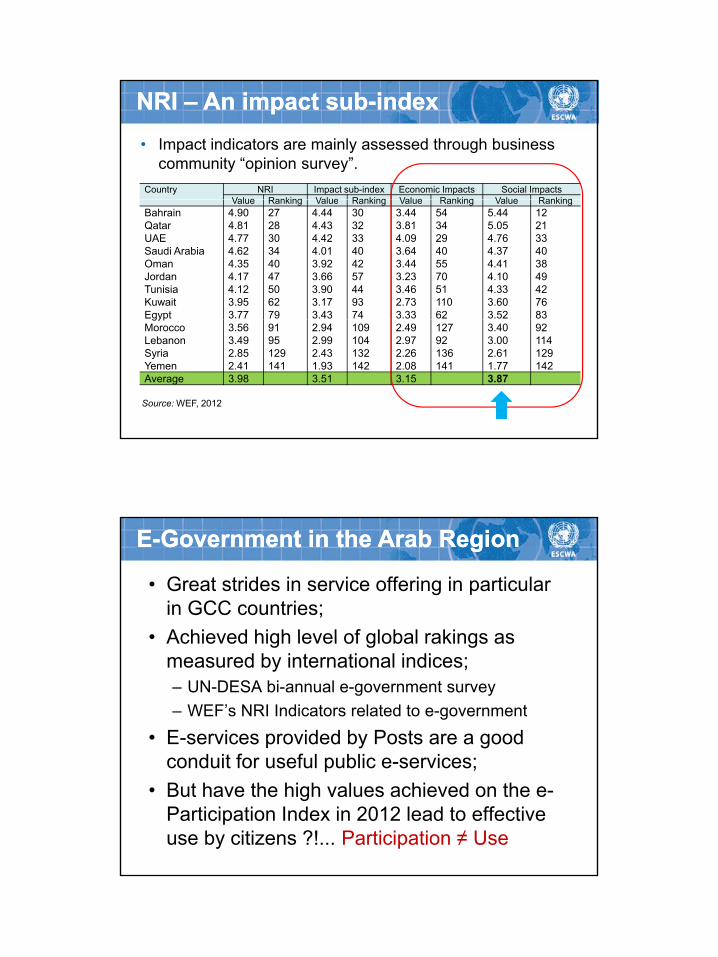
• Impact indicators are mainly assessed through business community “opinion survey”.
NRI NRI –– An impact subAn impact sub--indexindex
Country NRI Impact sub-index Economic Impacts Social ImpactsValue Ranking Value Ranking Value Ranking Value RankingValue Ranking Value Ranking Value Ranking Value Ranking
Bahrain 4.90 27 4.44 30 3.44 54 5.44 12Qatar 4.81 28 4.43 32 3.81 34 5.05 21UAE 4.77 30 4.42 33 4.09 29 4.76 33Saudi Arabia 4.62 34 4.01 40 3.64 40 4.37 40Oman 4.35 40 3.92 42 3.44 55 4.41 38Jordan 4.17 47 3.66 57 3.23 70 4.10 49Tunisia 4.12 50 3.90 44 3.46 51 4.33 42Kuwait 3.95 62 3.17 93 2.73 110 3.60 76Egypt 3.77 79 3.43 74 3.33 62 3.52 83gypMorocco 3.56 91 2.94 109 2.49 127 3.40 92Lebanon 3.49 95 2.99 104 2.97 92 3.00 114Syria 2.85 129 2.43 132 2.26 136 2.61 129Yemen 2.41 141 1.93 142 2.08 141 1.77 142Average 3.98 3.51 3.15 3.87
Source: WEF, 2012
• Great strides in service offering in particular in GCC countries;
• Achieved high level of global rakings as
EE--Government in the Arab RegionGovernment in the Arab Region
• Achieved high level of global rakings as measured by international indices;– UN-DESA bi-annual e-government survey– WEF’s NRI Indicators related to e-government
• E-services provided by Posts are a good d it f f l bli iconduit for useful public e-services;
• But have the high values achieved on the e-Participation Index in 2012 lead to effective use by citizens ?!... Participation ≠ Use
6
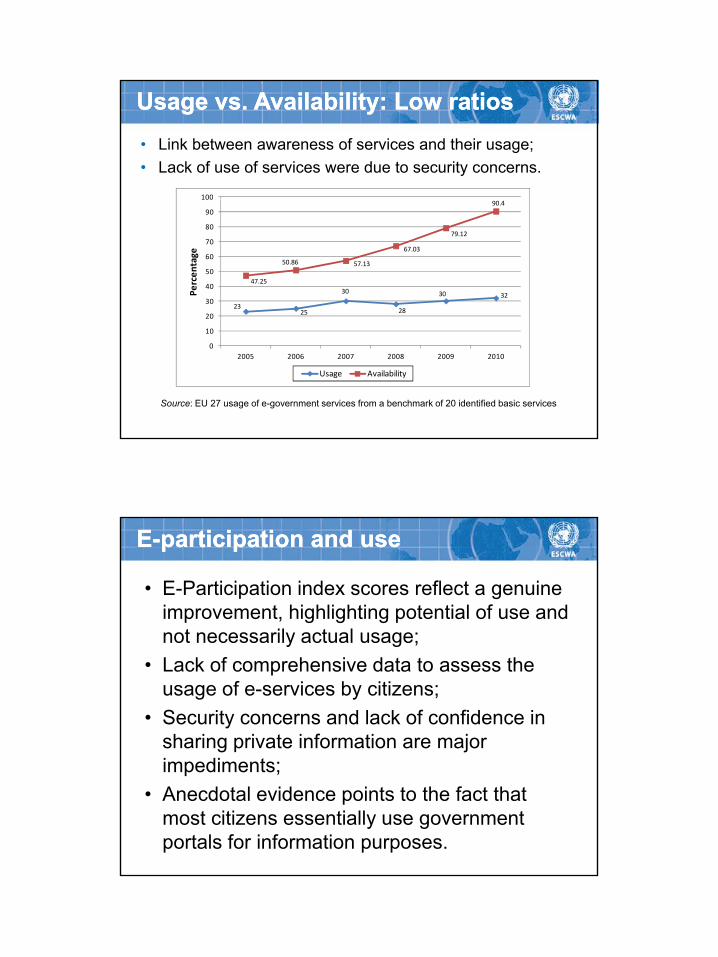
100
Usage vs. Availability: Low ratiosUsage vs. Availability: Low ratios• Link between awareness of services and their usage;• Lack of use of services were due to security concerns.
2325
30
28
30 32
47.25
50.86 57.13
67.03
79.12
90.4
20
30
40
50
60
70
80
90
100Pe
rcen
tage
Source: EU 27 usage of e-government services from a benchmark of 20 identified basic services
0
10
2005 2006 2007 2008 2009 2010
Usage Availability
• E-Participation index scores reflect a genuine improvement, highlighting potential of use and not necessarily actual usage;
EE--participation and use participation and use
not necessarily actual usage;• Lack of comprehensive data to assess the
usage of e-services by citizens;• Security concerns and lack of confidence in
sharing private information are major impediments;
• Anecdotal evidence points to the fact that most citizens essentially use government portals for information purposes.
7
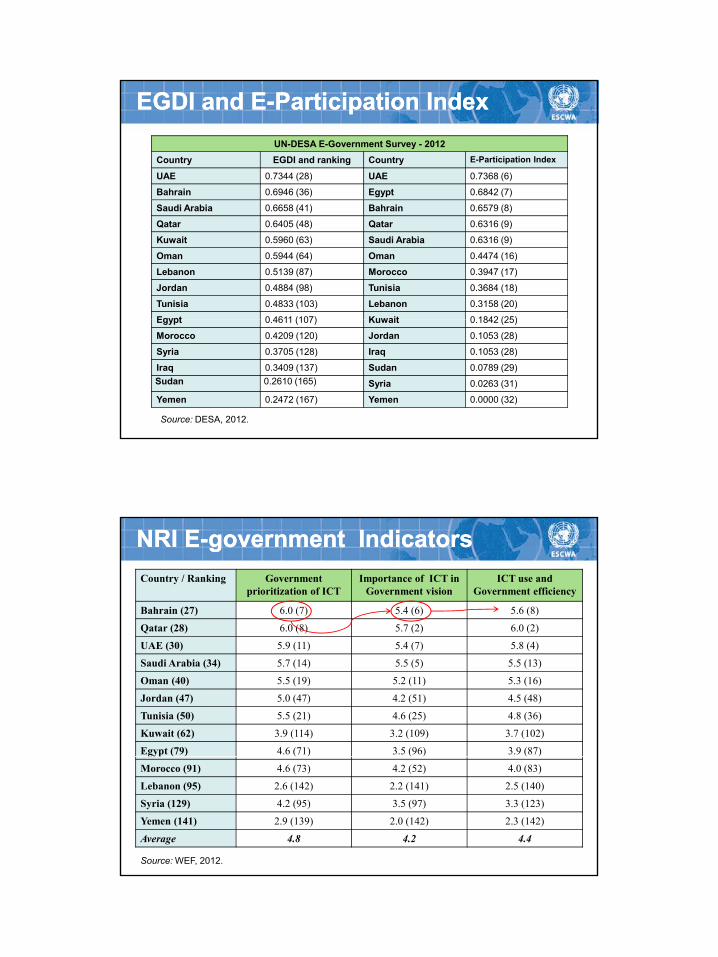
UN-DESA E-Government Survey - 2012 Country EGDI and ranking Country E-Participation Index
UAE 0.7344 (28) UAE 0.7368 (6)
Bahrain 0.6946 (36) Egypt 0.6842 (7)
EGDI and EEGDI and E--Participation IndexParticipation Index
Saudi Arabia 0.6658 (41) Bahrain 0.6579 (8)
Qatar 0.6405 (48) Qatar 0.6316 (9)
Kuwait 0.5960 (63) Saudi Arabia 0.6316 (9)
Oman 0.5944 (64) Oman 0.4474 (16)
Lebanon 0.5139 (87) Morocco 0.3947 (17)
Jordan 0.4884 (98) Tunisia 0.3684 (18)
Tunisia 0.4833 (103) Lebanon 0.3158 (20)
Egypt 0 4611 (107) Kuwait 0 1842 (25)Egypt 0.4611 (107) Kuwait 0.1842 (25)
Morocco 0.4209 (120) Jordan 0.1053 (28)
Syria 0.3705 (128) Iraq 0.1053 (28)
Iraq 0.3409 (137) Sudan 0.0789 (29)Sudan 0.2610 (165) Syria 0.0263 (31)
Yemen 0.2472 (167) Yemen 0.0000 (32)
Source: DESA, 2012.
Country / Ranking Government prioritization of ICT
Importance of ICT in Government vision
ICT use and Government efficiency
Bahrain (27) 6.0 (7) 5.4 (6) 5.6 (8)
Qatar (28) 6.0 (8) 5.7 (2) 6.0 (2)
NRI ENRI E--government Indicatorsgovernment Indicators
UAE (30) 5.9 (11) 5.4 (7) 5.8 (4)
Saudi Arabia (34) 5.7 (14) 5.5 (5) 5.5 (13)
Oman (40) 5.5 (19) 5.2 (11) 5.3 (16)
Jordan (47) 5.0 (47) 4.2 (51) 4.5 (48)
Tunisia (50) 5.5 (21) 4.6 (25) 4.8 (36)
Kuwait (62) 3.9 (114) 3.2 (109) 3.7 (102)
Egypt (79) 4.6 (71) 3.5 (96) 3.9 (87)
Morocco (91) 4.6 (73) 4.2 (52) 4.0 (83)
Lebanon (95) 2.6 (142) 2.2 (141) 2.5 (140)
Syria (129) 4.2 (95) 3.5 (97) 3.3 (123)
Yemen (141) 2.9 (139) 2.0 (142) 2.3 (142)
Average 4.8 4.2 4.4
Source: WEF, 2012.
8
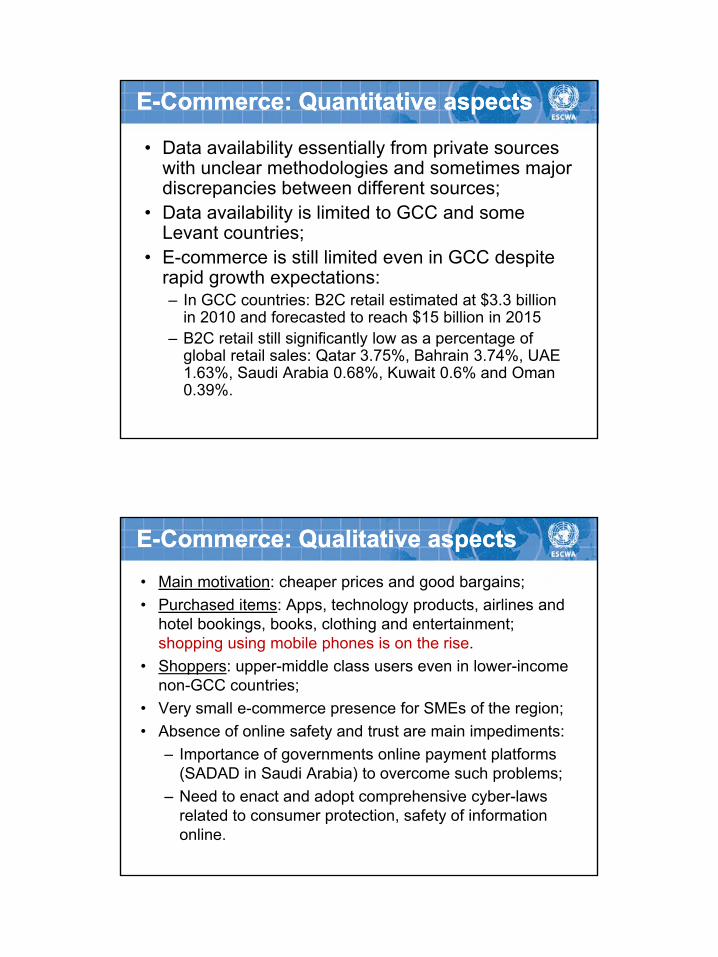
• Data availability essentially from private sources with unclear methodologies and sometimes major discrepancies between different sources;
EE--Commerce: Quantitative aspectsCommerce: Quantitative aspects
• Data availability is limited to GCC and some Levant countries;
• E-commerce is still limited even in GCC despite rapid growth expectations:– In GCC countries: B2C retail estimated at $3.3 billion
in 2010 and forecasted to reach $15 billion in 2015in 2010 and forecasted to reach $15 billion in 2015 – B2C retail still significantly low as a percentage of
global retail sales: Qatar 3.75%, Bahrain 3.74%, UAE 1.63%, Saudi Arabia 0.68%, Kuwait 0.6% and Oman 0.39%.
• Main motivation: cheaper prices and good bargains;• Purchased items: Apps, technology products, airlines and
hotel bookings, books, clothing and entertainment; h i i bil h i h i
EE--Commerce: Qualitative aspectsCommerce: Qualitative aspects
shopping using mobile phones is on the rise.• Shoppers: upper-middle class users even in lower-income
non-GCC countries;• Very small e-commerce presence for SMEs of the region;• Absence of online safety and trust are main impediments:
– Importance of governments online payment platformsImportance of governments online payment platforms (SADAD in Saudi Arabia) to overcome such problems;
– Need to enact and adopt comprehensive cyber-laws related to consumer protection, safety of information online.
9
EE--Commerce measurement (I)Commerce measurement (I)
• Private data sources for e-commerce focus on retail B2C, which represents only a small fraction of e-commerce. (B2B transactions constitute 90% of e-commerce. (B2B transactions constitute 90% of ecommerce activities in the US)
• Existing data on core ICT indicators, NRI indicators, as well as anecdotal and private source evidence, point to the willingness of businesses to instil ICT and end-users to actively use e-commerce.y
• Lack of official data on e-commerce in the region; governments measurement efforts are limited to core indicators on use of ICT by businesses; (6 countries have B indicators + low periodicity)
• Data on B indicators do not capture e-commerce transactions values for B2C, B2B, G2C, G2B, …
• Do not differentiate between sales to domestic
EE--Commerce measurement (II)Commerce measurement (II)
• Do not differentiate between sales to domestic customers and purchases from foreign suppliers;
• Household surveys could be a possible source; but B2C is a smaller share of total e-commerce;
• Use of ICT by businesses limited to large enterprises majority of businesses are SMEs;enterprises - majority of businesses are SMEs;
• The absence of official statistics based on business surveys hinders policymaking efforts aimed at improving ICT impact on the economy.
10
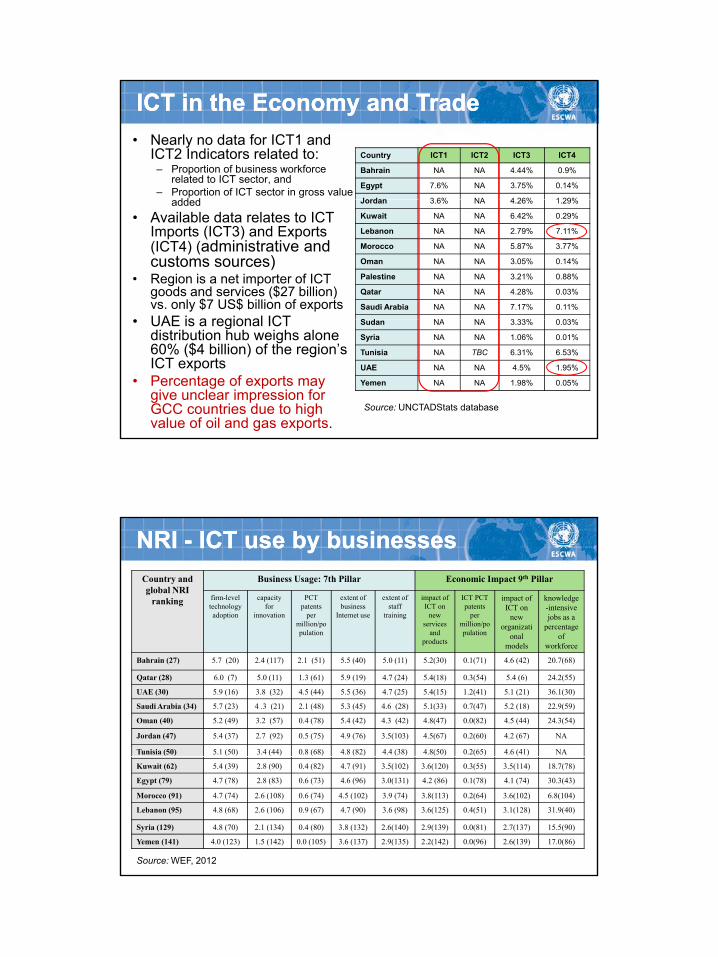
ICT in the Economy and TradeICT in the Economy and Trade• Nearly no data for ICT1 and
ICT2 Indicators related to:– Proportion of business workforce
related to ICT sector, and– Proportion of ICT sector in gross value
dd d
Country ICT1 ICT2 ICT3 ICT4
Bahrain NA NA 4.44% 0.9%
Egypt 7.6% NA 3.75% 0.14%
Jordan 3 6% NA 4 26% 1 29%added• Available data relates to ICT
Imports (ICT3) and Exports (ICT4) (administrative and customs sources)
• Region is a net importer of ICT goods and services ($27 billion) vs. only $7 US$ billion of exports
• UAE is a regional ICT
Jordan 3.6% NA 4.26% 1.29%
Kuwait NA NA 6.42% 0.29%
Lebanon NA NA 2.79% 7.11%
Morocco NA NA 5.87% 3.77%
Oman NA NA 3.05% 0.14%
Palestine NA NA 3.21% 0.88%
Qatar NA NA 4.28% 0.03%
Saudi Arabia NA NA 7.17% 0.11%
S d NA NA 3 33% 0 03%• UAE is a regional ICT distribution hub weighs alone 60% ($4 billion) of the region’s ICT exports
• Percentage of exports may give unclear impression for GCC countries due to high value of oil and gas exports.
Sudan NA NA 3.33% 0.03%
Syria NA NA 1.06% 0.01%
Tunisia NA TBC 6.31% 6.53%
UAE NA NA 4.5% 1.95%
Yemen NA NA 1.98% 0.05%
Source: UNCTADStats database
NRI NRI -- ICT use by businessesICT use by businessesCountry andglobal NRI
ranking
Business Usage: 7th Pillar Economic Impact 9th Pillar
firm-level technology adoption
capacity for
innovation
PCT patents
per million/population
extent of business
Internet use
extent of staff
training
impact of ICT on
new services
and
ICT PCT patents
per million/population
impact of ICT on
new organizati
onal
knowledge-intensive jobs as a
percentage of
productsonal
modelsof
workforce
Bahrain (27) 5.7 (20) 2.4 (117) 2.1 (51) 5.5 (40) 5.0 (11) 5.2(30) 0.1(71) 4.6 (42) 20.7(68)
Qatar (28) 6.0 (7) 5.0 (11) 1.3 (61) 5.9 (19) 4.7 (24) 5.4(18) 0.3(54) 5.4 (6) 24.2(55)
UAE (30) 5.9 (16) 3.8 (32) 4.5 (44) 5.5 (36) 4.7 (25) 5.4(15) 1.2(41) 5.1 (21) 36.1(30)
Saudi Arabia (34) 5.7 (23) 4 .3 (21) 2.1 (48) 5.3 (45) 4.6 (28) 5.1(33) 0.7(47) 5.2 (18) 22.9(59)
Oman (40) 5.2 (49) 3.2 (57) 0.4 (78) 5.4 (42) 4.3 (42) 4.8(47) 0.0(82) 4.5 (44) 24.3(54)
Jordan (47) 5.4 (37) 2.7 (92) 0.5 (75) 4.9 (76) 3.5(103) 4.5(67) 0.2(60) 4.2 (67) NA
Tunisia (50) 5.1 (50) 3.4 (44) 0.8 (68) 4.8 (82) 4.4 (38) 4.8(50) 0.2(65) 4.6 (41) NA
Kuwait (62) 5.4 (39) 2.8 (90) 0.4 (82) 4.7 (91) 3.5(102) 3.6(120) 0.3(55) 3.5(114) 18.7(78)
Egypt (79) 4.7 (78) 2.8 (83) 0.6 (73) 4.6 (96) 3.0(131) 4.2 (86) 0.1(78) 4.1 (74) 30.3(43)
Morocco (91) 4.7 (74) 2.6 (108) 0.6 (74) 4.5 (102) 3.9 (74) 3.8(113) 0.2(64) 3.6(102) 6.8(104)
Lebanon (95) 4.8 (68) 2.6 (106) 0.9 (67) 4.7 (90) 3.6 (98) 3.6(125) 0.4(51) 3.1(128) 31.9(40)
Syria (129) 4.8 (70) 2.1 (134) 0.4 (80) 3.8 (132) 2.6(140) 2.9(139) 0.0(81) 2.7(137) 15.5(90)
Yemen (141) 4.0 (123) 1.5 (142) 0.0 (105) 3.6 (137) 2.9(135) 2.2(142) 0.0(96) 2.6(139) 17.0(86)
Source: WEF, 2012
11
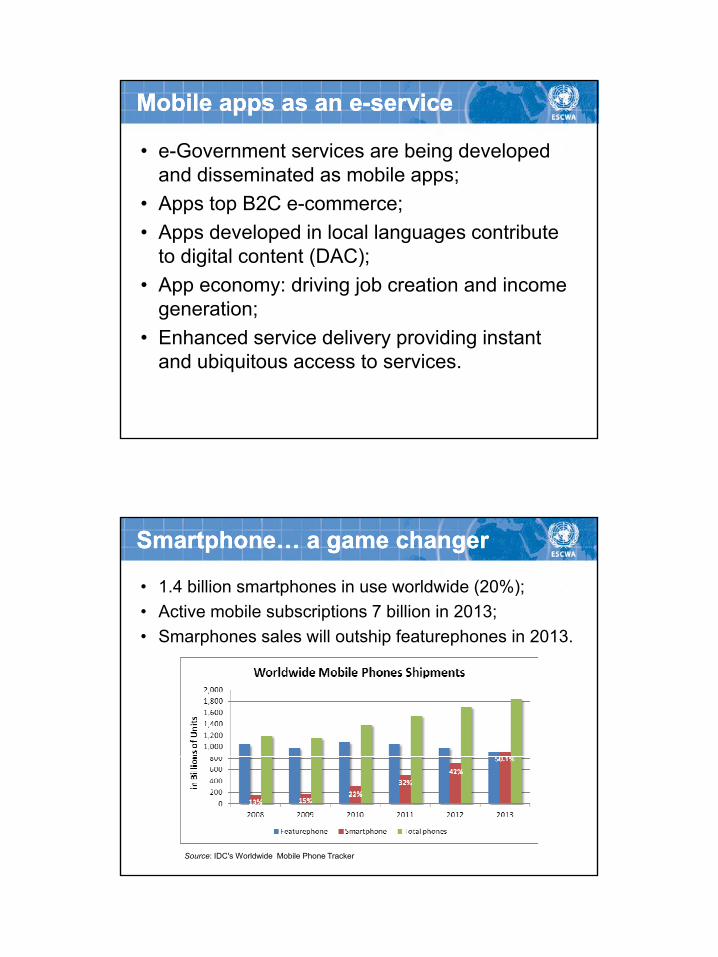
• e-Government services are being developed and disseminated as mobile apps;A t B2C
Mobile apps as an eMobile apps as an e--serviceservice
• Apps top B2C e-commerce;• Apps developed in local languages contribute
to digital content (DAC);• App economy: driving job creation and income
generation;g• Enhanced service delivery providing instant
and ubiquitous access to services.
• 1.4 billion smartphones in use worldwide (20%);• Active mobile subscriptions 7 billion in 2013;• Smarphones sales will outship featurephones in 2013
Smartphone… a game changerSmartphone… a game changer
• Smarphones sales will outship featurephones in 2013.
Source: IDC's Worldwide Mobile Phone Tracker
12
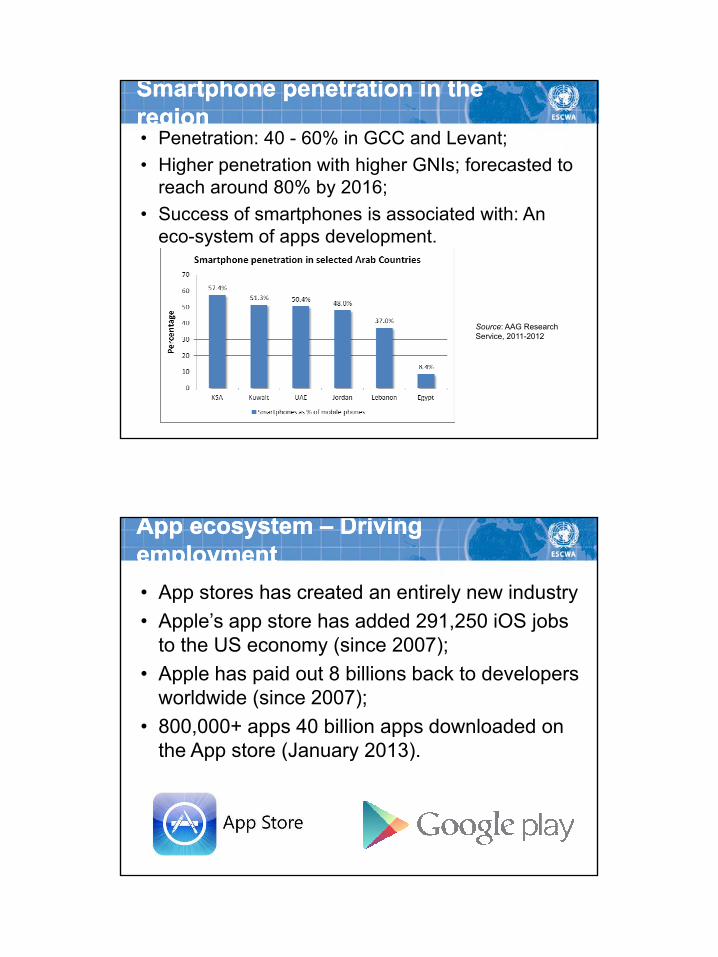
Smartphone penetration in the Smartphone penetration in the regionregion• Penetration: 40 - 60% in GCC and Levant;• Higher penetration with higher GNIs; forecasted to
reach around 80% by 2016;• Success of smartphones is associated with: An
eco-system of apps development.
Source: AAG Research Service, 2011-2012
App ecosystem App ecosystem –– Driving Driving employmentemployment• App stores has created an entirely new industry• Apple’s app store has added 291,250 iOS jobs
to the US economy (since 2007);• Apple has paid out 8 billions back to developers
worldwide (since 2007);• 800,000+ apps 40 billion apps downloaded on
the App store (January 2013).the App store (January 2013).
13
Apps downloaded in the Arab regionApps downloaded in the Arab region
• Social networking apps top the list, followed by games, entertainment, and productivity;
• Few Arabic or local services apps within the• Few Arabic or local services apps within the top 10 lists of Arab countries. (OM Police)
• Top 20 or 50 lists show more local apps and categories such as books, education, and news - a higher potential for local services.
Apps landscape in the regionApps landscape in the region
• The smartphone uptake in the region is at its beginning; early adopters dominated by the well-off and young generation groups;well off and young generation groups;
• A lack of useful apps for public services and, lack of public awareness about them;
• Some e-government portals are offering public services apps mimicking the App store (UAE);
• Usage patterns will likely shift to useful public services and economic activities when the smartphone becomes within the reach of most population groups (vulnerable and low income)
14
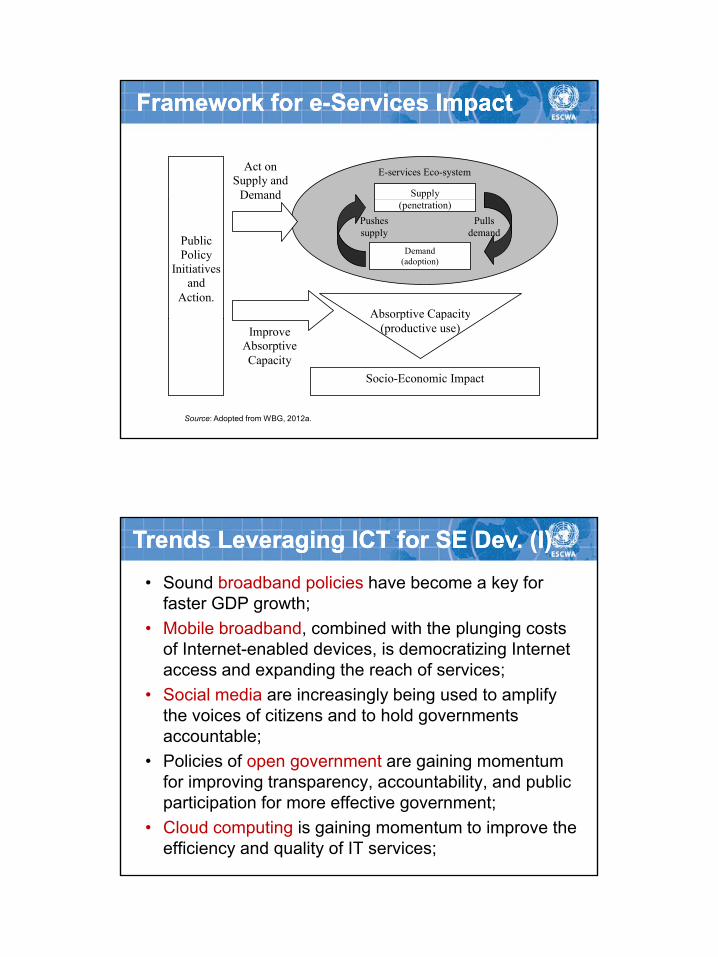
Supply
E-services Eco-system Act on Supply and
Demand
Framework for eFramework for e--Services ImpactServices Impact
Absorptive Capacity
Demand (adoption)
(penetration)Pulls
demand Pushes supply
Public Policy
Initiatives and
Action. p p y
(productive use)
Socio-Economic Impact
Improve Absorptive Capacity
Source: Adopted from WBG, 2012a.
• Sound broadband policies have become a key for faster GDP growth;
• Mobile broadband, combined with the plunging costs
Trends Leveraging ICT for SE Dev. (I)Trends Leveraging ICT for SE Dev. (I)
p g gof Internet-enabled devices, is democratizing Internet access and expanding the reach of services;
• Social media are increasingly being used to amplify the voices of citizens and to hold governments accountable;P li i f t i i t• Policies of open government are gaining momentum for improving transparency, accountability, and public participation for more effective government;
• Cloud computing is gaining momentum to improve the efficiency and quality of IT services;
15
• Using analytics and data mining to understand behaviors and tailor services;
• Crowdsourcing as tools to solve public policy bl
Trends Leveraging ICT for SE Dev. Trends Leveraging ICT for SE Dev. (II)(II)
problems; • Countries at all levels of development are integrating
ICT strategies into their national development strategies;
• Countries are building leadership and institutional capabilities to use ICT to transform their economies;
• ICT are raising demands for new skills to promote competitiveness;
• Redefining trust in the broadband world: information security and privacy;
Source: World Bank Group, ICT Strategy 2012-2015
1. Induce an open and accountable development using ICTs;
Strategic Priorities to improve ICT Strategic Priorities to improve ICT impactimpact
2. Improve public services delivery through an ICT-driven transformation;
3. Promote Innovation in ICT;
Th i iti l d t t P li• These priorities lead to concrete Policy Initiatives aimed at improving the Impact of ICT.
16
• Setting up of an open data portal with a significant amount of accessible and recent public data;
• Providing citizens with capability to enrich and contribute to data provided by the government and
Policy Initiatives (I)Policy Initiatives (I)
contribute to data provided by the government and report on social issues and needs;
• Organizing processes at all level whereby citizens (and also private sector) could become co-creators of public services based on open public data;
• Ensuring that legal and regulatory frameworks are put in place through proper directives for open
t d d t t ti tgovernment, and data protection acts;• Setting up a government CIO function with real
powers and high-level political support;• Setting up a national ICT-driven transformation e-
strategy with timely objectives and implementation plan;
• Setting up sector specific e-strategies for key public services areas aimed at ICT-driven transformation;
• Leveraging PPP for effective service delivery and concretely applying this concept in a significant number of
bli i
Policy Initiatives (II)Policy Initiatives (II)
public services.• Clustering IT-based businesses (for content and
applications) to link SMEs and local research institutions to economic activities.
• Creating capacity-building intermediaries to help entrepreneurs turn business ideas into reality and to modernize and improve companies’ competitiveness through ICTthrough ICT.
• Creating open innovation forums or “Living Labs” to engage start-ups and small firms to evaluate concepts and develop prototypes in real-life settings with real users.
• Provide access to finance through social networks established by entrepreneurs or global systems for pooled citizen (micro) financing.
17
• The above policy initiatives beyond their inherent usefulness to improve impact lend themselves to metrics;Th t i d t i t b t
From Policy Initiatives to MetricsFrom Policy Initiatives to Metrics
• Those metrics do not measure impact per se but are aimed at improving it;
• There is no guaranteed causal effect between action and impact but…
• In the absence of impact metrics even in developed countries it is an approach worth taking as:– It has a marginal cost to the initiatives themselves– It leverages on the proven trends of ICT-driven
transformation and innovation which might likely lead to positive impact results
• Improve data collection in particular for core ICT indicators based on statistical surveys;
• Enlarge data collection efforts beyond the core
Recommendations (I)Recommendations (I)
• Enlarge data collection efforts beyond the core indicators and use, among others, new proposed Indicators as defined for the WSIS targets;
• Build capacity for ICT survey based statistics and improve regional cooperation among countries with sharing of best practices and experience;with sharing of best practices and experience;
• Raise awareness of e-government services and participation level through citizen-driven bottom-up initiatives especially at the local and regional level;
18
• Collect e-commerce data periodically through business surveys, and take concrete initiatives to assist SMEs in embracing e-commerce;
Recommendations (II)Recommendations (II)
• Improve e-commerce adoption by introducing secure e-payment methods, improving efficiency of Postal services through an ICT-driven transformation, and adopting and enforcing proper cyber legislations;
• Encourage the emergence of an app industry, in coordination with DAC development to produce appscoordination with DAC development, to produce apps for government and other public e-services;
• Countries may consider the suggested policy initiatives and start their implementation after taking into consideration their local context and priorities.
• Measuring the impact of e-services on socio-economic development is an endeavour still in its early inception and Arab region is no exception;
Conclusion (I)Conclusion (I)
• There is a growing potential for e-government services as well as e-commerce and use of ICT by businesses (still limited to large enterprises);
• The potential of mobile “apps” is high in a region with a majority of young and relatively well educated population;
• The suggested policy initiatives leverage on recent trends in ICT and the possibility of stirring a bottom-up innovation in e-services from citizens and SMEs;
19
• Some ICT-driven transformation experiences have already taken place in the region but bottom-up innovation is still very limited if inexistent;
Conclusion (II)Conclusion (II)
innovation is still very limited if inexistent;• e-services impact can only be improved if countries
in the region adopt measures aimed at unleashing the transformation and innovation potential of ICT;
• This potential could be enhanced if policymakers unleash the bottom up innovation process byunleash the bottom-up innovation process by citizens and SMEs, regional cooperation, sharing of experiences, and transfer of knowledge is enhanced.
Thank you