Embed Size (px)
Citation preview
Paper ID #14947
Impact of Elementary School Teachers’ Enacted Engineering Design-BasedScience Instruction on Student Learning (Fundamental)
Brenda Capobianco, Purdue University, West Lafayette
Brenda M. Capobianco is Associate Professor in the Department of Curriculum and Instruction, andSchool of Engineering Education (courtesy) at Purdue University. She holds a B.S. in biology from theUniversity of Alaska Fairbanks, M.S. in science education from Connecticut Central State University,and Ed.D. from the University of Massachusetts Amherst. She teaches elementary science methods andgraduate courses in teacher action research and gender and culture in science education. Her researchinterests include girls’ participation in science and engineering; teacher’s engagement in action research;and science teachers’ integration of the engineering design process to improve science learning.
James D. Lehman, Purdue University
Dr. James D. Lehman is a Professor of Learning Design and Technology in the Department of Curriculumand Instruction and the Director of the Discovery Learning Research Center at Purdue University. He ismember of the leadership teams of two current NSF-funded projects, Science Learning through Engineer-ing Design (SLED) and Professional Development for Computer Science (PD4CS). He holds a B.S. andM.S. in biology and a Ph.D. in science education, all from Purdue University. His research interests in-clude integration of computers in education, particularly in STEM disciplines; e-learning; and interactivemultimedia.
Qiming Huang, Purdue University
Qiming Huang is a Ph.D. candidate in the Department of Statistics at Purdue University. He holds aB.S. in Mathematics from the Beijing Institute of Technology, M.S. in Statistics from Purdue University.His research interests include variable selection, dimension reduction, kernel methods, computationaladvertising and statistical application in psychometrics.
Chell Nyquist, Purdue University
Chell Nyquist is the project manager for the Science Learning through Engineering Design (SLED) Part-nership which focuses on improving science achievement among students in grades 3 through 6 in fourpartnering Indiana school corporations. Prior to joining the project, he was the Instructional LaboratoryCoordinator for the First-Year Engineering Program at Purdue University. He was responsible for the co-ordination and administration of two introductory engineering courses involving 1800 students. Nyquistearned his MS in engineering from Purdue University and received BS degrees in Physiology and Bio-engineering from the University of Illinois at Urbana-Champaign.
c©American Society for Engineering Education, 2016
Impact of elementary school teachers’ enacted engineering
design-based science instruction on student learning
Introduction
Engineering design is viewed as a vehicle through which scientific knowledge and real-world
problem-solving skills can be constructed, refined, and enhanced. With the adoption of new
national science standards in the U.S. 1,2 teachers, specifically elementary school teachers, are
faced with the daunting task of learning how to integrate engineering design and, more
importantly, facilitate student learning of science through design. Considerable strides at the
national level have been made to integrate engineering design for inservice elementary science
teachers.3,4,5,6,7 Programs such as the Boston’s Museum of Science’s Engineering is Elementary,
Purdue University’s Science Learning through Engineering Design (SLED) Partnership, The
John Hopkins University’s STEM Achievement in Baltimore Elementary Schools (SABES), and
University of Minnesota’s Engr: TEAMS are grounded in the delivery of high-quality, content-
rich, engineering design-based experiences for inservice elementary science teachers. Results
from the SLED Partnership, for example, show strong proof-of-concept that elementary teachers
can develop deep conceptual knowledge of engineering practices and effectively translate
engineering basics into the classroom environment.3,4 However, how elementary school
teachers’ direct instruction of engineering design impacts student learning of science has yet to
be examined. The purpose of this study was to explore elementary school teachers’ enactments
of engineering design-based science instruction and to assess the impact of their instruction on
students’ science learning.
Research questions
This study was guided by the following research questions: a) How do elementary school
teachers enact engineering design-based science instruction? b) What is the fidelity of teachers’
implementation? c) What knowledge do students learn when engaging in engineering design-
based tasks? and d) To what extent does the fidelity of instruction correlate with students’
science learning?
Theoretical framework
This study is grounded in the theoretical construct of situated learning theory where learners
(teachers and students) become part of a community of practice in which they learn from others
(university STEM faculty, more knowledgeable peers) through an apprenticeship approach and
advance from simple to more complex tasks until becoming full-fledged participants of the
community. Based on Lave and Wenger’s (1991) concept of situated learning, teachers learn
how to utilize and implement new science-teaching practices through experienced teachers (e.g.,
master science teachers or STEM faculty).8 As they continue to attend more professional
development, they become more active in the community. This process where the newcomer
moves from the periphery to the community’s center is known as legitimate peripheral
participation. Through this progression, the newcomers become old-timers. Thus, learning occurs
in social interactions within context, activity, and culture; this concept is known as “situated
learning.” Within situated learning, knowledge is socially distributed. Lave and Wenger (1991)
assert that learning is useless unless it is applied within the context that is intended for.8 The
success of the science teacher depends on his/her social interactions with others within the
community. Therefore, learning takes place within a social setting. This setting is known as a
community of practice, and it offers teachers in situated learning a chance to collaborate with
other community members, which has been found to have a positive influence on teacher and
student learning.9,10
In this study, we utilize the construct of situated learning to paint the landscape of how a
university-school partnership and its related professional development activities fostered a sense
of collaborative learning among elementary school teachers. By immersing fifth and sixth grade
teachers in authentic, ill-structured design problems, STEM faculty helped teachers to learn
firsthand how to utilize design thinking and reasoning as a way of developing their own
understanding of and emerging practice for engineering design-based science instruction.
Simultaneously we leveraged the role of experienced SLED teachers as master teachers to
facilitate engineering design-based science instruction during the summer professional
development and within SLED schools.
As the teachers integrated various curricular activities grounded in the engineering design
process, they merged key science ideas, concepts, and skills with children’s use of everyday
technology (e.g., simple machines at home and in school), children’s ideas of current science
issues and topics (e.g., water conservation and purification), and children’s abilities to work
collaboratively in a social setting modeling the engineer’s workplace. When learning is
composed of authentic tasks, we hypothesize that there is a greater probability of engagement
with the task and also with the information and ideas involved with the tasks.11,12,13 Authentic
engineering learning tasks are more likely to hold the attention and interest of students and lead
to deeper levels of engagement than other similar but more traditional (less authentic) classroom
tasks.14 Students will gain new knowledge over time and will share this knowledge among fellow
community members to form a productive community of practice.
Participants of the study
The context of this study is a large, multi-year university school partnership that includes the
participation of over 200 elementary/intermediate school teachers, 3,000 students, 25 STEM
faculty and educational researchers. For the purpose of this study, a sub-sample of ten individual
cases (five Grade 5 teachers and 180 students, and five Grade 6 teachers and 224 students) were
purposefully selected from the larger population. These cases represented individual classroom
teachers and their students who provided consent, completed all research-related activities, and
implemented a series of similar engineering design-based science tasks over the course of one
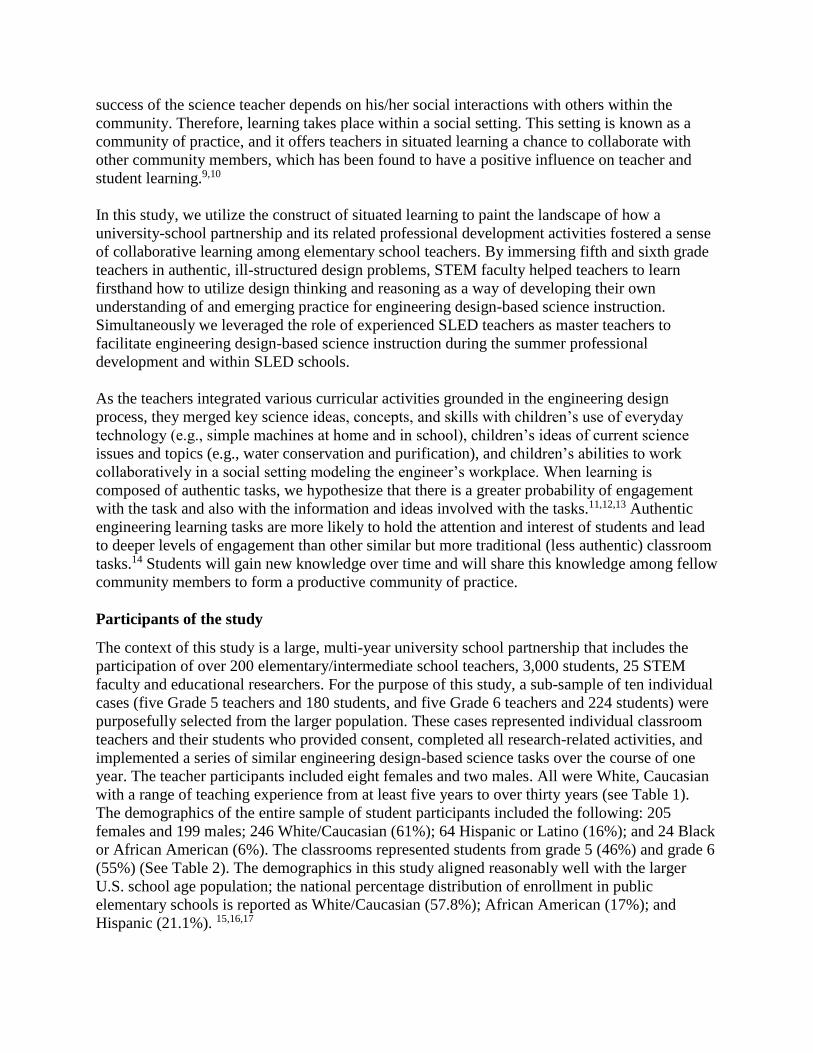
year. The teacher participants included eight females and two males. All were White, Caucasian
with a range of teaching experience from at least five years to over thirty years (see Table 1).
The demographics of the entire sample of student participants included the following: 205
females and 199 males; 246 White/Caucasian (61%); 64 Hispanic or Latino (16%); and 24 Black
or African American (6%). The classrooms represented students from grade 5 (46%) and grade 6
(55%) (See Table 2). The demographics in this study aligned reasonably well with the larger
U.S. school age population; the national percentage distribution of enrollment in public
elementary schools is reported as White/Caucasian (57.8%); African American (17%); and
Hispanic (21.1%). 15,16,17
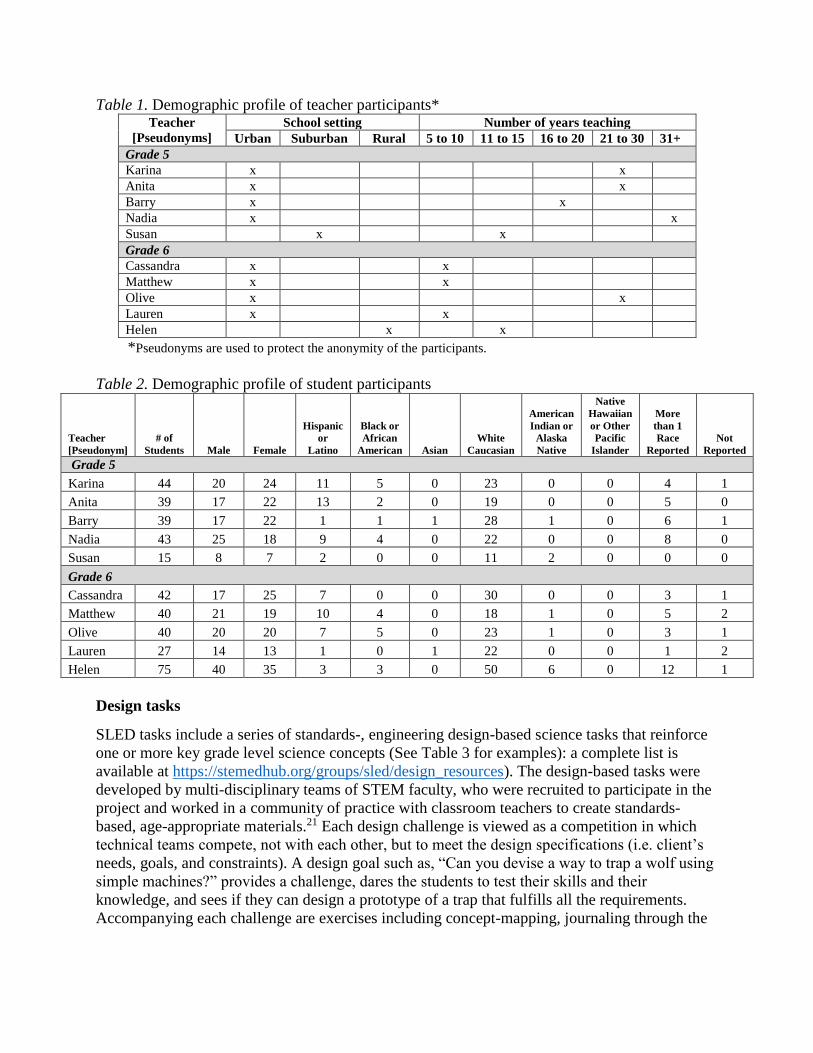
Table 1. Demographic profile of teacher participants* Teacher
[Pseudonyms]
School setting Number of years teaching
Urban Suburban Rural 5 to 10 11 to 15 16 to 20 21 to 30 31+
Grade 5
Karina x x
Anita x x
Barry x x
Nadia x x
Susan x x
Grade 6
Cassandra x x
Matthew x x
Olive x x
Lauren x x
Helen x x
*Pseudonyms are used to protect the anonymity of the participants.
Table 2. Demographic profile of student participants
Teacher
[Pseudonym]
# of
Students Male Female
Hispanic
or
Latino
Black or
African
American Asian
White
Caucasian
American
Indian or
Alaska
Native
Native
Hawaiian
or Other
Pacific
Islander
More
than 1
Race
Reported
Not
Reported
Grade 5
Karina 44 20 24 11 5 0 23 0 0 4 1
Anita 39 17 22 13 2 0 19 0 0 5 0
Barry 39 17 22 1 1 1 28 1 0 6 1
Nadia 43 25 18 9 4 0 22 0 0 8 0
Susan 15 8 7 2 0 0 11 2 0 0 0
Grade 6
Cassandra 42 17 25 7 0 0 30 0 0 3 1
Matthew 40 21 19 10 4 0 18 1 0 5 2
Olive 40 20 20 7 5 0 23 1 0 3 1
Lauren 27 14 13 1 0 1 22 0 0 1 2
Helen 75 40 35 3 3 0 50 6 0 12 1
Design tasks
SLED tasks include a series of standards-, engineering design-based science tasks that reinforce
one or more key grade level science concepts (See Table 3 for examples): a complete list is
available at https://stemedhub.org/groups/sled/design_resources). The design-based tasks were
developed by multi-disciplinary teams of STEM faculty, who were recruited to participate in the
project and worked in a community of practice with classroom teachers to create standards-
based, age-appropriate materials.21 Each design challenge is viewed as a competition in which
technical teams compete, not with each other, but to meet the design specifications (i.e. client’s
needs, goals, and constraints). A design goal such as, “Can you devise a way to trap a wolf using
simple machines?” provides a challenge, dares the students to test their skills and their
knowledge, and sees if they can design a prototype of a trap that fulfills all the requirements.
Accompanying each challenge are exercises including concept-mapping, journaling through the

use of “design notebooks,” and oral reporting – designed to help students construct their personal
meanings.
Table 3. Examples of Grade 5 and 6 SLED design tasks Grade
Level
Task Description Core science concept
5 Prosthetic Limb Design a model of a prosthetic leg for a
young child that can kick a soccer ball.
mass, volume, density,
musculoskeletal system
Water Filter Design a device to remove as much
sediment (dirt) as possible from dirty water
in the shortest amount of time.
weight, volume, properties of
materials
6 Solar Tracker Develop a solar panel system that can be
easily moved to track the sun in the sky
during different times of the day and
different seasons.
inclination of the earth, direct and
indirect light rays, seasons
Roller Coaster Design and construct a roller coaster
model that results in the greatest total loop
diameter at the lowest cost.
potential and kinetic energy
Data collection and analysis
The research team employed a mixed methods approach, collecting quantitative and qualitative
data concurrently throughout the course of the study (Creswell, 2002). What follows is a
description of methods and analytic procedures employed for data gathered among both teacher
and student participants.
Table 4. Overview of data collection methods Research questions Data collection methods
Qualitative Quantitative
How do elementary school teachers enact engineering
design-based science instruction?
Interviews
Classroom Observations
What is the fidelity of teachers’ implementation? SLED Engineering Design-
based Classroom
Observational Rubric
What knowledge do students learn when engaging in
engineering design-based tasks?
Pre-/post-
Knowledge Tests
To what extent does the fidelity of instruction correlate
with students’ science learning?
SLED Engineering Design-
based Classroom
Observational Rubric
Pre-/post-
Knowledge Tests
Teacher participant data
Interviews. Semi-structured interviews (n=20 total) were conducted at the beginning and end of
the school year to identify and characterize teachers’ perceptions of engineering design,
expectations and reflections of task implementation, and challenges they experienced throughout
the year. Analysis and interpretation of teacher interviews involved the use of grounded theory.18
During this process, members of the research team focused on identifying indicators of concepts
and categories that fit the data. Repeatedly appearing categories, concepts, and events helped the
research team construct assertions based on the events leading up to the teachers’ conceptions of
engineering design, plans for integrating engineering design-based tasks, and the actual
implementation of engineering design tasks.
Classroom observations. The aim of classroom observations was to observe and characterize
design-informed pedagogical methods employed by SLED teachers. Initially, members of the
research team conducted informal classroom observations that included open field notes focusing
on the teacher; specifically, his/her instructional practices exhibited during a given lesson. Based
on early field notes and a review of existing classroom observational protocols (e.g., RTOP,
STAMM, and ATI) and science education reform documents, the research team elected to
employ a modified-version of the Inquiring into Science Instruction Observation Protocol
(ISIOP) developed by Minner and DeLisi (2012).20 Members of the research team adapted the
ISIOP protocol to address engineering practices as depicted in the NGSS by adding a series of
engineering design-based instructional codes.4, 19, 20 Examples of codes included PROB/DEF
indicating that the teacher encouraged students to identify the problem statement and essential
features of the design brief; PLAN/IND or PLAN/TEAM indicating individual and team
planning, respectively; and CONSTRUCT and TEST representing the creation and testing of a
design. Observation data were independently coded and the codes were then compared for
agreement. Inter-rater reliability for the observers yielded an inter-reliability of 0.88 for the
observation protocol.
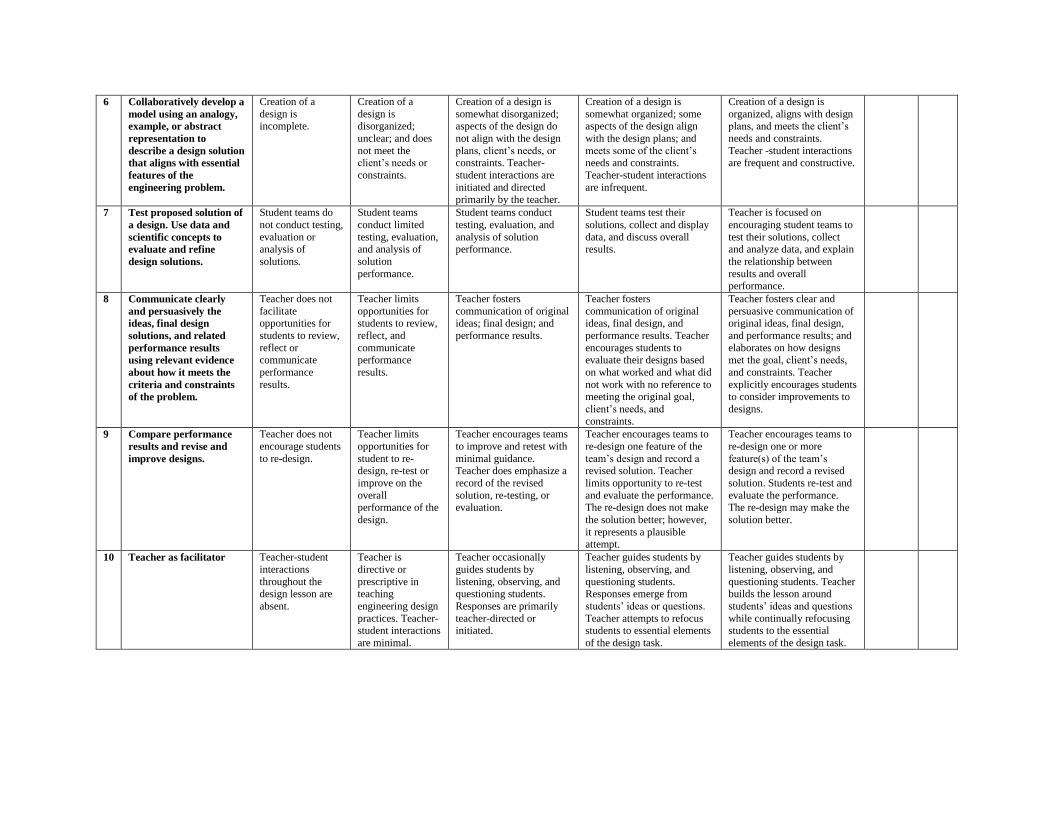
Coded observation data (n=200 hours) were then assessed against an analytical rubric having 10
major categories representing the following: (a) a specific phase within the engineering design
process as depicted in the SLED’s design model and the literature in engineering education, and
(b) one or more NGSS engineering practices (See Appendix A).4 For example, the first phase of
the design process is problem identification which is referred to as problem scoping in
engineering and this phase aligns well with NGSS Practice 1 – Asking questions and defines
features of an engineering problem.1,22 Each category within the rubric consists of five levels of
performance with a 0-, 1-, 2-, 3-, or 4- point value. Four denotes the highest fidelity to the
SLED’s model for engineering design-based instruction (very descriptive), whereas 0 denotes the
lowest, indicating no evidence or occurrence. The mean of each category rather than the total
score was reported in order to highlight the findings. Therefore, a 3 or higher was indicative of
engineering design-based teaching. Thus, a teacher with a high degree of fidelity to the SLED
model would obtain a mean score of 3 or higher, while a teacher with a low degree of fidelity
would obtain a score of 2 or lower.
Student participant data
Students’ development of content knowledge was assessed using identical pre- and post-
instruction tests. The tests, which were developed by the project team, were composed of
multiple-choice items that were designed to probe for different levels of comprehension using
low, medium, and high cognitive demand items covering both science and engineering content.
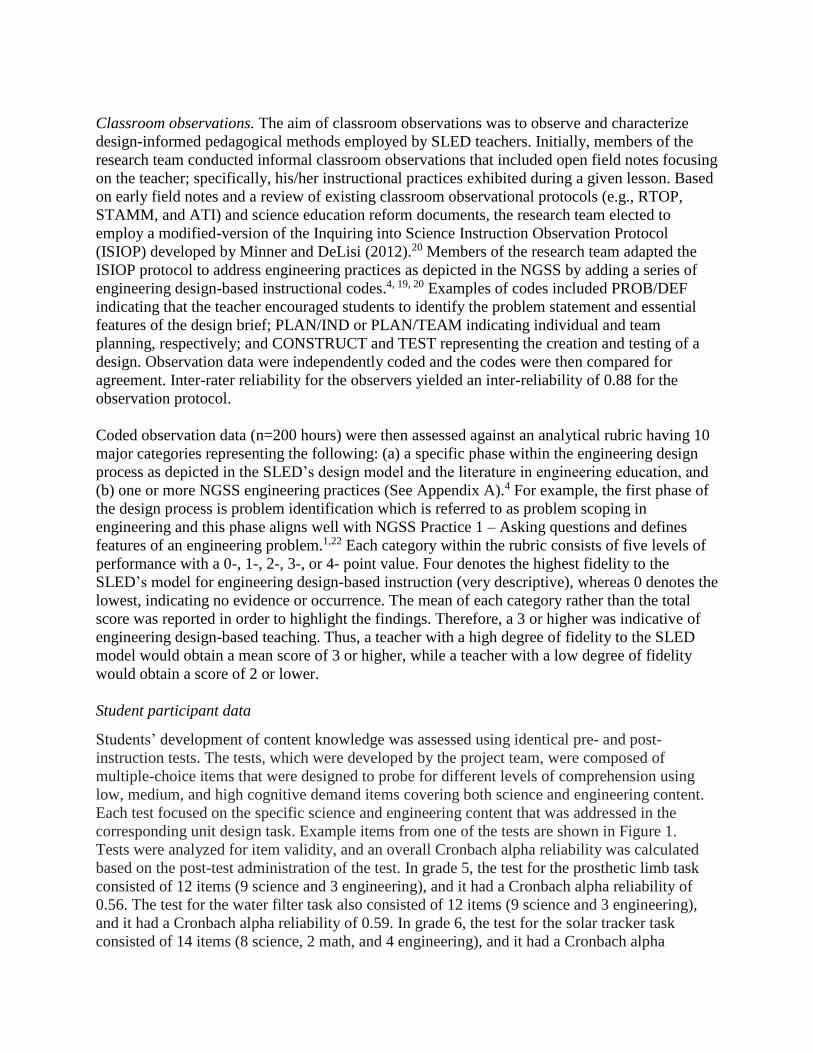
Each test focused on the specific science and engineering content that was addressed in the
corresponding unit design task. Example items from one of the tests are shown in Figure 1.
Tests were analyzed for item validity, and an overall Cronbach alpha reliability was calculated
based on the post-test administration of the test. In grade 5, the test for the prosthetic limb task
consisted of 12 items (9 science and 3 engineering), and it had a Cronbach alpha reliability of
0.56. The test for the water filter task also consisted of 12 items (9 science and 3 engineering),
and it had a Cronbach alpha reliability of 0.59. In grade 6, the test for the solar tracker task
consisted of 14 items (8 science, 2 math, and 4 engineering), and it had a Cronbach alpha
reliability of 0.71. The test for the roller coaster task also consisted of 14 items (11 science and 3
engineering), and it had a Cronbach alpha reliability of 0.68.
The pre-instruction knowledge tests were administered at the beginning of the school year, and
the post-instruction knowledge tests were administered within two weeks of the completion of
the corresponding design task in the participating classrooms. Raw scores were converted to
percentiles, and basic descriptive statistics were calculated for each test by classroom. To
determine if students showed significant knowledge gains from pre-test to post-test, paired
sample t-tests were used to compare the post-test to the pre-test means within and across
teachers. To assess whether there was a relationship between the fidelity of teachers’
implementation of the design-based lessons and student performance on the knowledge tests,
Pearson product moment correlations were calculated between teachers’ mean observational
rubric scores and students’ scores on the corresponding post-test. All statistical analyses were
conducted using SAS 9.4 (SAS Institute, Inc.).
Figure 1. Example test assessment items (Source: SLED Roller Coaster task)
Triangulation
To determine the consistency of our findings from both the teacher and student data sets, we first
reviewed fidelity of implementation results from the teacher’s first and second implementations.
As noted above, we then correlated the teachers’ implementation scores with results from
students’ performance on the post- instruction tests. To confirm emerging patterns in these
correlations, we used teacher interview data and original observation field notes to verify and
validate assertions.
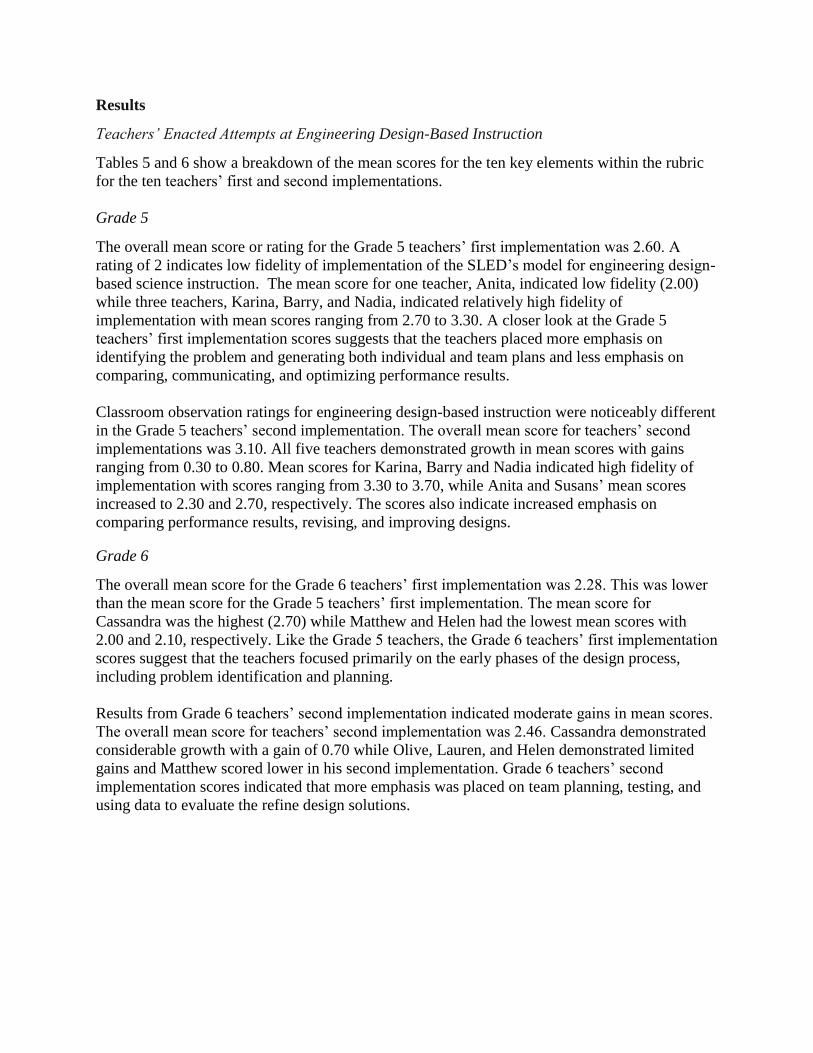
Results
Teachers’ Enacted Attempts at Engineering Design-Based Instruction
Tables 5 and 6 show a breakdown of the mean scores for the ten key elements within the rubric
for the ten teachers’ first and second implementations.
Grade 5
The overall mean score or rating for the Grade 5 teachers’ first implementation was 2.60. A
rating of 2 indicates low fidelity of implementation of the SLED’s model for engineering design-
based science instruction. The mean score for one teacher, Anita, indicated low fidelity (2.00)
while three teachers, Karina, Barry, and Nadia, indicated relatively high fidelity of
implementation with mean scores ranging from 2.70 to 3.30. A closer look at the Grade 5
teachers’ first implementation scores suggests that the teachers placed more emphasis on
identifying the problem and generating both individual and team plans and less emphasis on
comparing, communicating, and optimizing performance results.
Classroom observation ratings for engineering design-based instruction were noticeably different
in the Grade 5 teachers’ second implementation. The overall mean score for teachers’ second
implementations was 3.10. All five teachers demonstrated growth in mean scores with gains
ranging from 0.30 to 0.80. Mean scores for Karina, Barry and Nadia indicated high fidelity of
implementation with scores ranging from 3.30 to 3.70, while Anita and Susans’ mean scores
increased to 2.30 and 2.70, respectively. The scores also indicate increased emphasis on
comparing performance results, revising, and improving designs.
Grade 6
The overall mean score for the Grade 6 teachers’ first implementation was 2.28. This was lower
than the mean score for the Grade 5 teachers’ first implementation. The mean score for
Cassandra was the highest (2.70) while Matthew and Helen had the lowest mean scores with
2.00 and 2.10, respectively. Like the Grade 5 teachers, the Grade 6 teachers’ first implementation
scores suggest that the teachers focused primarily on the early phases of the design process,
including problem identification and planning.
Results from Grade 6 teachers’ second implementation indicated moderate gains in mean scores.
The overall mean score for teachers’ second implementation was 2.46. Cassandra demonstrated
considerable growth with a gain of 0.70 while Olive, Lauren, and Helen demonstrated limited
gains and Matthew scored lower in his second implementation. Grade 6 teachers’ second
implementation scores indicated that more emphasis was placed on team planning, testing, and
using data to evaluate the refine design solutions.
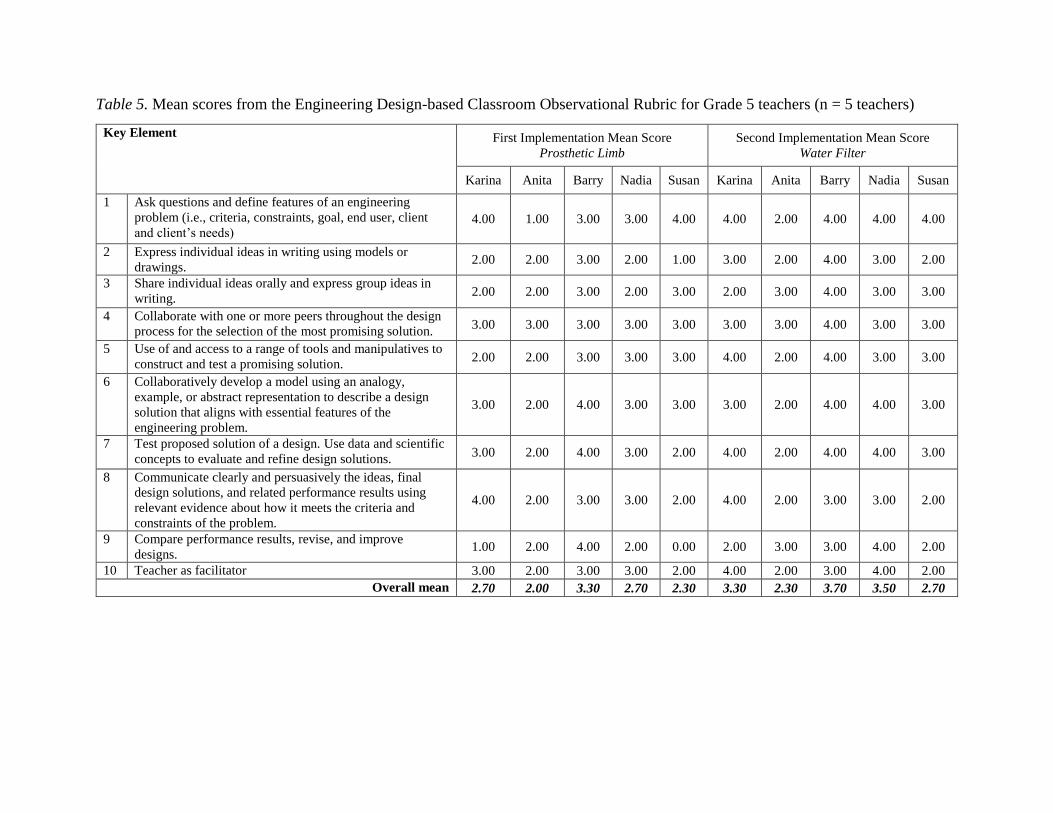
Table 5. Mean scores from the Engineering Design-based Classroom Observational Rubric for Grade 5 teachers (n = 5 teachers)
Key Element First Implementation Mean Score
Prosthetic Limb
Second Implementation Mean Score
Water Filter
Karina Anita Barry Nadia Susan Karina Anita Barry Nadia Susan
1 Ask questions and define features of an engineering
problem (i.e., criteria, constraints, goal, end user, client
and client’s needs) 4.00 1.00 3.00 3.00 4.00 4.00 2.00 4.00 4.00 4.00
2 Express individual ideas in writing using models or
drawings. 2.00 2.00 3.00 2.00 1.00 3.00 2.00 4.00 3.00 2.00
3 Share individual ideas orally and express group ideas in
writing. 2.00 2.00 3.00 2.00 3.00 2.00 3.00 4.00 3.00 3.00
4 Collaborate with one or more peers throughout the design
process for the selection of the most promising solution. 3.00 3.00 3.00 3.00 3.00 3.00 3.00 4.00 3.00 3.00
5 Use of and access to a range of tools and manipulatives to
construct and test a promising solution. 2.00 2.00 3.00 3.00 3.00 4.00 2.00 4.00 3.00 3.00
6 Collaboratively develop a model using an analogy,
example, or abstract representation to describe a design
solution that aligns with essential features of the
engineering problem.
3.00 2.00 4.00 3.00 3.00 3.00 2.00 4.00 4.00 3.00
7 Test proposed solution of a design. Use data and scientific
concepts to evaluate and refine design solutions. 3.00 2.00 4.00 3.00 2.00 4.00 2.00 4.00 4.00 3.00
8 Communicate clearly and persuasively the ideas, final
design solutions, and related performance results using
relevant evidence about how it meets the criteria and
constraints of the problem.
4.00 2.00 3.00 3.00 2.00 4.00 2.00 3.00 3.00 2.00
9 Compare performance results, revise, and improve
designs. 1.00 2.00 4.00 2.00 0.00 2.00 3.00 3.00 4.00 2.00
10 Teacher as facilitator 3.00 2.00 3.00 3.00 2.00 4.00 2.00 3.00 4.00 2.00
Overall mean 2.70 2.00 3.30 2.70 2.30 3.30 2.30 3.70 3.50 2.70
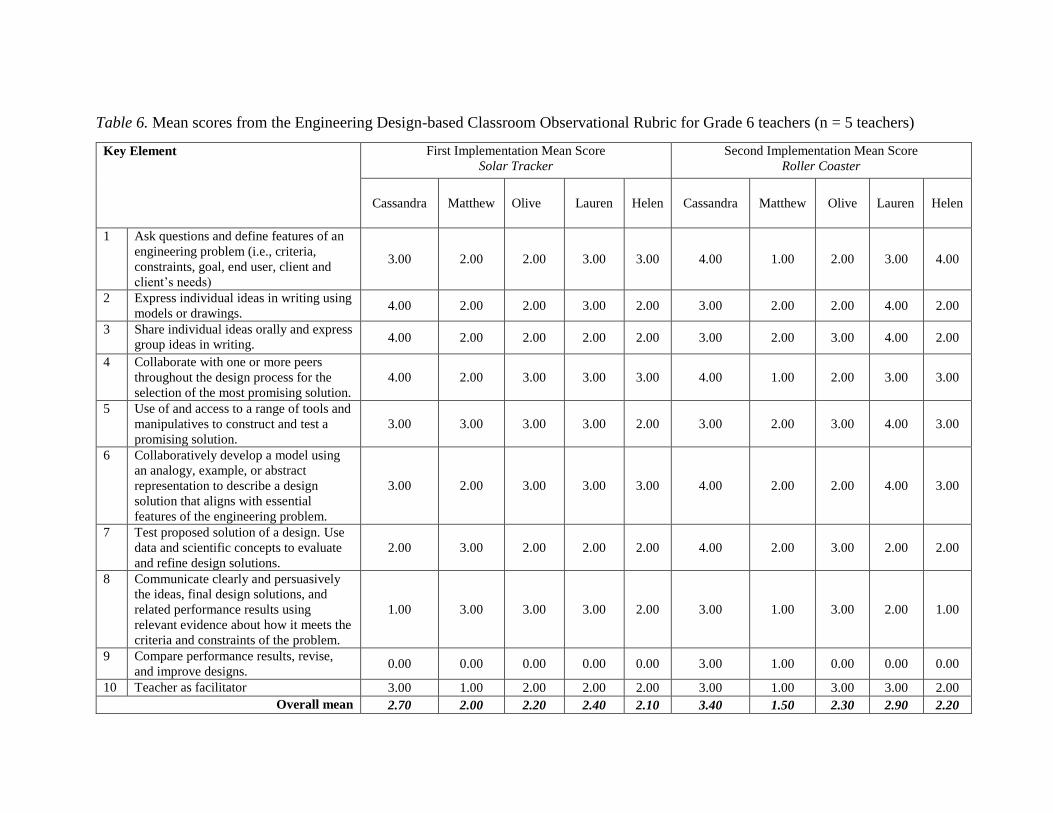
Table 6. Mean scores from the Engineering Design-based Classroom Observational Rubric for Grade 6 teachers (n = 5 teachers)
Key Element First Implementation Mean Score
Solar Tracker
Second Implementation Mean Score
Roller Coaster
Cassandra Matthew Olive Lauren Helen Cassandra Matthew Olive Lauren Helen
1 Ask questions and define features of an
engineering problem (i.e., criteria,
constraints, goal, end user, client and
client’s needs)
3.00 2.00 2.00 3.00 3.00 4.00 1.00 2.00 3.00 4.00
2 Express individual ideas in writing using
models or drawings. 4.00 2.00 2.00 3.00 2.00 3.00 2.00 2.00 4.00 2.00
3 Share individual ideas orally and express
group ideas in writing. 4.00 2.00 2.00 2.00 2.00 3.00 2.00 3.00 4.00 2.00
4 Collaborate with one or more peers
throughout the design process for the
selection of the most promising solution.
4.00 2.00 3.00 3.00 3.00 4.00 1.00 2.00 3.00 3.00
5 Use of and access to a range of tools and
manipulatives to construct and test a
promising solution.
3.00 3.00 3.00 3.00 2.00 3.00 2.00 3.00 4.00 3.00
6 Collaboratively develop a model using
an analogy, example, or abstract
representation to describe a design
solution that aligns with essential
features of the engineering problem.
3.00 2.00 3.00 3.00 3.00 4.00 2.00 2.00 4.00 3.00
7 Test proposed solution of a design. Use
data and scientific concepts to evaluate
and refine design solutions.
2.00 3.00 2.00 2.00 2.00 4.00 2.00 3.00 2.00 2.00
8 Communicate clearly and persuasively
the ideas, final design solutions, and
related performance results using
relevant evidence about how it meets the
criteria and constraints of the problem.
1.00 3.00 3.00 3.00 2.00 3.00 1.00 3.00 2.00 1.00
9 Compare performance results, revise,
and improve designs. 0.00 0.00 0.00 0.00 0.00 3.00 1.00 0.00 0.00 0.00
10 Teacher as facilitator 3.00 1.00 2.00 2.00 2.00 3.00 1.00 3.00 3.00 2.00
Overall mean 2.70 2.00 2.20 2.40 2.10 3.40 1.50 2.30 2.90 2.20
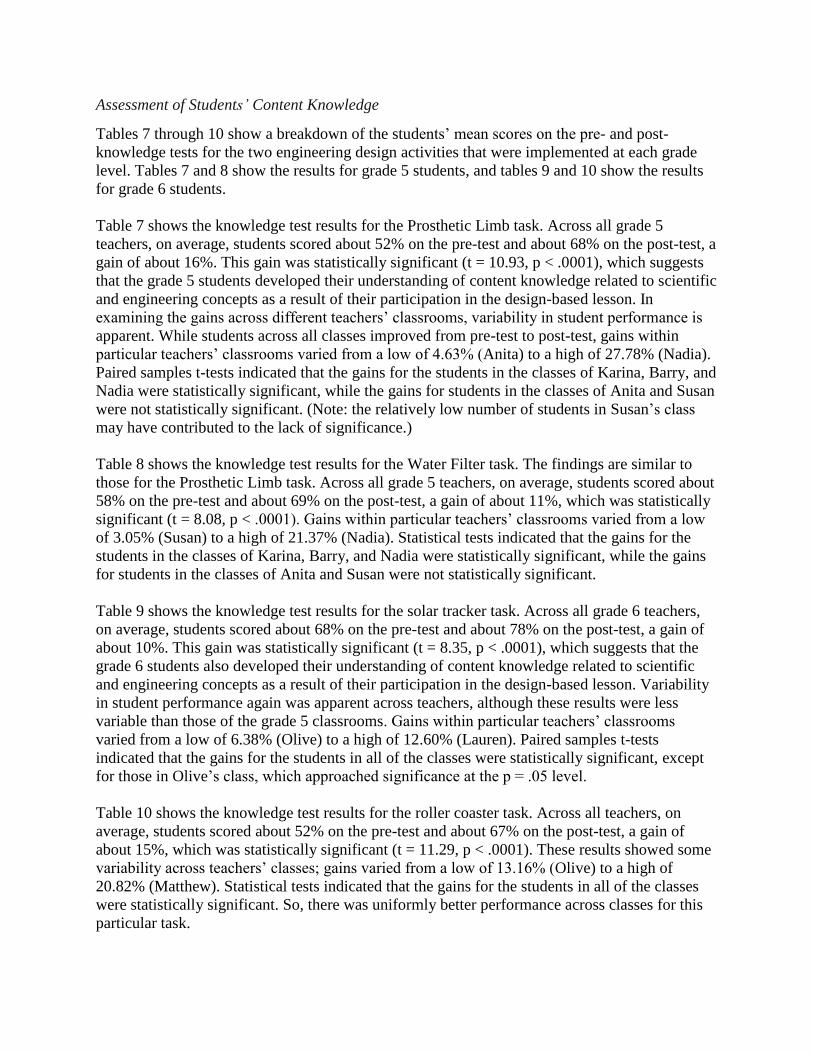
Assessment of Students’ Content Knowledge
Tables 7 through 10 show a breakdown of the students’ mean scores on the pre- and post-
knowledge tests for the two engineering design activities that were implemented at each grade
level. Tables 7 and 8 show the results for grade 5 students, and tables 9 and 10 show the results
for grade 6 students.
Table 7 shows the knowledge test results for the Prosthetic Limb task. Across all grade 5
teachers, on average, students scored about 52% on the pre-test and about 68% on the post-test, a
gain of about 16%. This gain was statistically significant (t = 10.93, p < .0001), which suggests
that the grade 5 students developed their understanding of content knowledge related to scientific
and engineering concepts as a result of their participation in the design-based lesson. In
examining the gains across different teachers’ classrooms, variability in student performance is
apparent. While students across all classes improved from pre-test to post-test, gains within
particular teachers’ classrooms varied from a low of 4.63% (Anita) to a high of 27.78% (Nadia).
Paired samples t-tests indicated that the gains for the students in the classes of Karina, Barry, and
Nadia were statistically significant, while the gains for students in the classes of Anita and Susan
were not statistically significant. (Note: the relatively low number of students in Susan’s class
may have contributed to the lack of significance.)
Table 8 shows the knowledge test results for the Water Filter task. The findings are similar to
those for the Prosthetic Limb task. Across all grade 5 teachers, on average, students scored about
58% on the pre-test and about 69% on the post-test, a gain of about 11%, which was statistically
significant (t = 8.08, p < .0001). Gains within particular teachers’ classrooms varied from a low
of 3.05% (Susan) to a high of 21.37% (Nadia). Statistical tests indicated that the gains for the
students in the classes of Karina, Barry, and Nadia were statistically significant, while the gains
for students in the classes of Anita and Susan were not statistically significant.
Table 9 shows the knowledge test results for the solar tracker task. Across all grade 6 teachers,
on average, students scored about 68% on the pre-test and about 78% on the post-test, a gain of
about 10%. This gain was statistically significant (t = 8.35, p < .0001), which suggests that the
grade 6 students also developed their understanding of content knowledge related to scientific
and engineering concepts as a result of their participation in the design-based lesson. Variability
in student performance again was apparent across teachers, although these results were less
variable than those of the grade 5 classrooms. Gains within particular teachers’ classrooms
varied from a low of 6.38% (Olive) to a high of 12.60% (Lauren). Paired samples t-tests
indicated that the gains for the students in all of the classes were statistically significant, except
for those in Olive’s class, which approached significance at the p = .05 level.
Table 10 shows the knowledge test results for the roller coaster task. Across all teachers, on
average, students scored about 52% on the pre-test and about 67% on the post-test, a gain of
about 15%, which was statistically significant (t = 11.29, p < .0001). These results showed some
variability across teachers’ classes; gains varied from a low of 13.16% (Olive) to a high of
20.82% (Matthew). Statistical tests indicated that the gains for the students in all of the classes
were statistically significant. So, there was uniformly better performance across classes for this
particular task.
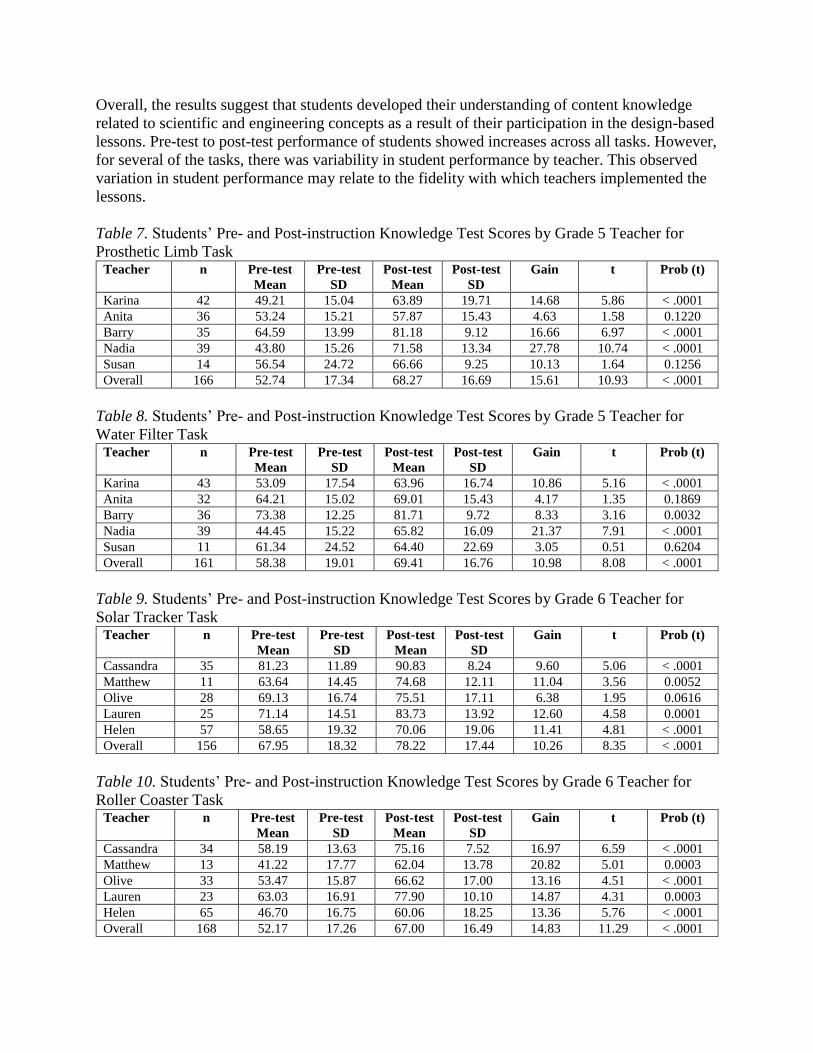
Overall, the results suggest that students developed their understanding of content knowledge
related to scientific and engineering concepts as a result of their participation in the design-based
lessons. Pre-test to post-test performance of students showed increases across all tasks. However,
for several of the tasks, there was variability in student performance by teacher. This observed
variation in student performance may relate to the fidelity with which teachers implemented the
lessons.
Table 7. Students’ Pre- and Post-instruction Knowledge Test Scores by Grade 5 Teacher for
Prosthetic Limb Task Teacher n Pre-test
Mean
Pre-test
SD
Post-test
Mean
Post-test
SD
Gain t Prob (t)
Karina 42 49.21 15.04 63.89 19.71 14.68 5.86 < .0001
Anita 36 53.24 15.21 57.87 15.43 4.63 1.58 0.1220
Barry 35 64.59 13.99 81.18 9.12 16.66 6.97 < .0001
Nadia 39 43.80 15.26 71.58 13.34 27.78 10.74 < .0001
Susan 14 56.54 24.72 66.66 9.25 10.13 1.64 0.1256
Overall 166 52.74 17.34 68.27 16.69 15.61 10.93 < .0001
Table 8. Students’ Pre- and Post-instruction Knowledge Test Scores by Grade 5 Teacher for
Water Filter Task Teacher n Pre-test
Mean
Pre-test
SD
Post-test
Mean
Post-test
SD
Gain t Prob (t)
Karina 43 53.09 17.54 63.96 16.74 10.86 5.16 < .0001
Anita 32 64.21 15.02 69.01 15.43 4.17 1.35 0.1869
Barry 36 73.38 12.25 81.71 9.72 8.33 3.16 0.0032
Nadia 39 44.45 15.22 65.82 16.09 21.37 7.91 < .0001
Susan 11 61.34 24.52 64.40 22.69 3.05 0.51 0.6204
Overall 161 58.38 19.01 69.41 16.76 10.98 8.08 < .0001
Table 9. Students’ Pre- and Post-instruction Knowledge Test Scores by Grade 6 Teacher for
Solar Tracker Task Teacher n Pre-test
Mean
Pre-test
SD
Post-test
Mean
Post-test
SD
Gain t Prob (t)
Cassandra 35 81.23 11.89 90.83 8.24 9.60 5.06 < .0001
Matthew 11 63.64 14.45 74.68 12.11 11.04 3.56 0.0052
Olive 28 69.13 16.74 75.51 17.11 6.38 1.95 0.0616
Lauren 25 71.14 14.51 83.73 13.92 12.60 4.58 0.0001
Helen 57 58.65 19.32 70.06 19.06 11.41 4.81 < .0001
Overall 156 67.95 18.32 78.22 17.44 10.26 8.35 < .0001
Table 10. Students’ Pre- and Post-instruction Knowledge Test Scores by Grade 6 Teacher for
Roller Coaster Task Teacher n Pre-test
Mean
Pre-test
SD
Post-test
Mean
Post-test
SD
Gain t Prob (t)
Cassandra 34 58.19 13.63 75.16 7.52 16.97 6.59 < .0001
Matthew 13 41.22 17.77 62.04 13.78 20.82 5.01 0.0003
Olive 33 53.47 15.87 66.62 17.00 13.16 4.51 < .0001
Lauren 23 63.03 16.91 77.90 10.10 14.87 4.31 0.0003
Helen 65 46.70 16.75 60.06 18.25 13.36 5.76 < .0001
Overall 168 52.17 17.26 67.00 16.49 14.83 11.29 < .0001
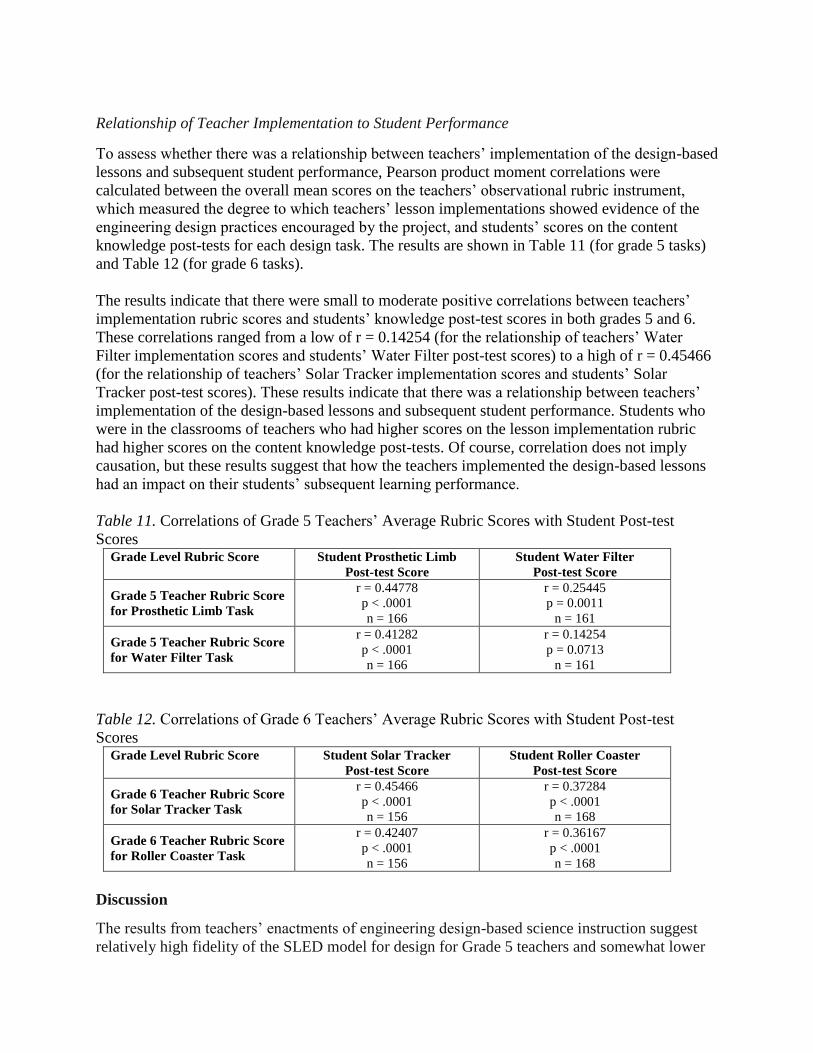
Relationship of Teacher Implementation to Student Performance
To assess whether there was a relationship between teachers’ implementation of the design-based
lessons and subsequent student performance, Pearson product moment correlations were
calculated between the overall mean scores on the teachers’ observational rubric instrument,
which measured the degree to which teachers’ lesson implementations showed evidence of the
engineering design practices encouraged by the project, and students’ scores on the content
knowledge post-tests for each design task. The results are shown in Table 11 (for grade 5 tasks)
and Table 12 (for grade 6 tasks).
The results indicate that there were small to moderate positive correlations between teachers’
implementation rubric scores and students’ knowledge post-test scores in both grades 5 and 6.
These correlations ranged from a low of r = 0.14254 (for the relationship of teachers’ Water
Filter implementation scores and students’ Water Filter post-test scores) to a high of r = 0.45466
(for the relationship of teachers’ Solar Tracker implementation scores and students’ Solar
Tracker post-test scores). These results indicate that there was a relationship between teachers’
implementation of the design-based lessons and subsequent student performance. Students who
were in the classrooms of teachers who had higher scores on the lesson implementation rubric
had higher scores on the content knowledge post-tests. Of course, correlation does not imply
causation, but these results suggest that how the teachers implemented the design-based lessons
had an impact on their students’ subsequent learning performance.
Table 11. Correlations of Grade 5 Teachers’ Average Rubric Scores with Student Post-test
Scores Grade Level Rubric Score Student Prosthetic Limb
Post-test Score
Student Water Filter
Post-test Score
Grade 5 Teacher Rubric Score
for Prosthetic Limb Task
r = 0.44778
p < .0001
n = 166
r = 0.25445
p = 0.0011
n = 161
Grade 5 Teacher Rubric Score
for Water Filter Task
r = 0.41282
p < .0001
n = 166
r = 0.14254
p = 0.0713
n = 161
Table 12. Correlations of Grade 6 Teachers’ Average Rubric Scores with Student Post-test
Scores Grade Level Rubric Score Student Solar Tracker
Post-test Score
Student Roller Coaster
Post-test Score
Grade 6 Teacher Rubric Score
for Solar Tracker Task
r = 0.45466
p < .0001
n = 156
r = 0.37284
p < .0001
n = 168
Grade 6 Teacher Rubric Score
for Roller Coaster Task
r = 0.42407
p < .0001
n = 156
r = 0.36167
p < .0001
n = 168
Discussion
The results from teachers’ enactments of engineering design-based science instruction suggest
relatively high fidelity of the SLED model for design for Grade 5 teachers and somewhat lower
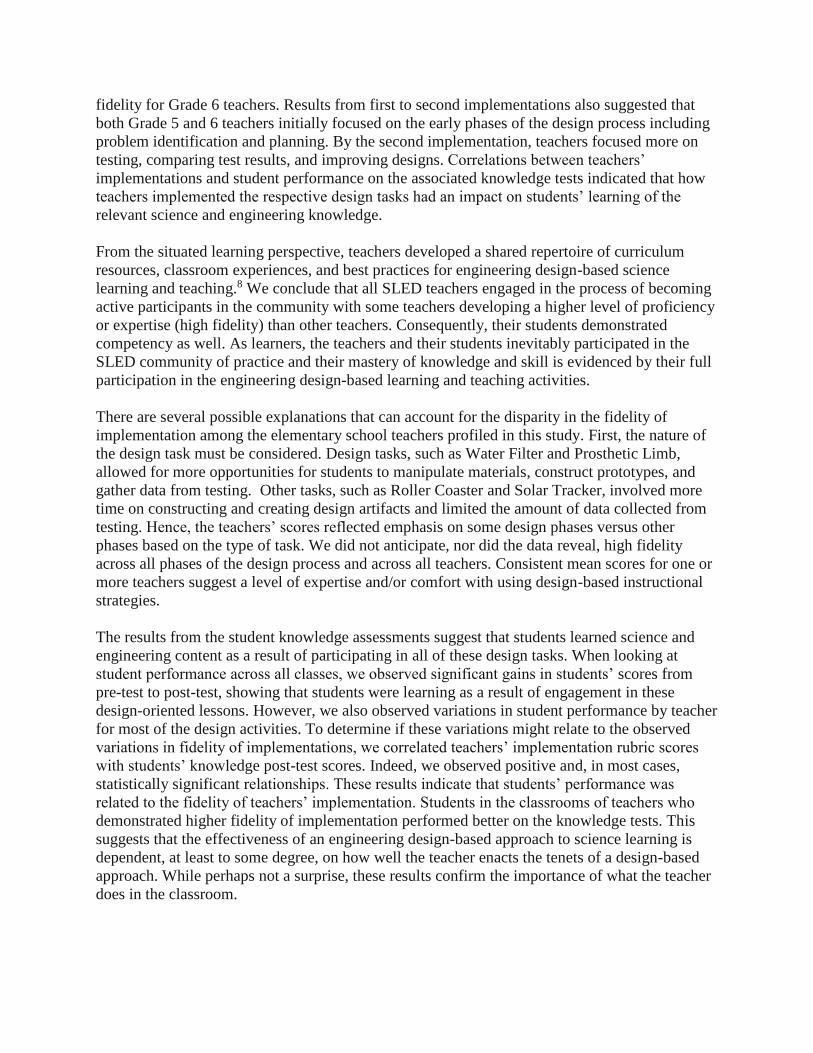
fidelity for Grade 6 teachers. Results from first to second implementations also suggested that
both Grade 5 and 6 teachers initially focused on the early phases of the design process including
problem identification and planning. By the second implementation, teachers focused more on
testing, comparing test results, and improving designs. Correlations between teachers’
implementations and student performance on the associated knowledge tests indicated that how
teachers implemented the respective design tasks had an impact on students’ learning of the
relevant science and engineering knowledge.
From the situated learning perspective, teachers developed a shared repertoire of curriculum
resources, classroom experiences, and best practices for engineering design-based science
learning and teaching.8 We conclude that all SLED teachers engaged in the process of becoming
active participants in the community with some teachers developing a higher level of proficiency
or expertise (high fidelity) than other teachers. Consequently, their students demonstrated
competency as well. As learners, the teachers and their students inevitably participated in the
SLED community of practice and their mastery of knowledge and skill is evidenced by their full
participation in the engineering design-based learning and teaching activities.
There are several possible explanations that can account for the disparity in the fidelity of
implementation among the elementary school teachers profiled in this study. First, the nature of
the design task must be considered. Design tasks, such as Water Filter and Prosthetic Limb,
allowed for more opportunities for students to manipulate materials, construct prototypes, and
gather data from testing. Other tasks, such as Roller Coaster and Solar Tracker, involved more
time on constructing and creating design artifacts and limited the amount of data collected from
testing. Hence, the teachers’ scores reflected emphasis on some design phases versus other
phases based on the type of task. We did not anticipate, nor did the data reveal, high fidelity
across all phases of the design process and across all teachers. Consistent mean scores for one or
more teachers suggest a level of expertise and/or comfort with using design-based instructional
strategies.
The results from the student knowledge assessments suggest that students learned science and
engineering content as a result of participating in all of these design tasks. When looking at
student performance across all classes, we observed significant gains in students’ scores from
pre-test to post-test, showing that students were learning as a result of engagement in these
design-oriented lessons. However, we also observed variations in student performance by teacher
for most of the design activities. To determine if these variations might relate to the observed
variations in fidelity of implementations, we correlated teachers’ implementation rubric scores
with students’ knowledge post-test scores. Indeed, we observed positive and, in most cases,
statistically significant relationships. These results indicate that students’ performance was
related to the fidelity of teachers’ implementation. Students in the classrooms of teachers who
demonstrated higher fidelity of implementation performed better on the knowledge tests. This
suggests that the effectiveness of an engineering design-based approach to science learning is
dependent, at least to some degree, on how well the teacher enacts the tenets of a design-based
approach. While perhaps not a surprise, these results confirm the importance of what the teacher
does in the classroom.
Conclusion and implications
The purpose of this study was to examine teachers’ attempts at integrating engineering design-
based science instruction and the impact their instruction had on students’ learning. Results from
this study suggest that how teachers integrate engineering design-based pedagogies influences
how students’ construct new knowledge.
There are several limitations to this study. One limitation was the design of the study. Missing
from this study was a carefully matched or randomly assigned control group, allowing the
research team to conduct secondary analysis and correlations relative students’ performance on
instructional knowledge tests. Another limitation is the sample size, in particular the class size
across multiple classrooms. The class sizes for the total sample ranged from 15 to 75 students for
each respective teacher. The last limitation includes demographics of the students as learners.
We can only speculate that some of teachers may have had more homogeneous classes than other
teachers’ classrooms or perhaps a higher or lower representation of high performing students.
Implications of this study suggest that there is fertile ground for studying the integration of
engineering practices in the elementary science classroom. Consideration must be given to
strategically examining how elementary school students engage in design and apply core
disciplinary concepts. To what extent do students utilize and connect science concepts to develop
and test their designs and how enduring are these concepts? Attention must also be given to how
teachers orient their existing science teaching practices to engineering design? How do they
mediate their existing teaching strategies with relatively new pedagogies? What does teacher
expertise in engineering design-based science instruction look like and how does this impact
student learning? From these studies we can learn more about the different ways elementary
school teachers and their students engage in and learn from new reform efforts in engineering
education.
References 1 Next Generation Lead States. (2013). Next Generation Science Standards. National Academies Press: Washington
DC. 2 National Research Council. (2012). A framework for K-12 science education: Practices, crosscutting concepts, and
core ideas. Washington, DC: National Academies Press. 3 Capobianco, B., Lehman, J., & Kelley, T. (2015, April). Learning to teach elementary school science through
engineering design. A paper presentation at the American Educational Research Association Annual Meeting,
Chicago, IL. 4 Capobianco, B. M., & Rupp, M. (2014). STEM teachers' planned and enacted attempts at implementing
engineering design-based instruction. School Science and Mathematics, 114(6), 258-270. 5 Sargianis, K., Yang, S., & Cunningham, C. (2012). Effective engineering professional development for elementary
educators. A paper presented at the Annual Meeting for the American Society of Engineering Education, San
Antonio, TX. Retrieved from https://peer.asee.org/effective-engineering-professional-development-for-elementary-
educators 6 Yasar, S., Baker, D., Robinson-Kurpius, S., Krause, S., & Roberts, C. (2006). Development of a survey to assess
K-12 teachers’ perceptions of engineers and familiarity with teaching design, engineering, and technology. Journal
of Engineering Education, 95 (3), 205-216.
7 Yoon, S., Dyehouse, M., Lucietto, Diefes-Dux, H., & Capobianco, B. M. (2014). The effects of integrated science,
technology, and engineering education on elementary students' knowledge and identity development. School Science
and Mathematics, 114 (8), 380-391. 8 Lave, J., & Wenger, E. (1991). Situated learning: Legitimate peripheral participation. Cambridge, England:
Cambridge University Press. 9 Cochran-Smith, M., & Lytle, S. (1999). Relationships of knowledge and practice: Teacher learning in
communities. Review of Research in Education, 24, 249-305. 10 Vescio, V., Ross, D., & Adams, A. (2008). A review of research on the impact of professional learning
communities on teaching practice and student learning. Teaching and Teacher Education, 24, 80-91. 11 Fortus, D., Dershimer, C., Krajcik, J., Marx, R., & Mamlok-Naaman, R. (2004). Design-based science and student
learning. Journal of Research in Science Teaching, 41(10), 1081-1110. 12 Roth, M. W. (1996). Art and artifact of children’s designing: A situated cognition perspective. The Journal of the
Learning Sciences, 5, 61-94. 13 Roth, M. W. (1997). Interactional structures during a Grade 4-5 open-design engineering unit. Journal of
Research in Science Teaching, 34(3), 273-302. 14 Roth, W. M. (1998). Designing communities. Dordecht, The Netherlands. Kluwer. 15 Sable, J., & Noel, A. (2013). Public Elementary and Secondary School Student Enrollment and Staff from the
Common Core of Data: School Year 2012-13 (NCES 2013-305). National Center for Education Statistics, Institute
of Education Sciences, U.S. Department of Education. Washington, DC. 16 U.S. Census Bureau. (2014). School Enrollment--Social and Economic Characteristics of Students: October 2014.
Retrieved December 12, 2015, from the U.S. Census Bureau:
http://www.census.gov/hhes/school/data/cps/2014/tables.html 17 U.S. Department of Education Institute of Education Sciences. (2015). Digest of Education Statistics, 2015.
Retrieved December 12, 2015, from the U.S. Department of Education:
http://nces.ed.gov/programs/digest/2015menu_tables.asp 18 Strauss, A., & Corbin, J. (1998). Basics of Qualitative Research: Techniques and Procedures for Developing
Grounded Theory. Thousand Oaks, CA: Sage. 19DeLisi, J., McNeill, K., & Minner, D. (2011). Illuminating the relationship between inquiry science instruction and
student learning: Results from three case studies. A paper presentation at the annual meeting of the National
Association of Research for Science Teaching. 20 Minner, D., & DeLisi, J. (2010). Inquiring into science instruction observation protocol (ISIOP) Grades 9-12.
Newton, MA: Education Development Center. 21Lehman, J. D., Kim, W., & Harris, C. (2014). Collaborations in a community of practice working to integrate
engineering design in elementary science education. Journal of STEM Education: Innovations and Research, 15(3),
21-28. 22 Atman, C., Adams, R., Cardella, M., Turns, J., Mosborg, S., & Saleem, J. (2007). Engineering design processes: A
comparison of students and expert practitioners. Journal of Engineering Education, 96(4), 359-379.
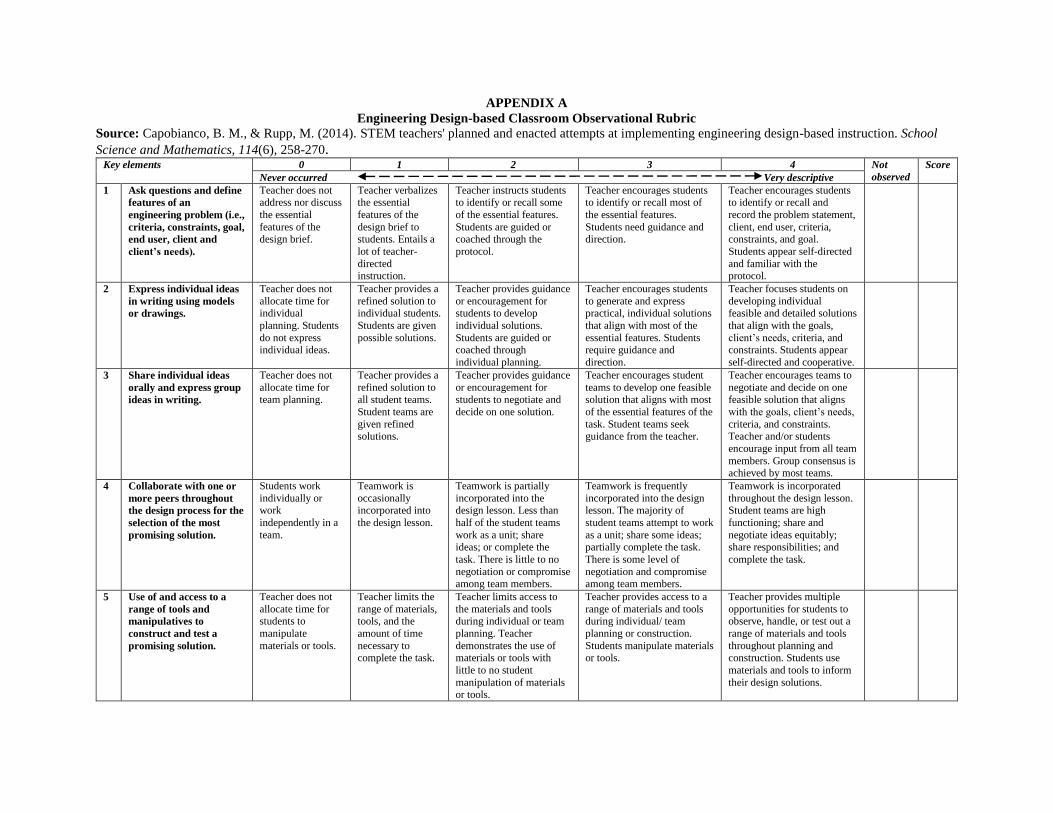
APPENDIX A
Engineering Design-based Classroom Observational Rubric
Source: Capobianco, B. M., & Rupp, M. (2014). STEM teachers' planned and enacted attempts at implementing engineering design-based instruction. School
Science and Mathematics, 114(6), 258-270. Key elements 0 1 2 3 4 Not
observed
Score
Never occurred Very descriptive
1 Ask questions and define
features of an
engineering problem (i.e.,
criteria, constraints, goal,
end user, client and
client’s needs).
Teacher does not address nor discuss
the essential
features of the design brief.
Teacher verbalizes the essential
features of the
design brief to students. Entails a
lot of teacher-
directed instruction.
Teacher instructs students to identify or recall some
of the essential features.
Students are guided or coached through the
protocol.
Teacher encourages students to identify or recall most of
the essential features.
Students need guidance and direction.
Teacher encourages students to identify or recall and
record the problem statement,
client, end user, criteria, constraints, and goal.
Students appear self-directed
and familiar with the protocol.
2 Express individual ideas
in writing using models
or drawings.
Teacher does not
allocate time for individual
planning. Students
do not express individual ideas.
Teacher provides a
refined solution to individual students.
Students are given
possible solutions.
Teacher provides guidance
or encouragement for students to develop
individual solutions.
Students are guided or coached through
individual planning.
Teacher encourages students
to generate and express practical, individual solutions
that align with most of the
essential features. Students require guidance and
direction.
Teacher focuses students on
developing individual feasible and detailed solutions
that align with the goals,
client’s needs, criteria, and constraints. Students appear
self-directed and cooperative.
3 Share individual ideas
orally and express group
ideas in writing.
Teacher does not
allocate time for team planning.
Teacher provides a
refined solution to all student teams.
Student teams are
given refined solutions.
Teacher provides guidance
or encouragement for students to negotiate and
decide on one solution.
Teacher encourages student
teams to develop one feasible solution that aligns with most
of the essential features of the
task. Student teams seek guidance from the teacher.
Teacher encourages teams to
negotiate and decide on one feasible solution that aligns
with the goals, client’s needs,
criteria, and constraints. Teacher and/or students
encourage input from all team
members. Group consensus is achieved by most teams.
4 Collaborate with one or
more peers throughout
the design process for the
selection of the most
promising solution.
Students work
individually or work
independently in a
team.
Teamwork is
occasionally incorporated into
the design lesson.
Teamwork is partially
incorporated into the design lesson. Less than
half of the student teams
work as a unit; share ideas; or complete the
task. There is little to no
negotiation or compromise among team members.
Teamwork is frequently
incorporated into the design lesson. The majority of
student teams attempt to work
as a unit; share some ideas; partially complete the task.
There is some level of
negotiation and compromise among team members.
Teamwork is incorporated
throughout the design lesson. Student teams are high
functioning; share and
negotiate ideas equitably; share responsibilities; and
complete the task.
5 Use of and access to a
range of tools and
manipulatives to
construct and test a
promising solution.
Teacher does not
allocate time for students to
manipulate
materials or tools.
Teacher limits the
range of materials, tools, and the
amount of time
necessary to complete the task.
Teacher limits access to
the materials and tools during individual or team
planning. Teacher
demonstrates the use of materials or tools with
little to no student
manipulation of materials or tools.
Teacher provides access to a
range of materials and tools during individual/ team
planning or construction.
Students manipulate materials or tools.
Teacher provides multiple
opportunities for students to observe, handle, or test out a
range of materials and tools
throughout planning and construction. Students use
materials and tools to inform
their design solutions.
6 Collaboratively develop a
model using an analogy,
example, or abstract
representation to
describe a design solution
that aligns with essential
features of the
engineering problem.
Creation of a
design is incomplete.
Creation of a
design is disorganized;
unclear; and does
not meet the client’s needs or
constraints.
Creation of a design is
somewhat disorganized; aspects of the design do
not align with the design
plans, client’s needs, or constraints. Teacher-
student interactions are
initiated and directed primarily by the teacher.
Creation of a design is
somewhat organized; some aspects of the design align
with the design plans; and
meets some of the client’s needs and constraints.
Teacher-student interactions
are infrequent.
Creation of a design is
organized, aligns with design plans, and meets the client’s
needs and constraints.
Teacher -student interactions are frequent and constructive.
7 Test proposed solution of
a design. Use data and
scientific concepts to
evaluate and refine
design solutions.
Student teams do
not conduct testing,
evaluation or analysis of
solutions.
Student teams
conduct limited
testing, evaluation, and analysis of
solution
performance.
Student teams conduct
testing, evaluation, and
analysis of solution performance.
Student teams test their
solutions, collect and display
data, and discuss overall results.
Teacher is focused on
encouraging student teams to
test their solutions, collect and analyze data, and explain
the relationship between
results and overall performance.
8 Communicate clearly
and persuasively the
ideas, final design
solutions, and related
performance results
using relevant evidence
about how it meets the
criteria and constraints
of the problem.
Teacher does not
facilitate opportunities for
students to review,
reflect or communicate
performance
results.
Teacher limits
opportunities for students to review,
reflect, and
communicate performance
results.
Teacher fosters
communication of original ideas; final design; and
performance results.
Teacher fosters
communication of original ideas, final design, and
performance results. Teacher
encourages students to evaluate their designs based
on what worked and what did
not work with no reference to meeting the original goal,
client’s needs, and
constraints.
Teacher fosters clear and
persuasive communication of original ideas, final design,
and performance results; and
elaborates on how designs met the goal, client’s needs,
and constraints. Teacher
explicitly encourages students to consider improvements to
designs.
9 Compare performance
results and revise and
improve designs.
Teacher does not
encourage students
to re-design.
Teacher limits
opportunities for
student to re-design, re-test or
improve on the
overall performance of the
design.
Teacher encourages teams
to improve and retest with
minimal guidance. Teacher does emphasize a
record of the revised
solution, re-testing, or evaluation.
Teacher encourages teams to
re-design one feature of the
team’s design and record a revised solution. Teacher
limits opportunity to re-test
and evaluate the performance. The re-design does not make
the solution better; however,
it represents a plausible attempt.
Teacher encourages teams to
re-design one or more
feature(s) of the team’s design and record a revised
solution. Students re-test and
evaluate the performance. The re-design may make the
solution better.
10 Teacher as facilitator Teacher-student
interactions
throughout the design lesson are
absent.
Teacher is
directive or
prescriptive in teaching
engineering design
practices. Teacher-student interactions
are minimal.
Teacher occasionally
guides students by
listening, observing, and questioning students.
Responses are primarily
teacher-directed or initiated.
Teacher guides students by
listening, observing, and
questioning students. Responses emerge from
students’ ideas or questions.
Teacher attempts to refocus students to essential elements
of the design task.
Teacher guides students by
listening, observing, and
questioning students. Teacher builds the lesson around
students’ ideas and questions
while continually refocusing students to the essential
elements of the design task.


![Mathematics for elementary teachers 10ed [2013]](https://img.pdfslide.net/doc/110x75/58756d8e1a28abd80a8b682f/mathematics-for-elementary-teachers-10ed-2013.jpg)