Embed Size (px)
Citation preview

International Journal of Smart Grid and Clean Energy
Impact of Energy Storage Systems on the Management of
Fault Current at LV Network with High Penetration of
Distributed Generation
K.N. Bangasha , M.E.A. Farrag
b , A.H. Osman
c
a K.N. Bangash, American University of Sharjah, Sharjah, 26666, UAE
b M.E.A. Farrag, Glasgow Caledonian University, Glasgow, G4 0BA, UK
cA.H. Osman, American University of Sharjah, Sharjah, 26666, UAE
Abstract
Penetration level of renewable energy such as solar and wind power into the grid is sharply increasing worldwide.
This paper investigates the impact of the increasing level of distributed generation (DG) on the distribution network
protection. Studies were commenced to mitigate the effect of small scale embedded generation (SSEG) on the system
fault levels. Residential DG penetration level is modelled on the UK typical low voltage (LV) network considering
the fault level stability limits. Based on penetration level of DG energy storages in the form of battery bank are
determined to charge and discharge according to daily load cycle. Short circuit analysis results are compared with the
UK passive network to investigate the impact of the DG on the short circuit currents at the distribution transformer.
In this study, power flow from the transformer secondary is kept within limits to avoid malfunctioning of relays. The
flow of reverse power in the presence of DG is confined by energy storage elements.
Keywords: DG penetration, distribution network, energy storage batteries, electric vehicles (EVs), fault current,
reverse power flow
1. Introduction
Smart grid has opened the way for communicating grid events and information between utilities and
their customers. This has enabled the use of demand response (DR) programs and distributed energy
resources (DER) assets in effective and efficient way [1]. In the smart grid environment, electric power
generated from renewable DG, such as solar and wind power, can be integrated and coordinated
efficiently with the main utility grid. DG can help support the increased demand for electricity, and may
improve power generation efficiency and network reliability [2]. However, high penetration of DG may
also lead to problems, such as reverse power flow, voltage unbalance, changes in network short circuit
level (SCL) and consequently changes in the setting of existing protection systems, particularly in weak
distribution networks [3]-[4].
During light loading conditions and high DG power generation, the utility may curtail this energy
production to maintain the network stability. This energy curtailment is considered as a waste of energy
[5]. Energy storage is required at LV distribution network to store excessive electric energy generated by
DG and supply power back during low generation times. This allows the system to run on average load
rather than peak load. Energy storage system can also compensate for intermittency of renewable energy.
Winter peak demand on the UK grid is currently around 65 GW, but by 2050 this will increase six-fold as
demand for electric cars and household heating climbs. Energy storage technologies could generate
savings of £10bn a year by 2050 in the UK [6]. ABB has worked with UK Power Networks, which
supplies power to over eight million homes and businesses in the UK, to develop a dynamic energy
storage solution. The installation enables renewable energy generated and also ensures compensation of
the intermittence of wind power, support power quality in the event of a fault and provides dynamic
voltage control in the distribution system [7].
In Germany, solar power can be generated for 0.12 Euro per kWh. In contrast, utilities currently charge
an average of 0.25 Euro for domestic electricity. Solar storage systems can increase on-site consumption
doi: 10.12720/sgce.6.3.195-206
Manuscript received February 5, 2017; revised June 15, 2017.
Corresponding author.; E-mail address: [email protected]
International Journal of Smart Grid and Clean Energy, vol. 6, no. 3, July 2017
by up to 70 %. According to EuPD research survey, almost 90% of solar operators are already thinking
about buying an additional storage system [8].
Small size Lithium ion batteries are available in the range 1–10 kWh. Energy storage integrated with
PV can maximize consumption of solar energy by using electricity stored during off-peak times [9]. The
batteries can be properly charged and discharged to support the frequency when system transfers into
islanding mode. Battery storage are used in [10]-[11] to improve the security of supply for grid connected
PV, curtail overvoltage problem, peak shaving and to improve transient stability. A study to investigate
the interruptions in Europe showed that the storage should ensure a total of 3 hours of autonomy for the
users, which will allow the system to cover 90% of the interruptions [12]. During a fault period, DG along
with storage devices connected to the grid can reduce the drop in terminal voltage and the deviation in
rotor speed, which can definitely enhance the transient stability of the system [12]. In [13] batteries are
used for frequency and voltage control of microgrid. A controller is developed for a CIGRE LV network
using DG, Static Compensator (STATCOM) and Battery Storage System (BSS). A controller is designed
to control the battery charge/discharge rate and the reactive power flow through the lines in order to
improve the power factor [14]. A strategy to shave the peak demand and mitigate the voltage unbalance
of the electrical networks using a BSS is developed in [15].
This work investigates the high penetration level of DG and its impacts on fault current contribution
and protective relays malfunction. Energy storage batteries are used to confine the flow of short circuit
current contributed by DG. The rest of the paper is organized as follows. Section 2 explains the problems
related to protective device coordination in systems with high penetration level of DG. Section 3 presents
the modelling of DG penetration level based on capacity of distribution transformer. Section 4 shows the
simulation results on fault analysis with DG, EVs and energy storage batteries. Section 5 concludes the
paper.
2. System Fundamentals
In conventional radial distribution systems power flows in one direction from source to load.
Protection devices are placed on feeders to detect faults and protect system equipment. The ordinary type
of protection devices are thermo-magnetic switches, moulded-case circuit breakers (MCCBs), fuses, and
over-current relays. Amongst these types, over-current relay is the most common protection device used
to counteract abnormal currents in power systems [16]. Each protection device has to cover prescribed
zone. In highly reliable network, coordination between protections devices are established to only isolate
faulty zone and maintain healthy parts energized [17].
Fuses installed at the main feeder or lateral feeders in distribution networks operate when the fault
current heats up and melts the fuse link. Time current characteristic (TCC) curves are used to describe the
fuse link melting time. Fuses are used in conjunction with automatic reclosers to prevent damage during
the event of a temporary fault and the extended time period of fault outages [18]-[19].
The advent of DG in conventional radial configurations causes a number of problems with the
protective devices coordination. In radial systems, overcurrent protection is designed on the assumption
that the fault current flows in one direction only, from the utility to the load. This assumption is no longer
valid if DG is embedded in the network. In addition, the presence of DG in a network changes the short
circuit level [20].
The type of DG connected to the system affect the short circuit level. The synchronous generator is the
highest fault current contributor. Inverter interfaced DG type has the least amount of fault current
contribution due to the controller limiters [21]. According to G83/2 standards [22]-[23] DG must remain
connected for 0.5 sec when the measured phase-phase voltage is less than 80% of the nominal value, and
must remain connected (or “ride-through”) for duration of 2.5s when the measured voltage constrained
between 80% and 87% of the nominal value. Reliability of power network can be increased if DG is
configured to support back up islands during upstream utility source outages.
In distribution networks fuses are coordinated with recloser. This coordination is required in order to
be able to save the fuse from blowing out in case of temporary faults. The purpose is to reduce power
196

K.N.Bangash et al.: Impact of Energy Storage Systems on the Management of Fault Current at LV Network with High…. 197
outages as it is not required to interrupt the system during temporary faults due to the fact that these faults
are considered to be around 70% to 80% of the total faults. Fig. 1 shows an example of a part of a
distribution network involving recloser and fuse with DG [24].
The radial distribution feeder is fundamentally passive so protective devices normally activate on
steady state fault current. However, when DG is added to the feeder lateral, generation is closer to the
load so less real power is required by the substation to provide the total real power demand. The power
supply to meet demand is now the combination of power from substation PSUB and the power supplied
from the DG (PDG) given in eq. 1 and 2.
∑(Pload + Plosses) = Pdemand (1)
∑(PDG + PSUB) = Psupply (2)
Fig. 1. Network with embedded generation
The penetration of DG in the network will change the power characteristics of the network,
contributing to fault currents which increase the fault current values and may cause failure of fuse–
recloser coordination. In Fig. 1, the fault current flowing through the recloser is only contributed by the
substation (source), whilst the fault current flowing through the fuse is a sum of the currents from the DG
and the substation. The increase in the fault current flowing through the fuse could be sufficient to initiate
the blowing of the fuse before the recloser operation.
In future active distribution systems, the type of protection depends on the situation of the DG and its
location in the network as the penetration of DG can change the configuration of the network. Protection
systems can fail by unnecessarily removing a non-faulty component (mal-trip) or failure to remove a
faulty component (fail-to-trip). In case of mal trip, a protection device detects the fault while it is outside
its protection zone and trips unnecessarily. Fig. 2-a, shows this type of failure occurs when the DG feeds
an upstream fault. Circuit breaker CB2 is the protection device that should trip whenever a fault occurs on
feeder 2. However, CB1 at feeder 1 may trip unnecessarily due to the fault current contributed to the fault
from the DG. Therefore, the reliability of the distribution network is reduced [25]. In contrast, CB1 may
fail to trip for a downstream fault if a DG is connected as shown in Fig. 2-b [26]. The presence of DG
results in the reduction of the fault current contribution from the feeder and therefore, the fault may not be
cleared by CB1 [27]-[28].
Fig. 2. Mal trip of feeder 1 during upstream fault (left) and fail to trip during down-stream fault (right) [23]

International Journal of Smart Grid and Clean Energy, vol. 6, no. 3, July 2017
3. Modelling Of DG Penetration Level Based on Capacity of Distribution Transformer
In this paper, typical UK distribution network model discussed in [29] is used with penetration mainly
from wind power and Photovoltaic (PV) generations. Typical summer home load profile is used with roof
top PV (3 kW output power) at a bright sunny day of UK as shown in Fig. 3 [30]. Wind power generation
data pattern is gathered from the weather station installed at roof top of Glasgow Caledonian University
campus.
Fig. 3. Home Load Profile, PV and Wind production for 24 hour period (summer season) in Percentage
It can be seen that there is a time shift between peak load demand and maximum capability of
renewable generations. This behavior is considered in the modelling of DG penetration level addressed in
this research.
In this research, percentage penetration level of DG is prepared with reference to 11/0.4 kV, 500 kVA
distribution transformer rating. Penetration levels of DGs are analysed to measure the fault current. Two
cases are presented below to evaluate penetration levels of DGs.
3.1.Case 1:Total of 30% DG Penetration Level, 13% from wind turbines and 17% from PV panels at the
secondary side of transformer
Individual penetration level percentage of wind turbines, PV panels and total DG percentage level with
respect to the 500 kVA transformer rating is analysed as shown in Fig. 4. It shows that there are
opportunities to install more wind power so that the total percentage level of DG penetration can
compensate for the load demand, particularly nearer the peak time.
Fig. 4. % DG Penetration Level (13% Wind, 17% PV)
Fig. 5 represents total power flow from transformer after adding DG. In the middle of the day between
13 and 15 Hrs with 30 % DG power production, minor amount of reverse power is flowing at the
transformer. The impact of this on the network operation particularly during the fault is discussed in
Section 4.
198

K.N.Bangash et al.: Impact of Energy Storage Systems on the Management of Fault Current at LV Network with High…. 199
Fig. 5. Total Power flow from 500 kVA Transformer for 30% Penetration
3.2.Case 2:Total 103% DG penetration Level, 78% from wind turbines and 25% from PV panels at the
secondary side of the transformer
Percentage DG penetration level at both ends of the day has enhanced from 5% to more than 30%. At
mid-day, it has touched 103% of the transformer capacity as shown in Fig. 6. These curves also indicate
how the type of DG changes the total penetration level over the day. Utility companies can encourage
customers to install wind turbines at residential places (LV side) so that DG penetration level is increased
at both end of the day. High penetration level at mid-day can be shaved by charging and discharging
batteries during off-peak/peak hours [31].
Fig. 6. % DG Penetration Level (78% Wind, 25% PV)
With high penetration level of DGs reverse power flow will increase and reach its maximum level at
the middle of the day as shown in Fig. 7. High amount of reverse power will impose significant technical
barriers for the efficient and effective operation of existing distribution system protection. Increased fault
current contribution from the DG will affect existing protective relaying scheme.
-400
-300
-200
-100
0
100
1 3 5 7 9 11 13 15 17 19 21 23 25
Po
we
r in
kW
Time (hr)
Total Power F low
from T/F
Fig. 7. Total Power flow from 500 kVA Transformer for 103% Penetration
International Journal of Smart Grid and Clean Energy, vol. 6, no. 3, July 2017
4. Simulation Results
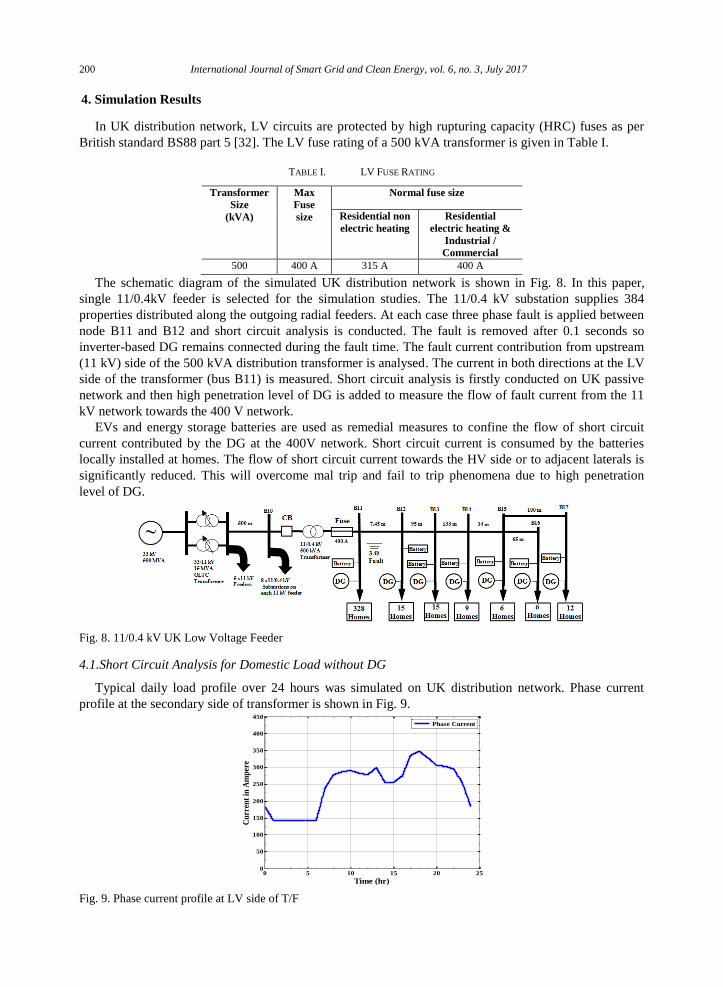
In UK distribution network, LV circuits are protected by high rupturing capacity (HRC) fuses as per
British standard BS88 part 5 [32]. The LV fuse rating of a 500 kVA transformer is given in Table I.
TABLE I. LV FUSE RATING
Transformer
Size
(kVA)
Max
Fuse
size
Normal fuse size
Residential non
electric heating
Residential
electric heating &
Industrial /
Commercial
500 400 A 315 A 400 A
The schematic diagram of the simulated UK distribution network is shown in Fig. 8. In this paper,
single 11/0.4kV feeder is selected for the simulation studies. The 11/0.4 kV substation supplies 384
properties distributed along the outgoing radial feeders. At each case three phase fault is applied between
node B11 and B12 and short circuit analysis is conducted. The fault is removed after 0.1 seconds so
inverter-based DG remains connected during the fault time. The fault current contribution from upstream
(11 kV) side of the 500 kVA distribution transformer is analysed. The current in both directions at the LV
side of the transformer (bus B11) is measured. Short circuit analysis is firstly conducted on UK passive
network and then high penetration level of DG is added to measure the flow of fault current from the 11
kV network towards the 400 V network.
EVs and energy storage batteries are used as remedial measures to confine the flow of short circuit
current contributed by the DG at the 400V network. Short circuit current is consumed by the batteries
locally installed at homes. The flow of short circuit current towards the HV side or to adjacent laterals is
significantly reduced. This will overcome mal trip and fail to trip phenomena due to high penetration
level of DG.
Fig. 8. 11/0.4 kV UK Low Voltage Feeder
4.1.Short Circuit Analysis for Domestic Load without DG
Typical daily load profile over 24 hours was simulated on UK distribution network. Phase current
profile at the secondary side of transformer is shown in Fig. 9.
0 5 10 15 20 250
50
100
150
200
250
300
350
400
450
Time (hr)
Cu
rren
t in
Am
per
e
Phase Current
Fig. 9. Phase current profile at LV side of T/F
200

K.N.Bangash et al.: Impact of Energy Storage Systems on the Management of Fault Current at LV Network with High…. 201
Three phase short circuit fault is applied at 5:00 am and cleared after 0.1sec. This is the time when
minimum current is flowing towards residential properties. Fault current of 460 Amps is contributed by
the substation as shown in Fig. 10. This will lead to relay pick up and the circuit breaker would trip before
fuse is blown up.
4.6 5 5.1 5.40
50
100
150
200
250
300
350
400
450
500
550
600
Time
Cu
rren
t in
Am
per
e
Phase Current
Pre-Fault Current Post-Fault Current
Maximum Current Setting
During-Fault Current
Fig. 10. Fault Current Contributed by the Substation
4.2.Short circuit Analysis with 78% Wind and 25% PV
High penetration level of DG injects power into the grid. High reverse power supply to 11 kV network
may exceed the pickup current of the relays. This would trip the CB as signaled by over current relay.
Hence, at high penetration level of DG, rating of fuses and settings of CB may be required to update.
Moreover, there could be a false operation of over current protection system which is designed for uni-
directional power flow. To mitigate false current operation of relay due to reverse power flow, relay
settings would be updated based on the maximum bi–directional current to ensure correct operation time
faults [33].
Due to rise of voltage, DG owners are discouraged to drive their plants at full capacity [34]. In the
German grid, only 70% of the 22 GW solar is paid through feed-in-tariff for plants smaller than 30kW.
Moreover, if the high reverse current from LV feeder to medium voltage feeder is not tackled properly
residential DG owners would be forced to drive their units at low capacity.
Current profile of the transformer with DGs is shown in Fig. 11. At maximum DG penetration level i.e.
mid-day, the reverse current reaches 550 Amps which is much higher than the rating of the fuse. Though
this is not a fault but relay would pick up signal and trip the CB. The settings of the relays and rating of
fuses need to be updated.
0 5 10 15 20 25-600
-500
-400
-300
-200
-100
0
100
200
Time (hr)
Cu
rren
t in
Am
per
e
Phase Current
Maximum Current Settting
Fig. 11. Phase Current Profile at LV side of the Transformer with DGs
To evaluate the current contribution to the fault from the transformer, fault is applied at hour 14:00 for
0.1 sec as shown in the Fig. 12. The reverse current is reduced from 550 Amps to around 320 Amps. In
this case, DG would contribute to the upstream fault which results in the decrease of the transformer side
current and the relay would be unable to detect the fault.

International Journal of Smart Grid and Clean Energy, vol. 6, no. 3, July 2017
13.5 14 14.1 14.5-650
-600
-550
-500
-450
-400
-350
-300
-250
-200
Time
Cu
rren
t in
Am
per
e
Phase Current
Post-Fault CurrentPre-Fault Current
During-Fault Current
Maximum Current Setting
Fig. 12. Fault Current Contributed by the Substation
With high penetration level of DGs there is a possibility that relay may count high current as a fault,
while fault current that is less than the relay settings would be counted as normal current. In below
simulations, EVs and energy storage batteries are used to compensate the reverse power produced by DG.
4.3.Short circuit Analysis with 78% Wind, 25% PV and 39 % EVs
In the grid-to-vehicle (G2V) mode, EVs can operate as mobile active loads that increase the demand
on the network during charging and as generators during discharging when operating in the vehicle-to-
grid (V2G) mode. Standard 3 kW domestic chargers are used for 6 hours in this work [35]-[36]. 60 EVs
are charged one after the other except during the morning times at which the vehicles are leaving to
offices and during the evening peak hours. During the 24 hrs load cycle, around 220-240 EVs are charged
throughout the day. Fig. 13 shows the pattern of daily power consumption by EVs.
Fig. 13. Load profile of 60 EVs
EVs acting as active load would reduce the reverse power flow towards 11 kV network via transformer.
The phase current is shown in Fig. 14. With EVs current at both ends of the days is flowing from 11 kV
to 400 V network and reverse current is reduced as compare to Fig. 11.
0 5 10 15 20 25-550
-500
-450
-400
-350
-300
-250
-200
-150
-100
-50
0
50
100
150
200
250
300
350
400
450
Time (hr)
Cu
rren
t in
Am
per
e
Phase CurrentMaximum Current Setting
Maximum Current Setting
Fig. 14. Phase Current Profile at LV side of T/F with DGs and EVs
202

K.N.Bangash et al.: Impact of Energy Storage Systems on the Management of Fault Current at LV Network with High…. 203
The phase current in reverse direction has exceeded the limit at 16:00 hrs. Relay will count this as a
fault and open the circuit breaker. Fault is applied at hour 16:00 and cleared in 0.1 second as shown in the
Fig. 15. As a result of the charging process the fault current is less than -250 A. Relay would be unable to
distinguish between normal and fault current.
15.6 16 16.1 16.5-550
-500
-450
-400
-350
-300
-250
-200
-150
-100
-50
0
Time
Cu
rren
t in
Am
per
e
Phase Current
During-Fault Current
Post-Fault CurrentMaximum Current Setting
Pre-Fault Current
Fig. 15. Fault Current contributed by the Substation
Grid connected wind and solar with storage batteries would reduce flow of reverse power and current.
Compared to Fig. 12, the impacts of storage element is to reduce the short circuit current.
1.1. Impact of standalone Energy Storage Batteries on reverse Power flow
In this simulation 200 batteries with rating of 1kW are distributed among 384 properties. In daily load
cycle, batteries are required to charge when reverse power flow and discharge during both ends of the day
i.e. from 00:00 to 08:00 hrs and 20:00 to 24:00 hrs. Fig. 16 shows power produced and consumed by the
batteries during the charging and discharging cycle in 24 hrs.
Fig. 16. Power Consumed and Produced by the Batteries during Charging and Discharging Period
It is obvious that high production of power is required in mid-day to charge the batteries and less
power generation at both ends of the day to discharge batteries. To achieve this, wind penetration level
has to decrease and the PV penetration level has to increase. This will also allow the power to flow
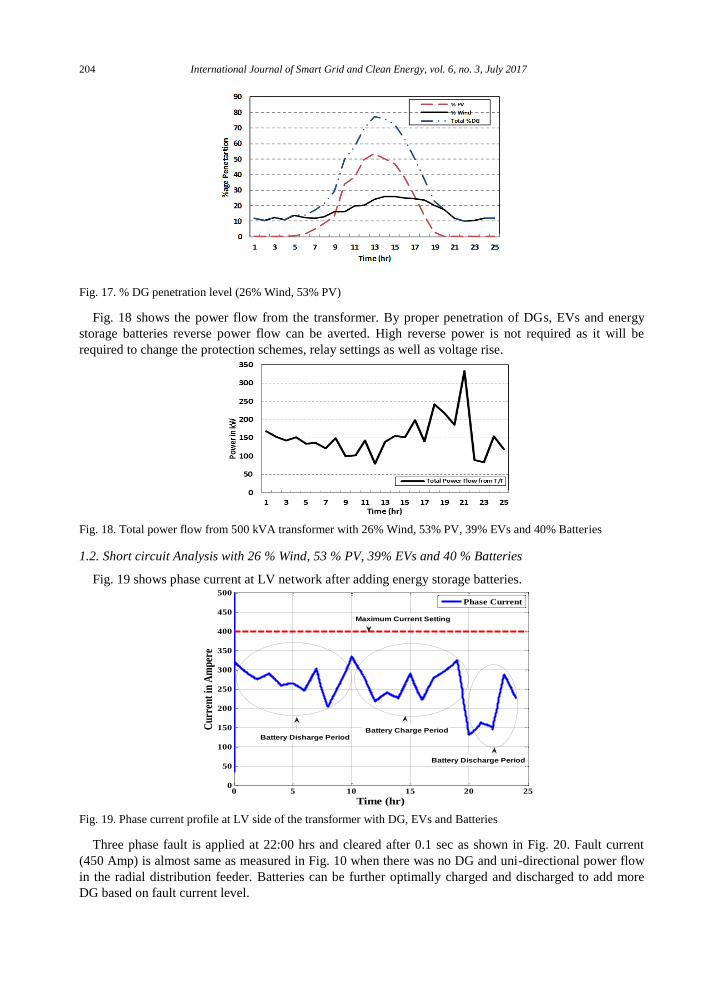
downstream for correct protection decision. Penetration level of wind is reduced from 78% to 26% and
penetration level of PVs is increased from 25% to 53% as shown in the Fig. 17. With this scheme, power
production at both ends of the day would decrease so batteries would be able to discharge. Batteries can
be charged at mid-day when PV power production is maximum.
International Journal of Smart Grid and Clean Energy, vol. 6, no. 3, July 2017
Fig. 17. % DG penetration level (26% Wind, 53% PV)
Fig. 18 shows the power flow from the transformer. By proper penetration of DGs, EVs and energy
storage batteries reverse power flow can be averted. High reverse power is not required as it will be
required to change the protection schemes, relay settings as well as voltage rise.
Fig. 18. Total power flow from 500 kVA transformer with 26% Wind, 53% PV, 39% EVs and 40% Batteries
1.2. Short circuit Analysis with 26 % Wind, 53 % PV, 39% EVs and 40 % Batteries
Fig. 19 shows phase current at LV network after adding energy storage batteries.
0 5 10 15 20 250
50
100
150
200
250
300
350
400
450
500
Time (hr)
Cu
rren
t in
Am
per
e
Phase Current
Maximum Current Setting
Battery Charge PeriodBattery Disharge Period
Battery Discharge Period
Fig. 19. Phase current profile at LV side of the transformer with DG, EVs and Batteries
Three phase fault is applied at 22:00 hrs and cleared after 0.1 sec as shown in Fig. 20. Fault current
(450 Amp) is almost same as measured in Fig. 10 when there was no DG and uni-directional power flow
in the radial distribution feeder. Batteries can be further optimally charged and discharged to add more
DG based on fault current level.
204

K.N.Bangash et al.: Impact of Energy Storage Systems on the Management of Fault Current at LV Network with High…. 205
21.5 22 22.1 22.50
50
100
150
200
250
300
350
400
450
500
550
600
Time
Cu
rren
t in
Am
per
e
Phase Current
Pre-Fault Current
Post-Fault Current
During-Fault CurrentMaximum Current setting
Fig. 20. Fault Current Contributed by the Substation
5. Conclusion
Renewable energies will be providing more and more of our electricity in the future. Large scale
integration of wind and PV DG impacts the reliability and coordination of protection devices. Energy
storage batteries are used as remedial measures. Whenever fault analysis is conducted for the future smart
grid, EVs and batteries must also be integrated in system to observe the clear picture. EVs and energy
storage batteries would allow continuous power flow to the downstream side of the transformer and help
keeping the settings of protective devices fixed. DGs with batteries would allow suitable amount of fault
current to flow from the transformer side, which would avoid mal-trip and fail to trip of relays. Without
energy storage all customers cannot install DG domestically as reverse power could cause overloading of
distribution transformer. The proposed scheme with proper scheduling of batteries, fuse and relay
coordination would remain the same as in existing radial feeder protection scheme.
References
[1] Farrokh R. and Ali I.. Demand response as a market resource under the smart grid paradigm. IEEE Trans. on Smart Grid, vol. 1, No. 1, pp. 82–88, June 2010.
[2] Irfan W.. Impacts of Distributed Generation on the Residential Distribution Network Operation. MSc thesis at Virginia
Polytechnic Institute and State University, Falls Church, Virginia: December 8, 2008. [3] Hadi, Azah, Hussain and Marjan. Impact of distributed generations on power system protection performance. International
Journal of the Physical Sciences Vol. 6(16), pp. 3999-4007, 18 August, 2011.
[4] Barbier C., Maloyd A. and Putrus G. Embedded controller for LV network with distributed generation. (K/EL/00334/00/REP).
UK: Department of Trade and Industry (DTI), (2007).
[5] Debra L., Lori B., Michael M., Bethany S., et al. Wind and Solar Curtailment. NREL/CP-5500-60245, International Workshop on Large-Scale Integration of Wind Power Into Power Systems as Well as on Transmission Networks for Offshore
Wind Power Plants London, England October 22 – 24, 2013.
[6] Richard A.. Energy Storage: The key to a smarter power grid. 24 April, 2014. http://www.bbc.com/news/business-27071303. [7] Overview brochure. Energy Storage Keeping smart grids in balance. Power and productivity for better world, ABB.
[8] Sascha R.. When will solar batteries become economical. Technologies, Solar energy storage, April 2013. [Online]. Available:
http://www.solarenergystorage.org/en/wann-werden-solarakkus-wirtschaftlich-2/. [9] Paul, Erik, Brendan and Michael. The role of energy storage with renewable electricity generation. National Renewable
Energy Laboratory, NREL/TP-6A2-47187 Jan 2010.
[10] Momen B., Nirmal N.. Solar PV, Battery Storage and Low Voltage Distribution Network: A Discussion on the Benefits of Distributed Battery Storage. Power systems group, University of Auckland, October 2013.
[11] Alexandre Lucas, Stamatios Chondrogiannis. Smart grid energy storage controller for frequency regulation and peak shaving,
using a vanadium redox flow battery. International Journal of Electrical power and Energy Systems, Elsevier, 80 (2016) 26-36.
[12] Sivanandan S., Jaisiva S., Vinoth R., Mahendran A.. Transient stability analysis of distributed generation. IJRET:
International Journal of Research in Engineering and Technology, eISSN: 2319-1163 | pISSN: 2321-7308. [13] Adel A., Mehdi M.. Voltage and Frequency Control in Microgrid by Battery Energy Storage. Research Article, Int. J. Rev. Life.
Sci., 4(12), 2014, 35-47.

International Journal of Smart Grid and Clean Energy, vol. 6, no. 3, July 2017
[14] Ghullam Mustafa Bhuttoa,b, Birgitte Bak-Jensena , Pukar Mahata. Modeling of the CIGRE Low Voltage Test Distribution
Network and the Development of Appropriate Controllers. International Journal of Smart Grid and Clean Energy, 2012.
[15] Kein Huat Chua, Yun Seng Lim, Stella Morris. Battery energy storage system for peak shaving and voltage unbalance mitigation. International Journal of Smart Grid and Clean Energy, 2013.
[16] Holmes J., J. M. .Protection of Electricity Distribution Networks. United Kingdom: Power and Energy Series 47, 2004.
[17] Khan, U. N. .Impact of Distributed Generation on Distributed Network. Wroclav, University of Technology, Poland. 2008. [18] The Electricity Association, Power System Protection Vol. 3: Application, The Institution of Electrical Engineer, 1995.
[19] P.M.Anderson, Power System Protection, Wiley-IEEE Press, 1998.
[20] Philip P. Barker, R. W. .Determining the Impact of Distributed Generation on Power Systems: Part 1 - Radial Distribution Systems. IEEE conference paper, IEEE, 2000.
[21] Martin-Arnedo, J. A. .Impacts of Distributed Generation on Protection and Power Quality October 2009.
[22] F. M. Gatta, F. Iliceto, S. Lauria and P. Masato. Modelling and Computer Simulation of in Dispersed Generation in Distribution Networks. Measures to prevent disconnection during system disturbances. proc. of IEEE Power Tech Conference,
Bolonga, Italy, June 23-26, 2003.
[23] Operations Directorate of Energy Networks Association. Recommendations for the Connection of Type Tested Small-scale
Embedded Generators (Up to 16A per Phase) in Parallel with Low-Voltage Distribution Systems. Engineering
Recommendation G83 Issue 2, London, August 2012.
[24] Sukumar Brahma, A. G. .Effect of Distributed Generation on Protective Device Coordination in Distribution System. Clemson University, USA, 2001.
[25] Desus J., Grenard S., Bollen M.H.J., Häger M., Sollerkvist F.. Effective impact of DER on Distribution System protection. 19th
International conference on electricity distribution, Vienna, 21-24 May 2007. [26] Angel Fernández Sarabia. Impact of distributed generation on distribution system. MSc thesis, Aalborg University, Denmark,
June 2011.
[27] Kauhaniemi K, L. K. .Impact of Distributed Generation on the Protection of Distribution Networks. University of Vaasa, Finland, VTT Technical Research Centre of Finland, Finland, 2004.
[28] Thomas Gallery, L. M. (n.d.). Impact of Distributed Generation on Distribution Network Protection. ESBI Engineering &
Facility Management, Ireland. [29] Pasisit Suwanapingkarl. Power quality analysis of future power network. PhD thesis, University of Northumbria, Newcastle,
UK, November 2012.
[30] Hernándeza J. C. and Medina F. J. A.. Impact comparison of PV system integration into rural and urban feeders. Energy Conversion and Management, 1747-1765, 2008.
[31] Andreas P. Renewable and Sustainable Energy Reviews. Renewable and Sustainable Energy reviews, Elsevier 27(2013)
[32] Tony Haggis. Network Design Manual. e.on, central networks, Dec. 2006. [33] Nader barsoum, Chai Zen Lee. Simulation of power flow and protection of limited bus grid systems with injected solar power.
Scientific Research, Energy and Power Engineering, 2013, 5, 59-69.
[34] T. Stetz, F. Marten, M. Braun. Improved low voltage grid integration of photovoltaic systems in Germany. IEEE Trans. Sustainable Energy, vol. 4, no. 2, pp. 534–542, 2013.
[35] Koyanagi, Inuzuka, T., Uriu, y., Yokoyama, R. .Monte Carlo simulation on the demand impact by quick chargers for electric
vehicles. IEEE Power Engineering society, Edmonton, Alta., Canada 18-22 July, pp. 1031-1036. [36] Mott MacDonald. System integration of additional micro generation (SIAM) (DG/CG/00028/REP). UK: Department of trade
and industry (DTI) & OFGEM, 2004.
206