Embed Size (px)
Citation preview
Working Paper 265
Impact of Macro-economic Environment on
Diversification-performance Relationship:
A Cross Country Study of India and Japan
Saptarshi Purkayastha
March 2013
INDIAN COUNCIL FOR RESEARCH ON INTERNATIONAL ECONOMIC RELATIONS
Contents
Abstract ........................................................................................................................................... i
1. Introduction ........................................................................................................................... 1
2. Theory & Hypotheses:........................................................................................................... 2
2.1 Role of institutions and resources in developed and emerging economies ..................... 2
2.2 The role of the munificent and scarce macro-economic environment in developed and
emerging economies......................................................................................................... 4
2.3 The moderating impact of business group affiliation on the diversification-performance
relationship ...................................................................................................................... 5
3. Research design and methodology ....................................................................................... 8
3.1 Identification of macroeconomic conditions of munificence and scarcity....................... 8
3.2 Method ............................................................................................................................. 9
3.3 Sample ............................................................................................................................ 11
4. Results ................................................................................................................................... 12
4.1 Firm performance measure............................................................................................ 12
4.2 Diversification Measures ............................................................................................... 12
4.3 Regression Results ......................................................................................................... 13
5. Discussion and Conclusion .................................................................................................. 17
6. Limitations and future research directions ....................................................................... 18
References .................................................................................................................................... 20
Tables & Hypothesis
Table1: Macroeconomic environmental conditions in India and Japan .............................................. 3
Hypothesis 1a: ............................................................................................................................................ 4
Hypothesis 1b: ............................................................................................................................................ 4
Hypothesis 2a: ............................................................................................................................................ 5
Hypothesis 2b: ............................................................................................................................................ 5
Hypothesis 3a: ............................................................................................................................................ 7
Hypothesis 3b: ............................................................................................................................................ 7
Table 2: Growth of Japanese domestic market demand in different industries within the
manufacturing sector ................................................................................................................. 8
Table 3: Growth of Indian domestic market demand in different industries within the
manufacturing sector ................................................................................................................. 9
Table 4: Sectoral distribution of Indian and Japanese firms............................................................... 11
Table 5: Descriptive Statistics ................................................................................................................ 12
Table 6: Regression Results for macroeconomic munificent environment ..................................... 14
Table 7: Regression Results for macroeconomic scarce environment ............................................. 16
i
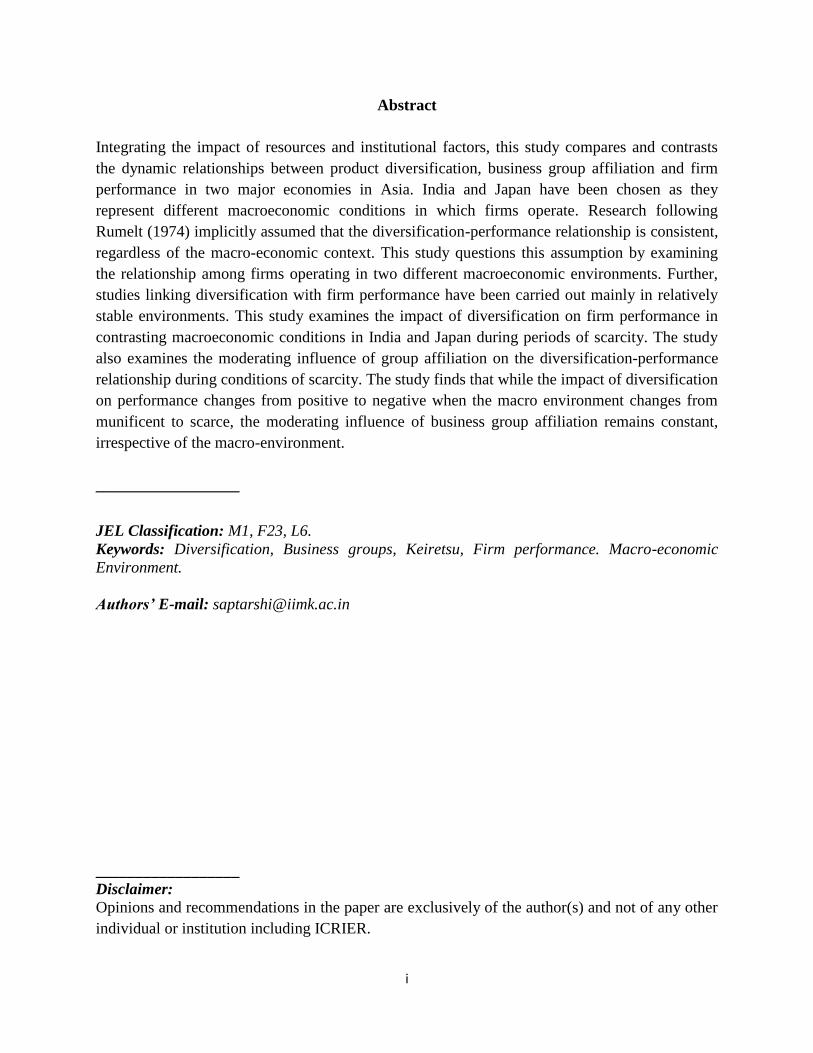
Abstract
Integrating the impact of resources and institutional factors, this study compares and contrasts
the dynamic relationships between product diversification, business group affiliation and firm
performance in two major economies in Asia. India and Japan have been chosen as they
represent different macroeconomic conditions in which firms operate. Research following
Rumelt (1974) implicitly assumed that the diversification-performance relationship is consistent,
regardless of the macro-economic context. This study questions this assumption by examining
the relationship among firms operating in two different macroeconomic environments. Further,
studies linking diversification with firm performance have been carried out mainly in relatively
stable environments. This study examines the impact of diversification on firm performance in
contrasting macroeconomic conditions in India and Japan during periods of scarcity. The study
also examines the moderating influence of group affiliation on the diversification-performance
relationship during conditions of scarcity. The study finds that while the impact of diversification
on performance changes from positive to negative when the macro environment changes from
munificent to scarce, the moderating influence of business group affiliation remains constant,
irrespective of the macro-environment.
__________________
JEL Classification: M1, F23, L6.
Keywords: Diversification, Business groups, Keiretsu, Firm performance. Macro-economic
Environment.
Authors’ E-mail: [email protected]
__________________
Disclaimer:
Opinions and recommendations in the paper are exclusively of the author(s) and not of any other
individual or institution including ICRIER.
1
Impact of Macro-economic Environment on Diversification-performance
Relationship: A Cross Country Study of India and Japan
Saptarshi Purkayastha*
1. Introduction
Diversification and its linkages to firm performance has been one of the most widely researched
areas both in advanced and emerging economies. Although this area of inquiry falls short of
consensus (Palich, Cardinal & Miller, 2000), several studies in emerging economies propose that
highly diversified firms are likely to be more profitable as compared to focused firms (Guillén
2000; Khanna & Palepu, 1997; Kock & Guillén, 2001). On the contrary, in advanced
economies, focused firms are more profitable than highly diversified firms because the latter are
difficult to manage (Grant, Jammine & Thomas, 1988) since diversification results in increased
monitoring costs, co-ordination costs, and costs related to other diseconomies (Markides,1992).
Research following Rumelt (1974, 1984) implicitly assumed that the diversification-performance
relationship is consistent, regardless of the general environmental context (Coplan, 2008). It
assumed that the specific matching of intra-firm resources and capabilities with micro-economic
and competitive prospects, ultimately determine the financial performance of the enterprise. By
overlooking the effects of larger exogenous forces, previous researchers suggested that the
relationship between diversification and financial performance remains consistent, even when
environmental conditions change (Geringer, Tallman & Olsen, 2000). A few recent studies
(Chakrabarti, Singh & Mahmood, 2007; Coplan & Hikino, 2005; Mayer & Whittington, 2003),
however, have concluded that the relationship between strategic choices and financial outcomes
are dynamic and contingent on the environmental context.
My study goes beyond past research by analysing the relationship between diversification and
business group affiliation, and firm performance by integrating macroeconomic conditions.
Specifically, the study has three objectives. First, my study argues that the exogenous macro
environment plays a critical role in influencing this relationship. Japan and India have very
different macroeconomic environments. Japan, being a developed nation, has highly developed
institutions like the capital market, product market and labour market, necessary to do business,
while in India such institutions are either emerging or are absent (Khanna & Palepu, 1997). Our
paper compares the diversification-performance relationship under contrasting macroeconomic
environments. Second, the study questions the boundaries of diversified operations. As the world
* Faculty, Strategic Management Department, Indian Institute of Management, Kozhikode, e-mail:

2
economy passes through troubled times, with declining growth rates, what would be the impact
of diversification on the performance of firms? Will the diversification-performance relationship
remain stable or will it change under a scarcity environment? Except for a few studies (Colpan,
2008; Chakrabarti, el al., 2007; Lim, Das & Das, 2009), most of the previous literature has
examined the diversification-performance literature under stable macroeconomic conditions. To
the best of our knowledge, this study will be the first to compare the diversification-performance
relationship under scarcity conditions in a developed country (Japan) and an emerging economy
(India). The final issue relates to business groups. Business groups act as internal markets for
affiliated firms, thus enhancing their performance. These benefits of business group affiliation
have been examined mostly in stable environments (see for example, Khanna & Palepu, 2000a,
2000b; Chang & Hong, 2000, 2002). This study examines whether the advantages of group
affiliation would also be available when the economy is characterised by scarcity and instability.
In this paper, we make several contributions. First, the study contributes to the body of work that
has investigated the relationship between changes in macro-environment and firm outcomes by
focusing on two specific issues, diversification and business group affiliation. Prior studies
investigated how macroeconomic shifts affect strategic reconfiguration, such as growth and
survival (Randolph & Dess, 1984), strategic changes (Koberg, 1987; Yasai-Ardekani, 1989) and
decision-making (Goll & Rasheed, 1997). Our work adds to these findings by examining
whether environmental changes affect the diversification-performance relationship and business
group affiliation-performance relationships. Second, our research responds to rising criticisms of
the static version of institutional (Chakrabarti et al., 2007) and resource based perspectives of the
firm (Colpan, 2008) by integrating the environmental context into the relationship. We argue that
the efficiency of internal institutions built by diversified firms to substitute inefficient external
institutions will depend upon the macroeconomic environment. From a resource-based
perspective, we argue that market conditions ultimately determine the competitive value of a
resource. Managers often fail to realise that an existing resource may fail to provide competitive
advantage when macroeconomic conditions change. Finally, the paper employs two measures of
diversification and three different measures of performance, in contrast to the usual one measure,
which often leads to the criticism that the results are driven by the idiosyncratic measure (Robins
& Wiersema, 2003). Our results, thus, are stronger than single-measure studies.
2. Theory & Hypotheses:
2.1 Role of institutions and resources in developed and emerging economies
This study employs the institutional (Khanna & Palpeu, 1997) and resource based perspectives
(Dosi, Coriat & Pavit, 2000) of the firm, as these approaches are directly relevant to managerial
choices, especially with respect to product diversification and business group affiliation.
Institutional perspective research in emerging economy environments argue that highly
diversified firms provide greater benefits as compared to less diversified or focused firms (Chang

3
& Hong, 2002; Hoskisson, Eden, Lau & Wright, 2000; Khanna & Palepu, 1997). This is because
of the institutional context in which firms in emerging economies operate. For example, in a
developed economy like Japan (Table 1 presents macroeconomic statistics for India and Japan),
the institutional context is characterised by well functioning capital, labour and product markets.
In contrast, in emerging economies like India, China or Brazil, there is a variety of market
failures. The financial markets are characterised by inadequate disclosure, and weak corporate
governance and control. Intermediaries such as financial analysts, mutual funds, investment
bankers and venture capitalists are not fully evolved. Finally, contract enforcement through the
judicial process is either weak or time-consuming. (See Khanna & Palepu, 2000a for a
comparison of the institutional context in India and Japan). These market imperfections make it
costly to establish a quality brand image in the product market, to acquire necessary inputs such
as finance, technology and management talent and to establish contractual relationships with
international joint ventures. In this context, an enterprise may be pursued profitably as part of a
large diversified firm that can act as an intermediary between individual entrepreneurs and
imperfect markets. For example, a diversified firm can use their track record and reputation in
established lines of business to gain credibility in new ventures among suppliers and customers.
A developed economy such as Japan, on the other hand, has well-developed and efficient market
intermediaries. Focused firms can profitably conduct open market operations to match the
advantages of the internal markets of diversified firms. Slack resources can be traded perfectly
because of developed market institutions while the reduction in shareholder risk by diversified
firms can be offset by less diversified firms because of developed external capital markets. In
general, the potential returns from diversification decreases in markets where external developed
institutions are present.
Table1: Macroeconomic environmental conditions in India and Japan
Indicators (2008) India Japan
GDP (Billion, $) 1217.5 4909.3
GDP Per Capita ($) 1,068 38,442.6
Gross savings (% of GDP) 35.8 27.9a
Inflation, consumer prices 8.3 1.4
Total reserves (Billion, $) 257.4 1,030.8
a - 2006 data
Source; http://www.icrier.org/indojapan/socialeco/monetary_indicator.html
The resource-based view suggests that developing a diversification strategy in a developed
economy should be based on inputs that are characterised as valuable, durable, inimitable and
non-substitutable (Markides & Williamson, 1994). Such inputs can only be firm specific and can
be exploited if firms diversify in limited or related industries (Collis & Montgomery 1995; Perry
1998). A firm in a developed economy should thus diversify into product markets where it can
4
leverage its strategic resources and firm-specific capabilities. The situation is the opposite in the
case of emerging economies. The emerging economies of East Asia, Latin America and Southern
Europe developed in the late 1960s and 1970s, mostly by entering into mature industries such as
simple assembled goods, electrical appliances, rubber, transportation equipment, steel and
chemicals (Haggard 1990). The native governments of these countries encouraged local
entrepreneurs to participate in the economy by protecting them from foreign competition. These
local entrepreneurs leveraged local and foreign contacts to obtain foreign technology and
resources to serve the local market. Thus, resources such as political and bureaucratic contacts
and connections are important for firm performance in such environments (Kock & Guillén,
2001). Contacts, as a type of human knowledge, are costly to create initially but are less costly to
apply to additional tasks (Teece, 1982), suggesting a potential for scope economics. As contact
capabilities are not product specific and it requires time and resources to build them, firms would
leverage them across diverse product-market combinations (Weidenbaum & Hughes, 1996; Luo
& Chung, 2005). Diversified firms, therefore, would be profitable in emerging markets.
Hypothesis 1a: The more institutionally developed an economy, such as Japan, the lesser are
the benefits for diversified firms
Hypothesis 1b: The less institutionally developed an economy, such as India, the greater the
benefits for diversified firms
2.2 The role of the munificent and scarce macro-economic environment in developed and
emerging economies
A key argument of this paper is that the forecast performance outcome of strategic adaptation is
contingent on the macroeconomic setting. By macroeconomic setting, we refer to
macroeconomic munificence and scarcity. A munificent environment is defined as one where
there is resource abundance with slack and capacity to support growth (Dess & Beard, 1984;
Lim, et al., 2009). In a munificent market, as consumer income rises, they become less sensitive
to prices, which create expanding markets (Coplan, 2008). A less munificent or scarce
environment is characterised by instability and volatility (Lim, et al., 2009). In a scarce
environment, price rise leads to fall in consumer income, making them price sensitive and leads
to decline in sales volumes. This results in lower performance of firms. The paper argues that in
environments characterised by scarcity, diversified firms in developed economies will have a
poorer performance as compared to focused firms. Our argument is based on a couple of reasons.
The scarce environment (1)reduces the internal market benefits from diversification and (2)
increases management and organisational costs more for diversified firms than for focused firms
(Chakrabarti et al., 2007). The privileged access to resources and internal transfers, which
diversified firms enjoy during periods of munificence, provides relatively fewer benefits during
periods of economy wide scarcity. When many or all of a diversified firm’s markets are affected
by scarcity, it will not be able to shift resources from strong to weak businesses. Businesses that
5
were viable because of resource transfers will suffer in their absence or reduction. Thus, firms
that position themselves in diversified markets will not be able to sustain their profitability,
because they lack the core competencies that the established market leader posses in each of the
individual markets that they operate in. A typical example is Kanebo Ltd. of Japan, a once
prominent textile firm that filed for bankruptcy in 2004. The company had deliberately adopted a
business model of technologically unrelated diversification since the 1970s but could not
compete with the market leaders in its diverse portfolio stretching into cosmetics, real estate and
housing, finance, food and electronics, when domestic demand in those markets slumped.
All the problems of diversified firms in developed economies discussed above are also present in
firms in emerging economies. Privileged access to resources and internal transfer may not be
available and the benefit of spreading risks through diversification may not apply in times of
macroeconomic scarcity. However, we argue that the internal intermediate institutions that
diversified firms in emerging economies have built would help them offset to some extent the
problems of macroeconomic scarcity. Since these institutions are controlled directly by the firms,
they would have greater flexibility in moulding these institutions to cope with a dynamic
situation better. For example, diversified firms might profitably exploit the internal labour
market by concentrating labour in areas of greater concern. Moreover, the umbrella branding of
diversified firms would help them obtain debt at lower costs as compared to focused firms.
Although environmental uncertainties increase the cost of debt financing across the board for all
borrowers (Lim, et al., 2009), debt holders may be willing to lend at lower rates to diversified
firms as compared to focused firms as they are more confident of recovering capital and interest
from their investments. This might be because most diversified firms, especially in India, are
affiliated to business groups, which, because of their size and market power, are likely to have a
lower probability of bankruptcy (Purkayastha, 2009).
Hypothesis 2a: In a developed economy, such as Japan, the more diversified a firm, the
greater the decline in its performance during periods of macroeconomic
scarcity.
Hypothesis 2b: In an emerging economy, such as India, the more diversified a firm, the lesser
the decline in its performance during periods of macroeconomic scarcity.
2.3 The moderating impact of business group affiliation on the diversification-performance
relationship
Business groups have become ubiquitous in Asian and other emerging economies (Purkayastha,
2009). This unique organisational form has a significant impact on the economies of emerging
countries. For example, the top 30 business groups contributed 40 per cent of Korea’s total
industrial output in the year 1996 (Chang & Hong, 2000). For the year 2000, business groups in
China contributed close to 60 per cent of the nation’s industrial output (Yiu, Bruton & Lu, 2005)
6
whereas in Taiwan, the top hundred business groups contributed 45 per cent of the country’s
industrial output (Chu, 2004). In India, in 2000, business groups controlled about 75 per cent of
the total industrial output in the private sector (Purkayastha, 2009).
To explain their prevalence and dominance in different emerging economies, researchers
adopting various theoretical perspectives have argued that business group ties have performance-
enhancing benefits for affiliates (Yiu, Lu, Bruton & Hoskisson, 2007). Taking up the theme of
business groups as a response to market failures, Khanna and Palepu (1997) reasoned that
affiliation benefits firms because these groups function as efficient internal capital and labour
markets. From a resource-based perspective, Guillén (2000) argued that recurring transactions
between business group affiliates lead to richer flow of information that improve resource
allocation among affiliates. Transaction cost theorists have argued that scarce skilled labour and
managerial talent can be developed and shared among affiliate firms more efficiently because of
transaction recurrence (Chang & Choi, 1988; Chang & Hong, 2000). From a social network
perspective, studies have emphasised the benefits arising from enduring and multiple relations
between business group affiliates (Gerlach, 1992; Granovetter, 2005). They argue that network
embeddedness provides firms with rich formal and tacit information about each other, which
offers benefits in terms of uncertainty reduction, contract enforcement and opportunity
identification (Granovetter, 2005). Gerlach (1992) and Keister (1988) reasoned that business
groups reduce uncertainty for affiliates through the co-ordination of investment decisions and by
assuring supply of intermediate goods. Weidenbaum and Hughes (1996) attributed the success of
business groups to their informal contract enforcement capacities, thus lowering the possibility
of contractual disputes. Business groups, thus, can be seen as a mechanism through which intra-
group transaction costs are lowered, efficient resource allocation is done, superior information
about affiliate firms is obtained and the possibility of contractual disputes is reduced.
Collectively, these factors may improve the outcomes for affiliated firms.
Researchers in emerging economies have argued that group affiliation moderates positively the
relationship between diversification and firm performance (Chang & Hong 2000; Purkayastha,
2009). Group-affiliated firms are able to mobilise resources at lower costs because group
affiliation provides reputation benefits and privileged access (Chakrabarti, et al., 2007).
However, few researchers have examined whether the positive moderating impact of group
affiliation buffers the negative impact of macroeconomic scarcity. We argue in this paper that the
spill over benefits from sharing resources within emerging economy, diversified business groups
are likely to decline substantially during an economy wide shock as all affiliated firms within a
group are likely to be affected by such a crisis. Firms, which depend on internal resource
transfers, will be affected if transfers dry up because of resource shortages. Firms that did not
require resource transfers might be required to bail out brethren firms by sharing the excess
resources. Moreover, negative reputation effects from poorer group performance may cause
affiliated firms to lose the privileged access that they enjoyed to external resources as a result of
their group affiliation (Carney, Gedajlovic, Heugens, Essen, & Oosterhout, 2011; Kim,
7
Hoskisson, & Wan, 2004). Independent firms, on the other hand, face similar challenges of
exposure to economy wide scarcity, though without the burden of group affiliation.
Business groups or keiretsus in Japan, unlike business groups in India, have a “main bank”,
which has strategic ties with its affiliated firms (Miyazaki, 1980; Morikawa, 1992). The “main
bank” functions as a convenient substitute for intra-firm resources by offering necessary finances
when the afflicted firms do not generate enough resources to implement their growth strategies
(Colpan, 2008). Keiretsu financing can then serve as a source of semi-internal resources. Some
authors claim that because of this privileged credit access, keiretsu financing exhibits positive
effects on the performance of affiliated firms, as the banks infuse loans for operating companies
and then monitor them for effective management of resources (Akoi, 1994; Berglof & Perotti,
1994). Although main banks usually do not commit themselves to the core strategic decisions of
affiliated firms including diversification, they influence those strategic decisions by accepting or
rejecting loan applications (Kang, Shivdasani & Yamada, 2000; Kim, et al., 2004). Thus, as long
as keiretsu-affiliated firms relied on the main bank for borrowings, the capabilities of firms
tended to be focused in operational and other functional competencies rather than on financial
capabilities, thus resulting in their superior performance over independent competitors.
Under conditions of macro-economic scarcity, we argue that keiretsu affiliation would positively
moderate the relationship between diversification and firm performance. This might be because
of a number of reasons. First, under scarcity conditions, when the bad loans troubles of most
banks might have forced them to be selective and deliberate in credit allocation, affiliated firms,
in spite of their poor performance, might have avoided the credit crunch because of “relational
lending” (Miwa & Ramseyer, 2001). Second, lending by the main bank, especially in periods of
macroeconomic scarcity, would lead to a high level of monitoring by the bank, resulting in the
efficient use of resources. Finally, large commercial banks would assist affiliated fund-raising for
the internationalisation of affiliated firms (Klein, Peek & Rosengren, 2002). This becomes
particularly important in times of domestic scarcity when fund raising from international sources
becomes a necessity. Thus, for either product or international diversification, affiliated firms
with long-term bank ties would function positively, especially in times of macroeconomic
scarcity as the main bank functions as a secured source of external financing when firms cannot
generate enough internal funds to grow.
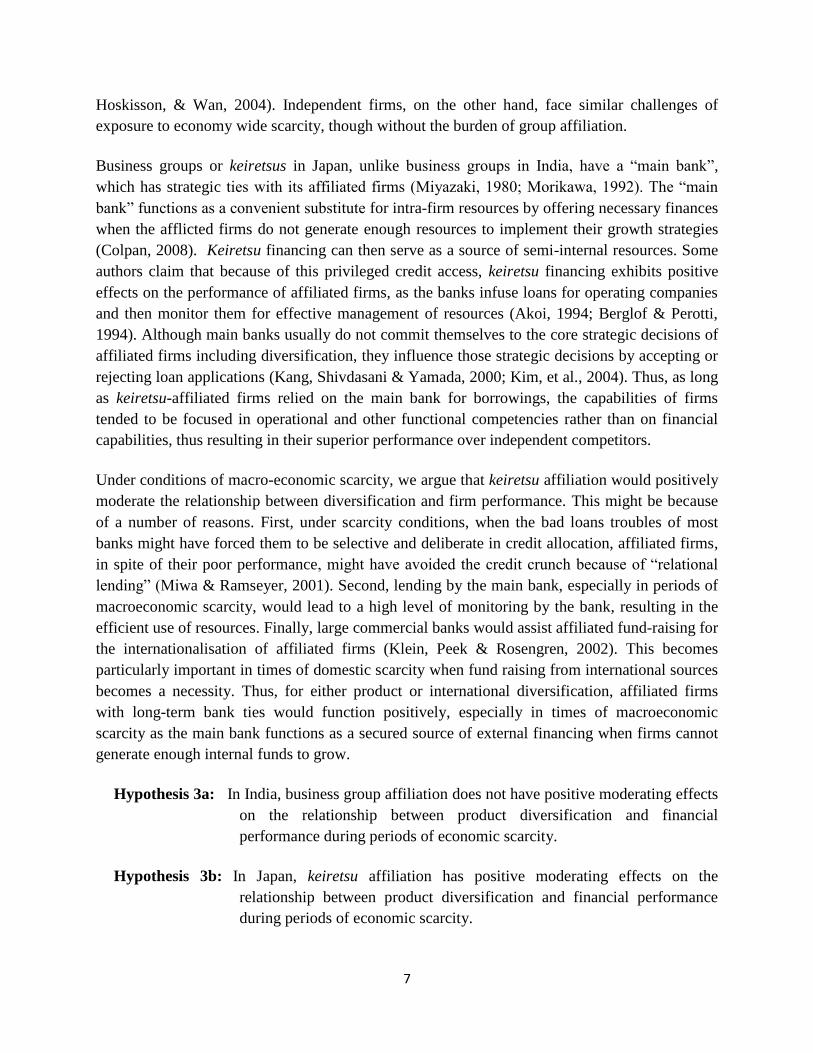
Hypothesis 3a: In India, business group affiliation does not have positive moderating effects
on the relationship between product diversification and financial
performance during periods of economic scarcity.
Hypothesis 3b: In Japan, keiretsu affiliation has positive moderating effects on the
relationship between product diversification and financial performance
during periods of economic scarcity.

8
3. Research design and methodology
3.1 Identification of macroeconomic conditions of munificence and scarcity
To analyse firm performance in munificent and scarce environments, the major economic factors
affecting the investment patterns of individual enterprises were examined. In the case of Japan,
following Colpan and Hikino (2005) and Colpan (2008), we use the period of 1996-2000 as a
period of munificence. Although growth rates in 1996-2000 were lower than in the boom period
in the 1980s, growth rates were higher than in the period 1991-95 (Table 2).
Table 2: Growth of Japanese domestic market demand in different industries within the
manufacturing sector
Industry 1991-95 1996-2000
Chemicals -0.69 1.04
Petroleum and coal products -3.10 4.65
Electrical machinery and equipment -0.72 2.13
Transportation equipment -2.04 0.13
Instruments -4.85 1.32
Data Source: Worldscope Fundamental database from Thomson Reuters
In the case of India, the period 1996-2000 was a period of prosperity when economic growth
performance remained sound with industrial production growing by almost 6 per cent, except for
the year 1998-99 where it grew by 4 per cent. GDP growth rate for all these years was above 6
per cent, with the exception of 1997-98 where it was 5 per cent (Economic Survey of India,
1999-2000). Inflation remained at low levels of less than 4.0 per cent on an average in the period
1996-2000. Further, a wide variety of reforms to boost the economy took place in this period.
The Information Technology Bill to create a legal framework to facilitate electronics commerce
was passed in this period. In order to bring in more FDI, except for a negative list, sectoral limits,
and a few explicitly defined constraints, all other FDI was brought under the RBI automatic
system. Non-resident Indians were also permitted to invest under the automatic route in all items,
barring a few Indian companies, which were allowed to access AGR/GDR markets through the
automatic route, subject to specified norms and post-issue reporting requirements. This resulted
in resource munificence in this period. Comparing the growth rates of a cross-section of
industries for period 1996-2000 with 1991-95 also confirms this contention (Table 3).
9
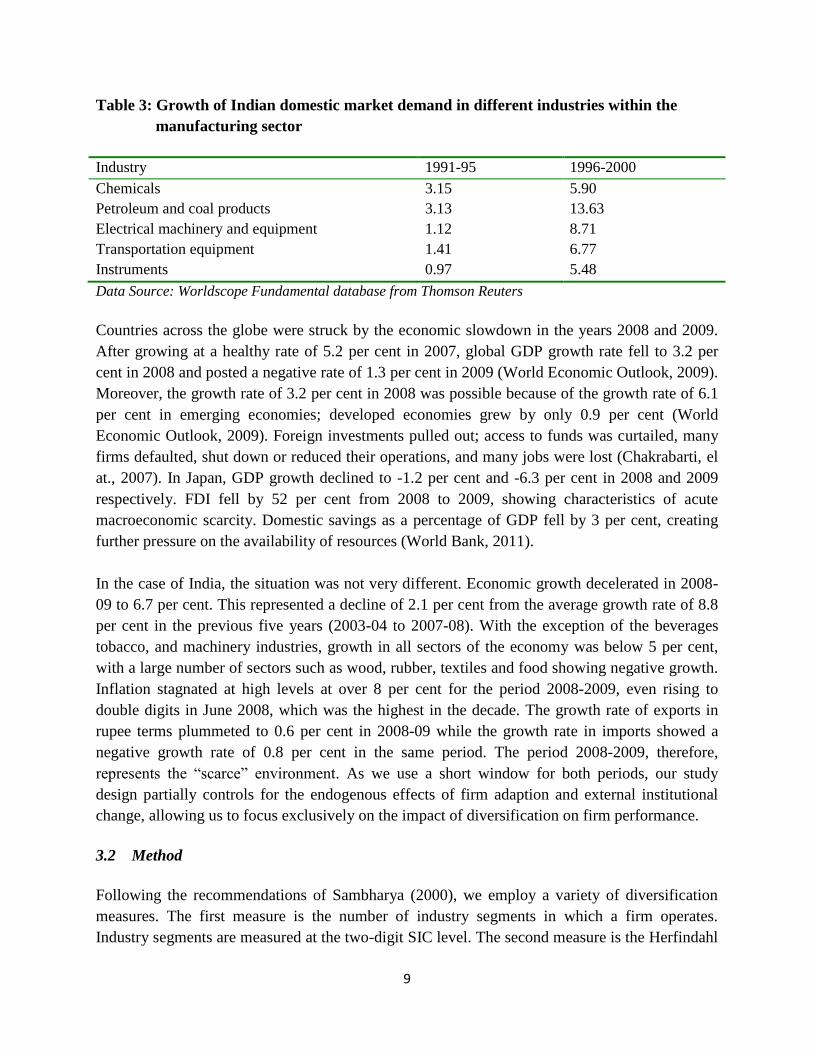
Table 3: Growth of Indian domestic market demand in different industries within the
manufacturing sector
Industry 1991-95 1996-2000
Chemicals 3.15 5.90
Petroleum and coal products 3.13 13.63
Electrical machinery and equipment 1.12 8.71
Transportation equipment 1.41 6.77
Instruments 0.97 5.48
Data Source: Worldscope Fundamental database from Thomson Reuters
Countries across the globe were struck by the economic slowdown in the years 2008 and 2009.
After growing at a healthy rate of 5.2 per cent in 2007, global GDP growth rate fell to 3.2 per
cent in 2008 and posted a negative rate of 1.3 per cent in 2009 (World Economic Outlook, 2009).
Moreover, the growth rate of 3.2 per cent in 2008 was possible because of the growth rate of 6.1
per cent in emerging economies; developed economies grew by only 0.9 per cent (World
Economic Outlook, 2009). Foreign investments pulled out; access to funds was curtailed, many
firms defaulted, shut down or reduced their operations, and many jobs were lost (Chakrabarti, el
at., 2007). In Japan, GDP growth declined to -1.2 per cent and -6.3 per cent in 2008 and 2009
respectively. FDI fell by 52 per cent from 2008 to 2009, showing characteristics of acute
macroeconomic scarcity. Domestic savings as a percentage of GDP fell by 3 per cent, creating
further pressure on the availability of resources (World Bank, 2011).
In the case of India, the situation was not very different. Economic growth decelerated in 2008-
09 to 6.7 per cent. This represented a decline of 2.1 per cent from the average growth rate of 8.8
per cent in the previous five years (2003-04 to 2007-08). With the exception of the beverages
tobacco, and machinery industries, growth in all sectors of the economy was below 5 per cent,
with a large number of sectors such as wood, rubber, textiles and food showing negative growth.
Inflation stagnated at high levels at over 8 per cent for the period 2008-2009, even rising to
double digits in June 2008, which was the highest in the decade. The growth rate of exports in
rupee terms plummeted to 0.6 per cent in 2008-09 while the growth rate in imports showed a
negative growth rate of 0.8 per cent in the same period. The period 2008-2009, therefore,
represents the “scarce” environment. As we use a short window for both periods, our study
design partially controls for the endogenous effects of firm adaption and external institutional
change, allowing us to focus exclusively on the impact of diversification on firm performance.
3.2 Method
Following the recommendations of Sambharya (2000), we employ a variety of diversification
measures. The first measure is the number of industry segments in which a firm operates.
Industry segments are measured at the two-digit SIC level. The second measure is the Herfindahl
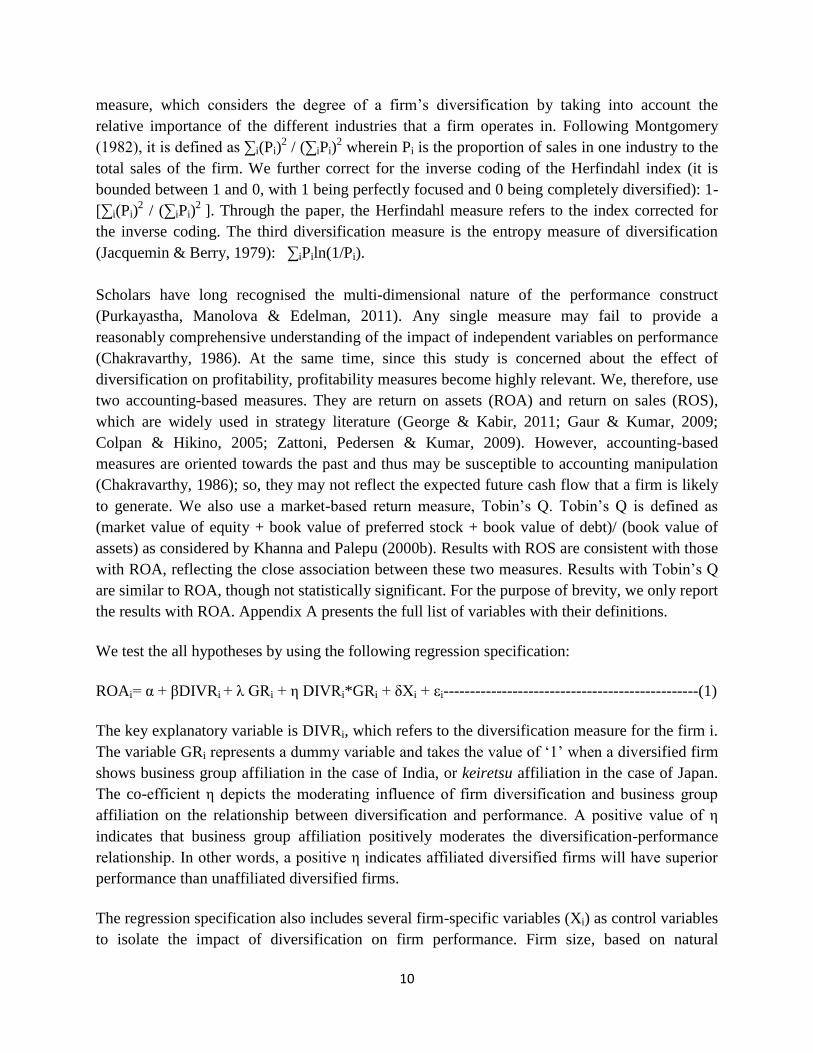
10
measure, which considers the degree of a firm’s diversification by taking into account the
relative importance of the different industries that a firm operates in. Following Montgomery
(1982), it is defined as ∑i(Pi)2 / (∑iPi)
2 wherein Pi is the proportion of sales in one industry to the
total sales of the firm. We further correct for the inverse coding of the Herfindahl index (it is
bounded between 1 and 0, with 1 being perfectly focused and 0 being completely diversified): 1-
[∑i(Pi)2 / (∑iPi)
2 ]. Through the paper, the Herfindahl measure refers to the index corrected for
the inverse coding. The third diversification measure is the entropy measure of diversification
(Jacquemin & Berry, 1979): ∑iPiln(1/Pi).
Scholars have long recognised the multi-dimensional nature of the performance construct
(Purkayastha, Manolova & Edelman, 2011). Any single measure may fail to provide a
reasonably comprehensive understanding of the impact of independent variables on performance
(Chakravarthy, 1986). At the same time, since this study is concerned about the effect of
diversification on profitability, profitability measures become highly relevant. We, therefore, use
two accounting-based measures. They are return on assets (ROA) and return on sales (ROS),
which are widely used in strategy literature (George & Kabir, 2011; Gaur & Kumar, 2009;
Colpan & Hikino, 2005; Zattoni, Pedersen & Kumar, 2009). However, accounting-based
measures are oriented towards the past and thus may be susceptible to accounting manipulation
(Chakravarthy, 1986); so, they may not reflect the expected future cash flow that a firm is likely
to generate. We also use a market-based return measure, Tobin’s Q. Tobin’s Q is defined as
(market value of equity + book value of preferred stock + book value of debt)/ (book value of
assets) as considered by Khanna and Palepu (2000b). Results with ROS are consistent with those
with ROA, reflecting the close association between these two measures. Results with Tobin’s Q
are similar to ROA, though not statistically significant. For the purpose of brevity, we only report
the results with ROA. Appendix A presents the full list of variables with their definitions.
We test the all hypotheses by using the following regression specification:
ROAi= α + βDIVRi + λ GRi + η DIVRi*GRi + δXi + εi------------------------------------------------(1)
The key explanatory variable is DIVRi, which refers to the diversification measure for the firm i.
The variable GRi represents a dummy variable and takes the value of ‘1’ when a diversified firm
shows business group affiliation in the case of India, or keiretsu affiliation in the case of Japan.
The co-efficient η depicts the moderating influence of firm diversification and business group
affiliation on the relationship between diversification and performance. A positive value of η
indicates that business group affiliation positively moderates the diversification-performance
relationship. In other words, a positive η indicates affiliated diversified firms will have superior
performance than unaffiliated diversified firms.
The regression specification also includes several firm-specific variables (Xi) as control variables
to isolate the impact of diversification on firm performance. Firm size, based on natural
11
logarithm of total sales, is controlled for size-related impact on performance. Age (in years),
current ratio (current liabilities/total liabilities), leverage (debt/equity) and trade intensity
(export-import)/sales) measure resource availability and constraints for each firm. As firms in
our sample are diversified in multiple industries, we categorise a particular firm in a single
industry depending on its sales in that industry. Each firm is grouped into a “core” industry, the
“core” industry being defined as the one where the firm has the highest sales.1
Specification (1) is estimated using panel data regression, with ROA as the dependent variable.
The use of panel data is more relevant and offers advantages over cross-sectional approaches,
such as less collinearity among the explanatory variables, increased degrees of freedom, and
control for firm heterogeneity (Baltagi, 2005),
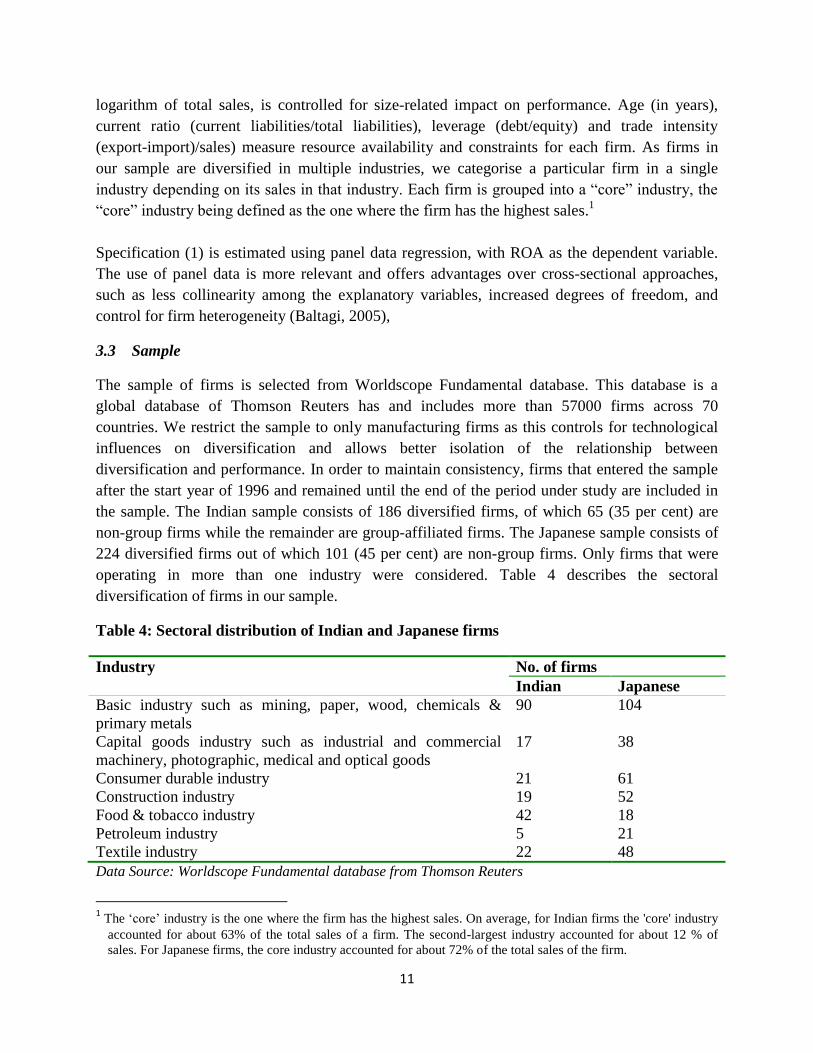
3.3 Sample
The sample of firms is selected from Worldscope Fundamental database. This database is a
global database of Thomson Reuters has and includes more than 57000 firms across 70
countries. We restrict the sample to only manufacturing firms as this controls for technological
influences on diversification and allows better isolation of the relationship between
diversification and performance. In order to maintain consistency, firms that entered the sample
after the start year of 1996 and remained until the end of the period under study are included in
the sample. The Indian sample consists of 186 diversified firms, of which 65 (35 per cent) are
non-group firms while the remainder are group-affiliated firms. The Japanese sample consists of
224 diversified firms out of which 101 (45 per cent) are non-group firms. Only firms that were
operating in more than one industry were considered. Table 4 describes the sectoral
diversification of firms in our sample.
Table 4: Sectoral distribution of Indian and Japanese firms
Industry No. of firms
Indian Japanese
Basic industry such as mining, paper, wood, chemicals &
primary metals
90 104
Capital goods industry such as industrial and commercial
machinery, photographic, medical and optical goods
17 38
Consumer durable industry 21 61
Construction industry 19 52
Food & tobacco industry 42 18
Petroleum industry 5 21
Textile industry 22 48
Data Source: Worldscope Fundamental database from Thomson Reuters
1 The ‘core’ industry is the one where the firm has the highest sales. On average, for Indian firms the 'core' industry
accounted for about 63% of the total sales of a firm. The second-largest industry accounted for about 12 % of
sales. For Japanese firms, the core industry accounted for about 72% of the total sales of the firm.
12
4. Results
4.1 Firm performance measure
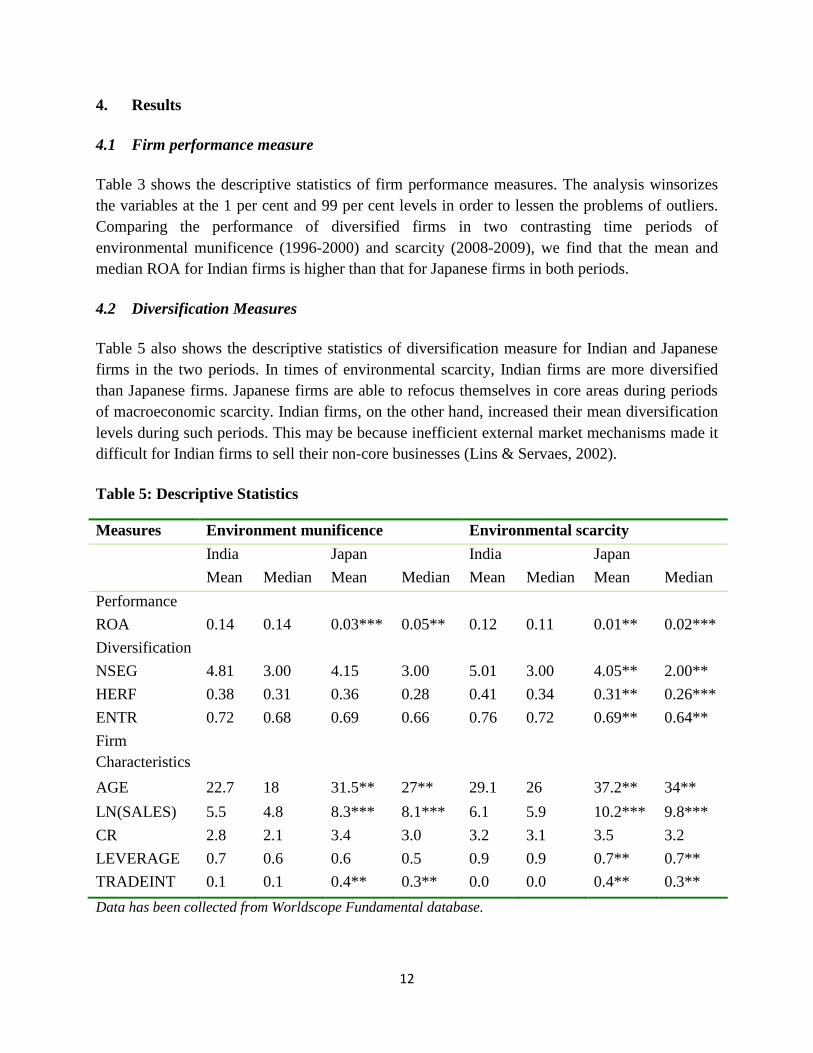
Table 3 shows the descriptive statistics of firm performance measures. The analysis winsorizes
the variables at the 1 per cent and 99 per cent levels in order to lessen the problems of outliers.
Comparing the performance of diversified firms in two contrasting time periods of
environmental munificence (1996-2000) and scarcity (2008-2009), we find that the mean and
median ROA for Indian firms is higher than that for Japanese firms in both periods.
4.2 Diversification Measures
Table 5 also shows the descriptive statistics of diversification measure for Indian and Japanese
firms in the two periods. In times of environmental scarcity, Indian firms are more diversified
than Japanese firms. Japanese firms are able to refocus themselves in core areas during periods
of macroeconomic scarcity. Indian firms, on the other hand, increased their mean diversification
levels during such periods. This may be because inefficient external market mechanisms made it
difficult for Indian firms to sell their non-core businesses (Lins & Servaes, 2002).
Table 5: Descriptive Statistics
Measures Environment munificence Environmental scarcity
India Japan India Japan
Mean Median Mean Median Mean Median Mean Median
Performance
ROA 0.14 0.14 0.03*** 0.05** 0.12 0.11 0.01** 0.02***
Diversification
NSEG 4.81 3.00 4.15 3.00 5.01 3.00 4.05** 2.00**
HERF 0.38 0.31 0.36 0.28 0.41 0.34 0.31** 0.26***
ENTR 0.72 0.68 0.69 0.66 0.76 0.72 0.69** 0.64**
Firm
Characteristics
AGE 22.7 18 31.5** 27** 29.1 26 37.2** 34**
LN(SALES) 5.5 4.8 8.3*** 8.1*** 6.1 5.9 10.2*** 9.8***
CR 2.8 2.1 3.4 3.0 3.2 3.1 3.5 3.2
LEVERAGE 0.7 0.6 0.6 0.5 0.9 0.9 0.7** 0.7**
TRADEINT 0.1 0.1 0.4** 0.3** 0.0 0.0 0.4** 0.3**
Data has been collected from Worldscope Fundamental database.

13
The table depicts descriptive statistics for 186 Indian firms and 224 Japanese firms. The two
time-periods include environment munificence and environmental scarcity. All variables are
defined in Appendix A. The equality of means and medians is tested using the t-test and
Wilcoxon/Mann-Whitney test respectively. The symbols *, ** and *** denote significance at
10%, 5% and 1% level respectively.
4.3 Regression Results
Tables 6 and 7 shows the results of the OLS regression between diversification, business group
affiliation and performance for Indian and Japanese firms for two different macroeconomic
environments ‒ environmental munificence and scarcity. Time dummies are used to represent
the two different macro-economic environments. Model 1 presents the results of the regression
without the interaction term while model 2 presents the results with the interaction term as given
in specification (1). Hypothesis 1a postulates that in a developed economy like Japan, high
diversification would lead to poor performance of firms. Models 1B, 1D and 1F of Table6
support hypothesis 1a as diversification has a negative impact on firm performance. The results
are supported by Markides (1995), and Palepu (1985). Hypothesis 1b postulates that in a less
institutionally developed country like India, the higher the diversification, the better would be the
firm’s performance. Models 1A, 1C and 1E of Table 6 support hypothesis 1b as diversification
has a positive impact on firm performance. Our results are supported by Khanna and Palepu
(2000a, 2000b), Guillén (2000), Chang and Hong (2002). Time dummies for both Japan and
India are positive, which indicates that diversified firms perform better in conditions of macro-
economic munificence than in conditions of macro-economic scarcity.

14
Table 6: Regression Results for macroeconomic munificent environment
The table presents the results of the OLS regression, with ROA as the dependent variable, using specification (1) for both the periods
of environmental munificence (1996-2000) and environmental scarcity (2008-09) for diversified firms of India and Japan. A time
dummy is used to differentiate between the periods. Model 1 provides the regression results without the interaction variable while
model 2 provides the regression results with the interaction variable. All variables are defined in Appendix A. The data was averaged
over the time-period to rule out the effects of business cycles. The regression results are corrected for heteroskedasticity using White
heteroskedasticity consistent standard errors and co-variance. The symbols *, ** and *** denote significance at 10%, 5% and 1% level
respectively.
Variable Model 1 Model 2
(A) (B) (C) (D) (E) (F) (A) (B) (C) (D) (E) (F)
India Japan India Japan India Japan India Japan India Japan India Japan
Intercept 0.05 0.16 0.08 0.15 0.01 0.11 0.08 0.01 0.06 0.02 0.07 0.01
LN(NSEG) 1.96*** -0. 36** 0.98** -0.12
HERF 0.63** -0.31** 0.28** -0.16**
ENTR 0.81*** -0.22** 0.65 0.28
Time dummy 0.13** 0.27** 0.08** 0.14* 0.15** 0.21** 0.56** 0.14*** 0.27*** 0.19** 1.41** 0.27**
GR 2.72* -0.41** 1.12** -0.52** 0.97** 0.12 0.56** -
0.26***
0.47*** -0.10** 1.09** -0.04**
AGE 0.45 0.00 0.32 0.11 0.12* -0.31** 0.45 -0.24** 0.08 -0.08 0.28* 0.19
LN(SALES) 3.01*** 0.06 2.14*** 0.53* 1.01 0.48* 2.05** 0.54 1.19** 1.14*** 1.05** 0.41***
CR 0.42** 0.51** 0.65 0.38 0.62 0.05 0.15 0.15* 0.04 0.24 0.05 0.19
LEVERAGE -0.11 -0.08 -0.56 -0.06* -0.09* -0.08** 0.41 -0.06 -0.18 -0.09 0.04 -0.27
TRADEINT 0.24 0.06 0.12 0.01 0.28 0.01 0.06 0.15* 0.03 0.00 0.00 0.00
LNNSEG*Time
dummy
0.21 -0.06**
HERF*Time dummy 0.12 -0.78**
ENTR*Time dummy 0.18 -0.67
Industry dummies Included Included Included Included Included Included Included Included Included Included Included Included
Adjusted R2 0.35 0.31 0.30 0.32 0.37 0.34 0.38 0.32 0.36 0.29 0.21 0.24
No. of obs. 186 224 186 224 186 224 186 224 186 224 186 224
Data has been collected from Worldscope Fundamental database.

15
Hypothesis 2a states that in an institutionally developed country like Japan, diversification would
have a negative impact on firm’s performance when economic scarcity pervades the macro-
environment. Models 2B and 2D of Table 6 show that the interaction term between time dummy
and diversification is negative, suggesting that Japanese diversified firms perform worse in
macroeconomic scarcity situations, thus supporting this hypothesis. Researchers like Colpan and
Hikino (2005) and Colpan (2008) have also arrived at similar conclusions. Hypothesis 2b states
that in an institutionally deficient country like India, higher diversification would not lead to
greater decline in performance during conditions of macroeconomic scarcity. Models 2A, 2C and
2E of Table 6 show that the interaction term between time dummy and diversification co-
efficient is not significant in India, which shows that there is no significant decline in
performance in periods of macroeconomic munificence and scarcity. Thus, hypothesis 2b is
supported.
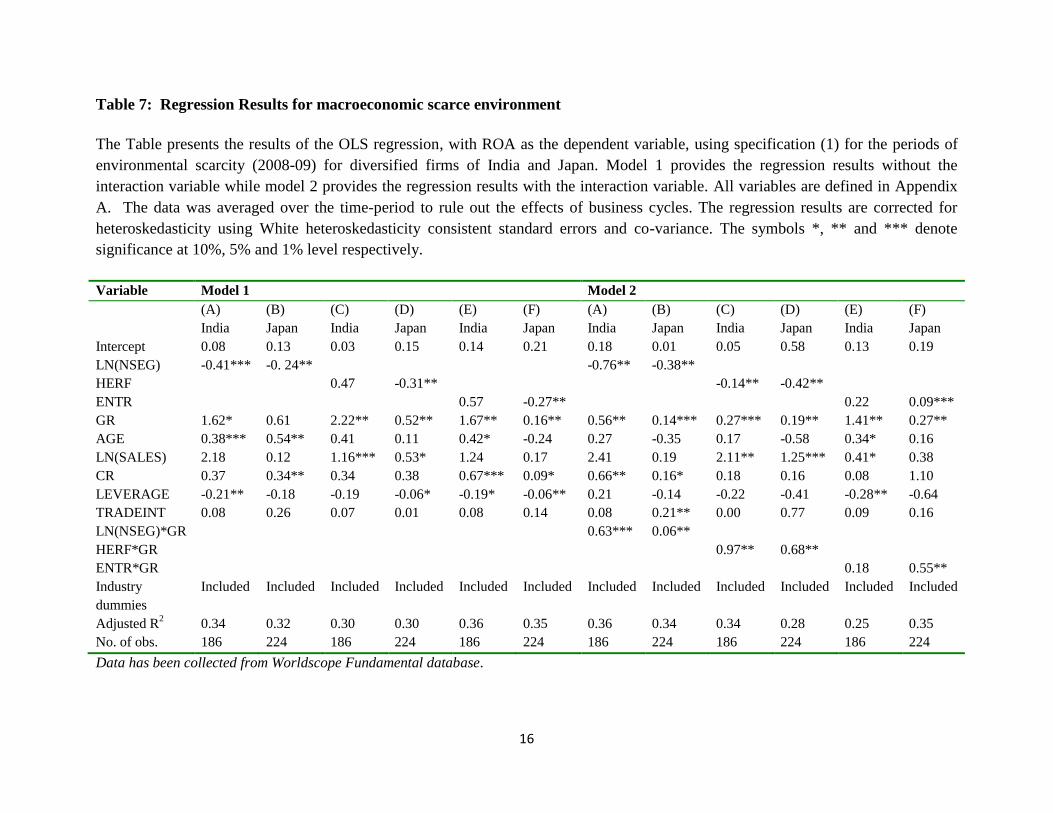
Hypothesis 3a postulates that business group affiliation in the case of Indian firms does not have
a positive moderating influence on diversification-performance relationship. The co-efficient of
the interaction terms between group affiliation and diversification is a measure of the moderating
influence and is positive for models 2A and 2C (Table 7). Thus, hypothesis 3a is not supported.
An interesting fact to be noted from Table 7 is that diversification in the case of Indian firms is
negative for models 1A, 2A and 2C. Comparing this with the co-efficient of the diversification
measure (Models 2A & 2C), the moderating effect is dominated by the group affiliation effect
rather than the diversification effect. Hypothesis 3b postulates that keiretsu group affiliation in
the case of Japanese firms would have a positive moderating influence on the diversification-
performance relationship. Models 2B, 2D and 2F of Table 7show that the co-efficient of the
interaction term is positive and thus, hypothesis 3b is supported. As in the case of Indian firms,
the co-efficient of the diversification measure for Japanese firms is negative (Models 1B, 1D, 1F,
2B & 2D) whereas the co-efficient of the group affiliation measure is positive. Thus, the
moderating effect is dominated by the group affiliation measure. In summary, therefore, the
results support hypotheses 1a, 1b, 2a, 2b and 3b while it does not support hypothesis 3a.
16
Table 7: Regression Results for macroeconomic scarce environment
The Table presents the results of the OLS regression, with ROA as the dependent variable, using specification (1) for the periods of
environmental scarcity (2008-09) for diversified firms of India and Japan. Model 1 provides the regression results without the
interaction variable while model 2 provides the regression results with the interaction variable. All variables are defined in Appendix
A. The data was averaged over the time-period to rule out the effects of business cycles. The regression results are corrected for
heteroskedasticity using White heteroskedasticity consistent standard errors and co-variance. The symbols *, ** and *** denote
significance at 10%, 5% and 1% level respectively.
Variable Model 1 Model 2
(A) (B) (C) (D) (E) (F) (A) (B) (C) (D) (E) (F)
India Japan India Japan India Japan India Japan India Japan India Japan
Intercept 0.08 0.13 0.03 0.15 0.14 0.21 0.18 0.01 0.05 0.58 0.13 0.19
LN(NSEG) -0.41*** -0. 24** -0.76** -0.38**
HERF 0.47 -0.31** -0.14** -0.42**
ENTR 0.57 -0.27** 0.22 0.09***
GR 1.62* 0.61 2.22** 0.52** 1.67** 0.16** 0.56** 0.14*** 0.27*** 0.19** 1.41** 0.27**
AGE 0.38*** 0.54** 0.41 0.11 0.42* -0.24 0.27 -0.35 0.17 -0.58 0.34* 0.16
LN(SALES) 2.18 0.12 1.16*** 0.53* 1.24 0.17 2.41 0.19 2.11** 1.25*** 0.41* 0.38
CR 0.37 0.34** 0.34 0.38 0.67*** 0.09* 0.66** 0.16* 0.18 0.16 0.08 1.10
LEVERAGE -0.21** -0.18 -0.19 -0.06* -0.19* -0.06** 0.21 -0.14 -0.22 -0.41 -0.28** -0.64
TRADEINT 0.08 0.26 0.07 0.01 0.08 0.14 0.08 0.21** 0.00 0.77 0.09 0.16
LN(NSEG)*GR 0.63*** 0.06**
HERF*GR 0.97** 0.68**
ENTR*GR 0.18 0.55**
Industry
dummies
Included Included Included Included Included Included Included Included Included Included Included Included
Adjusted R2 0.34 0.32 0.30 0.30 0.36 0.35 0.36 0.34 0.34 0.28 0.25 0.35
No. of obs. 186 224 186 224 186 224 186 224 186 224 186 224
Data has been collected from Worldscope Fundamental database.

17
5. Discussion and Conclusion
The preceding analysis of the relationship between diversification strategy, business or keiretsu
affiliation and performance of firms within the macroeconomic settings of munificence and
scarcity has yielded interesting results. The principal finding is that individual strategic factors
yield varying effects on financial performance as macroeconomic settings change. In the case of
Indian firms, diversification, which has a positive impact on firm’s performance during periods
of macroeconomic munificence, has a negative impact during periods of macroeconomic
scarcity. In the case of Japanese firms, group affiliation, which has a negative impact during
macroeconomic munificent period, has a positive impact on firm performance in a scarcity
environment.
Environment-led prosperity, thanks to a rapidly growing economy and rapidly rising domestic
demand that emerging economies such as India and China have witnessed before the current
economic slowdown, may have temporarily masked the ineffective product diversification of
firms. As long as the firm had located itself in a high-growth economy, demand factors lifted
profitability temporarily. Those general demand-pull factors appear to have overwhelmed the
specific strategy-performance relationships since no individual business model, in terms of
product diversity, functioned effectively to outperform others in this period. Most of the
emerging economies in the last three decades have been growing at high rates and so, the results
of studies done during this period show that high diversification has a positive impact on
performance (see Chang & Hong, 2000; Keister, 1998; Khanna & Palepu, 2000a, 2000b; Li &
Wong, 2003; Ma, Yao & Xi, 2006; Yiu, et al., 2005). A few studies that looked at the
diversification impact on performance in times of crisis (Asian Crisis, specifically) have found
that diversification is not beneficial to firm performance (Chakrabarti et al., 2007; Lim et al.,
2009).
Diversified Japanese firms, on the other hand, showed an inferior performance as compared to
focused firms. Such behaviour can be argued from the institutional perspective; in developed
economies, external intermediate institutions, such as financial markets, stock markets and
labour markets are efficient and thus, firms that seek to internalise these functions through
diversification will not be rewarded in the market place (McMillan, 2008; Meyer, 2001; Tong,
Reuer, & Peng, 2008). However, keiretsu affiliation, whose effect on firm performance was
negative in munificent environments, turned positive during periods of macroeconomic scarcity.
This may be because of the different organisational structure of business groups in Japan as
compared to India. The “main bank” of a keiretsu in Japan functions as a convenient substitute to
intra-firm resources by offering necessary finances when the afflicted firms do not generate
enough resources to implement their growth strategies (Miyazaki, 1980; Morikawa, 1992).
Under conditions of macroeconomic scarcity, keiretsu bank would provide loans to affiliated
firms at concessional rates at a time when bad loans troubles of most banks might have forced
bank to be selective and deliberate in credit allocation (Miwa & Ramseyer, 2001). Moreover,

18
lending by the main bank, especially in periods of macroeconomic scarcity, would lead to high
level of monitoring by the bank, resulting in efficient use of resources.
Notwithstanding the different relationship between diversification, business group affiliation and
firm performance among Indian and Japanese firms, the moderating effect of business group
affiliation on diversification-performance relationship remains positive for both munificent and
scarcity environments. The combined effect of business group affiliation and diversification
results in a positive outcome for firm performance. The negative impact of diversification in a
scarcity environment is dominated by the positive impact of business group or keiretsu
affiliation. The advantages of business groups in emerging economies like India, as a response
to market failures (Khanna & Palepu, 1997), such as superior allocation of resources (Guillén,
2000) and benefits of social network (Gerlach, 1992; Granovetter, 2005), outweigh the cost of
affiliation such as negative reputation effects and cross-subsidisation, even in times of economic
scarcity. The bank ties in the case of keiretsu firms acted as a relational asset, which functioned
positively for Japanese firms (Lincoln & Gerlach, 2004). Such firms continued their external
debt financing through their keiretsu banks even during times of economic scarcity.
Our paper has practical implications for policy makers. In countries as varied as China, India,
Japan, Korea, Malaysia and South Korea, to name a few, policy makers are debating the future of
diversified business groups. The debates have grown especially furious as a scarce macro-
economic environment, coupled with a financial crisis, reshape the economic landscape of many
of these countries. Some policy makers such as those in South Korea are arguing for a reduction
in the diversity of business groups while others in China are encouraging them to become
diversified. Yet others in South Africa are advocating a mixed stance. Others such as in India and
Chile have chosen to deregulate market institutions so as to help business groups become more
competitive. It is difficult to justify such variance in public policy without properly
understanding the roles that business groups play in different macro-economic conditions. Our
study, while not speaking directly of the wisdom of these policy initiatives, suggest that polices
need to be modified not only on the basis of the institutional development of the country but also
on the basis of broad macro-economic conditions.
6. Limitations and future research directions
While the present study has empirically contributed to the context-sensitive arguments of
diversification and group affiliation relationships with firm’s performance, the study is not
without limitations, which may be improved upon by future researchers. First, in this paper, we
were concerned about the short time window of our study, although this research design partially
controls for the endogenous effects of firm adaptation and external institutional change, allowing
us to focus exclusively on the impact of diversification on firm performance. Future researchers
may wish to work with data for a longer time-period with proper control for time-varying
measures.
19
Second, systematic empirical extensions in different geographical settings would be fruitful to
generalise the arguments of this study.
Finally, the findings of our study can provide a potentially rewarding direction upon which
future research can be built. Given that our analysis suggests the significance of macroeconomic
factors such as munificence and scarcity in determining firm performance, future work can
systematically examine the roles of strategy and industry in different macro-economic settings.
That may possibly bring in critical insights to resolve the ongoing debate on the disaggregated
variance of profitability.

20
References
Aoki, M. 1994. Monitoring characteristics of the main bank system. In M. Aoki & H. Patrick
(Eds.). The Japanese Main Bank System. Oxford University Press, NY.
Baltagi, B.H. 2005. Econometric Analysis of Panel Data. John Wiley & Sons, Ltd UK.
Berglof, E., and Perotti, E. 1994. The governance structure of the Japanese financial keiretsu.
Journal of Financial Economics, 36 (V): 259–284.
Carney, M., Gedajlovic, E.R., Heugens, P.P.M.A.R., Essen, M.V. & Oosterhout, J.V. 2011.
Business group affiliation, performance, context and strategy: A meta-analysis.
Academy of Management Journal, 54(November): 437-460.
Chakrabarti, A., Singh, K. and Mahmood. I., 2007. Diversification and performance: Evidence
from East Asian firms. Strategic Management Journal, 28(2): 101-120.
Chakravarthy B. S 1986. Measuring strategic performance. Strategic Management Journal,
7(5): 437–458,
Chang, S, J., and Hong, J. 2002. How much does the business group matter in Korea? Strategic
Management Journal, 23(3): 265-274.
Chang, S. J. and Choi, U. 1988. Strategy, structure and performance of Korean business
groups: A transactions cost approach. The Journal of Industrial Economics, 37(2):
141-158
Chang, S.J. and Hong, J. 2000. Economic performance of group-affiliated companies in Korea;
Intragroup resource sharing and internal business transaction. Academy of
Management Journal, 43(3): 429-448.
Chu, W. 2004. Are group-affiliated firms really more profitable than non-affiliated? Small
Business Economics, 22: 391-405.
Collis, D., and Montgomery, C. (1995). Competing on resources: Strategy in the 1990s.
Harvard Business Review, 76: 118–128.
Colpan, A. M., 2008. Are strategy-performance relationships contingent on macroeconomic
environments? Evidence from Japan’s textile industry. Asia Pacific Journal of
Management, 25(4): 635-665.
21
Colpan, A.M. and Hikino, T. 2005. Changing economic environments, evolving diversification
strategies, and differing financial performance: Japan's largest textile firms, 1970-
2001. Industrial and Corporate Change, 14(3): 897-940
Delios, A., and Beamish, P. W. 1999. Geographic scope, product diversification, and the
corporate performance of Japanese firms. Strategic Management Journal, 20(8):
711–727.
Dess, G. G. and Beard D. W. 1984. Dimensions of Organizational Task Environments
Administrative Science Quarterly, 29: 52-73
Dosi, G., Coriat, B., and Pavitt, K. 2000. Competencies, capabilities and corporate
performances. Laboratory of Economics and Management, Dynacom Working
Paper, Laboratory of Economics and Management, Sant’Anna School of Advanced
Studies, Pisa.
Economic Survey, 2009-10. http://indiabudget.nic.in/es2009-10/esmain.htm
Gaur, A.S and Kumar, V. 2009. International diversification, business group affiliation and
firm performance: Empirical evidence from India. British Journal of Management,
20: 172–186.
Gemba, K., and Kodama, F. 2001. Diversification dynamics of the Japanese industry. Research
Policy(3), 30:1165–1184.
George R. and Kabir R. 2008. Business groups and profit redistribution: A boon or bane for
firms? Journal of Business Research, 61(4): 1004-1014
George R. and Kabir R. 2012. Heterogeneity in business groups and the corporate
diversification–firm performance relationship. Journal of Business Research
65(2):412-420
Geringer, M. J., Tallman, S., and Olsen, D. M. 2000. Product and international diversification
among Japanese multinational firms. Strategic Management Journal, 21(8): 51–80.
Gerlach M.L. 1992. Alliance Capitalism: The Social Organization of Japanese Business.
University of California Press, Berkeley
Goll, I., and Rasheed, A. M. A. 1997. Rational decision-making and firm performance: The
moderating role of environment. Strategic Management Journal, 18(7): 583–591.
22
Granovetter, M. 2005. Business groups. In Smelser, N.J. and Swedberg. R. (Eds.), Handbook of
Economic Sociology. Princeton University Press: Princeton, NJ and Russell Sage
Foundation: New York
Grant, R.M., Jammine, A.P., and Thomas, H., 1988, Diversity, diversification, and
profitability among British manufacturing companies 1972-84, Academy of
Management Journal, 31(4): 771-801.
Guillén, M.F. 2000. Business groups in emerging economies: A resource based view. Academy
of Management Journal, 43(3): 362-380.
Hoskisson, R.E. Eden, L., Lau, C.M. and Wright, M. 2000. Strategy in emerging markets. The
Academy of Management Journal, 43: 249-267.
Itami, H., Kagono, T., Yoshihara, H., and Sakuma, A. 1982. Diversification strategies and
economic performance. Japanese Economic Studies, 11(1): 78–110.
Jacqueimin, A.P. and Berry, C.H. 1979. Entropy measure of diversification and corporate
growth. The Journal of Industrial Economics, 24(XXVII): 359-369
Kagono, T., Nonaka, I., Sakakibara, K., and Okumura, A. 1985. Strategic vs. evolutionary
management: A U.S.–Japan comparison of strategy and organization. Amsterdam:
North-Holland.
Kakani, R.K. 2000. Financial performance and diversification strategy of Indian business
groups. Unpublished doctoral dissertation, Indian Institute of Management,
Calcutta
Kang, J. K., Shivdasani, A., and Yamada, T. 2000. The effect of bank relations on investment
decisions: An investigation of Japanese takeover bids. Journal of Finance, 55:
2197–2218.
Keister, L. A. 1998. Engineering growth: Business group structure and firm performance in
China’s transition economy. American Journal of Sociology, 104: 404–40.
Khanna, T. and Palepu, K. 1997. Why focused strategies may be wrong for emerging markets?
Harvard Business Review, 77: 3-10.
23
Khanna, T. and Palepu, K. 2000a. Is group affiliation profitable in emerging markets: An
analysis of Indian diversified business groups? Journal of Finance, 55(2): 867-
891.
Khanna, T. and Palepu, K. 2000b. The future of business groups in emerging markets: Long-
run evidence from Chile. The Academy of Management Journal, 43: 268-285.
Kim, H., Hoskisson, R. E., and Wan, W. P. 2004. Power dependence, diversification strategy,
and performance in keiretsu member firms. Strategic Management Journal, 25(7):
613–636.
Klein, M. W., Peek, J., and Rosengren, E. S. 2002. Troubled banks, impaired foreign direct
investment: the role of relative access to credit. American Economic Review, 92:
664–682.
Koberg, C. 1987. Resource scarcity, environmental uncertainty, and adaptive organizational
behaviour. Academy of Management Journal, 30(4): 798-807.
Kock, C.F. and Gullien, M.F. 2001. Strategy and structure in developing countries: Business
group as an evolutionary response to opportunities for unrelated diversification.
Industrial and Corporate Change.10(4): 77-113
Li, M., Ramaswamy, K., and Petitt, B. S. P. 2006. Business groups and market failures: A
focus on vertical and horizontal strategies. Asia Pacific Journal of Management,
23(4): 439–452.
Li, M., & Wong Y. 2003 Diversification and economic performance: An empirical assessment
of Chinese firms. Asia Pacific Journal of Management, 20(5): 243–265.
Lim, E.N., Das, S.S. and Das, A. 2009. Diversification strategy, capital structure and the Asian
financial crises (1997-1988): Evidence from Singapore firms. Strategic
Management Journal, 30 (6): 577-594
Lincoln, J. R., and Gerlach, M. L. 2004. Japan’s network economy: Structure, persistence, and
change. Cambridge University Press, Cambridge.
Lins, K, and Servaes, H. 2002. Is corporate diversification beneficial in emerging markets?
Financial Management 31: 5-31.

24
Lu, J. W., and Beamish, P. W. 2004. International diversification and firm performance: The S-
curve hypothesis. Academy of Management Journal, 47(4): 598–609.
Luo, X., and Chung, C.N. 2005. Keeping it all in the family: The role of particularistic
relationships in business group performance during institutional transition.
Administrative Science Quarterly, 50(6): 404–439.
Ma, X., Yao, X., Xi, Y. 2006. Business group affiliation and firm performance in a transition
economy: A focus on ownership voids. Asia Pacific Journal of Management,
23(2): 467-483
Markides, C. and Williamson, P.J. 1994. Corporate Diversification and Organizational
Structure: A Resource-Based View. The Academy of Management Journal,
39(4):340-367.
Markides, C. C. 1992. Consequences of Corporate Refocusing: Ex Ante Evidence. The
Academy of Management Journal, 35: 398-412
Markides, C. C. 1995. Diversification, restructuring and economic performance. Strategic
Management Journal, 16(10): 101–118.
Mayer, M., and Whittington, R. 2003. Diversification in context: A cross-national and cross-
temporal extension. Strategic Management Journal, 24(8): 773–781
McMillan J. 2008. Market institutions. In S. Durlauf, & L. Blume (eds.). The New Palgrave
Dictionary of Economics. Palgrave Macmillan: London, UK; Vol. 3.
Meyer K.E. 2001. Institutions, transaction costs and entry mode choice. Journal of International
Business Studies31: 357–368.
Miwa, Y., and Ramseyer, J. M. 2001. The myth of the main bank: Japan and comparative
corporate governance. Discussion paper no.333, Harvard Law School, Cambridge,
M.A.
Miyazaki, Y. 1980. Industry and business in Japan. White Plains. N.Y.: M.E. Sharp.
Morikawa, H. 1992. Zaibatsu: The Rise and Fall of Family Enterprise Groups in Japan. Tokyo:
University of Tokyo Press.
25
Palich L. E., Cardinal L. B. and Miller C. 2000. Curvilinearity in the diversification-
performance linkage: An examination of over three decades of research. Strategic
Management Journal, 21(6): 155-174.
Peng, M. W., & Delios, A. 2006. What determines the scope of the firm over time and around
the world? An Asia Pacific perspective. Asia Pacific Journal of Management, 23:
385–405.
Perry, R. 1998. A Meta Analytic Review of Diversification–Performance Relationship:
Aggregating Findings in Strategic Managements. Doctoral dissertation, Florida
Atlantic University.
Purkayastha S., Manolova T.S, and Edelman L. F. 2011 Diversification and Performance in
Developed and Emerging Market Contexts: A Review of the Literature.
International Journal of Management Reviews 14:18-38
Purkayastha, S. 2009. Diversification and Performance: A Study of Indian Manufacturing
Firms. Unpublished doctoral dissertation, Icfai University, Dehradun.
Randolph, W. and Dess, G. 1984. The congruence perspective of organization design: A
conceptual model and multivariate research approach. Academy of Management
Review(6), 9: 114-27.
Robins, J.A. and Wiersema, M.F. 1995. A resource-based approach to the multibusiness firm:
empirical analysis of portfolio interrelationships and corporate financial
performance. Strategic Management Journal, 1(10): 277-99.
Rumelt, R. P. 1984. Towards a strategic theory of the firm. In R. B. Lamb (Ed.), Competitive
Strategic Management: 566–570. Englewood Cliffs, NJ: Prentice-Hall.
Rumelt, R.P. 1974. Strategy, structure and economic performance. MA: Harvard University
Press, Cambridge.
Sambharya R. 2000. Assessing the construct validity of strategic and SIC-based measures of
corporate diversification. British Journal of Management 11: 163-173.
Saple, V. 2000. Diversification, Merger and Their Effect on Firm Performance: A Study of the
Indian Corporate Sector. Doctoral dissertation, Indira Gandhi Institute of
Development Research, Mumbai, India.

26
Singh D. A. and. Gaur A. S. 2009. Business group affiliation, firm governance, and firm
performance: Evidence from China and India. Corporate Governance: An
International Review, 17: 411–425
Teece, D.J. 1980. Economies of scope and the scope of the enterprise. Journal of Economic
Behavior and Organization, 3: 223-247.
Tong, T., Reuer, J.J. and Peng, M.W. 2008. International joint ventures and the value of
growth options. Academy of Management Journal 51(6): 1014-1029.
Weidenbaum, M. and Hughes, S. 1996. The bamboo network: How expatriate Chinese
entrepreneurs are creating a new economic superpower in Asia, The Free Press,
New York.
World Bank, 2011. http://data.worldbank.org/indicator/NY.GDP.MKTP.KD.ZG, July, 2012
World Economic Outlook. 2009. http://www.imf.org/external/pubs/ft/weo/2009/01/pdf/text.pdf
Yasai-Ardekani, M. 1989. Effects of environmental scarcity and munificence on the
relationship of context to organizational structure. Academy of Management
Journal, 32(3):131-56.
Yiu D.W., Lu Y., Bruton G. D. and Hoskisson R. E.. 2007. Business groups: An integrated
model to focus future research. Journal of Management Studies. 8:1551-1579
Yiu, D., Bruton, G.D. and Lu, Y. 2005. Understanding business group performance in an
emerging economy: Acquiring resources and capabilities in order to prosper.
Journal of Management Studies, 42: 183-206
Zattoni A., Pedersen T. and Kumar V. 2009. The performance of group-affiliated firms during
institutional transition: A longitudinal study of Indian firms. Corporate
Governance: An International Review, 17: 510–523, July 2009
27
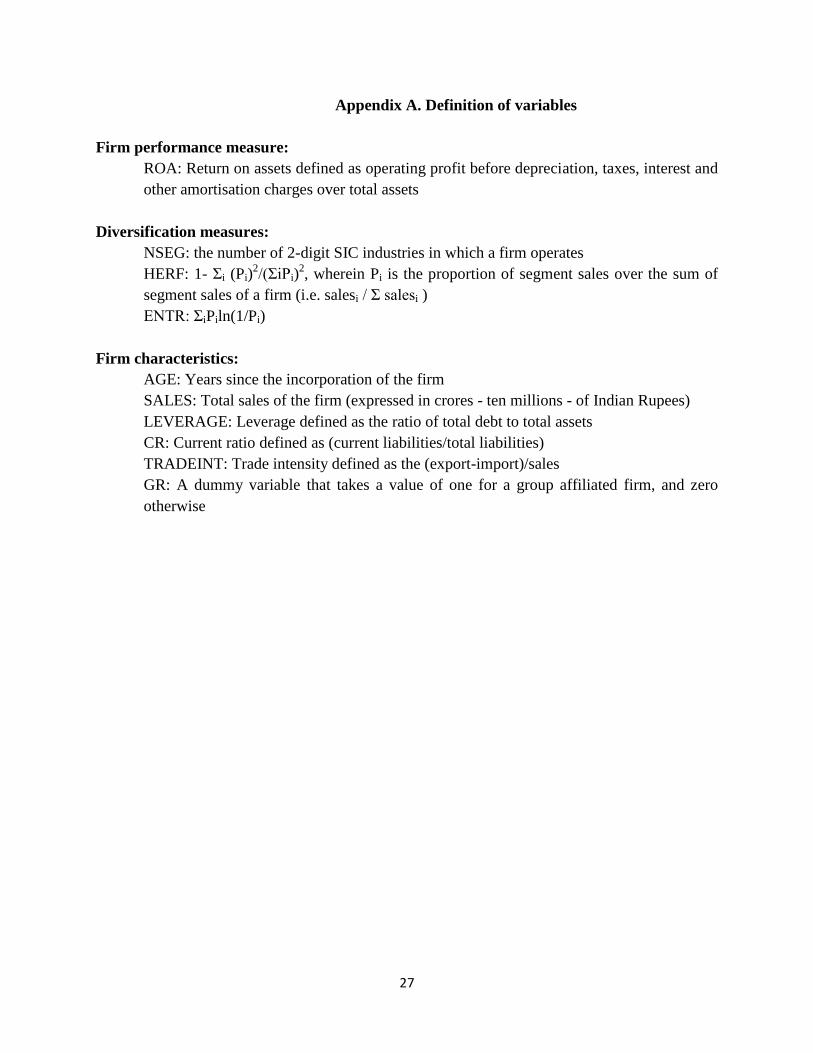
Appendix A. Definition of variables
Firm performance measure:
ROA: Return on assets defined as operating profit before depreciation, taxes, interest and
other amortisation charges over total assets
Diversification measures:
NSEG: the number of 2-digit SIC industries in which a firm operates
HERF: 1- Σi (Pi)2/(ΣiPi)
2, wherein Pi is the proportion of segment sales over the sum of
segment sales of a firm (i.e. salesi / Σ salesi )
ENTR: ΣiPiln(1/Pi)
Firm characteristics:
AGE: Years since the incorporation of the firm
SALES: Total sales of the firm (expressed in crores - ten millions - of Indian Rupees)
LEVERAGE: Leverage defined as the ratio of total debt to total assets
CR: Current ratio defined as (current liabilities/total liabilities)
TRADEINT: Trade intensity defined as the (export-import)/sales
GR: A dummy variable that takes a value of one for a group affiliated firm, and zero
otherwise
28
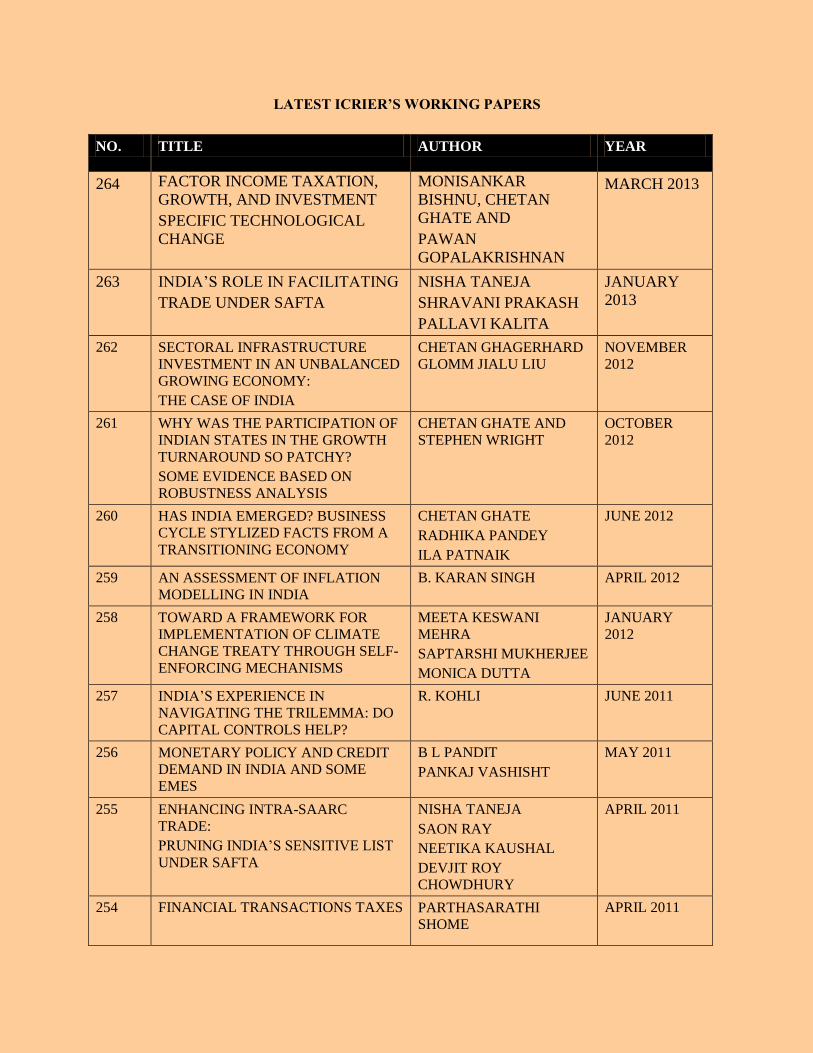
LATEST ICRIER’S WORKING PAPERS
NO. TITLE AUTHOR YEAR
264 FACTOR INCOME TAXATION,
GROWTH, AND INVESTMENT
SPECIFIC TECHNOLOGICAL
CHANGE
MONISANKAR
BISHNU, CHETAN
GHATE AND
PAWAN
GOPALAKRISHNAN
MARCH 2013
263 INDIA’S ROLE IN FACILITATING
TRADE UNDER SAFTA
NISHA TANEJA
SHRAVANI PRAKASH
PALLAVI KALITA
JANUARY
2013
262 SECTORAL INFRASTRUCTURE
INVESTMENT IN AN UNBALANCED
GROWING ECONOMY:
THE CASE OF INDIA
CHETAN GHAGERHARD
GLOMM JIALU LIU
NOVEMBER
2012
261 WHY WAS THE PARTICIPATION OF
INDIAN STATES IN THE GROWTH
TURNAROUND SO PATCHY?
SOME EVIDENCE BASED ON
ROBUSTNESS ANALYSIS
CHETAN GHATE AND
STEPHEN WRIGHT
OCTOBER
2012
260 HAS INDIA EMERGED? BUSINESS
CYCLE STYLIZED FACTS FROM A
TRANSITIONING ECONOMY
CHETAN GHATE
RADHIKA PANDEY
ILA PATNAIK
JUNE 2012
259 AN ASSESSMENT OF INFLATION
MODELLING IN INDIA
B. KARAN SINGH APRIL 2012
258 TOWARD A FRAMEWORK FOR
IMPLEMENTATION OF CLIMATE
CHANGE TREATY THROUGH SELF-
ENFORCING MECHANISMS
MEETA KESWANI
MEHRA
SAPTARSHI MUKHERJEE
MONICA DUTTA
JANUARY
2012
257 INDIA’S EXPERIENCE IN
NAVIGATING THE TRILEMMA: DO
CAPITAL CONTROLS HELP?
R. KOHLI JUNE 2011
256 MONETARY POLICY AND CREDIT
DEMAND IN INDIA AND SOME
EMES
B L PANDIT
PANKAJ VASHISHT
MAY 2011
255 ENHANCING INTRA-SAARC
TRADE:
PRUNING INDIA’S SENSITIVE LIST
UNDER SAFTA
NISHA TANEJA
SAON RAY
NEETIKA KAUSHAL
DEVJIT ROY
CHOWDHURY
APRIL 2011
254 FINANCIAL TRANSACTIONS TAXES PARTHASARATHI
SHOME
APRIL 2011

29
About ICRIER
Established in August 1981, ICRIER is an autonomous, policy-oriented, not-for-profit, economic
policy think tank. ICRIER's main focus is to enhance the knowledge content of policy making by
undertaking analytical research that is targeted at informing India's policy makers and also at
improving the interface with the global economy. ICRIER's office is located in the institutional
complex of India Habitat Centre, New Delhi.
ICRIER's Board of Governors includes leading academicians, policymakers, and representatives
from the private sector. Dr. Isher Ahluwalia is ICRIER's chairperson. Dr. Rajat Kathuria is
Director and Chief Executive.
ICRIER conducts thematic research in the following seven thrust areas:
Macro-economic Management in an Open Economy
Trade, Openness, Restructuring and Competitiveness
Financial Sector Liberalisation and Regulation
WTO-related Issues
Regional Economic Co-operation with Focus on South Asia
Strategic Aspects of India's International Economic Relations
Environment and Climate Change
To effectively disseminate research findings, ICRIER organises workshops, seminars and
conferences to bring together academicians, policymakers, representatives from industry and
media to create a more informed understanding on issues of major policy interest. ICRIER
routinely invites distinguished scholars and policymakers from around the world to deliver
public lectures and give seminars on economic themes of interest to contemporary India.


![2nd Chapter Macro Environment[1]](https://img.pdfslide.net/doc/110x75/55cf8c565503462b138b8aaa/2nd-chapter-macro-environment1.jpg)