Embed Size (px)
Citation preview
Impact of mobile phone-based money transfer services in agriculture: evidence from
Kenya
Oliver K. Kirui (Corresponding Author)
International Maize and Wheat Improvement Centre, P.O. Box 1041-00621, Nairobi, Kenya
Tel: +254 723804178 Email: [email protected]
Julius J. Okello
University of Nairobi, P.O. Box 29053-00625, Nairobi, Kenya
Tel: +254 727869515 Email: [email protected]
Rose A. Nyikal
University of Nairobi, P.O. Box 29053-00625, Nairobi, Kenya
Tel: +254 722841016 Email: [email protected]
Selected Paper prepared for presentation at the International Association of Agricultural
Economists (IAAE) Triennial Conference, Foz do Iguaçu, Brazil, 18-24 August, 2012.
Copyright 2012 by [authors]. All rights reserved. Readers may make verbatim copies of this
document for non-commercial purposes by any means, provided that this copyright notice appears on
all such copies.
Abstract
The recent introduction of mobile phone-based money transfer (MMT) services in developing
countries has generated a lot of interest among development partners. It facilitates transfer of
money in a quick and cost effective way. It also offers an easy and secure platform for small
savings to majority of rural populations with no access to formal financial services.
However, the impact of MMT services on smallholder agriculture has not been documented.
This study therefore contributes to pioneering literature on the impact of MMT, especially in
agriculture. It provides information regarding financial intermediation to the excluded
through the use of new generation Information Communication Technology (ICT) tools
especially the mobile phone. The study employs propensity score matching technique to
examine the impact of MMT services on household agricultural input use, agricultural
commercialization and farm incomes among farm households in Kenya. It uses cross-
sectional data collected from 379 multi-stage randomly selected households in Central,
Western and Nyanza provinces of Kenya. The study found that use of MMT services
significantly increased level of annual household input use by $42, household agricultural
commercialization by 37% and household annual income by $224. We conclude that MMT
services in rural areas help to resolve an idiosyncratic market failure that farmers face;
access to financial services. We therefore recommend that other developing countries should
follow the Kenyan model and provide an enabling environment that would facilitate entry
and survival of MMT initiatives.
Key words: Mobile phones, money transfer, M-PESA, impact, smallholder farmers, Kenya
1. Introduction
Sending or receiving money for either payment of salaries, settlement of business
transactions, payment of school fees, or for family support is a common phenomenon for both
businesses and individuals. It requires efficient, reliable and affordable money transfer
services whereby money can be deposited in one location and withdrawn in another in both
urban and rural areas (Kim et al., 2010, and Contini et al. 2011). Structural weaknesses in the
formal financial industry in Kenya, however, limit the access to money transfer services,
especially in rural areas and for low-income people (Hughes and Lonie, 2007). This is
because banks are concentrated mainly in urban centers and have conditions that constitute
barriers to the use of their services (Biljon and Kotzé, 2008). The cost of transfer, usually
charged as a percent of the amount sent, is considered expensive for small amounts for both
local and international transfers (Au and Kauffman, 2008).
The informal systems of money transfer such as individuals carrying money on
themselves or sending drivers and conductors are susceptible to highway robberies and thefts
(Kim et al., 2010 and Hughes and Lonie, 2007). Sander (2003) also noted that money sent
through friends and relatives is sometimes misused and at times never reaches its destination
while money sent through letters and parcels of the courier companies may be stolen. Other
challenges associated with the formal and semi-formal systems, include delays and long
queues, network limitations, insolvency of branches, unreliable communication and
misdirected parcels (Au and Kauffman, 2008).
This situation has changed dramatically in the last few years with the introduction of
mobile phone-based money transfer (MMT) services. The introduction of prepaid cards of
low denominations and the fallen prices of mobile handsets have lead to a rapid spread of
mobile phones in the developing countries (Orozco et al. 2007). This has opened up diverse
opportunities for it to be used beyond voice communication. At the centre of this experience
is money transfer. MMT service is an aspect of a broader concept emerging in the electronic
payment and banking industry referred to as Mobile banking (Orozco, 2003, Orozco et al.
2007). Even though MMT has not been well defined in literature it can be said to include all
the various activities (long-distance remittance, micro-payments, and informal air-time
battering schemes) that bring financial services to the unbanked using mobile technology.
Jenkins (2008) simply defined MM as money that can be accessed and used via mobile
phone.
The primary function of MMT services is to reduce the costs of making remittances
from one individual to another, especially across large distances (World Bank, 2009).
Because individuals do not need to withdraw or send balances immediately, they are also able
to accumulate savings on their MMT accounts over time. Thus MMT has become a savings
instrument, as well as a means to send money. Sometimes money is stored in an MMT
account simply to save a person from carrying too much cash, especially for example on long
and potentially dangerous bus trips. With a large network of MMT agents in the rural areas, it
can especially make it easy for agricultural households to reduce the time and cash expense in
accessing the funds they need to invest in agriculture.
The aim of this study is to assess the impact of the recently introduced mobile phone–
based money transfer (MMT) services among farm households in Kenya. Specifically, the
objective is to ascertain the impact of using these services on household input use, level of
household agricultural commercialization and level of household farm incomes. There is
growing interest in mobile money transfer services in Kenya driven by relatively high rural
mobile phone penetration rates and the historical exclusion of majority smallholder farmers
from formal financial markets.
2. Mobile phone–based money transfer (MMT) in Kenya
Four companies provide mobile phone services in Kenya. These include Safaricom,
Airtel (formally Zain), YU and Orange (formally Telkom Kenya). Safaricom was the first
company to provide mobile services and MMT services in Kenya. In partnership with the
Commercial Bank of Africa and a micro-finance company, Faulu Kenya, Safaricom designed
and tested a micro-payment platform called M-PESA in 2004. ‘Pesa’ means ‘money’ in
Kiswahili and the prefix ‘M’ refers to the use of a mobile phone to facilitate banking
transactions. M-PESA began by using Safaricom’s airtime retailers (agents) to issue
microloans that borrowers would repay at an interest rate reduced by eliminating the
overhead conventional microloans carried. However, the skilled worker in Kenya soon began
using the facility to transfer cash from working relatives in the city to their families in the
rural areas (Hughes and Lonie, 2007). Consequently, M-PESA money transfer service was
officially launched in March 2007 as a MMT service. MMT service in Kenya is almost
synonymous with M-PESA. Meanwhile, Airtel - the second largest mobile phone company
launched its MMT service called Airtel-Money (formally ZAP) in February 2009 while YU
mobile phone company introduced its services named and YU-CASH in December 2009.
Orange (formally Telcom and Posta) is the fourth and latest entrant to introduce its MMT
service called Orange Money in November 2010.
MMT operates in a very easy and simple way. MMT services allow customers to use
their phone like a bank account and a debit card. These customers credit their accounts at a
local authorized agent and can then transfer the money to another person’s phone or use for
different transactions such as making loan repayment, paying bills or redeeming it as cash.
MMT is still at an early stage of development in Kenya but ahead of the world: it is designed
to bring the economic advantages of having a savings and money transfer facility to those
with small, irregular or cyclical incomes (Pulver, 2009).
Recent evidence suggests that there is an increase in penetration and use of MMT
services in Kenya (Mason, 2007). In early 2011, Safaricom had an M-PESA subscription
base of about 16 million and about 17,000 agents (outlets) countrywide (Central Bank of
Kenya, 2011). Figures for the other MMT service players were not immediately available.
This represents substantially more points of service than the combined number of bank
branches (1063) and Automated Teller Machines (ATMs) (1979) (Central Bank of Kenya,
2010). Statistics from the Central Bank of Kenya indicate that Safaricom’s M-PESA users
moved more than Ksh. 728 Billion (approximately $8 Billion) in 2010 as compared to only
Ksh. 50 Million by Orange-money (Central Bank of Kenya, 2010). This amount was moved
in the more than 306 Million transactions conducted in the service. The report further puts
daily movement of cash to more than Ksh 2.3 Billion. Revenue from M-PESA in 2010 stood
at Ksh 12 Billion, up from Ksh 8 Billion in 2009 (Central Bank of Kenya, 2010). M-PESA
remains the most widely used method of mobile money transfer as evidenced by the number
and value of transactions effected.
MMT has a clear edge over banks especially because it is fast and cost-effective. For
instance, to send KSh. 35,000 ($ 350) within the country using a classic money transfer
company such as Western Union would cost KSh. 1,200 ($ 12), but using MMT method,
such as M-PESA, to send the same amount would cost only Ksh. 75 ($ 0.75) which is 6 times
cheaper (Central Bank of Kenya, 2010). Classic money transfer methods requires that one
must visit a given post office or bank (which could be a long distance away) to receive the
remitted cash. Most banks and post offices are associated with long queues and fixed times of
operation hence the opportunity cost of time spent while waiting to obtain the cash and other
transaction costs are usually high (Mason, 2007).
Successes in Africa (and particularly in Kenya’s M-PESA) are being tried out
elsewhere in the world. A recent inventory by the social venture credit SMS suggests that that
there are at least 23 distinct MMT, operating or pending in 20 countries following the success
of MPESA (Mas and Morawczynski, 2009). Some, like MTN’s Mobile Money, and Zain’s
Zap operate across multiple countries; others are country-specific. Some of these applications
include: a Greenefield deployment in Indonesia launched in 2009 and the SMART
Communications’ Island Activations Program in the Philippines (Pulver, 2009). The leading
Afghan mobile network operator, Roshan, anticipate building an M-PESA-like infrastructure
in Afghanistan by end of 2010.
3. Study Methods
Conceptual Framework
The desire to spur progress in smallholder agriculture has historically led to search for
new models of agricultural financing that address the constraints faced by farmers. Among
these models are interventions that provide agricultural finance to farmers in groups and
attempts to use the Grameen lending model (Zeller & Sharma, 2000). Other models link
farmers to formal agricultural finance markets through flexible lending systems that allow
recovery of loan from sales (such as interlinked credit schemes) (Gine, 2009). Other efforts
include establishment of credit and microfinance platforms based on collateralized lending
(Besley, 1994, Zeller & Sharma, 2000). Indeed, the emergence of rural micro-finance
organizations and Savings and Credit Cooperative Societies (SACCOs) has been based on the
premise that smallholder farmers need unique services that are close to them. These models
have had limited success due to factors such as high transaction costs of delivering the
services to small and widely dispersed farmers, high covariate risks, missing markets for
managing weather and market risks and the lack of suitable collateral (Poulton et al, 2006,
Okello et al, 2010). These factors limit the ability of smallholder farmers to save, borrow as
well as access remittances. In this paper we specifically focus on the later - access to
remittances.
Money transfer services in Kenya are provided by a variety of institutions and
individuals. At one end of the spectrum are individuals using the very informal and basic
systems of transfer such as physical transport of cash themselves or through relatives and
friends. At the other end are the modern commercial banks using state-of-the-art technology
of electronic fund transfer systems. Along the spectrum there are a range of services of
varying degrees of sophistication, including semi-formal providers.
Generally, commercial banks have been the major players in money transfer business
in Kenya, servicing mainly large users and, to a smaller extent, low-income users (World
Bank, 2003). Among the commercial bank instruments, telegraphic transfers, cheques,
electronic funds transfers and bank drafts are typically used for large value transfers, as they
offer the cheapest service for the transfer of large amounts (Wright, 2001). Western Union
and MoneyGram, which operate through commercial banks, are used almost exclusively to
receive money rather than send it. Despite the network of these formal providers throughout
the country, rural areas and client segments such as low-income earners tend to be excluded
(UN, 2006). Indeed, the financial exclusion (people without access to any form of financial
services stands at 38% of the Kenyan population (Financial Times, 2007 & FinAccess, 2009).
The availability of financial services in the rural areas has suffered a setback since the
mid-nineties when commercial banks closed down less-profitable branches especially in rural
areas. The post offices, with the single largest network of offices and often the only choice
for much needed basic financial services, withdrew their telegraphic money transfer service.
This left many rural and low-income people with few if any formal service alternatives,
especially for domestic money transfers (UN, 2005, World Bank 2003). Such gaps left by
formal providers have typically been bridged by informal means and services. These include
transporting the money oneself or sending it with a friend or through an unlicensed service
(Ravallion et al., 2007).
The frequencies and volumes of money transferred vary depending on seasonal needs.
For instance, transfers for school fee payments follow the school term calendar with
payments at the beginning of every term. Remittances from family members working in
urban areas and abroad for purposes of family support are regular and often small. The costs
of transfers also vary depending on the amounts sent, the instruments used and also the
destination. Fees range from less than 1% to 35% of the amount being transferred (World
Bank, 2006, Owens, 2007). It is cheaper to transfer large amounts than small amounts for
both local and international transfers. For small amounts, the fee as percentage of amount
sent can be higher than 35% due to the high minimum fees charged for every transfer while
for very large amounts the percentage can be lower than 1% of the value (Owens, 2007). This
often discourages and rations out clients with small remittances.
The World Bank (2006) finds that there have been an increasing number of agencies
(both public and private) involved in raising the reach and efficiency of financial
intermediation targeting the poorest clientele/households. Their task of providing financial
services at reasonable costs to poor smallholder farmers has not been easy. The poor
economic conditions in rural communities make running of such organizations unprofitable.
Consequently, most financial organizations tend to be located in commercial centres where
there is enough clientele to make their operations profitable. Such centres, however, tend to
be inaccessible to the remotely located smallholder farmers. The lack of access to a broader
set of financial options represents a potential constraint to entrepreneurship and the ability to
undertake socially and privately profitable investment projects (Coetzee, 1997, Haggblade et
al, 2007).
Rural financial intermediation is expensive because participants are geographically
scattered, financial transactions are small and rural incomes tend to be unstable (Lariviere and
Martin, 1999 & Schrieder, 2000). However, the arrival of MMT service in Africa (Kenya in
particular) has significantly altered the status quo. It can, theoretically, resolve the
constraints smallholder farmers face in accessing finances by reducing the transaction costs
associated with access to financial services. First, it can make money transfer into farming
communities easy and instant. Consequently, farmers do not have to incur high time and
travel costs to travel to banking facilities. Second, it can include the hitherto excluded farmers
into the banking services by reducing the costs of accessing remitted funds or depositing
small savings. The latter is especially important because unlike the commercial banks and
savings organizations, MMT services attract no ledger fees and minimum balances. At the
same time, it attracts a very modest withdrawal fee that is affordable to farmers. By
facilitating cheap and timely transfer of small amounts of money across large distances,
MMT can improve the investment in, and allocation of, human capital as well as physical
capital. One element of banking not offered by MMT services is lending. It is however
acknowledged that producers could improve their productivity by reorganizing their
resources, not by necessarily borrowing (Nyikal, 2003).
Theoretical model: Examining the impact of an intervention
The effect of use of MMT is examined by assessing its impact on household share of
agricultural sales (i.e., agricultural commercialization), level of input use and agricultural
income. The level of household agricultural commercialization in this study is computed as a
ratio of the value of sales to the value of total production. Input use and agricultural income
were measured as value of purchased inputs and agricultural revenue respectively. The
inputs considered in this study included fertilizer, improved seed varieties, pesticides, and
hired labour.
The dependent variables in the three cases above is continuous therefore OLS can
potentially be used to estimate the model relating to level of household commercialization
index, input use and agricultural income to a set of right-hand side variables, i.e., Equation
(1). The OLS model can be expressed as:
Yi = X’β + αmPm +ui i,m =1,2,3,……n (1)
where, Yi , the dependent variable, measures the outcome (i.e., commercialization index or
input use or income), β is a vector of parameters to be estimated, X is a matrix of the
explanatory variables that include farmer-specific, farm-specific, asset endowment and
location (regional) characteristics. Pi is a dummy variable indicating use of MMT services
(1=user, 0=otherwise), and ui is the error term.
In the above formulation, αm which is a constant coefficient of the dummy Pm gives
the average effect (Average Treatment Effect on Treated - ATT) of use of MMT services on
users (Heckman et al., 1999). If the explanatory variables X perfectly captured impact of
MMT on the user then αm would be an unbiased estimator of use of MMT on users. In other
words, the formulation in Equation (1) assumes absence of selection bias, which is unlikely
to be the case. Ideally, the ATT is likely to be affected by other confounding factors not
captured in X.
In presence of selection biases, OLS regression techniques tend to yield biased
estimates. Previous authors have employed different models to counter this problem. These
include the Heckman two-step (HS) method, the Instrumental Variable (IV) method and the
difference-in-indifference method (Puhani, 2000; Wooldridge, 2002; Vandenberghe and
Robin, 2004). However HS and IV have inherent weakness and assumptions that are overly
restrictive (Ali and Abdulai (2010). Both of these procedures are completely dependent on
the strong assumption that unobserved variables are normally distributed. Another limitation
of these approaches is that it requires/uses at least one variable in the treatment equation to
serve as instrument in specifying the outcome equation. Finding such instruments has
remained a setback in empirical application of these methods. Difference-in-differences
method is appropriate when panel data are available. This method differs from cross-sectional
matching in that it allows for temporally invariant differences in outcomes between users and
non-users (Smith and Todd, 2005). Recent studies have employed the use of propensity score
matching technique in the evaluation of the impact of a program/intervention in the presence
of selection bias using cross-sectional data. This study applies the propensity score matching
technique.
The propensity score matching technique
Propensity score matching consists of matching treatment with controls/comparison
units (i.e., users of MMT with non- users) that are similar in terms of their observable
characteristics. The difference in outcome variables between the matches and then
computing and averaged to obtain the ATT. It follows that the expected treatment effect
(ATT) for the treated population is of primary significance.
Let Yi1
= outcome after treatment (i.e., use of MMT), and Yi0= outcome without
treatment. Then the causal effect on an individual i is given by:
Yi = Yi
1- Yi
0 (2)
The estimated causal effect is thus given by:
Ε(Yi) =Ε (Yi1-Yi
0) =Ε (Yi
1) – E (Yi
0) (3)
When using cross-section data, for impact evaluation, it is impossible to observe individual
treatment effect since we do not know the outcomes for untreated observations when it is
under treatment (Yi1) and for treated when it is not under treatment (Yi
0). Propensity score
matching therefore takes a treated individual and matches with a control of similar pre-
participation characteristics. Any difference in the outcome (household level of
commercialization, household income or input use) will then be attributed to the treatment
(use of MMT service).
Propensity score matching technique begins with an estimation of a probit of a logit that
assigns every individual a score (propensity score) that shows the probability of being
included in the matching process. Mathematically, the probability that an individual is
treated, given the observable variables, can be expressed as:
Prob(x) = Prob [P=1|X=x] (4)
Where P=1 is the observable treatment (user of MMT) and 0 otherwise; X is a vector of pre-
participation characteristics including farmer-specific, farm-specific, asset endowment and
regional/location variables. The implicit functional form of estimated use equation in this
study is given by:
mtransfer=mtransfer(age, gender, occupation, distance to the market, number of enterprises,
household size, household income, assets value, education, farming experience, group
membership, district dummies) + e (5)
where e is the random error term.
The estimated scores are then used for matching the users and non-users. The four
techniques that have been used in the matching process are: Nearest Neighbour Matching
(NNM), Radius Matching (RM), Kernel Based Matching (KBM) and Mahalanobis Metric
Matching (MMM) techniques. The NNM consists of matching each treated individual with
the control individual that has the closest propensity score. It allows for replacement of the
matches which increases the average quality of matching, but reduces the number of distinct
nonparticipant observations used to construct the counterfactual mean, thereby increasing the
variance of the estimator (Smith and Todd, 2005).
In Radius Matching (RM) approach, an individual from the control group is chosen
as a matching partner for a participant that lies within the specified radius in terms of
propensity score. Usually a smaller radius results in better quality matching. The Kernel
Based Matching (KBM) on the other hand involves matching each participant with a
weighted average of all controls. The weights used are inversely proportional to the distance
between the propensity scores of participants and controls.
Mahalanobis Metric Matching (MMM) technique randomly orders subjects and then
calculates the distance between the first treated subject and all controls. The minimum
distance between the treated subject and the controls is used as a match and the procedure is
repeated for all the covariates. This technique is usually appropriate for panel data hence not
applied in this study. All these matching algorithms compute the difference between the
matched treatment and control which is then averaged to obtain the average treatment effect
on the treated (ATT). The ATT is measure of the impact of a program/intervention.
Sampling procedure and data
This study was part of a wider project implemented by Electronic Agricultural
Research Network in Africa (eARN-Africa). The aim of the project was to evaluate the
effectiveness of ICTs in helping smallholder farmers commercialize. The project had been
implemented in three different districts each in a separate province. These include Kirinyaga
(Central province), Bungoma (western province) and Migori (Nyanza province). These
districts were characterized by poor access to markets by small farmers and reliance on
agriculture. The study districts were selected to represent diverse agro-ecological zones,
socio-economic environment, cultural diversity and varying production systems. For
example, Kirinyaga district is considered a high potential area with export oriented export
crops (French beans, baby-corn and Asian vegetables). Bungoma district on the other hand
grew mainly maize with sugarcane while Migori is considered low potential area with main
crops grown being maize and tobacco. Thus the choice of the districts presents differing
levels of commercialization. Kirinyaga district is mainly inhabited by people of Kikuyu
ethnic group while Bungoma and Migori districts are mainly inhabited by Luhya and Luo
ethnic groups respectively.
Sampling procedure was done in three stages. First, the three districts (project
districts) were purposely selected. Second, in each of the district, a location was randomly
identified. A list of all farm households was then drawn with the help of local administration
(village elders and area agricultural extension officers). Third, the respondents were then
randomly sampled from the lists. A total of 379 farmers were interviewed in this study. These
comprised of 198 (52%) users of MMT and 181(48%) non-users of MMT. We compare and
contrast these respondents in the next section.
The data was collected through personal interviews using pre-tested questionnaire and
data entered and analyzed using SPSS and STATA packages. The data collected included
household characteristics, socio-economic indicators, household assets, information sources,
ownership and use of mobile phones, sources and uses of income, among others. The
household survey was conducted during March and April of 2010.
4. Results
Characteristics of users and non users of MMT services
We present differences in the characteristics of users and non-users of MMT services with
test of significance in their differences in Table 1. We carried out t-tests for continuous
variables and chi-square test for categorical variables. Results suggest that there were
differences between users and non-users of MMT with respect to farmer-specific, farm-level
and asset endowment characteristics. Specifically, results show that users of MMT services
are more educated than their counterparts. Interestingly, non-users of MMT services are more
experienced in farming. There are also significant differences among the farm-specific
characteristics namely, distance to the bank, distance to the money transfer agent and distance
to the agricultural extension agent’s office. Users of MMT services have a closer proximity to
the MMT agent. Asset endowment (value of current assets) characteristics show no
significant difference between the groups.
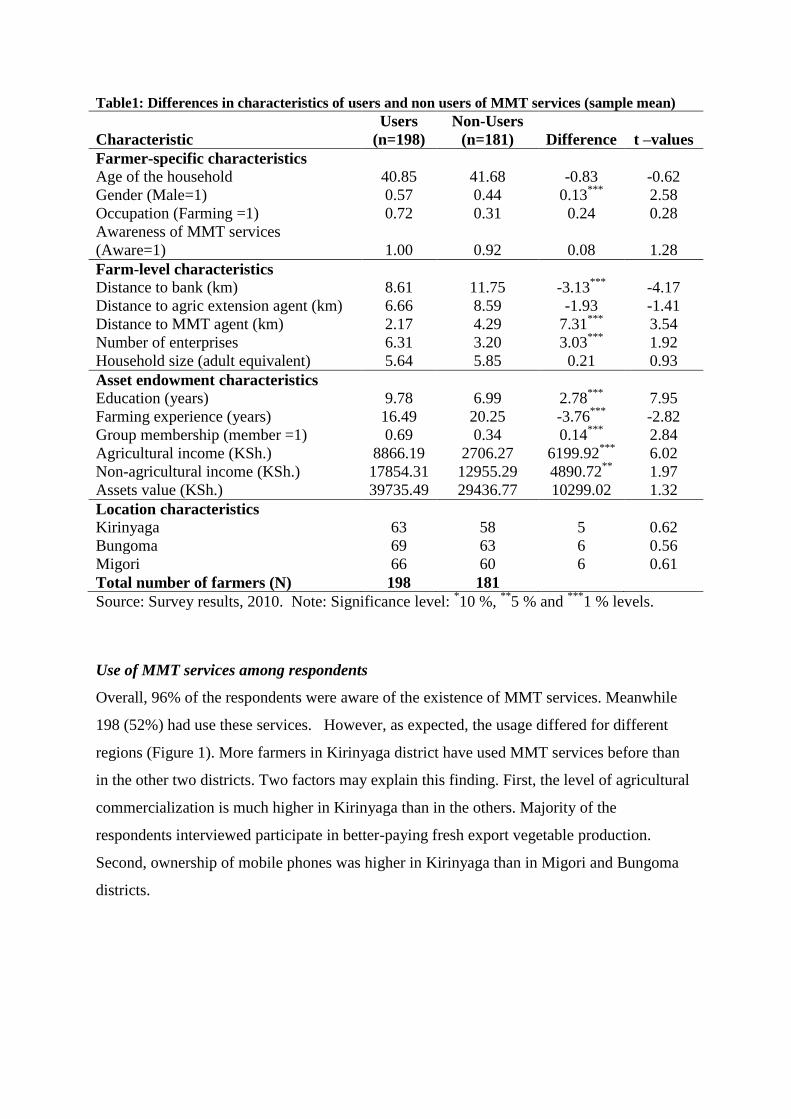
Table1: Differences in characteristics of users and non users of MMT services (sample mean)
Characteristic
Users
(n=198)
Non-Users
(n=181) Difference t –values
Farmer-specific characteristics
Age of the household 40.85 41.68 -0.83 -0.62
Gender (Male=1) 0.57 0.44 0.13***
2.58
Occupation (Farming =1) 0.72 0.31 0.24 0.28
Awareness of MMT services
(Aware=1) 1.00 0.92 0.08 1.28
Farm-level characteristics
Distance to bank (km) 8.61 11.75 -3.13***
-4.17
Distance to agric extension agent (km) 6.66 8.59 -1.93 -1.41
Distance to MMT agent (km) 2.17 4.29 7.31***
3.54
Number of enterprises 6.31 3.20 3.03***
1.92
Household size (adult equivalent) 5.64 5.85 0.21 0.93
Asset endowment characteristics
Education (years) 9.78 6.99 2.78***
7.95
Farming experience (years) 16.49 20.25 -3.76***
-2.82
Group membership (member =1) 0.69 0.34 0.14***
2.84
Agricultural income (KSh.) 8866.19 2706.27 6199.92***
6.02
Non-agricultural income (KSh.) 17854.31 12955.29 4890.72**
1.97
Assets value (KSh.) 39735.49 29436.77 10299.02 1.32
Location characteristics
Kirinyaga 63 58 5 0.62
Bungoma 69 63 6 0.56
Migori 66 60 6 0.61
Total number of farmers (N) 198 181
Source: Survey results, 2010. Note: Significance level: *10 %,
**5 % and
***1 % levels.
Use of MMT services among respondents
Overall, 96% of the respondents were aware of the existence of MMT services. Meanwhile
198 (52%) had use these services. However, as expected, the usage differed for different
regions (Figure 1). More farmers in Kirinyaga district have used MMT services before than
in the other two districts. Two factors may explain this finding. First, the level of agricultural
commercialization is much higher in Kirinyaga than in the others. Majority of the
respondents interviewed participate in better-paying fresh export vegetable production.
Second, ownership of mobile phones was higher in Kirinyaga than in Migori and Bungoma
districts.
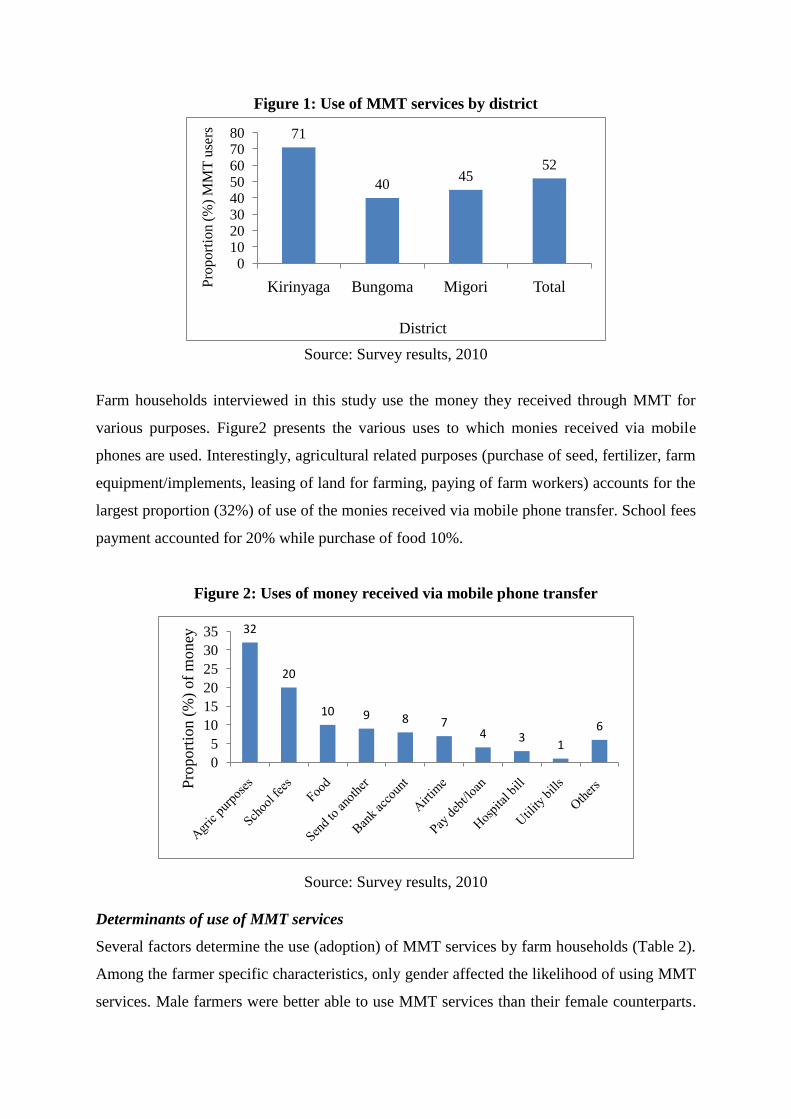
Figure 1: Use of MMT services by district
71
4045
52
01020304050607080
Kirinyaga Bungoma Migori TotalPro
port
ion (
%)
MM
T u
sers
District
Source: Survey results, 2010
Farm households interviewed in this study use the money they received through MMT for
various purposes. Figure2 presents the various uses to which monies received via mobile
phones are used. Interestingly, agricultural related purposes (purchase of seed, fertilizer, farm
equipment/implements, leasing of land for farming, paying of farm workers) accounts for the
largest proportion (32%) of use of the monies received via mobile phone transfer. School fees
payment accounted for 20% while purchase of food 10%.
Figure 2: Uses of money received via mobile phone transfer
32
20
10 9 8 74 3
1
6
0
5
10
15
20
25
30
35
Pro
port
ion
(%
) o
f m
on
ey
Source: Survey results, 2010
Determinants of use of MMT services
Several factors determine the use (adoption) of MMT services by farm households (Table 2).
Among the farmer specific characteristics, only gender affected the likelihood of using MMT
services. Male farmers were better able to use MMT services than their female counterparts.
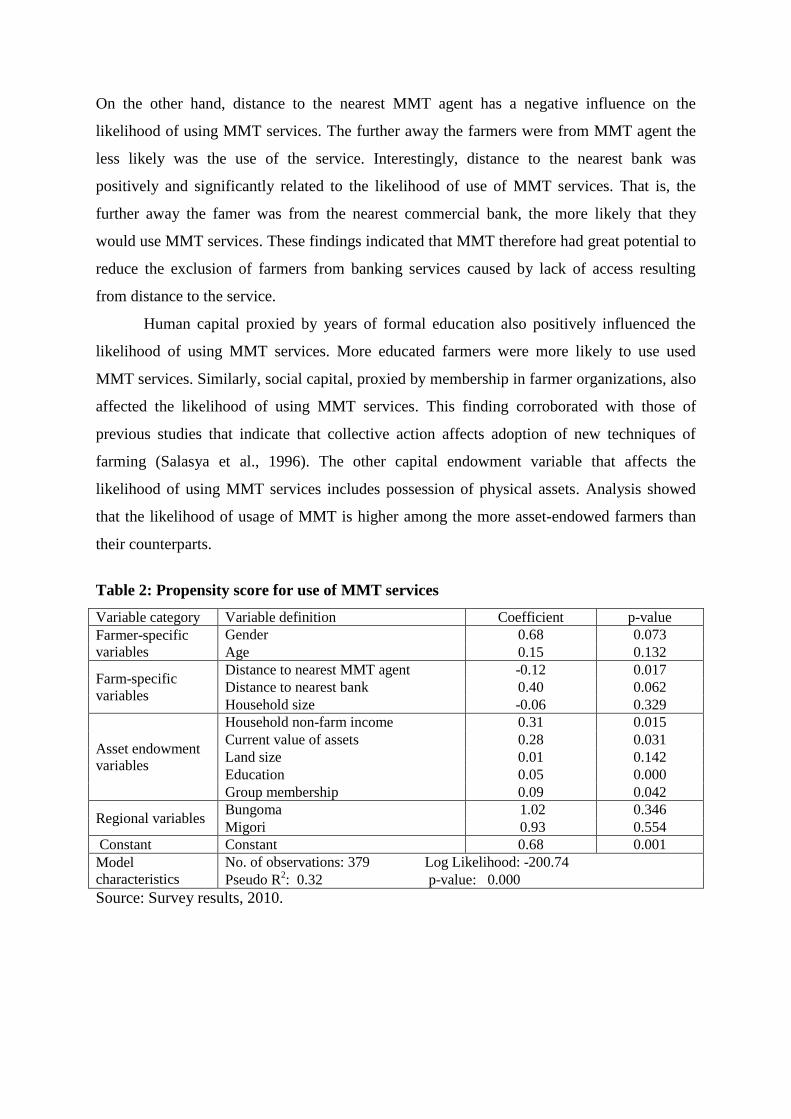
On the other hand, distance to the nearest MMT agent has a negative influence on the
likelihood of using MMT services. The further away the farmers were from MMT agent the
less likely was the use of the service. Interestingly, distance to the nearest bank was
positively and significantly related to the likelihood of use of MMT services. That is, the
further away the famer was from the nearest commercial bank, the more likely that they
would use MMT services. These findings indicated that MMT therefore had great potential to
reduce the exclusion of farmers from banking services caused by lack of access resulting
from distance to the service.
Human capital proxied by years of formal education also positively influenced the
likelihood of using MMT services. More educated farmers were more likely to use used
MMT services. Similarly, social capital, proxied by membership in farmer organizations, also
affected the likelihood of using MMT services. This finding corroborated with those of
previous studies that indicate that collective action affects adoption of new techniques of
farming (Salasya et al., 1996). The other capital endowment variable that affects the
likelihood of using MMT services includes possession of physical assets. Analysis showed
that the likelihood of usage of MMT is higher among the more asset-endowed farmers than
their counterparts.
Table 2: Propensity score for use of MMT services
Variable category Variable definition Coefficient p-value
Farmer-specific
variables
Gender 0.68 0.073
Age 0.15 0.132
Farm-specific
variables
Distance to nearest MMT agent -0.12 0.017
Distance to nearest bank 0.40 0.062
Household size -0.06 0.329
Asset endowment
variables
Household non-farm income 0.31 0.015
Current value of assets 0.28 0.031
Land size 0.01 0.142
Education 0.05 0.000
Group membership 0.09 0.042
Regional variables Bungoma 1.02 0.346
Migori 0.93 0.554
Constant Constant 0.68 0.001
Model
characteristics
No. of observations: 379 Log Likelihood: -200.74
Pseudo R2: 0.32 p-value: 0.000
Source: Survey results, 2010.
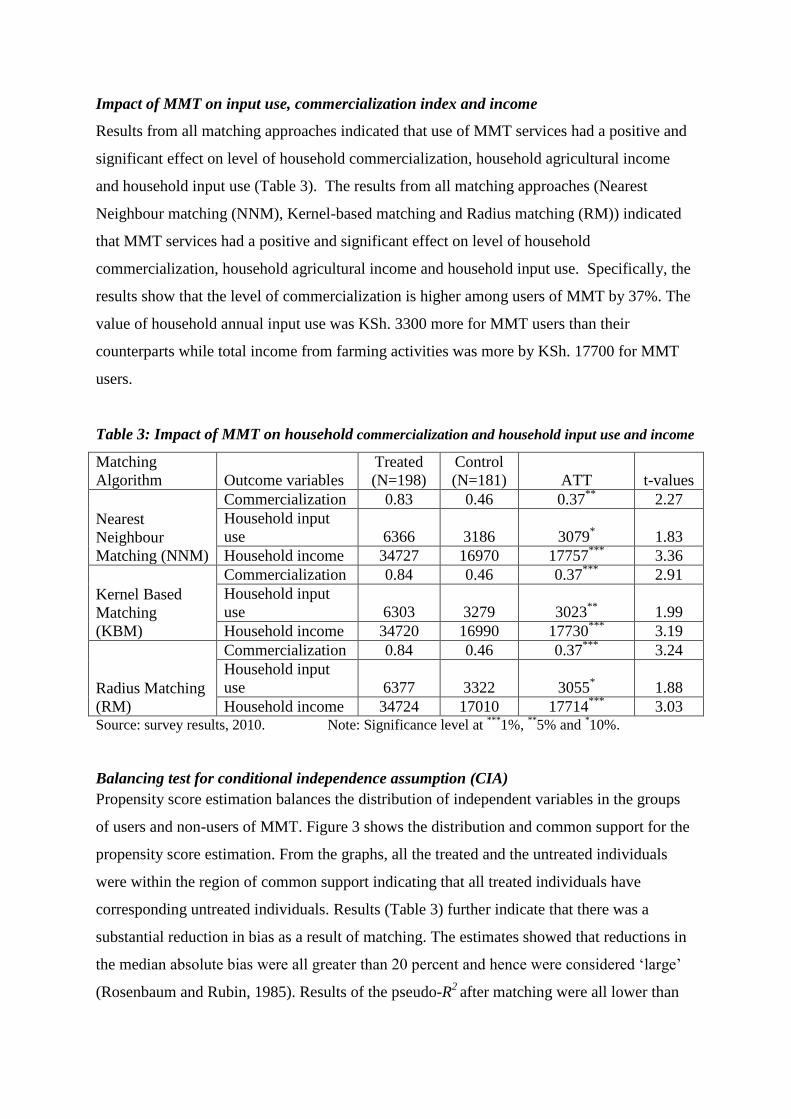
Impact of MMT on input use, commercialization index and income
Results from all matching approaches indicated that use of MMT services had a positive and
significant effect on level of household commercialization, household agricultural income
and household input use (Table 3). The results from all matching approaches (Nearest
Neighbour matching (NNM), Kernel-based matching and Radius matching (RM)) indicated
that MMT services had a positive and significant effect on level of household
commercialization, household agricultural income and household input use. Specifically, the
results show that the level of commercialization is higher among users of MMT by 37%. The
value of household annual input use was KSh. 3300 more for MMT users than their
counterparts while total income from farming activities was more by KSh. 17700 for MMT
users.
Table 3: Impact of MMT on household commercialization and household input use and income
Matching
Algorithm Outcome variables
Treated
(N=198)
Control
(N=181) ATT t-values
Nearest
Neighbour
Matching (NNM)
Commercialization 0.83 0.46 0.37**
2.27
Household input
use 6366 3186 3079* 1.83
Household income 34727 16970 17757***
3.36
Kernel Based
Matching
(KBM)
Commercialization 0.84 0.46 0.37***
2.91
Household input
use 6303 3279 3023**
1.99
Household income 34720 16990 17730***
3.19
Radius Matching
(RM)
Commercialization 0.84 0.46 0.37***
3.24
Household input
use 6377 3322 3055* 1.88
Household income 34724 17010 17714***
3.03 Source: survey results, 2010. Note: Significance level at
***1%,
**5% and
*10%.
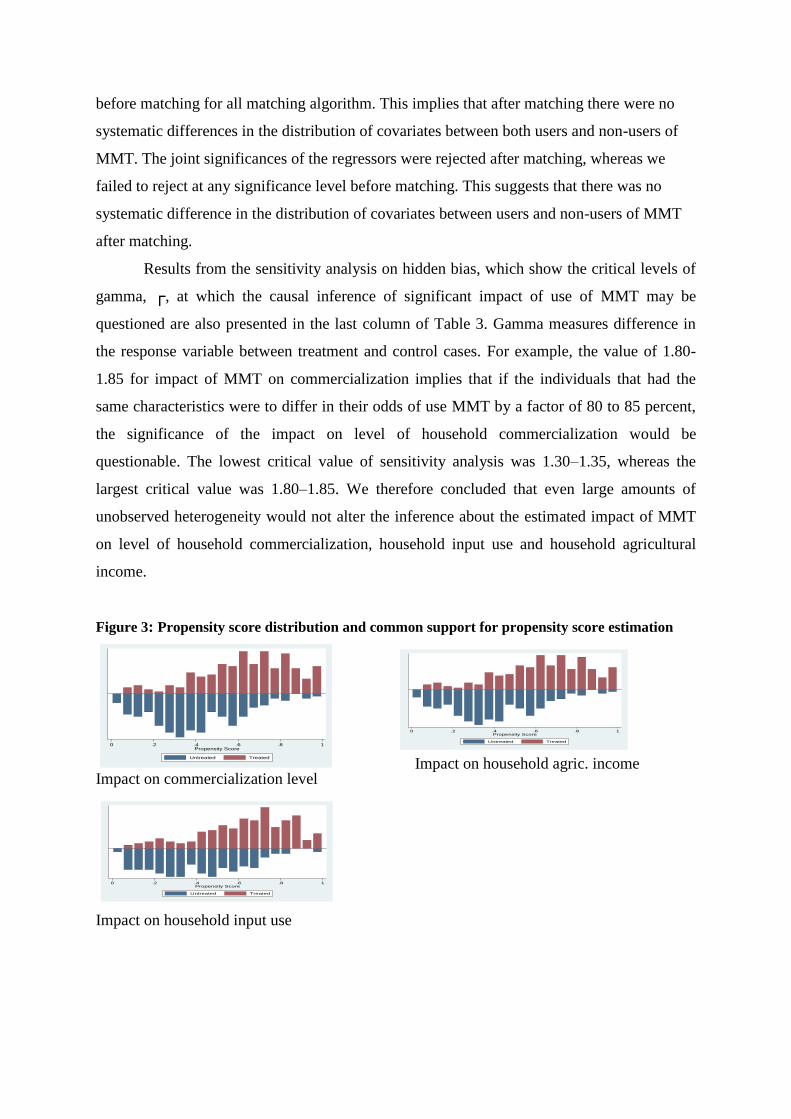
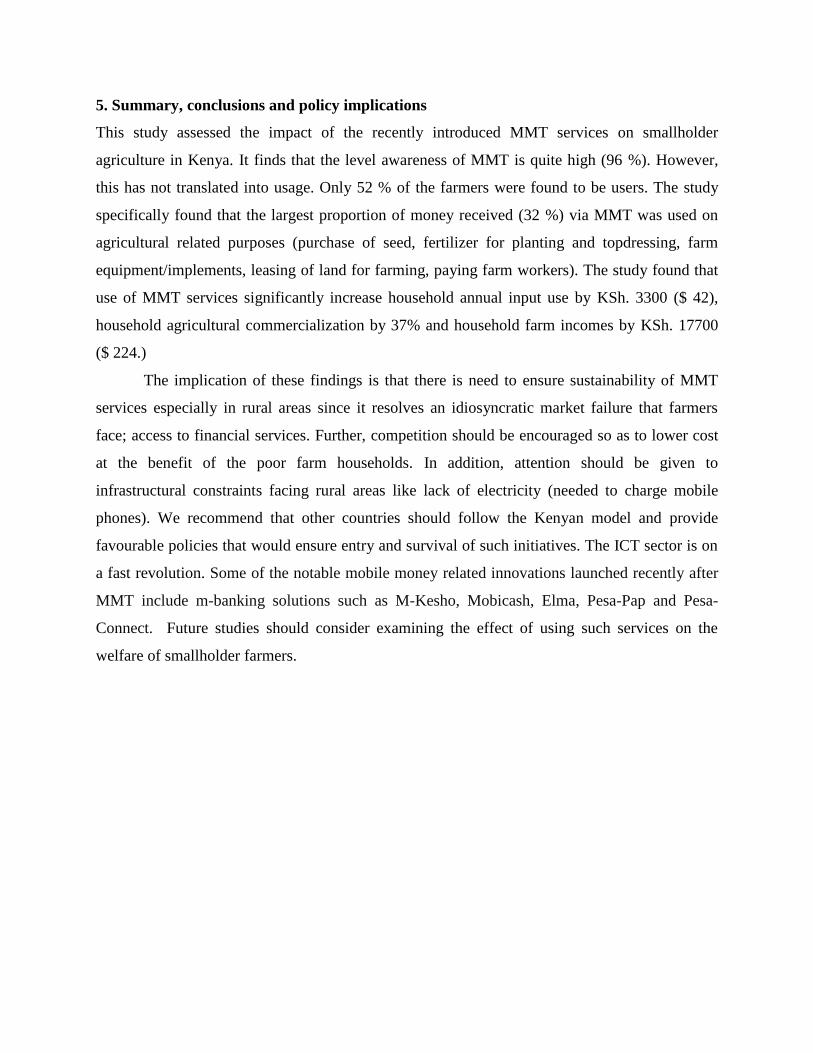
Balancing test for conditional independence assumption (CIA)
Propensity score estimation balances the distribution of independent variables in the groups
of users and non-users of MMT. Figure 3 shows the distribution and common support for the
propensity score estimation. From the graphs, all the treated and the untreated individuals
were within the region of common support indicating that all treated individuals have
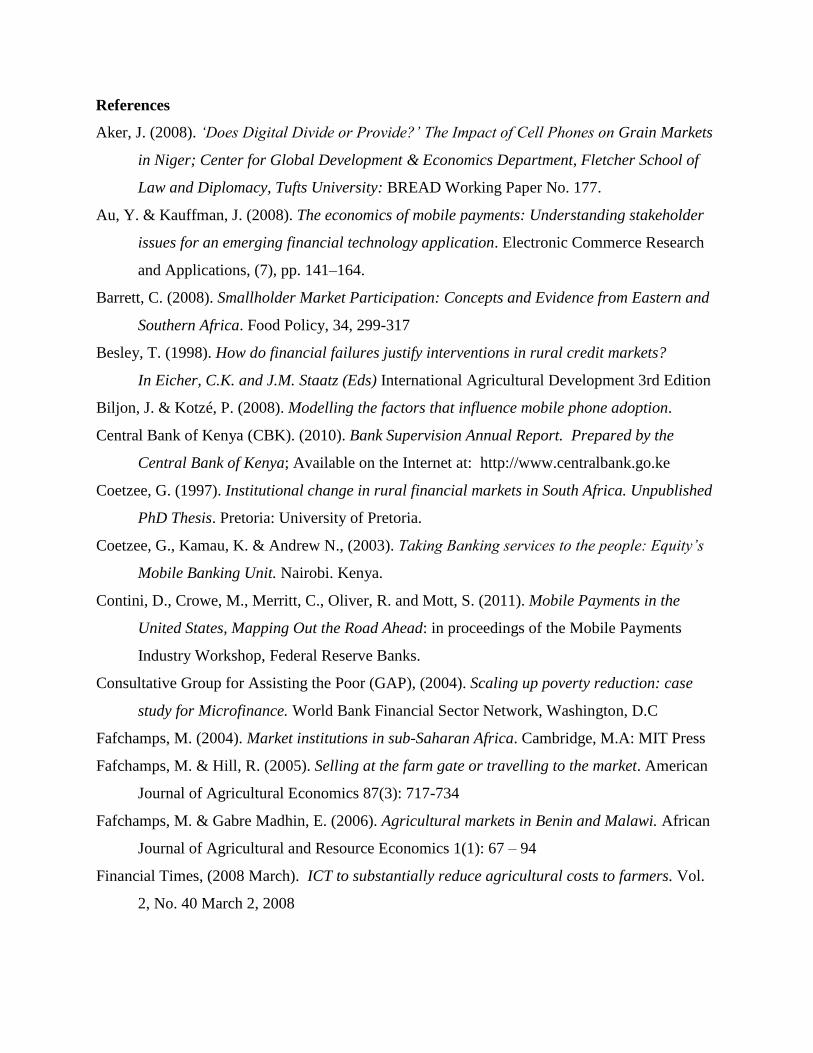
corresponding untreated individuals. Results (Table 3) further indicate that there was a
substantial reduction in bias as a result of matching. The estimates showed that reductions in
the median absolute bias were all greater than 20 percent and hence were considered ‘large’
(Rosenbaum and Rubin, 1985). Results of the pseudo-R2
after matching were all lower than
before matching for all matching algorithm. This implies that after matching there were no
systematic differences in the distribution of covariates between both users and non-users of
MMT. The joint significances of the regressors were rejected after matching, whereas we
failed to reject at any significance level before matching. This suggests that there was no
systematic difference in the distribution of covariates between users and non-users of MMT
after matching.
Results from the sensitivity analysis on hidden bias, which show the critical levels of
gamma, ┌, at which the causal inference of significant impact of use of MMT may be
questioned are also presented in the last column of Table 3. Gamma measures difference in
the response variable between treatment and control cases. For example, the value of 1.80-
1.85 for impact of MMT on commercialization implies that if the individuals that had the
same characteristics were to differ in their odds of use MMT by a factor of 80 to 85 percent,
the significance of the impact on level of household commercialization would be
questionable. The lowest critical value of sensitivity analysis was 1.30–1.35, whereas the
largest critical value was 1.80–1.85. We therefore concluded that even large amounts of
unobserved heterogeneity would not alter the inference about the estimated impact of MMT
on level of household commercialization, household input use and household agricultural
income.
Figure 3: Propensity score distribution and common support for propensity score estimation
Effect on Level of household
commercialization
Impact on household input use
Impact on household agric. income Impact on commercialization level
0 .2 .4 .6 .8 1Propensity Score
Untreated Treated
0 .2 .4 .6 .8 1Propensity Score
Untreated Treated
0 .2 .4 .6 .8 1Propensity Score
Untreated Treated
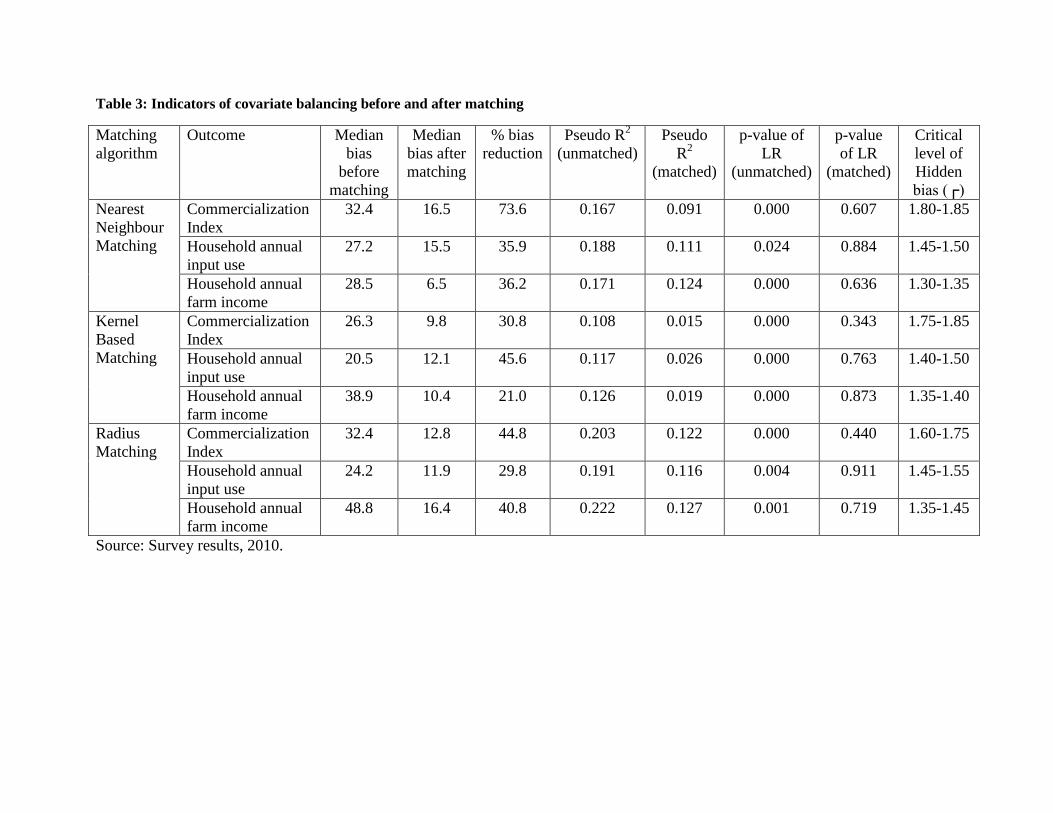
Table 3: Indicators of covariate balancing before and after matching
Matching
algorithm
Outcome Median
bias
before
matching
Median
bias after
matching
% bias
reduction
Pseudo R2
(unmatched)
Pseudo
R2
(matched)
p-value of
LR
(unmatched)
p-value
of LR
(matched)
Critical
level of
Hidden
bias (┌)
Nearest
Neighbour
Matching
Commercialization
Index
32.4 16.5 73.6 0.167 0.091 0.000 0.607 1.80-1.85
Household annual
input use
27.2 15.5 35.9 0.188 0.111 0.024 0.884 1.45-1.50
Household annual
farm income
28.5 6.5 36.2 0.171 0.124 0.000 0.636 1.30-1.35
Kernel
Based
Matching
Commercialization
Index
26.3 9.8 30.8 0.108 0.015 0.000 0.343 1.75-1.85
Household annual
input use
20.5 12.1 45.6 0.117 0.026 0.000 0.763 1.40-1.50
Household annual
farm income
38.9 10.4 21.0 0.126 0.019 0.000 0.873 1.35-1.40
Radius
Matching
Commercialization
Index
32.4 12.8 44.8 0.203 0.122 0.000 0.440 1.60-1.75
Household annual
input use
24.2 11.9 29.8 0.191 0.116 0.004 0.911 1.45-1.55
Household annual
farm income
48.8 16.4 40.8 0.222 0.127 0.001 0.719 1.35-1.45
Source: Survey results, 2010.
5. Summary, conclusions and policy implications
This study assessed the impact of the recently introduced MMT services on smallholder
agriculture in Kenya. It finds that the level awareness of MMT is quite high (96 %). However,
this has not translated into usage. Only 52 % of the farmers were found to be users. The study
specifically found that the largest proportion of money received (32 %) via MMT was used on
agricultural related purposes (purchase of seed, fertilizer for planting and topdressing, farm
equipment/implements, leasing of land for farming, paying farm workers). The study found that
use of MMT services significantly increase household annual input use by KSh. 3300 ($ 42),
household agricultural commercialization by 37% and household farm incomes by KSh. 17700
($ 224.)
The implication of these findings is that there is need to ensure sustainability of MMT
services especially in rural areas since it resolves an idiosyncratic market failure that farmers
face; access to financial services. Further, competition should be encouraged so as to lower cost
at the benefit of the poor farm households. In addition, attention should be given to
infrastructural constraints facing rural areas like lack of electricity (needed to charge mobile
phones). We recommend that other countries should follow the Kenyan model and provide
favourable policies that would ensure entry and survival of such initiatives. The ICT sector is on
a fast revolution. Some of the notable mobile money related innovations launched recently after
MMT include m-banking solutions such as M-Kesho, Mobicash, Elma, Pesa-Pap and Pesa-
Connect. Future studies should consider examining the effect of using such services on the
welfare of smallholder farmers.
References
Aker, J. (2008). ‘Does Digital Divide or Provide?’ The Impact of Cell Phones on Grain Markets
in Niger; Center for Global Development & Economics Department, Fletcher School of
Law and Diplomacy, Tufts University: BREAD Working Paper No. 177.
Au, Y. & Kauffman, J. (2008). The economics of mobile payments: Understanding stakeholder
issues for an emerging financial technology application. Electronic Commerce Research
and Applications, (7), pp. 141–164.
Barrett, C. (2008). Smallholder Market Participation: Concepts and Evidence from Eastern and
Southern Africa. Food Policy, 34, 299-317
Besley, T. (1998). How do financial failures justify interventions in rural credit markets?
In Eicher, C.K. and J.M. Staatz (Eds) International Agricultural Development 3rd Edition
Biljon, J. & Kotzé, P. (2008). Modelling the factors that influence mobile phone adoption.
Central Bank of Kenya (CBK). (2010). Bank Supervision Annual Report. Prepared by the
Central Bank of Kenya; Available on the Internet at: http://www.centralbank.go.ke
Coetzee, G. (1997). Institutional change in rural financial markets in South Africa. Unpublished
PhD Thesis. Pretoria: University of Pretoria.
Coetzee, G., Kamau, K. & Andrew N., (2003). Taking Banking services to the people: Equity’s
Mobile Banking Unit. Nairobi. Kenya.
Contini, D., Crowe, M., Merritt, C., Oliver, R. and Mott, S. (2011). Mobile Payments in the
United States, Mapping Out the Road Ahead: in proceedings of the Mobile Payments
Industry Workshop, Federal Reserve Banks.
Consultative Group for Assisting the Poor (GAP), (2004). Scaling up poverty reduction: case
study for Microfinance. World Bank Financial Sector Network, Washington, D.C
Fafchamps, M. (2004). Market institutions in sub-Saharan Africa. Cambridge, M.A: MIT Press
Fafchamps, M. & Hill, R. (2005). Selling at the farm gate or travelling to the market. American
Journal of Agricultural Economics 87(3): 717-734
Fafchamps, M. & Gabre Madhin, E. (2006). Agricultural markets in Benin and Malawi. African
Journal of Agricultural and Resource Economics 1(1): 67 – 94
Financial Times, (2008 March). ICT to substantially reduce agricultural costs to farmers. Vol.
2, No. 40 March 2, 2008
Haggblade, S., Hazell, P. & Reardon, T. (2007). Transforming the Rural Nonfarm Economy:
Opportunities and Threats in the Developing World. Johns Hopkins University Press, 51p
Jaffee, S. (2005). Transaction costs, risk and the organization of private sector food commodity
systems In: Jaffee, S. and Morton, J. (Eds). Marketing Africa's High Value Foods:
Comparative Experiences of an Emergent Private Sector, Dubuque, Iowa.
Jenkins, B. (2008). “Developing Mobile Money Ecosystems.” Washington, DC: IFC and the
Harvard Kennedy School.
Kim, C., Mirsobit, M. & Lee, I. (2010). An empirical examination of factors influencing the
intention to use mobile payment, Computers in Human Behavior, 26, pp. 310–322.
Mutua, M. & Lineth, O. (2007 November). Poverty Reduction through Enhanced Rural Access
to Financial Services in Kenya. Institute for Policy Analysis and Research (IPAR).
Southern and Eastern Africa Policy Research Network (SEAPREN) Working Paper No. 6
North, D. (1990). Institutions, Institutional Change and Economic Performance Cambridge.
Cambridge University Press
Okello, J., & Swinton, S. (2005). Compliance with International Food Safety Standards in
Kenya's Greene Bean Industry: A Paired Case Study of Small and Large Family Farms.
Selected paper for American Agricultural Economics Association (AAEA) annual
meeting, Providence, RI, July 24-27, 2005
Okello, J., Edith O., Oliver, M. & Ruth, O. (2010). Using ICT to integrate smallholder farmers
into agricultural value chain: the case of DrumNet project in Kenya. International Journal
of ICT and Research Development, 1:23-37
Omamo, S. (1998). Farm-to-market transaction costs and specialization in small-scale
agriculture: explorations with non-separable household model. Journal of Development
Studies 35, 152-163
Orozco, M. (2003). Worker Remittances: an international comparison.” Working Paper
commissioned by the Multilateral Investment Fund, Inter-American Development Bank,
February 2003. http://www.iadb.org/exr/prensa/images/RemittancesInternational.pdf
Owens, J. (2007). Leapfrogging access to finance with mobile phone technology: Philippine
rural banks offering M-banking & M-commerce services. Presentation, IFC/CGAP
conference 17-19 September 2007, Washington, D.C.,
http://siteresources.worldbank.org/FSLP/Resources/JohnOwensshortversionupdated.pdf.
Poulton, C., Kydd, J & Doward, A. (2006). Overcoming market constraints on pro-poor
Agricultural growth in sub-Saharan Africa. Development Policy Review 24(3), 243-27
Ravallion, M., Chen, S. & Sangraula, P. (2007). New evidence on the urbanization of global
poverty. Policy Research Working Paper No. 4199 (Washington, D.C.: World Bank).
Mas, I. & Kabir K. (2008). Banking on Mobiles: Why, How, for Whom? Consultative Group to
Assist the Poor, Focus Note No. 48, Washington DC.
Sander, C. (2003). Migrant Remittances to Developing Countries - A Scoping Study: Overview
and Introduction to Issues for Pro-Poor Financial Services.” Prepared for DFID UK,
Schrieder, H. (2000). Estimation and inference in econometrics. New York: Oxford University
Press.
Stiglitz, J. (2000). Markets, Market Failures and Development. In Eicher, C. & Staatz, J. (Eds.).
International Agricultural Development. 3rd
ed. Baltimore: John Hopkins University Press
Stiglitz, J. & Weiss, A. (1981). Credit rationing in markets with imperfect information.
American Economic Review, vol. 71, no. 3: 393–410
United Nations. (2005). Department of Economic and Social Affairs: World Urbanization
Prospects: The 2005 Revision, Population Division, http://esa.un.org/unpp.
United Nations. (2006). Department of Economic and Social Affairs: World Population
Prospects: The 2006 Revision, Population Division, http://esa.un.org/unpp.
World Bank. (2003). Reaching the Rural Poor: A Renewed Strategy for Rural Development.
Washington, D.C.
World Bank (2006). Uganda poverty and vulnerability assessment. World Bank Report No.
392877. Poverty Reduction and Economic Management Unit. Africa. Washington, D.C.
World Bank. (2007). Uganda: Moving Beyond Recovery – Investment & Behavior Change, For
Growth. Country Economic Memorandum. World Bank Report No. 39221-UG. Poverty
Reduction and Economic Management Unit. Africa. September. Washington, D.C.
Wright, G. (2001). Market Research and Client Responsive Product Development. Micro Save-
Africa, Nairobi, 2001.
Zeller, M. & M. Sharma. (2000). Demand for and access to financial services by the rural poor:
A multi-country synthesis. In: Zeller, Manfred, and Manohar Sharma (Eds). Innovations in
rural micro-finance for the rural poor: Exchange of knowledge and implications for policy.
Feldafing, Germany: German Foundation for International Development (DSE).