Embed Size (px)
Citation preview
Impact of non-tariff measures on sea food industry and its potential implication for
sustainable development goals
Case of the EU export ban on Sri Lankan seafood industry
K.P.G. Lahiru Sandaruwan, Dr. Senal Weerasooriya and Prof. JeewikaWeerahewa
University of PeradeniyaSri Lanka
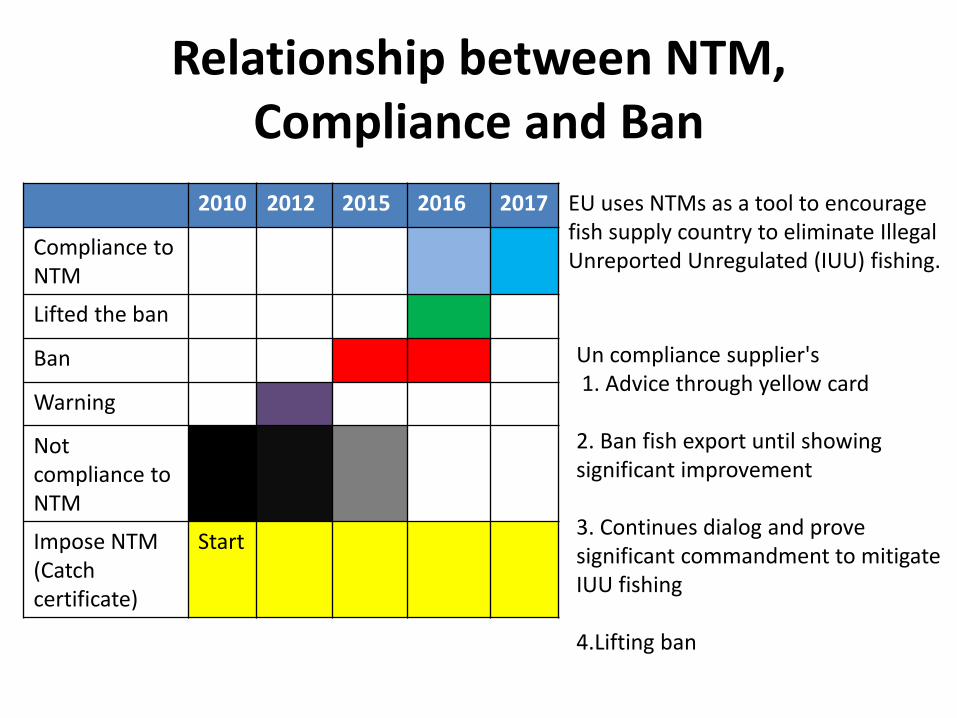
Relationship between NTM, Compliance and Ban
2010 2012 2015 2016 2017
Compliance to NTM
Lifted the ban
Ban
Warning
Not compliance to NTM
Impose NTM (Catchcertificate)
Start
EU uses NTMs as a tool to encourage fish supply country to eliminate Illegal Unreported Unregulated (IUU) fishing.
Un compliance supplier's1. Advice through yellow card
2. Ban fish export until showing significant improvement
3. Continues dialog and prove significant commandment to mitigate IUU fishing
4.Lifting ban
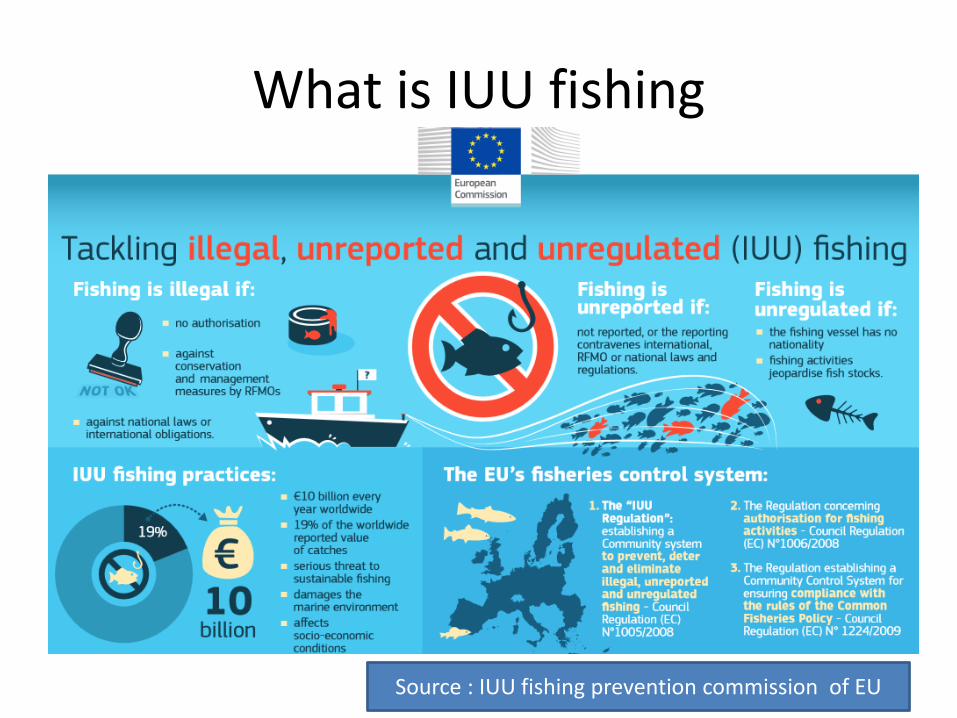
What is IUU fishing
Source : IUU fishing prevention commission of EU
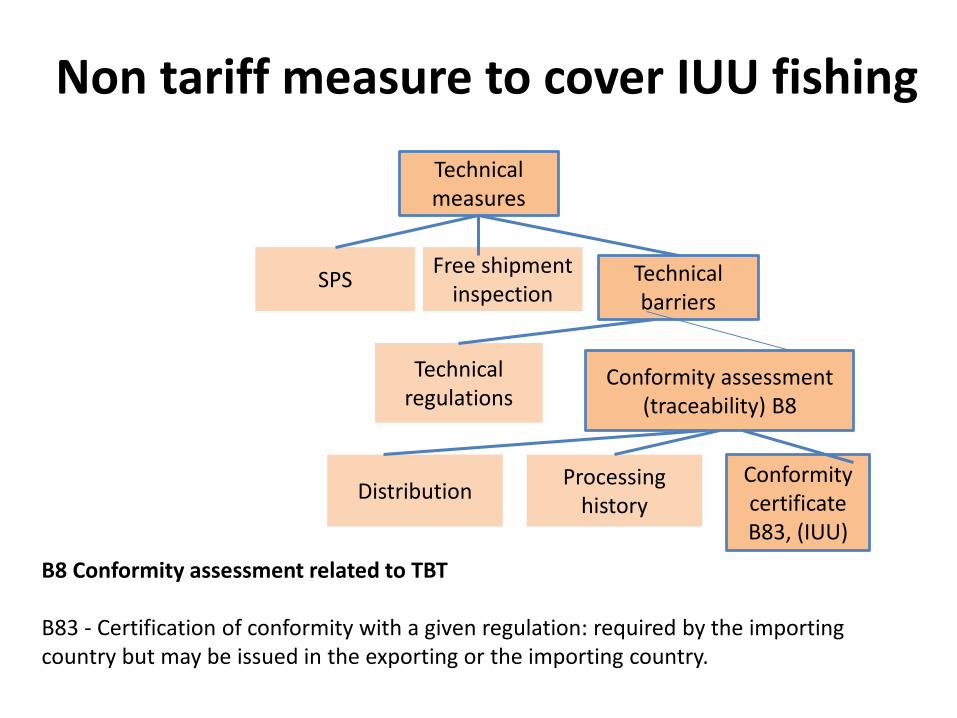
Technical measures
Technical barriers
Free shipment inspection
SPS
Technical regulations
Conformity assessment (traceability) B8
DistributionProcessing
history
Conformity certificate B83, (IUU)
Non tariff measure to cover IUU fishing
B8 Conformity assessment related to TBT
B83 - Certification of conformity with a given regulation: required by the importing country but may be issued in the exporting or the importing country.
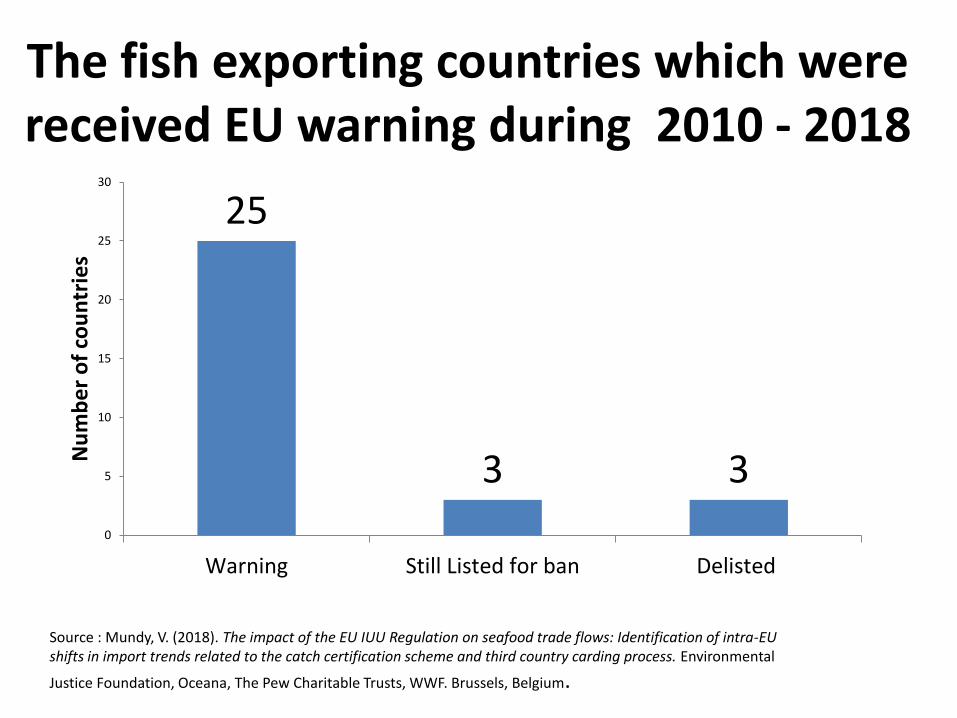
The fish exporting countries which were received EU warning during 2010 - 2018
25
3 3
0
5
10
15
20
25
30
Warning Still Listed for ban Delisted
Nu
mb
er
of
cou
ntr
ies
Source : Mundy, V. (2018). The impact of the EU IUU Regulation on seafood trade flows: Identification of intra-EU shifts in import trends related to the catch certification scheme and third country carding process. Environmental
Justice Foundation, Oceana, The Pew Charitable Trusts, WWF. Brussels, Belgium.
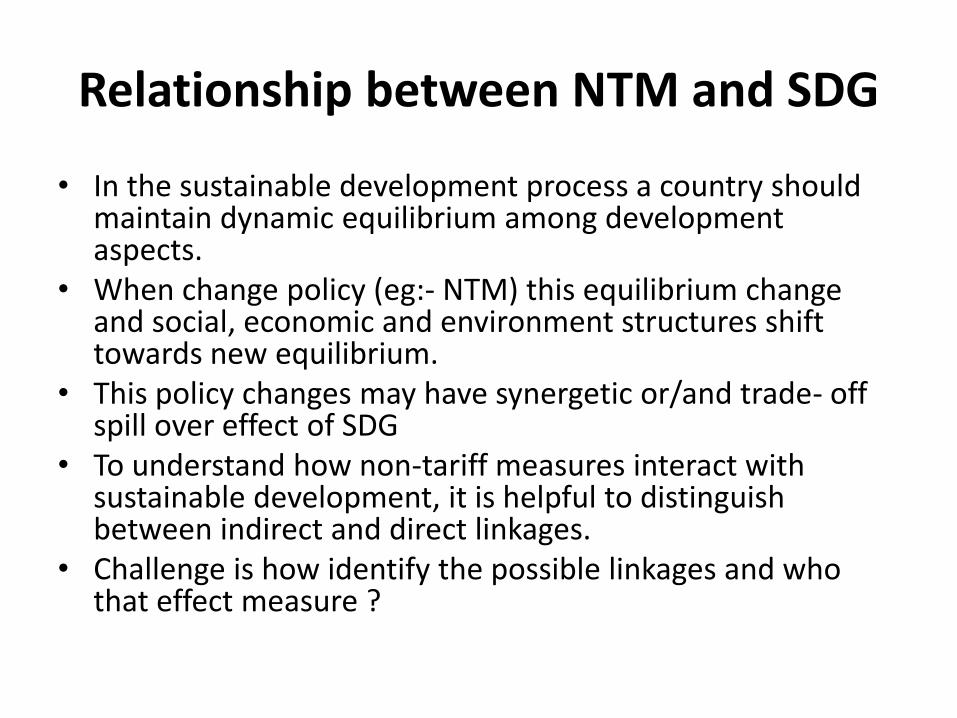
Relationship between NTM and SDG
• In the sustainable development process a country should maintain dynamic equilibrium among development aspects.
• When change policy (eg:- NTM) this equilibrium change and social, economic and environment structures shift towards new equilibrium.
• This policy changes may have synergetic or/and trade- off spill over effect of SDG
• To understand how non-tariff measures interact with sustainable development, it is helpful to distinguish between indirect and direct linkages.
• Challenge is how identify the possible linkages and who that effect measure ?
Objectives of the istudy
• To explore the performance of fish product export industry of Sri Lanka before, during and after the EU ban
• To study the producer level response for the EU ban
• To develop indicators and measure the impact of fish export ban and remedial measures taken to lift the ban on SDG of stake holders of the industry
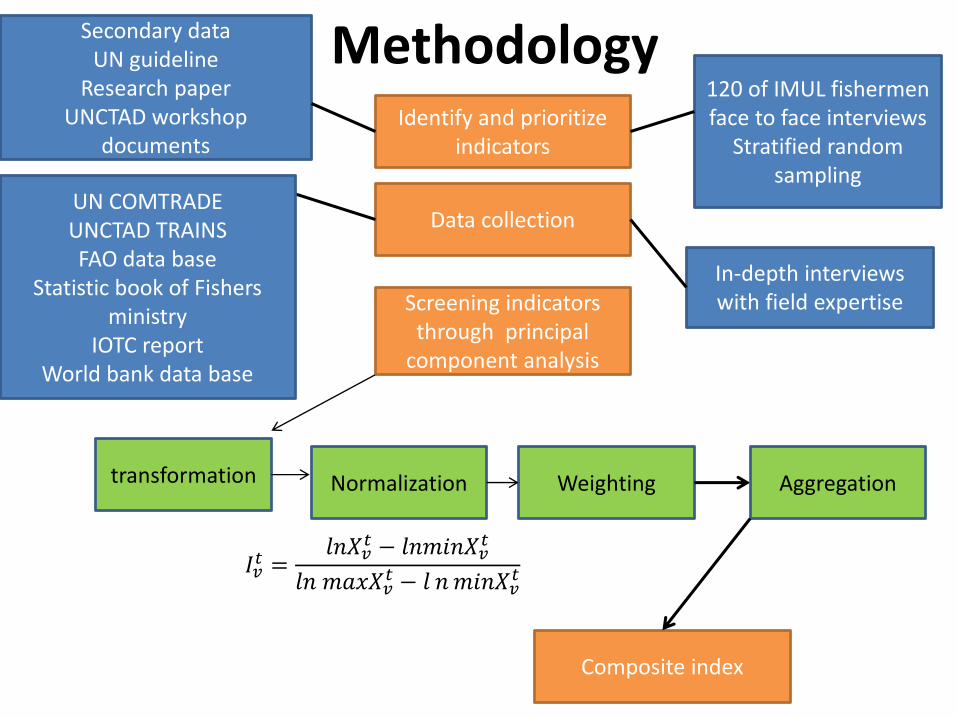
Methodology Identify and prioritize
indicators
Secondary dataUN guideline
Research paperUNCTAD workshop
documents
In-depth interviews with field expertise
Data collection
120 of IMUL fishermen face to face interviews
Stratified random sampling
Composite index
Screening indicators through principal
component analysis
transformation Weighting
𝐼𝑣𝑡 =
𝑙𝑛𝑋𝑣𝑡 − 𝑙𝑛𝑚𝑖𝑛𝑋𝑣
𝑡
𝑙𝑛 𝑚𝑎𝑥𝑋𝑣𝑡 − 𝑙 𝑛𝑚𝑖𝑛𝑋𝑣
𝑡
AggregationNormalization
UN COMTRADEUNCTAD TRAINSFAO data base
Statistic book of Fishers ministry
IOTC reportWorld bank data base
Impact on fish trade
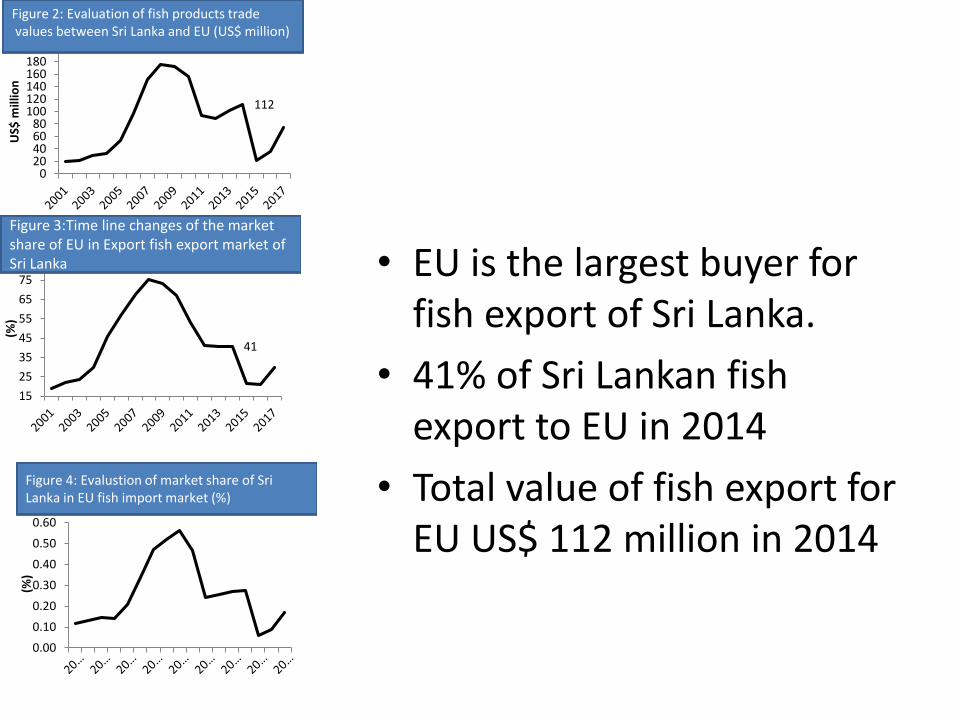
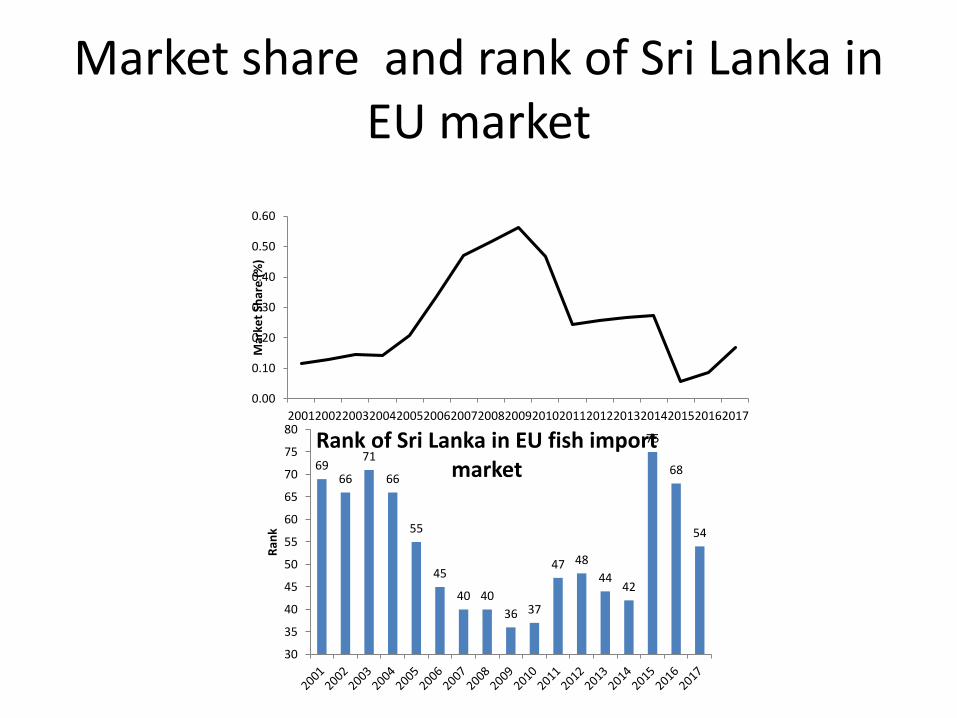
• EU is the largest buyer for fish export of Sri Lanka.
• 41% of Sri Lankan fish export to EU in 2014
• Total value of fish export for EU US$ 112 million in 2014
41
15
25
35
45
55
65
75
85
(%)
Figure 3:Time line changes of the market share of EU in Export fish export market of Sri Lanka
112
020406080
100120140160180200
US$
mill
ion
Figure 2: Evaluation of fish products tradevalues between Sri Lanka and EU (US$ million)
0.00
0.10
0.20
0.30
0.40
0.50
0.60
(%)
Figure 4: Evalustion of market share of Sri Lanka in EU fish import market (%)
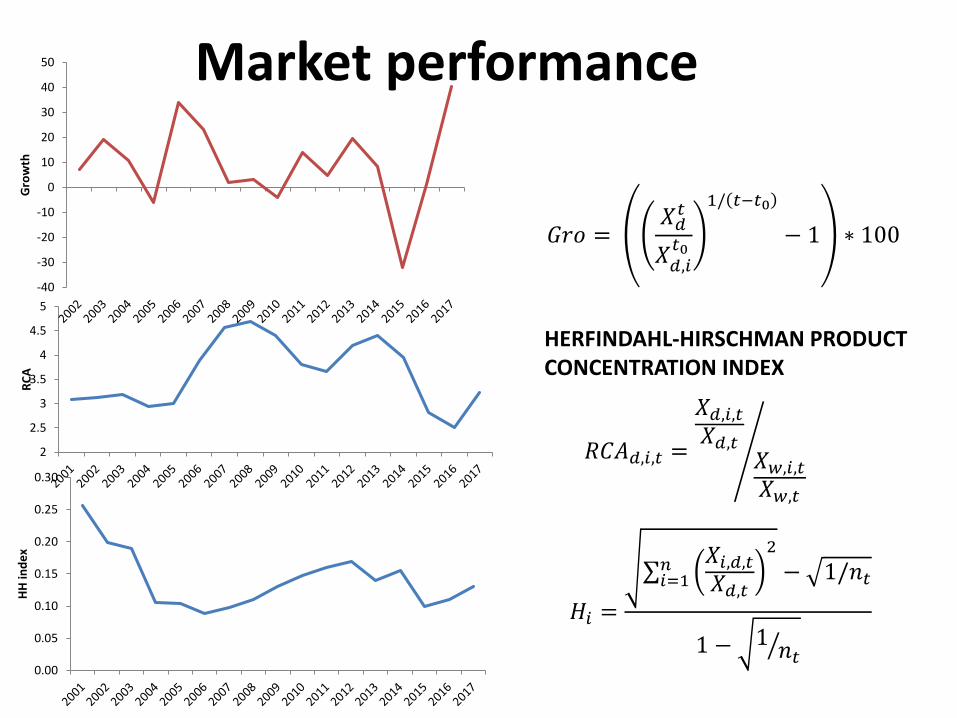
Market performance
HERFINDAHL-HIRSCHMAN PRODUCT CONCENTRATION INDEX
0.00
0.05
0.10
0.15
0.20
0.25
0.30
HH
ind
ex
𝐻𝑖 =
σ𝑖=1𝑛 𝑋𝑖,𝑑,𝑡
𝑋𝑑,𝑡
2
− 1/𝑛𝑡
1 − ൗ1 𝑛𝑡
2
2.5
3
3.5
4
4.5
5
RC
A
-40
-30
-20
-10
0
10
20
30
40
50
Gro
wth
𝐺𝑟𝑜 =𝑋𝑑𝑡
𝑋𝑑,𝑖𝑡0
1/ 𝑡−𝑡0
− 1 ∗ 100
𝑅𝐶𝐴𝑑,𝑖,𝑡 = ൚
𝑋𝑑,𝑖,𝑡𝑋𝑑,𝑡
𝑋𝑤,𝑖,𝑡𝑋𝑤,𝑡
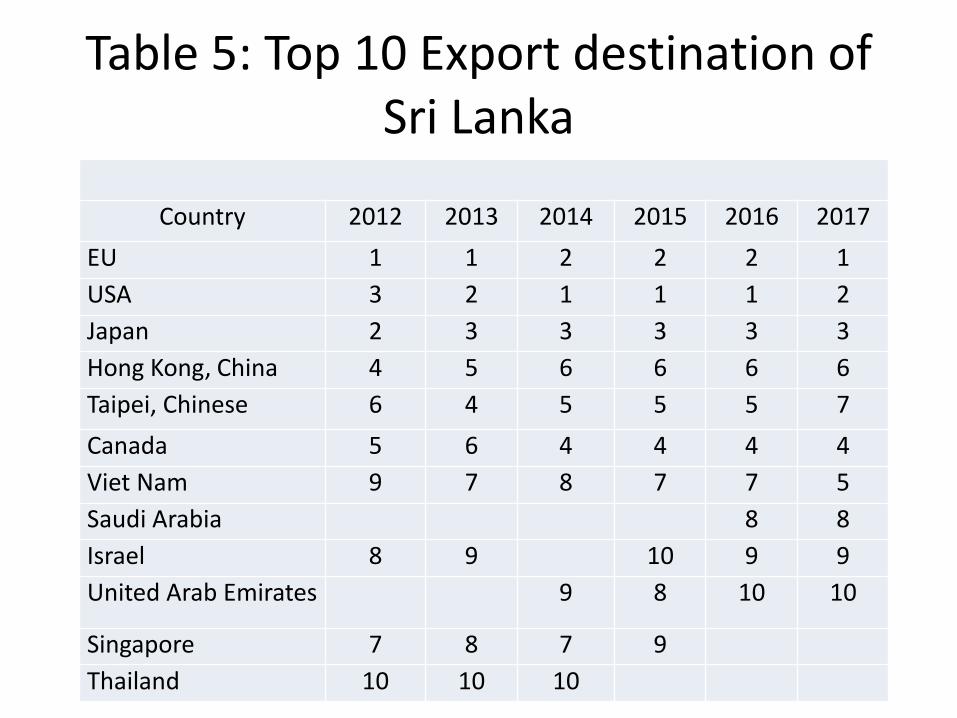
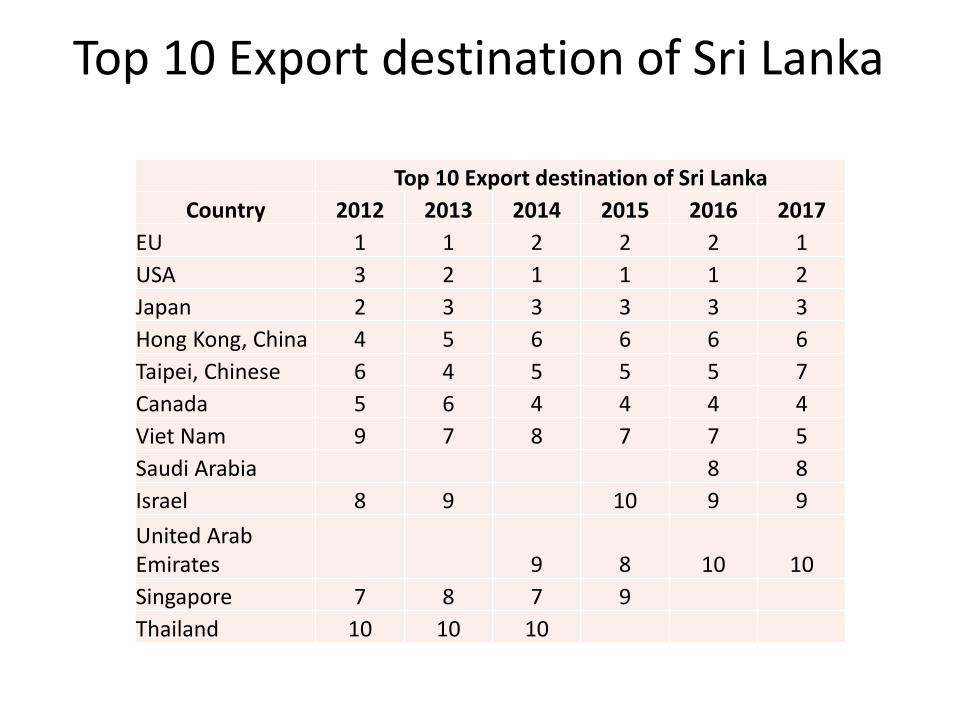
Table 5: Top 10 Export destination of Sri Lanka
Country 2012 2013 2014 2015 2016 2017
EU 1 1 2 2 2 1
USA 3 2 1 1 1 2
Japan 2 3 3 3 3 3
Hong Kong, China 4 5 6 6 6 6
Taipei, Chinese 6 4 5 5 5 7
Canada 5 6 4 4 4 4
Viet Nam 9 7 8 7 7 5
Saudi Arabia 8 8
Israel 8 9 10 9 9
United Arab Emirates 9 8 10 10
Singapore 7 8 7 9
Thailand 10 10 10
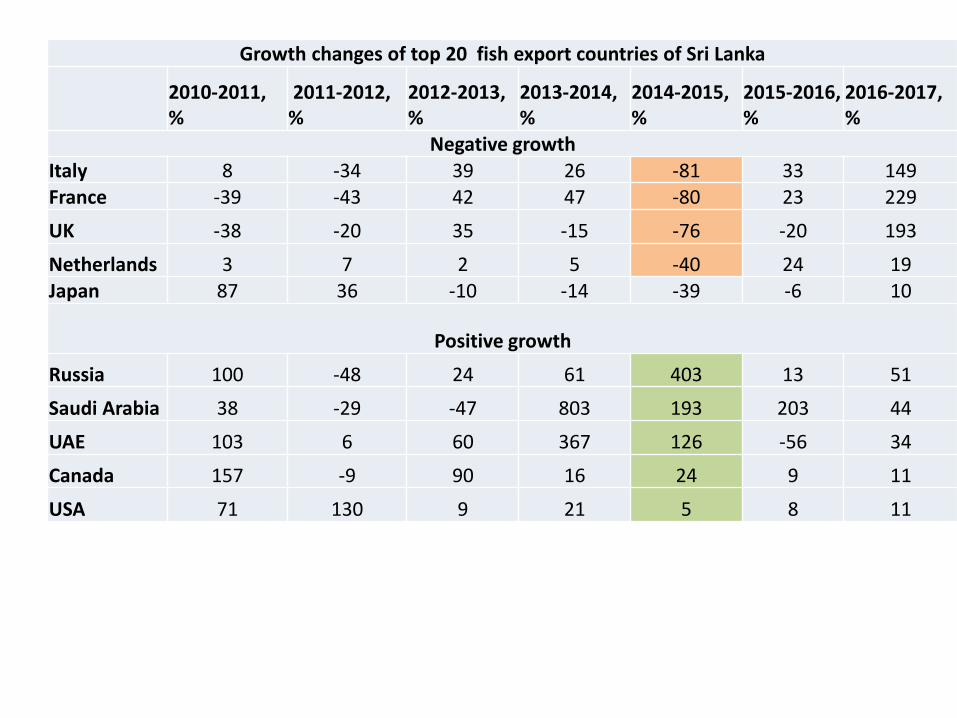
Growth changes of top 20 fish export countries of Sri Lanka
2010-2011, %
2011-2012, %
2012-2013, %
2013-2014, %
2014-2015, %
2015-2016, %
2016-2017, %
Negative growth Italy 8 -34 39 26 -81 33 149France -39 -43 42 47 -80 23 229
UK -38 -20 35 -15 -76 -20 193
Netherlands 3 7 2 5 -40 24 19Japan 87 36 -10 -14 -39 -6 10
Positive growth
Russia 100 -48 24 61 403 13 51
Saudi Arabia 38 -29 -47 803 193 203 44
UAE 103 6 60 367 126 -56 34
Canada 157 -9 90 16 24 9 11
USA 71 130 9 21 5 8 11
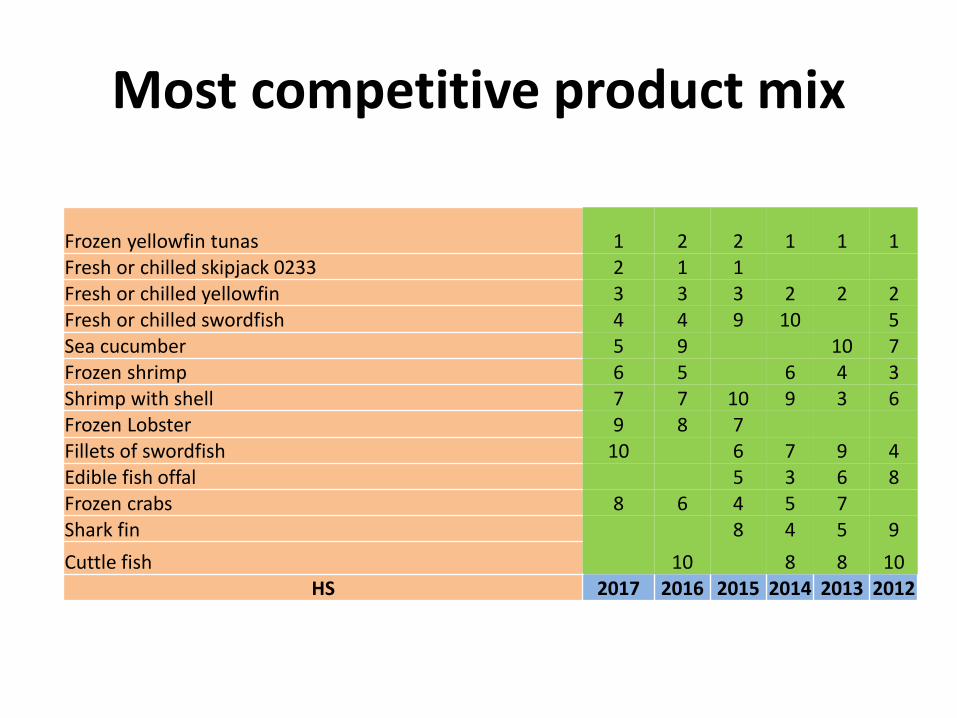
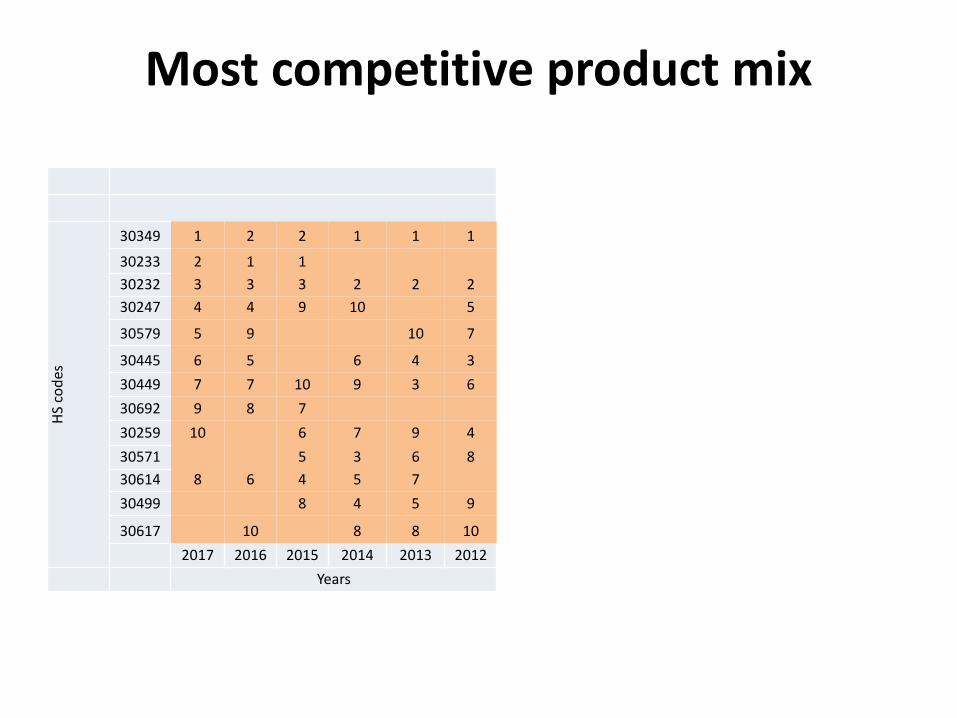
Most competitive product mix
Frozen yellowfin tunas 1 2 2 1 1 1Fresh or chilled skipjack 0233 2 1 1Fresh or chilled yellowfin 3 3 3 2 2 2Fresh or chilled swordfish 4 4 9 10 5Sea cucumber 5 9 10 7Frozen shrimp 6 5 6 4 3Shrimp with shell 7 7 10 9 3 6Frozen Lobster 9 8 7Fillets of swordfish 10 6 7 9 4Edible fish offal 5 3 6 8Frozen crabs 8 6 4 5 7Shark fin 8 4 5 9
Cuttle fish 10 8 8 10HS 2017 2016 2015 2014 2013 2012
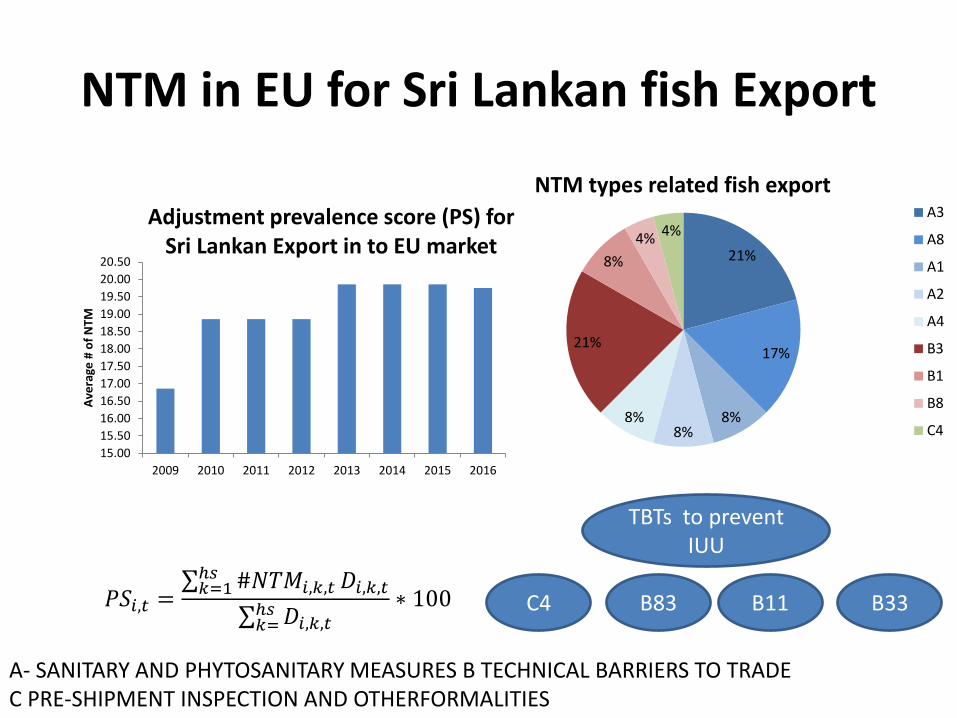
NTM in EU for Sri Lankan fish Export
21%
17%
8%8%
8%
21%
8%
4% 4%
NTM types related fish export A3
A8
A1
A2
A4
B3
B1
B8
C4
𝑃𝑆𝑖,𝑡 =σ𝑘=1ℎ𝑠 #𝑁𝑇𝑀𝑖,𝑘,𝑡 𝐷𝑖,𝑘,𝑡
σ𝑘=ℎ𝑠 𝐷𝑖,𝑘,𝑡
∗ 100
15.00
15.50
16.00
16.50
17.00
17.50
18.00
18.50
19.00
19.50
20.00
20.50
2009 2010 2011 2012 2013 2014 2015 2016
Ave
rage
# o
f N
TM
Adjustment prevalence score (PS) for Sri Lankan Export in to EU market
TBTs to prevent IUU
C4 B83 B11 B33
A- SANITARY AND PHYTOSANITARY MEASURES B TECHNICAL BARRIERS TO TRADEC PRE-SHIPMENT INSPECTION AND OTHERFORMALITIES
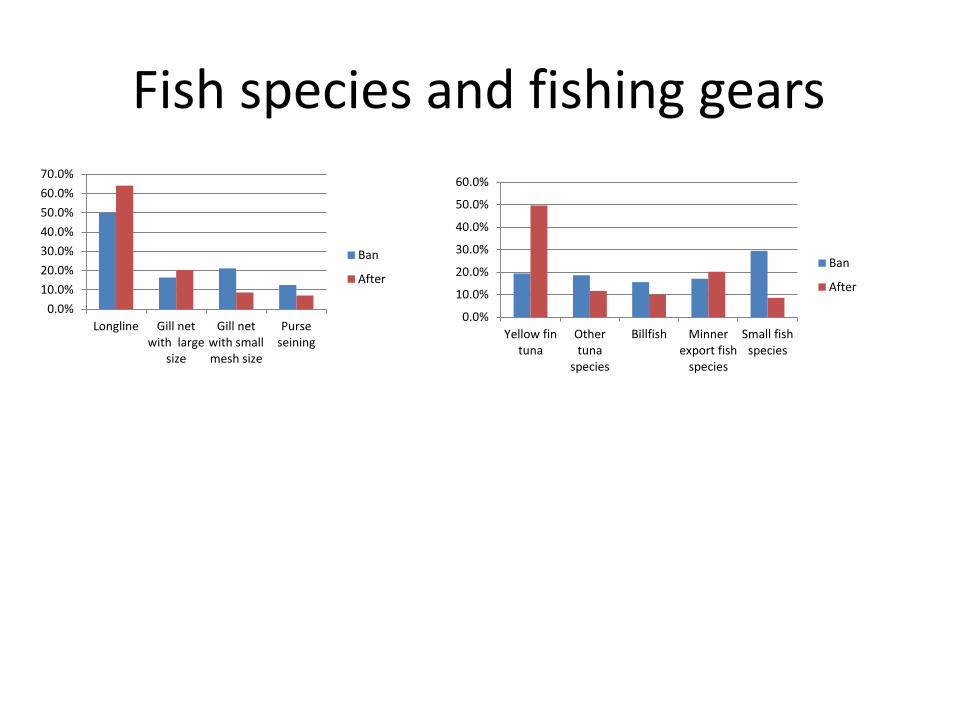
Producer level response for the ban
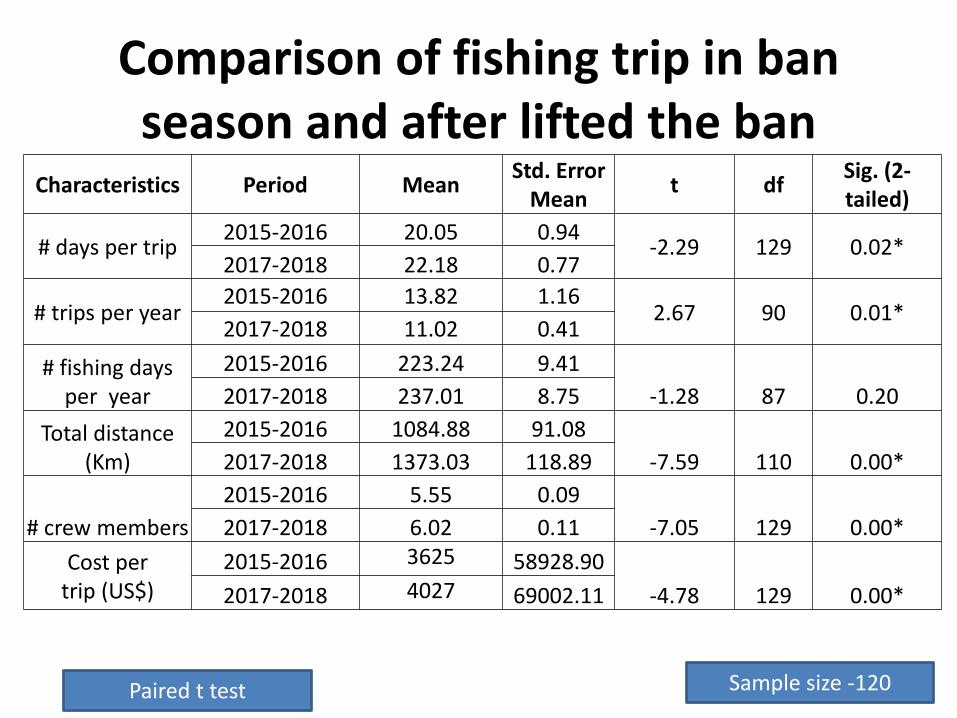
Comparison of fishing trip in ban season and after lifted the ban
Paired t test
Characteristics Period MeanStd. Error
Meant df
Sig. (2-tailed)
# days per trip2015-2016 20.05 0.94
-2.29 129 0.02*2017-2018 22.18 0.77
# trips per year2015-2016 13.82 1.16
2.67 90 0.01*2017-2018 11.02 0.41
# fishing days per year
2015-2016 223.24 9.41
-1.28 87 0.202017-2018 237.01 8.75
Total distance (Km)
2015-2016 1084.88 91.08
-7.59 110 0.00*2017-2018 1373.03 118.89
# crew members
2015-2016 5.55 0.09
-7.05 129 0.00*2017-2018 6.02 0.11
Cost per trip (US$)
2015-2016 3625 58928.90
-4.78 129 0.00*2017-2018 4027 69002.11
Sample size -120
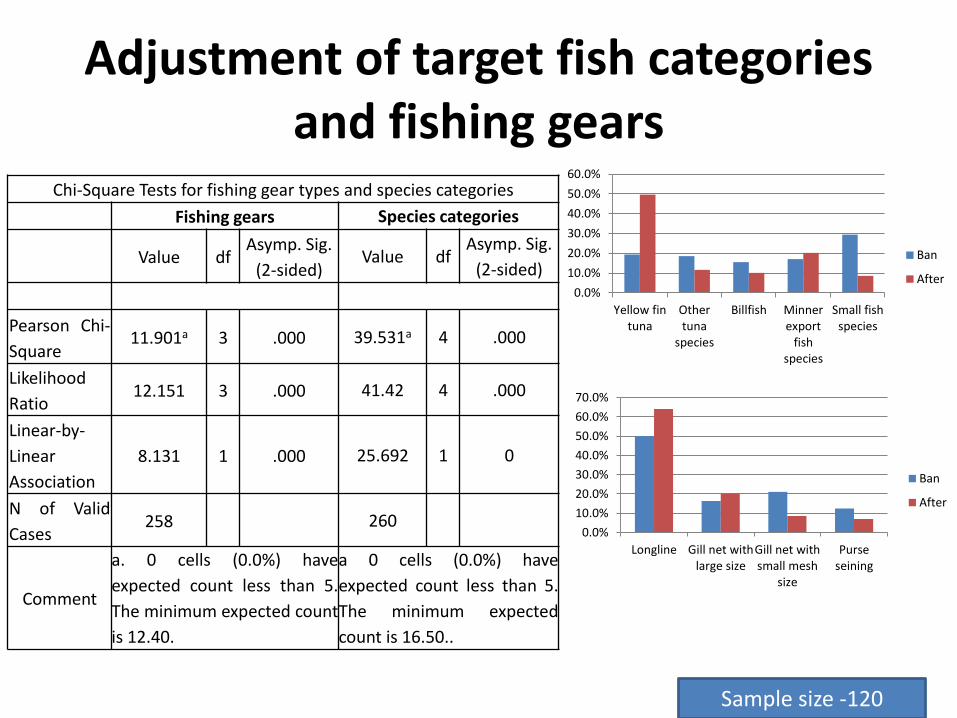
Adjustment of target fish categories and fishing gears
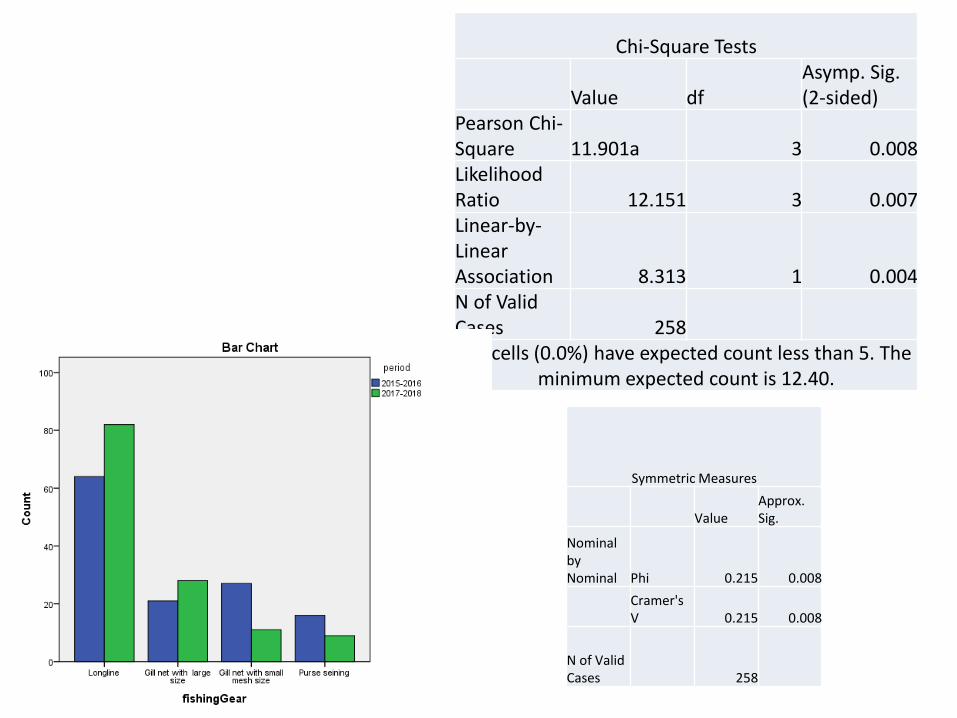
Chi-Square Tests for fishing gear types and species categories
Fishing gears Species categories
Value dfAsymp. Sig.
(2-sided)Value df
Asymp. Sig.
(2-sided)
Pearson Chi-
Square11.901a 3 .000 39.531a 4 .000
Likelihood
Ratio12.151 3 .000 41.42 4 .000
Linear-by-
Linear
Association
8.131 1 .000 25.692 1 0
N of Valid
Cases258 260
Comment
a. 0 cells (0.0%) have
expected count less than 5.
The minimum expected count
is 12.40.
a 0 cells (0.0%) have
expected count less than 5.
The minimum expected
count is 16.50..
Sample size -120
0.0%
10.0%
20.0%
30.0%
40.0%
50.0%
60.0%
70.0%
Longline Gill net withlarge size
Gill net withsmall mesh
size
Purseseining
Ban
After
0.0%
10.0%
20.0%
30.0%
40.0%
50.0%
60.0%
Yellow fintuna
Othertuna
species
Billfish Minnerexport
fishspecies
Small fishspecies
Ban
After
Impact on SDG
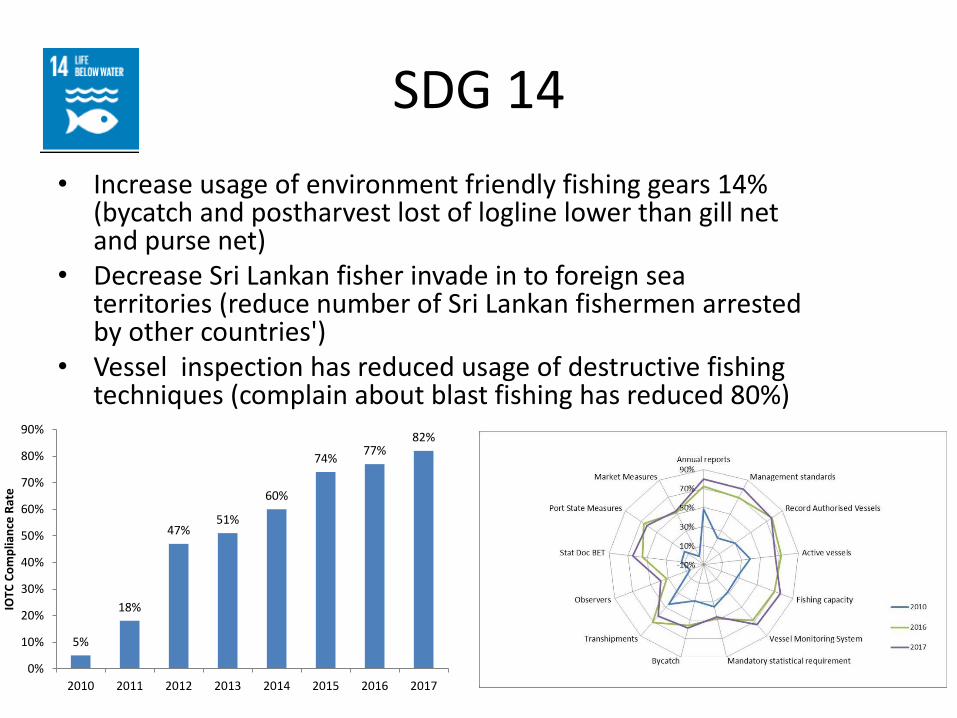
SDG 14
• Increase usage of environment friendly fishing gears 14% (bycatch and postharvest lost of logline lower than gill net and purse net)
• Decrease Sri Lankan fisher invade in to foreign sea territories (reduce number of Sri Lankan fishermen arrested by other countries')
• Vessel inspection has reduced usage of destructive fishing techniques (complain about blast fishing has reduced 80%)
5%
18%
47%51%
60%
74%77%
82%
0%
10%
20%
30%
40%
50%
60%
70%
80%
90%
2010 2011 2012 2013 2014 2015 2016 2017
IOTC
Co
mp
lian
ce R
ate
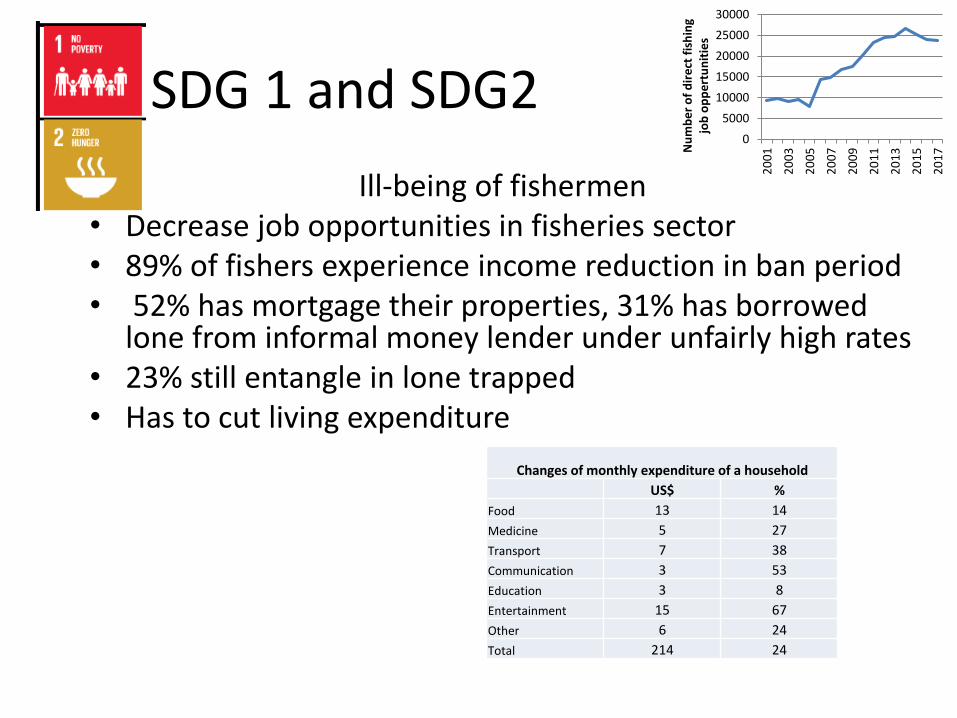
SDG 1 and SDG2
Ill-being of fishermen• Decrease job opportunities in fisheries sector• 89% of fishers experience income reduction in ban period • 52% has mortgage their properties, 31% has borrowed
lone from informal money lender under unfairly high rates • 23% still entangle in lone trapped • Has to cut living expenditure
0
5000
10000
15000
20000
25000
30000
20
01
20
03
20
05
20
07
20
09
20
11
20
13
20
15
20
17N
um
be
r o
f d
ire
ct f
ish
ing
job
op
pe
rtu
nit
ies
Changes of monthly expenditure of a household
US$ %
Food 13 14
Medicine 5 27
Transport 7 38
Communication 3 53
Education 3 8
Entertainment 15 67
Other 6 24
Total 214 24
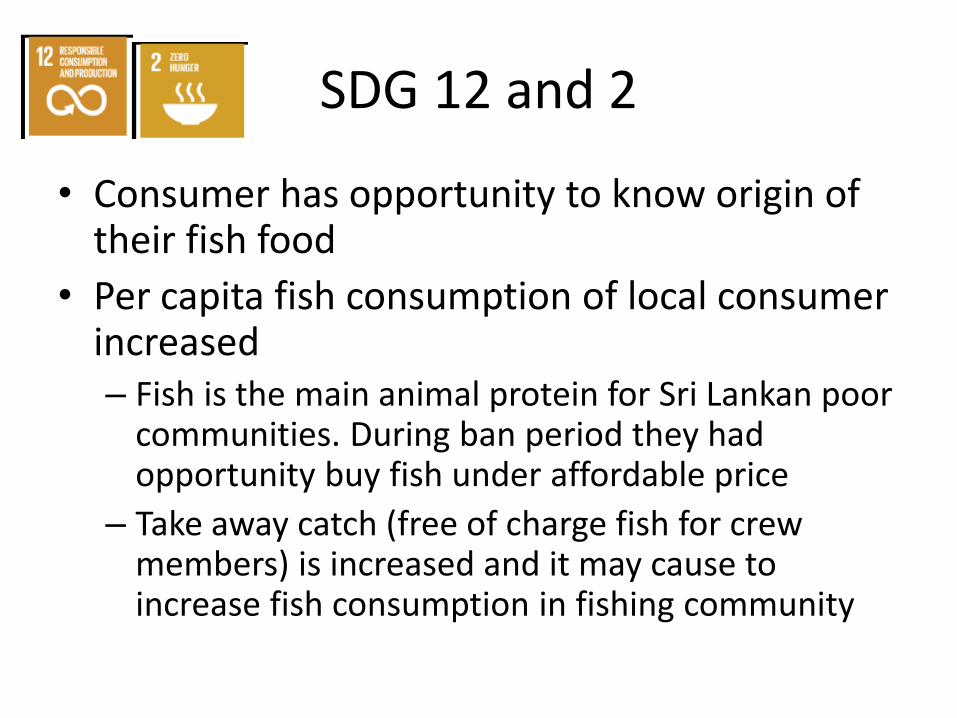
SDG 12 and 2
• Consumer has opportunity to know origin of their fish food
• Per capita fish consumption of local consumer increased – Fish is the main animal protein for Sri Lankan poor
communities. During ban period they had opportunity buy fish under affordable price
– Take away catch (free of charge fish for crew members) is increased and it may cause to increase fish consumption in fishing community
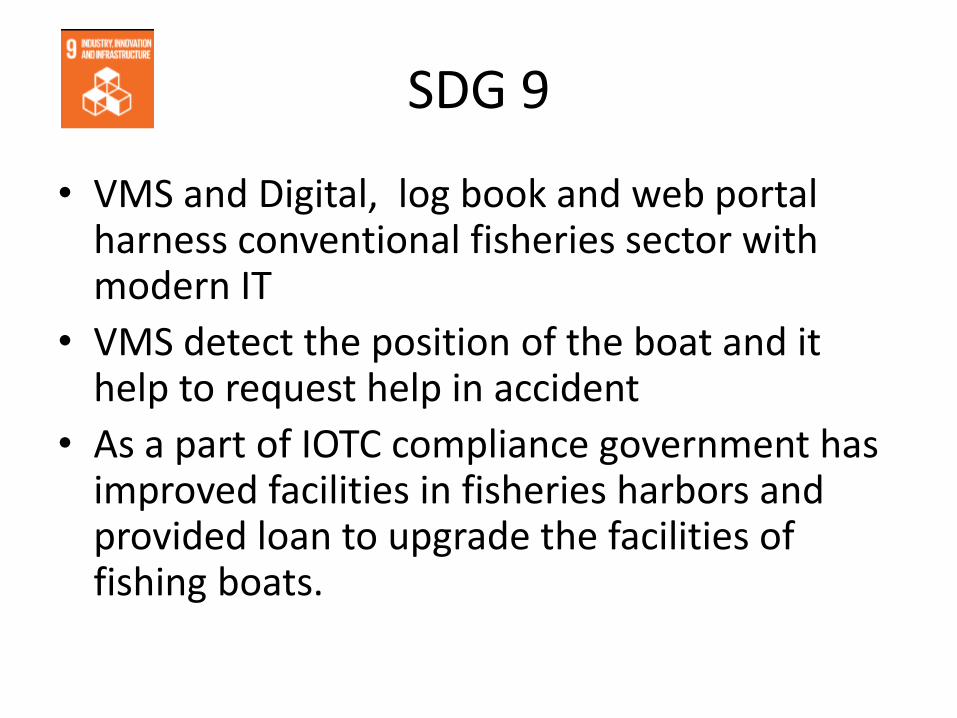
SDG 9
• VMS and Digital, log book and web portal harness conventional fisheries sector with modern IT
• VMS detect the position of the boat and it help to request help in accident
• As a part of IOTC compliance government has improved facilities in fisheries harbors and provided loan to upgrade the facilities of fishing boats.
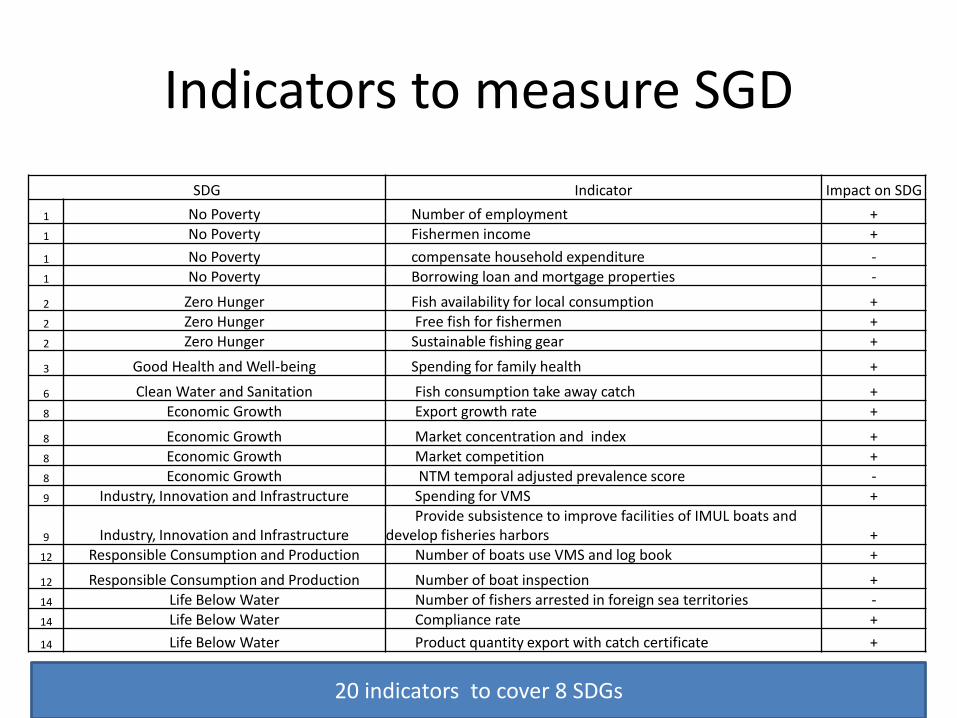
Indicators to measure SGD
SDG Indicator Impact on SDG
1 No Poverty Number of employment +
1 No Poverty Fishermen income +
1 No Poverty compensate household expenditure -
1 No Poverty Borrowing loan and mortgage properties -
2 Zero Hunger Fish availability for local consumption +
2 Zero Hunger Free fish for fishermen +
2 Zero Hunger Sustainable fishing gear +
3 Good Health and Well-being Spending for family health +
6 Clean Water and Sanitation Fish consumption take away catch +
8 Economic Growth Export growth rate +
8 Economic Growth Market concentration and index +
8 Economic Growth Market competition +
8 Economic Growth NTM temporal adjusted prevalence score -
9 Industry, Innovation and Infrastructure Spending for VMS +
9 Industry, Innovation and InfrastructureProvide subsistence to improve facilities of IMUL boats and
develop fisheries harbors +
12 Responsible Consumption and Production Number of boats use VMS and log book +
12 Responsible Consumption and Production Number of boat inspection +
14 Life Below Water Number of fishers arrested in foreign sea territories -
14 Life Below Water Compliance rate +
14 Life Below Water Product quantity export with catch certificate +
20 indicators to cover 8 SDGs
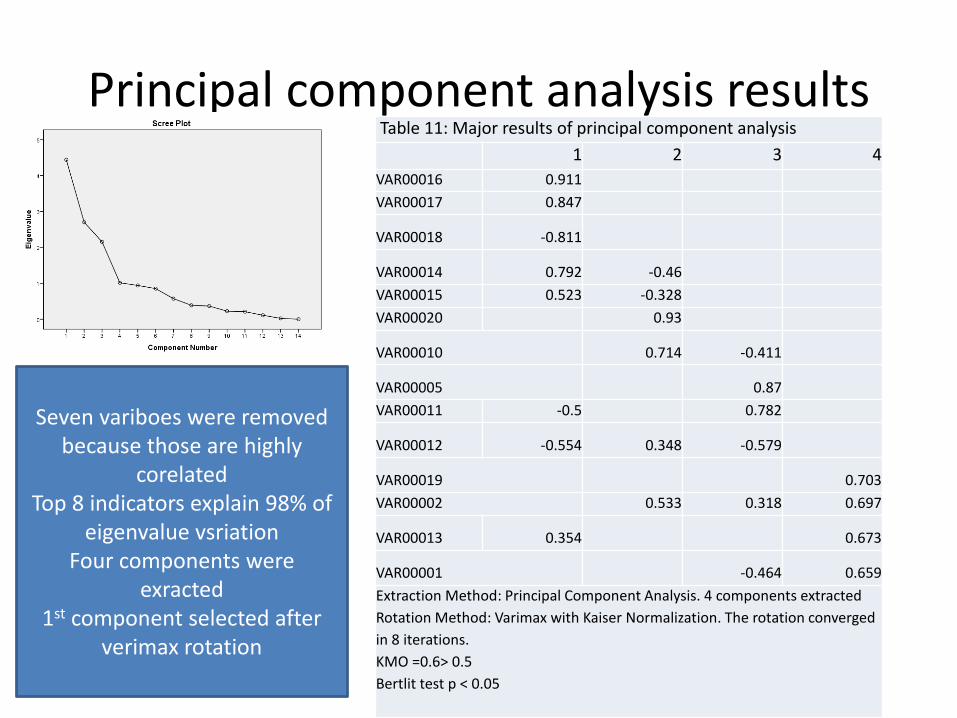
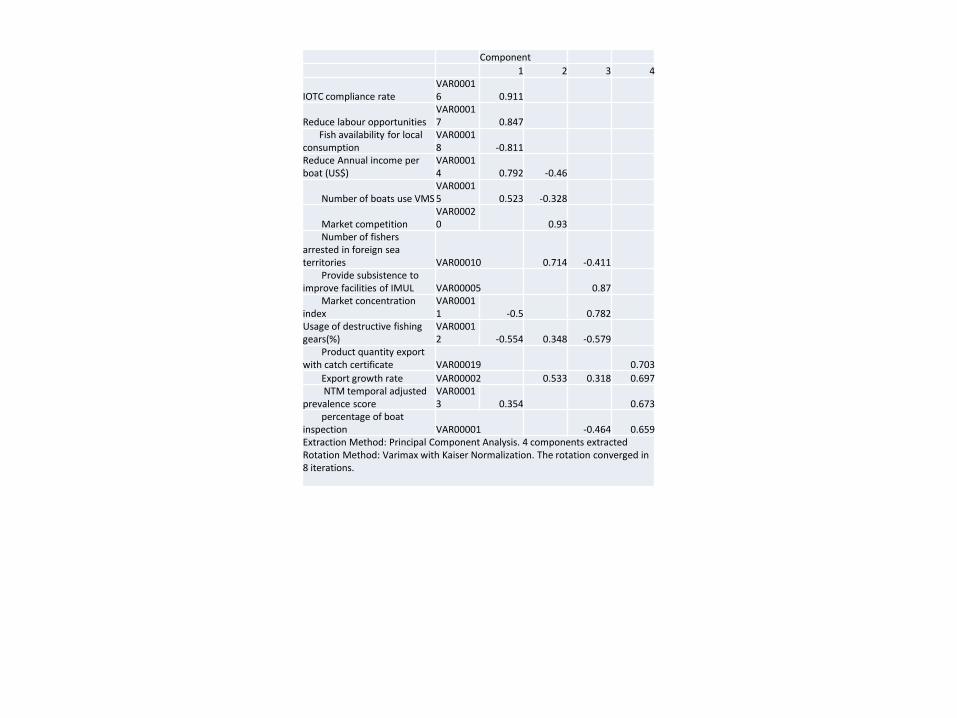
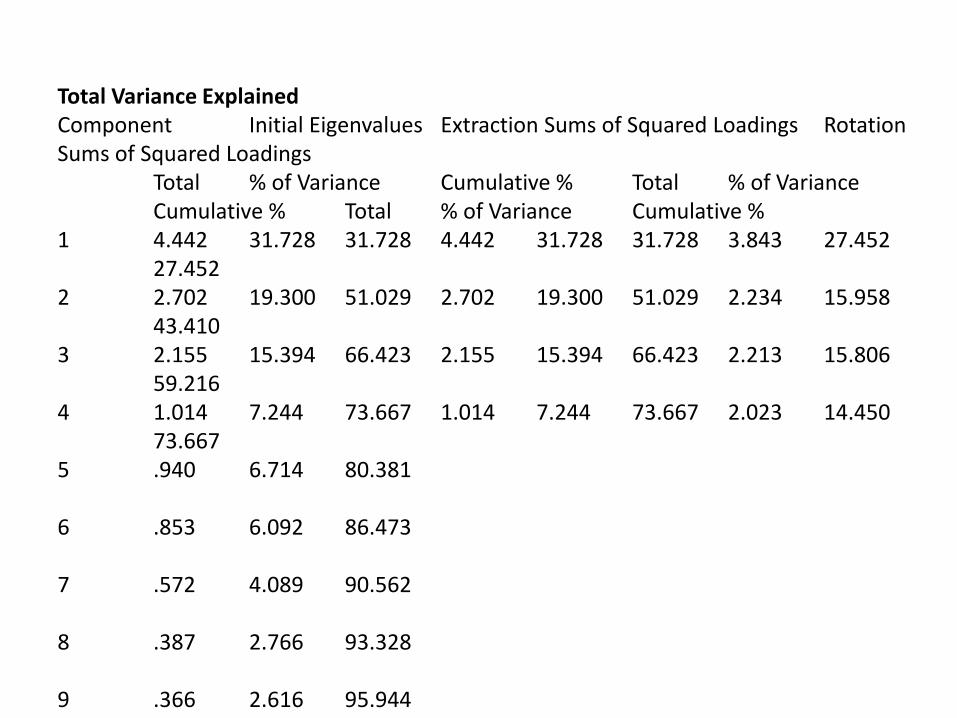
Principal component analysis resultsTable 11: Major results of principal component analysis
1 2 3 4
VAR00016 0.911
VAR00017 0.847
VAR00018 -0.811
VAR00014 0.792 -0.46
VAR00015 0.523 -0.328
VAR00020 0.93
VAR00010 0.714 -0.411
VAR00005 0.87
VAR00011 -0.5 0.782
VAR00012 -0.554 0.348 -0.579
VAR00019 0.703
VAR00002 0.533 0.318 0.697
VAR00013 0.354 0.673
VAR00001 -0.464 0.659
Extraction Method: Principal Component Analysis. 4 components extracted
Rotation Method: Varimax with Kaiser Normalization. The rotation converged
in 8 iterations.
KMO =0.6> 0.5
Bertlit test p < 0.05
Seven variboes were removed because those are highly
corelatedTop 8 indicators explain 98% of
eigenvalue vsriationFour components were
exracted1st component selected after
verimax rotation
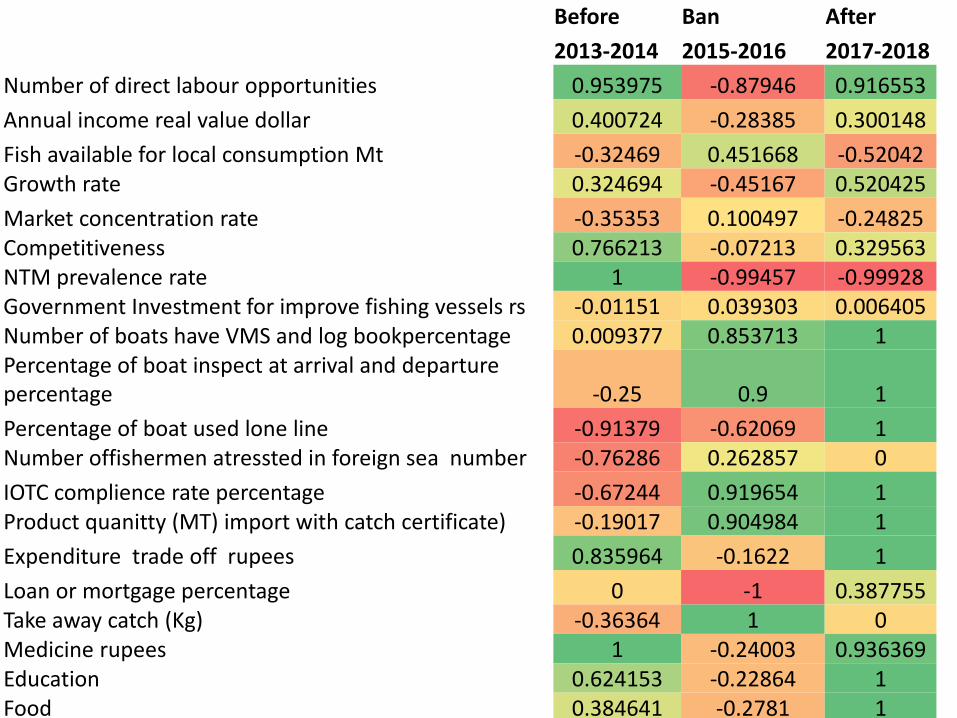
Before Ban After
2013-2014 2015-2016 2017-2018
Number of direct labour opportunities 0.953975 -0.87946 0.916553
Annual income real value dollar 0.400724 -0.28385 0.300148
Fish available for local consumption Mt -0.32469 0.451668 -0.52042Growth rate 0.324694 -0.45167 0.520425
Market concentration rate -0.35353 0.100497 -0.24825Competitiveness 0.766213 -0.07213 0.329563NTM prevalence rate 1 -0.99457 -0.99928Government Investment for improve fishing vessels rs -0.01151 0.039303 0.006405Number of boats have VMS and log bookpercentage 0.009377 0.853713 1Percentage of boat inspect at arrival and departure percentage -0.25 0.9 1
Percentage of boat used lone line -0.91379 -0.62069 1Number offishermen atressted in foreign sea number -0.76286 0.262857 0
IOTC complience rate percentage -0.67244 0.919654 1Product quanitty (MT) import with catch certificate) -0.19017 0.904984 1
Expenditure trade off rupees 0.835964 -0.1622 1
Loan or mortgage percentage 0 -1 0.387755Take away catch (Kg) -0.36364 1 0Medicine rupees 1 -0.24003 0.936369Education 0.624153 -0.22864 1Food 0.384641 -0.2781 1
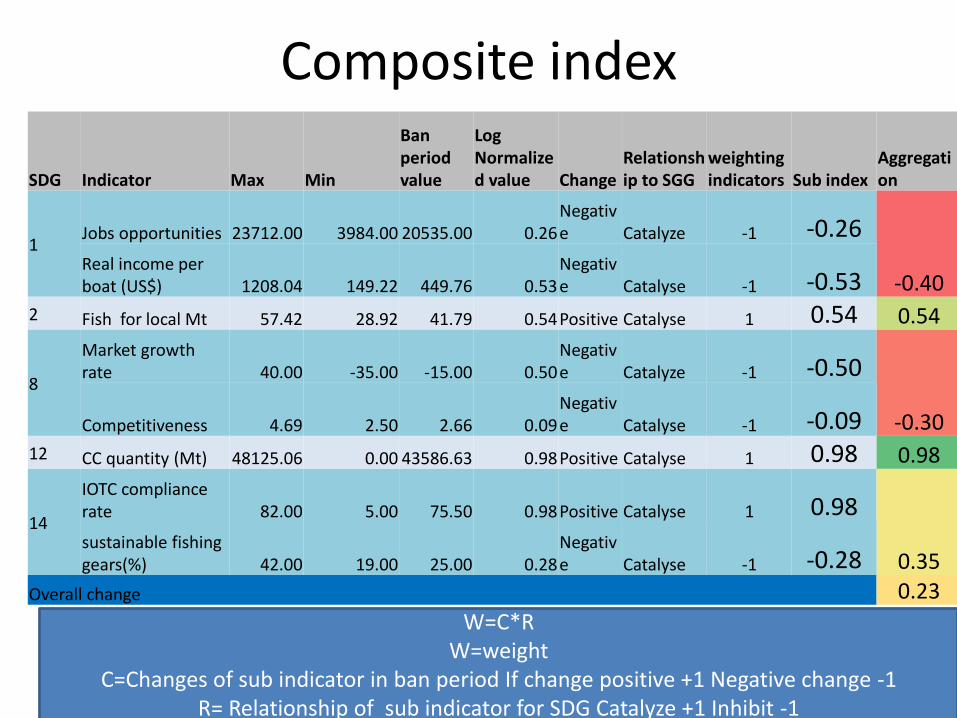
Composite index
SDG Indicator Max Min
Ban period value
Log Normalized value Change
Relationship to SGG
weighting indicators Sub index
Aggregation
1Jobs opportunities 23712.00 3984.00 20535.00 0.26
Negative Catalyze -1 -0.26
-0.40Real income per boat (US$) 1208.04 149.22 449.76 0.53
Negative Catalyse -1 -0.53
2 Fish for local Mt 57.42 28.92 41.79 0.54Positive Catalyse 1 0.54 0.54
8
Market growth rate 40.00 -35.00 -15.00 0.50
Negative Catalyze -1 -0.50
-0.30Competitiveness 4.69 2.50 2.66 0.09Negative Catalyse -1 -0.09
12 CC quantity (Mt) 48125.06 0.00 43586.63 0.98Positive Catalyse 1 0.98 0.98
14
IOTC compliance rate 82.00 5.00 75.50 0.98Positive Catalyse 1 0.98
0.35sustainable fishing gears(%) 42.00 19.00 25.00 0.28
Negative Catalyse -1 -0.28
Overall change 0.23
W=C*RW=weight
C=Changes of sub indicator in ban period If change positive +1 Negative change -1R= Relationship of sub indicator for SDG Catalyze +1 Inhibit -1
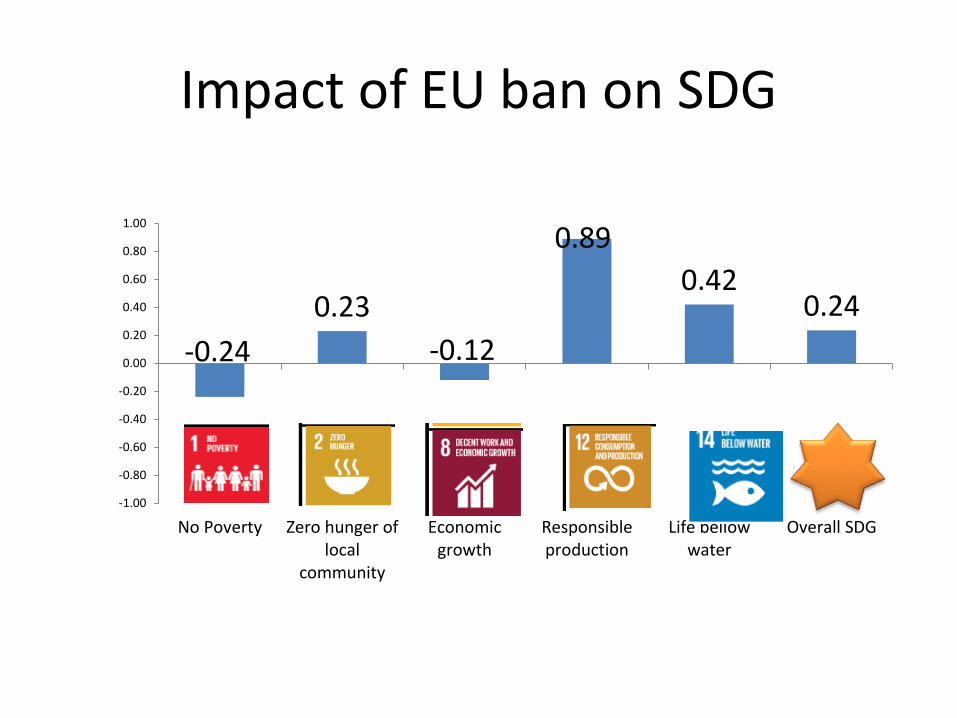
Impact of EU ban on SDG
-0.24
0.23
-0.12
0.89
0.420.24
-1.00
-0.80
-0.60
-0.40
-0.20
0.00
0.20
0.40
0.60
0.80
1.00
No Poverty Zero hunger oflocal
community
Economicgrowth
Responsibleproduction
Life bellowwater
Overall SDG
• All NTMs are not a 100% curse because each NTM can generate bothpositive and negative impacts on trade partners.
• Some NTMs, such as catch Certificate can be positively contribute for theenvironment protection and negatively impact on fishermen becauseincrease production cost.
• To eliminate disadvantage of production cost increment there should bepremium price for fish caught under environment sustainable manner.
• Near competitive markets, consists with small scale producers such asfishery industry, required long time period to adopt technology andattitude to compliance with costly complex NTM
• Collective action, government support essential for these industries
Conclusion
• The impact of NTM and impact of ban might begenerated contradictory outcome. For examplebecause of sanction there was no attractive pricefor the fish caught under sustainable fishingtechniques hence fishermen incline to low costdestructive fishing gears. On the other hand aftersanction fishermen attract towards thesustainable fishing gears because the fish withcatch certificate had significantly high price.
• The NTMs should not be a weapon to attacke tradecompetitors or opponent of international politicalarena.
• It should be a constructive tool to motivatesustainable development. The spontaneousdecision should not be taken regarding NTMsbecause the NTMs as very sensitive invisiblelinkages with sustainable development goals ofdifferent stake holders. It is recommendedimplementing fine studies to cover most of theimpacts and adjust the nature of NTMs to generateholistic sustainable development for whole planet.

Thank you
27.000
32.000
37.000
42.000
47.000
52.000
57.000
1 2 3 4 5 6 7 8 9 10 11 12 13 14 15 16 17
Mt
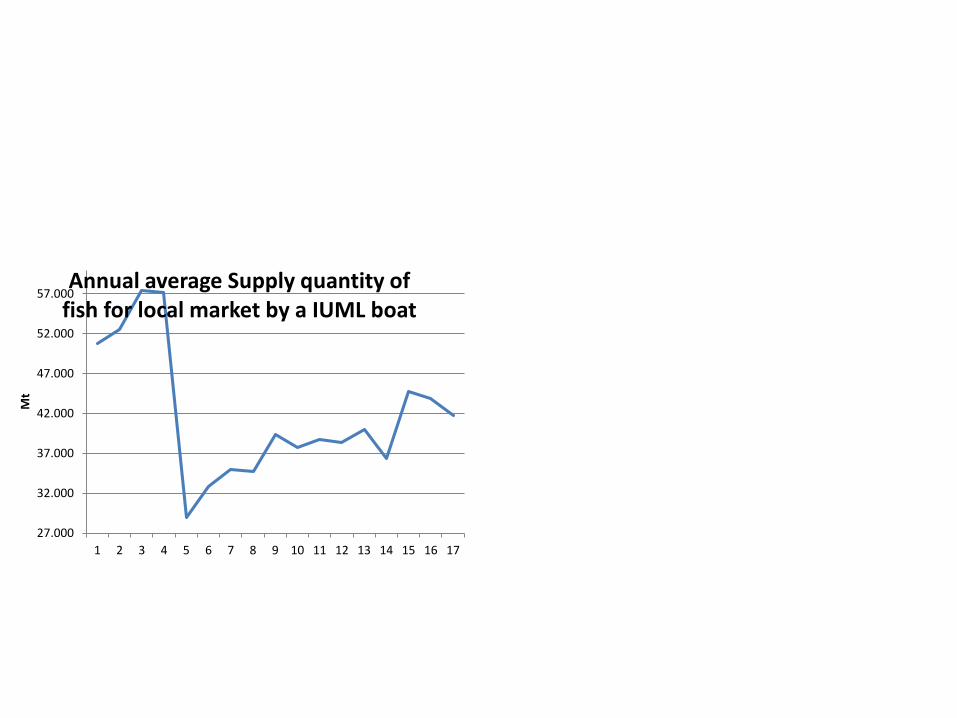
Annual average Supply quantity of fish for local market by a IUML boat
53334467304598841162
47401
665337411677418
899549194699799
93625
135647
117366105524
156618
0
20000
40000
60000
80000
100000
120000
140000
160000
180000
20
01
20
02
20
03
20
04
20
05
20
06
20
07
20
08
20
09
20
10
20
11
20
12
20
13
20
14
20
15
20
16
US$
th
ou
san
d
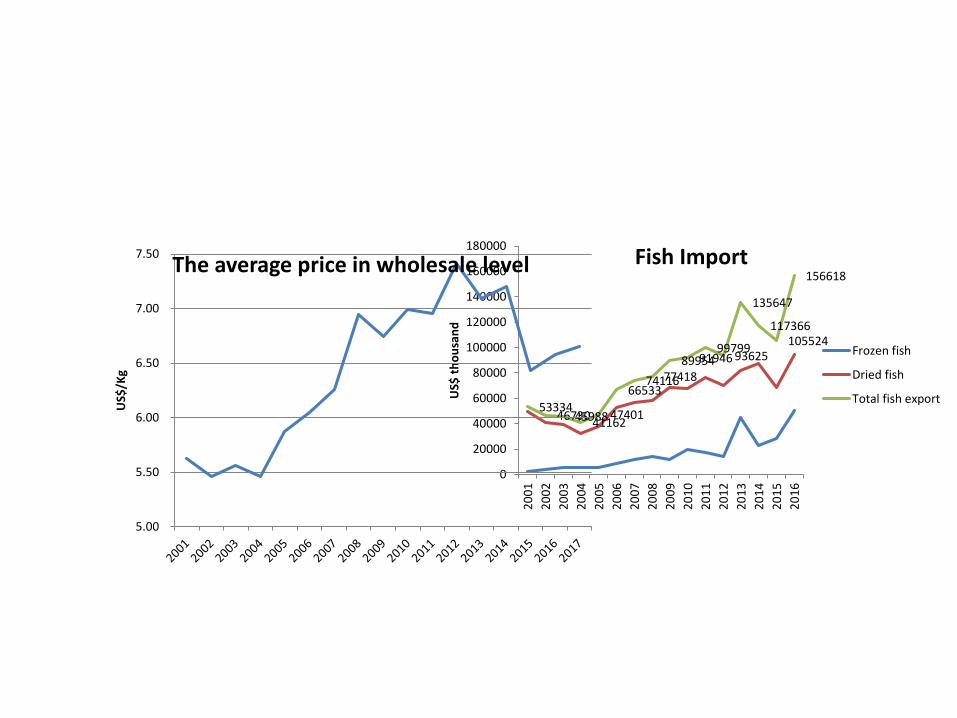
Fish Import
Frozen fish
Dried fish
Total fish export
5.00
5.50
6.00
6.50
7.00
7.50
US$
/Kg
The average price in wholesale level
35
40
45
50
55
60
65
Mt
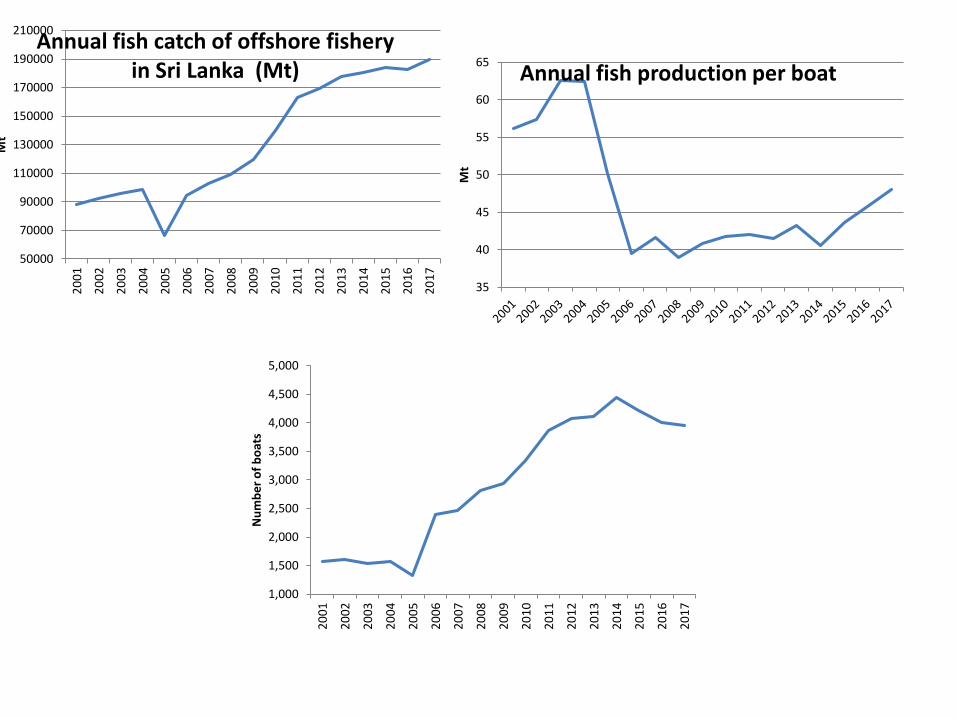
Annual fish production per boat
50000
70000
90000
110000
130000
150000
170000
190000
210000
20
01
20
02
20
03
20
04
20
05
20
06
20
07
20
08
20
09
20
10
20
11
20
12
20
13
20
14
20
15
20
16
20
17
Mt
Annual fish catch of offshore fishery in Sri Lanka (Mt)
1,000
1,500
2,000
2,500
3,000
3,500
4,000
4,500
5,000
20
01
20
02
20
03
20
04
20
05
20
06
20
07
20
08
20
09
20
10
20
11
20
12
20
13
20
14
20
15
20
16
20
17
Nu
mb
er
of
bo
ats

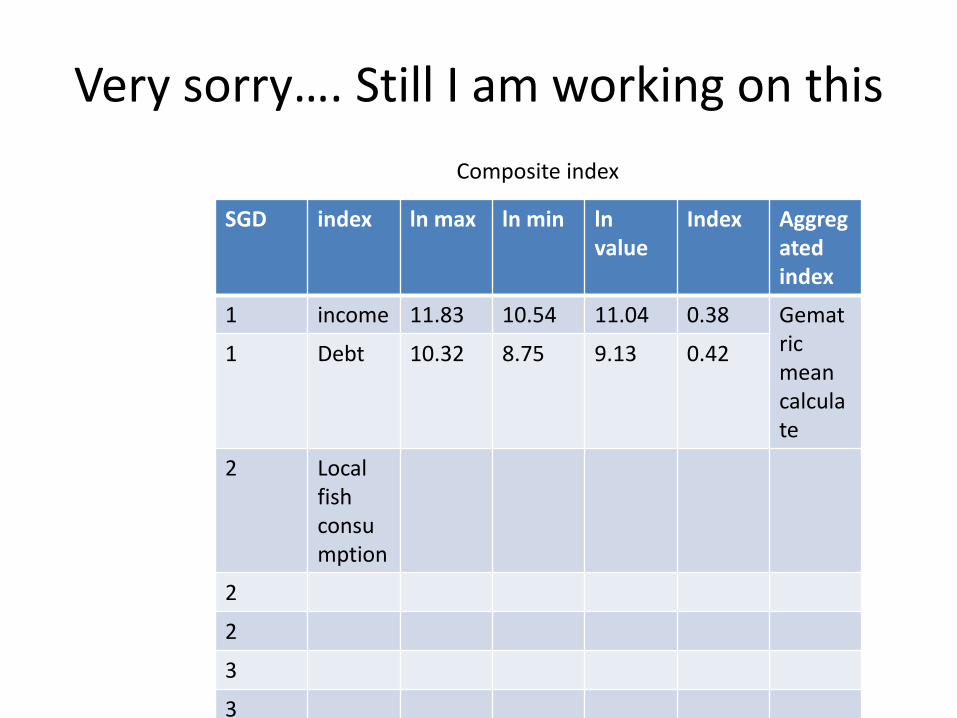
Very sorry…. Still I am working on this
SGD index ln max ln min lnvalue
Index Aggregated index
1 income 11.83 10.54 11.04 0.38 Gematricmean calculate
1 Debt 10.32 8.75 9.13 0.42
2 Local fish consumption
2
2
3
3
Composite index
• It is a web diagram to show NTM impact on each SDG
Conclusion
References

Thank you
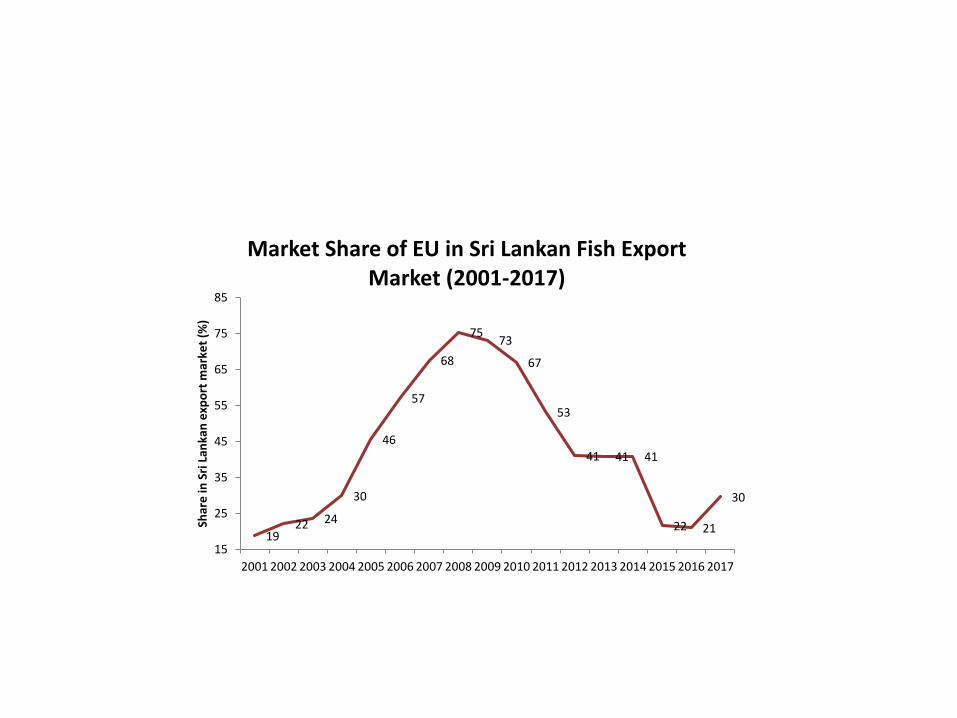
1922 24
30
46
57
68
7573
67
53
41 41 41
22 21
30
15
25
35
45
55
65
75
85
2001 2002 2003 2004 2005 2006 2007 2008 2009 2010 2011 2012 2013 2014 2015 2016 2017
Shar
e in
Sri
Lan
kan
exp
ort
mar
ket
(%)
Market Share of EU in Sri Lankan Fish Export Market (2001-2017)
0
5000
10000
15000
20000
25000
300002
00
1
20
03
20
05
20
07
20
09
20
11
20
13
20
15
20
17N
um
be
r o
f d
ire
ct f
ish
ing
job
op
pe
rtu
nit
ies
Number of offshore boat registered
Overviwe of Sri Lankan fisheries industry
Chi-Square Tests
Value dfAsymp. Sig. (2-sided)
Pearson Chi-Square 11.901a 3 0.008Likelihood Ratio 12.151 3 0.007Linear-by-Linear Association 8.313 1 0.004N of Valid Cases 258a 0 cells (0.0%) have expected count less than 5. The
minimum expected count is 12.40.
Symmetric Measures
ValueApprox. Sig.
Nominal by Nominal Phi 0.215 0.008
Cramer's V 0.215 0.008
N of Valid Cases 258
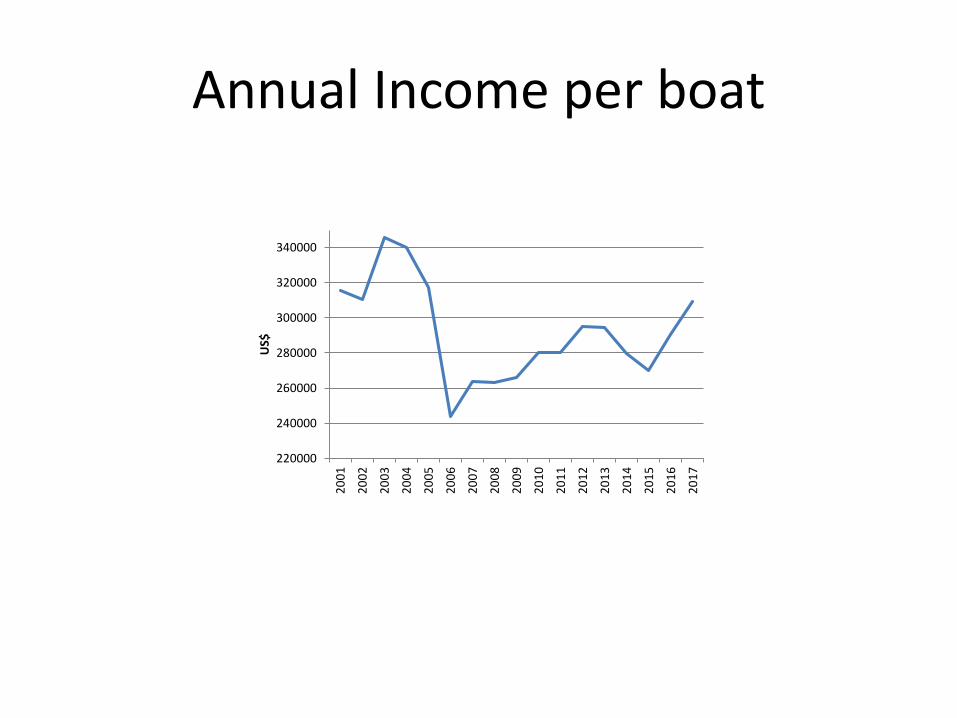
Annual Income per boat
220000
240000
260000
280000
300000
320000
340000
20
01
20
02
20
03
20
04
20
05
20
06
20
07
20
08
20
09
20
10
20
11
20
12
20
13
20
14
20
15
20
16
20
17
US$
Component
1 2 3 4
IOTC compliance rate VAR00016 0.911
Reduce labour opportunitiesVAR00017 0.847
Fish availability for local consumption
VAR00018 -0.811
Reduce Annual income per boat (US$)
VAR00014 0.792 -0.46
Number of boats use VMS VAR00015 0.523 -0.328
Market competitionVAR00020 0.93
Number of fishers arrested in foreign sea territories VAR00010 0.714 -0.411
Provide subsistence to improve facilities of IMUL VAR00005 0.87
Market concentration index
VAR00011 -0.5 0.782
Usage of destructive fishing gears(%)
VAR00012 -0.554 0.348 -0.579
Product quantity export with catch certificate VAR00019 0.703
Export growth rate VAR00002 0.533 0.318 0.697NTM temporal adjusted
prevalence score VAR00013 0.354 0.673
percentage of boat inspection VAR00001 -0.464 0.659Extraction Method: Principal Component Analysis. 4 components extracted Rotation Method: Varimax with Kaiser Normalization. The rotation converged in 8 iterations.
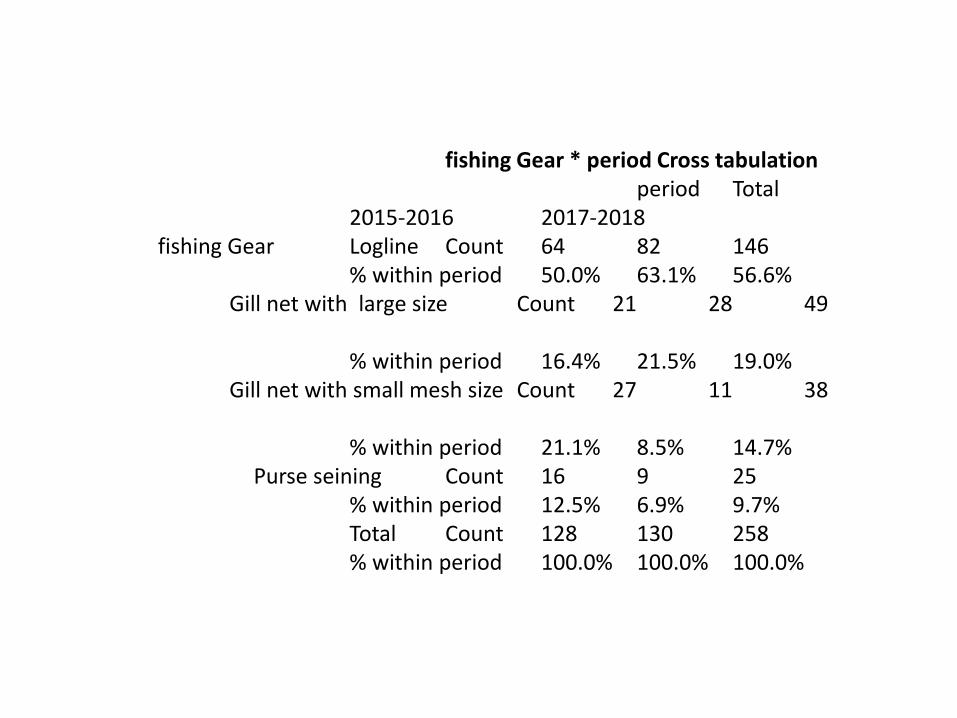
fishing Gear * period Cross tabulationperiod Total
2015-2016 2017-2018fishing Gear Logline Count 64 82 146
% within period 50.0% 63.1% 56.6%Gill net with large size Count 21 28 49
% within period 16.4% 21.5% 19.0%Gill net with small mesh size Count 27 11 38
% within period 21.1% 8.5% 14.7%Purse seining Count 16 9 25
% within period 12.5% 6.9% 9.7%Total Count 128 130 258% within period 100.0% 100.0% 100.0%
Total Variance ExplainedComponent Initial Eigenvalues Extraction Sums of Squared Loadings Rotation Sums of Squared Loadings
Total % of Variance Cumulative % Total % of VarianceCumulative % Total % of Variance Cumulative %
1 4.442 31.728 31.728 4.442 31.728 31.728 3.843 27.45227.452
2 2.702 19.300 51.029 2.702 19.300 51.029 2.234 15.95843.410
3 2.155 15.394 66.423 2.155 15.394 66.423 2.213 15.80659.216
4 1.014 7.244 73.667 1.014 7.244 73.667 2.023 14.45073.667
5 .940 6.714 80.381
6 .853 6.092 86.473
7 .572 4.089 90.562
8 .387 2.766 93.328
9 .366 2.616 95.944
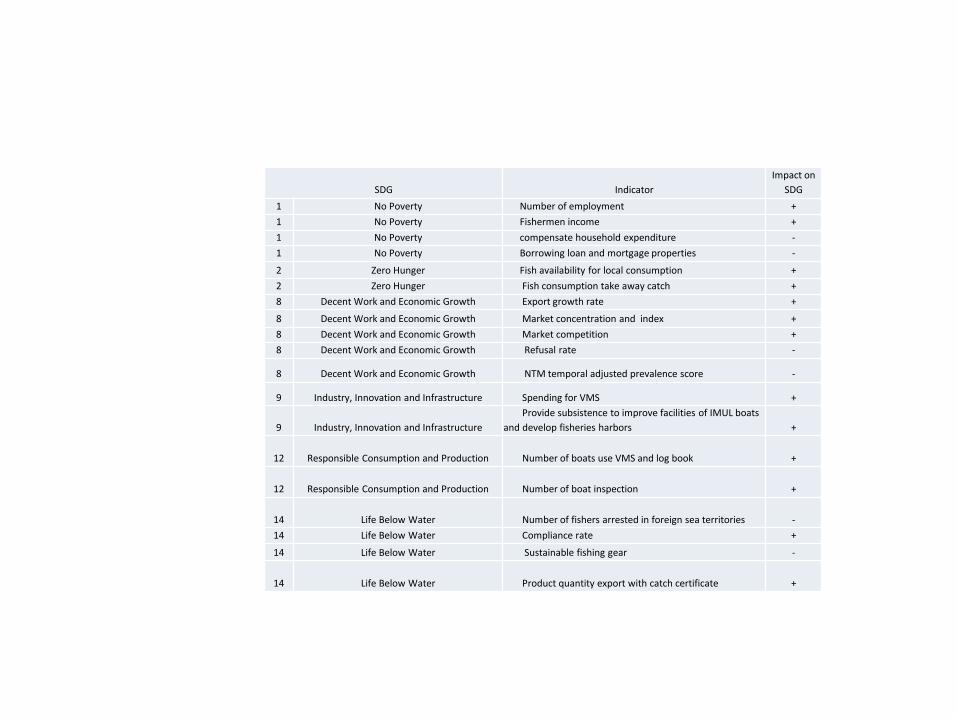
SDG Indicator
Impact on
SDG
1 No Poverty Number of employment +
1 No Poverty Fishermen income +
1 No Poverty compensate household expenditure -
1 No Poverty Borrowing loan and mortgage properties -
2 Zero Hunger Fish availability for local consumption +
2 Zero Hunger Fish consumption take away catch +
8 Decent Work and Economic Growth Export growth rate +
8 Decent Work and Economic Growth Market concentration and index +
8 Decent Work and Economic Growth Market competition +
8 Decent Work and Economic Growth Refusal rate -
8 Decent Work and Economic Growth NTM temporal adjusted prevalence score -
9 Industry, Innovation and Infrastructure Spending for VMS +
9 Industry, Innovation and Infrastructure
Provide subsistence to improve facilities of IMUL boats
and develop fisheries harbors +
12 Responsible Consumption and Production Number of boats use VMS and log book +
12 Responsible Consumption and Production Number of boat inspection +
14 Life Below Water Number of fishers arrested in foreign sea territories -
14 Life Below Water Compliance rate +
14 Life Below Water Sustainable fishing gear -
14 Life Below Water Product quantity export with catch certificate +
EU following banning decision
• EU 28
• Check republic
• France
• UK
• Itali

4000
5000
6000
7000
8000
9000
10000
11000
12000
13000
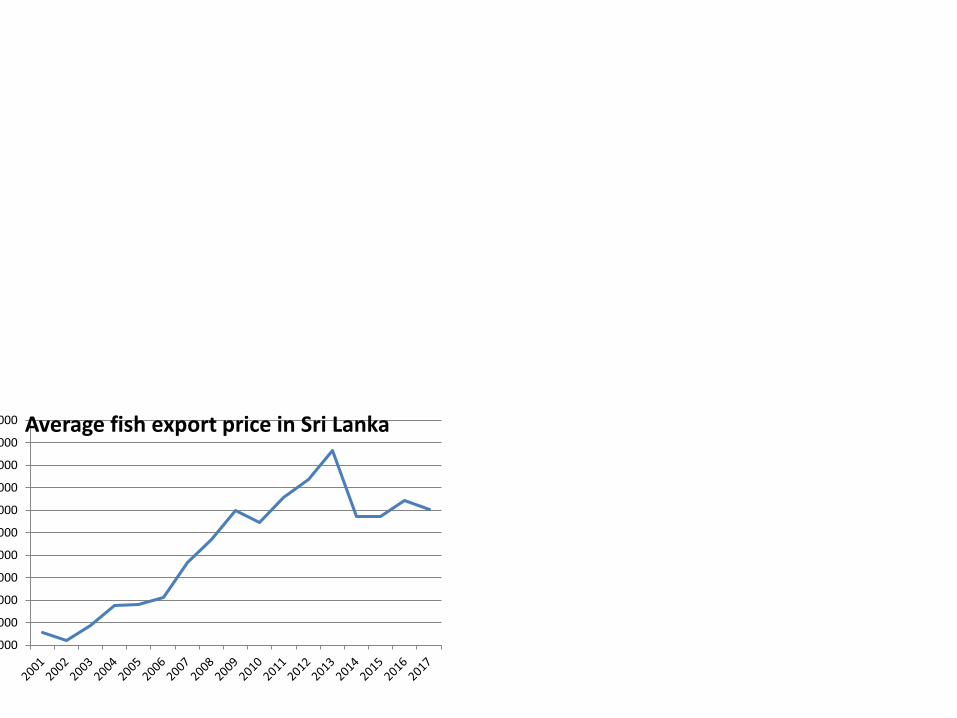
14000 Average fish export price in Sri Lanka
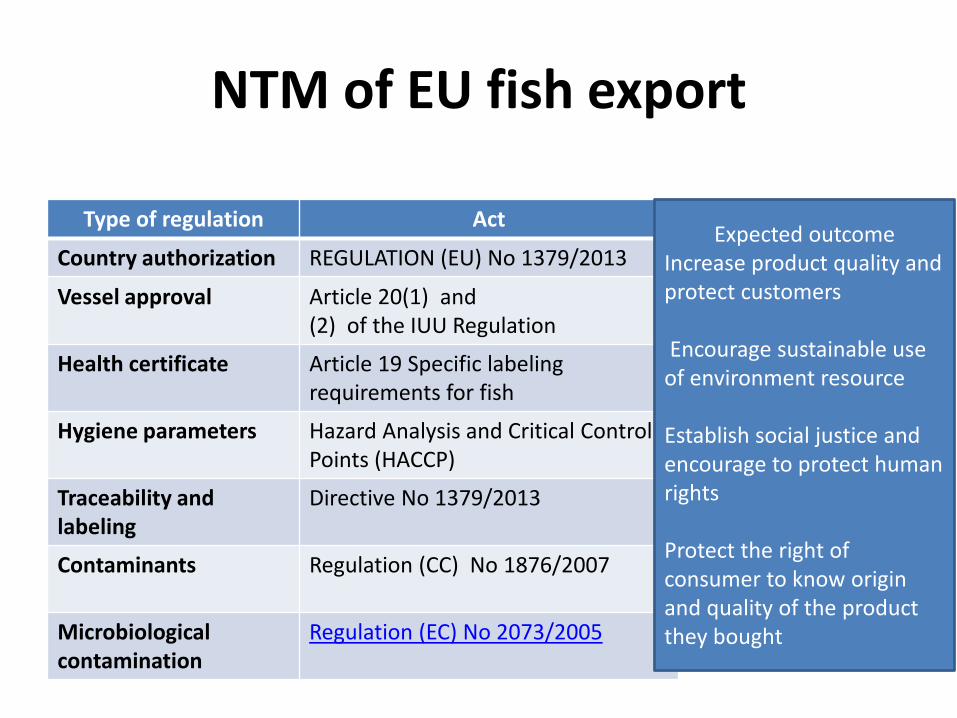
NTM of EU fish export
Type of regulation Act
Country authorization REGULATION (EU) No 1379/2013
Vessel approval Article 20(1) and (2) of the IUU Regulation
Health certificate Article 19 Specific labeling requirements for fish
Hygiene parameters Hazard Analysis and Critical Control Points (HACCP)
Traceability and labeling
Directive No 1379/2013
Contaminants Regulation (CC) No 1876/2007
Microbiological contamination
Regulation (EC) No 2073/2005
Expected outcomeIncrease product quality and protect customers
Encourage sustainable use of environment resource
Establish social justice and encourage to protect human rights
Protect the right of consumer to know origin and quality of the product they bought
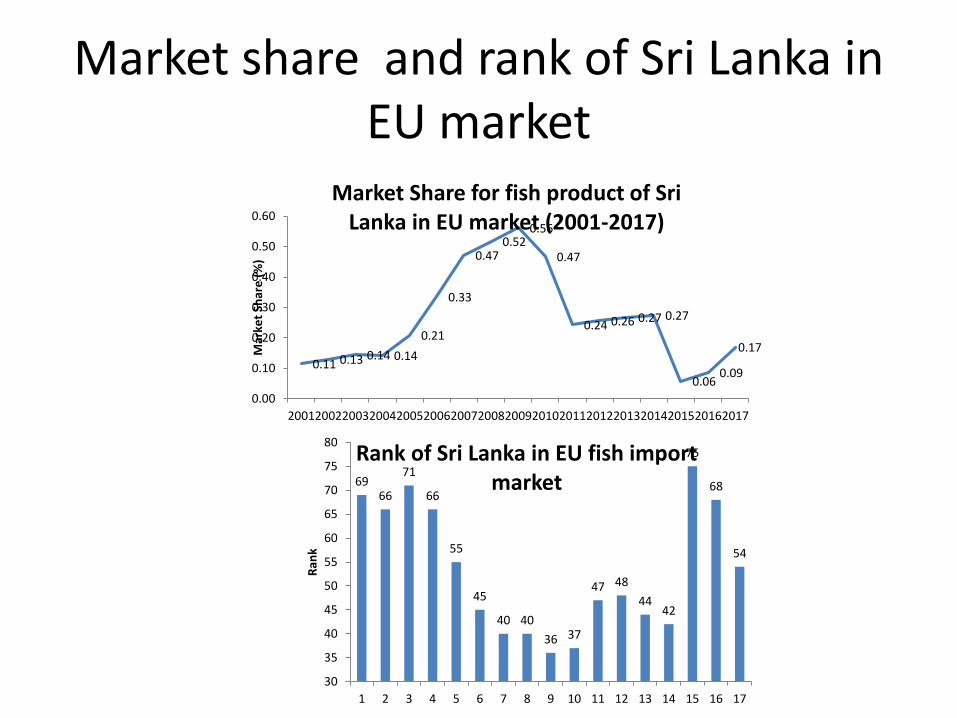
Market share and rank of Sri Lanka in EU market
0.11 0.13 0.14 0.14
0.21
0.33
0.470.52
0.56
0.47
0.24 0.26 0.27 0.27
0.060.09
0.17
0.00
0.10
0.20
0.30
0.40
0.50
0.60
20012002200320042005200620072008200920102011201220132014201520162017
Mar
ket
Shar
e (
%)
Market Share for fish product of Sri Lanka in EU market (2001-2017)
6966
71
66
55
45
40 40
36 37
47 48
4442
75
68
54
30
35
40
45
50
55
60
65
70
75
80
1 2 3 4 5 6 7 8 9 10 11 12 13 14 15 16 17
Ran
k
Rank of Sri Lanka in EU fish import market
0
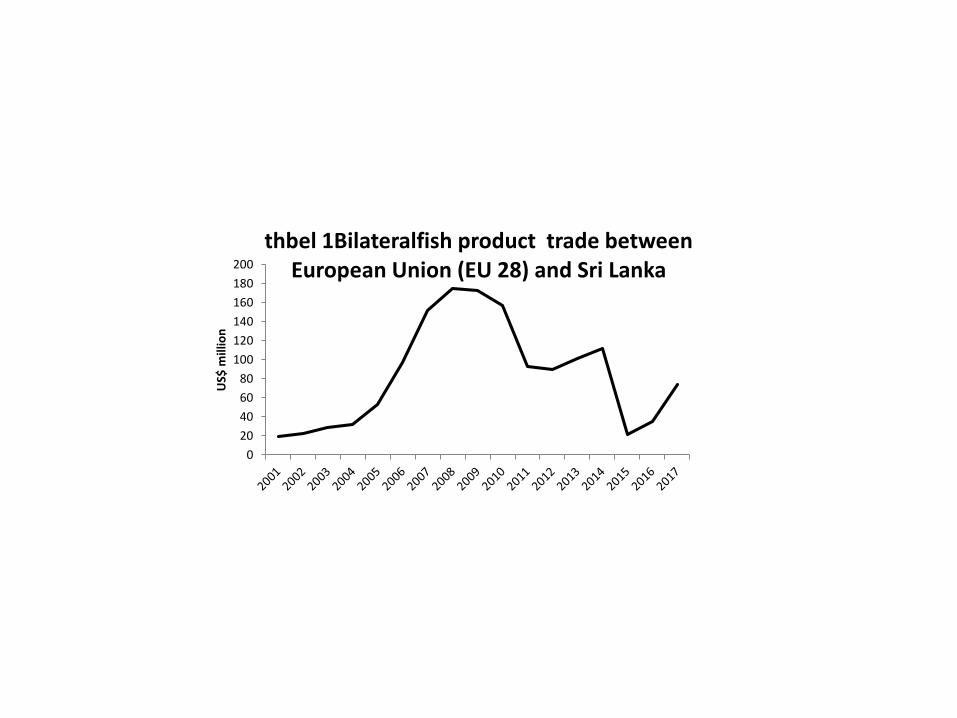
20
40
60
80
100
120
140
160
180
200
US$
mill
ion
thbel 1Bilateralfish product trade between European Union (EU 28) and Sri Lanka
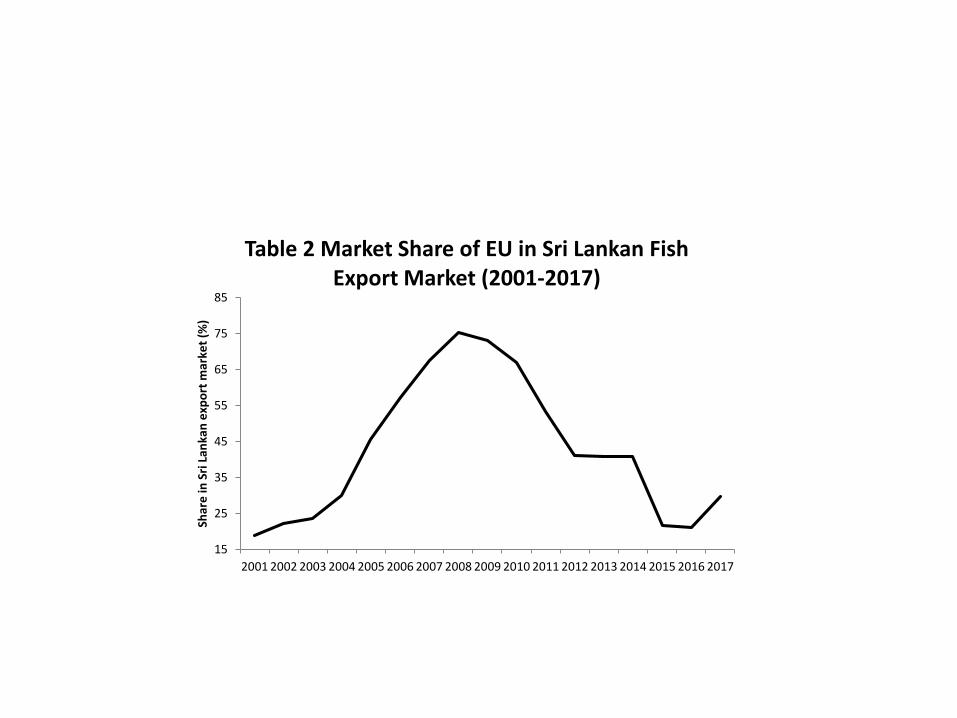
15
25
35
45
55
65
75
85
2001 2002 2003 2004 2005 2006 2007 2008 2009 2010 2011 2012 2013 2014 2015 2016 2017
Shar
e in
Sri
Lan
kan
exp
ort
mar
ket
(%)
Table 2 Market Share of EU in Sri Lankan Fish Export Market (2001-2017)
Fish species and fishing gears
0.0%
10.0%
20.0%
30.0%
40.0%
50.0%
60.0%
70.0%
Longline Gill netwith large
size
Gill netwith smallmesh size
Purseseining
Ban
After
0.0%
10.0%
20.0%
30.0%
40.0%
50.0%
60.0%
Yellow fintuna
Othertuna
species
Billfish Minnerexport fish
species
Small fishspecies
Ban
After
Most competitive product mix H
S co
des
30349 1 2 2 1 1 1
30233 2 1 1
30232 3 3 3 2 2 2
30247 4 4 9 10 5
30579 5 9 10 7
30445 6 5 6 4 3
30449 7 7 10 9 3 6
30692 9 8 7
30259 10 6 7 9 4
30571 5 3 6 8
30614 8 6 4 5 7
30499 8 4 5 9
30617 10 8 8 10
2017 2016 2015 2014 2013 2012
Years
Market share and rank of Sri Lanka in EU market
0.00
0.10
0.20
0.30
0.40
0.50
0.60
20012002200320042005200620072008200920102011201220132014201520162017
Mar
ket
Shar
e (
%)
6966
71
66
55
45
40 40
36 37
47 48
4442
75
68
54
30
35
40
45
50
55
60
65
70
75
80
Ran
k
Rank of Sri Lanka in EU fish import market
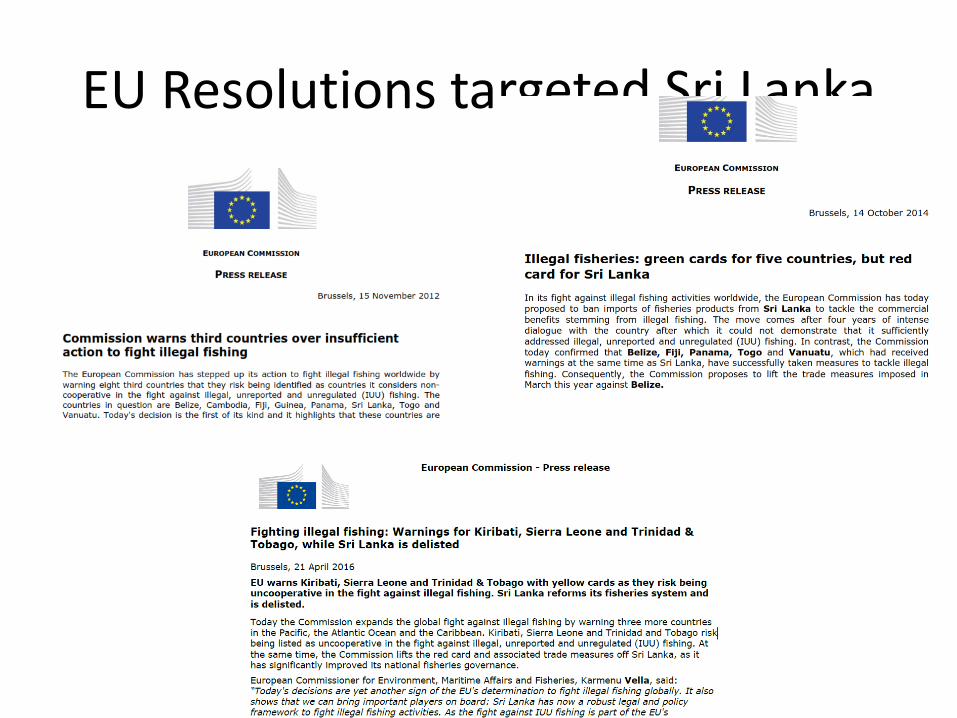
Table 1: Overview of third country authorisations to export seafood products to the EU (up to end 2017)
Yellow card pre-identification Identification (listing
as ban country)
Withdraw (delisting)
Number of the
countries
25 6 3
Names of the
Countries
Belize , Cambodia , Comoros Curacao ,
Fiji , Ghana ,Kiribati , Korea ,Liberia ,
Panama , Papua New Guinea ,
Philippines , Republic of Guinea , Sierra
Leone , Solomon Islands , Sri Lanka , St
Kitts
St Vincent and Grenadines , Taiwan ,
Thailand ,Togo , Trinidad and, Tobago ,
Tuvalu , Vanuatu , Vietnam
Republic of Guinea
Sri Lanka
St Vincent and
Grenadines
Belize
Cambodia
Comoros
Republic of Guinea
Sri Lanka
Belize
Source: Author preparation table base the list of banned and warn third country (European Commission
,2018)
EU Resolutions targeted Sri Lanka
Top 10 Export destination of Sri Lanka
Top 10 Export destination of Sri Lanka
Country 2012 2013 2014 2015 2016 2017
EU 1 1 2 2 2 1
USA 3 2 1 1 1 2
Japan 2 3 3 3 3 3
Hong Kong, China 4 5 6 6 6 6
Taipei, Chinese 6 4 5 5 5 7
Canada 5 6 4 4 4 4
Viet Nam 9 7 8 7 7 5
Saudi Arabia 8 8
Israel 8 9 10 9 9
United Arab Emirates 9 8 10 10
Singapore 7 8 7 9
Thailand 10 10 10
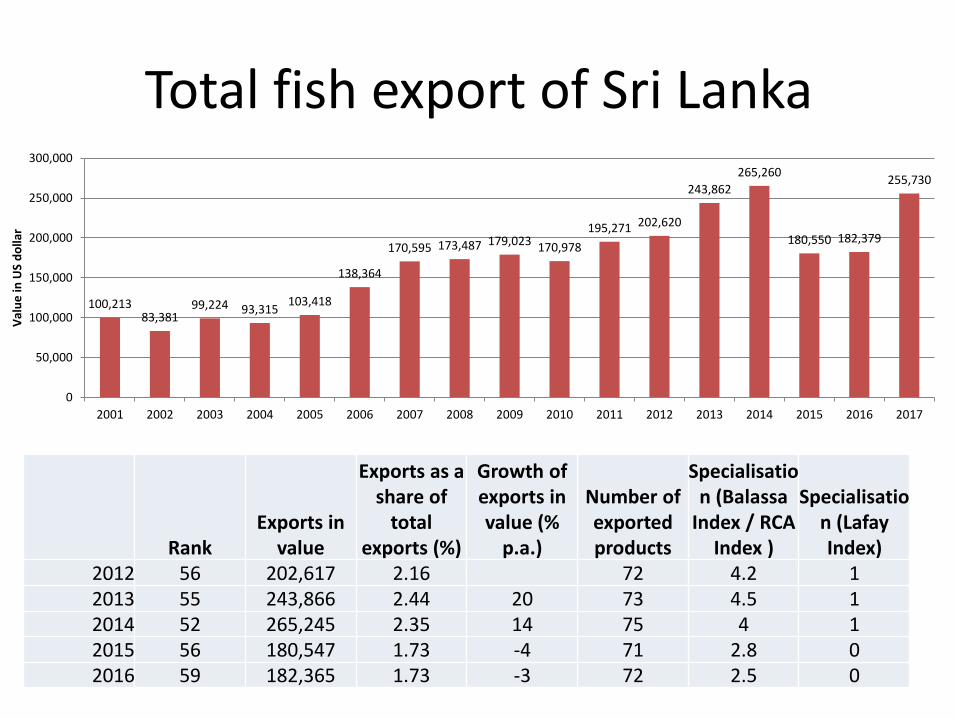
Total fish export of Sri Lanka
100,21383,381
99,224 93,315103,418
138,364
170,595 173,487 179,023 170,978
195,271 202,620
243,862
265,260
180,550 182,379
255,730
0
50,000
100,000
150,000
200,000
250,000
300,000
2001 2002 2003 2004 2005 2006 2007 2008 2009 2010 2011 2012 2013 2014 2015 2016 2017
Val
ue
in U
S d
olla
r
RankExports in
value
Exports as a share of
total exports (%)
Growth of exports in value (%
p.a.)
Number of exported products
Specialisation (Balassa
Index / RCA Index )
Specialisation (LafayIndex)
2012 56 202,617 2.16 72 4.2 12013 55 243,866 2.44 20 73 4.5 12014 52 265,245 2.35 14 75 4 12015 56 180,547 1.73 -4 71 2.8 02016 59 182,365 1.73 -3 72 2.5 0