Embed Size (px)
Citation preview

IMPACT OF OIL REVENUE ON ECONOMIC GROWTH, AGRICULTURE
AND TOURISM SECTORS OF DEVELOPING OIL EXPORTING COUNTRIES
RIZGAR ABDLKARIM ABDLAZIZ
FEP 2019 11

© COPYRIG
HT UPM
i
IMPACT OF OIL REVENUE ON ECONOMIC GROWTH, AGRICULTURE
AND TOURISM SECTORS OF DEVELOPING OIL EXPORTING
COUNTRIES
By
RIZGAR ABDLKARIM ABDLAZIZ
Thesis Submitted to the School of Graduate Studies, Universiti Putra Malaysia,
in Fulfillment of the Requirements for the Degree of Doctor of Philosophy
March 2019

© COPYRIG
HT UPM
ii
COPYRIGHT
All material contained within the thesis, including without limitation text, logos, icons,
photographs, and all other artwork, is copyright material of Universiti Putra Malaysia
unless otherwise stated. Use may be made of any material contained within the thesis
for non-commercial purposes from the copyright holder. Commercial use of material
may only be made with the express, prior, written permission of Universiti Putra
Malaysia.
Copyright © Universiti Putra Malaysia
© COPYRIG
HT UPM
i
Abstract of thesis presented to the Senate of Universiti Putra Malaysia in fulfilment of
the requirement for the degree of Doctor of Philosophy
IMPACT OF OIL REVENUE ON ECONOMIC GROWTH, AGRICULTURE
AND TOURISM SECTORS OF DEVELOPING OIL EXPORTING
COUNTRIES
By
RIZGAR ABDLKARIM ABDLAZIZ
March 2019
Chairman : Mohd Naseem Niaz Ahmad, PhD
Faculty : Economics and Management
This study investigates the impact of oil revenue on economic growth, agriculture and
tourism in developing oil-exporting countries, which are divided into major and minor
oil-exporting countries based on their oil revenue shares to their respective GDPs.
While developing oil-exporting countries have gained massive oil income, they suffer
from Dutch disease in different manners, such as low economic growth and lagging
non-oil sectors. Heterogeneities exist among developing oil-exporting countries. Panel
Autoregressive Distributed Lag (ARDL) modelling is used to achieve the objectives
of the study.
The first objective of this study is to examine the impact of oil revenue on economic
growth for 25 developing oil-exporting countries (major and minor), conditional to
the different level of the real effective exchange rate. The results show that the long-
run effect of oil revenue on economic growth is significant only for the full sample,
while the effect is highly positive and significant in the short run for all groups. Also,
the indirect effect of the marginal effect of oil revenue on economic growth is
statistically insignificant for all groups. However, the indirect effect of the oil price on
economic growth is statistically significant and confirms the same direction of the
marginal effects of oil revenue for all groups. In the case of the major group, the
indirect effect of oil price shows the symptom of Dutch disease and proving the
existence of Dutch disease. That means that in major oil-exporting countries, the oil
price is harmful for economic growth when the real effective exchange rate
appreciates.
© COPYRIG
HT UPM
ii
The second objective of the present study is to investigate the impact of oil revenue
on the agriculture sector of 25 developing oil-exporting countries (major and minor),
conditional to the different level of the real effective exchange rate. The regression
results of the baseline model indicate that oil revenue in the long and short term has
adverse and highly significant effects on the value added of agriculture in the full
sample, as well as in the cases of major and minor oil-exporting countries. Despite this
result, the magnitude of the impact in the major oil-exporting countries is higher than
that of the minor oil-exporting countries. The results of marginal effects for the minor
group show that oil revenue indirectly slows down the value added of agriculture when
the real effective exchange rate appreciates. Otherwise, oil revenue benefits
agriculture if the real effective exchange rate depreciates. However, in the case of
major group, the marginal effect shows that oil revenue decreases the value added of
agriculture, even in the presence of real effective exchange rate depreciation.
The third objective of this study is to find the relationship between oil revenue and the
tourism sector of oil-exporting countries based on the different level of the real
effective exchange rate. The estimations show a direct positive effect of oil revenue
on tourism income for the entire sample, and for the minor group. The results show an
adverse but insignificant for the major group. Additionally, the findings of the
marginal effect of oil revenue on tourism income support the Dutch disease
phenomenon for the entire sample and the major group. That means the marginal
effects of oil revenue are negative and significant at the lower-level of the real
effective exchange rate (appreciation) but positive and significant at the higher-level
of the real effective exchange rate (depreciation). This result is contrary to the minor
group but insignificant.
Overall the findings and results support the hypotheses of this study, which focuses
on the differential behaviour of major and minor oil-exporting countries toward
economic growth and non-oil sectors (the agriculture and tourism sectors). More
specifically, the results of the direct and indirect effects of oil revenue show that major
oil-exporting countries suffer from Dutch disease. The results of this study have policy
implications, pointing to the need to eliminate this phenomenon. First, it is necessary
for governments of oil-exporting countries to adopt a fiscal policy that limits the role
of spending effects as a source of appreciation to the real effective exchange rate.
Secondly, policymakers should adopt and improve policy instruments that support and
promote the non-oil sectors—including proper macroeconomic policy, such as
enhancing public investment in the agriculture and tourism sectors. Finally, economic
diversification is required. Using oil revenue to build high-quality infrastructure may
improve the non-oil sectors. Then, dynamic growth in the oil sector may lead to
sustainable economic growth in the long run.
© COPYRIG
HT UPM
iii
Abstrak tesis yang dikemukakan kepada Senat Universiti Putra Malaysia sebagai
memenuhi keperluan untuk ijazah Doktor Falsafah
KESAN HASIL MINYAK TERHADAP PERTUMBUHAN EKONOMI,
SEKTOR PERTANIAN DAN PELANCONGAN DI KALANGAN NEGARA-
NEGARA MEMBANGUN PENGEKSPORT MINYAK
Oleh
RIZGAR ABDLKARIM ABDLAZIZ
Mac 2019
Pengerusi : Mohd Naseem Niaz Ahmad, PhD
Fakulti : Ekonomi dan Pengurusan
Kajian ini mengkaji impak hasil minyak ke atas pertumbuhan ekonomi, sektor
pertanian dan pelancongan bagi negara-negara membangun pengeksport minyak, yang
dibahagikan kepada negara pengeksport minyak utama dan kecil berdasarkan nisbah
hasil minyak kepada KDNK Negara masing-masing. Bagaimanapun, jika negara-
negara membangun pengeksport minyak memperoleh pendapatan minyak yang besar,
mereka mengalami penyakit Dutch dalam pelbagai cara yang berbeza, seperti
pertumbuhan ekonomi yang rendah serta ketinggalan di dalam sektor bukan minyak.
Selain itu, kaedah Panel Autoregressive Distributed Lag (ARDL) digunakan untuk
mencapai objektif kajian, di mana terdapat heterogen di kalangan negara-negara
membangun pengeksport minyak.
Objektif pertama kajian ini adalah untuk mengkaji kesan hasil minyak ke atas
pertumbuhan ekonomi bagi 25 negara-negara membangun pengeksport minyak
(major dan minor). Khususnya, sama ada kesan hasil minyak terhadap pertumbuhan
ekonomi bergantung kepada kadar pertukaran mata wang. Keputusan kajian
menunjukkan bahawa kesan jangka panjang hasil minyak ke atas pertumbuhan
ekonomi didapati tidak signifikan sementara kesannya sangat positif dan signifikan
dalam jangka pendek. Selain itu, kesan tidak langsung kesan marginal hasil minyak
terhadap pertumbuhan ekonomi adalah tidak signifikan bagi semua kumpulan.
Bagaimanapun, kesan harga minyak secara tidak langsung terhadap pertumbuhan
ekonomi adalah signifikan dan mengesahkan arah yang sama kesan marginal hasil
minyak bagi semua kumpulan. Dalam kes kumpulan utama, kesan tidak langsung
harga minyak menunjukkan gejala penyakit Belanda dan membuktikan kewujudan
penyakit Belanda. Ini bermakna di negara-negara pengeksport minyak utama, harga
minyak adalah berbahaya untuk pertumbuhan ekonomi apabila kadar pertukaran mata
wang mengalami naik nilai.

© COPYRIG
HT UPM
iv
Objektif kedua kajian ini adalah untuk mengkaji kesan hasil minyak ke atas sektor
pertanian bagi 25 negara-negara membangun pengeksport minyak (utama dan kecil)
yang mana bergantung pada kadar pertukaran matawang. Keputusan kajian
menunjukkan bahawa hasil minyak dalam jangka panjang dan jangka pendek
mempunyai kesan negatif dan ketara terhadap nilai tambah pertanian bagi sampel
penuh dan kes-kes negara-negara membangun pengeksport minyak utama dan kecil.
Disebalik keputusan ini, magnitud impak bagi negara-negara membangun
pengeksport minyak utama adalah lebih tinggi daripada negara-negara membangun
pengeksport minyak kecil. Keputusan kesan marginal untuk kumpulan kecil
mendedahkan bahawa hasil minyak secara tidak langsung melambatkan nilai tambah
sektor pertanian apabila kadar pertukaran matawang naik nilai. Jika tidak, hasil
minyak memberi manfaat kepada sektor pertanian jika kadar pertukaran matawang
mengalami susutnilai. Bagaimanapun, dalam kes kumpulan utama, kesan marginal
menunjukkan bahawa hasil minyak mengurangkan nilai tambah sektor pertanian
walaupun apabila kadar pertukaran matawang mengalami susutnilai.
Objektif ketiga kajian ini adalah untuk mengkaji hubungan antara hasil minyak dan
sektor pelancongan negara-negara membangun pengeksport minyak berdasarkan
kadar pertukaran matawang. Keputusan kajian menunjukkan kesan langsung positif
dari hasil minyak ke atas pendapatan pelancongan untuk keseluruhan sampel dan
kumpulan kecil, sementara keputusan adalah tidak signifikan bagi kumpulan utama.
Di samping itu, penemuan kesan marginal hasil minyak terhadap pendapatan
pelancongan menyokong fenomena penyakit Dutch untuk keseluruhan sampel dan
kumpulan utama. Ini bermakna kesan marginal hasil minyak adalah negatif dan
signifikan di peringkat rendah kadar pertukaran matawang (naik nilai) tetapi adalah
positif dan signifikan pada tahap yang lebih tinggi dari kadar pertukaran matawang
(susut nilai). Berbeza dengan kumpulan kecil, yang mana didapati tidak signifikan.
Keseluruhannya penemuan menyokong hipotesis kajian ini, yang menumpukan pada
tingkah laku perbezaan negara pengeksport minyak utama dan kecil ke atas
pertumbuhan ekonomi dan sektor bukan minyak (sektor pertanian dan pelancongan).
Ianya mendapati, kesan langsung dan tidak langsung hasil minyak menunjukkan
bahawa negara-negara membangun pengeksport minyak utama mengalami penyakit
Belanda. Oleh itu, beberapa implikasi dasar perlu bagi menghapuskan fenomena ini.
Pertama, adalah perlu bagi kerajaan negara pengeksport minyak untuk mengguna
pakai dasar fiskal bagi membatasi peranan perbelanjaan sebagai punca kepada kadar
pertukaran matawang naik nilai. Kedua, mengguna pakai dan memperbaiki jenis
instrumen dasar yang menyokong dan menggalakkan sektor bukan minyak termasuk
dasar makroekonomi yang betul seperti meningkatkan pelaburan awam dalam sektor
pertanian dan pelancongan. Akhirnya, kepelbagaian ekonomi diperlukan, dengan
menggunakan hasil minyak untuk membina infrastruktur berkualiti tinggi supaya
dapat meningkatkan hasil sektor bukan minyak, maka sektor minyak dapat membawa
kelestarian pertumbuhan ekonomi dalam jangka panjang.

© COPYRIG
HT UPM
v
ACKNOWLEDGEMENTS
First and foremost, my sincerest thanks go to the most Merciful Allah S.W.T. Who
gifted me the chance to continue my Ph.D. study in the UPM in Malaysia. I want to
display my deepest gratitude thanks to my thesis supervisor committee members,
especially to Dr. Mohd Naseem Bin Niaz Ahmad, The chairman of the thesis, for his
perceptive supervision, advice, guidance, valuable suggestions, and support during the
research period. I want to give great appreciation to Dr. Ly Slesman for his valuable
contribution during my Ph.D.’s journey. In the same manner, I want to extend my
sincere gratitude to my co-supervisors, Associate Prof. Dr. Wan Azman Saini Bin Wan
Ngah and Associate Prof. Dr. Normaz Wana Binti Ismail for their valuable and
continuous assistance. It is my pleasure to state my gratitude and appreciation to all
lecturers and the whole staff of the Faculty of Economics and Management, UPM
especially, Prof Dr. Mansor Ibrahim, Prof Dr. Ahmad Zubaidi Bin Baharumshah,
Assoc. Prof Dr. Law Siong Hook, also my great thanks to deputy dean of Graduate
Studies, Assoc. Prof Dr. Yuhanis Ab Aziz for her excellent assistance in some tough
times during my study. Finally, I want to thank my family (my Mother, my wife,
brothers, and sisters) and I would like to thanks my friends especially, Dr. Younis Ali
Ahmed and Dr. Adamu Peter, for their encouragement and support during my study
period,

© COPYRIG
HT UPM

© COPYRIG
HT UPM
vii
This thesis was submitted to the Senate of the Universiti Putra Malaysia and has been
accepted as fulfilment of the requirement for the degree of Doctor of Philosophy. The
members of the Supervisory Committee were as follows:
Mohd Naseem Niaz Ahmad, PhD
Senior Lecturer
Faculty of Economics and Management
Universiti Putra Malaysia
(Chairman)
Wan Azman Saini Wan Ngah, PhD
Associate Professor
Faculty of Economics and Management
Universiti Putra Malaysia
(Member)
Normaz Wana Ismail, PhD
Associate Professor
Faculty of Economics and Management
Universiti Putra Malaysia
(Member)
Ly Slesman, PhD
Assistant Professor
Center for Advanced Research
Universiti Brunei Darussalam
(Member)
ROBIAH BINTI YUNUS, PhD
Professor and Dean
School of Graduate Studies
Universiti Putra Malaysia
Date:

© COPYRIG
HT UPM
viii
Declaration by graduate student
I hereby confirm that:
this thesis is my original work;
quotations, illustrations and citations have been duly referenced;
this thesis has not been submitted previously or concurrently for any other degree
at any institutions;
intellectual property from the thesis and copyright of thesis are fully-owned by
Universiti Putra Malaysia, as according to the Universiti Putra Malaysia
(Research) Rules 2012;
written permission must be obtained from supervisor and the office of Deputy
Vice-Chancellor (Research and innovation) before thesis is published (in the form
of written, printed or in electronic form) including books, journals, modules,
proceedings, popular writings, seminar papers, manuscripts, posters, reports,
lecture notes, learning modules or any other materials as stated in the Universiti
Putra Malaysia (Research) Rules 2012;
there is no plagiarism or data falsification/fabrication in the thesis, and scholarly
integrity is upheld as according to the Universiti Putra Malaysia (Graduate
Studies) Rules 2003 (Revision 2012-2013) and the Universiti Putra Malaysia
(Research) Rules 2012. The thesis has undergone plagiarism detection software
Signature: Date:
Name and Matric No: Rizgar Abdlkarim Abdlaziz, GS40629

© COPYRIG
HT UPM
ix
Declaration by Members of Supervisory Committee
This is to confirm that:
the research conducted and the writing of this thesis was under our supervision;
supervision responsibilities as stated in the Universiti Putra Malaysia (Graduate
Studies) Rules 2003 (Revision 2012-2013) were adhered to.
Signature:
Name of Chairman
of Supervisory
Committee:
Dr. Mohd Naseem Niaz Ahmad
Signature:
Name of Member
of Supervisory
Committee:
Associate Professor Dr. Wan Azman Saini Wan Ngah
Signature:
Name of Member
of Supervisory
Committee:
Associate Professor Dr. Normaz Wana Ismail
Signature:
Name of Member
of Supervisory
Committee:
Associate Professor Dr. Ly Slesman
© COPYRIG
HT UPM
x
TABLE OF CONTENTS
Page
ABSTRACT i
ABSTRAK iii
ACKNOWLEDGEMENTS v
APPROVAL vi
DECLARATION viii
LIST OF TABLES xiii
LIST OF FIGURES xv
CHAPTER
1 INTRODUCTION 1
1.1 An Overview 1
1.2 Background to the Study 3
1.2.1 Oil Price and Oil Revenue Pattern 3
1.2.2 Oil Revenue and Economic Growth in Oil-Exporting
Countries 7
1.2.3 Oil Revenue and Agriculture Sector in Oil-Exporting
Countries 14
1.2.4 Oil Revenue and Tourism in the Oil-Exporting
Countries 24
1.3 Problem Statement 36
1.3.1 Research Questions 38
1.4 Research Objectives 38
1.5 Significance of the Study 38
1.6 Organization of the Study 39
2 LITERATURE REVIEW 40
2.1 Introduction 40
2.2 Dutch Disease and the Effect of Oil Revenue on Economic
Growth 40
2.2.1 Theoretical Review 40
2.2.1.1 Resource Curse Theory 40
2.2.1.2 What is Dutch Disease? 41
2.2.1.3 Dutch Disease, Exchange Rate Appreciation
and Economic Growth 42
2.2.2 Empirical Studies 44
2.3 Dutch Disease and the Effect of Oil Revenue on Agricultural
Value-Added 47
2.3.1 Theoretical Review 47
2.3.1.1 Dutch Disease and The Effect of Oil Revenue
on Agricultural Value-Added in Developing
Oil-Exporting Economies 48
2.3.2 Empirical Studies 49
2.4 The Effect of Oil Revenue on Tourism Income 51
2.4.1 Theoretical Reviews 51

© COPYRIG
HT UPM
xi
2.4.1.1 Effect of Oil Price on the Tourism Sector of
Oil-Importing Countries 52
2.4.1.2 Effects of Oil Revenue on the Tourism Sector
in Oil-Exporting Countries 53
2.5 Summary of Gap in Literature 55
3 RESEARCH METHODOLOGY 58
3.1 Introduction 58
3.2 First Objective: Impact of Oil Revenue on Economic Growth 58
3.2.1 Theoretical Framework: Impact of Oil Revenue on
Economic Growth 58
3.2.2 Estimation Methodology for the Effect of Oil Revenue
on Economic Growth 61
3.2.3 Variable Description and Expected Signs 63
3.2.3.1 Dependant variable 63
3.2.3.2 Independent variables 63
3.3 Second Objective: Impact of Oil Revenue on the Agriculture
Sector (Dutch Disease) 65
3.3.1 Theoretical Framework: Impact of Oil Revenue on the
Agriculture Sector (Dutch Disease) 65
3.3.2 Estimation Methodology for the Impact of Oil Revenue
on the Agriculture Sector 66
3.3.3 Variable Description and Expected Sign 67
3.3.3.1 Dependent variable 67
3.3.3.2 Independent variables 68
3.4 Third Objective: Effect of Oil Revenue on the Tourism Sector 69
3.4.1 Theoretical Framework: Effect of Oil Revenue on the
Tourism Sector 69
3.4.2 Estimation Methodology for the Effect of Oil Revenue
on Tourism 71
3.4.3 Variable Description and Expected Signs 72
3.4.3.1 Dependent variable 73
3.4.3.2 Independent variables 73
3.5 Empirical Methodology: Panel ARDL 74
3.5.1 Estimating Panel Unit Root 74
3.5.2 Estimating Panel Co-Integration 75
3.5.3 Model Selection 76
3.5.3.1 Mean Group (MG) 76
3.5.3.2 Pooled Mean Group (PMG) 77
3.5.3.3 Hausman Test and Model Selection 79
3.5.3.4 Empirical Methodology and Justification 80
3.6 Data Source and Sample Countries 80
4 RESULTS AND DISCUSSION 83
4.1 Introduction 83
4.2 Results and Discussion for the First Objective: Impact of Oil
Revenue on Economic Growth 83
4.2.1 Descriptive Statistics and Correlation Analysis 83
4.2.2 Panel Unit Root Tests Results 86

© COPYRIG
HT UPM
xii
4.2.3 Panel Cointegration Results 90
4.2.4 Regression Results and Discussion: Oil Revenue and
Economic Growth 90
4.2.5 Robustness Check and Sensitivity Analysis 94
4.3 Results and Discussion for the Second Objective: Impact of Oil
Revenue on the Agriculture Sector 97
4.3.1 Descriptive Statistics and Correlation Analysis 97
4.3.2 Panel Unit Root Tests Results 102
4.3.3 Panel Cointegration Results 106
4.3.4 Regression Results and Discussion: Oil Revenue and
Agriculture Sector 108
4.3.5 Robustness Check and Sensitivity Analysis 114
4.4 Results and Discussion for the Third Objective: Impact of Oil
Revenue on the Tourism Sector 117
4.4.1 Descriptive Statistics and Correlation Analysis 117
4.4.2 Panel Unit Root Test Results 122
4.4.3 Panel Cointegration Results 126
4.4.4 Regression Results and Discussion: Oil Revenue and
Tourism Sector 128
4.4.5 Robustness Check and Sensitivity Analysis 133
4.5 Summary of the Results 136
5 CONCLUSION AND POLICY IMPLICATIONS 137
5.1 An Overview 137
5.2 Summary of Empirical Findings 139
5.3 Policy Implications 142
5.4 Limitation and Future Research 143
REFERENCES 144
APPENDICES 159
BIODATA OF STUDENT 172
LIST OF PUBLICATIONS 173

© COPYRIG
HT UPM
xiii
LIST OF TABLES
Table Page
1.1 Economic growth (GDP per Capita Growth (Annual %) for oil
exporting countries 1970-2014 8
1.2 Unemployment rate (educated youth) in the oil exporting countries 16
1.3 Value added share of GDP by Sectors 17
1.4 Sectorial Distribution of Employment (%total Employment) 18
3.1 Summary of variables for First Objective 65
3.2 Summary of Variables for Objective Two 69
3.3 Summary of Variables for Objective Three 74
3.4 List of Sample Countries for Objective One 82
3.5 Variables and Data Sources 82
4.1 Descriptive statistic of variables for objective one 84
4.2 Correlation matrix for objective one 85
4.3 Unit Root test for full sample of developing oil exporting countries for
objective one (Full Sample) 87
4.4 Unit Root test for major developing oil exporting countries for
objective one (major oil exporting countries) 88
4.5 Unit Root test for minor developing oil exporting countries for
objective one (minor oil exporting countries) 89
4.6 Panel cointegration tests for objective one 90
4.7 Results of PMG estimator of the impact of oil revenue on economic
growth (real effective exchange rate) 93
4.8 Results of PMG estimators of the impact of oil price on economic
growth (real effective exchange rate). 95
4.9 Descriptive statistic of variables for objective two 99
4.10 Correlation matrix for objective two 101
4.11 Unit Root test for full sample of developing oil exporting countries for
objective two (full sample) 103

© COPYRIG
HT UPM
xiv
4.12 Unit Root test for major developing oil exporting countries for
objective two (major oil exporting countries) 104
4.13 Unit Root test for minor developing oil exporting countries for
objective two (minor oil exporting countries) 105
4.14 Panel Cointegration for Objective Two 107
4.15 Results of PMG estimator of the impact of oil revenue on agriculture
sector 109
4.16 Results of PMG estimator of the impact of oil price on agriculture
sector 115
4.17 Descriptive statistic of variables for objective three 119
4.18 Correlation matrix for objective three 121
4.19 Panel unit root test for full sample (objective three) 123
4.20 Panel unit root test for major oil exporting countries (objective three) 124
4.21 Panel unit root test for minor oil exporting countries (objective three) 125
4.22 Panel cointegration tests for objective three 127
4.23 Results of PMG estimator of the impact of oil revenue on tourism
sector 130
4.24 Results of PMG estimator of the impact of oil price on tourism sector 134

© COPYRIG
HT UPM
xv
LIST OF FIGURES
Figure Page
1.1 Oil price change during 1970-2014 5
1.2 Oil price and oil revenue share of GDP in oil exporting countries 6
1.3 The relationship between GDP per Capita, oil Revenue, REER, and
interaction term of REER and oil rent during 970-2014 ( full sample
of oil exporting countries) 11
1.4 The relationship between GDP per capita growth, oil revenue, REER,
and interaction term of REER and oil revenue during 197-2014 (Major
oil exporting countries) 12
1.5 The relationship between GDP per capita growth, oil revenue, REER,
and interaction term of oil revenue and REER during 1970-2014(minor
oil exporting countries) 13
1.6 Agriculture value-added (%GDP) in the oil exporting countries 19
1.7 The relationship between agriculture % GDP, oil revenue, REER and
interaction term of REER and oil revenue during 1970-2014( full
sample) 21
1.8 The relationship between agriculture %GDP, oil revenue, REER, and
interaction term of REER and oil revenue during 1970-2014(Major oil
exporting countries) 22
1.9 The relationship between agriculture %GDP, oil revenue, REER, and
interaction term of REER and oil revenue during 1970-2014(Minor oil
exporting countries) 23
1.10 Tourism % GDP for both major and minor oil exporting countries
(average) 26
1.11 Tourism contribution to employment as percentage of total
employment for major and minor oil exporting countries 27
1.12 Tourism export (% Total export) in the major and minor oil exporting
countries 29
1.13 Net tourism export for major and minor oil exporting countries. 31
1.14 The relationship between tourism share of GDP, oil revenue, REER,
interaction term of REER and oil rent during 1990-2014.( full
sample ) 33

© COPYRIG
HT UPM
xvi
1.15 The relationship between tourism share of GDP, oil revenue, REER,
interaction term of REER and oil rent during 1990-2014.(Major oil
exporting countries ) 34
1.16 The relationship between tourism share of GDP, oil revenue, REER,
interaction term of REER and oil rent during 1990-2014.(Minor oil
exporting countries ) 35
3.1 Theoretical Framework of the effect of oil revenue on tourism sector
in the oil exporting countries 70
4.1 Marginal effect of oil price on GDP per capita growth at the different
level of the real effective exchange rate 96
4.2 Marginal effect of oil revenue on agriculture sector at level of real
effective exchange rate 113
4.3 Marginal effect of oil price on agriculture sector at level of real
effective exchange rate 116
4.4 Marginal effect of oil revenue on tourism sector at level of real
effective exchange rate 132
4.5 Marginal effect of oil price on tourism sector at level of real effective
exchange rate 135

© COPYRIG
HT UPM
1
CHAPTER 1
1 INTRODUCTION
1.1 An Overview
The primary objective of this study is to investigate three issues concerning oil-
exporting countries that are essential for their future growth and development. The
first issue concentrates on the relationship between oil revenue and economic growth.
Although notable studies have recently focused on this issue in oil-exporting
countries, considerable debate regarding the relationship between oil revenue and
economic growth remains amongst researchers. Some oil-exporting countries benefit
from the abundance of oil revenue to avoid Dutch disease. These countries—which
include Indonesia, Malaysia, Chile and Botswana—have attained a sustainable oil-
driven growth path (Mehrara and Sarem, 2009; Venables, 2016). By contrast, other
oil-exporting developing economies have failed in managing windfall revenue to
enjoy sustainable economic growth (Frankel, 2010; Sachs and Warner, 1995).
The resource-curse puzzle phenomenon refers to the paradox of plenty, which states
that abundant natural resources (oil in our case) will have an adverse effect on
economic growth. Many African and Middle Eastern countries—such as Nigeria,
Angola, Congo, Saudi Arabia and Iraq—have abundant oil and other natural
resources. However, their citizens still experience a low standard of living and low
income per capita. By contrast, Japan, South Korea, Singapore and Hong Kong have
achieved levels of income per capita and well-being seen in developed industrial
countries, despite having meagre natural resources (Sachs and Warner, 1995).
Dutch disease theory refers to the adverse impact of resource income (oil income) on
economic growth through the real exchange rate. Theoretically, an increase in oil price
and oil revenue during the boom period in major oil-exporting countries will result in
an appreciation of the real exchange rate due to the overvaluing of the local currency.
Non-oil exports (industrial, agricultural and tourism exports) will decrease, which
corresponds to a rise in the prices of services or non-tradable goods (Dülger, Lopcu,
Burgaç, and Ballı,2013).
Oil price changes since the 1970s have been producing extensive research that
analyses the effect of oil price on economic growth in developed oil-importer and oil-
exporter economies. There is an extensive literature on different channels such as
supply-side shock, income transfer, real balance effect and monetary policy, which
considers that high oil prices can cause low economic growth in oil-importing
countries. However, after the year 2000, oil price shocks have exerted minimal effects
on oil-importing countries because of their efficient energy use and improvements in
monetary policy (see Brown and Yucel 2002; Blanchard and Gali ,2010) .

© COPYRIG
HT UPM
2
This condition differs for developing oil-exporting countries. Oil revenue is still
considered the major driver of these countries. Thus, oil price changes affect the
growth of such countries. In general, an oil price decrease is beneficial for oil
importing economies because it leads to real income growth, a decrease in production
costs and low inflation. By contrast, an oil price decrease is a concern for oil-exporting
countries because of its adverse effect on their real income. However, the negative
impact of oil price reduction on economic growth is not the same for all individual oil-
exporting countries. Mehrara and Sarem (2009) and Moshiri (2015) provided strong
evidence for different responses to oil price and oil revenue among oil-exporting
economies. Thus, oil-exporting countries that have successfully diversified their
economies through good management of oil revenue to establish effective industrial,
agricultural and tourism sectors, may escape from the negative effect of oil-price
shocks and the Dutch disease phenomenon.
The second issue is to investigate the effect of oil revenue on the agricultural output
of developing oil-exporting countries. In their seminal work, Corden and Neary (1982)
provided a Dutch disease theory to explain the effect of the oil boom price on different
sectors of the economy. In the core model of the Dutch disease, the economy is divided
into three sectors: the boomed sector (e.g. oil sector), the producer sector of tradable
goods (e.g. industrial output) and the non-tradable sector (e.g. service sector or
housing). The model predicts an increase in national income as a result of high oil
prices, and thus, the boomed sector further produces two effects. First, an appreciation
in the local currency reduces the export of tradable goods in the international market.
Secondly, the factors of output (labour and capital) move from the industrial sector to
the oil or boomed sector due to the resource-movement effect, thereby reducing
industrial production relative to the oil sector.
Corden and Neary (1982) also investigated Dutch disease for developed oil-exporting
economies, but focused on the industrial sector. They found a negative effect of high
oil price on industrial output because of the following reasons. First, developed
economies have a long-term experience in producing industrial goods. Moreover, the
industrial sector considers the primary sector that produces goods for export in the
global market. Secondly, the movement of capital and labour is flexible in developed
countries. Consequently, an oil revenue increase appreciates local currency, which
leads to diminishing industrial exports through the spending and resource-movement
effects.
However, this condition may not be the case in developing oil-exporting countries.
The movement of input factors (labour and capital) between the boomed (oil) sector
and the remaining sectors in an economy is inflexible. In addition, the agriculture (not
industrial) sector is typically considered the primary sector in nearly all developing
economies. Thus, agricultural output is negatively affected by high national income
that stems from high oil prices and oil revenues (Apergis, El-Montasser, Sekyere,
Ajmi, and Gupta, 2014). Fardmanesh (1991) argued that an increase in the world oil
price leads to the development of the industrial sector and contracts the agriculture
sector in developing oil-exporting economies.

© COPYRIG
HT UPM
3
Another important issue that has not gained serious attention in the economic literature
is the effect of oil revenue on the tourism sector amongst oil-exporting countries.
Theoretically, an increase in the energy price and oil price may harm economic
activities and the tourism sector in oil-importing economies through its impact on
transportation costs, production costs, economic uncertainty and disposable income
(Donzelli, 2010). These economies are heavily dependent on the tourism industry to
generate their income (Becken, 2008; Chatziantoniou, Filis, Eeckels and Apostolakis,
2013). In the case of oil-exporting countries, the effect of oil revenue on tourism
remains under investigation (Becken, 2011b). Although no specific theory identifies
the direct effect of oil revenue on the tourism sector, the model developed by Corden
and Neary (1982) may provide a basic theoretical framework to understand this
relationship in two indirect channels. These channels are (1) through the exchange rate
appreciation in oil-exporting economies that is supported by empirical studies (Fakhri,
2010; Jahan-Parvar and Mohammadi, 2011); and (2) through the service sector.
The following subsections in this chapter discuss the three issues in oil-exporting
countries. Section 1.2 presents the background of these issues. Section 1.3 discusses
the research problem and questions. Section 1.4 highlights the research objectives.
Section 1.5 discusses the significance of the study. Section 1.6 focuses on the
organization of the research.
1.2 Background to the Study
1.2.1 Oil Price and Oil Revenue Pattern
An overview of historical oil price shocks and the relationship between oil price and
oil revenue is presented here. Similar to other economic goods, the crude oil price
follows the law of supply and demand. Thus, a change in oil demand and supply in
the global market affects the oil price. An increase in oil demand leads to high oil
prices, whereas high oil supply leads to low oil prices. Several oil price shocks have
occurred since the discovery of crude oil, but the first oil price shock that considerably
affected developed oil-importing countries occurred in October 1973 during the Arab–
Israeli war. On October 17, Arab oil-exporting countries announced an embargo on
oil exports to Western economies that supported Israel. In September of the same year,
a substantial decrease in oil production by 4.4 million barrels per day occurred. The
decrease accounted for approximately 7.5 percent of the global supply shortage. Thus,
crude oil prices jumped from 1.7 US dollars to 3.29 US dollars per barrel in 1921–
1973 to 11.58 US dollars per barrel in 1974. The Iranian revolution in 1979 was the
second oil price shock since World War Ⅱ. The revolution caused a shortage in the
global oil supply by 7 percent. Oil prices increased again and reached 31 US dollars,
whereas it was steady and smooth with minimal changes between 12 and 14 US dollars
in the 1974–1978 period. In addition, the Iran–Iraq war caused an oil production loss
in both countries, and the shortage worsened by November 1979. The combined
production of both countries was only 1 million barrels per day, which is a decrease
from 6.5 million barrels per day a year before the war. Therefore, worldwide crude oil

© COPYRIG
HT UPM
4
production was 10 percent lower in 1979 with a consequential increase in the crude
oil price to 36 US dollars per barrel (Hamilton, 2011a).
Furthermore, the oil price remained moderate in the 1982–1985 period. The average
price was approximately 29 US dollars per barrel. However, the price collapsed to 14
US dollars in 1986 because of certain factors, such as the first Organization of the
Petroleum Exporting Countries (OPEC) oil supply policy and the increase in oil
production, particularly in Saudi Arabia from 2 million to 5 million barrels per day
with a corresponding low global demand for crude oil. The first Persian Gulf War
(1990–1991) further generated uncertainty in the world oil market. However, the price
ranged between a maximum of 23 US dollars and a minimum of 12 US dollars, with
an average of 18 US dollars per barrel, between 1987 and 1999 (Williams, 2011). The
Asian financial crises in 1998 and the increase in OPEC’s oil production resulted in
oversupply in the world oil market. Oil prices reached a minimum level of 12 US
dollars after 1979 because Southeast Asian countries were considered moderated oil
consumer regions (300.000 barrel per day in 1990–1997). To recover the price, OPEC
reduced its oil production by approximately 3 million barrels per day. This reduction
corresponds to an increase in world energy consumption. In 1999, oil prices reached
25 US dollars. As a result of the Venezuelan unrest and the United States attack on
Iraq in the Second Gulf war in 2003, global oil supply lost approximately 4.3 million
barrels of petroleum (2.1 of Venezuela’s and 2.2 of Iraq’s production), thereby
resulting in an oil price increase (Amin, 2011; Candemir, 2013).
The International Monetary Fund (IMF) (2008) reported that the world’s real gross
product grew at an average annual rate of 4.7 percent in 2004–2007. This growth
corresponded to a rise in world oil consumption during this period. The powerful
demand pressure was the primary factor that triggered the steady increase in oil prices
over these years (Hamilton, 2009). Therefore, a substantial upward shift in the demand
curve with a steady supply curve triggered an increase in the oil price from 55 US
dollars in 2005 to 97 US dollars in 2008. Oil prices collapsed again in 2009 due to the
world financial crisis and witnessed a recovery in 2010 with a steady rise. Oil prices
reached the highest level in 2011 (Figure 1.1).
© COPYRIG
HT UPM
5
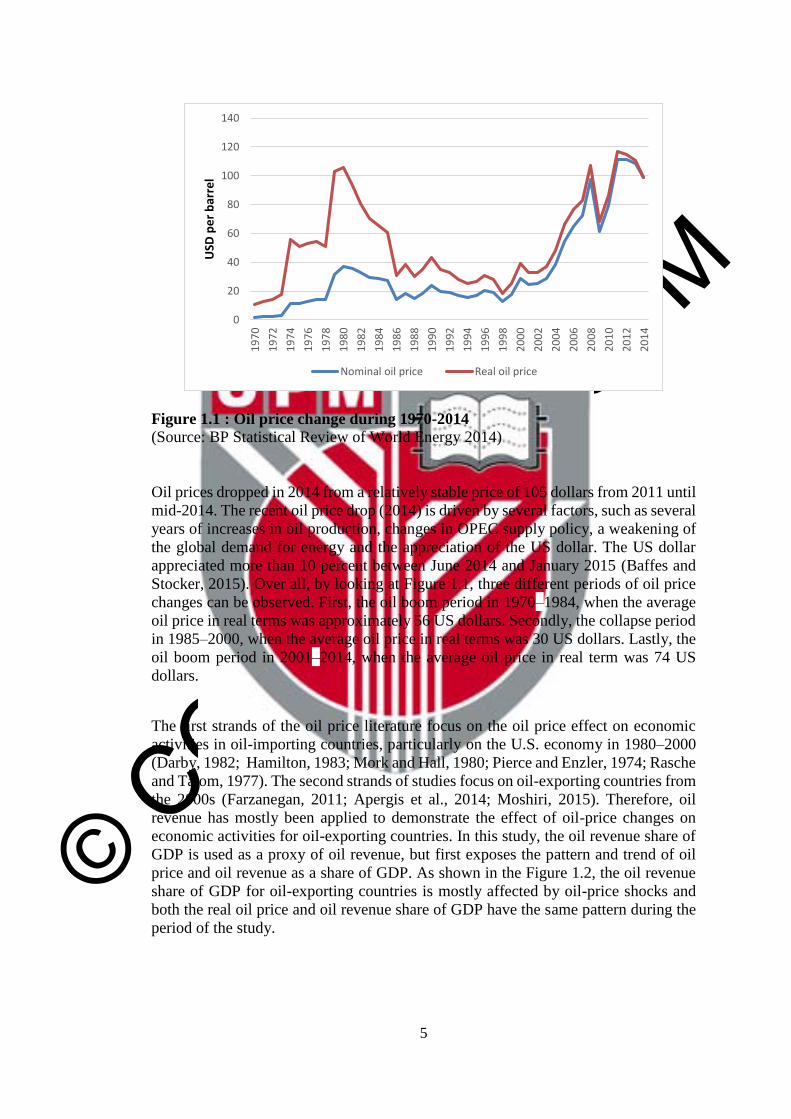
Figure 1.1 : Oil price change during 1970-2014
(Source: BP Statistical Review of World Energy 2014)
Oil prices dropped in 2014 from a relatively stable price of 105 dollars from 2011 until
mid-2014. The recent oil price drop (2014) is driven by several factors, such as several
years of increases in oil production, changes in OPEC supply policy, a weakening of
the global demand for energy and the appreciation of the US dollar. The US dollar
appreciated more than 10 percent between June 2014 and January 2015 (Baffes and
Stocker, 2015). Over all, by looking at Figure 1.1, three different periods of oil price
changes can be observed. First, the oil boom period in 1970–1984, when the average
oil price in real terms was approximately 56 US dollars. Secondly, the collapse period
in 1985–2000, when the average oil price in real terms was 30 US dollars. Lastly, the
oil boom period in 2001–2014, when the average oil price in real term was 74 US
dollars.
The first strands of the oil price literature focus on the oil price effect on economic
activities in oil-importing countries, particularly on the U.S. economy in 1980–2000
(Darby, 1982; Hamilton, 1983; Mork and Hall, 1980; Pierce and Enzler, 1974; Rasche
and Tatom, 1977). The second strands of studies focus on oil-exporting countries from
the 2000s (Farzanegan, 2011; Apergis et al., 2014; Moshiri, 2015). Therefore, oil
revenue has mostly been applied to demonstrate the effect of oil-price changes on
economic activities for oil-exporting countries. In this study, the oil revenue share of
GDP is used as a proxy of oil revenue, but first exposes the pattern and trend of oil
price and oil revenue as a share of GDP. As shown in the Figure 1.2, the oil revenue
share of GDP for oil-exporting countries is mostly affected by oil-price shocks and
both the real oil price and oil revenue share of GDP have the same pattern during the
period of the study.
0
20
40
60
80
100
120
140
19
70
19
72
19
74
19
76
19
78
19
80
19
82
19
84
19
86
19
88
19
90
19
92
19
94
19
96
19
98
20
00
20
02
20
04
20
06
20
08
20
10
20
12
20
14
USD
pe
r b
arre
l
Nominal oil price Real oil price

© COPYRIG
HT UPM
6
5
10
15
20
25
30
35
0
20
40
60
80
100
120
1975 1980 1985 1990 1995 2000 2005 2010
Oil revenue share of GDP (on the left)Real oil price in USD (on the Right )
Figure 1.2 : Oil price and oil revenue share of GDP in oil exporting countries
In addition, the oil revenue share of GDP is used in this study to divide the entire
sample of oil-exporting countries into major and minor oil-exporting countries.
Previous research has used the ratio of natural resource exports’ share of GDP to
classify resource-rich and resource-poor countries (Sachs and Warner, 1995, 2001).
Countries without natural resource exports’ share of GDP are considered resource-
poor countries. By contrast, those with natural resource exports share of GDP are
considered resource-rich countries. In this study, the magnitude of the oil revenue
share of GDP was used to clarify the effects of oil revenue on economic growth and
the agriculture and tourism sectors. Therefore, the study sample was divided into two
groups: major oil-exporting and minor oil-exporting countries. These sample countries
were grouped based on the magnitude of oil revenue as a percentage of GDP for
individual countries. Countries with an oil revenue share of GDP as a percentage
during the study period that is below 10 percent are considered minor oil-exporting
countries, whereas those with a share of above 10 percent are considered major oil-
exporting countries.
Three different economic perspectives of oil-exporting countries are explained in this
subsection. First, oil revenue and economic growth are presented. Secondly, the oil
revenue and agriculture perspective are provided. Finally, the relationship between oil
revenue and the tourism sector is discussed.
________________________ For the relationship of oil price and oil revenue share of GDP for major, minor oil-exporting countries
and at the individual level for each country, see Appendix A.

© COPYRIG
HT UPM
7
1.2.2 Oil Revenue and Economic Growth in Oil-Exporting Countries
Oil and gas are crucial and tradable goods in the current global economy. Economic
activities heavily depend on oil to continue production, particularly in industrially-
developed economies. Oil has been crucial to the world economy since its early
discovery in the 1800s. The invention of the internal combustion engine is the major
impetus for the rise in the importance of oil. Such importance has increased to the
extent that in a world without oil, all major distribution systems that allow economic
transactions beyond a local basis can fail. The world economy can also collapse
(Suleiman, 2013). The growth of renewable energy sources (wind, solar and
geothermal) as alternatives to oil is still in its infancy. The share of sustainable energy
is expected to rise to 4.3 percent of the total supply of energy by 2040, whereas the
share of oil and gas are expected to increase supply to 53 percent of the world energy
during the same period (OPEC, 2015). According to British Petroleum (2015), the
total global consumption of oil is 92 million barrels per day. Energy-intensive regions,
such as North America, Europe, Eurasia and the Asian Pacific, consume
approximately 72.4 million barrels a day, which qualifies them as major oil consumers
of the world. Consequently, rising oil consumption and demand increase the global oil
price based on demand theory. In addition, high oil revenue influences the economic
activities and economic growth of oil-exporting countries.
The economic growth of oil-exporting countries was not sustainable over the past 45
years. Major oil-exporting countries experienced three major periods of economic
growth since the first oil boom in the 1970s. In the first episode (1970–1984), income
per capita considerably grew at an average annual rate of 2.17 percent due to the
increase in the global oil price. However, the dramatic collapse of the world oil price
in the second period of the mid-1980s caused a substantial decline in GDP per capita,
which even reached a negative value (-0.30). In the third period, the GDP per capita
of major oil-exporting economies grew at an average rate of 1.37 in the 2001–2014
period after oil prices recovered during the 2000s.
Similarly, given the slow recovery in the preceding years, the GDP per capita growth
rate of major oil-exporting countries remained considerably lower than the growth
performance achieved in the first oil boom period (1970–1984). Moreover, the average
growth was close to 2.17 percent and only behind that of non-oil-exporting countries
in East Asia, which grew by more than 4 percent (Elbadawi, 2005). Unlike East Asia,
which accomplished a remarkably quick recovery from the 1998 financial crisis,
growth was not sustained in major oil-exporting countries. However, minor oil-
exporting countries have gained positive and sustained economic growth. Moreover,
the GDP per capita growth of minor oil-exporting countries in the first, second and
third episode was about 2.52, 1.66 and 2.59 percent, respectively. Additionally,
overall, the GDP per capita growth of minor oil-exporting countries remained stable
(2.47 percent) and was approximately twice higher than that of the major oil-exporting
countries (1.64 percent) in 1970–2014.

© COPYRIG
HT UPM
8
In oil-exporting countries, economic growth is affected by oil price changes based on
the level of oil dependency. Notably, the magnitude of the negative impact of oil price
decreases on oil-exporting countries varies from country to country. These countries
heavily depend on oil as the mainstay of their economies. Table 1.1 indicates that most
major oil-exporting countries experienced a negative economic growth rate during the
collapsing period of oil price (1985–2000), whereas minor oil-exporting countries saw
positive economic growth in the same period. Additionally, Table 1.1 shows that oil
price decreases cause less severe economic growth in minor oil-exporting countries
than in major oil-exporting countries. That is, minor oil-exporting economies are more
successful than major oil-exporting economies in managing their oil revenue. The
former also exhibits positive growth1.
Table 1.1 : Economic growth (GDP per Capita Growth (Annual %) for oil
exporting countries 1970-2014
Major oil exporting countries 1970-1984 1985-2000 2001-2014 1970-2014
Algeria 3.14 -0.57 2.06 1.47
Congo 5.25 -1.89 1.86 1.55
Ecuador 2.86 0.12 2.85 1.64
Gabon 5.39 -1.14 0.36 2.08
Iran -0.47 0.08 2.45 1.96
Brunei 0.41 -1.29 -0.67 -0.68
Nigeria 0.82 -0.42 5.25 1.55
Trinidad and Tobago 1.07 1.32 4.08 2.32
Saudi 1.67 -0.80 2.50 1.07
Venezuela - 0.77 -0.04 1.34 0.31
Oman 4.02 1.89 -1.10 4.75
United Arab Emirates -1.42 -1.75 -3.18 -2.19
Average 2.17 -0.30 1.37 1.64
Minor oil exporting countries
Argentina 0.33 0.99 1.91 1.31
Egypt 4.22 2.15 2.08 2.60
Indonesia 4.85 3.45 3.99 3.57
Malaysia 4.86 3.82 3.05 3.84
Mexico 2.59 1.03 0.70 1.79
Peru -0.001 0.21 4.15 1.57
Tunisia 3.96 2.30 2.55 2.84
Colombia 2.31 1.59 3.10 2.25
Morocco 2.42 2.22 3.31 2.62
Bolivia -0.09 0.95 2.61 1.12
Brazil 3.62 1.07 2.20 2.28
Cameroon 4.31 -2.05 1.06 1.03
Chile 0.19 4.62 3.21 2.70
Average 2.52 1.68 2.59 2.47
(Source: Authors ‘calculation based on data from World Bank World Development Indicators 2016
1 Some major oil economies, as observed in the last oil price shocks at the end of 2014, experienced
an adverse effect of oil price decrease on economic activities in Libya and Iraq. This effect is more
severe than that in the United Arab Emirates due to the level of oil dependency (Arezki and
Blanchard, 2014; Hou, Keane, Kennan and Willem, 2015).

© COPYRIG
HT UPM
9
With regard to oil revenue and economic growth, Figure 1.3, 1.4 and 1.5 illustrate the
relationship between oil revenue, the real effective exchange rate (REER), and the
interaction term between oil revenue and the real effective exchange rate with GDP
per capita growth in full sample, major and minor oil-exporting countries respectively.
When pooled together, the full sample of 25 oil-exporting countries encompasses
major and minor oil-exporting economies. Figure 1.3 shows the negative correlation
between oil revenue and economic growth. Given their utmost dependence on natural
resources, oil-exporting countries, particularly major oil-exporting economies, are
mostly affected by the fluctuation of the world oil price and oil revenue.
In addition, figure 1.4 illustrates the negative trend between oil revenue and economic
growth in major oil-exporting countries. During the oil boom years, economic growth
rates were remarkably high. However, a decline in economic growth occurred after
the boom years. That is, most of these countries have not yet reached sustainable
economic growth due to the nature of rentier economies and oil vulnerabilities (Noland
and Pack, 2007). However, the partial effect of oil revenue through REER on
economic growth is positive for entire sample, as well as for major oil-exporting
economies. Based on the Dutch disease theory and the real exchange rate channel, if
the relationship between oil revenue and GDP per capita growth is negative, and the
interaction term between oil revenue and REER is positive, that means the existence
of Dutch disease for these countries. These preliminary data support the Dutch disease
theory, which states that an appreciation of the exchange rate considers the primary
channel in which oil revenue adversely affects economic growth in oil-exporting
countries.
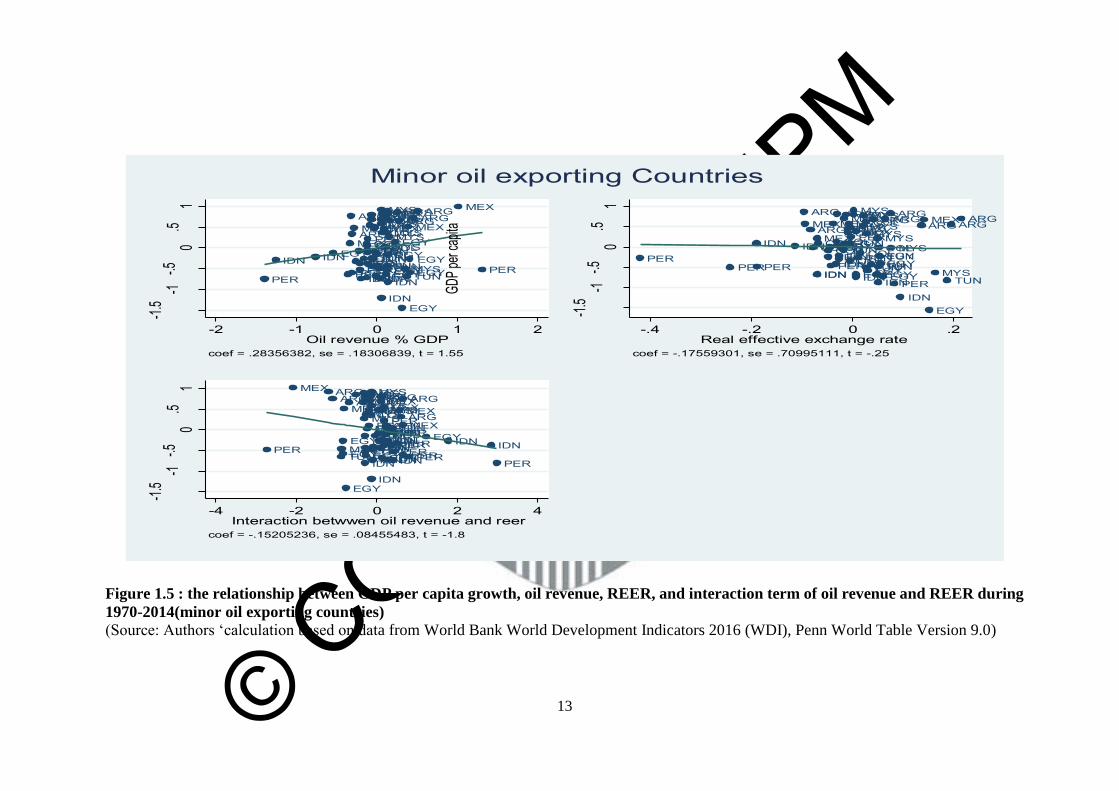
The situation differs for minor oil-exporting economies with low oil revenue share as
a percentage of GDP, (e.g. Indonesia, Malaysia, Egypt, Tunisia, Mexico, Colombia,
Argentina and Peru). Figure 1.5 shows the positive relationship between oil revenue
and GDP per capita growth for these countries. However, the partial effect of REER
on economic growth is negative for minor oil-exporting countries. These preliminary
data do not support the Dutch disease theory for minor oil-exporting countries because
the direction of the partial effect of oil revenue based on the interaction term will be
downward. One possible explanation for the aforementioned phenomenon is that
minor oil-exporting economies may better than major oil-exporting economies in
managing their oil revenue to drive their economic growth.
The growth of the oil sector as a contributor to national income leads to a decrease in
the role of non-oil sectors (such as agriculture) in most oil-exporting countries. Oil
revenues can largely contribute to economic growth in oil-exporting developing
countries because they provide much-needed financial resources for these countries,
e.g. high income per capita of oil-wealthy countries, such as the members of the Gulf
Cooperation Council (GCC). However, high oil revenues also encourage economic
conditions that stifle growth, such as the appreciation of exchange rates, inflation and
rent-seeking. This effect of oil windfalls is clearly reflected in the empirical literature.
Some studies on single or multiple oil-exporting countries show that oil has been a
‘curse’ (Ayadi, 2005; Berument, Basak,and Dogan , 2010; Eltony and Al-Awadi,

© COPYRIG
HT UPM
10
2001; Sachs and Warner, 2001). By contrast, other studies, such as Esfahani,
Mohaddes, and Pesaran (2013, 2014), suggest that oil has contributed positively to the
long-running economic performance of oil-exporting countries.

© COPYRIG
HT UPM
11
Figure 1.3 : The relationship between GDP per Capita, oil Revenue, REER, and interaction term of REER and oil rent during 970-2014
( full sample of oil exporting countries)
(Source: Authors ‘calculation based on data from World Bank World Development Indicators 2016 (WDI), Penn World Table Version 9.0)
SAU SAU
PERNGAPER
COG
OMNOMN
PER
IRN
PER
DZANGACOG
DZA
SAU
IRNCOLMEXARG
NGAIDN
COLMEX
IDN
ARG
COG
COLMEXTUNMEX
IDN
IRNARGMEXPERMEXCOL
NGA
PERPERCOLTTOMEX
TUNMYS
SAU
ECUIDNECU
MEXMYSTTO
PER
MYSTTOMYS
IDNEGY
IRNCOLEGY
PER
VEN
COL
COG
ECU
TTO
TTOMYS
EGY
MEXTUNIRNCOLEGYECU
OMN
TTO
TUNECUDZAIRN
IDNNGA
VEN
DZA
IDN
VENSAUSAUTTO
TUN
EGY
ARGOMNOMN
ECUDZA
VENVEN
DZAEGYTUN
IRN
IDN
SAU
MYSTUNCOLEGYNGAECU
VEN
MYS
OMN
ECUTTOVENARGVEN
ECU
OMN
DZAGABIRNARG
NGA
GAB
MYSEGY
OMN
DZATUN
SAUARGGABVEN
IDN
GABGAB
EGY
MYS
NGA
COG
TTOSAUGABARG
COGTUN
OMNARGDZAGAB
COG
GABGAB
COG
NGA
COG
IRN
-3-2
-10
12
GDP p
er cap
ita
-6 -4 -2 0 2 4Oil revenue % GDP
coef = -.10148645, se = .05621263, t = -1.81
PERPERPERPER
SAUSAU
OMN
COG
COLMEXOMN
COL
IDN
MEXARG
IDN
ARG
NGA
COLTTOTTOTUNMEX
IDN
MEXSAU
MEXMEXCOLECU
ARGTTOMEXIRNMYSMYS
ECUPERTUNCOLTTOMEX
PERPER
VENMEX
IDN
MYSVEN
ECU
TTO
EGY
VEN
PERMYS
IDN
GABTTO
NGACOGCOG
EGYNGA
ECUCOLECUCOLDZANGA
VEN
DZA
GABPER
OMNSAU
MYS
VENSAU
DZAECU
VENOMNSAUVENOMNTTO
EGYEGY
VENOMN
COL
SAU
IRNTUN
OMN
NGADZAIRN
OMN
NGATUN
GABIRNDZA
VEN
NGA
SAUGABTTO
COG
GAB
TTO
TUN
ARGIRN
EGY
COG
IDNTUN
SAU
MYSCOL
GAB
DZAECUEGY
EGY
OMNGABIRNGABARGDZATUN
GAB
COG
NGAMYSECUECU
COG
ARGIRN
IDNNGA
MYS
COG
IDN
ARG
TUN
EGY
MYSEGY
IDN
IRNARG
DZA
ARG
TUNCOG
DZA IRN
-3-2
-10
12
GDP p
er cap
ita
-.4 -.2 0 .2 .4 .6Real effective exchange rate
coef = -1.9920293, se = .61067976, t = -3.26
IRN
NGA
COGCOG
GABGABARGDZA
TUN
COG
COG
GABARGOMN
MYS
EGY
GABTTO
NGA
SAU
IDN
ARG
COG
VENGABGABGAB
TUNDZAMYSEGY
SAUARGOMNGAB
NGA
ECU
ARGGABIRNDZAECUECUMYSCOLEGY
OMNVEN
TUNNGA
VEN
MYS
IDN
TTO
EGY
VENARGIRN
TUNTUN
OMN
DZA
TTO
EGY
VENVEN
DZAECU
OMNSAU
IDNTUN
OMN
NGADZA
IDN
DZA
VEN
IRNECU
SAUVEN
TUNCOLEGYECUTTO
SAU
MYS
EGY
PERMEXCOL
TTO
TTOECUIRNCOL
OMN
EGYIDN
VEN
MYSPER
COG
MYSIRNTTO
EGY
IDN
MEXMYSTTO
ECUECUMYSTUN
MEXCOLPERPERPERTTOCOLMEXARGMEXSAU
IDN
MEXMEX
NGA
TUN
IRN
COLARG
IDN
MEXCOL
ARG
IDN
COG
MEXCOL
NGA
IRNDZA
SAU
COGNGADZA
PER
IRN
PER
OMN
PER
COG
OMN
PERNGA
SAU SAU
-3-2
-10
12
GDP p
er cap
ita
-5 0 5 10 15Intreation between oil revenue and REER
coef = .05149673, se = .02685292, t = 1.92
Full Sample of oil Exporting Countries

© COPYRIG
HT UPM
12
Figure 1.4 : The relationship between GDP per capita growth, oil revenue, REER, and interaction term of REER and oil revenue during
197-2014 (Major oil exporting countries)
(Source: Authors ‘calculation based on data from World Bank World Development Indicators 2016 (WDI), Penn World Table Version 9.0)
SAUSAU
COG
NGA
OMNOMN
TTOTTOECU
TTO
ECU
IRNTTOECU
TTOSAU
VEN
NGAECUTTOVEN
NGA
DZAECU
COG
DZA
COG
DZAECU
VEN
NGANGADZAGAB
TTOSAU
ECU
VENIRNIRN
VENIRNVENOMNSAUOMNVEN
COG
DZAGAB
DZA
VENTTOOMN
DZA
VENSAU
IRN
OMN
IRNIRN
SAUOMN
NGAECUNGAECU
OMNGAB
NGA
GABTTO
SAU
GABGABIRN
SAU
COG
GABGAB
DZA
OMNGAB
COG
COG
COG
NGA
DZA
COG
IRN
-3-2
-10
12
GDP p
er Ca
pita
-4 -2 0 2 4 6Oil revenue % GDP
coef = -.23159578, se = .08506416, t = -2.72
SAUSAU
TTOTTOECU
TTO
ECU
OMN
TTOVEN
COG
ECU
VENTTOVENOMN
TTOGABECUECUECUDZADZA
GABVENVEN
DZA
SAU
NGA
DZAIRN
NGA
VENTTOTTOOMNVEN
IRN
SAU
NGA
VEN
ECU
OMN
NGANGA
OMNGAB
NGACOG
OMN
COG
OMNSAU
IRN
SAUSAUTTOIRN
VENOMNGAB
DZANGA
GAB
SAU
IRN
ECUIRNDZA
NGA
ECU
COG
GABGABSAUGABGAB
COG
OMN
COG
DZA
NGA
COG
IRN
COG
IRNDZA
COG
DZA IRN
-3-2
-10
12
GDP p
er Ca
pita
-.2 0 .2 .4 .6Real effective exchange rate
coef = -3.7674362, se = 1.1386787, t = -3.31
IRN DZA
COG
COGNGA
COGCOG
DZA
GABOMNGABIRNGAB
COG
SAUGABGABTTO
SAU
GAB
NGA
GAB
ECUECUNGA
OMN
IRN
NGA
IRN
OMN
IRNDZA
SAUOMNVEN
DZA
TTOVENSAUGABOMN
ECU
DZA
VENVENOMNSAUOMNVEN
IRNIRN
COG
TTO
IRNVEN
NGA
GABDZA
SAUVEN
DZAECUDZA
NGACOG
ECUECU
VENTTO
COG
DZA
NGA
VENTTO
ECUNGATTO
SAU
ECU
TTO
ECUTTOIRNTTO
OMN
NGA
COG
OMN
SAUSAU
-3-2
-10
12
GDP p
er Ca
pita
-10 -5 0 5 10interation between oil revenue and REER
coef = .10638503, se = .03989045, t = 2.67
Major oil exporting Countries
© COPYRIG
HT UPM
13
Figure 1.5 : the relationship between GDP per capita growth, oil revenue, REER, and interaction term of oil revenue and REER during
1970-2014(minor oil exporting countries)
(Source: Authors ‘calculation based on data from World Bank World Development Indicators 2016 (WDI), Penn World Table Version 9.0)
PER
IDN IDNEGY
PER
MEX
ARG
ARG
PER
MEX
PERPER
PERPER
IDN
IDNCOLTUNCOL
IDN
PERTUNCOLCOLCOL
MEXARGMEX
TUNIDNTUN
MYSMYS
TUN
EGY
COLTUNTUNIDN
ARGMYSMYS
IDN
MEX
COL
COL
MEX
MYS
ARG
EGY
MYS
TUNEGY
EGY
IDN
ARGMEX
MYS
COL
EGY
MYSARG
EGY
MYSTUN
MEX
EGYEGY
ARGARG MEX
PER
-1.5
-1-.5
0.5
1
GDP p
er cap
ita
-2 -1 0 1 2Oil revenue % GDP
coef = .28356382, se = .18306839, t = 1.55
PERPER
IDN
PER
IDN
ARGMEXARG
COLMEX
IDNIDN
COLCOLPERPERTUN
PER
MEX
IDN
COLEGY
ARG
IDNPERTUN
MEX
EGY
MEX
COLMEXMYS
COL
TUN
MYSPER
MEXMYS
MEX
EGYIDN
TUNCOL
MYSMYSCOLMYS
TUNEGYTUN
ARG
EGY
MYS
IDN
TUN
COLEGYTUNEGYEGY
ARGARG
MYS
PERIDN
ARGMEX
EGY
MYSTUN
ARGARG
-1.5
-1-.5
0.5
1
GDP p
er cap
ita
-.4 -.2 0 .2Real effective exchange rate
coef = -.17559301, se = .70995111, t = -.25
PER
MEX ARGARG
TUNMYSEGYEGY
MEX
EGY
ARGMYS
COLARG
MYS
IDN
MEX
EGY
ARG
TUNEGY
MYS
EGY
MYSCOLEGY
MEXARGCOL
MEX
IDN
MYSMYS
TUNIDNTUNCOL
MYS
TUNTUNIDN
MEXARG
TUN
EGY
MYSMEX
COL
PERCOLTUNCOLCOL
IDN
COLIDNPER
TUN
IDNPER
PERPER
MEXARG
ARG
MEX
PERPER
EGYIDN IDN
PER
-1.5
-1-.5
0.5
1
GDP p
er cap
ita
-4 -2 0 2 4Interaction betwwen oil revenue and reer
coef = -.15205236, se = .08455483, t = -1.8
Minor oil exporting Countries
© COPYRIG
HT UPM
14
Oil-exporting economies who are beneficiaries of oil windfalls suffer from major
economic issues, such as unstable oil prices in the global oil market, which has an
effect on government spending and fiscal policy of these countries. The beneficiaries
of oil windfalls in resource-rich economies depend on several factors, such as the
effective management of the economy in general and oil income in particular (Collier,
Ploeg, Spence and Venables. 2010). Most developing major oil-exporting economies
have failed to maintain their oil revenue to establish sustainable economic growth.
However, Botswana, Malaysia and Indonesia, as developing minor oil-exporting
countries, have succeeded in managing their oil revenue to achieve sustainable
economic growth (Ghura, 2012; Venables, 2016).
1.2.3 Oil Revenue and Agriculture Sector in Oil-Exporting Countries
The agriculture sector is considered one of the important sectors that pushes economic
growth in developing oil-exporting countries, particularly in Algeria, Tunisia, Iran,
Egypt, Nigeria, Indonesia and Malaysia. With regard to the input–output linkages
amongst different economic sectors, agriculture provides the primary support for
various economic activities in developing oil-exporting countries, such as
manufacturing, marketing, trade and service activities. This sector has also contributed
to employment; more specifically, it accounted for an average of approximately 19
percent of total employment in major and minor oil-exporting countries in 2000–2014.
In addition, agriculture satisfies the food consumption needs of the population,
particularly in rural areas.
Specific reasons explain the significance of the agriculture sector for developing
economies in general and developing oil-exporting economies in particular. First, in
contrast to renewable resources, oil is a depleting resource that can eventually
disappear. Thus, oil-exporting countries must set long-term strategies to diversify their
economies to avoid total oil dependency. Some countries in GCC concentrate on
export diversification by developing service industries, such banking and tourism
(Morakabati, Beavis and Fletcher, 2014). Other oil-exporting countries, such as
Algeria, Iran, Malaysia, Indonesia, Egypt, Tunisia and Nigeria, also focus on the
tourism sector. In addition, they can improve the agriculture sector because they have
sufficient agricultural potential, such as land, water and labour force. Gollin, Parente
and Rogerson (2002) empirically confirmed that improving agricultural productivity
can accelerate and push industrialization and enhance national income per capita.
Diao, Hazell and Thurlow (2010) referred to the victory of Asian green revolution and
concluded that agriculture is still the key sector for economic development in Africa.
Secondly, oil price instability in the world market dramatically affects oil revenue,
national income, the government budget, government spending and all
macroeconomic activities of oil-exporting economies. Thus, improving non-oil
sectors, such as agriculture and tourism, can mitigate the severity of oil revenue
fluctuation in their economies. Finally, most developing major oil-exporting countries
face the challenge of high population growth and high unemployment rates. However,
the oil and gas sectors (which contain and cover most economic activities in these

© COPYRIG
HT UPM
15
countries) only has a small contribution towards unemployment because the oil sector
is a technological and capital-intensive sector. Thus, its impact on employment and
other macroeconomic structures is strongly marginal (Mansfeld and Winckler, 2007).
In addition, non-oil sectors, such as agriculture and tourism, will have a significant
effect in reducing in the unemployment rate. Most major oil-exporting countries suffer
from a high long-term unemployment rate ranging from 10 percent to 40 percent. Such
a rate mostly involves the young and educated population. Table 1.2 shows the
unemployment rate among educated youth for major and minor oil-exporting
countries as an average during the 1990-2014 period. As observed, major oil-exporting
countries witness a higher unemployment rate than minor oil-exporting countries.
Youth unemployment rates as high as 40.03, 38.33 and 29 percent are witnessed in
Congo, Gabon, and Saudi Arabia, respectively. Even though Tunisia is a minor oil-
exporting country, it suffers from the high unemployment rate.
Therefore, one of the greatest challenges of these countries is job creation (O’Sullivan,
Rey and Mendez, 2011). The agriculture sector in these countries has remained the
major employer of labour. For example, the agriculture sector in oil-exporting
countries absorbed nearly 20 percent of total employment from 2000 to 2014, which
is equal to the worldwide level of 19 percent. Tables 1.3 and 1.4 show the sectoral
distribution of employment as a percentage of total employment and the sectoral
value-added share of GDP in oil-exporting countries. Even though the agriculture
value-added share of GDP is small in most of major oil-exporting countries, the
agriculture sector employs a sizable and moderate ratio of total employment in these
countries.

© COPYRIG
HT UPM
16
Table 1.2 : Unemployment rate (educated youth) in the oil exporting countries
Major oil exporting countries 1990-2014 OECD South
Asia
North
America
MENA
Algeria 27
Congo 40.03
Ecuador 11.08
Gabon 38.33
Iran 23.25
Brunei 25.40
Nigeria 10
TTO 13.16
Saudi 29.58
Venezuela 17.13
Oman NA
Unite Arab Emiratis 10.06
Average 22.27 14.51 8.92 12.93 22.59
Minor oil exporting countries
Argentina 23.80
Egypt 27.47
Indonesia 20.14
Malaysia NA
Mexico 7.41
Peru 12.75
Tunisia 31.16
Colombia 20.48
Morocco 20.22
Bolivia 2.61
Brazil 7.16
Cameroon 5.75
Chile 20
Average 16.57 14.51 8.92 12.93 22.59
(Source: Authors ‘calculation based on data from World Bank World Development Indicators)
For example, the average of agriculture value-added share of GDP for Algeria during
1990-2000 and 2001-2014 are 9.75 and 8.74 percent, respectively. However,
agriculture’s contribution to employment is about 22.48 and 18.37 percent—about two
times greater than its share of GDP in the same periods. The industrial sector share of
GDP is about 50 and 51, while its contribution to employment is 25 and 34 percent in
the same periods. The role of the agriculture sector in employment is higher in the
case of Congo, Gabon, Iran, Egypt, and Indonesia. For the rest of major and minor oil-
exporting countries, Tables 1.3 and 1.4 compare the role of agriculture in absorbing
unemployment with other sectors.

© COPYRIG
HT UPM
17
Table 1.3 : Value added share of GDP by Sectors
Sectors
Agriculture sector Industry sector Service sector
Country 1990-2000 2001-2014 1990-2000 2001-2014 1990-2000 2001-2014
Major oil exporting countries
Algeria 9.75 8.74 49.86 51.24 35.04 35.86
Congo 10.04 4.65 47.82 70.94 42.13 24.40
Ecuador 19.91 9.81 28.91 33.55 47.18 51.18
Gabon 7.60 4.65 48.94 54.75 43.45 33.30
Iran 10.98 7.38 37.7 45.2 51.74 49.31
Kuwait 0.40 0.36 NA 71.44 NA 42.17
Nigeria 24.16 25.62 34.15 25.78 40.68 47.68
Saudi 5.67 3.14 49.38 59.04 44.94 37.8
Venezuela 4.77 4.45 46.35 47.10 41.79 41.66
UAE 1.76 1.19 47.87 53.73 50.36 45.06
Brunei 1.12 0.85 57.23 68.65 41.63 30.50
Oman 2.55 1.55 49.17 61.6 46.33 36.81
Minor oil exporting countries
Argentina 5.60 7.21 28.4 26.94 61.39 52.34
Egypt 16.13 13.40 29.93 35.65 47.78 47.25
Indonesia 18.10 14.20 41.91 45.34 39.16 40.06
Malaysia 12.73 9.35 43.06 43.02 47.07 47.13
Mexico 4.88 3.2 31.39 32.89 58.44 59.78
Peru 8.15 7.03 28.18 33.88 54.19 50.48
Tunisia 13.03 8.81 27.94 27.79 46.79 55.25
Colombia 14.09 6.93 28.85 30.69 54.22 53.74
Morocco 15.03 12.72 26.33 25.82 46.80 51.60
Bolivia 14.36 11.21 28.17 27.89 49 44.9
Cameroon 19.38 14.42 27.53 27.65 46.76 50.78
Brazil 5.83 4.71 27.66 22.75 53.38 57.71
Chile 7 3.88 34.74 34.42 50.38 53.15
(Source: World Bank World Development Indicators)

© COPYRIG
HT UPM
18
Table 1.4 : Sectorial Distribution of Employment (%total Employment)
Sectors
Agriculture sector Industry sector Service sector
1990-2000 2001-2014 1990-2000 2001-2014 1990-2000 2001-2014
Major oil exporting countries
Algeria 22.48 18.37 25.67 34.31 51.90 47.56
Congo 40 39.82 23.01 23.56 36.75 36.75
Ecuador 6.98 29.52 23.09 18.54 69.62 51.89
Gabon 43.5 24.2 9.6 11.8 46.9 64
Iran 23 21.41 30 32 44.3 46.52
Kuwait 1.6 2.13 24.19 26 73.59 72.17
Nigeria 46.9 46.55 7.5 10 43.7 42.3
Saudi 7 4.74 23.44 21.63 71.03 73.78
Venezuela 12.2 9.12 24.57 21.72 63.02 68.93
UAE 7.31 3.24 33.47 32.38 59.34 64.56
Brunei 1.75 0.90 23.93 19.60 74.34 79.52
Oman 8.19 6.10 8.41 26 83.56 67.91
Minor oil exporting countries
Argentina 0.59 1.88 28 23.26 70.9 75.07
Egypt 34.21 29.65 22.11 22.44 43.5 47.91
Indonesia 48.63 40.61 14.51 19.15 34.85 40.2
Malaysia 23.49 14.07 29.12 29.39 47.33 56.82
Mexico 23.55 14.97 23.8 25.11 52.21 59.44
Peru 2.8 9.5 23.52 20.76 73.62 73
Tunisia 25 16.76 33.6 32.83 39.1 49.73
Colombia 1.19 17.67 29.54 20.1 69.14 60.98
Morocco 41.75 41.92 22.64 20.54 35.41 37.67
Bolivia 2 1.23 20.23 19.79 40.62 46.61
Cameroon 68.45 65.08 9.14 9.26 22.56 25.84
Brazil 25.88 17.45 20.26 21.84 54.29 60.97
Chile 16.03 12.03 25.83 23.49 58.29 64.61
(Source: World Bank World Development Indicators)
Most oil-exporting countries have high potential in agriculture for different types of
agricultural products and have a long history of farming. Although most of these
economies heavily depend on crude oil export as their primary source of foreign
exchange, the value-added share of agriculture to GDP of minor oil-exporting
economies (14.45 percent) is approximately twice more than that of major oil-
exporting countries (8.3 percent), on average for the 1970–2014 period. Furthermore,
oil-exporting economies lagged behind non-oil economies with regard to the
agricultural share of GDP from 1970 to 2014. For major oil-exporting economies, one
possible explanation for neglecting the agriculture sector is that high oil production
shapes total exports along with government spending.
Heterogeneity exists amongst oil-exporting countries in terms of the value-added
agricultural share of GDP. Indonesia, Malaysia, Egypt, Ecuador and Tunisia recorded
their highest level of agriculture in GDP (34, 29, 28, 23 and 17 percent, respectively)
from 1970 to 1980. Nigeria, Algeria and Saudi Arabia reached their highest level (26,
10 and 5 percent, respectively) in the 1990s. The agriculture contribution to GDP of
other oil-exporting states in GCC, such as Kuwait, Qatar and Oman, is marginal as
shown in Figure 1.6.

© COPYRIG
HT UPM
19
Figure 1.6 : Agriculture value-added (%GDP) in the oil exporting countries
(Source: World Bank World Development Indicators 2016.)
0
5
10
15
20
25
30
35
40
1970-1980 1980-1990 1990-2000 2001-2014

© COPYRIG
HT UPM
20
The policy tools—such as fiscal policy, exchange rates, pricing, and the trade
regime—that are necessary for managing oil revenue and government spending to
optimize resource allocation during and after oil boom periods differ among oil-
exporting countries. Pinto (1987) provided substantial evidence of a contrast in policy
and performance between Nigeria and Indonesia during and after the first oil boom.
In contrast to Indonesia, Nigeria suffered a serious economic problem that included
severe contraction in its agricultural output and exports for decades after the first oil
boom. For example, during the oil boom in the 1970–1982 period, the annual
production of Nigeria’s central crops—namely, cocoa, rubber, cotton and
groundnuts—decreased by 43, 29, 65 and 64 percent, respectively. By contrast, the
share of agriculture imports in the total imports increased from 3 percent to 7 percent
in 1960–1980. In the case of Indonesia, a good policy succeeded in avoiding severe
interruption in agricultural output. Indonesia’s rice production grew approximately 5
percent per annum from 1968 to 1984.
Figure 1.7, 1.8 and 1.9 illustrate a scatterplot between oil revenue and real effective
exchange rate and their interaction term with value-added agriculture as a percentage
of GDP in the full sample , major and minor oil exporting countries respectively. The
relationship between oil revenue and agriculture is positive for the entire sample of
oil-exporting countries, whereas such a relationship is negative for major and minor
oil-exporting countries. Nevertheless, the relationship between the real exchange rate
and agricultural share of GDP is positive for all cases. The partial effect of oil revenue
through the REER on agricultural value added is only positive for minor oil-exporting
countries. Based on the Dutch disease theory and the hypotheses of this study, if the
relationship between oil revenue and agriculture value added is negative, and the
interaction term between oil revenue and REER is positive, that means that Dutch
disease exists for these countries. Otherwise, they would escape from Dutch disease.
Overall, these preliminary data appear to support the Dutch disease theory for major
and minor oil-exporting countries.

© COPYRIG
HT UPM
21
Figure 1.7 : The relationship between agriculture % GDP, oil revenue, REER and interaction term of REER and oil revenue during
1970-2014( full sample) (Source: Authors ‘calculation based on data from World Bank World Development Indicators 2016)
SAU SAU
PERNGAPER
COGOMNOMNPER
IRN
PER
DZA
NGACOG
SAUKWTDZAIRN
COL
MEX
NGA
ARG
IDN
COLMEXCOGIDN
ARG
COL
TUNMEXMEX
IDNIRNARGMEX
NGA
MEXCOLPERPERPERKWTCOL
MEXTUNMYSSAU
ECUECU
MYSIDN
MEX
MYSPERMYS
EGY
IRN
IDNCOL
EGYCOG
VENCOLPER
ECUMEXIRN
EGYMYS
COL
TUNOMNEGY
ECU
ECUDZATUNVENIRN
NGA
SAUVENSAUDZA
IDNIDN
OMNOMN
ECUVENVEN
EGY
TUNDZASAUARGDZAEGYTUN
IDNMYS
TUNIRNVEN
COL
OMN
EGY
NGAECU
VEN
MYSECU
VENOMNARG
DZA
ECUGABIRN
NGA
ARG
GAB
OMNKWTKWT
MYS
EGY
KWTSAUDZAKWT
TUNKWTKWT
GABVEN
ARG
GABGAB
IDN
COG
EGY
NGA
MYS
SAUGABKWTARG
OMN
COGTUNGAB
ARGDZA
COGGAB
GABCOG
NGA
COG
IRN
-100
1020
30
Agric
ulture
% G
DP
-6 -4 -2 0 2 4Oil revenue %GDP
coef = .32097345, se = .40592127, t = .79
PERPERPERPER
SAUSAUOMN
COL
MEXCOGCOL
IDN
MEXOMNARG
IDN
ARG
COL
TUN
NGA
MEXKWTIDN
MEX
MEXMEXCOL
ECU
SAUARGMEXMYSMYS
ECU
PERTUNCOLMEXIRNPERPERVENKWT
MEX
IDNMYSVENVENECUEGY
PERMYS
GABIDN
NGA
EGY
COLECUECUCOG
COL
COG
NGA
DZAGAB
VENDZA
PER
MYS
OMN
NGA
SAUVEN
ECU
DZASAUVENVENOMNOMNSAUEGYVEN
COLEGY
OMNIRNTUNOMN
NGA
SAUKWT
DZA
KWTOMN
NGA
GABTUNIRN
NGA
IRNKWTVENSAUKWTKWT
GABDZAKWTGABCOG
TUNARG
IRNEGYCOG
IDN
TUNSAU
MYSCOLGAB
ECU
DZAEGYKWT
EGY
OMN
GABGABIRNARG
GABTUNCOG
NGA
DZA
MYSECUECUCOG
ARGIRN
IDN
NGA
MYS
COG
IDN
ARG
TUN
EGYMYS
EGY
IDN
IRNARGDZA
ARG
TUNCOG
DZAIRN
-100
1020
30
Agric
ulture
% G
DP
-.4 -.2 0 .2 .4 .6Real effective exchange rate
coef = 13.194815, se = 4.4830494, t = 2.94
IRN
NGA
COGCOGGAB
ARGDZA
TUNGABCOG
ARG
COGGAB
OMN
MYSEGY
KWTGAB
IDNNGA
ARG
SAUCOGVENGABGABGABTUN
KWTDZA
MYS
EGY
KWTKWTARGKWTKWTSAUKWTGAB
OMN
ECU
NGA
ARG
GABIRNECUDZA
ECUMYSCOLEGYTUN
NGAMYSIDN
OMNVENEGYIRNVENARGTUNTUNVENDZAOMN
EGY
VENDZAVENECU
IDN
TUN
IDN
OMNSAU
NGA
OMNDZAIRNDZAVENTUNECU
COL
EGY
ECU
SAUVENMYSSAU
EGY
PERMEXCOL
COL
IRNECU
OMN
EGYIDN
VENMYSPERMYSIRN
COGIDN
EGY
MEX
MYS
ECUECU
MYSTUNCOL
MEXPERPERPERCOLMEXARGMEXSAU
IDN
MEXMEXTUN
NGA
IRNCOL
KWTARG
IDN
MEXARGCOL
IDNCOG
MEX
COL
NGA
IRNDZA
COG
SAUKWT
NGA
DZA
PER
IRNPER
OMN
PER
COGOMN
PERNGA
SAU SAU
-100
1020
30
Agric
ulture
% G
DP
-5 0 5 10 15interaction between oil renenue and REER
coef = -.25051863, se = .194227, t = -1.29
Full Sample of Oil exporting Countries

© COPYRIG
HT UPM
22
Figure 1.8 : The relationship between agriculture %GDP, oil revenue, REER, and interaction term of REER and oil revenue during
1970-2014(Major oil exporting countries)
(Source: Authors ‘calculation based on data from World Bank World Development Indicators 2016)
SAUSAU
COGOMN
NGAECU
OMN
ECU
IRNECU
VEN
ECU
VENECUSAU
NGA
KWTDZADZA
NGA
ECU
VEN
GABCOGDZA
NGA
DZAVEN
ECU
VEN
NGA
COG
SAUIRNIRNGAB
VENOMNSAUVENOMNVENDZADZAIRN
OMNVEN
COG
SAUIRN
OMN
NGA
OMNIRNDZASAU
KWT
ECU
KWT
NGA
ECU
KWT
GABIRN
OMN
NGA
GAB
KWTKWTSAUGAB
KWTKWTGABSAUGABGABIRNCOG
KWTGAB
OMN
DZA
COG
COGCOG
NGA
COG
DZAIRN
-100
1020
Agric
ulture
% G
DP
-4 -2 0 2 4 6Oil revenue %GDP
coef = -.07761312, se = .52729997, t = -.15
SAU
ECUECU
SAUVEN
ECUVENVEN
OMNCOGGAB
ECU
ECUOMNECUDZADZAGABDZAVENVEN
NGA
DZA
ECU
VENSAUOMNVENKWTIRN
NGA
KWT
NGA
SAUIRN
NGA
VENGAB
OMNOMNIRN
NGA
OMNOMNKWT
SAU
NGA
COGCOG
IRNVENSAUDZAGABSAUOMNKWT
NGA
GABKWT
ECU
KWTSAUIRN
NGA
IRNECU
GABDZA
COG
KWTGABGABGABKWTSAUKWT
COG
OMNCOG
NGA
DZA
COGIRN
COG
IRNDZACOG
DZA
IRN
-100
1020
Agric
ulture
% G
DP
-.2 0 .2 .4 .6Real effective exchange rate
coef = 4.6065378, se = 7.3162938, t = .63
IRNDZA
COGCOG
NGA
COGCOG
DZAGABIRN
OMN
KWTGABGABCOGSAUGABKWTKWT
GABSAUKWTKWT
GAB
NGA
ECUIRNGAB
NGA
OMN
ECU
KWT
IRN
KWTDZAOMN
NGA
SAU
OMN
IRNDZASAUKWTVENOMN
IRNDZAVEN
COG
VENOMNSAUGAB
VENOMNIRN
ECU
IRNSAUVEN
COG
VEN
NGA
NGA
DZAGAB
VEN
DZADZAECUDZA
COG
NGA
ECU
NGAECU
VENKWTSAUVEN
ECUIRN
ECUECU
OMN
NGA
OMNCOG
SAUSAU
-100
1020
Agric
ulture
% G
DP
-10 -5 0 5 10Interaction between oil revenue and REER
coef = -.08336067, se = .24601751, t = -.34
Major Oil Exporting Countries

© COPYRIG
HT UPM
23
Figure 1.9 : The relationship between agriculture %GDP, oil revenue, REER, and interaction term of REER and oil revenue during
1970-2014(Minor oil exporting countries)
(Source: Authors ‘calculation based on data from World Bank World Development Indicators 2016)
PER
IDNIDN
EGY
PER
MEXARGARG
PER
MEXPERPERPERPER
IDN
IDNCOL
TUN
COLIDN
PERTUNCOL
COL
COL
MEXARG
MEX
TUNIDNTUN
MYSMYSTUN
EGYCOL
TUNTUN
IDN
ARGMYSMYS
IDN
MEX
COL
COL
MEX
MYS
ARG
EGYMYSTUNEGYEGY
IDN
ARGMEX
MYS
COLEGYMYSARG
EGYMYS
TUNMEXEGYEGY
ARG
ARGMEX
PER
-100
1020
Agricu
lture %
GDP
-2 -1 0 1 2Oil revenue %GDP
coef = -2.9425744, se = 2.0611518, t = -1.43
PER PER
IDNPERIDN
ARGMEXARG
COL
MEXIDNIDN
COL
COL
PERPERTUNPERMEX
IDNCOL
EGYARG
IDNPERTUN
MEX
EGY
MEXCOLMEXMYS
COL
TUN
MYSPERMEX
MYSMEX
EGYIDN
TUN
COL
MYS
MYSCOL
MYSTUNEGYTUNARG
EGYMYSIDN
TUN
COL
EGYTUNEGYEGY
ARGARG
MYSPER
IDN
ARGMEX
EGYMYS
TUN
ARG
ARG-100
1020
Agricu
lture %
GDP
-.4 -.2 0 .2Real effective exchange rate
coef = 2.973464, se = 7.9932809, t = .37
PER
MEXARG
ARG
TUN
MYS
EGYEGY
MEX
EGY
ARGMYS
COLARG
MYSIDN
MEX
EGY
ARG
TUNEGYMYSEGY
MYS
COL
EGYMEXARGCOLMEX
IDN
MYSMYS
TUN
IDN
TUN
COL
MYSTUNTUNIDN
MEX
ARGTUN
EGY
MYS
MEX
COL
PER
COL
TUN
COL
COL
IDNCOLIDNPERTUN
IDN
PERPERPERMEXARGARGMEXPER
PER
EGYIDN
IDN
PER
-100
1020
e( agv
gdp3 |
X )
-4 -2 0 2 4interaction term between oil revenue and REERcoef = 1.5286991, se = .95199586, t = 1.61
Minor Oil Exporting Countries
© COPYRIG
HT UPM
24
1.2.4 Oil Revenue and Tourism in the Oil-Exporting Countries
In the majority oil-exporting countries, the service sector has a sizable share of GDP.
As shown in Table 1.3, in the major oil-exporting countries, agriculture share of GDP
tends to be diminishing over time, while its share of employment is still high in these
economies. However, the industrial value-added and service value-added percentage
of GDP are considerable in the major and minor oil-exporting countries. As shown in
Table 1.4, the service sector tends to be the largest source of employment. For
example, the service sector’s contribution to employment as a percentage of total
employment was about 50 percent for Algeria, about 60 percent for Ecuador, and more
than 70 percent for Kuwait, Oman, Saudi Arabia, Brunei and Peru. Even though the
service sector has large contributions in total employment, the substantial fraction of
the labour force in that sector is in government employees and government salary,
which mostly is considered as hidden unemployment in most of the major oil-
exporting countries. In the two-past decades, most major and minor oil-exporting
countries expanded the service sector in term of banking services, financial activities
and developing tourism industries. Most of these activities are in the private sector,
which means their effect and contribution in real jobs is large.
International tourism has developed over the past six decades. Only 25 million tourists
(overnight visitors) travelled internationally in 1950. Most of these tourists came from
Europe and North America. During the 1980s, the number of tourists increased eight
times more than that in 1950 and reached 278 million. The number of global arrivals
exceeded 1 billion tourists (1.138) in 2014 and is expected to rise to 1.8 billion by
2030. In 2014, destinations in developing and emerging countries in Latin America,
the Middle East, North Africa and the Asia Pacific accounted for approximately 50
percent of global inbound tourism. By contrast, these regions received only 29 percent
in 1980 (Lanquar, 2011).
The tourism sector is one of the central channels and important sources that can
contribute to the national income of a country. Considering inflation and the volatility
of exchange rates, the international receipt in real terms rose from only 2 billion US
dollars in 1950 and 104 billion US dollars in 1980, to 1.197 billion US dollars in 2013.
The current share of the tourism industry is 9 percent of the world’s GDP (United
Nations World Tourism Organisation, 2015). Figure 1.10 show the share of tourism
in GDP in minor oil-exporting countries as average in 1995–2014. This share is twice
larger than that of major oil-exporting countries during the same period. The
percentage of tourism share in GDP (average) was estimated to be 10.47 percent and
6.5 percent for minor and major oil-exporting countries, respectively. The figures
clearly indicate that most major oil-exporting countries, except Bahrain, lagged behind
minor oil-exporting countries, particularly in the last period.
According to WTTC, tourism (directly and indirectly) generated more than 283
million jobs in 2014, which is approximately 9 percent of the world’s total
employment. Therefore, the tourism sector affects the income distribution between

© COPYRIG
HT UPM
25
developed and developing countries. The latter can also earn exchanges from rich
tourists from advanced economies.
In addition, tourism is considered one of the most labour-intensive economic sectors.
The greatest advantage of this sector is the flexibility of its labour movement and the
fast entry point to the labour market, mostly of women and young people. This
advantage reduces gender inequality in developing countries. Moreover, tourism
exhibits a remarkable positive linkage with other sectors in the economy such as
agriculture. It generates job opportunities not only for itself but also for other sectors
through its complicated value chain that involves transportation, agriculture and small
businesses in destination countries.
Furthermore, tourism reduces emigration rate from rural to urban areas. The sector
also serves as an important employment linkage, which is the extension of tourism-
related jobs across different regions in an economy. Such linkages cause farmers and
rural communities to remain on their land (Khatoon and Mehdi, 2013). According to
WTTC, the tourism sector created approximately 12 million and 27 million jobs in
2014 in major and minor oil-exporting countries, respectively. The number for minor
oil-exporting countries is twice that for major oil-exporting countries. Figure 1.11
shows the contribution of tourism to employment as the percentage of the total
employment for major and minor oil-exporting countries. The share in employment of
tourism for minor oil-exporting countries, such as Mexico, Tunisia, Egypt and
Malaysia, is higher than that for most major oil-exporting countries, excluding Qatar,
Saudi Arabia and Bahrain.

© COPYRIG
HT UPM
26
Figure 1.10 : Tourism % GDP for both major and minor oil exporting countries (average)
(Source: World Travel and Tourism Council 2016)
0.00
5.00
10.00
15.00
20.00
25.00
1995-2000 2001-2006 2007-2014
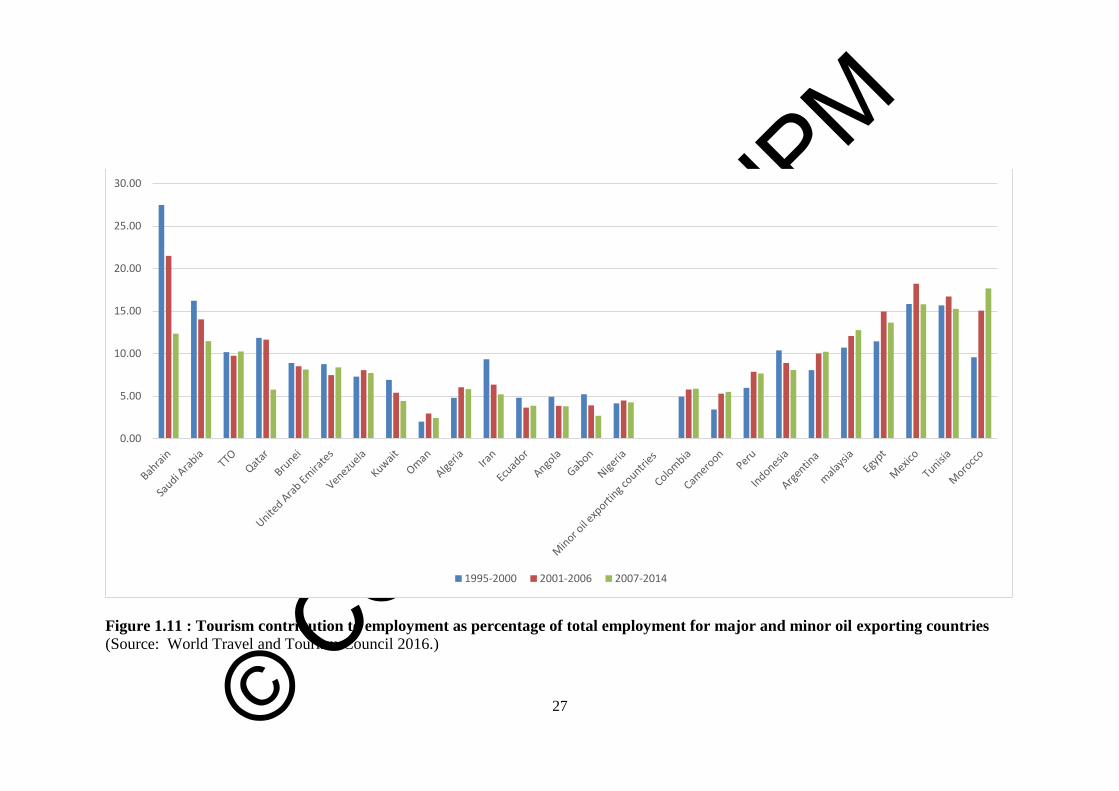
© COPYRIG
HT UPM
27
Figure 1.11 : Tourism contribution to employment as percentage of total employment for major and minor oil exporting countries
(Source: World Travel and Tourism Council 2016.)
0.00
5.00
10.00
15.00
20.00
25.00
30.00
1995-2000 2001-2006 2007-2014

© COPYRIG
HT UPM
28
The tourism sector in most oil-exporting economies has been developing since the past
two decades to create and establish economic diversity. Oil-exporting countries, such
as Bahrain, Tunisia, Indonesia, Malaysia, Egypt, Colombia and the United Arab
Emirates are good examples. The current tourism industry is becoming known and
exhibits remarkable participation in economic growth. Developing oil-exporting
countries can use the tourism sector as a comparative advantage towards the
competitive market position because most oil-exporting countries have an
overwhelming high tourism potential. This potential includes socio-landscapes,
cultural heritage, traditional lifestyle, a mild climate and beaches, which are
considered the most popular destinations worldwide. In these countries, tourism is
regarded as a crucial economic activity that contributes to foreign exchange, increases
employment and stimulates new economic activities, all of which lead to economic
gains.
Figure 1.12 shows tourism export as percentage of total export for major and minor
oil-exporting countries in the 1995–2014 period. Minor oil-exporting economies have
successfully managed their tourism industries to attract more international tourists and
gain more income than most major oil-exporting countries, excluding Bahrain, the
United Arab Emirates, Qatar and Trinidad and Tobago.

© COPYRIG
HT UPM
29
Figure 1.12 : Tourism export (% Total export) in the major and minor oil exporting countries
(Source: World Travel and Tourism Council 2016.)
0.00
5.00
10.00
15.00
20.00
25.00
30.00
1995-2000 2001-2006 2007-2014

© COPYRIG
HT UPM
30
In terms of political implication, most major oil-exporting countries have established
a rentier relationship between political authorities and their citizens. In such a
relationship, governments (which are mostly controlled by one family or one party)
provide their citizens with different types of direct financial benefits (e.g. free
education and health care services, high governmental allowance and public-sector
employment with high salaries). Indirect benefits, such as energy, food,
telecommunication, water, housing and transportation subsidies, are also provided.
That is, the citizens of oil-exporting countries exchange their right to political
participation for no taxation (Mansfeld and Winckler, 2007).
Under such situation, people in rentier economies receive high personal income
without exerting much effort, and therefore, prefer to spend their money overseas.
Consequently, outbound tourism expenditure is relatively greater than inbound
tourism expenditure. Net tourism export (inbound tourism expenditure minus
outbound tourism expenditure) is negative for most major oil-exporting countries
(except Bahrain). By contrast, net tourism export is positive for minor oil-exporting
countries (except Argentina), as shown in Figure 1.13. Amongst major oil-exporting
countries, the United Arab Emirates, Bahrain and Qatar have benefited the most from
tourism income, whereas amongst minor oil-exporting countries, Egypt, Tunisia,
Indonesia, Malaysia and Mexico have recorded the highest tourism income. These
countries have considerable potential to further develop their international tourism
industry given their tourism assets and geographical proximity to European markets.
High economic growth rates and rising income in emerging economies also serve as
opportunities for these countries to attract visitors beyond the traditional European and
Gulf markets.

© COPYRIG
HT UPM
31
Figure 1.13 : Net tourism export for major and minor oil exporting countries.
(Source: Authors ‘calculation based on data from World Travel and Tourism Council 2016.)
-15
-10
-5
0
5
10
15
1995-2000 2001-2006 2007-2014

© COPYRIG
HT UPM
32
Moreover, no direct theory has highlighted the effect of oil price or oil revenue on the
tourism sector and tourism income of oil-exporting countries. However, Dutch disease
theory provides an indirect explanation that may build the theoretical framework for
the investigation of this relationship. The following points explain this scenario. First,
the negative effect of oil price on the tourism sector is observed through its impact on
local currency. The classical Dutch disease model provides strong evidence that high
oil revenue can cause the appreciation of the exchange rate of oil-exporting countries.
Local currency can also be overvalued. When the exchange rate is overvalued and
appreciates, the exports of oil-exporting countries become relatively expensive,
whereas their imports become low-cost. Consequently, the demand for domestic
goods tends to decrease, which motivates spending outside the country on foreign
goods. That is, the appreciation of exchange rates diminishes the production and
exports of non-oil sectors, such as the industrial, agriculture and tourism sectors, in
accordance with Dutch disease theory (Corden, 1984; Morakabati, Beavis and
Fletcher, 2014).
Secondly, Dutch disease theory provides an indirect channel of the effect of oil
revenue on the tourism sector of oil-exporting countries. High oil revenue and national
income can contract the production and export of the non-oil tradable sector and
expand those of the service sector. Thus, high oil revenue may increase investment in
tourism infrastructure, such as banking, transportation and investment in tourism
locations. Consequently, the tourism sector in oil-exporting countries may benefit
from high oil prices and revenues. However, given that tourism is only a small
proportion of the service sector, the preliminary data (Figure 1.14) support the positive
effect of oil revenue on the tourism sector for the entire sample of oil-exporting
countries.
By contrast, the effect of oil revenue on tourism is negative for major and minor oil-
exporting countries (Figure 1.15 and 1.16). However, the partial effect of oil revenue
through the REER on tourism value added is positive for major and minor oil-
exporting countries. Based on the Dutch disease theory and the hypotheses of this
study if the relationship between oil revenue and tourism share of GDP is negative,
and the interaction term between oil revenue and REER is positive, Dutch disease may
exist for these countries. Therefore, based on interaction term, Dutch disease may
occur for major and minor oil-exporting countries with respect to the tourism sector.

© COPYRIG
HT UPM
33
Figure 1.14 : The relationship between tourism share of GDP, oil revenue, REER, interaction term of REER and oil rent during 1990-
2014.( full sample )
(Source: Authors ‘calculation based on data from World Travel and Tourism Council, World Bank World Development Indicators.)
IRNPREMAR
NGAMAR
IRN
MAR
IDNNGAARG
IRN
ARG
MAR
IRN
MARGABMAR
MARNGAMEX
NGA
GAB
VENMARAGOMAR
MARMAR
AGO
IDN
COL
IDN
IRNCOLCOL
GAB
ARGMEX
GABCMRGAB
COLAGOAGO
MEX
COL
MEX
COLCOL
SAUIDN
COL
SAUSAU
IDN
COL
SAUSAU
IRNMAR
OMNAGOIRNMEXSAU
COL
IRNMEXIDNMARAGOAGOOMN
OMNMAR
SAU
ARG
SAU
IRNVEN
GABKWTARG
OMNAGO
OMNIRNVENARGSAUTUNIDNMEXARG
AGO
IDN
SAU
BHR
OMNPRECOL
MARCOLIRNOMNPREMEXSAUTTOSAU
BHRKWT
TUNSAU
AGO
VENARGECUARG
OMN
MEX
OMN
SAU
VENSAUIRN
CMR
SAUIRNKWTARGSAU
OMN
KWTGABBHR
VEN
COLOMNCOLIDNOMNCOLIRN
CMR
TUN
CMROMNGABVENMEXSAUTTO
NGAMARMYS
CMRKWTOMNCMRIRNTUNEGY
OMNAGO
VEN
AGO
MEX
GABMAR
MEXBHR
COLOMNOMNCMRNGA
EGY
MARKWT
TUN
OMNVENMEXBRNMYSOMN
ECU
MYSGABKWTMEXIDNCMRMAROMN
MEXBHR
ARGMEXBRN
TUN
ECUECU
OMN
OMNIDNPREKWTDZASAUIRNBRNTTOMYSSAUTTOUAECMR
MEXGABMAR
ECU
MYSSAU
COL
ARG
CMR
BHR
PREGABBRNSAUTTONGAPREBHR
NGA
MYS
CMRDZAARGMEX
BHR
GAB
EGYTTOBRNIDNBRNKWTTTODZAARG
KWTBRNIDNBHRBRNTTOGABBRNMYSOMNCMRDZATTOTUN
GABDZA
MYS
BRNPREARGCOLDZA
TUNMEXMEX
CMRBRN
GABDZAECU
BRNDZANGA
MEX
ECUPREUAEMEX
PREGABECUUAEDZAVENBRNUAEECUTTO
BHR
BRNMYS
ECU
ECU
MEX
UAE
BHREGY
NGA
BHR
CMRDZADZA
BHR
CMRDZAECU
EGYSAU
CMR
ECU
KWT
EGY
BRNGAB
BHRBHR
KWT
BHRUAECMRTTO
EGY
KWTMYS
ECU
BHR
DZADZAPREDZATTOECUTTOBRNBHRSAUTTOBRNBHRDZAVENIRN
KWT
UAETTO
ECU
ECU
BHR
ECUDZA
BHR
CMRCMRVENBRNBHREGYTTO
EGY
BRN
ECU
OMNSAUBRNUAEDZATTONGANGACOLBRNTTOBHRTUN
BRNUAEBHR
GABGABOMNDZA
ECU
TTOUAEMYSDZA
NGAGAB
AGO
UAEUAEECUCMRVENOMNDZABRNMYS
IRNGAB
MYSMARBRNMYS
NGADZABRNVEN
ECU
GABDZAUAEBRNCOLTTOMYSOMNEGYBHR
GABCMR
GAB
UAETTOIDNCOLBRN
ECU
GABECUTTOSAU
KWT
BHR
AGOKWTIDNMEXPREMYSMAR
TUN
ECU
MYSIDNMEX
UAETTOSAU
GAB
TTOKWTPREUAE
MYSIDNUAEKWT
COL
MYSUAEUAEKWTCOLCOLIDN
BHR
KWTEGYMARUAEEGYIRN
DZAKWTCOLKWTKWTNGATTOECUVEN
KWT
UAEMYSCOLNGAIRNNGAIRNVENEGY
ECUUAEIDNPREIDNIDNIRNVENMARPRENGAIRNPREKWTPRECOLUAEDZAIRNIDNEGYTUNMYSIDNIDNVEN
AGOIRN
IDNKWTIRNPRE
IDNKWTTTOMYS
MEXMEX
CMRPRE
TUNIDNMYSEGYVENEGY
NGAAGO
TUNMYS
NGAMYSPRETUNPREMYSEGY
CMRNGAVENPRE
EGYVENEGY
CMR
VENMYS
CMR
EGY
NGAPRE
TUN
UAEARGEGY
MARMAR
TUN
CMR
TTOTUNVENNGADZA
TUN
UAEPREVENEGY
NGA
EGYTUN
CMR
TUN
VENPREVENTUN
UAE
TUN
PREPREAGOMAR
TUN
NGAPREEGYEGY
UAE
TUNTUNEGY
AGOVEN
TUN
NGAAGO
EGY
AGOAGOAGO
TUN
NGADZAAGOAGO
ARG
AGOIRNAGO
ARGARGARG
AGO
ARGARGARGARGARGARGARG
-3-2
-10
12
touris
m %G
DP
-.4 -.2 0 .2 .4Oil revenue % GDP
coef = .38888221, se = .33518057, t = 1.16
PRE
IDN
MAR
ARG
MARMARIRN
ARGMEXNGAMARMARMAR
IRN
NGAMARIDN
COLCOLIDN
COLCMR
MEX
COL
ARGMEXMARMAR
MAR
MARIDN
GAB
COL
COL
COLCOLNGAMEX
COL
COL
MEXIDNAGO
AGOGAB
IDNMEXECU
GAB
IDNMEXMEXARGCOLAGO
TTOARGIDNTUNARGARG
PREAGOCOL
ARGMAR
GAB
MEXSAUSAUTUNPRE
IRN
CMR
TTOARG
SAU
MARAGOCOL
OMNCMRNGACOLVEN
GAB
EGYMAR
SAU
KWTAGOARGTTO
SAU
AGOOMNCOLCMR
TUNTTOEGY
CMROMN
ECU
CMR
MEXIDNCMR
SAU
KWT
SAU
OMN
SAUMAR
ECU
OMNTUNMYSMEX
UAE
MEXSAU
AGO
SAU
CMR
MYSSAU
ECU
KWTCMR
OMN
ECU
KWTBHRVENTTOOMNCOL
ECU
MEXSAUSAUIRNMEXSAUTUN
OMN
IRNUAE
SAUIDNTTOMYSTTOMEX
NGAGABVEN
AGOGABSAUTTOMYS
BHRTTOARGOMN
SAUMEX
OMN
TTOTTOOMNVENVENKWTKWT
TUN
CMRVENGABOMN
MEX
OMN
MYSEGY
CMROMNKWTTTOOMN
AGO
COLOMNARGMYSNGAUAECMROMNIRNUAEPREKWTIDNMYSSAUOMN
EGY
IRNARGOMNUAE
SAUOMN
SAU
IDNUAE
SAUIRNBRN
GABKWT
MEXPREGABSAUEGYVEN
OMN
EGYMYS
MAR
TUN
PREARGGABMEXECUCMRIDNIRN
BHR
TTOGABGABKWTCOL
TUN
TTOARGOMN
GABUAEGAB
BRNCMR
MEXTTO
MAR
BRNMEXMEX
MAR
MYSBRNBHR
TTOUAE
GAB
SAU
CMR
MEXBRNPREDZAKWT
EGYBHR
TTO
AGO
BRNDZAUAE
ECU
GAB
TTOCMRTTOUAEBRNMARVENSAU
ECUKWT
AGO
UAEKWTBRNNGA
MYSIRNDZAECUBRN
BHRDZASAU
ECUIRNIRNBRNBRNDZADZACMRPRE
UAEOMNUAEBRN
BHRBHR
IRN
BHRBHRDZABRNDZABRN
BHR
ECU
UAENGAUAEBRNUAEUAEPREDZABRNTTO
GABECUUAEOMNGABDZABRNUAEOMNDZA
AGO
VENBHRBRNNGAGAB
KWT
ECU
IRNBHRBRNNGA
BHRBHR
DZA
BHRECU
VENBHRDZAUAEOMNIRNECUGAB
BRNNGAUAEUAEBRNECUGAB
BRNCMRBRNCMROMNDZAGAB
GAB
ECU
BRN
GABECUPREVEN
GAB
SAU
MAR
BHR
KWTUAEAGOECUKWTCOLTTOECU
BHR
BRNTUN
NGA
BHRVENEGY
GAB
VENSAUMYS
DZAKWTIRNDZA
BHRKWTKWTBHRBRNCMR
MYS
VEN
MYSVEN
MYSVENKWTKWT
DZA
ECU
IRNCOLVEN
BHRMYS
NGAECUKWTKWT
KWTCMRIDN
NGANGACOLVENIRNIRNNGA
ECU
IRNBRNEGYMEXIDNPREDZADZA
TUNBHRMEXMYSKWT
BHR
PRE
BHRMYSIRNUAEIDNCOL
VENVENECU
IDNKWT
IRN
VENMYS
ECUDZANGAKWTIDNDZAAGOAGOMARMYSUAECOLTTOVENMARCOLVENTTONGANGA
NGAEGY
DZATTONGA
EGYECUCOLVENEGY
PREMARIDNIDNPRE
BHR
PREPRECOLIDNMYSUAECOLVEN
TUNIDNEGY
NGAMARIDNVENPREIDNIDNIRNIDNTTOMYSMEXMEX
PRENGAUAEIDNMYSDZANGA
MYSTUNPREEGY
DZAPREMYS
PRENGAMYSTUNMYSTUNTTO
EGY
AGODZACMR
VENPRE
TUNMYSARG
CMR
EGYEGYEGY
MARMARCMRCMRAGOAGO
TUNTUN
CMRAGOPRE
EGYIRNEGYTUNTTO
AGONGANGA
TUN
AGO
PREPRE
TUN
PRETUNTUN
MAR
EGY
CMR
PRETUN
IRN
TUN
AGO
TUNEGYEGYEGY
AGO
DZA
TUNEGYEGYTUNEGY
AGOAGOIRNAGO
DZAARGARGARGARGARGARGARG
IRN
ARGARGARGARG
-3-2
-10
12
touris
m %G
DP
-.5 0 .5 1Real effective exchange rate
coef = .07032113, se = .2031015, t = .35
ARGARGARGARGARGARGARG
AGO
ARGARGARG
AGOIRNAGO
ARG
AGOAGODZA
NGA
TUN
AGOAGO
EGY
AGOAGO
TUN
NGAVENAGO
EGYTUNTUN
MARUAE
EGYPREEGYTUN
PRENGAPRE
TUN
AGOPRETUN
UAE
TUN
VENVEN
CMR
TUNEGYEGY
NGAPREMAR
TUN
MARVENUAEDZA
TUN
CMR
TTOTUN
VENNGAARGPRE
EGYTUN
UAE
EGYMYS
CMR
EGY
CMRNGA
VENPRE
EGYVENPRE
CMR
MYSEGY
VENPRETUNNGAMYSMYSTUNEGY
NGA
MYS
AGOPRE
EGYIDNNGAVENTUNMEXMEX
CMR
MARMYSPRE
IDNTTOIDNIDNKWT
TUN
IRN
IDNIDNMYSIRNKWTEGY
COLPREPREVEN
AGODZAMARPREUAEIRNPREIDNIDNIRNIDNKWTNGA
EGYVENIRNUAEECUVENCOLNGA
ECUMYSMARIRNUAETTOIRNVENNGA
KWT
MARCOLNGADZA
EGYIRNIDNKWTKWTUAEKWTEGYCOL
BHR
COLCOLMYSPREKWTIDNMYS
UAE
MEX
UAEPREKWTMYS
UAE
TUN
TTOTTOIDNUAEMEXKWTECUIDNUAE
GAB
MYSKWTSAUIDNECU
TTOCOLECUCMRBHR
COL
MYSEGYKWTAGO
MYS
KWT
ECUMYSSAUTTOMYSUAEBHR
GAB
CMRDZATTOBRNDZA
GAB
OMNUAEVENGAB
MYSBRN
TUN
BRNNGABRNBRNUAE
GAB
IRNDZAVEN
ECUOMNUAE
GABCOLPRETTOBRNUAEUAEECU
BHR
MARNGA
DZAGABNGATTODZA
ECU
AGO
BHR
CMRDZAGABOMNTTOBRNGABTTO
EGY
CMRVENEGYECU
NGAUAEKWTBHRBHRECUECUBRNTTOUAE
BHR
VEN
BHRDZAPREECUOMNBRNTTOTTOCMRTTOBHRBRNBRNMYSIRNSAU
PREDZA
BHR
DZA
EGY
BRNTTO
ECU
ECU
DZADZACMRCMR
BHREGYUAECMR
BHREGYMEXBHRSAUDZA
MYS
KWTBRN
EGYBHR
KWTECU
MEX
UAEPRE
BHR
ECU
BHRMEX
GABTTODZA
BHRMAR
ECU
MEX
NGAECUKWTVENDZAECUDZAUAETUN
COL
SAUARGBRNBRNCMRUAEMEXUAENGAECU
TUN
DZAIDNMYS
GAB
DZAMYSARG
ECU
BRNDZACMRMAR
MEXTTOTTOBRN
MARDZAIDNPREBRNDZAPRE
GAB
ARGTTOBHRBRNTTO
GABBRNMYSOMNBRNCMREGYBRNBRNDZAARG
GABCOLKWT
BHR
DZAMARPREIDNMYSMEXTTOCMRCMR
BHR
NGANGA
ECU
GABKWTTTOBRNMYS
UAE
BHR
TTOSAUTUN
GABGABSAU
DZAIRNBRN
ECU
SAUMEXARG
ECU
MEXMEXMYSSAUIDNCMRKWT
OMN
OMNBRNMEXBHRTUNECU
MYS
OMNOMNGABVEN
COLKWTBRN
CMROMN
EGYMEXMEX
KWTNGATUNBHR
OMN
EGY
OMNMYSMEXVEN
AGO
CMRGABCMROMNTTOIRNAGOOMN
CMR
IDNKWT
TUN
CMRCOLCOLNGA
SAUVENCOLOMNGABIRNARGOMNMARBHROMNVEN
CMROMN
GABSAUKWTKWTIRNSAUMEXARGIRNARGVENTUNSAU
ECUSAU
OMN
PRE
OMNAGO
TTOVENMEXMAR
SAU
COLBHR
SAU
COLIRNKWT
SAUOMNPREMARIDNARGTUNARGMEXIDN
OMN
BHRARGARG
AGO
SAU
MARIRNSAUVENOMN
GAB
AGO
IRNVEN
OMNKWT
SAUSAU
OMN
OMNAGO
MEXIDNAGOCOL
MEXIRNSAU
IRNIRNAGOOMN
IDN
COL
SAUSAU
COL
IDN
SAUSAU
COLCOL
SAUMEX
COL
MEX
AGOCOLAGOCMRGAB
MEX
GAB
ARGMAR
MAR
MARCOL
IDNCOLMAR
IRNCOL
IDN
GABAGO
VENAGO
GAB
MARMEX
NGAMAR
NGA
MARMARGAB
IRN
ARG
IRN
ARGNGAIDN
MARMAR
IRN
NGA
MARPREIRN
-3-2
-10
12
touris
m %G
DP
-2 -1 0 1 2interaction term between oil revenue and REERcoef = -.10828487, se = .072442, t = -1.49
Full Sample of Oil Exporting Countries

© COPYRIG
HT UPM
34
Figure 1.15 : The relationship between tourism share of GDP, oil revenue, REER, interaction term of REER and oil rent during 1990-
2014.(Major oil exporting countries )
(Source: Authors ‘calculation based on data from World Travel and Tourism Council, World Bank World Development Indicators.)
IRN
NGA
IRN
NGA
ECUTTO
GAB
NGATTOAGO
GABAGO
TTO
ECU
TTO
GAB
ECUECU
UAE
ECU
TTOAGOTTOAGO
GAB
TTOTTO
ECU
VENUAETTOTTOTTO
IRN
GABTTO
VEN
SAUSAU
NGA
SAUSAU
OMN
SAU
AGO
ECU
AGO
UAEOMN
OMNAGOUAE
SAU
ECUSAUSAU
OMN
TTOOMN
UAE
ECU
AGO
UAEKWT
SAUSAU
TTOKWT
IRN
ECU
TTOTTOECU
OMN
UAE
OMNSAUSAU
BHR
ECU
BHR
VENVEN
OMN
TTO
SAU
OMN
UAE
SAUVEN
UAETTOKWTIRN
AGO
TTO
OMN
SAUVENIRNOMNUAE
ECUSAUGABBHR
VENUAEVENOMNOMNKWTIRN
SAU
BHR
TTOOMNIRNBHRBHRVENGAB
ECU
KWT
ECU
BHRBHRBRNOMN
BHR
IRNNGAUAE
SAUBRNGABOMNOMN
BHR
UAEOMNUAEKWT
BHR
DZADZAECU
AGO
TTO
ECUECU
BHRBHR
BRNGABUAEBRNUAEBHR
ECU
IRNOMNBRN
ECU
DZANGA
BHR
OMN
IRNDZABRNDZAIRNDZA
NGA
DZA
ECU
BHRDZA
ECU
AGO
BRNOMN
BHRBHRUAENGA
IRN
BRNECU
DZABRN
NGA
VENBRN
BHR
BRN
BHRBRNUAEBRNBRNBRNUAEDZABRN
DZABRN
DZA
UAE
ECU
GABOMNBRN
BHR
VENDZANGAECUAGOBRNUAESAUKWTBHRIRNBRN
BHR
GABUAEVENVENBRNKWTVEN
DZAGAB
SAU
KWTGAB
SAU
BRNUAE
SAU
OMN
GAB
DZAVEN
GABECU
VENIRNKWTKWTKWT
ECU
DZADZABRNIRN
NGAGAB
NGAOMNTTOKWT
BHR
NGAGABDZADZAGAB
BHR
IRNBRN
GAB
BRN
BHR
GABKWTNGADZA
VENOMNVENBRNOMNBRN
GAB
SAUSAUOMNTTO
GABDZA
AGO
KWT
GAB
KWTSAU
UAEVEN
KWT
IRNIRNTTOGABGAB
GABKWTVENSAU
UAEGAB
IRN
DZA
KWTKWTNGAAGOVENNGA
KWTKWTNGA
BHRKWTNGA
KWT
SAU
IRNAGONGA
VENKWTVENKWTKWTNGATTONGAIRNAGOUAEVENDZA
VENVEN
NGA
IRN
TTODZANGAUAENGADZANGA
VENTTOAGO
IRN
AGOAGOAGONGAAGO
NGAAGO
AGO
IRN
DZAAGOAGOAGOIRN
AGO
DZAIRN
-2-1
01
2
Touri
sm %
GDP
-.2 0 .2 .4Oil revenue %GDP
coef = -3.3919768, se = .69160819, t = -4.9
IRN
NGANGA
IRN
ECUTTO
GAB
TTONGATTOAGOTTO
AGO
ECU
GAB
ECU
UAE
ECU
GAB
ECU
TTOTTOVEN
ECU
AGOUAETTOTTOTTOTTOTTOAGO
UAETTO
SAU
GAB
SAU
UAE
SAU
AGOOMN
SAUSAU
UAEECUUAEAGOAGOOMNKWT
GAB
ECU
OMN
TTO
SAUSAU
OMN
OMN
SAU
TTOTTO
SAU
AGO
UAEUAEUAE
ECUSAU
VEN
ECUSAUVEN
TTOKWT
ECU
TTO
OMN
OMNUAEKWT
BHR
SAU
OMN
SAU
TTO
VEN
TTO
SAUIRNKWTSAU
SAU
OMN
GABUAEIRNBHROMNOMN
VEN
VENKWTGABUAE
OMN
BHR
ECU
KWTSAU
UAE
BHR
VEN
VENOMNOMNOMNNGA
BHRVENBHROMNVENOMNGABNGABHRNGATTOBRN
BHR
OMNBRN
TTOIRNIRNBHR
ECU
GABOMN
IRNBHR
AGO
UAEDZA
BHR
OMN
VEN
ECU
SAU
ECU
BRNBHR
IRNAGO
BHR
DZAECUUAE
ECU
DZADZADZAVENUAE
BHR
ECUECU
BHR
DZABRNNGABRNBRNDZABRNOMNUAEECU
KWTBRNBRNBRNGABUAEKWTBRNBRNBRNUAEBRNUAEDZAIRNVEN
ECU
SAUBHR
BRNBRNIRNGAB
SAUSAU
NGAECU
UAEGABDZA
AGO
UAE
NGA
IRN
SAU
BRNDZABHRECUUAEKWT
GABKWTDZAOMN
GAB
BRN
BHR
KWTDZABHR
IRNOMN
VENKWT
NGA
DZA
BHR
DZABRNIRN
GAB
BRNGABIRNNGAKWTOMN
DZAVENGABDZA
BRN
NGAECUUAEKWT
AGO
GABBRNIRN
NGAVENIRNVENBRNDZAECUGAB
BHR
BRNUAE
BHR
OMNBHRSAU
BRNSAUOMNBRNGAB
BRNVENOMN
GAB
AGO
VEN
SAU
GAB
IRNKWTKWT
ECU
KWT
IRNGAB
ECUGAB
GAB
NGA
KWTSAUBHR
GABTTODZADZA
IRNBHR
IRNKWTAGOKWTKWTNGA
GABNGAKWT
BHR
NGADZAKWTKWT
SAU
AGOIRN
NGA
TTOVEN
DZA
VENKWTVEN
TTO
KWTNGAKWTUAENGAVEN
DZA
VEN
NGAAGO
BHRVENVENTTOUAENGANGA
DZANGA
VENTTONGADZA
IRN
AGOAGOAGOAGODZAIRNNGATTO
AGOAGONGA
IRN
AGOAGO
DZAAGOIRNAGO
AGOIRNDZA
IRN
-2-1
01
2
Touri
sm %
GDP
-.2 0 .2 .4 .6Real effective exchange rate
coef = -2.2746791, se = .45216433, t = -5.03
IRNDZA
AGOIRNAGOAGODZA
AGOIRN
AGOAGONGAAGONGAAGO
IRN
TTOAGOAGOAGOVENDZANGATTONGADZAUAENGA
IRN
DZANGAVENVENTTOUAE
VEN
IRNAGONGANGABHRKWTVEN
NGA
KWT
NGADZA
VEN
AGO
KWT
NGAVENTTOIRNUAE
VENTTONGADZA
KWTKWTNGA
SAU
KWTIRNVENKWT
UAEDZATTOIRNKWTIRNAGO
GAB
BHR
KWT
KWTKWTBHRSAUKWTVEN
ECU
BHR
ECUDZADZA
KWT
GABECUGABNGA
VEN
GABGAB
IRN
GABNGA
AGO
SAUBRNOMN
BRNOMNBRN
GAB
OMNBRNSAU
GAB
BHRSAU
IRNECUGABGABNGA
BRNVENBHRVEN
VENDZANGABRNVENVENDZAOMNIRNBRNUAEDZADZAKWTDZA
BHRVEN
GAB
BRNIRN
GAB
KWTDZABHR
UAEKWT
NGA
BRNGABUAEBHRBHR
ECU
BRNBRNNGAECU
KWTDZA
GAB
BRNUAEECUBRNKWT
BHR
DZAOMNUAEGABDZAVEN
ECUOMNBRNECU
IRN
NGA
BRNUAEBHRUAEDZABRNUAEBHR
ECUDZABRN
BRN
SAU
KWTGABBRNNGA
AGO
GABDZADZA
ECU
BRNIRNBRNBRNDZAIRN
SAUBRNBRN
SAUSAUIRN
ECU
BHR
ECU
UAE
BHR
DZATTO
ECUTTO
BHR
DZAUAE
ECU
GABDZA
BHR
UAE
AGO
UAE
BHR
BRNOMNVENBHR
ECU
BHR
KWTBHRBHRBRNKWT
BHR
OMN
BHRIRNGABOMN
BHRBRN
UAEAGOVENOMNVEN
UAEUAETTONGATTOIRNOMNOMNGAB
SAU
IRNUAEOMN
KWT
OMNTTONGAOMNIRN
ECU
KWT
ECUSAU
TTO
ECU
AGO
OMN
GABUAE
VEN
OMNTTOTTOOMNKWTVEN
ECUGABSAUVENKWT
OMN
IRNSAU
SAU
TTOUAE
SAUVEN
BHR
ECU
UAE
OMN
SAU
BHROMN
UAEIRN
OMN
KWT
SAU
UAE
SAU
AGO
SAUSAU
OMN
OMN
SAUSAU
TTO
OMN
TTOKWTOMN
TTOAGOAGOTTOTTOUAETTO
SAU
VEN
ECU
NGA
OMNAGO
SAU
TTOVEN
TTOGAB
SAU
ECU
IRNSAUSAU
ECU
UAE
GAB
ECU
AGO
ECU
TTOAGOTTO
GAB
TTO
GABAGO
AGOTTONGAECU
GAB
NGA
IRN
NGA
IRN
-2-1
01
2
Touri
sm %
GDP
-2 -1 0 1Interaction term between oil revenue and REERcoef = .61752065, se = .1476329, t = 4.18
Major Oil Exporting Countries

© COPYRIG
HT UPM
35
Figure 1.16 : The relationship between tourism share of GDP, oil revenue, REER, interaction term of REER and oil rent during 1990-
2014.(Minor oil exporting countries )
(Source: Authors ‘calculation based on data from World Travel and Tourism Council, World Bank World Development Indicators.)
EGYEGYMAREGY
MARMAR MARMARMAR
MAR
CMR
EGYEGYEGYEGYEGY
CMR
MARMARMAREGY
MAR
EGY
CMR
EGY
CMRCMR
MYS
EGYEGY
MYSCOLMYS
EGYEGY
COL
ARGEGY
COLMYSEGYTUNEGYTUNMYS
EGY
IDNIDNTUNMYSMARMYS
CMR
COL
MEXTUN
IDNARGARGIDNARGMARTUNMAR
CMR
MYS
COL
MYSMYSMYS
CMR
MYSMYS
COLCMR
MYSIDN
COL
MYSIDNMARIDNMYSMYSARGCMR
TUNARGMEXIDNEGYMEXTUN
PRECMR
TUN
ARG
COL
MYSIDNIDNPREIDN
COLCMR
ARG
COL
TUNPREMEXIDNMEXPREMEXTUNARGARGMYSIDNPREMEX
COL
TUN
PRE
MEXMEXARGMYS
PRE
IDNMYSMEX
CMR
MEXMYSMEXTUNEGYARG
COL
TUN
IDN
TUN
PREARGCMR
MEX
PREIDNPREMYS
COL
TUNMEX
CMR
MYSTUN
IDNMEXIDN
COL
COL
MEXARGMEX
IDNCMR
TUNIDNPREIDNCMR
TUN
CMRCOLCMRPRE
MYSTUNMEX
COL
TUN
COL
IDNCMR
MEXMEX
PRE
ARGPREPRE
MAREGY
MARCMR
ARGMARPRE
TUNIDNEGY
MARCOLPREMYSTUN
CMR
PREMEXTUNMEXMEXMYSTUN
PRECMR
EGY
PRECOLCOL
MEXEGY
COL
MARCMRCMR
TUNIDN
PREPRECOLCOLCOL
PREIDN
PREIDNPREMARPRE
MEXTUNMEXMAR
CMR
MEX
COL
MAREGYEGYMAR
CMR
IDN
PRE
TUN
COL
ARGMARMARARGARGMARARGARGARGARGARGARGARGARG
-3-2
-10
1
Touri
sm %
GDP
-.3 -.2 -.1 0 .1 .2Oil revenue %GDP
coef = -.0537268, se = .67301079, t = -.08
MARMARMAREGYPREEGYMARARGARGEGYMARMAR
IDNMARMARMEXMARMAR
MARARG
COL
MEXIDN
COL
MEX
COL
COL
IDN
COLARG
CMR
EGYIDN
COL
MEXARGTUNARG
COL
ARGIDNCOLIDN
PRE
MYSPRE
COL
COL
ARG
CMR
EGYTUNMAREGYMEX
IDNEGYEGYMEX
MYSARGMEX
COLCOL
MEX
CMR
MYSEGYEGYARGTUN
COL
IDN
COLCOL
MAR
CMR
TUN
COL
EGYMAR
IDNMYS
MEX
CMRCMR
TUN
CMR
MYSMEXMEXEGYCOL
TUN
ARGMEXMEXIDNIDN
COL
ARGARG
COL
MYSPREMYSMEXIDNMYSIDNCOL
ARGMYSIDNCMRCMR
TUN
CMRCOL
TUNARGMEXMEX
CMR
MEXMYS
CMRCMR
MEXEGY
PREMEX
CMR
MEX
CMRCOLCMR
MEXMYSMYSMEX
CMRCMRCOL
MYSMYS
MYSCMRPRECMRIDN
EGYMARMYSMYSMYSMYSPRE
TUN
CMR
MYS
CMR
EGY
IDNIDNMEX
CMR
MYS
PRE
MYS
COL
EGYEGYEGYIDN
TUN
PRE
MEX
CMR
EGY
COL
PRETUNMEXTUN
IDN
EGYPREEGY
COLPREIDNEGYTUN
EGY
MYSCMR
IDNIDN
COL
MYSIDNIDNMYSIDNMYS
CMR
MYSTUN
PRE
IDN
MEX
IDN
MARMEXEGYMARMARMAR
TUN
CMR
PREPREPRETUN
PRE
EGY
MARPREPRE
PRETUNARGTUNEGY
PRE
TUN
PREMARTUNTUNMARTUNTUN
MARPRE
MARTUN
PREPREEGYTUN
PREPRE
TUN
MARMAR
TUN
MARARGARGARGARGARGARGARGARGARGARGARG
-3-2
-10
1
Touri
sm %
GDP
-.5 0 .5 1Real effective exchange rate
coef = .20223904, se = .22097645, t = .92
ARGARGARGARGARGARGARGARGMARARGMARARGMARARG
COL
TUN
PRE
MARIDNMAR
CMR
EGYEGYMAR
COL
MEX
CMR
MARTUNMEXPRE
MEXPREIDNPRE
IDNPRE
COLCOLPRECOLPREMAR
TUNIDN
CMRCMR
COL
EGYMEX
COLCOLPRE
TUN
MARPRECMR
EGY
MARMYSMEXMEXTUN
MARPRE
MARMEXTUN
CMR
PREMYS
PRECOL
TUNIDNEGYARGPRECMR
EGY
PRE
PRE
ARGMEXMEX
CMRIDNTUN
COLCOL
MEXTUN
PRECMR
MYS
COLCMRPRE
TUNIDNCMRIDNIDNTUNIDNARGCMR
COL
MEXMEX
COL
IDN
TUNMEX
CMR
PREMYS
COLPRE
TUN
IDN
MEXMYSPREMEXARGCMR
TUNTUN
IDNCOL
MEXARG
PRE
MEXMEXMYSTUNEGY
IDNMYSMEX
CMR
ARGMYS
PRE
MEXPRE
TUN
COLMYSMEXPREIDNARGARGTUNMEXMEXIDNPREMEXTUN
COL
ARGPREIDN
COL
IDN
CMRIDNARG
COL
MARTUNMYSPRE
TUN
IDNCMR
EGYMEXMEXARGTUNARGCMRIDNMYSMYSIDN
COL
MYSIDNMYS
CMRCOL
MYSMYS
CMR
MARMARMYSMYSMYS
COL
MYS
CMR
TUNARGIDNARGMARARGIDN
TUNMEX
CMR
COL
MYSMYSTUNIDNIDN
EGY
MYSTUNEGYTUNEGYMYSCOL
ARGEGY
COL
EGYEGY
MYSCOL
EGY
MYSEGY
MYS
CMRCMR
EGY
MAR
CMR
MARMAREGYMAREGY
CMR
EGYEGYEGYEGYEGYMAR
CMR
MARMARMAR MARMARMAREGY
EGYEGY
-3-2
-10
1
Touri
sm %
GDP
-1 -.5 0 .5 1 1.5Interaction term between oil revenue and REERcoef = .00317498, se = .14594897, t = .02
Minor Oil Exporting Countries
© COPYRIG
HT UPM
36
1.3 Problem Statement
In the oil-exporting countries, economic activities, fiscal policy (such as revenue,
taxes, and government spending), trade and export policy, a monetary policy (such as
foreign exchange), different sectors such as agriculture, manufacturing, service sector
and tourism sector, are directly and indirectly affected by the oil sector and oil revenue.
Therefore, this study tries to address three issues in these countries, which are oil
revenue’s relation to economic growth, agriculture, and tourism. The first issue
focuses on the relationship between oil revenue and economic growth in oil-exporting
countries. Theoretically, countries with plentiful of oil revenue tend to achieve low
economic growth, whereas those with little oil revenue have performed better
economic growth based on the substantial literature (theoretical and empirical) that
tested the resource curse hypothesis.(Frankel, 2010; Sarmidi, Law and Jafari, 2014;
Williams, 2011).
Most empirical studies examined developed and developing oil-exporting countries
together. However, the effect of oil revenue on economic growth may differ among
developing oil-exporting countries. As observed in Table 1-1, despite the dramatic rise
in the oil price and oil revenue in the past decades, particularly in 2000–2014,
economic growth is still lower in major oil-exporting countries than in minor oil-
exporting countries. Furthermore, most major oil-exporting countries experienced
negative economic growth (on average) during the oil collapse period (1986–2000),
whereas minor oil-exporting countries gained positive economic growth during the
same period. Therefore, oil revenue decreases economic growth less in minor oil-
exporting countries than in major oil-exporting countries.
Dutch disease theory provides an exchange rate channel to highlight the effect of oil
revenue on economic growth for oil-exporting countries. This study tries to investigate
an indirect channel between oil revenue and the real effective exchange rate to show
the partial effect of oil revenue on economic growth through the real effective
exchange rate. The preliminary data (Figure 1.3, 1.4 and 1.5) seem to be support Dutch
disease for the full sample and major oil-exporting countries because the partial effect
of oil revenue through REER on economic growth is positive, while it is not supported
for minor oil-exporting countries. Therefore, these observations suggest the necessity
to study the impact of oil revenue through the exchange rate as an indirect channel for
both major and minor developing oil-exporting countries.
The second issue of this study is the relationship between oil revenue and the
agriculture sector through the real effective exchange rate as an indirect channel. The
importance of the agriculture sector as a non-oil sector for oil-exporting countries is
seen in its contribution to employment in these countries. In some case (Congo) for
example, agriculture contributes to employment four times greater than its value-
added share of GDP (Tables 1.3 and 1.4). Moreover, oil revenue is recognized as the
key determinant of economic activities in major oil-exporting countries. Graphically,
the trend of the value-added share of agriculture in GDP exhibits a slowdown for all

© COPYRIG
HT UPM
37
oil countries (except Nigeria) over the period. However, the agriculture percentage of
GDP for minor oil-exporting countries is twice that of most major oil-exporting
countries (Figure 1.6).
Dutch disease theory provides the base theory for investigation of the relationship
between oil revenue and agriculture. It reveals that oil revenue may harm the
agriculture sector through the appreciation of real effective exchange rate. Therefore,
as observed from the preliminary data, Figure 1.8 and 1.9 show a negative direction
between oil revenue and agriculture value added for both major and minor oil-
exporting countries while the partial effect of oil revenue through the REER on
agriculture value added is only positive for minor oil-exporting countries. Then, these
preliminary data appear to support Dutch disease theory for major and minor oil-
exporting countries. Based on the above observations, understanding the relationship
between oil revenue and agriculture sector is required for both major and minor oil-
exporting countries to address the policy suggestions regards to diversify their
economies and escape from monocultural economies, which depend only on the oil
sector to produce value-added share or to diversify their sources of export and foreign
exchange.
The third issue that this study tries to examine is the relationship between oil revenue
and the tourism sector in developing oil-exporting countries (both major and minor).
No direct theory explains this relation, but Dutch disease theory may provide two
different indirect channels to illustrate the effect of oil revenue on the tourism sector
in oil-exporting countries. First, an oil revenue increase leads to the appreciation of
the real exchange rate of oil-exporting economies, which may be reduced in the
tourism sector. For example, numerous studies support a strong nexus between the
real oil price and real exchange rate. These studies provide clear evidence that an oil
price increase leads to the appreciation of the real exchange rate in these countries
(Fakhri, 2010; Jahan-Parvar and Mohammadi, 2011). Therefore, in this view, an oil
revenue increase may harm the tourism sector in oil-exporting countries. The second
channel through which oil revenue affects the tourism sector is the service sector.
Dutch disease theory also provides evidence that an oil revenue increase can expand
the service sector in these economies. Theoretically, through the first channel, oil
revenue adversely effects tourism, while the second channel may have a positive
effect. Empirical studies are very scanty in this regard. Therefore, the present study
examines the relationship between oil revenue and tourism sector through the
exchange rate for oil-exporting countries.
Preliminary data (Figure 1.15 and 1.6) show the negative direction between oil
revenue and tourism for major and minor oil-exporting countries. As the moderate
effect of the interaction term shows a positive direction, this may support Dutch
disease in these countries. Additionally, Figure 1.10, 1.11. 1.12 and 1.13 illustrate the
performance of minor oil-exporting countries over major oil-exporting countries with
regards to tourism’s share of GDP, tourism’s contribution to employment, tourism
exports, and net tourism exports respectively. Therefore, an investigation of the effect
of oil revenue on tourism sector is required.
© COPYRIG
HT UPM
38
1.3.1 Research Questions
1. What is the effect of oil revenue on economic growth in oil-exporting
economies? Is the relationship moderated or conditioned by real effective
exchange rate policy?
2. What is the effect of oil revenue on value-added agriculture in oil-exporting
economies? Is the relationship being contingent or conditional on the real
effective exchange rate?
3. What are the effects of oil revenue on the tourism sector in oil-exporting
economies? To what extent is the relationship contingent or conditional on real
effective exchange rate?
1.4 Research Objectives
The impact of oil revenue on macroeconomic variables both in developed and
developing countries has been debated in the literature. This study contributes to this
debate by examining the impact of oil revenue on the economic growth, agriculture
and tourism in oil-exporting countries from the perspective of real exchange rate
policy. Specifically, this research intends to:
1. Investigate both direct and indirect effects of oil revenue on the economic
growth of oil-exporting countries conditional on the real effective exchange
rate.
2. Examine both direct and indirect effects of oil revenue on the agriculture sector
of oil-exporting countries through the real effective exchange rate.
3. Investigate both direct and indirect effects of oil revenue on the tourism sector
of oil-exporting countries conditional on the real effective exchange rate.
1.5 Significance of the Study
This study focuses on a sample of 25 countries. The sample is further divided into
major and minor oil-exporting countries to further investigate the heterogeneous
behaviors among these oil-exporting countries, if any. The findings of this study
would not only contribute to the existing literature but also benefit in informing
policymakers and stakeholders on the likely contingent effects of exchange rate policy
on the nexus of oil revenue and real economic sectors in these oil-exporting
economies. In terms of the objectives, empirical studies are few, which creates a
considerable literature gap, particularly for oil-exporting countries. Thus, this study
explores this relationship for oil-exporting countries and attempts to fill in this major
research gap.
Regardless of whether oil revenue improves economic growth significantly or not,
policy makers will utilize the revenue more efficiently or restructure their economies
to promote a sustainable long-run economic growth and development. Policy makers

© COPYRIG
HT UPM
39
will find the outcome of this study useful for economic planning especially, the major
oil-exporting countries who depend solely on oil revenue. Furthermore, the role of
exchange rate in the oil revenue-growth nexus is essential for policymaking. This will
guide the government in these countries as to the exchange rate regime that is most
suitable to protect the value of oil rent receipts for crude oil exports. Using the
marginal effects approach, the findings for average, minimum and maximum rates of
real exchange will guide the financial regulators in the economy in choosing the most
suitable and favourable exchange rate policy for their respective countries.
In addition, the issue of Dutch Disease is still debated in the empirical literature,
especially for developing oil-exporting countries. The new and more robust findings
of this study would provide a more realistic and empirically proven effect of oil
revenue on the agricultural sectors of these countries. Arguably, oil revenue renders
the agricultural sector less attractive and promotes a strong currency for the domestic
economy. The findings of this study would be useful for policymakers to devise better
means of regulating the economy against a very strong currency which affects the
exports of agricultural products emanating from their countries.
Finally, the tourism sector world over is booming in recent years and generates
revenue for most developing countries. Interestingly, the large proportion of oil-
exporting countries are from developing countries who have huge tourism potentials.
Unfortunately, the tourism sector of these countries has faced neglect from the
governments of these countries. The findings of this study would provide the
potentials of the tourism sector and reveal the need for a renewed focus on the sector
by major stakeholders. This will go a long way to attract revenue for the government
to promote long-term economic growth and development. This study can also serve
as reference for future researchers to expand empirical research on the oil price–
tourism nexus. In addition, it adopts a robust econometric method to point out the
nature of the relationship.
1.6 Organization of the Study
The remainder of this paper is organized as follows. Chapter 2 provides the theoretical
and empirical reviews of the literature on the effect of oil price on economic growth,
and the agriculture and tourism sectors. Chapter 3 describes the theoretical framework
and empirical methodology for the research objectives. Chapter 4 presents the
estimated results and discussion. Finally, Chapter 5 draws the conclusion and offers
policy recommendations, along with the limitations of the study and directions for
future research.

© COPYRIG
HT UPM
144
6 REFERENCES
Ackah, I. (2016). Sacrificing Cereals for Crude: Has oil discovery slowed agriculture
growth in Ghana? (No. 69953) Munich Personal RePEc Archive.
Adams, S., Kwame, E., Klobodu, M., Evans, E., & Opoku, O. (2016). Energy
consumption , political regime and economic growth in sub- Saharan Africa.
Energy Policy, 96, 36–44.
Ahmad, A. H., & Masan, S. (2015). Dynamic relationships between oil revenue ,
government spending and economic growth in Oman. International Journal of
Business and Economic Development, 3(2), 93–116.
Al-mulali, U., Fereidouni, H. G., Lee, J. Y., & Mohammed, A. H. (2014). Estimating
the tourism-led growth hypothesis : A case study of the Middle East countries.
Anatolia, 25(2), 290–298.
Algieri, B. (2011). The Dutch disease: Evidences from Russia. Economic Change and
Restructuring, 44(3), 243–277.
Alkhathlan, K. a. (2013). Contribution of oil in economic growth of Saudi Arabia.
Applied Economics Letters, 20(4), 343–348.
Allcott, H., & Keniston, D. (2017). Dutch disease or agglomeration ? The local
economic effects of natural resource booms in modern America. The Review
of Economic Studies, 85(2), 695-731.
Amin, M. Y. (2011). Effect of Oil Price on the Stock Market Return and Volatility in
Six Major Oil Exporting Countries,Universiti Putra Malaysia. (Master
dissertation, Universiti Putra Malaysia)
Ammani, A. a. (2011). Nigeria’s oil boom Period (1973-1983): Was agriculture really
neglected? International Journal of Statistics and Research, 1(1), 6–9.
Antonakakis, N., Dragouni, M., Eeckels, B., & Filis, G. (2015). Tourism and
economic growth revisited: Empirical evidence from a Panel VAR approach.
Munich Personal RePEc Archive, (67419).
Apergis, N., El-Montasser, G., Sekyere, E., Ajmi, A. N., & Gupta, R. (2014). Dutch
disease effect of oil rents on agriculture value added in Middle East and North
African ( MENA) countries. Energy Economics, 45, 485–490.
Arezki, B. R., & Blanchard, O. (2014). Seven Questions about the Recent Oil Price
Slump.The IMF Blog, . https://blogs.imf.org/2014/12/22/seven-questions-
about-the-recent-oil-price-slump/ .
Asteriou, D., & Monastiriotis, V. (2004). What do unions do at the large scale? Macro-
economic evidence from a panel of OECD countries. Journal of Applied
Economics, 7(1), 27-46.

© COPYRIG
HT UPM
145
Auty, R. M. (2001). The political state and the management of mineral rents in capital-
surplus economies: Botswana and Saudi Arabia. Resources Policy, 27(2), 77-
86.
Ayadi, O. F. (2005). Oil price fluctuations and the Nigerian economy. OPEC Review,
29(3), 199–217.
Baffes, J., Kose, M. A., Ohnsorge, F., & Stocker, M. (2015). The great plunge in oil
prices: Causes, consequences, and policy responses.World Bank Group.
Development Economics. Policy Research Note 9–10.
http://dx.doi.org/10.2139/ssrn.2624398.
Bahar, D., & Santos, M. A. (2018). One more resource curse: Dutch disease and export
concentration. Journal of Development Economics, 132, 102-114.
Bakhtiari, S., & Haghi, Z. (2001). The Impact of Impact of Oil Revenue Increase on
Iran's Agricultural Sector : A Case of Dutch Disease In Iran. EQTESAD-E
KESHAVARZI VA TOWSE’E, 9(3 (35)), 109–138.
Baltagi, B. H. (2008). Econometric analysis of panel data. Chichester, John Wiley &
Sons.
Barnet, E. M. (1975). The impact of inflation on the travel market. The Tourist Review,
30(1), 2-5.
Barro, R. J. (1991). Economic growth in a cross section of countries. The Quarterly
Journal of Economics, 106(2), 407-443.
Barro, R. J. (2016). Economic growth and convergence, applied to China. China &
World Economy, 24(5), 5-19.
Bashir, F. (2015). Energy consumption and agriculture aector in middle income
developing countries: A panel data analysis. Pakistan Journal of Social
Sciences (PJSS), 35(1), 479-496.
Basnet, H. C., & Upadhyaya, K. P. (2015). Impact of oil price shocks on output,
inflation and the real exchange rate: Evidence from selected ASEAN
countries. Applied Economics, 47(29), 3078-3091.
Becken, S. (2008). Developing indicators for managing tourism in the face of peak
oil. Tourism Management, 29(4), 695–705.
Becken, S. (2011). Oil, the global economy and tourism. Tourism Review, 66(3), 65-
72.
Becken, S. (2011b). A critical review of tourism and oil. Annals of Tourism
Research, 38(2), 359-379.
Becken, S. (2016). Peak oil: a hidden issue? Social representations of professional
tourism perspectives. Journal of Sustainable Tourism, 24(1), 31-51.

© COPYRIG
HT UPM
146
Becken, S., & Lennox, J. (2012). Implications of a long-term increase in oil prices for
tourism. Tourism Management, 33(1), 133-142.
Belloumi, M. (2010). The relationship between tourism receipts, real effective
exchange rate and economic growth in Tunisia. International Journal of
Tourism Research, 12(5), 550-560.
Benjamin, N. C., Devarajan, S., & Weiner, R. J. (1989). The ‘Dutch’ disease in a
developing country: Oil reserves in Cameroon. Journal of Development
Economics, 30(1), 71-92
Berry, D. (1978). Effects of urbanization on agricultural activities. Growth and
Change; 9(3). https://doi.org/10.1111/j.1468-2257.1978.tb01024.x
Berry, S., & Jia, P. (2010). Tracing the woes: An empirical analysis of the airline
industry. American Economic Journal: Microeconomics, 2(3), 1–43.
Berument, M. H., Ceylan, N. B., & Dogan, N. (2010). The impact of oil price shocks
on the economic growth of selected MENA countries. Energy Journal, 31(1),
149–176.
Bhatia, M. S. (1999). Rural infrastructure and growth in agriculture. Economic and
Political Weekly, 34(13), A43-A48.
Blanchard, O.J., Gali, J., 2010. The macroeconomic effects of oil price shocks: why
are the2000s so different from 1970s? In: Gali, J., Gertler, M. (Eds.),
International Dimensions of Monetary Policy. University of Chicago Press,
Chicago, IL, pp. 373–428.
Brida, J. G., Lanzilotta, B., Lionetti, S., & Risso, W. A. (2010). Research note: The
tourism-led growth hypothesis for Uruguay. Tourism Economics, 16(3), 765-
771. https://doi.org/10.5367/000000010792278356
Brida, J. G., Lanzilotta, B., Pereyra, J. S., & Pizzolon, F. (2015). A nonlinear approach
to the tourism-led growth hypothesis: The case of the MERCOSUR. Current
Issues in Tourism, 18(7), 647-666.
Brida, J. G., Cortes-Jimenez, I., & Pulina, M. (2016). Has the tourism-led growth
hypothesis been validated ? A literature review. Current Issues in Tourism,
19(5), 394–430. https://doi.org/10.1080/13683500.2013.868414
Brambor, T., Clark, W. R., & Golder, M. (2006). Understanding interaction models:
Improving empirical analyses. Political Analysis, 14(1), 63–82.
Bresser-pereira, L. C. (2008). The Dutch disease and its neutralization : A Ricardian
approach. Brazilian Journal of Political Economy, 28(1), 47–71.
Brown, S. P. a, & Yucel, M. K. (2002). Energy prices and aggregate economic activity:
An interpretative survey. Quarterly Review of Economics and Finance, 42(2),
193–208.

© COPYRIG
HT UPM
147
Brown, S. P. a, Yücel, M. K., & Reserve, F. (1999). Oil prices and US aggregate
economic activity : A question of neutrality. Economic and Financial Review,
Second Quarter, Dallas, TA, Federal Reserve Bank of Dallas, pp. 16–23..
Brückner, M. (2012). Economic growth, size of the agricultural sector, and
urbanization in Africa. Journal of Urban Economics, 71(1), 26-36.
https://doi.org/10.1016/j.jue.2011.08.004
Candemir, M. (2013). Oil price movements and macroeconomic variables: Evidence
from high and upper middle income countries (Doctoral dissertation, Eastern
Mediterranean University (EMU)-Doğu Akdeniz Üniversitesi (DAÜ))..
Chao, M. C., Huang, W. H., & Jou, R. C. (2015). The asymmetric effects of gasoline
prices on public transportation use in Taiwan. Transportation Research Part
D: Transport and Environment, 41, 75-87.
Chatziantoniou, I., Filis, G., Eeckels, B., & Apostolakis, A. (2013). Oil prices , tourism
income and economic growth : A structural VAR approach for European
Mediterranean countries. Tourism Management, 36, 331–341.
Chavas, J. P. (2001). Structural change in agricultural production: Economics,
technology and policy. Handbook of Agricultural Economics, 1, 263-285.
Chen, C., & Chiou-wei, S. Z. (2009). Tourism expansion , tourism uncertainty and
economic growth : New evidence from Taiwan and Korea. Tourism
Management, 30(6), 812–818. https://doi.org/10.1016/j.tourman.2008.12.013
Chen, S. S. (2009). Oil price pass-through into inflation. Energy Economics, 31(1),
126–133.
Cheng, K. M., Kim, H., & Thompson, H. (2013). The real exchange rate and the
balance of trade in US tourism. International Review of Economics &
Finance, 25, 122-12
Collier, P., Van Der Ploeg, R., Spence, M., & Venables, A. J. (2010). Managing
resource revenues in developing economies. IMF Staff Papers, 57(1), 84–118.
https://doi.org/10.1057/imfsp.2009.16
Cologni, A., & Manera, M. (2008). Oil prices, inflation and interest rates in a structural
cointegrated VAR model for the G-7 countries. Energy Economics, 30(3),
856–888.
Copeland, B. R. (1991). Tourism, welfare and de-industrialization in a small open
economy. Economica,58(232), 515-529.
Corden, W. M. (1981). The exchange rate , monetary policy and North Sea oil : The
economic theory of the squeeze on tradeables. Oxford Economic Papers, 33,
23–46.

© COPYRIG
HT UPM
148
Corden, W. M. (1984). Booming sector and Dutch disease economics: Survey and
consolidation Oxford Economic Papers, 36(3), 359–380.
Corden, W. M., & Neary, J. P. (1982). Booming sector and deindustrialization in a
small open economy. The Economic Journal, 92(368), 825–848.
Cortés-Jiménez, I., Nowak, J. J., & Sahli, M. (2011). Mass beach tourism and
economic growth : Lessons from Tunisia. Tourism Economics, 17(3), 531–
547.
Crouch, G. I. (1992). Effect of income and price on international tourism. Annals of
Tourism Research, 19(4), 643-664.
Cunado, J., & Perez de Gracia, F. (2005). Oil prices, economic activity and inflation:
Evidence for some Asian countries. Quarterly Review of Economics and
Finance, 45(1), 65–83.
Davis, G. A. (1995). Learning to love the Dutch disease: Evidence from the mineral
economies. World Development, 23(10), 1765–1779.
De Santis, R. a. (2003). Crude oil price fluctuations and Saudi Arabia’s behaviour.
Energy Economics, 25(2), 155–173.
Demetriades, P., & Hook Law, S. (2006). Finance, institutions and economic
development. International Journal of Finance & Economics, 11(3), 245-260.
Diao, X., Hazell, P., & Thurlow, J. (2010). The role of agriculture in African
development. World Development, 38(10), 1375–1383.
Donzelli, M. (2010). The effect of low-cost air transportation on the local economy:
Evidence from Southern Italy. Journal of Air Transport Management, 16(3),
121-126.
Dritsakis, N. (2012). Tourism development and economic growth in seven
Mediterranean countries : A panel data apporoch. Tourism Economics, 18(4),
801–816.
Dülger, F., Lopcu, K., Burgaç, A., & Ballı, E. (2013). Is russia suffering from dutch
disease? Cointegration with structural break. Resources Policy, 38(4), 605–
612.
Dwyer, L., Forsyth, P., & Rao, P. (2002). Destination price competitiveness:
Exchange rate changes versus domestic inflation. Journal of Travel
Research, 40(3), 328-336.
Edwards, S., & Aoki, M. (1983). Oil export boom and Dutch-disease: A dynamic
analysis. Resource and Energy, 5(3), 219–242.
Egert, B. (2012). Dutch Disease in the post-soviet countries of Central and South-West
Asia : How contagious is it ? Journal of Asian Economics, 23(5), 571–584.

© COPYRIG
HT UPM
149
El Anshasy, A. a., & Bradley, M. D. (2012). Oil prices and the fiscal policy response
in oil-exporting countries. Journal of Policy Modeling, 34(5), 605–620.
Elbadawi, brahim A. (2005). Reviving Growth in the Arab World. Economic
Development and Cultural Change, 53(2), 293–326.
Eltony, M. N., & Al-Awadi, M. (2001). Oil price fluctuations and their impact on the
macroeconomic variables of Kuwait: A case study using a VAR model.
International Journal of Energy Research, 25(11), 939–959.
Emami, K., & Adibpour, M. (2012). Oil income shocks and economic growth in Iran.
Economic Modelling, 29(5), 1774–1779.
Esfahani, H. S., Mohaddes, K., & Pesaran, M. H. (2014). An empirical growth model
for major oil exporters. Journal of Applied Econometrics, 29(1), 1-21.
Esfahani, H. S., Mohaddes, K., & Pesaran, M. H. (2013). Oil exports and the Iranian
economy. Quarterly Review of Economics and Finance, 53(3), 221–237.
Fakhri, H. (2010). The Impact of Real Oil Price on Real Effective Exchange Rate: The
Case of Azerbaijan. DIW Berlin, German Institute for Economic
Research.Discussion Paper Series 1041, Available from:
http://www.diw.de/documents/publikationen/73/diw_01.c.359129.de/dp1041.
pdf.
Fardmanesh, M. (1991). Dutch disease economics and oil syndrome: An empirical
study. World Development, 19(6), 711–717
Farzanegan, M. R. (2011). Oil revenue shocks and government spending behavior in
Iran. Energy Economics, 33(6), 1055–1069.
https://doi.org/10.1016/j.eneco.2011.05.005
Farzanegan, M. R., & Markwardt, G. (2009). The effects of oil price shocks on the
Iranian economy. Energy Economics, 31(1), 134–151.
Favara, G. (2003). An Empirical Reassessment of the Relationship between Finance
and Growth. International Monetary Fund, (No. 3-123).
https://ssrn.com/abstract=879199
Fiess, N. & Verner, D. (2001). Intersectoral Dynamics and Economic Growth in
Ecuador, World Bank Policy Research Working Paper 2514 (Washington, DC:
The World Bank). https://doi.org/10.1596/1813-9450-2514
Filis, G., & Chatziantoniou, I. (2013). Financial and monetary policy responses to oil
price shocks: Evidence from oil-importing and oil-exporting countries. Review
of Quantitative Finance and Accounting, 42(4), 709–729
Frankel, J. A. (2010). The natural resource curse: A survey. NBER, No. 15836.
© COPYRIG
HT UPM
150
Franzese, R. J., Kam, C. D., & Jamal, A. A. (2007). Modeling and interpreting
interactive hypotheses in regression analysis. Michigan, USA: The University
of Michigan Press.
Fuinhas, J. A., Marques, A. C., & Couto, A. P. (2015). Oil rents and economic growth
in oil producing countries: evidence from a macro panel. Economic Change
and Restructuring, 48(3-4), 257-279.
Gelb, A. H. (1981). Capital-importing oil exporters: Adjustment Issues and Policy
Choices World Bank Staff Working Paper No: 475 (August), Washington,
D.C.: The World Bank. https://www.osti.gov/biblio/5233836
Gardi, C., Panagos, P., Van Liedekerke, M., Bosco, C., & De Brogniez, D. (2015).
Land take and food security: assessment of land take on the agricultural
production in Europe. Journal of Environmental Planning and Management,
58(5), 898-912.
Ghura, D., & Pattillo, C. (2012). Macroeconomic policy frameworks for resource-rich
developing countries. International Monetary Fund, Washington, DC.
Gollin, D., Parente, S. L., & Rogerson, R. (2002). The role of agriculture in
development. American Economic Review, 92(2), 160–164.
Gössling, S., Peeters, P., Ceron, J. P., Dubois, G., Patterson, T., & Richardson, R. B.
(2005). The eco-efficiency of tourism. Ecological Economics, 54(4), 417–434.
Gylfason, T. (2001). Natural resources , education , and economic development.
European Economic Review, 45(4–6), 847–859.
Gylfason, T., Herbertsson, T. T., & Zoega, G. (1999). A mixed blessing: Natural
resources and economic growth. Macroeconomic Dynamics, 3(2), 204-225.
Hafiz, M., Hanafiah, M., Fauzi, M., & Harun, M. (2010). Tourism demand in
Malaysia : A cross-sectional pool time-series analysis. International Journal
of Trade, Economics and Finance, 1(2), 80-83.
Hamilton, J. D. (1983). Oil and the macroeconomy since World War II. Journal of
Political Economy, 91(2), 228-248.
Hamilton, J. D. (1988). Are the macroeconomic effects of oil-price changes
symmetric ?.Carnegie-Rochester Conference Series on Public Policy, 28,
369–378. https://doi.org/10.1016/0167-2231(88)90031-0
Hamilton, J. D. (2009). Causes and Consequences of the Oil Shock of 2007-08.
NBER,(No.w1002)
Hamilton, J. D. (2011). Historical oil shocks . NBER. No.16790.
Hamilton, J. D. (2011). Nonlinearities and the macroeconomic effects of oil
prices. Macroeconomic Dynamics, 15(S3), 364-378.

© COPYRIG
HT UPM
151
Harberger, A. C. (1983). Dutch disease—how much sickness, how much boon?.
Resources and Energy, 5(1), 1-20..
Harding, T., & van der Ploeg, F. (2009). Is Norway’s bird-in-hand stabilization fund
prudent enough? Fiscal Reactions to Hydrocarbon Windfalls and Graying
Populations.CESifo Working Papers, (2830)
https://ssrn.com/abstract=1494895
Hasanov, F. (2013). Dutch disease and the Azerbaijan economy. Communist and Post-
Communist Studies, 46(4), 463–480.
Hausman, J. A. (1978). Specification tests in econometrics. Econometrica: Journal of
the Econometric Society, 46(6), 1251–1271.
Hausmann, R., & Rigobon, R. (2003). An alternative interpretation of the’resource
curse’: Theory and policy implications . National Bureau of Economic
Research, ((No. w9424)). (DOI): 10.3386/w9424
Hazari, B. R., & Sgro, P. M. (1995). Tourism and growth in a dynamic model of trade.
Journal of International Trade and Economic Development, 4(2), 243–252.
Hooker, M. A. (1996). This is what happened to the oil price-macroeconomy
relationship: Reply. Journal of Monetary Economics, 38(2), 295–213.
Hou, Z., Keane, J., Kennan, J., & te Velde, D. W. (2015). The oil price shock of 2014:
Drivers, impacts and policy implications.Working Paper,No. 415. London:
Overseas Development Institute
Idrisov, G., Kazakova, M., & Polbin, A. (2015). A theoretical interpretation of the oil
prices impact on economic growth in contemporary Russia ً. Russian Journal
of Economics, 1(3), 257–272.
Iimi, A. (2006). Did Botswana escape from the resource curse? IMF Working Papers,
6(138), 1-33.
https://www.imf.org/en/Publications/WP/Issues/2016/12/31/Did-Botswana-
Escape-from-the-Resource-Curse-19207
Im, K. S., Pesaran, M. H., & Shin, Y. (2003). Testing for unit roots in heterogeneous
panels. Journal of Econometrics, 115(1), 53–74.
IMF. (2008). World Economic Outlook: Financial Stress,Downturns, and Recoveries.
International Monetary Fund. Washington, DC.
https://www.bookstore.imf.org/books/title/world-economic-outlook-october-
2008
Isham, J., Woolcock, M., Pritchett, L., & Busby, G. (2005). The varieties of resource
experience: natural resource export structures and the political economy of
economic growth. The World Bank Economic Review, 19(2), 141-174.

© COPYRIG
HT UPM
152
Ismail,K., 2010. The Structural Manifestation of the ‘Dutch Disease’: The case of oil
exporting countries. IMF Working Paper WP/10/103, 1-36,
https://www.imf.org/~/media/Websites/IMF/imported-full-text-pdf. .
Iwayemi, A., & Fowowe, B. (2011). Impact of oil price shocks on selected
macroeconomic variables in Nigeria. Energy Policy, 39(2), 603–612.
Ivanov, S., & Webster, C. (2007). Measuring the impact of tourism on economic
growth. Tourism Economics, 13(3), 379-388.
Jahan-Parvar, M. R., & Mohammadi, H. (2011). Oil prices and real exchange rates in
oil-exporting countries: a bounds testing approach. The Journal of Developing
Areas, 45, 309–318.
Jbir, R., & Zouari-Ghorbel, S. (2011). Oil price and dutch disease: The Case of
Algeria. Energy Sources, Part B: Economics, Planning, and Policy, 6(3), 280–
293.
Jiménez-Rodríguez, R., & Sanchez, M. (2005). Oil price shocks and real GDP growth:
empirical evidence for some OECD countries. Applied Economics, 37(2), 201–
228.
Johansen, S. (1995). Likelihood-based inference in cointegrated vector autoregressive
models. (Oxford: Oxford University Press.
https://www.oxfordscholarship.com/view/10.1093/0198774508.001.0001/acp
rof-9780198774501
Katircioglu, S. T. (2009). Revisiting the tourism-led-growth hypothesis for Turkey
using the bounds test and Johansen approach for cointegration. Tourism
Management, 30(1), 17–20. https://doi.org/10.1016/j.tourman.2008.04.004
Kao, C. (1999). Spurious regression and residual-based tests for cointegration in panel
data. Journal of Econometrics, 90(1), 1–44.
Khatoon, S., & Mehdi, S. A. (2013). Rural indian economics–supplementing
agriculture with tourism for development. Journal of Indian Research, 1(4),
43–52.
Koranchelian, T. (2005). The equilibrium real exchange rate in a commodity exporting
country: Algeria's Experience. International Monetary Fund, IMF Working Paper,
05/135.https://www.imf.org/~/media/Websites/IMF/imported-full-text-pdf.
Korhonen, I., & Juurikkala, T. (2009). Equilibrium exchange rates in oil-exporting
countries. journal of Economics and Finance, 33(1), 71–79
Korstanje, M. E., Tzanelli, R., & Clayton, A. (2014). Brazilian World cup 2014:
Terrorism, tourism, and social conflict. Event Management, 18, 487–491.

© COPYRIG
HT UPM
153
Krugman, P. (1987). The narrow moving band, the Dutch disease, and the competitive
consequences of Mrs. Thatcher: Notes on trade in the presence of dynamic
scale economies. Journal of Development Economics, 27(1-2), 41–55.
Lama, R., & Medina, J. P. (2012). Is exchange rate stabilization an appropriate cure
for the Dutch disease. International Journal of Central Banking, 8(1), 5-46.
Lane, B. W. (2012). A time-series analysis of gasoline prices and public transportation
in US metropolitan areas. Journal of Transport Geography, 22, 221–235.
Lanquar, R. (2011). Tourism in the Mediterranean : Scenarios up to 2030. MEDPRO
Report No. 1.http://dx.doi.org/10.2139/ssrn.2000717.
Lanza A., Pigliaru F. (2000) Why are Tourism Countries Small and Fast-Growing?
In: Fossati A., Panella G. (eds) Tourism and Sustainable Economic
Development. Springer, Boston, MA. https://doi.org/10.1007/978-1-4615-
4321-3_3
Larsen, E. R. (2006). Escaping the resource curse and the dutch disease? American
Journal of Economics and Sociology, 65(3), 605–640.
Leite, C. A., & Weidmann, J. (1999). Does mother nature corrupt? Natural resources
,corruption, and economic growth IMF Working Paper WP/99/85.
http://www.imf.org/external/pubs/ft/wp/1 999/wp9985.pdf).
Levin, A., Lin, C. F., & Chu, C. S. J. (2002). Unit root tests in panel data: asymptotic
and finite-sample properties. Journal of Econometrics, 108(1), 1-24.
Liew, V. K. S. (2004). Which lag length selection criteria should we employ ?
Economics Bulletin, 3(33), 1–9
Loayza, N. V, & Rancière, R. (2006). Financial development , financial fragility, and
growth. journal of Money, Credit and Banking, 38(4), 1051–1076..
Maddala, G. S., & Wu, S. (1999). A comparative study of unit root tests with panel
data and a new simple test. Oxford Bulletin of Economics and
Statistics, 61(S1), 631-652.
Mansfeld, Y., & Winckler, O. (2007). The tourism industry as an alternative for the
GCC oil-based rentier economies. Tourism Economics, 13(3), 333–360.
Masson, S., & Petiot, R. (2009). Can the high speed rail reinforce tourism
attractiveness? The case of the high speed rail between Perpignan (France) and
Barcelona (Spain). Technovation, 29(9), 611–617.
Meade, J. E., & Russell, E. A. (1957). Wage rates, the cost of living, and the balance
of Payments. Economic Record, 33(64), 23–28.
Mehdi, S., & Reza, M. (2011). A study examining the effect of oil exports on
agricultural value added in Iran., 2(1), 10-17. Journal of Education and
Vocational Research, 2(1), 10–17.
© COPYRIG
HT UPM
154
Mehrara, M., & Mohaghegh, M. (2011). Macroeconomic dynamics in the oil
exporting countries: a panel VAR study. International Journal of Business and
Social Science, 2(21).
Mehrara, M., & Sarem, M. (2009). Effects of oil price shocks on industrial production:
evidence from some oil-exporting countries. OPEC Energy Review, 33(3–4),
170–183.
Mohammadi, H., & Jahan-Parvar, M. R. (2012). Oil prices and exchange rates in oil-
exporting countries: Evidence from TAR and M-TAR models. Journal of
Economics and Finance, 36(3), 766–779.
Moradi, M., Salehi, M., & Keivanfar, M. (2010). A study of the effect of oil price
fluctuation on industrial and agricultural products in Iran. Asian Journal on
Quality, 11(3), 303–316.
Morakabati, Y., Beavis, J., & Fletcher, J. (2014). Planning for a Qatar without oil :
Tourism and Economic Diversification , a Battle of Perceptions. Tourism
Planing and Development, 11(4), 415–43.
Mork, K. A. (1989). Oil and the macroeconomy when prices go up and down: An
extension of Hamilton's results. Journal of Political Economy, 97(3), 740-744.
Moshiri, S. (2015). Asymmetric effects of oil price shocks in oil-exporting countries:
the role of institutions. OPEC Energy Review, 39(2), 222–246.
Mundlak, Y. (2001). Production and supply. Handbook of Agricultural Economics, 1,
3-85.
Nazlioglu, S. (2011). World oil and agricultural commodity prices: Evidence from
nonlinear causality. Energy Policy, 39(5), 2935–2943.
Nazlioglu, S., & Soytas, U. (2012). Oil price, agricultural commodity prices, and the
dollar: A panel cointegration and causality analysis. Energy Economics, 34(4),
1098–1104.
Nelson, L. A., Dickey, D. A., & Smith, J. M. (2015). Estimating time series and cross
section tourism demand models : Mainland United States to Hawaii data.
Tourism Management, 32(1), 28–38.
Noland, M., & Pack, H. (2007). The Arab economies in a changing world. Peterson
Institute.
Nusair, S. A. (2016). The effects of oil price shocks on the economies of the Gulf Co-
operation Council countries: Nonlinear analysis. Energy Policy, 91, 256–267.
Ogunlesi, A. O., & Bokana, K. G. (2018). Dynamics of agricultural productivity in
Sub-Saharan Africa: A panel-ARDL model approach. Acta Universitatis
Danubius., 14(3), 148-172.

© COPYRIG
HT UPM
155
O’Sullivan, A., Rey, M. E., & Mendez, J. G. (2011). Opportunities and challenges in
the MENA Region. Arab World Competitiveness Report, 42-67.
www.oecd.org/mena/49036903.pdf
Oh, C. (2005). The contribution of tourism development to economic growth in the
Korean economy. Tourism Management, 26(1), 39–44.
Oludiran, S., Akinleye, S. O., & Ekpo, S. (2013). Oil price shocks and macroeconomic
performance in Nigeria. Economia Mexicana, 2, 565–624.
Olusi, J. O., & Olagunju, M. A. (2005). The Primary Sectors of the economy and the
Dutch disease in Nigeria. The Pakistan Development Review, 44 (2),159-175
Omgba, L. D. (2011). Oil wealth and non-oil sector performance in a developing
country: Evidence from Cameroon. Oxford Development Studies, 39(4), 487–
503.
Oomes, N., & Kalcheva, K. (2007). Diagnosing Dutch disease: does Russia have the
symptoms? International Monetary Fund. Working Paper No. 07/102.
https://www.imf.org/~/media/Websites/IMF/imported-full-text-pdf.
OPEC. (2015). World Oil Outlook. Organization of the Petroleum Exporting
Countries. www.opec.org.
Ouerfelli, C. (2008). Co-integration analysis of quarterly European tourism demand
in Tunisia. Tourism Management, 29(1), 127–137.
Oyejide, T. A. (1986). The effects of trade and exchange rate policies on agriculture
in Nigeria. Intl Food Policy Res Inst, No 55.
http://www.ifpri.org/publication/effects-trade-and-exchange-rate-policies-
agriculture-nigeria.
Papalia, R. B., & Bertarelli, S. (2013). Nonlinearities in economic growth and club
convergence. Empirical Economics, 44(3), 1171-1202.
Payne, J. E., & Mervar, A. (2010). Research note : The tourism – growth nexus in
Croatia. Tourism Economics, 16(4), 1089–1094.
Pedroni, P. (1999). Critical values for cointegration tests in heterogeneous panels with
multiple regressors. Oxford Bulletin of Economics and statistics, 61(S1), 653-
670.
Pedroni, P. (2004). Panel cointegration: asymptotic and finite sample properties of
pooled time series tests with an application to the PPP hypothesis. Econometric
Theory, 20(3), 597-625.
Pei, T. L., Shaari, Shahidan, M., & Abdul Rahim, H. (2013). Effects of oil price shocks
on the economic sectors in Malaysia. International Journal of Energy
Economics and Policy, 3(4), 360–366.
© COPYRIG
HT UPM
156
Pesaran, M. H., & Smith, R. (1995). Estimating long-run relationships from dynamic
heterogeneous panels. Journal of Econometrics, 68(1), 79–113.
Pesaran, M. H., Shin, Y., & Smith, R. J. (2001). Bounds testing approaches to the
analysis. Journal of Applied Econometrics, 16(3), 289–326
Pesaran, M. H., Shin, Y., & Smith, R. P. (1999). Heterogeneous panels Pooled Mean
Group estimation of dynamic heterogeneous panels. Journal of the American
Statistical Association, 94(446), 621–634.
Pesaran, M. H., & Shin, Y. (1998). An autoregressive distributed lag modelling
approach to cointegration analysis. Econometrics and Economic Theory in 20th
Century : the Ragnar Frisch Centennial Symposium. Cambridge University
Press, Cambridge,371-413. https://doi.org/10.1017/CCOL521633230.011
Pesaran, M. H. (1997). The role of economic theory modelling the long run. The
Economic Journal, 107(440), 178–191.
Phillips, P. C., & Hansen, B. E. (1990). Statistical inference in instrumental variables
regression with I (1) processes. The Review of Economic Studies, 57(1), 99–
125.
Pinto, B. (1987). Nigeria during and after the oil boom: A policy comparison with
Indonesia. World Bank Economic Review, 1(3), 419–445.
Quadri, D. L., & Zheng, T. (2010). A revisit to the impact of exchange rates on tourism
demand : The case of Italy. The Journal of Hospitality Financial Management,
18(2), 47–60.
Ramey, G., & Ramey, V. A. (1995). Cross-country evidence on the link between
volatility and growth. American Economic Association, 85(5), 1138–1151.
Richards, G. (2011). Tourism development trajectories- from culture to creativity ?
Tourism & Management Studies, 6, 9–15.
Robert M . Solow. (1956). A contribution to the theory of economic growth source :
The Quarterly Journal of Economics, 70(1), 65–94.
Rodrik, D. (2008). The real exchange rate and economic growth. Brookings Papers
on Economic Activity, (2), 365-412. 10.1353/eca.0.0020.
Rosegrant, M. W., Kasryno, F., & Perez, N. D. (1998). Output response to prices and
public investment in agriculture: Indonesian food crops. Journal of
Development Economics, 55(2), 333–352.
Rudd, C. D. (1996). An empirical analysis of Dutch disease : Developing and
developed countries. John Wesley Powell Student Research, 7th Annual JWP
Conference. http://digitalcommons.iwu.edu/jwprc/1996/posters/16

© COPYRIG
HT UPM
157
Sachs, J. D., & Warner, A. M. (1995). Natural resource abundance and economic
growth. National Bureau of Economic NBER Working Paper No. w5398.
https://ssrn.com/abstract=225459.
Sachs, J. D., & Warner, A. M. (2001). The curse of natural resources. European
Economic Review, 45(4), 827–838.
Sakai, M. (2006), Public sector investment in tourism infrastructure, International
Handbook on the Economics of Tourism, Edward Elgar Publishing Ltd,
Cheltenham, pp 266–279.
Samargandi, N., Fidrmuc, J., & Ghosh, S. (2015). Is the relationship between financial
development and economic growth monotonic? Evidence from a sample of
middle-income countries. World Development, 68, 66-81.
Santana-Gallego, M., Ledesma-Rodríguez, F. J., & Pérez-Rodríguez, J. V. (2010).
Exchange rate regimes and tourism. Tourism Economics, 16(1), 25–43.
Sarmidi, T., Law, S. H., & Jafari, Y. (2014). Resource curse : New evidence on the
role of institutions. International Economic Journal, 28(1), 191–206.
Seghir, G. M., Mostéfa, B., Abbes, S. M., & Zakarya, G. Y. (2015). Tourism spending-
economic growth causality in 49 countries: A dynamic panel data approach.
Procedia Economics and Finance, 23, 1613-1623.
https://doi.org/10.1016/S2212-5671(15)00402-5
Sekumade, a B. (2009). The effects of petroleum dependency on agricultural trade in
Nigeria: An error correlation modeling (ECM) approach. Scientific Research
and Essay, 4(11), 1385–1391.
Seo, J. H., Park, S. Y., & Yu, L. (2009). The analysis of the relationships of Korean
outbound tourism demand: Jeju Island and three international
destinations.Tourism Management, 30(4): 530-543
Shin, Y. (2014). Dynamic Panel Data Workshop, University of Melbourne.
Spatafora, N., & Stavrev, E. (2003). The equilibrium real exchange rate in a
commodity exporting country: The case of Russia. IMF Working Paper No.
03/93, 1-22. https://www.imf.org/~/media/Websites/IMF/imported-full-text-
pdf.
Steinnes, D. N. (1988). A statistical analysis of the impact of oil price shocks on
tourism. Journal of Travel Research, 27(2), 39–42.
Suleiman M. (2013). Oil demand , oil prices , economic growth and the resource
curse : An empirical analysis. Thesis submitted to Surrey Energy Economics
Centre (SEEC),University of Surrey. www.seec.surrey.ac.uk

© COPYRIG
HT UPM
158
Tang, C. F., & Abosedra, S. (2014). The impacts of tourism , energy consumption and
political instability on economic growth in the MENA countries. Energy
Policy, 68(1), 458–464.
Tang, C. H., & Shawn Jang, S. (2009). The tourism – economy causality in the United
States : A sub-industry level examination. Tourism Management, 30(4), 553–
558. https://doi.org/10.1016/j.tourman.2008.09.009
Tang, J., Sriboonchitta, S., Ramos, V., & Wong, W. K. (2016). Modelling dependence
between tourism demand and exchange rate using the copula-based GARCH
model. Current Issues in Tourism, 19(9), 876–894.
Tazhibayeva, K., & Ter-Martirosyan, A. (2008). Fiscal policy and economic cycles in
oil-exporting countries. IMF Working Paper No. 08/253.
https://www.imf.org/~/media/Websites/IMF/imported-full-text-pdf.
Van Wijnbergen, S. (1984). Inflation , employment , and the dutch disease in oil-
exporting countries : A Short-Run Disequilibrium Analysis. The Quarterly
Journal of Economics, 99(2), 233–250.
Venables, A. J. (2016). Using natural resources for development : Why Has It Proven
So Difficult ? Journal of Economic Perspectives, 30(1), 161–184.
Vita, G. De. (2014). The long-run impact of exchange rate regimes on international
tourism fl ows. Tourism Management, 45, 226–233.
Vita, G. De, & Kyaw, K. S. (2013). Role of the exchange rate in tourism demand.
Annals of Tourism Research, 43, 624–627.
Watts, M. (1984). State , oil , and accumulation ; from boom to crisis. Environment
and Planning D: Society and Space, 2(4), 403–428.
Webber, A. G. (2001). Exchange rate volatility and cointegration in tourism demand.
Journal of Travel Research, 39(4), 398–405.
Wijnbergen, S. van. (1984). The ` Dutch Disease ’: A Disease After All ? The
Economic Journal, 94(373), 41–55.
Williams, A. (2011). Shining a light on the resource curse : An empirical analysis of
the relationship between natural resources , transparency , and economic
growth. World Development, 39(4), 490–505.
Williams, J. L. (2011). Oil price history and analysis. WTRG Economics.
http://www.wtrg.com/prices.htm
Yeoman, I., Lennon, J. J., Blake, A., Galt, M., Greenwood, C., & Mcmahon-beattie,
U. (2007). Oil depletion : What does this mean for Scottish tourism ? Tourism
Management, 28(5), 1354–1365.
Younis, A. Ahmed. (2014). Role of the tourism sector in the Iraqi. (Unpublished
doctoral dissertation). Univirsti Putra Malaysia, Selangor Malaysia.

![SENARAI PENGEDAR UNTUK SYARAT KHAS KE ATAS … · Zuellig Pharma Sdn Bhd No. 15, Persiaran Pasak Bumi, Kawasan Perindustrian Bukit Jelutong, 40150, Shah Alam, Selangor [Pengeksport]](https://img.pdfslide.net/doc/110x75/5b149a747f8b9a347c8def96/senarai-pengedar-untuk-syarat-khas-ke-atas-zuellig-pharma-sdn-bhd-no-15-persiaran.jpg)


![SENARAI PENGEDAR UNTUK SYARAT KHAS KE ATAS LESEN A … · No. 15, Persiaran Pasak Bumi, Kawasan Perindustrian Bukit Jelutong, 40150, Shah Alam, Selangor [Pengeksport] 2. Clarinase](https://img.pdfslide.net/doc/110x75/5e0e6bb5263bbb7244344ea4/senarai-pengedar-untuk-syarat-khas-ke-atas-lesen-a-no-15-persiaran-pasak-bumi.jpg)