Embed Size (px)
Citation preview

ISO-NE PUBLIC
A G E N D A I T E M 2 . 0 | P S P C M E E T I N G N O . 3 3 1
J U L Y 2 6 , 2 0 1 8 | W E S T B O R O U G H , M A
Peter Wong & Fei Zeng( 4 1 3 ) 5 4 0 - 4 2 1 2 | F Z E N G @ I S O - N E . C O M
Revision to Slide 20
Impact of Proposed Installed Capacity Requirement (ICR) Assumptions Changes on ICR Values - Revised

ISO-NE PUBLIC
2
Background
• For each Forward Capacity Auction (FCA), values are calculated to determine ICR and related values, Capacity Zone determinations and values used in other Forward Capacity Market (FCM) applications
• These include values calculated with a probabilistic model– ICR and Net ICR (NICR)– Local Resource Adequacy Requirement (LRA)(an input into Local Sourcing
Requirement (LSR))– Maximum Capacity Limit (MCL)– Marginal Reliability Impact (MRI) Demand Curve– Reserve deficiency hours– Tie benefits
• Also include values calculated with a deterministic transmission reliability screen– Transmission Security Analysis (TSA) Requirement (also an input into LSR)– Capacity Zone Trigger Analysis– De-list Review Analysis

ISO-NE PUBLIC
3
Background, cont.
• ISO-NE has identified three specific changes to the assumptions used to calculate these values based on stakeholder input and changing system conditions– Probabilistic model assumptions
• A change in the assumed level of 10-Minute Operating Reserves maintained before load shedding from 200 MW to 700 MW
• An adjustment to the amount of load relief assumed in ICR calculations due to 5% voltage reduction from 1.5% to 1.0%*
– Deterministic model assumptions• A change in the assumed 20% derate of peaking generation resources to
the individual resource Equivalent Forced Outage Rate – Demand (EFORd)*
*Proposed assumption changes requiring Tariff changes. For more information, see March 13, 2018 Reliability Committee presentation at: https://www.iso-ne.com/static-assets/documents/2018/03/a2_assessment_of_icr_lsr_and_discussion_of_the_218_long_term_load_forecast.pptx

ISO-NE PUBLIC
4
Background, cont.
• In addition, ISO-NE has proposed a methodology to model behind-the-meter photovoltaic (BTM PV) with an uncertainty component in the probabilistic ICR calculations– Modeling the uncertainty associated with the correlation between the
hourly load and the hourly BTM PV output by using a 7-day window from which the daily shape of BTM PV output will be randomly selected
– Benchmarked impacts show an approximate 30 MW increase in ICR; See the May 29, 2018 PSPC presentation for more details:
https://www.iso-ne.com/static-assets/documents/2018/05/a5_pspc_btmpv_uncrtnty_mdling_05292018.pdf
ISO-NE PUBLIC
5
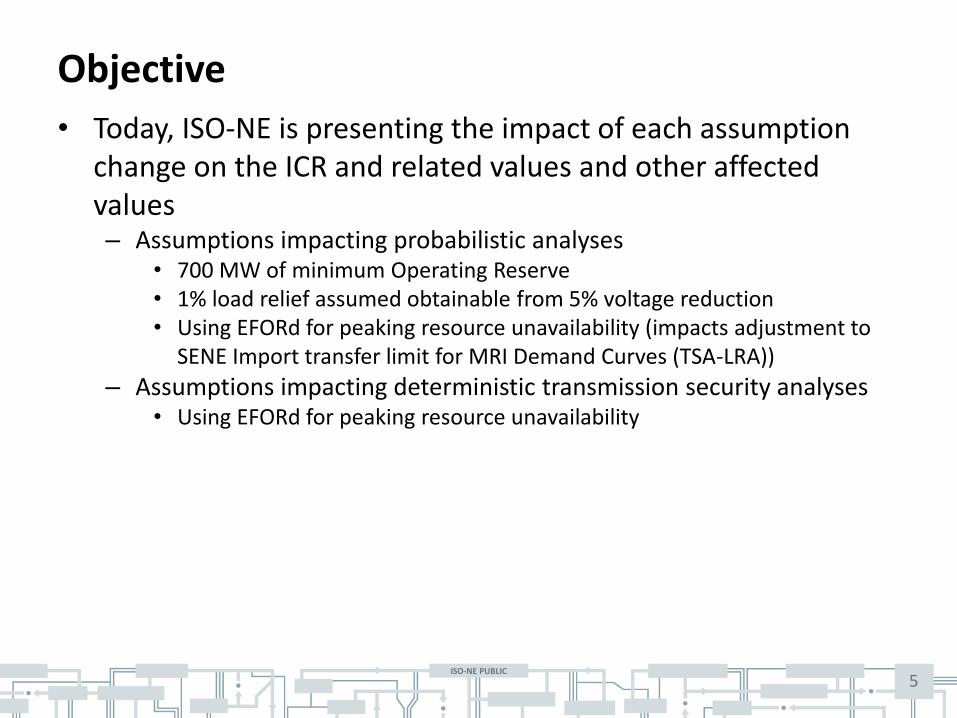
Objective
• Today, ISO-NE is presenting the impact of each assumption change on the ICR and related values and other affected values– Assumptions impacting probabilistic analyses
• 700 MW of minimum Operating Reserve• 1% load relief assumed obtainable from 5% voltage reduction• Using EFORd for peaking resource unavailability (impacts adjustment to
SENE Import transfer limit for MRI Demand Curves (TSA-LRA))
– Assumptions impacting deterministic transmission security analyses• Using EFORd for peaking resource unavailability

ISO-NE PUBLIC
6
Methodology
• Impacts were benchmarked with the twelfth Forward Capacity Auction (FCA 12) ICR model and the 2017 Capacity, Energy, Load and Transmission Report (CELT Report) load forecast– All proposed assumption changes were evaluated
• High level impacts on FCA 13 ICR values are also presented using the preliminary FCA 13 ICR model and the 2018 CELT load forecast– 700 MW of minimum Operating Reserve modeled– BTM PV uncertainty is modeled with the 7-day window

ISO-NE PUBLIC
Summary of Quantified Impacts from Proposed ICR Assumption Changes
7
Scenario Evaluated
Impacts on other ICR Inputs (MW) Impacts on ICR Related Values and Demand Curves (MW)
Tie Benefits
Adj to SENE Import Limit
(TSA-LRA)NetICR
SENE TSA
SENE LRA
NNEMCL
System and Zonal Demand
Curves
Sys Reserve Deficiency
Hours
Base (FCA 12) 2,020 -313 33,725 10,018 9,705 8,790
Sys comparison slides 8-11
SENE comparisonslides 12-15
NNE comparisonslides 16-19
S1 and S2 comparison on slide 20
S3 has no impacts
S1: minimum Operating Reserve changed from 200 MW to 700 MW 1,960 -88 34,275 10,018 9,930 8,870
S2: S1 & “assumed load relief from 5% voltage reduction changed from 1.5% to 1.0%” 1,940 -23 34,435 10,018 9,995 8,890
S3: S2 & “using EFORdfor peaking resource unavailability” 1,940
0(TSA < LRA) 34,435 9,914 9,995 8,890

ISO-NE PUBLIC
System MRI Curves Comparison (FCA 12)
8
0.0
0.2
0.4
0.6
0.8
1.0
1.2
1.4
1.6
1.8
2.0
2.2
2.4
31,500 32,500 33,500 34,500 35,500 36,500
-Mar
gina
l Rel
iabi
lity
Impa
ct (h
ours
/yea
r)
System Capacity (MW)FCA #12 700 MW Min Rsrv 700 MW Min Rsrv + 1% VR
Net ICR

ISO-NE PUBLIC
System MRI Curves Comparison (FCA 12)- Relative to Net ICR
9
0.0
0.2
0.4
0.6
0.8
1.0
1.2
1.4
1.6
1.8
2.0
2.2
2.4
-2,500 -1,500 -500 500 1,500 2,500
-M
argi
nal
Re
liab
ility
Imp
act
(ho
urs
/ye
ar)
System Capacity Relative to Net ICR (MW)
FCA #12 700 MW Min Rsrv 700 MW Min Rsrv + 1% VR
Net ICR

ISO-NE PUBLIC
System Price Demand Curves Comparison (FCA 12)
10
$0
$2
$4
$6
$8
$10
$12
$14
32,000 33,000 34,000 35,000 36,000 37,000
Pri
ce (
$/k
W-m
on
th)
System Capacity (MW)
FCA #12 700 MW Min Rsrv 700 MW Min Rsrv + 1% VR
Net ICR

ISO-NE PUBLIC
System Price Demand Curves Comparison (FCA 12)- Relative to Net ICR
11
$0
$2
$4
$6
$8
$10
$12
$14
-2,000 -1,500 -1,000 -500 0 500 1,000 1,500 2,000 2,500
Pri
ce (
$/k
W-m
on
th)
System Capacity Relative to Net ICR (MW)
FCA #12 700 MW Min Rsrv 700 MW Min Rsrv + 1% VR
Net ICR

ISO-NE PUBLIC
SENE MRI Curves Comparison (FCA 12)
12
0.0
0.2
0.4
0.6
0.8
1.0
1.2
1.4
1.6
1.8
2.0
2.2
2.4
8,500 9,000 9,500 10,000 10,500 11,000
-Mar
gina
l Rel
iabi
lity
Impa
ct (h
ours
/yea
r)
SENE Capacity (MW)
FCA #12 700 MW Min Rsrv
700 MW Min Rsrv + 1% VR 700 MW Min Rsrv + 1% VR + EFORd for Peaking
LSR

ISO-NE PUBLIC
SENE MRI Curves Comparison (FCA 12)- Relative to LSR
13
0.0
0.2
0.4
0.6
0.8
1.0
1.2
1.4
1.6
1.8
-1,500 -1,000 -500 0 500 1,000
-M
argi
nal
Re
liab
ility
Imp
act
(ho
urs
/ye
ar)
SENE Capacity Relative to LSR (MW)
FCA #12 700 MW Min Rsrv
700 MW Min Rsrv + 1% VR 700 MW Min Rsrv + 1%VR + EFORd for Peaking
LSR

ISO-NE PUBLIC
SENE Price Demand Curves Comparison (FCA 12)
14
$0
$2
$4
$6
$8
$10
$12
$14
8,500 9,000 9,500 10,000 10,500 11,000
Pri
ce (
$/k
W-m
on
th)
SENE Capacity (MW)
FCA #12 700 MW Min Rsrv
700 MW Min Rsrv + 1% VR 700 MW Min Rsrv + 1%VR + EFORd for Peaking
LSR

ISO-NE PUBLIC
SENE Price Demand Curves Comparison (FCA 12)- Relative to LSR
15
$0
$2
$4
$6
$8
$10
$12
$14
-1,500 -1,000 -500 0 500 1,000
Pri
ce (
$/k
W-m
on
th)
SENE Capacity Relative to LSR (MW)
FCA #12700 MW Min Rsrv
LSR

ISO-NE PUBLIC
NNE MRI Curves Comparison (FCA 12)
16
-1.0
-0.8
-0.6
-0.4
-0.2
0.0
8,000 8,500 9,000 9,500 10,000 10,500-M
argi
nal R
elia
bilit
y Im
pact
(hou
rs/y
ear)
NNE Capacity (MW)
FCA #12 700 MW Min Rsrv 700 MW Min Rsrv + 1% VR
MCL

ISO-NE PUBLIC
NNE MRI Curves Comparison (FCA 12)- Relative to MCL
17
-0.8
-0.6
-0.4
-0.2
0.0
-1,000 -500 0 500 1,000 1,500
-M
argi
nal
Re
liab
ility
Imp
act
(ho
urs
/ye
ar)
NNE Capacity Relative to MCL (MW)
FCA #12 700 MW Min Rsrv 700 MW Min Rsrv + 1% VR

ISO-NE PUBLIC
NNE Price Demand Curves Comparison (FCA 12)
18
-$12 + P_SYS
-$10 + P_SYS
-$8 + P_SYS
-$6 + P_SYS
-$4 + P_SYS
-$2 + P_SYS
$0 + P_SYS
8,000 8,500 9,000 9,500 10,000 10,500P
rice
($
/kW
-mo
nth
)
NNE Capacity (MW)
FCA #12 700 MW Min Rsrv 700 MW Min Rsrv + 1% VR
MCL

ISO-NE PUBLIC
NNE Price Demand Curves Comparison (FCA 12)- Relative to MCL
19
-$12 + P_SYS
-$10 + P_SYS
-$8 + P_SYS
-$6 + P_SYS
-$4 + P_SYS
-$2 + P_SYS
$0 + P_SYS
-1,000 -500 0 500 1,000 1,500P
rice
($
/kW
-mo
nth
)
NNE Capacity Relative to MCL (MW)
FCA #12 700 MW Min Rsrv 700 MW Min Rsrv + 1% VR

ISO-NE PUBLIC
Impacts on Expected Reserve Deficiency Hours (FCA 12) (Revised)
20
0
4
8
12
16
20
24
-1600 -1200 -800 -400 0 400 800 1200 1600 2000 2400 2800 3200
Exp
ect
ed
Re
serv
e D
efic
ien
cy H
ou
rs A
nn
ual
ly
ICRICR + ICR + ICR + ICR + ICR + ICR + ICR + ICR +ICR ICR ICR ICR
FCA 12 - 200 MW Min Rsrv and 1.5% VR
700 MW Min Rsrv
net
700 MW Min Rsrv + 1% VR

ISO-NE PUBLIC
21
Impacts on Preliminary FCA 13 ICR Values
• ISO-NE looked at the impacts of the 700 MW minimum Operating Reserve and BTM PV uncertainty assumptions on preliminary FCA 13 ICR Values– NICR shows little change from the value calculated for FCA 12 (33,725 MW)
• When coupled with the lower 2018 CELT load forecast for 2022-2023 (629 MW decrease for the gross load forecast versus the 2017 CELT), the impacts of the 700 MW minimum Operating Reserve and BTM PV uncertainty assumptions are effectively netted out
– SENE LRA increases approximately 160 MW over the value calculated for FCA 12 (9,705 MW)• The 2018 CELT gross load forecast is lower by approximately 70 MW for SENE
versus the 2017 CELT and the impact of the 700 MW minimum Operating Reserve assumption is an increase of approximately 225 MW
– NNE MCL decreases approximately 230 MW versus the value calculated for FCA 12 (8,790 MW)• The 2018 CELT gross load forecast is lower by approximately 270 MW for NNE
versus the 2017 CELT and the impact of 700 MW minimum Operating Reserve assumption is an increase of approximately 80 MW

ISO-NE PUBLIC
22
Impacts of Peaking Resource Availability Assumption on Capacity Zone Trigger Analyses
• For import-constrained Capacity Zones, updating the assumed availability for peaking resources in the Capacity Zone Trigger Analysis from the 20% derate to using the individual resource EFORd will make a Capacity Zone less likely to trigger– Since the average EFORd is less than 20% it has the effect of counting
more MWs from existing peaking generation in the zone formation objective criteria calculation
• Would not have impacted the outcome of the FCA 13 zonal formation analysis– SENE would still trigger because the delta between the requirement and
the existing capacity was significant – TSA “Requirement” (9,431 MW) > Existing Capacity (8,396 MW)– See May 29, 2018 PSPC presentation for more information:
https://www.iso-ne.com/static-assets/documents/2018/05/a2_pspc_fca13_cap_zonal_05292018.pdf

ISO-NE PUBLIC
23
Impact of Peaking Resource Availability Assumption on De-list Analyses
• In the FCA 12 analysis, 20% of the peaking generation resources were assumed unavailable– Approximately 45 MW of peaking generation resources in the NEMA/Boston Load
Zone were assumed unavailable out of 225 MW
• Calculating this amount based on the peaking generation’s EFORd, would have had no impact on the outcome– This would have resulted in assuming 28 MW out of 225 MW
• The transmission operability analysis focuses on local reliability issues– PP-10, Appendix A, Resources Forced Outage Assumptions: “Depending on the
type of analysis, these will be applied by either modeling the Resource’s Capacity at a reduced amount or by modeling equivalent discrete outage(s).”
– Because the peaking generation is dispersed across an area, under most situations the peaking generation unavailability factor will not have a significant impact on the reliability need
• To be consistent with changes made in the TSA calculations and the Needs Assessment Studies, changes will be made for FCA 14– ISO-NE is researching the best implementation for de-list analyses

ISO-NE PUBLIC
• BTM PV = Behind the meter photovoltaic
• CELT = Capacity, Energy, Loads, and Transmission Report
• EFORd = Equivalent Forced Outage Rate - Demand
• FCA = Forward Capacity Auction
• FCM = Forward Capacity Market
• GE MARS = General Electric Multi-Area Reliability Simulation Program
• ICR = Installed Capacity Requirement
• LRA = Local Resource Adequacy Requirement
• LSR = Local Sourcing Requirement
• MCL = Maximum Capacity Limit
24
Acronyms Used in this Presentation • MRI = Marginal Reliability Impact
• NICR = Net ICR
• NNE = Northern New England
• PP-10 = Planning Procedure No. 10
• PV = Photovoltaic
• SENE = Southeast New England
• TSA = Transmission Security Analysis

ISO-NE PUBLIC25