Embed Size (px)
Citation preview

Impact of the economic recession on
the pharmaceutical sector
February 2010
I.M. Buysse (UU)
Supervised by:
R.O. Laing (WHO)
A.K. Mantel (UU)
WHO COLLABORATING CENTRE FOR PHARMACOEPIDEMIOLOGY & PHARMACEUTICAL
POLICY ANALYSIS

Impact of the economic recession on the pharmaceutical sector
Ta
ble
of
con
ten
ts
2
Table of contents
Executive summary ................................................................................................................................. 3
Introduction ............................................................................................................................................ 6
Background ............................................................................................................................................. 8
History of recessions ............................................................................................................................................................. 8
Asian Crisis 1997-2000 .......................................................................................................................................................... 9
Economic crisis 2008-2009 .................................................................................................................................................. 12
WHO involvement in assessing the impact of the recession .............................................................................................. 14
Hypotheses ......................................................................................................................................................................... 15
Methods ................................................................................................................................................ 16
IMS data collection ............................................................................................................................................................. 16
Provision of indexed data ................................................................................................................................................... 18
Graphical transformation methods..................................................................................................................................... 18
Economic indicators ............................................................................................................................................................ 19
Shift from private to public sector ...................................................................................................................................... 19
Country selection ................................................................................................................................................................ 19
Impact of the recession on specific groups and individual medicines ................................................................................ 20
Results ................................................................................................................................................... 22
Overall pharmaceutical consumption ................................................................................................................................. 22
Consumption of medicines for acute and chronic indications ............................................................................................ 26
Consumption of original & licensed brands and others brands & unbranded medicines ................................................... 29
Price per IMS Standard Unit ................................................................................................................................................ 32
Pharmaceutical expenditure ............................................................................................................................................... 35
Shift from private to public sector ...................................................................................................................................... 37
Impact of the recession on specific groups and individual medicines ................................................................................ 39
Discussion.............................................................................................................................................. 47
Conclusion ........................................................................................................................................................................... 51
References: ........................................................................................................................................... 52
Annexes ................................................................................................................................................. 54

Impact of the economic recession on the pharmaceutical sector
Exe
cuti
ve s
um
ma
ry
3
Executive summary
Introduction
The global financial crisis which started in 2008 may have considerable impact on governments’
budgets and the available funding for health services. Past economic recessions (especially the ‘97
Asian financial crisis) have shown that the impact on public health can be severe. At a high level
meeting in January 2009 WHO was requested to investigate the impact of the current economic
recession on global health. As part of this investigation a programme was established which focused
on the impact of the global economic crisis on the pharmaceutical sector.
The goal of this study was to assess the impact of global recession on consumption of medicines and
pharmaceutical expenditures and prices. A secondary objective was to investigate which medicines
were affected the most and the least by the recession in those countries that showed a clear decline
in medicines consumption.
Methods
IMS Health provided indexed data for pharmaceutical consumption, expenditures and prices in 84
countries from the first quarter of 2007 (Q1 07) until the last quarter of 2009 (Q4 09). Changes in
medicines consumption, pharmaceutical expenditure and prices over time (compared to the first
quarter of 2008 (Q1 08); the last quarter before the recession) were assessed per WHO region (AFR,
AMR, EMR, EUR, SEAR and WPR) and World Bank income category (high, upper middle, lower middle
and low income countries). Linear regression analysis was used to establish a potential relationship
between a decline in GDP and pharmaceutical consumption in the European region. The
consumption of medicines was subdivided into medicines for acute and chronic indications to
examine if there was a difference in development of consumption between these two categories. To
investigate a shift from original & licensed brands to other brands & unbranded medicines the
consumption patterns of both categories were compared.
A potential relationship between a decline in GDP and an increase in pharmaceutical prices was
assessed by linear regression as well.
A shift in pharmaceutical consumption from the private sector to the public sector was investigated
in four countries where data for both private and public sector were available.
Four countries were selected for further analysis based on the observed decline in medicines
consumption: Estonia, Latvia, Lithuania, and Romania. Poland was hardly affected by the global
recession and was thus selected as a comparator. For these five countries data was retrieved on the
volume of different medicine groups (EphMRA ATC 2 level). First a Pareto analysis was performed to
identify 30% of medicine groups which accounted for 80% of total consumption. The periods
Q4 07 + Q1 08 and Q4 08 + Q1 09 were compared as a period before and period during the economic
recession, respectively, to detect medicine groups which declined the most. Medicine groups which
declined in three of the four selected countries and not in Poland were considered to be of interest.
Of these medicine groups data was gathered at therapeutic groups (EphMRA ATC 3 level). The same
analyses were used to select categories which declined the most and had a possible negative effect
on public health. Of these categories data on consumption volume on product level (EphMRA ATC 4)
was used for more detailed analyses of changes in volume of consumption.
Impact of the economic recession on the pharmaceutical sector
Exe
cuti
ve s
um
ma
ry
4
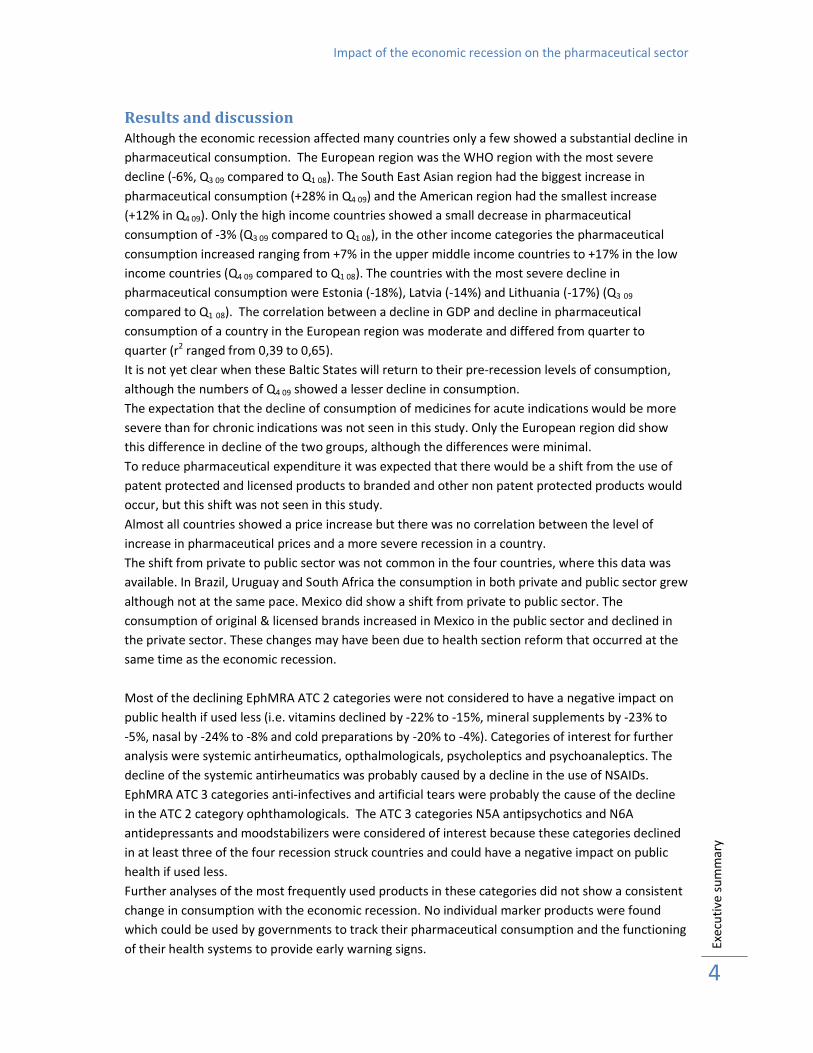
Results and discussion
Although the economic recession affected many countries only a few showed a substantial decline in
pharmaceutical consumption. The European region was the WHO region with the most severe
decline (-6%, Q3 09 compared to Q1 08). The South East Asian region had the biggest increase in
pharmaceutical consumption (+28% in Q4 09) and the American region had the smallest increase
(+12% in Q4 09). Only the high income countries showed a small decrease in pharmaceutical
consumption of -3% (Q3 09 compared to Q1 08), in the other income categories the pharmaceutical
consumption increased ranging from +7% in the upper middle income countries to +17% in the low
income countries (Q4 09 compared to Q1 08). The countries with the most severe decline in
pharmaceutical consumption were Estonia (-18%), Latvia (-14%) and Lithuania (-17%) (Q3 09
compared to Q1 08). The correlation between a decline in GDP and decline in pharmaceutical
consumption of a country in the European region was moderate and differed from quarter to
quarter (r2 ranged from 0,39 to 0,65).
It is not yet clear when these Baltic States will return to their pre-recession levels of consumption,
although the numbers of Q4 09 showed a lesser decline in consumption.
The expectation that the decline of consumption of medicines for acute indications would be more
severe than for chronic indications was not seen in this study. Only the European region did show
this difference in decline of the two groups, although the differences were minimal.
To reduce pharmaceutical expenditure it was expected that there would be a shift from the use of
patent protected and licensed products to branded and other non patent protected products would
occur, but this shift was not seen in this study.
Almost all countries showed a price increase but there was no correlation between the level of
increase in pharmaceutical prices and a more severe recession in a country.
The shift from private to public sector was not common in the four countries, where this data was
available. In Brazil, Uruguay and South Africa the consumption in both private and public sector grew
although not at the same pace. Mexico did show a shift from private to public sector. The
consumption of original & licensed brands increased in Mexico in the public sector and declined in
the private sector. These changes may have been due to health section reform that occurred at the
same time as the economic recession.
Most of the declining EphMRA ATC 2 categories were not considered to have a negative impact on
public health if used less (i.e. vitamins declined by -22% to -15%, mineral supplements by -23% to
-5%, nasal by -24% to -8% and cold preparations by -20% to -4%). Categories of interest for further
analysis were systemic antirheumatics, opthalmologicals, psycholeptics and psychoanaleptics. The
decline of the systemic antirheumatics was probably caused by a decline in the use of NSAIDs.
EphMRA ATC 3 categories anti-infectives and artificial tears were probably the cause of the decline
in the ATC 2 category ophthamologicals. The ATC 3 categories N5A antipsychotics and N6A
antidepressants and moodstabilizers were considered of interest because these categories declined
in at least three of the four recession struck countries and could have a negative impact on public
health if used less.
Further analyses of the most frequently used products in these categories did not show a consistent
change in consumption with the economic recession. No individual marker products were found
which could be used by governments to track their pharmaceutical consumption and the functioning
of their health systems to provide early warning signs.

Impact of the economic recession on the pharmaceutical sector
Exe
cuti
ve s
um
ma
ry
5
The time span of this study was limited to one year before and two years after the recession. Many
countries were already beginning to recover from the economic recession in 2010 and the value of
this study for those recovered countries as a measure of the impact of the economic crisis on the
pharmaceutical sector is thus limited.
However there may be more to learn from this recession which could guide future policy responses
to future recessions. For example some countries experienced severe declines in GDP but did not
show any decline in pharmaceutical consumption.
Conclusions
The economic recession which began in 2008 has had a mixed effect on pharmaceutical
consumption, expenditures and prices. The largest changes have occurred in high income countries
and in Europe. On country level, particulary the Baltic States showed large changes in their
pharmaceutical consumption, expenditure and prices.
No consistent pattern in the decline of consumption of particulair classes or individual medicines
were seen.
This recession provides an opportunity to identify which policy approaches most effectively
prevented or contributed to declines in pharmaceutical consumption.

Impact of the economic recession on the pharmaceutical sector
Intr
od
uct
ion
6
Introduction With the collapse of the housing market in the USA and parts of Europe in 2007 the world entered a
financial crisis which lasted at least through the years 2008 and 2009. Depending on the country
governments adjusted their budgets, which had considerable impact on the available funding to pay
for health services.(1-3) In the Organisation for Economic Cooperation and Development (OECD)
countries the average amount spend on healthcare before the recession was about 9% of the gross
domestic product (GDP), ranging from 6% in Korea, Mexico and Poland to 15,3% in the USA
(numbers of 2005).(4) In a recession governments may choose to lower their health care budgets.
Since medicines or pharmaceuticals are a substantial part of the health care budget world wide
(around 17% in OECD countries) it is likely that governments may take measures to reduce these
costs. As a consequence patients may find themselves unable to pay for their health services.
It is hard to gauge the implications of the recession on people's health. Experience from past
recessions has shown that the impact can be severe. (5) Stukler et al. showed that suicides and
homicides rose among working-age men and women when unemployment rose rapidly during times
of recession in Europe. A one percent increase in unemployment caused an increase in suicides of
0,79%. (6) An increase in underweight rates among primary school children and low birth weight
were observed during the crisis in Thailand.(7) In Mexico mortality among elderly and children was
5-7% higher during the crisis of 1995-1996 when compared to non-crisis years. According to the
authors this increase is most likely related to the magnitude of economic crisis and a reduction in
public sector medical services. (8) These are some examples of the possible impact of an economic
crisis on public health.
At the 2009 Executive Board meeting held in January 2009, WHO was requested to investigate the
impact of the current recession on health. (9) As part of this investigation, a programme has been
established which focuses on the impact of the global economic crisis on the consumption,
expenditure and prices of medicines.(9) This present report will address the impact of the economic
recession on the pharmaceutical sector from the beginning of 2007 to the end of 2009.
In this report other economic recessions during the twentieth century will be described, beginning
with the Great Depression in 1930’s, to put the 2008-2009 economic crisis in perspective. The Asian
Crisis in 1997 was the first crisis where the impact of a recession on public health was assessed.
Therefore this crisis will be highlighted. We will also describe the development of the present
economic crisis. We will highlight some policy changes with respect to public health in countries
severely affected by the economic recession, like Estonia, Latvia and Lithuania.
After this background section we will describe the data and methods used for analysing the changes
in pharmaceutical consumption in relation to the economic situation. Data on pharmaceutical
consumption, expenditure and prices was provided by IMS Health for 84 countries for each quarter
in the period 2007-2009.(10) The results of these analyses will be presented in the results section.
First we will present the changes in pharmaceutical consumption in different areas over the world
where we will look in more detail at countries with interesting changes in their consumption pattern.
The consumption divided in acute and chronic indication and in original & licensed brands and other
brands & unbranded medicines will be investigated to see if there is a different effect of the

Impact of the economic recession on the pharmaceutical sector
Intr
od
uct
ion
7
economic recession on the consumption of these different categories. We will also focus on
pharmaceutical expenditure and prices to see if these were affected by the crisis. In countries with a
clear decline in consumption we will look in more detail to the pharmaceutical consumption at
different ATC levels (Anatomic therapeutic classification) and we will try to identify marker products
which could predict a decline in pharmaceutical consumption in times of economic recession. These
marker products could thus act as sentinel products.
A shift was expected from the use of private to public health facilities because they are less
expensive. Data of four countries will be analysed to detect such a shift.
In the discussion this study will be compared to other studies carried out especially those regarding
the Asian Financial crisis. Some of the implications for (pharmaceutical) policy and public health will
be given and finally some recommendations for further research will be made.
The purpose of this report is to provide an overview of the changes in pharmaceutical consumption,
expenditure and prices for different regions in the world and some observed changes will be
highlighted in more detail. This report provides information that can be used by policy makers,
development planners and pharmaceutical experts to guide their responses in addressing the
present recession and in monitoring a next recession.

Impact of the economic recession on the pharmaceutical sector
Ba
ckg
rou
nd
8
Background
History of recessions
The world has already faced multiple financial crises during the 20th century. Some resulted in an
economic crisis in which not only the financial sector collapsed but the Gross Domestic Product
(GDP) dropped and unemployment rose.
One of the most severe recessions was the Great Depression which started in 1929 in the USA with
the collapse of the USA stock market prices. (11) It quickly spread over the world because the USA
invested and loaned substantial amounts of money to Europe to recover from World War I. Although
the Great Depression started in the USA, Australia, Canada and Germany were the countries which
were most severely affected by this crisis.(12) Recovery started in most countries in 1933 although
they did not fully recover until the beginning of World War II, when governments increased their
spending to produce war materials.
Another recession which had a great impact world wide was the 1973 oil crisis. As a response to the
re-supply of the Israeli military by the USA during the Yom Kippur war, the Organization of the
Petroleum Exporting countries (OPEC) brought an oil embargo into force. (13) As a consequence the
price of oil increased by 395%. (14) This price increase of crude oil had a negative impact on
industrial production. In March 1974 the embargo was lifted and the recovery began.
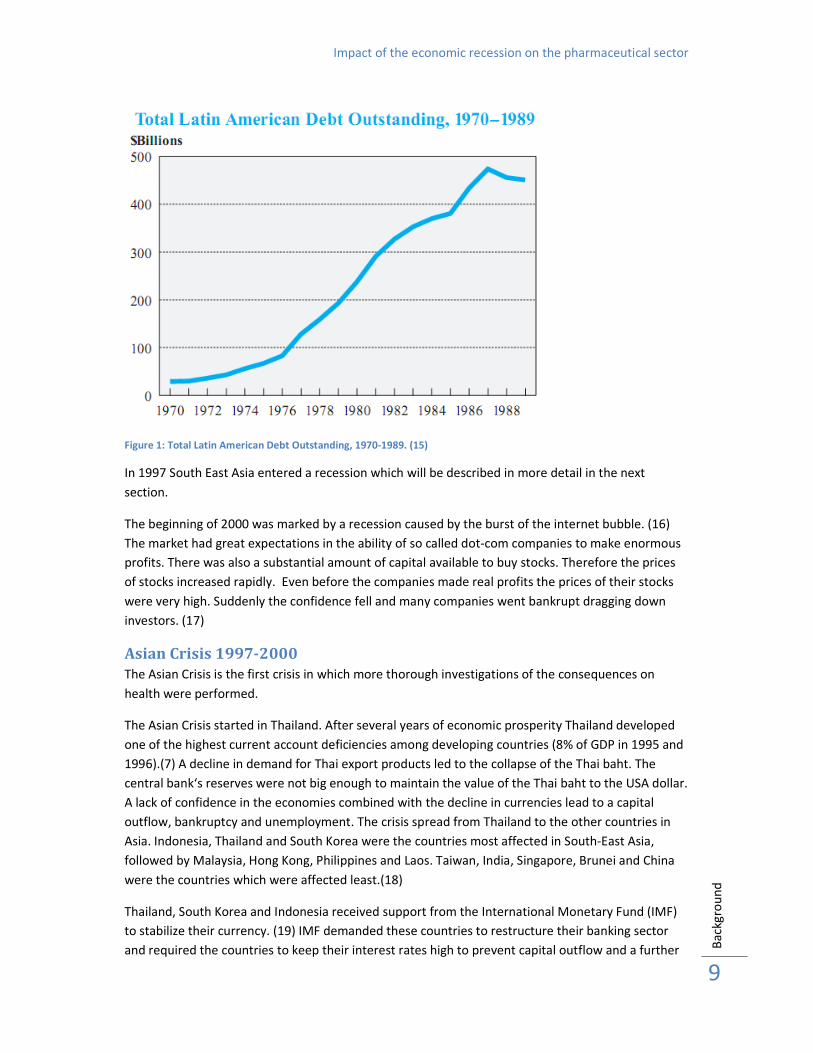
At the end of the 1970s Latin-America entered a recession. In the 1960s and 1970s Latin-American
countries, especially Brazil, Mexico and Argentina, borrowed large amounts of money for
industrialization. (15) Mexico, Brazil, Argentina and Venezuela had a debt of $29 billion in 1970
which increased to $159 billion in 1978 (see Figure 1). In 1979 interest rates in Europe and USA
increased making it more difficult for the Latin American countries to pay back their debts. When the
international capital markets discovered that the Latin American countries could not pay back their
loans (August 1982), they refused new loans to these countries. This caused a halt to the increase of
investments in industrialization. To prevent a more severe increase of the debts the Latin American
countries changed their import substitution industrialization economies to be export-oriented
industrialized economies. Large capital outflow caused a depreciation of the exchange rates which
led to an increase of interest rates. This improved the situation in these countries although they still
face large debts to date.
Impact of the economic recession on the pharmaceutical sector
Ba
ckg
rou
nd
9
Figure 1: Total Latin American Debt Outstanding, 1970-1989. (15)
In 1997 South East Asia entered a recession which will be described in more detail in the next
section.
The beginning of 2000 was marked by a recession caused by the burst of the internet bubble. (16)
The market had great expectations in the ability of so called dot-com companies to make enormous
profits. There was also a substantial amount of capital available to buy stocks. Therefore the prices
of stocks increased rapidly. Even before the companies made real profits the prices of their stocks
were very high. Suddenly the confidence fell and many companies went bankrupt dragging down
investors. (17)
Asian Crisis 1997-2000
The Asian Crisis is the first crisis in which more thorough investigations of the consequences on
health were performed.
The Asian Crisis started in Thailand. After several years of economic prosperity Thailand developed
one of the highest current account deficiencies among developing countries (8% of GDP in 1995 and
1996).(7) A decline in demand for Thai export products led to the collapse of the Thai baht. The
central bank‘s reserves were not big enough to maintain the value of the Thai baht to the USA dollar.
A lack of confidence in the economies combined with the decline in currencies lead to a capital
outflow, bankruptcy and unemployment. The crisis spread from Thailand to the other countries in
Asia. Indonesia, Thailand and South Korea were the countries most affected in South-East Asia,
followed by Malaysia, Hong Kong, Philippines and Laos. Taiwan, India, Singapore, Brunei and China
were the countries which were affected least.(18)
Thailand, South Korea and Indonesia received support from the International Monetary Fund (IMF)
to stabilize their currency. (19) IMF demanded these countries to restructure their banking sector
and required the countries to keep their interest rates high to prevent capital outflow and a further

Impact of the economic recession on the pharmaceutical sector
Ba
ckg
rou
nd
10
decline of their national currencies. Malaysia refused the assistance of IMF because of these
restrictions. (19)
The crisis in Indonesia became more complex than the crises in the other countries since it turned
into a political and social crisis, thereby complicating the Indonesian economic situation and
responses of the Indonesian government to the economic crisis. (20) WHO investigated the impact
of the Asian financial crisis on the pharmaceutical sector in Indonesia. It was expected that the use
of health facilities would decrease, but the health centres and hospitals did not report significant
changes in the number of patient visits. However Indonesia did experience a significant shortage of
raw materials for pharmaceutical production due to changes in exchange rates. The government
took several measures to protect the pharmaceutical sector. One of these measures was monitoring
the availability of 12 key indicator medicines. Another measure was to provide additional funds for
the provision of a national buffer stock of essential medicines. The monitoring of the availability of
generic products was also a measure to guarantee the access to generic products. To cover the
excess of exchange rate to buy raw materials above Rp 8000 per USA dollar the government
provided additional subsidies to pharmaceutical companies producing generic products. The
government also established the Jaring Pengaman Sosial Bidang Kesehatan (JPS-BK), a social security
net for health. This fund was especially meant for poor households.
Figure 2: Pharmaceutical consumption in South East Asia Q2 1996 - Q2 2002. These figures show that the decline in
pharmaceutical consumption (b) started later than the decline in GDP (a). (21)
Intercontinental Medical Statistics (IMS) Health has performed a retrospective investigation of the
consumption of medicines during the crisis in South-East Asia. (21) Their research covered the
consumption data for six years (see Figure 2). They measured the overall pharmaceutical
consumption and pharmaceutical consumption split by acute and chronic indication. The observed
decline in volume of pharmaceutical consumption (see Figure 3) was the most severe in Indonesia
(-13%), Thailand (-22 %) and South-Korea (-16 %). Therefore IMS Health concentrated their more in
depth research on these three countries. The decline in pharmaceutical consumption was consistent

Impact of the economic recession on the pharmaceutical sector
Ba
ckg
rou
nd
11
with the economic situation in three countries. The decrease in GDP was also the most severe in
Indonesia, Thailand and South-Korea.
The data gathered by IMS Health showed that the pharmaceutical consumptions dropped when GDP
growth dropped, although the decline started some quarters later (see Figure 2 and Table 1, the left
figure about the development of GDP shows a decline at t=0-1 quarters and the right figure about
the pharmaceutical consumption t=2-3 quarters). The recovery of pharmaceutical consumption took
longer than GDP.
Pharmaceutical consumption South East Asia 1997/1998
-25%
-20%
-15%
-10%
-5%
0%
5%
10%
15%
INDONES
IA
PHILIPPINES
THAILA
ND
MAL
AYS
IA
SINGAPO
RE
TAIW
AN
SOUTH
KORE
A
HONG KONG
Volu
me G
rowth
(%
)
-80%
-60%
-40%
-20%
0%
20%
40%
Valu
e G
rowth
(%
)
Volume Growth Value Growth (Local Currency) Value Growth (USD) Figure 3: This figure reflects the change in volume of pharmaceutical consumption in South East Asia in 1997-1998. The
value of the pharmaceutical consumption is given in local currencies and in US dollars. Indonesia, Thailand and South
Korea showed the most dramatic decline in pharmaceutical consumption. (9)
Looking at the difference between consumption of acute and chronic medication one can see that
the consumption for chronic indication recovered quicker than the overall consumption (Table 1).
Table 1: One can see in this how many quarters it took for real GDP (expressed in local currency), overall drug
consumption, consumption of medicines for acute and chronic indication (expressed in supply units) to decline, get to
the bottom of the decline and to recover. (9)
Real GDP (LCU) Overall Drug Consumption
(SU)
Consumption for Chronic
Disease (SU)
Consumption for Acute
Disease (SU)
Qtrs.
to
decline
Qtrs.
to
bottom
Qtrs. to
recovery
Qtrs.
to
decline
Qtrs. to
bottom
Qtrs. to
recovery
Qtrs.
to
decline
Qtrs. to
bottom
Qtrs. to
recovery
Qtrs.
to
decline
Qtrs.
to
bottom
Qtrs. to
recovery
Thailand 1 5 (.86) 18 2 5 (.78) 18 3 4 (.79) 9 2? 6 (.72) 26
Indonesia 2 6 (.85) 17 2 7 (.81) 13 2 4 (.75) 15 2 7 (.80) 12
Korea 2 4 (.92) 8 1 5 (.80) 10 3 3 (.90) 8 1 5 (.67) Never
Average 1.67 5 12.67 1.67 5.67
(.80) 13.67 2.67
3.67
(.81) 10.6 1.67 6 (.73) 19

Impact of the economic recession on the pharmaceutical sector
Ba
ckg
rou
nd
12
Economic crisis 2008-2009
The main cause of the current economic crisis is thought to be that US banks had provided high-risk
loans to people with poor credit history to purchase homes prior to 2007. (22) Between 2004 and
2006 house prices fell and interest rates in the US rose from 1% to 5,35% thereby triggering a
slowdown of the housing market. (22) Homeowners could no longer afford the large mortgages they
had taken to buy their houses. As a consequence banks and investors suffered losses and would not
take on any more risk, leading to a freezing of the credit market. The same problem occurred in
Europe. The European Central Bank (ECB) and the US Federal Bank made funds available for banks
and they have cut interest rates so the banks could start providing loans again. Since banks were still
very cautious about loans and did not lend to one another, the measures of the ECB and the Federal
Reserve did not prevent the crisis progressing.
From the beginning of 2008, banks and investors faced severe problems. (22) Governments tried to
keep banks and investors in business by providing them very large loans in exchange for shares in
the banks. On September 15, 2008 Lehman Brothers, a major investment bank in the USA, filed for
bankruptcy being the first of many banks in the US and Europe to collapse.
The lack of confidence in the credit market led to a decline in economic growth and from the second
half of 2008 many countries all over the world entered a recession. (22)
This recession started in the developed countries and caused a decline in revenues. The developed
countries needed money to stabilize their own economy and had no extra funds left to provide loans
to and invest in developing countries. The decline in loans and investments is the reason why
developing countries (which were highly dependent on loans and development assistance) were hit
hard by the current economic recession. The costs of existing loans became higher due to the
decline in exchange rates. Some export oriented economies such as China or India saw a decline in
demand for their exports, with consequences for their national revenues.(23)
Examples of countries which were hit hard by the recession are Estonia, Latvia and Lithuania. (24)
After years of rapid growth of their GDP, all three countries saw their GDP decline rapidly during the
’08-’09 recession. Estonia saw a decline in GDP of -15,0% in the first quarter of 2009 and Latvia
showed a bigger decline of -18,6% in the same quarter (see table 2). (25)
In the Euro area (EA16) and European Union (EU27) the decline of GDP in 2009 compared to 2008
decreased (see Table 2).(25) In Q1 09 these declines were respectively -5,0% and -4,9%. In Q4 09 these
declines were -2,1% for the Euro area and -2,3% for the European Union. Declines in GDP were still
large in Estonia, Latvia, Lithuania and Romania compared to the Euro area and the European Union
but not as large as in Q1 09. Poland had no decline in GDP although the growth rate became less
(from 1,5% in Q1 09 to 1,0% in Q3 09).

Impact of the economic recession on the pharmaceutical sector
Ba
ckg
rou
nd
13
Table 2: Growth rates of GDP in volume of 2009 compared to the same quarter of 2008. (25)
Q1 09 Q2 09 Q3 09 Q4 09
EA161
-5,0 -4,8 -4,0 -2,1
EU272
-4,9 -5,0 -4,3 -2,3
Estonia -15,0 -16,1 -15,6 -9,4
Latvia -18,6 -17,3 -19,3 -17,9
Li thuania -13,1 -19,7 -14,2 -13,0
Romania -6,2 -8,7 7,1 -6,6
Poland 1,5 1,3 1,0 na
Percentage change compa red wi th the same quarter of the
previous year
1) EA 16 consist of Austria, Belgium, Cyprus, Denmark, Estonia, Finland, France, Germany, Greece, Ireland, Italy,
Luxembourg, Malta, the Netherlands, Portugal, Slovakia, Slovenia and Spain. 2) EU27 includes Austria, Belgium, Bulgaria, Cyprus, the Czech Republic, Finland, France, Germany, Greece, Hungary,
Ireland, Italy, Latvia, Lithuania, Luxembourg, Malta, the Netherlands, Poland, Portugal, Romania, Slovakia, Slovenia,
Spain, Sweden and the United Kingdom.
NA = not available.
The governments of the Baltic States needed to have a careful look at their budgets because of
declining revenues. Health care is one of the largest expenses on the budgets of governments. Some
of the measures the Baltic governments took with respect to their health system/budget are
highlighted below.
The three Baltic States intended to adopt the Euro as their national currency in 2011. Therefore they
did not want to consider a devaluation of their currency, otherwise they would have to start over
with the application for joining the euro zone. (24) Besides the adoption of the euro there was
another issue. Most loans in the Baltic States were financed with money from Sweden. If the Baltic
countries devalued their currencies their debts would increase.
In Estonia several (health care) reforms were implemented. One of the biggest changes was the
policy of payments on sick leave. Before the recession people would receive money from day 2 of
their sick leave out of the National Health Insurance Fund. Now people only receive money after 3
days of sick leave by their employers during maximal 5 days and the National Health Insurance Fund
(EHIF) only starts to pay on day 9 of the sick leave. This could save the Estonian government 29
million Euros. (26) The government also decided to simply reduce the budget of the EHIF by 40
million Euros. (1) The budget of EHIF is used to cover medical services for all insured people.
The Latvian government decided to increase the fees of healthcare paid by patients as a
measurement to reduce the expenses on health care. (27) The overall budget cut of the ministry of
health was 12,7 million Euros of a total budget cut of 71,1 million Euros for the entire government.
(2, 3) In January 2009, the government decided to reduce the reimbursement levels from 90% to
75% and from 75% to 50% for different categories of care. (3) Other measures taken were transfer of
some medical treatments from hospitals to out-patient clinics and reduction of hospital funding by
30-45%.
The Lithuanian government reduced their public expenditure by 956,52 million Euros (28). This
included a reduction in the budget of the Compulsory Health Insurance Fund (CHIF) by 86,55 million

Impact of the economic recession on the pharmaceutical sector
Ba
ckg
rou
nd
14
Euros. (22) A reduction of the budget for subsidizing medicines of 9,04 million Euros was agreed at
the same time.
In all the Baltic countries the governments decided to increase their Value Added Tax (VAT) on
pharmaceuticals. One of the reasons was to put the taxes in line with some European tax levels, but
the most important reason to implement this change was to increase government revenues. (27, 29-
31)
WHO involvement in assessing the impact of the recession
To discuss the impact of the financial crisis on global health, WHO convened a high-level meeting on
January 19, 2009. (9) At the time of this meeting there was a widely stated expectation that this
current crisis would be the worst since the Great Depression in the 1930s. Increases in food and fuel
prices before the recession brought more than 100 million people back into poverty. (16) There was
a concern expressed that the poor would be hit the hardest by the economic recession as
unemployment would lead to a drop in household income and in many countries unemployed
people would lose their health insurance. (19) This would lead to an inability to pay for health care.
Figure 4 shows the relation between an economic crisis and a decreased health status. An economic
crisis means that there is less economic growth, which leads to higher unemployment and inflation.
This can lead to bankruptcies. It also means that household income and tax revenue decrease. When
families have less to spend they will buy less food and food of less quality. They also cut back their
expenses on health and education. Governments have to cut back on their budgets when tax
revenues decline.
Figure 4: This flowchart shows the relation between an economic crisis and a decreased health status. An economic crisis
implies an increase in unemployment and inflation. It also leads to bankruptcies. This causes a decrease in household
income and tax revenues. People spend less money on food, health and education. Decreased revenue means that
governments have to cut back on their budgets. A cut back on the heath and education budget can mean that funding
for immunization, health insurance and improvements in technology declines. This can lead to a decreased health status
of the population. Mortality rates will increase and life expectancy will decrease. (19)

Impact of the economic recession on the pharmaceutical sector
Ba
ckg
rou
nd
15
Some important shifts in health expenditure were expected to be seen. Private out-of-pocket
expenditure usually declines in a recession because most services are also available in the public
sector at lower costs. In the Mexican crisis of 1995-1996 out of the pocket health expenditures
declined from 3,9% of GDP in 1994 to 3,1% of GDP in 1995.(8) The demand for public services would
exceed the available supply and cause problems in access for those who normally depend on public
services.
A recession is often accompanied by inflation and sometimes devaluation of domestic currencies
which causes an increase in the price of imported raw materials, medicines and medical equipment.
A more efficient way of health sector spending could lead to an increase in the use of the cheaper
generic medicines instead of branded medicines. Usually branded medicines are priced higher but in
some circumstances they are not (i.e. when a country has a reference price system).
Because of the rapid evolution of the economic recession it was decided at the high-level meeting on
January 19, 2009 that monitoring of early warning signs was of great importance. The monitoring
requires information from various sources. The WHO has established a programme to track the
impact of the recession on health and the pharmaceutical sector. IMS Health provides quarterly
reports on pharmaceutical consumption, expenditure and prices in 84 countries. Changes in general
consumption, consumption of medicines for acute and chronic indication, consumption of original &
licensed brands and other brands & unbranded medicines, expenditure and price per Standard Unit
are monitored in the 84 countries. These 84 countries world-wide represent 81% of the global
population, only the countries in Africa were covered less.
Hypotheses
The quarterly reports of IMS Health/WHO offer only an aggregate overview of the changes in
consumption. Therefore we decided to look in more detail at the detected changes. Based on
experiences from previous recessions this study was undertaken to test the following hypotheses in
more depth:
• A decrease of GDP will lead to a decrease in pharmaceutical consumption. The more severe
the decline in GDP, the more severe the decline in pharmaceutical consumption will be.
• Consumption of medicines for an acute indication will decrease more than medicines used
for a chronic indication.
• A shift of the consumption of branded medicine to generic medicines would occur.
• Prices in national currency units (NCU) will increase more in countries which were more
severely affected by the economic crisis.
• The overall pharmaceutical expenditure will stay the same or drop while expenditure in the
public sector will increase and the private sector will decrease, where such information is
available.
• In countries which have a substantial decline in pharmaceutical consumption marker
products can be detected to track changes in pharmaceutical consumption due to an
economic recession.

Impact of the economic recession on the pharmaceutical sector
Me
tho
ds
16
Methods
IMS data collection
The data for this study was obtained by Intercontinental Medical Statistics (IMS Health). IMS Health
is a company which provides market intelligence and expert analysis to healthcare providers and
pharmaceutical industries. IMS collects pharmaceutical consumption data from wholesalers,
hospitals and/or dispensing outlets such as pharmacies and drugstores.(10) To gather this
consumption data IMS uses different methods. Within countries IMS uses the same method but the
methodology used varies between countries and depends on the nature of the pharmaceutical
supply systems. IMS collects data in over a hundred countries world-wide. Data used for this study
originates from 84 countries. These 84 countries represent about 81% of the global population.
There is a lack of coverage in the African countries. Only South Africa, Algeria, and some countries in
French West Africa are covered. Morocco, Tunisia and Egypt were covered as well but these
countries belong to the WHO Eastern Mediterranean region. In Central America the data is
combined for Costa Rica, El Salvador, Guatemala, Honduras, Nicaragua and Panama and in French
West Africa for Benin, Burkina, Cameroon, Congo, Gabon, Ivory Coast, Mali, Senegal and Togo.
If IMS does not collect data from all suppliers in a country they project the sample of a particular
distribution channel to the national level. In most low- and middle-income countries, IMS measures
consumption in the private sector. In many countries the private sector is the major or only supplier
to the public sector, which makes it hard to measure both private and public sector. If IMS collects
information on the distribution chain of the private sector, they do not give an estimate based on
this gathered information for the public sector. IMS makes an explicit distinction between countries
where they are able to cover both public and private sector and countries where they are not.
Consumption is expressed as volume in standard units (SU). This is a measure used by IMS derived
from the number of doses. It is measured differently depending on the formulation of the medicine.
It is different from the measure WHO uses, the Defined Daily Dose (DDD). DDD is defined by the
WHO as the assumed average maintenance dose per day for a drug used for its main indication in
adults. (32) Usually one SU equals one capsule, one tablet, one prefilled syringe, one dose of inhaled
medicine or 5 ml of an oral suspension etc. DDD’s and SU’s are used as a measure of consumption of
medicines by patients. Care is needed when standard units are compared between countries as
formulations can differ between countries. In this study we compare changes in SU’s so the
difference in formulation between countries is not an issue.
The European Pharmaceutical Market Research Association (EphMRA) developed an anatomical
classification system (AC-system) which is used by IMS to make the subdivision in acute and chronic
indication. (24) IMS based the subdivision of acute and chronic medicines on an analysis of primary
care records in the United Kingdom as well as subsequent medical review.
The AC-system of EphMRA is used as a base for the Anatomical Therapeutic Chemical classification
system (ATC-system) which is used by WHO as an international standard. Drugs are classified in
three or four different levels in the EphMRA system, while the WHO-ATC-classification uses four to
five levels. The fourth level in the EphMRA system is the molecule level. The fourth level in the WHO-
ATC-classification is a therapeutic/chemical/pharmacological subgroup and the fifth level is the

Impact of the economic recession on the pharmaceutical sector
Me
tho
ds
17
chemical substance subgroup. Both classification systems use the abbreviation ATC. In this report
ATC refers to the EphMRA classification.
For the purpose of this study medicines were grouped in two categories: original & licensed brands
and other brands & unbranded medicines. A subdivision in original & licensed brands versus other
brands & unbranded medicines can be used to detect movements from the use of originator
medicines to generics, although there are some complexities within different classes of drugs that
must be taken into account before definitive conclusions can be made. IMS Health defines an
original brand as a brand to be designated as an original brand, with a molecule in the product which
has or has had a molecule patent and is marketed by the patent holder (originator) of that product.
(10) Licensed brands are brands with a license which are sold by a different company than the
originator. Original and licensed brands also include products whose patents are expired but which
are still sold under their brand name. A formulation or process patent or a supplementary protection
certificates are not sufficient criteria on their own to be included in this group.
Products which are being marketed by companies which are neither the originator nor hold a license
from the originator belong to the category other brands & unbranded medicines. Other brands &
unbranded medicines are not the same as generics since products protected by formulation, process
and supplementary protection certificates may be included in this group if no molecule patient
existed. This group also includes branded products that contain ingredients for which there are no
originators. Some examples of these products are some oral contraceptives and insulins, vitamins,
infant milk and homeopathic products. The distinction between other brands & unbranded
medicines can sometimes appear somewhat artificial, depending on how the product is described
rather than how it is either priced or marketed.
Generally IMS collects information about the price of a product from various sources but only from a
single point in the supply chain. This information can relate to average weighted prices, price lists,
reimbursement prices or a combination of all three. IMS estimates the prices charged at other points
in the supply chain using averages based on local country knowledge. Therefore the estimated prices
do not represent actual prices charged at individual product level. The index Price per Standard Unit
is calculated by dividing the total reported value of sales by total volume for each country.
Movements in this index can be a result of new product introductions, government policies relating
to reimbursement prices and approved margins through the distribution chain and/or increases in
generic market share. It is not necessarily a sign of higher prices of individual products. IMS Health
usually collects information based on national currency units. Therefore changes in exchange rates
will not be reflected in prices, unless the change affects the price being charged in the local currency
due to importation costs. In the multi-country audits such as French West Africa and Central
America local currency has been converted to $US or €. As a result exchange rate fluctuations
directly affect the prices seen in IMS Health audits.
Pharmaceutical expenditure depends on the volume of consumption and prices of medicines.
Therefore changes in pharmaceutical expenditure can relate to changes in volume and changes in
prices. Since the pharmaceutical expenditure depends on the prices which are estimated by IMS the
same uncertainties can be applied to the expenditure as to the prices. As with the prices, the
expenditure is also expressed in national currency units.

Impact of the economic recession on the pharmaceutical sector
Me
tho
ds
18
Provision of indexed data
IMS provided a dataset with the pharmaceutical consumption in 84 countries for the first quarter of
2008 till the fourth quarter of 2009. Data was provided for two different indices. The first index
shows the evolution compared to the first quarter of 2008 (Q1 08). The first quarter of 2008 was
considered to be at least one quarter before the economic recession struck. By using this index a
comparison can be made between the period before the recession and during or after the recession.
A general formula for the calculation of these index numbers based on Q1 08 for the consumption
expressed in SU’s is:
08 1
nn
Q in s SU'Total
Q in s SU'TotalQ number index =
To calculate the index numbers for expenditure or price per IMS SU total SU’s have to be replaced by
the value for expenditure or price per IMS SU.
To take seasonal variation into account another index number was calculated based on the year
before:
1-n
nn
Q in price or eExpenditur or s SU'total of Value
Q in price or eExpenditur or s SU'total of ValueQ number ndexi =
To acquire more data points for the graphical transformation index numbers for the period Q1 2007 to
Q4 2007 were calculated for consumption, consumption split by acute and chronic indication and split
by original & licensed brands and other brands & unbranded medicines. These index numbers (Q1 07
– Q4 07) are based on Q1 08 and were calculated with the aid of the index numbers based on the year
before and the index numbers of Q1 08:
before year on indexedQ number index
Q on indexedQ number indexQ on indexed Q number Index
08 x
08 1 08 x
08 1 07x =
Graphical transformation methods
After the calculation of index numbers for Q1 07 - Q4 07 MS Excel was used for graphical
representation. To display different changes in the different areas over the world, graphics were
made with the pharmaceutical consumption per WHO region (AFR, AMR, EMR, EUR, SEAR and WPR)
and a global average. To see if the changes were dependent on the income level, countries were
divided into World Bank income categories (high income, upper middle, lower middle and low
income countries). To look in more detail at the countries, which showed an interesting change,
graphics were made with the consumption of these particular countries, other countries of interest
in this WHO region, global average and the average of the WHO-region to which the countries
belong. The weighted averages of pharmaceutical consumption (split by acute and chronic indication
and split by original & licensed brands and other brands & unbranded medicines) were provided by
IMS Health. The averages of the pharmaceutical consumption (split by acute and chronic indication
and split by original & licensed brands and other brands & unbranded medicines), pharmaceutical
expenditure and price per IMS SU per World Bank income category and the averages of the
pharmaceutical expenditure and price per IMS SU per WHO Region were calculated as a crude

Impact of the economic recession on the pharmaceutical sector
Me
tho
ds
19
average of the indexed data of the individual countries. The global averages were also calculated as
crude averages of the indexed data of the individual countries.
Economic indicators
Economic indicators describe the statistics of the economy of countries. Different economic
indicators are used for different purposes. Gross Domestic Product (GDP) is a measure for the total
production of a country in a year and therefore a measure for the economic performance of a
country. GDP is defined as the total market value of all final products and services produced within
the borders of a country in a year.
To investigate if a decrease in pharmaceutical consumption correlates with a decrease in growth of
GDP a linear regression analysis was performed. The volumes of GDP in index numbers for the 29
European countries were extracted from the website of EUROSTAT, the statistical agency of the
European Union. The index numbers of Q1 09−Q3 09 compared to the same quarter a year before for
pharmaceutical consumption and GDP were used to correct for seasonal variation. The periods Q1
09−Q3 09 were chosen to compare GDP and pharmaceutical consumption of the most recent periods.
A decline in GDP leads to a decline in exchange rate of a local currency against a hard currency as the
Euro or the US dollar. A lower exchange rate causes an increase in the price of imported raw
materials and medicines. As a result price per IMS SU in national currency will increase. To assess
whether prices (in national currency units) showed a bigger increase if the country was more
affected by the economic recession a linear regression analysis was performed.
For the same reasons as mentioned before the index numbers of GDP and pharmaceutical prices in
European countries for Q1 09 compared to Q1 08 were used.
Shift from private to public sector
People have less to spend during a recession and therefore it was expected that people would make
more use of the facilities in the public sector instead of the private sector. To see if this shift
occurred graphics were made for the countries where IMS could provide data for both sectors:
Brazil, Mexico, South Africa and Uruguay. For the consumption of acute and chronic medication and
original & licensed brands and other brands & non branded medicines graphics were made for each
country. For the overall consumption one graphic is made. Indexed consumption data for the period
Q1 07 – Q4 09 is used for the graphical display of this possible shift. The data is indexed on the first
quarter of 2008.
Country selection
Based on the analysis of the initial series of tables and graphics on the overall consumption countries
with a substantial decline in pharmaceutical consumption were selected to be examined in more
detail on EphMRA ATC 2/3/4 level. Pharmaceutical consumption depends like consumption of other
products on the demand of the consumers. Therefore natural fluctuations in pharmaceutical
consumption are common. Because we did not correct for seasonal variation we only selected
countries with a decrease in pharmaceutical consumption of more than 5% for three consecutive
quarters. Countries were selected based on the data provided up to the first quarter of 2009.
Countries which showed a decline of three consecutive periods after this point in time were not
included in these more detailed analyses.

Impact of the economic recession on the pharmaceutical sector
Me
tho
ds
20
Estonia, Latvia, Lithuania and Romania were selected since these countries showed a substantial
decline in overall consumption. Russia showed a number of declines as well but was not selected
because of the problems with acquiring insight in their health systems. Poland was selected as a
comparator because this is one of the few countries in Eastern Europe which was hardly affected in
terms of the economic crisis. The consumption in Poland dropped by -9% in Q2 08 compared to Q1 08.
However, when looking at the consumption pattern from Q1 07−Q4 09 one observes an increase in
consumption in the first quarter of every year and a constant consumption during the rest of the
year although at a lower level compared to this first quarter.
Impact of the recession on specific groups and individual medicines
One of the goals of this analysis was to detect groups of medicine which showed a big decrease in
consumption and groups of medicines which consumption hardly changed. If possible a selection of
marker medicines in these groups was made.
IMS Health provided a dataset with the SU’s per EphMRA ATC 2 category for the Estonia, Latvia,
Lithuania, Romania and Poland for the period 2007-2009. After sorting the data per country, the
total SU’s per quarter for each country were calculated. With the aid of this total, the SU’s per
EphMRA ATC 2 category were expressed as a percentage of the total SU’s of the corresponding
quarter. An average of these percentages for each EphMRA ATC 2 category was calculated. These
averages were used to make a Pareto analysis per country. For this analysis the EphMRA ATC 2
categories were sorted by highest average percentage of total SU’s. After the data was sorted a
cumulative percentage was calculated to generate a graphic to show the distribution of EphMRA
ATC 2 categories of total consumption. Based on this Pareto analysis 30% of EphMRA ATC 2
categories were selected which accounted for about 80% of total consumption.
Seasonal variation has great influence on the changes in consumption. Therefore it was decided to
compare a specific quarter with the corresponding quarter a year before. The periods Q4 08 and Q1 09
were chosen as quarters during the recession, because these periods contain the most recent data
and it is still possible to compare the values to a period before the recession started. The winter is
also one of the periods in which people have many costs and pharmaceutical consumption is more
likely to be affected.
The SU’s were converted in SU’s per capita for a better comparison of the data between countries.
Population data for the countries in question was extracted from the website of EUROSTAT. The SU’s
per capita for Q4 07 and Q1 08 were added as well as the values for Q4 08 and Q1 09. Of these two values
the absolute and percentage change were calculated. After this calculation a ranking was made
based on the increase in percentage change. These rankings were examined to look for categories
which had a decline in at least three of the four recession hit countries (Estonia, Latvia, Lithuania and
Romania) and preferable not in Poland. This selection was used to select the EphMRA ATC 2
categories of interest for further analysis on EphMRA ATC 3 level. Only EphMRA ATC 2 groups which
could have a potential harmful effect on public health if they are used less by patients were selected.
IMS Health provided a dataset with the SU’s for these specific EphMRA ATC 3 categories, which were
selected. For the EphMRA ATC 3 categories the SU’s per capita were calculated for the period
Q4 07 + Q1 08 and for Q4 08 + Q1 09 and were compared. The percentage change during these periods was

Impact of the economic recession on the pharmaceutical sector
Me
tho
ds
21
calculated. Again it was checked which EphMRA ATC 3 categories in this case met the criteria of
declining in three of the four recession hit countries and not in Poland.
Of these categories the development at product level was investigated to identify possible marker
products to track changes in a recession. Graphics were made of products when SU’s per capita were
available for all five countries (Estonia, Latvia, Lithuania, Romania and Poland). The developments
were checked for selection of possible marker products. A marker product would be a product that
has a sudden change in consumption shortly after the initiation of the recession in Q1 08. Changes in
consumption pattern that started in the beginning of 2007 and continually developed were not
considered to be caused by the economic recession.

Impact of the economic recession on the pharmaceutical sector
Re
sult
s
22
Results
Overall pharmaceutical consumption
Based on the indexed data provided by IMS Health figures were produced to show changes in the
consumption of pharmaceuticals from the first quarter of 2007 to the fourth quarter of 2009. Data
was indexed on the first quarter of 2008 which is at least one quarter before the recession. In most
parts of the world it appears that the pharmaceutical consumption was not affected by the
economic recession. Figure 5 shows that the European region (EUR) the only WHO region is where
consumption is lower compared to before the recession (-6% in Q3 09 compared to Q1 08), although
the consumption in Q4 09 increased. In the other WHO regions the consumption increased, ranging
from +12% (Q4 09) in the American region (AMR) to +28% (Q4 09) in the South East Asian region (SEAR).
1,16
0,93
1,14
1,12
1,18
0,99 1,02
0,95
1,28
1,22
0,90
0,95
1,00
1,05
1,10
1,15
1,20
1,25
1,30
Q1 07 Q2 07 Q3 07 Q4 07 Q1 08 Q2 08 Q3 08 Q4 08 Q1 09 Q2 09 Q3 09 Q4 09
Average pharmaceutical consumption index
Global and WHO regions(Evolution on Q1 08)
GLOBAL AFR AMR EMR EUR SEAR WPR
Figure 5: Pharmaceutical consumption global and by WHO regions. Volumes of consumption in SU’s indexed on Q1 08
were used for this figure. The pharmaceutical consumption in the European region declined after the recession started
(Q1 08) until Q3 09, while the pharmaceutical consumption in the other WHO regions increased.
The current economic recession began in the developed world. To see if the more developed
countries were affected more by the recession change in pharmaceutical consumption was assessed
for different income levels according to World Bank classification (Figure 6). This figure shows that
only the high income countries showed a small decline of -4% (Q3 09 compared to Q1 08) while the
other countries with less income all had an increase in their consumption. The low income countries
even had an increase of +18% in Q4 09 compared to the first quarter of 2008.

Impact of the economic recession on the pharmaceutical sector
Re
sult
s
23
1,16
0,97
1,04
0,96
1,06
0,93
1,12
1,01
1,18
0,90
0,95
1,00
1,05
1,10
1,15
1,20
Q1 07 Q2 07 Q3 07 Q4 07 Q1 08 Q2 08 Q3 08 Q4 08 Q1 09 Q2 09 Q3 09 Q4 09
Average pharmaceutical consumption index
Global and World Bank income categories(Evolution on Q1 08)
Global High income Upper middle income Lower middle income Low income
Figure 6: Pharmaceutical consumption global and by World Bank classification. Volumes of consumption in SU’s indexed
on Q1 08 were used for this figure. Only the high income countries showed a slight decline for three consecutive quarters
after the recession, until Q3 09.
Since averages per region do not give a clear picture about developments at country level, charts
were produced to look in more detail at developments in specific regions. Most of the 84 countries
did not show a decline in their pharmaceutical consumption. China even had an increase in
pharmaceutical consumption of +40% (Q4 09 compared to Q1 08) (see Figure 7). However there were
some exceptions: Estonia (-28% Q3 09), Latvia (-24% Q3 09), Lithuania (-17% Q3 09), Romania
(-11% Q3 09), Mexico private sector (-14% Q3 09) and Russia both private (-19% Q3 09) and public sector
(-35% Q2 09) all showed a severe decline in pharmaceutical consumption. Italy and the United Arab
Emirates showed a decline for three consecutive quarters as well, but their pharmaceutical
consumption increased in Q1 09. Malaysia only showed a decline of five consecutive quarters starting
in Q4 08 (-7% Q4 09 compared to Q1 08) (Figures 7 & 8).

Impact of the economic recession on the pharmaceutical sector
Re
sult
s
24
1,16
0,95
1,22
0,90
1,40
0,97
0,93
0,80
0,90
1,00
1,10
1,20
1,30
1,40
Q1 07 Q2 07 Q3 07 Q4 07 Q1 08 Q2 08 Q3 08 Q4 08 Q1 09 Q2 09 Q3 09 Q4 09
Pharmaceutical consumption
WPR, China and Malaysia(Evolution on Q1 08)
GLOBAL WPR CHINA MALAYSIA
Figure 7: Pharmaceutical consumption in WPR, China and Malaysia. Volumes of consumption in SU’s were used for this
figure and indexed on Q1 08. Malaysia showed a decline of -7% in Q4 09 compared to Q1 08, while China showed an
increase of +40% in the same period.
0,99
1,021,02
0,97
0,89
0,86
1,03
0,88
0,98
0,70
0,75
0,80
0,85
0,90
0,95
1,00
1,05
1,10
Q1 07 Q2 07 Q3 07 Q4 07 Q1 08 Q2 08 Q3 08 Q4 08 Q1 09 Q2 09 Q3 09 Q4 09
Pharmaceutical consumption
EUR, Poland, Romania and Baltics(Evolution on Q1 08)
EUR Poland Estonia Latvia Lithuania Romania
Figure 8: Pharmaceutical consumption in EUR, Poland, Romania and the Baltic States. Volumes of consumption in SU’s
were used for this figure and indexed on Q1 08. Romania and the Baltic States showed substantial declines in their
pharmaceutical consumption.
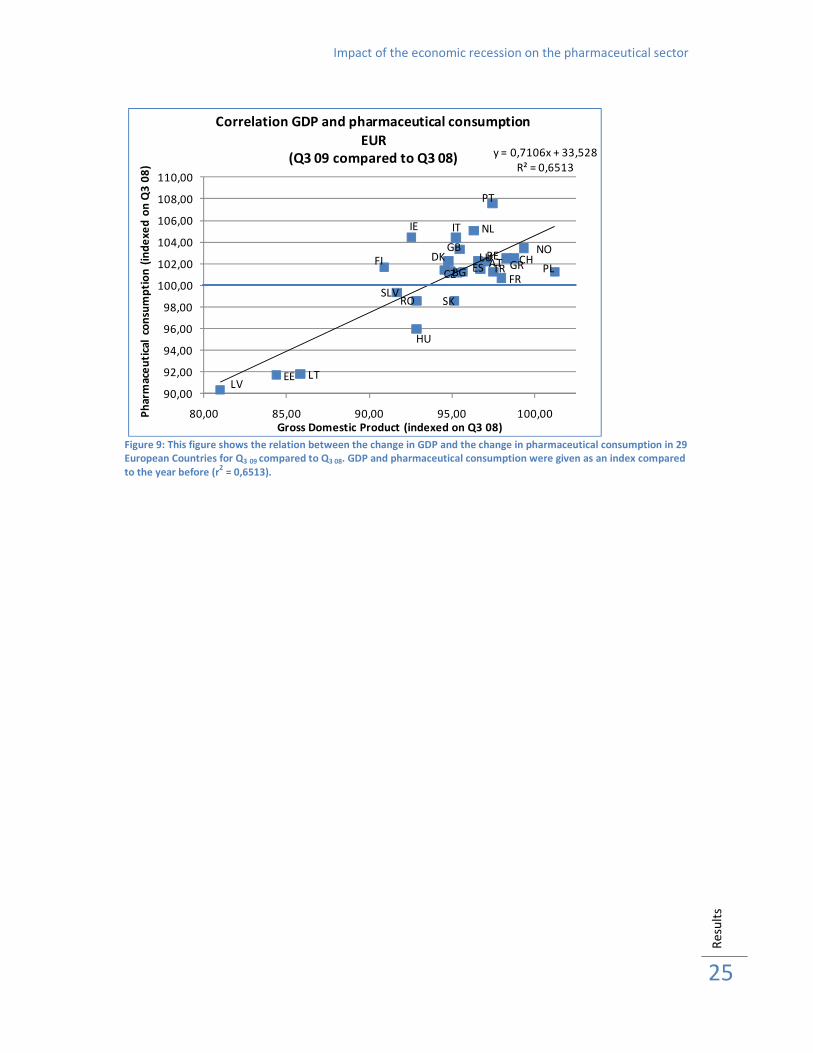
One of the hypotheses was that a decline in GDP will lead to a decrease in pharmaceutical
consumption. Figure 9 shows that in the European region a greater decline in GDP may be associated
with a lower pharmaceutical consumption, although this relationship is moderate and varied over
different quarters(r2 = 0,3914 to 0,6513 see Annex 1: Correlation decline in GDP and pharmaceutical
consumption). Many countries had a decline in GDP but only a limited number of countries (i.e.
Estonia, Latvia, Lithuania and Romania) had a severe decline in pharmaceutical consumption.
Impact of the economic recession on the pharmaceutical sector
Re
sult
s
25
ATBE
BGCZ
DK
EE
FI
FR
IT
GR
HU
IE
LVLT
LU
NL
NO
PL
PT
RO SKSLV
ESCH
TR
GB
y = 0,7106x + 33,528
R² = 0,6513
90,00
92,00
94,00
96,00
98,00
100,00
102,00
104,00
106,00
108,00
110,00
80,00 85,00 90,00 95,00 100,00Ph
arm
ace
uti
cal
con
sum
pti
on
(in
de
xe
d o
n Q
3 0
8)
Gross Domestic Product (indexed on Q3 08)
Correlation GDP and pharmaceutical consumption
EUR
(Q3 09 compared to Q3 08)
Figure 9: This figure shows the relation between the change in GDP and the change in pharmaceutical consumption in 29
European Countries for Q3 09 compared to Q3 08. GDP and pharmaceutical consumption were given as an index compared
to the year before (r2 = 0,6513).

Impact of the economic recession on the pharmaceutical sector
Re
sult
s
26
Consumption of medicines for acute and chronic indications
The research IMS Health performed on the ‘97-’98 Asian Crisis showed that the consumption of
medicines for acute indications decreased more and took longer to return to the pre-recession
values than the consumption of medicines for chronic indications. Figures 10 & 11 show that there is
little difference between the development of the consumption of medicine for an acute or chronic
indication on global and WHO region level. Again the European region is the only region where the
consumption of medicines for both acute and chronic indication declined, until Q3 09. The
consumption of medicines for acute indications decreased from Q1 08 onwards to -9% in Q3 09. The
consumption of medication for chronic indications decreased from Q1 08 with a recovery in Q4 08 and
Q1 09 to a decline of -6% in Q3 09. The increase in the other regions ranged from +7−+26% (Q4 09
compared to Q1 08) for the acute indications and from +13−+29% (Q4 09 compared to Q1 08) for the
chronic indications.
0,96
1,13
1,07
1,11
0,93
1,20
1,00
0,98
1,26
1,18
0,90
0,95
1,00
1,05
1,10
1,15
1,20
1,25
1,30
Q1 07 Q2 07 Q3 07 Q4 07 Q1 08 Q2 08 Q3 08 Q4 08 Q1 09 Q2 09 Q3 09 Q4 09
Average consumption index of medicines for acute indication
Global and WHO regions(Evolution on Q1 08)
GLOBAL AFR AMR EMR EUR SEAR WPR
Figure 10: Consumption of medicines for acute indication for the WHO regions. The European region showed a decline in
consumption of medicines with an acute indication up to -9% in Q3 09 compared to Q1 08. The other regions showed an
increase in the consumption of medicines with an acute indication.
0,92
1,13
1,17
0,981,03
1,29
0,96
1,23
0,85
0,90
0,95
1,00
1,05
1,10
1,15
1,20
1,25
1,30
Q1 07 Q2 07 Q3 07 Q4 07 Q1 08 Q2 08 Q3 08 Q4 08 Q1 09 Q2 09 Q3 09 Q4 09
Average consumption index of medicines for chronic indication
Global and WHO regions(Evolution on Q1 08)
GLOBAL AFR AMR EMR EUR SEAR WPR
Figure 11: Consumption of medicines for chronic indication for the WHO regions. Again the European region was the
only region with a decline (-6% in Q3 09 compared to Q1 08).

Impact of the economic recession on the pharmaceutical sector
Re
sult
s
27
0,96
1,13
0,98
1,001,02
0,93
1,12
1,17
0,90
0,95
1,00
1,05
1,10
1,15
1,20
Q1 07 Q2 07 Q3 07 Q4 07 Q1 08 Q2 08 Q3 08 Q4 08 Q1 09 Q2 09 Q3 09 Q4 09
Average consumption index medicines with acute indication
Global and World Bank income categories(Evolution on Q1 08)
Global High income Upper middle income Lower middle income Low income
Figure 12: Consumption of medicines with an acute indication for the World Bank income categories. Countries with a
high income showed a decline from the beginning of the recession. After an initial increase, the consumption decreased
in the upper middle income countries in 2009 and seems to recover in Q3 09 and Q4 09.
0,95
1,17
0,97
1,06
1,07
0,93
1,02
1,13
0,90
0,95
1,00
1,05
1,10
1,15
1,20
Q1 07 Q2 07 Q3 07 Q4 07 Q1 08 Q2 08 Q3 08 Q4 08 Q1 09 Q2 09 Q3 09 Q4 09
Average consumption index of medicines with chronic indication
Global and World Bank income categories(Evolution on Q1 08)
Global High income Upper middle income Lower middle income Low income
Figure 13: Consumption of medicines with a chronic indication. In all the World Bank income categories there was an
initial increase in consumption of medicines for a chronic indication. Only the high income countries showed a decline of
-3% in Q3 09 compared to Q1 08.
High- and upper middle income countries did show a difference between the consumption of acute
and chronic medicines (Figures 12 & 13). While the consumption of acute medicines declined slightly
by -4% (Q3 09 compared to Q1 08), the consumption of chronic medication increased by approximately
+2 to +3% until Q2 09 in the upper middle income countries and by -7% and -3% (Q3 09) respectively in
the high income countries. In Q3 09 the consumption in the upper middle income countries seemed to
be recovering, whereas the consumption of both acute and chronic medication in the high income
countries was still decreasing in Q3 09 and seemed to be recovering in Q4 09. In the lower middle and
low income countries the development was similar, the consumption of both categories increased
within a range of +12−+17% (Q4 09) for acute and +13−+17% (Q4 09) for chronic indications. Similar

Impact of the economic recession on the pharmaceutical sector
Re
sult
s
28
patterns were observed in those countries which had the largest overall decline (see Annex 2
Consumption of medicines for acute and chronic indications).
Impact of the economic recession on the pharmaceutical sector
Re
sult
s
29
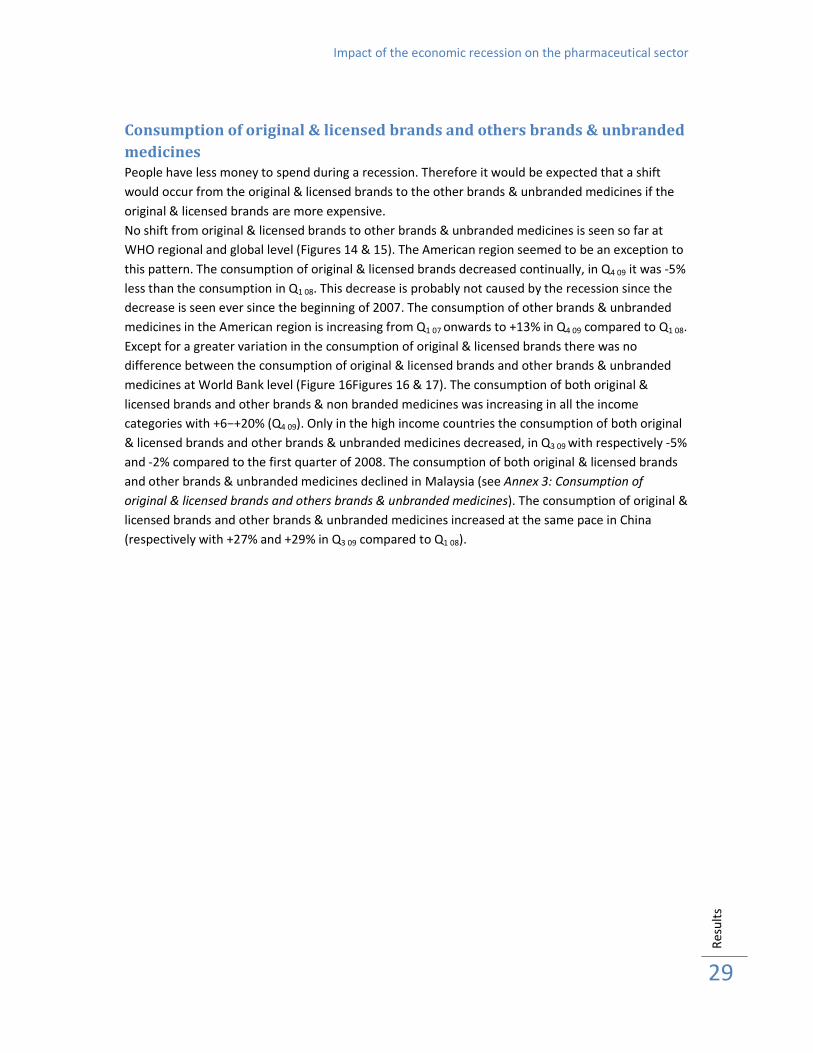
Consumption of original & licensed brands and others brands & unbranded
medicines
People have less money to spend during a recession. Therefore it would be expected that a shift
would occur from the original & licensed brands to the other brands & unbranded medicines if the
original & licensed brands are more expensive.
No shift from original & licensed brands to other brands & unbranded medicines is seen so far at
WHO regional and global level (Figures 14 & 15). The American region seemed to be an exception to
this pattern. The consumption of original & licensed brands decreased continually, in Q4 09 it was -5%
less than the consumption in Q1 08. This decrease is probably not caused by the recession since the
decrease is seen ever since the beginning of 2007. The consumption of other brands & unbranded
medicines in the American region is increasing from Q1 07 onwards to +13% in Q4 09 compared to Q1 08.
Except for a greater variation in the consumption of original & licensed brands there was no
difference between the consumption of original & licensed brands and other brands & unbranded
medicines at World Bank level (Figure 16Figures 16 & 17). The consumption of both original &
licensed brands and other brands & non branded medicines was increasing in all the income
categories with +6−+20% (Q4 09). Only in the high income countries the consumption of both original
& licensed brands and other brands & unbranded medicines decreased, in Q3 09 with respectively -5%
and -2% compared to the first quarter of 2008. The consumption of both original & licensed brands
and other brands & unbranded medicines declined in Malaysia (see Annex 3: Consumption of
original & licensed brands and others brands & unbranded medicines). The consumption of original &
licensed brands and other brands & unbranded medicines increased at the same pace in China
(respectively with +27% and +29% in Q3 09 compared to Q1 08).

Impact of the economic recession on the pharmaceutical sector
Re
sult
s
30
0,99
1,08
1,18
1,07
0,95
0,91
1,011,00
0,88
1,05
0,97
1,12
0,85
0,90
0,95
1,00
1,05
1,10
1,15
1,20
Q1 07 Q2 07 Q3 07 Q4 07 Q1 08 Q2 08 Q3 08 Q4 08 Q1 09 Q2 09 Q3 09 Q4 09
Average consumption index original & licensed brands
Global and WHO regions(Evolution on Q1 08)
GLOBAL AFR AMR EMR EUR SEAR WPR
Figure 14: Consumption of original & licensed brands for the different WHO regions. The American region (AMR) shows
a small decline from the beginning of 2007.
0,98
1,13
0,93
1,04
1,18
0,95
1,22
0,85
0,90
0,95
1,00
1,05
1,10
1,15
1,20
1,25
Q1 07 Q2 07 Q3 07 Q4 07 Q1 08 Q2 08 Q3 08 Q4 08 Q1 09 Q2 09 Q3 09 Q4 09
Average consumption index other brands & unbranded medicines
Global and WHO regions(Evolution on Q1 08)
GLOBAL AFR AMR EMR EUR SEAR WPR
Figure 15: Consumption of other brands & unbranded medicines for the different WHO regions. In most regions the
consumption of unbranded medicines increased. The European region (EUR) is the only region where the consumption
hardly grows and in some quarters even decreased.

Impact of the economic recession on the pharmaceutical sector
Re
sult
s
31
0,99
1,00 1,01
0,94
1,09
0,95
1,06
1,02
1,13
0,90
0,95
1,00
1,05
1,10
1,15
Q1 07 Q2 07 Q3 07 Q4 07 Q1 08 Q2 08 Q3 08 Q4 08 Q1 09 Q2 09 Q3 09 Q4 09
Average consumption index original brands & licensed brands
Global and World Bank income categories(Evolution on Q1 08)
Global High income Upper middle income Lower middle income Low income
Figure 16: Consumption of original & licensed brands for the World Bank income categories over time. Only the high
income countries had a decline in consumption of original & licensed brands.
0,93
1,16
0,96
1,05
1,09
0,92
1,12
1,00
1,20
0,90
0,95
1,00
1,05
1,10
1,15
1,20
Q1 07 Q2 07 Q3 07 Q4 07 Q1 08 Q2 08 Q3 08 Q4 08 Q1 09 Q2 09 Q3 09 Q4 09
Average consumption index other brands & unbranded medicines
Global and World Bank income categories(Evolution on Q1 08)
Global High income Upper middle income Lower middle income Low income
Figure 17: Consumption of other brands & unbranded medicines for the World Bank income categories over time. Only
the high income countries had no increase of the consumption of other brands & unbranded medicines, until Q3 09
compared to Q1 08.

Impact of the economic recession on the pharmaceutical sector
Re
sult
s
32
Price per IMS Standard Unit
In all WHO regions an increase of the crude average price per IMS SU was observed. The African
region and the American region were the WHO regions with the largest increase (+11% Q4 09
compared to Q1 08) while the other regions had an increase of +5−+8% in Q4 09 compared to Q1 08 (see
Figure 18). The high income countries only had a price increase of +5% (Q4 09), while the low income
countries had an increase of +11% and the upper middle income countries of +15% (Q4 09) (see Figure
18). In the European region Romania had the biggest increase in price of +39% (Q4 09), followed by
Estonia and Latvia with an increase of respectively +21% and +11% (Figure 20). Malaysia showed a
large price increase of +16% (Q4 09 compared to Q1 08) (Figure 21).
0,94
0,88
1,11
0,97
1,08
1,05
0,85
0,90
0,95
1,00
1,05
1,10
1,15
Q1 07 Q2 07 Q3 07 Q4 07 Q1 08 Q2 08 Q3 08 Q4 08 Q1 09 Q2 09 Q3 09 Q4 09
Average price per IMS Standard Unit index
Global and WHO regions (Evolution on Q1 08)
GLOBAL AFR AMR EMR EUR SEAR WPR
Figure 18: Average price per IMS Standard Unit index for the WHO regions. All regions showed an increase in price. The
Western Pacific region (WPR) has the smallest increase of about +5%, while African (AFR) and American (AMR) regions
experienced an increase of about +11% in Q4 09 compared to Q1 08.
1,09
0,97
1,05
0,91
1,15
0,93
1,11
0,90
0,95
1,00
1,05
1,10
1,15
1,20
Q1 07 Q2 07 Q3 07 Q4 07 Q1 08 Q2 08 Q3 08 Q4 08 Q1 09 Q2 09 Q3 09 Q4 09
Average price per IMS Standard Unit index
Global and World Bank income categories(Evolution on Q1 08)
Global High income Upper middle income Lower middle income Low income
Figure 19: Average price per IMS Standard Unit index for the World Bank income categories. High income countries
experienced one quarter of a decline in price but this decline quickly recovered and in Q4 09 the price was +5% higher
compared to Q1 08. In this same period the upper middle income countries and the low income countries showed an
increase of respectively +15% and +11%.

Impact of the economic recession on the pharmaceutical sector
Re
sult
s
33
1,11
0,93
1,21
0,85
1,07
1,01
1,39
0,80
0,90
1,00
1,10
1,20
1,30
1,40
Q1 07 Q2 07 Q3 07 Q4 07 Q1 08 Q2 08 Q3 08 Q4 08 Q1 09 Q2 09 Q3 09 Q4 09
Average price per IMS Standard Unit index
EUR, Poland, Baltics and Romania(Evolution on Q1 08)
EUR Poland Estonia Latvia Lithuania Romania
Figure 20: Average price per IMS Standard Unit for Poland, Romania and the Baltic States. Romania showed an increase
in price of +39% over the period Q1 08-Q4 09. Estonia and Poland have an increase of respectively +21% and +11%.
0,94
1,09
0,96
0,87
1,05
1,16
0,85
0,90
0,95
1,00
1,05
1,10
1,15
1,20
Q1 07 Q2 07 Q3 07 Q4 07 Q1 08 Q2 08 Q3 08 Q4 08 Q1 09 Q2 09 Q3 09 Q4 09
Average price per IMS Standard Unit
WPR, China and Malaysia(Evolution on Q1 08)
GLOBAL WPR CHINA MALAYSIA
Figure 21: Average price per IMS SU in WPR, China and Malaysia. Malaysia experienced two quarters of decline after
the start of the recession. From Q4 08 onwards the average price increased in Malaysia. Prices were +16% higher in Q4 09
compared to Q1 08. However these changes may be unrelated to the economic recession.

Impact of the economic recession on the pharmaceutical sector
Re
sult
s
34
It was expected that a more severe decrease in GDP would lead to an increase in pharmaceutical
prices due to more expensive imported raw materials and medicines. Figure 22 shows that there was
no correlation between these two variables in the European region.
AT
BE
BG
SE
CZEE
FI FR
ITGRHU
IELV LT
LU
NL
NO
PL
PT
RO
SK
SLV ES
CH
TR
GB
y = -0,249x + 127,2
R² = 0,0309
85,00
90,00
95,00
100,00
105,00
110,00
115,00
120,00
125,00
130,00
80,00 85,00 90,00 95,00 100,00 105,00Ph
arm
ace
uti
cal
con
sum
pti
on
(in
de
xe
d o
n Q
1 0
8)
Gross Domestic Product (indexed on Q1 08)
Correlation GDP and pharmaceutical prices
EURO
(Q1 09 compared to Q1 08)
Figure 22: This figure shows the relation between change in GDP and the change in pharmaceutical prices in 29 European
countries for Q1 09 compared to Q1 08. GDP and pharmaceutical consumption are given as an index compared to the same
quarter a year before. This figure shows that a decrease in GDP is not necessarily related to an increase in
pharmaceutical prices (r2 = 0,0309).

Impact of the economic recession on the pharmaceutical sector
Re
sult
s
35
Pharmaceutical expenditure In the WHO regions and the World Bank income categories, with the exception of EUR, the
pharmaceutical expenditure increased throughout the study period. The increase in expenditure
ranged from +20% in EMR to +33% in SEAR (Q4 09) (see Figure 23). In the low income countries this
increase was +31% (Q4 09 compared to Q1 08) (Figure 24). In China (+37% in Q3 09) and Malaysia (+14%
in Q3 09) the expenditure has increased as well (Figure 25) contrary to the Baltic countries where the
expenditure has decreased. Latvia has the largest decline of the three Baltic States, up to a decline of
-23% in the third quarter of 2009 (Figure 26). These figures are in line with the changes in volume
and prices.
1,24
0,84
0,90
1,28
0,92
1,10
1,33
1,20
0,80
0,90
1,00
1,10
1,20
1,30
Q1 07 Q2 07 Q3 07 Q4 07 Q1 08 Q2 08 Q3 08 Q4 08 Q1 09 Q2 09 Q3 09 Q4 09
Average pharmaceutical expenditure index
Global and WHO regions (Evolution on Q1 08)
GLOBAL AFR AMR EMR EUR SEAR WPR
Figure 23: Pharmaceutical expenditure for WHO regions. The pharmaceutical expenditure increased in all the regions.
The European region (EUR) is the only region where the increase of pharmaceutical expenditure is limited.
0,91
1,12
0,86
1,23
0,95
1,31
0,85
0,90
0,95
1,00
1,05
1,10
1,15
1,20
1,25
1,30
1,35
Q1 07 Q2 07 Q3 07 Q4 07 Q1 08 Q2 08 Q3 08 Q4 08 Q1 09 Q2 09 Q3 09 Q4 09
Average pharmaceutical expenditure index
Global and World Bank income categories (Evolution on Q1 08)
Global High income Upper middle income Lower middle income Low income
Figure 24: Average pharmaceutical expenditure index for World Bank income categories. The pharmaceutical
expenditure increased in all the income categories. The low income countries showed the largest increase, +31% in Q4 09
compared to Q1 08.

Impact of the economic recession on the pharmaceutical sector
Re
sult
s
36
0,91
1,24
1,20
0,79
1,46
1,08
0,70
0,80
0,90
1,00
1,10
1,20
1,30
1,40
1,50
Q1 07 Q2 07 Q3 07 Q4 07 Q1 08 Q2 08 Q3 08 Q4 08 Q1 09 Q2 09 Q3 09 Q4 09
Average pharmaceutical expenditure index
WPR, China and Malaysia (Evolution on Q1 08)
GLOBAL WPR CHINA MALAYSIA
Figure 25: Pharmaceutical expenditure in Western Pacific region (WPR), China and Malaysia. China showed a major
increase (+54% in Q3 09 compared to Q1 08) in pharmaceutical expenditure. Malaysia showed an increase as well of +14%
for the same period.
1,10
0,88
0,91
0,95 0,99
0,79
1,36
0,70
0,80
0,90
1,00
1,10
1,20
1,30
1,40
Q1 07 Q2 07 Q3 07 Q4 07 Q1 08 Q2 08 Q3 08 Q4 08 Q1 09 Q2 09 Q3 09 Q4 09
Average pharmaceutical expenditure index
EUR, Poland, Romania and Baltics (Evolution on Q1 08)
EUR Poland Estonia Latvia Lithuania Romania
Figure 26: Pharmaceutical expenditure in Poland, Romania and the Baltic States. Estonia, Latvia and Lithuania showed a
decline in their expenditure, while Romania showed an increase in pharmaceutical expenditure of +36% in Q4 09.

Impact of the economic recession on the pharmaceutical sector
Re
sult
s
37
0,80
0,90
1,00
1,10
1,20
1,30
1,40
1,50
Q1 07 Q2 07 Q3 07 Q4 07 Q1 08 Q2 08 Q3 08 Q4 08 Q1 09 Q2 09 Q3 09 Q4 09
Average pharmaceutical consumption
Private and public sector Brazil (indexed on Q1 08)
BRAZIL (PRIV.) BRAZIL (PUB.)
0,90
0,95
1,00
1,05
1,10
1,15
Q1 07 Q2 07 Q3 07 Q4 07 Q1 08 Q2 08 Q3 08 Q4 08 Q1 09 Q2 09 Q3 09 Q4 09
Average pharmaceutical consumption
Private and public sector Uruguay(indexed on Q1 08)
URUGUAY (PRIV.) URUGUAY (PUB.)
0,80
0,85
0,90
0,95
1,00
1,05
1,10
1,15
1,20
1,25
Q1 07 Q2 07 Q3 07 Q4 07 Q1 08 Q2 08 Q3 08 Q4 08 Q1 09 Q2 09 Q3 09 Q4 09
Average pharmaceutical consumption
Private and public sector Mexico (indexed on Q1 08)
MEXICO (PRIV.) MEXICO (PUB.)
0,85
0,95
1,05
1,15
1,25
1,35
1,45
1,55
Q1 07 Q2 07 Q3 07 Q4 07 Q1 08 Q2 08 Q3 08 Q4 08 Q1 09 Q2 09 Q3 09 Q4 09
Average pharmaceutical consumption
Private and public sector South Africa(indexed on Q1 08)
SOUTH AFRICA (PRIV.) SOUTH AFRICA (PUB.)
Shift from private to public sector
Figure 27a-d: Pharmaceutical consumption in the private and public sector in Brazil, Mexico, South Africa and Uruguay
for the period Q1 07-Q4 09. Consumption volume is indexed on Q1 08. In Uruguay there does not seem to be a shift from
private to public, until Q3 09. While in Mexico and South Africa the consumption in the public sector increases more than
in the private sector, until Q3 09. Mexico even has a decline in the private sector. After an initial stronger increase in the
public sector in Brazil, the difference between private and public stabilizes after Q1 09.
To investigate if there was a shift from private to public sector, graphics were made of the overall
pharmaceutical consumption in four countries where data on private and public sector was available
for analysis (Figure 27 Figure 27). The audits performed by IMS Health on the public sector contain
some private insurance sales and exclude public tenders.
In the period Q1 08-Q3 09 the consumption in the private sector in Mexico declined whereas the
consumption in the public sector increased. In South Africa the consumption in the public sector
seemed to be increasing faster than in the private sector. Brazil had an enormous increase in
consumption in the public sector after Q1 08. However the consumption decreased in the third and
fourth quarter of 2008 and came in line with the increase of the private sector in the second and
third quarter of 2009. In Uruguay the development of consumption in the private sector showed the
same pattern as in the public sector, until Q3 09. Differences in development of consumption of
medicines for acute and chronic indication and consumption of branded and non branded medicines
were examined for the same four countries. No difference in the development of consumption of
acute and chronic medication was found. Only Mexico showed a much stronger increase in the use
of original & licensed brands in the public sector compared to the other brands & unbranded
medicines. This might be explained by the differences in audits performed by IMS Health. In the
other three countries there is no clear difference between the changes in consumption of original
and licensed brands and other and unbranded medicines in private and public sector (see annex 4.1
& 4.2).

Impact of the economic recession on the pharmaceutical sector
Re
sult
s
38
0,80
0,85
0,90
0,95
1,00
1,05
1,10
1,15
1,20
1,25
1,30
Q1 07 Q2 07 Q3 07 Q4 07 Q1 08 Q2 08 Q3 08 Q4 08 Q1 09 Q2 09 Q3 09 Q4 09
Average price per IMS Standard Unit
Private and public sector Brazil (indexed on Q1 08)
BRAZIL (PRIV.) BRAZIL (PUB.)
0,75
0,80
0,85
0,90
0,95
1,00
1,05
1,10
1,15
1,20
Q1 07 Q2 07 Q3 07 Q4 07 Q1 08 Q2 08 Q3 08 Q4 08 Q1 09 Q2 09 Q3 09 Q4 09
Average price per IMS Standard Unit
Private and public sector Mexico (indexed on Q1 08)
MEXICO (PRIV.) MEXICO (PUB.)
0,90
0,95
1,00
1,05
1,10
1,15
1,20
1,25
Q1 07 Q2 07 Q3 07 Q4 07 Q1 08 Q2 08 Q3 08 Q4 08 Q1 09 Q2 09 Q3 09 Q4 09
Average price per IMS Standard Unit
Private and public sector Uruguay (indexed on Q1 08)
URUGUAY (PRIV.) URUGUAY (PUB.)
0,70
0,80
0,90
1,00
1,10
1,20
1,30
Q1 07 Q2 07 Q3 07 Q4 07 Q1 08 Q2 08 Q3 08 Q4 08 Q1 09 Q2 09 Q3 09 Q4 09
Average price per IMS Standard Unit
Private and public sector South Africa (indexed on Q1 08)
SOUTH AFRICA (PRIV.) SOUTH AFRICA (PUB.)
Figure 28a-d: Price per IMS SU (in national currency units) for private and public sector in Brazil, Mexico, Uruguay and
South Africa. The price per IMS SU increased over time. The price per IMS SU in the public sector varies more.
In Brazil, Mexico and South Africa prices in the public sector increased less than prices in the private
sector (see Figure 28). Next to that prices in the public sector varied more than in the private sector.
This difference is most likely caused by bulk purchases and therewith leads to economies of scale.
Since there was no clear shift from private to public sector in consumption and prices, with the
exception of Mexico, there was no shift based on expenditure (see annex 4.3: Pharmaceutical
expenditure in private and public sector).

Impact of the economic recession on the pharmaceutical sector
Re
sult
s
39
Impact of the recession on specific groups and individual medicines
To examine the declines in pharmaceutical consumption in Estonia, Latvia, Lithuania and Romania
was looked at percentage change for Q4 08 + Q1 09 compared to Q4 07 + Q1 08 at different EphMRA ATC
levels. The goal of this method was to compare these changes with the corresponding developments
in Poland. A Pareto analysis was performed to identify the 30% of EphMRA ATC 2 categories which
accounted for about 80% of the total consumption in each country. The number of EphMRA ATC 2
categories therefore differed between countries (See annex 5: Distribution of consumption for the
distribution charts of Estonia, Latvia, Lithuania, Romania and Poland).
An interesting finding was that all the EphMRA ATC 2 categories that accounted for 80% of the total
consumption in Estonia were declining for the period Q4 08 + Q1 09 compared to Q4 07 + Q1 08
(see Table 3Table 3). In the other countries some groups declined but other groups increased. In
Poland, the country which was not really influenced by the economic recession, the consumption in
the majority of EphMRA ATC 2 categories increased (see Table 7).
There were 13 EphMRA ATC 2 categories which declined in at least 3 of the recession hit countries
when Q4 07+Q1 08 was compared with Q4 08+Q1 09(see Table 3-7). Most of these EphMRA ATC 2
categories showed major declines but these declines may not necessarily have a harmful effect on
public health. Categories which will probably have little impact on public health include A11
Vitamins and R1 Nasal preparations. M1 Antireumatics systemically (declined by -20,6% to -0,3%), S1
Opthalmologicals (declined by -20,2% to -0,0%) and N5 Psycholeptics (declined by -19,8% to -0,9%)
were identified as the most important EphMRA ATC 2 categories that showed a decline in this period
in the Baltic States and Romania and not in Poland. Although the EphMRA ATC 2 category N6
Psychoanaleptics only declined in two of the four recession hit countries this group was seen to be of
considerable importance. It is a group closely related to N5 Psycholeptics and therefore worth
further investigation.
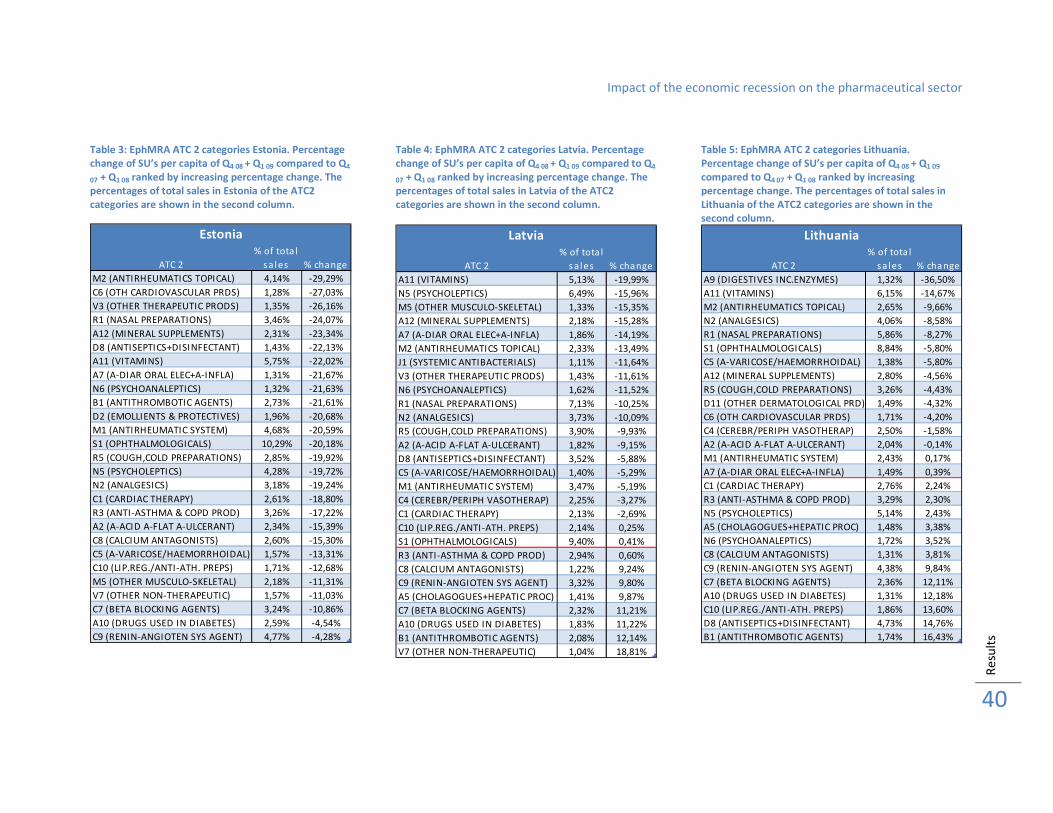
Impact of the economic recession on the pharmaceutical sector
Re
sult
s
40
Table 3: EphMRA ATC 2 categories Estonia. Percentage
change of SU’s per capita of Q4 08 + Q1 09 compared to Q4
07 + Q1 08 ranked by increasing percentage change. The
percentages of total sales in Estonia of the ATC2
categories are shown in the second column.
ATC 2
% of tota l
sa les % change
M2 (ANTIRHEUMATICS TOPICAL) 4,14% -29,29%
C6 (OTH CARDIOVASCULAR PRDS) 1,28% -27,03%
V3 (OTHER THERAPEUTIC PRODS) 1,35% -26,16%
R1 (NASAL PREPARATIONS) 3,46% -24,07%
A12 (MINERAL SUPPLEMENTS) 2,31% -23,34%
D8 (ANTISEPTICS+DISINFECTANT) 1,43% -22,13%
A11 (VITAMINS) 5,75% -22,02%
A7 (A-DIAR ORAL ELEC+A-INFLA) 1,31% -21,67%
N6 (PSYCHOANALEPTICS) 1,32% -21,63%
B1 (ANTITHROMBOTIC AGENTS) 2,73% -21,61%
D2 (EMOLLIENTS & PROTECTIVES) 1,96% -20,68%
M1 (ANTIRHEUMATIC SYSTEM) 4,68% -20,59%
S1 (OPHTHALMOLOGICALS) 10,29% -20,18%
R5 (COUGH,COLD PREPARATIONS) 2,85% -19,92%
N5 (PSYCHOLEPTICS) 4,28% -19,72%
N2 (ANALGESICS) 3,18% -19,24%
C1 (CARDIAC THERAPY) 2,61% -18,80%
R3 (ANTI-ASTHMA & COPD PROD) 3,26% -17,22%
A2 (A-ACID A-FLAT A-ULCERANT) 2,34% -15,39%
C8 (CALCIUM ANTAGONISTS) 2,60% -15,30%
C5 (A-VARICOSE/HAEMORRHOIDAL) 1,57% -13,31%
C10 (LIP.REG./ANTI-ATH. PREPS) 1,71% -12,68%
M5 (OTHER MUSCULO-SKELETAL) 2,18% -11,31%
V7 (OTHER NON-THERAPEUTIC) 1,57% -11,03%
C7 (BETA BLOCKING AGENTS) 3,24% -10,86%
A10 (DRUGS USED IN DIABETES) 2,59% -4,54%
C9 (RENIN-ANGIOTEN SYS AGENT) 4,77% -4,28%
Estonia
Table 4: EphMRA ATC 2 categories Latvia. Percentage
change of SU’s per capita of Q4 08 + Q1 09 compared to Q4
07 + Q1 08 ranked by increasing percentage change. The
percentages of total sales in Latvia of the ATC2
categories are shown in the second column.
ATC 2
% of tota l
s ales % change
A11 (VITAMINS) 5,13% -19,99%
N5 (PSYCHOLEPTICS) 6,49% -15,96%
M5 (OTHER MUSCULO-SKELETAL) 1,33% -15,35%
A12 (MINERAL SUPPLEMENTS) 2,18% -15,28%
A7 (A-DIAR ORAL ELEC+A-INFLA) 1,86% -14,19%
M2 (ANTIRHEUMATICS TOPICAL) 2,33% -13,49%
J1 (SYSTEMIC ANTIBACTERIALS) 1,11% -11,64%
V3 (OTHER THERAPEUTIC PRODS) 1,43% -11,61%
N6 (PSYCHOANALEPTICS) 1,62% -11,52%
R1 (NASAL PREPARATIONS) 7,13% -10,25%
N2 (ANALGESICS) 3,73% -10,09%
R5 (COUGH,COLD PREPARATIONS) 3,90% -9,93%
A2 (A-ACID A-FLAT A-ULCERANT) 1,82% -9,15%
D8 (ANTISEPTICS+DISINFECTANT) 3,52% -5,88%
C5 (A-VARICOSE/HAEMORRHOIDAL) 1,40% -5,29%
M1 (ANTIRHEUMATIC SYSTEM) 3,47% -5,19%
C4 (CEREBR/PERIPH VASOTHERAP) 2,25% -3,27%
C1 (CARDIAC THERAPY) 2,13% -2,69%
C10 (LIP.REG./ANTI-ATH. PREPS) 2,14% 0,25%
S1 (OPHTHALMOLOGICALS) 9,40% 0,41%
R3 (ANTI-ASTHMA & COPD PROD) 2,94% 0,60%
C8 (CALCIUM ANTAGONISTS) 1,22% 9,24%
C9 (RENIN-ANGIOTEN SYS AGENT) 3,32% 9,80%
A5 (CHOLAGOGUES+HEPATIC PROC) 1,41% 9,87%
C7 (BETA BLOCKING AGENTS) 2,32% 11,21%
A10 (DRUGS USED IN DIABETES) 1,83% 11,22%
B1 (ANTITHROMBOTIC AGENTS) 2,08% 12,14%
V7 (OTHER NON-THERAPEUTIC) 1,04% 18,81%
Latvia
Table 5: EphMRA ATC 2 categories Lithuania.
Percentage change of SU’s per capita of Q4 08 + Q1 09
compared to Q4 07 + Q1 08 ranked by increasing
percentage change. The percentages of total sales in
Lithuania of the ATC2 categories are shown in the
second column.
ATC 2
% of tota l
sa les % change
A9 (DIGESTIVES INC.ENZYMES) 1,32% -36,50%
A11 (VITAMINS) 6,15% -14,67%
M2 (ANTIRHEUMATICS TOPICAL) 2,65% -9,66%
N2 (ANALGESICS) 4,06% -8,58%
R1 (NASAL PREPARATIONS) 5,86% -8,27%
S1 (OPHTHALMOLOGICALS) 8,84% -5,80%
C5 (A-VARICOSE/HAEMORRHOIDAL) 1,38% -5,80%
A12 (MINERAL SUPPLEMENTS) 2,80% -4,56%
R5 (COUGH,COLD PREPARATIONS) 3,26% -4,43%
D11 (OTHER DERMATOLOGICAL PRD) 1,49% -4,32%
C6 (OTH CARDIOVASCULAR PRDS) 1,71% -4,20%
C4 (CEREBR/PERIPH VASOTHERAP) 2,50% -1,58%
A2 (A-ACID A-FLAT A-ULCERANT) 2,04% -0,14%
M1 (ANTIRHEUMATIC SYSTEM) 2,43% 0,17%
A7 (A-DIAR ORAL ELEC+A-INFLA) 1,49% 0,39%
C1 (CARDIAC THERAPY) 2,76% 2,24%
R3 (ANTI-ASTHMA & COPD PROD) 3,29% 2,30%
N5 (PSYCHOLEPTICS) 5,14% 2,43%
A5 (CHOLAGOGUES+HEPATIC PROC) 1,48% 3,38%
N6 (PSYCHOANALEPTICS) 1,72% 3,52%
C8 (CALCIUM ANTAGONISTS) 1,31% 3,81%
C9 (RENIN-ANGIOTEN SYS AGENT) 4,38% 9,84%
C7 (BETA BLOCKING AGENTS) 2,36% 12,11%
A10 (DRUGS USED IN DIABETES) 1,31% 12,18%
C10 (LIP.REG./ANTI-ATH. PREPS) 1,86% 13,60%
D8 (ANTISEPTICS+DISINFECTANT) 4,73% 14,76%
B1 (ANTITHROMBOTIC AGENTS) 1,74% 16,43%
Lithuania

Impact of the economic recession on the pharmaceutical sector
Re
sult
s
41
Table 6: EphMRA ATC 2 categories Romania.
Percentage change SU’s per capita of Q4 08 + Q1 09
compared to Q4 07 + Q1 08 ranked by increasing
percentage change. The percentages of total sales in
Romania of the ATC2 categories are shown in the
second column.
ATC 2
% of total
sa l es
Abs olute
cha nge % cha nge
M2 (ANTIRHEUMATICS TOPICAL) 2,49% -2,50 -29,41%
J1 (SYSTEMIC ANTIBACTERIALS) 5,24% -3,23 -18,13%
C3 (DIURETICS) 2,83% -1,30 -14,82%
N2 (ANALGESICS) 10,96% -4,90 -14,30%
A5 (CHOLAGOGUES+HEPATIC PROC) 2,01% -0,82 -12,88%
C4 (CEREBR/PERIPH VASOTHERAP) 3,58% -0,74 -6,85%
R5 (COUGH,COLD PREPARATIONS) 2,86% -0,57 -5,12%
R3 (ANTI-ASTHMA & COPD PROD) 3,38% -0,53 -5,08%
A2 (A-ACID A-FLAT A-ULCERANT) 2,86% -0,41 -4,73%
S1 (OPHTHALMOLOGICALS) 6,94% -0,87 -4,67%
M1 (ANTIRHEUMATIC SYSTEM) 2,89% -0,34 -4,02%
R1 (NASAL PREPARATIONS) 6,41% -0,66 -3,09%
A3 (GAST-INTEST DISORD DRUG) 2,43% -0,17 -2,40%
N5 (PSYCHOLEPTICS) 3,52% -0,08 -0,75%
B1 (ANTITHROMBOTIC AGENTS) 2,47% 0,09 1,30%
C9 (RENIN-ANGIOTEN SYS AGENT) 5,41% 0,27 1,74%
A10 (DRUGS USED IN DIABETES) 2,62% 0,44 6,04%
C1 (CARDIAC THERAPY) 4,27% 0,87 7,33%
C7 (BETA BLOCKING AGENTS) 3,52% 1,32 13,45%
Romania
Table 7: EphMRA ATC 2 categories Poland. Percentage
change SU’s per capita of Q4 08 + Q1 09 compared to Q4 07
+ Q1 08 ranked by increasing percentage change. The
percentages of total sales in Poland of the ATC2
categories are shown in the second column.
ATC 2
% of tota l
s al es % change
A12 (MINERAL SUPPLEMENTS) 3,40% -10,16%
J1 (SYSTEMIC ANTIBACTERIALS) 1,40% -4,48%
C1 (CARDIAC THERAPY) 2,49% -3,72%
A11 (VITAMINS) 6,41% -3,51%
A5 (CHOLAGOGUES+HEPATIC PROC) 1,65% -1,76%
D11 (OTHER DERMATOLOGICAL PRD) 1,19% -1,03%
N5 (PSYCHOLEPTICS) 3,53% -0,73%
S1 (OPHTHALMOLOGICALS) 6,67% -0,19%
R2 (THROAT PREPARATIONS) 1,29% 0,14%
C5 (A-VARICOSE/HAEMORRHOIDAL) 1,72% 0,87%
N2 (ANALGESICS) 3,97% 1,19%
R5 (COUGH,COLD PREPARATIONS) 3,76% 1,56%
M1 (ANTIRHEUMATIC SYSTEM 1,91% 1,91%
R3 (ANTI-ASTHMA & COPD PROD) 4,36% 2,30%
M2 (ANTIRHEUMATICS TOPICAL) 2,82% 2,50%
R1 (NASAL PREPARATIONS) 4,82% 3,00%
N6 (PSYCHOANALEPTICS) 2,41% 3,02%
B1 (ANTITHROMBOTIC AGENTS) 2,89% 3,29%
D8 (ANTISEPTICS+DISINFECTANT) 4,37% 3,68%
C8 (CALCIUM ANTAGONISTS) 1,47% 4,58%
G4 (UROLOGICALS) 1,54% 5,23%
C7 (BETA BLOCKING AGENTS) 3,00% 6,88%
C3 (DIURETICS) 2,44% 8,59%
A2 (A-ACID A-FLAT A-ULCERANT) 3,52% 9,15%
A10 (DRUGS USED IN DIABETES) 2,12% 11,39%
C9 (RENIN-ANGIOTEN SYS AGENT) 4,00% 15,18%
C10 (LIP.REG./ANTI-ATH. PREPS) 1,95% 19,03%
Poland

Impact of the economic recession on the pharmaceutical sector
Re
sult
s
42
A more detailed analysis on EphMRA ATC 3 level showed that the decline of EphMRA ATC 2 category
M1 antirheumatics was caused by a decline in M1A Non steroidal anti-inflammatory drugs (NSAIDs)
(see Table 8
Table 8). M1C specific antirheumatic agents was the group of concern regarding to public health.
Notable is the fact that only in Lithuania methotrexate was included in the specific antirheumatic
agents in the data from IMS. In the other countries methothrexate is included in a different EphMRA
ATC 3 category. Methothrexate is the gold standard in the treatment of rheumatoid arthritis.
Therefore it is not clear how representative the changes shown here are for the treatment of
rheumatoid arthritis.
Table 8: Subdivision of EphMRA ATC 2 category M1 Antirheumatics into EphMRA ATC 3 categories. Percentage change in
SU’s per capita for Q4 08 + Q1 09 compared to Q4 07 + Q1 08.
M1 Antirheumatics
Country ATC 3
Estonia M1A (ANTIRHEUMATIC N-STEROID) 4,58% -20,79%
Latvia M1A (ANTIRHEUMATIC N-STEROID) 3,43% -5,28%
Lithuania M1A (ANTIRHEUMATIC N-STEROID) 2,40% 0,14%
Romania M1A (ANTIRHEUMATIC N-STEROID) 2,85% -4,36%
Poland M1A (ANTIRHEUMATIC N-STEROID) 1,90% 1,92%
Estonia M1C (SPEC ANTIRHEUMATIC AGENT) 0,08% -9,09%
Latvia M1C (SPEC ANTIRHEUMATIC AGENT) 0,01% 15,45%
Lithuania M1C (SPEC ANTIRHEUMATIC AGENT) 0,02% 4,66%
Poland M1C (SPEC ANTIRHEUMATIC AGENT) 0,00% -0,43%
Romania M1C (SPEC ANTIRHEUMATIC AGENT) 0,03% 31,01%
% of tota l
sa les% change
The EphMRA ATC 2 category S1 Opthamologicals consists of 15 subcategories at EphMRA ATC 3
level. The complete table can be found in Annex 6: S1 Opthamologicals. Only the EphMRA ATC 3
category S1E Miotics and antiglaucoma preparations was identified as important for public health
and therefore shown here (Table 9). This table shows that only in Estonia there was a small decline
(-0,28%) in the consumption of this medication. The other countries showed an increase in
consumption, in Latvia the consumption even increased with +24%. The decline of EphMRA ATC 2
category S1 is caused by other subcategories as S1A anti-infectives and S1K artificial tears.
Table 9: Percentage change of SU’s per capita for Q4 08 + Q1 09 compared to Q4 07 + Q1 08 for S1E Miotics and antiglaucoma
preparations. Only Estonia showed a small decline of -0,28%.
S1 OpthamologicalsCountry atc3
Estonia S1E (MIOTICS+ANTIGLAUC.PREPS.) 2,43% -0,28%
Latvia S1E (MIOTICS+ANTIGLAUC.PREPS.) 1,64% 24,20%
Lithuania S1E (MIOTICS+ANTIGLAUC.PREPS.) 1,77% 5,28%
Romania S1E (MIOTICS+ANTIGLAUC.PREPS.) 1,39% 6,87%
Poland S1E (MIOTICS+ANTIGLAUC.PREPS) 1,22% 2,28%
% of total
sales % change

Impact of the economic recession on the pharmaceutical sector
Re
sult
s
43
In the EphMRA ATC 2 category N5 Psycholeptics N5A Antipsychotics and N5C Tranquilizers declined
in three of the four recession struck countries (Table 10). N5A met the fixed criteria for identification
of possible marker products. The consumption of this EphMRA ATC3 category was therefore
investigated in more detail on product level (EphMRA ATC 4 level). Less use of N5C tranquilizers
does not necessarily have a negative impact on public health, therefore this group was not examined
in more detail.
Table 10: Subdivision of EphMRA ATC 2 category N5 Psycholeptics in EphMRA ATC 3 categories. Percentage change in
SU’s per capita for Q4 08 + Q1 09 compared with Q4 07 + Q1 08.
N5 PsycholepticsCountry ATC 3
Estonia N5A (ANTIPSYCHOTICS) 1,02% -20,93%
Latvia N5A (ANTIPSYCHOTICS) 1,06% -3,42%
Lithuania N5A (ANTIPSYCHOTICS) 0,71% -0,63%
Romania N5A (ANTIPSYCHOTICS) 0,41% 1,62%
Poland N5A (ANTIPSYCHOTICS) 1,13% -1,84%
Estonia N5B (HYPNOTICS & SEDATIVES) 2,14% -21,01%
Latvia N5B (HYPNOTICS & SEDATIVES) 3,90% -23,53%
Lithuania N5B (HYPNOTICS & SEDATIVES) 2,18% 5,23%
Romania N5B (HYPNOTICS & SEDATIVE) 1,59% 1,32%
Poland N5B (HYPNOTICS & SEDATIVES) 1,29% 1,21%
Estonia N5C (TRANQUILLISERS) 1,12% -16,03%
Latvia N5C (TRANQUILLISERS) 1,51% -4,33%
Lithuania N5C (TRANQUILLISERS) 2,24% 0,67%
Romania N5C (TRANQUILLISERS) 1,51% -3,65%
Poland N5C (TRANQUILLISERS) 1,10% -1,88%
% of tota l
sa les % cha nge
Figure 29 shows the development of haloperidol for the period Q1 07 – Q3 09. Haloperidol is the most
used classic antipsychotic in these five countries. The development of the two most used atypical
antipsychotics in these five countries, clozapine and olanzapine, are shown in figures 30 & 31. The
use of these core drugs hardly declined. Haloperidol is declining in Estonia but this decline already
started before the recession.
1,12
0,75
1,07
0,91
0,82
1,02
0,87
0,96
0,60
0,70
0,80
0,90
1,00
1,10
1,20
Q1 07 Q2 07 Q3 07 Q4 07 Q1 08 Q2 08 Q3 08 Q4 08 Q1 09 Q2 09 Q3 09
Haloperidol (Evolution on Q1 08)
Estonia Latvia Lithuania Poland Romania
Figure 29: Volume of consumption of haloperidol in Estonia, Latvia, Lithuania, Romania and Poland in SU per capita for
the period Q1 07 – Q3 09 indexed on Q1 08.

Impact of the economic recession on the pharmaceutical sector
Re
sult
s
44
0,78
0,93
0,80
0,98 0,99
0,85
0,92
0,60
0,70
0,80
0,90
1,00
1,10
1,20
Q1 07 Q2 07 Q3 07 Q4 07 Q1 08 Q2 08 Q3 08 Q4 08 Q1 09 Q2 09 Q3 09
Clozapine (Evolution on Q1 08)
Estonia Latvia Lithuania Poland Romania
Figure 30: Volume of consumption of clozapine in Estonia, Latvia, Lithuania, Romania and Poland in SU per capita for the
period Q1 07 – Q3 09 indexed on Q1 08.
0,76
1,29
0,86
0,93
1,01
0,86
1,10
0,70
0,80
0,90
1,00
1,10
1,20
1,30
Q1 07 Q2 07 Q3 07 Q4 07 Q1 08 Q2 08 Q3 08 Q4 08 Q1 09 Q2 09 Q3 09
Olanzapine (Evolution on Q1 08)
Estonia Latvia Lithuania Poland Romania
Figure 31: Volume of consumption of olazapine in Estonia, Latvia, Lithuania, Romania and Poland in SU per capita for the
period Q1 07 – Q3 09 indexed on Q1 08.

Impact of the economic recession on the pharmaceutical sector
Re
sult
s
45
Table 11 shows the changes of the EphMRA ATC 3 categories belonging to EphMRA ATC 2 category
N6 Psychoanaleptics. The only group which had a decline in three of the four recession hit countries
is N6E Neurotonics and other preparations. This group was not considered to have great importance
for public health and was therefore not examined in more detail. A striking detail which can be seen
in table 11 was that the use of antidepressants in Estonia was declining by almost -20%. It was
expected that the incidence of depression would increase because of the rise in unemployment
caused by the recession. Therefore an increase in the consumption of antidepressants was expected.
This was the reason to have a more detailed look at the developments on product level of this
EphMRA ATC 3 category.
Table 11: Subdivision of ATC 2 category N6 Psychoanaleptics in ATC 3 categories. Percentage change in SU’s per capita
for Q4 08 + Q1 09 compared to Q4 07 + Q1 08.
N6 PsychoanalepticsCountry ATC 3
Estonia N6A (ANTIDEPRES&MOOD STABIL) 1,09% -19,18%
Latvia N6A (ANTIDEPRES&MOOD STABIL) 0,48% 0,33%
Lithuania N6A (ANTIDEPRES&MOOD STABIL) 0,76% 1,54%
Romania N6A (ANTIDEPRES&MOOD STABIL) 0,56% 3,93%
Poland N6A (ANTIDEPRES&MOOD STABIL) 1,00% 2,16%
Estonia N6B (PSYCHOSTIMULANTS) 0,10% -36,95%
Latvia N6B (PSYCHOSTIMULANTS) 0,00% 31,16%
Lithuania N6B (PSYCHOSTIMULANTS) 0,00% -89,75%
Romania N6B (PSYCHOSTIMULANTS) 0,00% 374,72%
Poland N6B (PSYCHOSTIMULANTS) 0,00% 26,10%
Estonia N6D (NOOTROPICS) 0,05% -10,57%
Latvia N6D (NOOTROPICS) 1,09% -15,07%
Lithuania N6D (NOOTROPICS) 0,84% 6,70%
Romania N6D (NOOTROPICS) 0,52% 8,24%
Poland N6D (NOOTROPICS) 1,40% 3,65%
Estonia N6E (NEUROTONICS+OTHER PREPS) 0,08% -39,56%
Latvia N6E (NEUROTONICS+OTHER PREPS) 0,05% -37,90%
Lithuania N6E (NEUROTONICS+OTHER PREPS) 0,11% -2,68%
Romania N6E (NEUROTONICS+OTHER PREPS) 0,02% 10,44%
Poland N6E (NEUROTONICS+OTHER PREPS) 0,00% -8,15%
% of tota l
sa les% change
In Annex 6: N6A Antidepressants and mood stabilisators the development of the EphMRA ATC 3
category N6A Antidepressants and mood stabilisators can be found. Amitryptyline is one of the most
used products in this EphMRA ATC 3 category. In Estonia the use of amitryptyline declined by -29,8%
(see Figure 32). In the other countries such a severe decline is not seen, the consumption stayed
rather flat.

Impact of the economic recession on the pharmaceutical sector
Re
sult
s
46
0,70
0,95
0,83
1,07
0,79
0,90
1,16
0,94
0,60
0,70
0,80
0,90
1,00
1,10
1,20
Q1 07 Q2 07 Q3 07 Q4 07 Q1 08 Q2 08 Q3 08 Q4 08 Q1 09 Q2 09 Q3 09
Amitriptyline (Evolution on Q1 08)
Estonia Latvia Lithuania Poland Romania
Figure 32: Volume of the consumption of amitryptyline in the Baltic States, Romania and Poland in SU’s per capita from
Q1 07 – Q3 09 indexed on Q1 08.

Impact of the economic recession on pharmaceutical consumption
Dis
cuss
ion
47
Discussion
Key findings
Although the economic recession affected many countries, only a few countries showed a
substantial decline in pharmaceutical consumption. The European region was the WHO region with
the most severe decline in consumption (-6% in Q3 09 compared to Q1 08). The countries with the most
severe decline in pharmaceutical consumption were the Baltic States with a -28% decline in Estonia,
-24% in Latvia and -17% in Lithuania (Q3 09 compared to Q1 08). There was a moderate correlation (r2=
0,65 in Q3 09) between worsening of the economic situation of a country as measured by GDP decline
and the decline in pharmaceutical consumption.
The decline in consumption of medicines for acute indications was not more severe than the decline
for chronic indications. Only the WHO region EUR showed a slight trend towards this difference in
decline but this trend was not very strong.
Economic stress could have the consequence that consumers and health services choose to
consume non patent protected generics instead of patent protected brands. Our hypothesis is that
such a shift would occur. The IMS Health data helped us to investigate such a shift from original &
licensed brands to other brands & unbranded medicines. The original & licensed brands usually
correspond to the patent protected medicines and other brands & unbranded medicines can
correspond with generic medicines whether branded or unbranded. In some circumstances branded
generics may be priced higher than original brands but usually they are not. No shift from original &
licensed brands to other brands & unbranded medicines was seen. Based on the data available for
this study the hypothesis that a shift from original & licensed brands to other brands & unbranded
medicines would occur has been rejected.
A more severe price increase of pharmaceuticals was expected in countries with a more severe
economic recession due to an increase in price of imported raw materials and medicines caused by a
lower exchange rate of the local currency against a hard currency. Although all countries had an
increase in pharmaceutical prices, there was no correlation between an increase in pharmaceutical
prices and a more severe economic recession in a country. Pharmaceutical prices in Estonia
increased by +21% in Q3 09 compared to Q1 08, but prices in Latvia and Lithuania hardly increased
(+1% in Q3 09 compared to Q1 08). Malaysia showed a striking price increase of +16% (in Q4 09
compared to Q1 08). The reason why Malaysia showed this severe price increase is not yet known.
The shift from private to public sector did not occur in the five countries where these data were
available. Mexico indeed showed a shift from private to public sector which mainly consists of the
private hospitals, insurances and excludes public tenders. The shift particularly occurred for original
& licensed brands in Mexico. In Brazil, Uruguay and South Africa the consumption in both private
and public sector was growing although not at the same pace. The shift in Mexico is probably not
caused by the economic recession but by a health reform which was implemented during this time
period.
When the EphMRA ATC 2/3/4 categories were examined more closely for identifying marker
products, there were only four EphMRA ATC 2 categories which declined in the Baltic States and

Impact of the economic recession on pharmaceutical consumption
Dis
cuss
ion
48
Romania and could have a negative impact on public health if used less. The EphMRA ATC 3
categories N5A Antipsychotics and N6A antidepressants and mood stabilisators were examined at
product level. There were no marker products found in these categories that declined consistently.
Strengths and limitations of this study
The data provided by IMS made it possible to compare pharmaceutical consumption, expenditure
and prices across many countries. Although only 12 African countries were covered by the IMS data
we were still able to study the changes in pharmaceutical consumption, expenditure and prices in 84
countries world wide.
IMS collects its data at a single point in the distribution chain. They use estimates to extrapolate the
values to other parts of the supply chain. The actual values of for example the pharmaceutical
consumption at these estimated points therefore need to be treated with care. However data is
collected at the same point every time by a validated process which makes it very suitable for
detecting changes in consumption over time. Therefore the extrapolation did not affect this study.
The estimations of the pharmaceutical prices can differ from the actual prices the consumers pay for
their pharmaceuticals. Average prices per SU are calculated by dividing the value of total sales by
total volume consumed. Changes in products, generic market share, governments policies related to
reimbursement prices and approved margins can therefore cause changes in price estimates.
Therefore the estimations for prices and thus expenditure are a less reliable indicator of the impact
of the economic recession than the estimations on consumption. The main conclusions of this report
are therefore mainly based on the pharmaceutical consumption data and less on data of
pharmaceutical expenditure and prices.
Trend analysis is an adequate tool to investigate the influence on the recession. Extrapolating the
normal development of pharmaceutical consumption over a longer period of time would generate
more accurate knowledge about the recession impact. Unfortunately, such data was not available
for this study. The collection of this data has started from 2007, so no extrapolation could be made
and no regular trend analysis could be used. Besides the limited data available it is probably difficult
to make a “normal” trend line for pharmaceutical consumption. Pharmaceutical consumption
depends on many factors. Seasonal variation is one of the factors which can be corrected for, but it
is more difficult to correct for changes in treatment guidelines, availability of pharmaceuticals etc.
Although we have not applied a regular trend analysis, we were still able to see a sudden decline in
pharmaceutical consumption, expenditure and prices (after a period of increase) in some countries
and regions, which indicated that those countries and regions were probably affected by the
economic crisis. In countries where the consumption changed, the pharmaceutical consumption was
investigated in more detail at EphMRA ATC 2, ATC 3 and ATC 4 level.
As a result of the limited data points available only two points in time were compared in this report
for the analysis on EphMRA ATC 2 and ATC 3 level. This hampers making a distinction between
trends started before the recession and changes caused by the recession. By making graphics of the
developments of the consumption at product level, products were eliminated which had a decline
which already started before the recession.
The recession did not start in all countries at the same time. It is also not clear if all countries are
recovering at the same pace. It might be possible that a decline in specific EphMRA ATC categories is
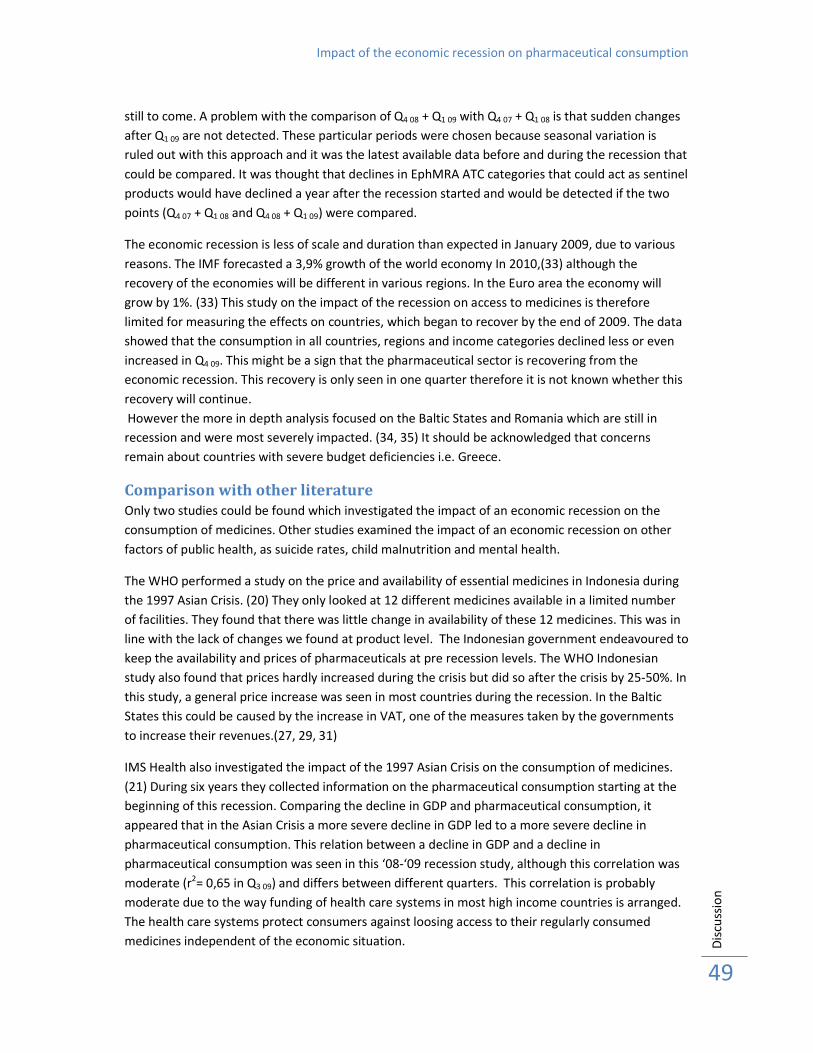
Impact of the economic recession on pharmaceutical consumption
Dis
cuss
ion
49
still to come. A problem with the comparison of Q4 08 + Q1 09 with Q4 07 + Q1 08 is that sudden changes
after Q1 09 are not detected. These particular periods were chosen because seasonal variation is
ruled out with this approach and it was the latest available data before and during the recession that
could be compared. It was thought that declines in EphMRA ATC categories that could act as sentinel
products would have declined a year after the recession started and would be detected if the two
points (Q4 07 + Q1 08 and Q4 08 + Q1 09) were compared.
The economic recession is less of scale and duration than expected in January 2009, due to various
reasons. The IMF forecasted a 3,9% growth of the world economy In 2010,(33) although the
recovery of the economies will be different in various regions. In the Euro area the economy will
grow by 1%. (33) This study on the impact of the recession on access to medicines is therefore
limited for measuring the effects on countries, which began to recover by the end of 2009. The data
showed that the consumption in all countries, regions and income categories declined less or even
increased in Q4 09. This might be a sign that the pharmaceutical sector is recovering from the
economic recession. This recovery is only seen in one quarter therefore it is not known whether this
recovery will continue.
However the more in depth analysis focused on the Baltic States and Romania which are still in
recession and were most severely impacted. (34, 35) It should be acknowledged that concerns
remain about countries with severe budget deficiencies i.e. Greece.
Comparison with other literature
Only two studies could be found which investigated the impact of an economic recession on the
consumption of medicines. Other studies examined the impact of an economic recession on other
factors of public health, as suicide rates, child malnutrition and mental health.
The WHO performed a study on the price and availability of essential medicines in Indonesia during
the 1997 Asian Crisis. (20) They only looked at 12 different medicines available in a limited number
of facilities. They found that there was little change in availability of these 12 medicines. This was in
line with the lack of changes we found at product level. The Indonesian government endeavoured to
keep the availability and prices of pharmaceuticals at pre recession levels. The WHO Indonesian
study also found that prices hardly increased during the crisis but did so after the crisis by 25-50%. In
this study, a general price increase was seen in most countries during the recession. In the Baltic
States this could be caused by the increase in VAT, one of the measures taken by the governments
to increase their revenues.(27, 29, 31)
IMS Health also investigated the impact of the 1997 Asian Crisis on the consumption of medicines.
(21) During six years they collected information on the pharmaceutical consumption starting at the
beginning of this recession. Comparing the decline in GDP and pharmaceutical consumption, it
appeared that in the Asian Crisis a more severe decline in GDP led to a more severe decline in
pharmaceutical consumption. This relation between a decline in GDP and a decline in
pharmaceutical consumption was seen in this ‘08-‘09 recession study, although this correlation was
moderate (r2= 0,65 in Q3 09) and differs between different quarters. This correlation is probably
moderate due to the way funding of health care systems in most high income countries is arranged.
The health care systems protect consumers against loosing access to their regularly consumed
medicines independent of the economic situation.
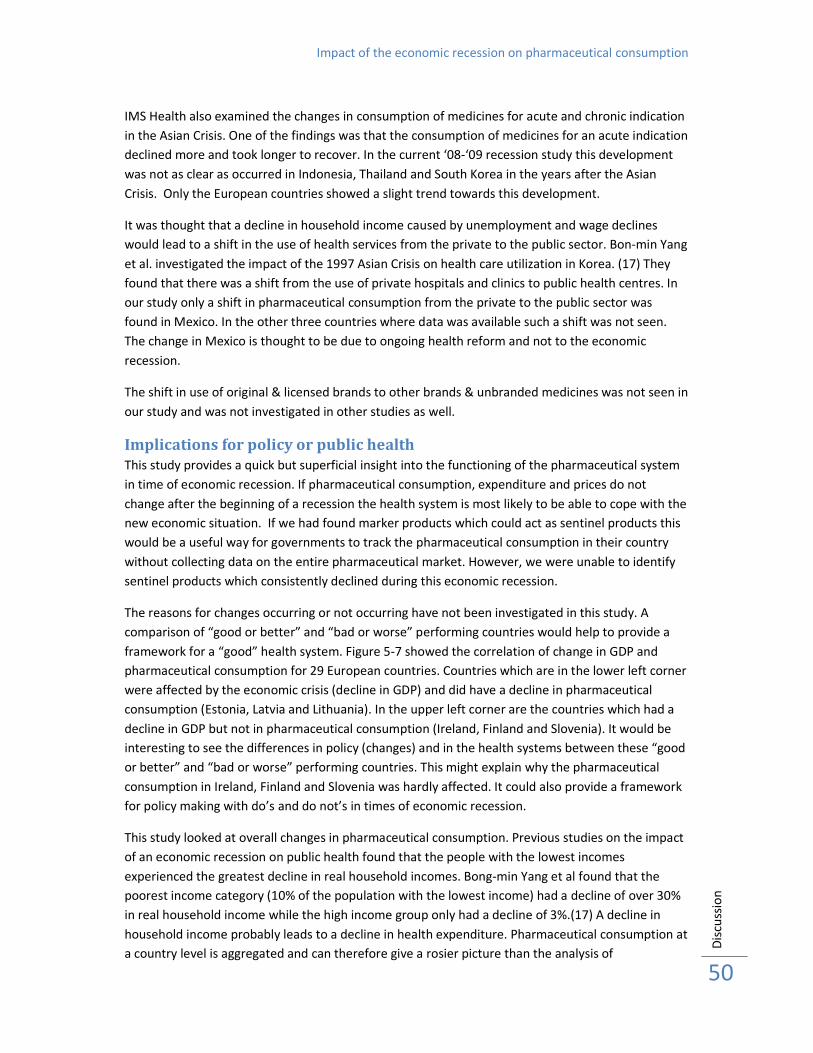
Impact of the economic recession on pharmaceutical consumption
Dis
cuss
ion
50
IMS Health also examined the changes in consumption of medicines for acute and chronic indication
in the Asian Crisis. One of the findings was that the consumption of medicines for an acute indication
declined more and took longer to recover. In the current ‘08-‘09 recession study this development
was not as clear as occurred in Indonesia, Thailand and South Korea in the years after the Asian
Crisis. Only the European countries showed a slight trend towards this development.
It was thought that a decline in household income caused by unemployment and wage declines
would lead to a shift in the use of health services from the private to the public sector. Bon-min Yang
et al. investigated the impact of the 1997 Asian Crisis on health care utilization in Korea. (17) They
found that there was a shift from the use of private hospitals and clinics to public health centres. In
our study only a shift in pharmaceutical consumption from the private to the public sector was
found in Mexico. In the other three countries where data was available such a shift was not seen.
The change in Mexico is thought to be due to ongoing health reform and not to the economic
recession.
The shift in use of original & licensed brands to other brands & unbranded medicines was not seen in
our study and was not investigated in other studies as well.
Implications for policy or public health
This study provides a quick but superficial insight into the functioning of the pharmaceutical system
in time of economic recession. If pharmaceutical consumption, expenditure and prices do not
change after the beginning of a recession the health system is most likely to be able to cope with the
new economic situation. If we had found marker products which could act as sentinel products this
would be a useful way for governments to track the pharmaceutical consumption in their country
without collecting data on the entire pharmaceutical market. However, we were unable to identify
sentinel products which consistently declined during this economic recession.
The reasons for changes occurring or not occurring have not been investigated in this study. A
comparison of “good or better” and “bad or worse” performing countries would help to provide a
framework for a “good” health system. Figure 5-7 showed the correlation of change in GDP and
pharmaceutical consumption for 29 European countries. Countries which are in the lower left corner
were affected by the economic crisis (decline in GDP) and did have a decline in pharmaceutical
consumption (Estonia, Latvia and Lithuania). In the upper left corner are the countries which had a
decline in GDP but not in pharmaceutical consumption (Ireland, Finland and Slovenia). It would be
interesting to see the differences in policy (changes) and in the health systems between these “good
or better” and “bad or worse” performing countries. This might explain why the pharmaceutical
consumption in Ireland, Finland and Slovenia was hardly affected. It could also provide a framework
for policy making with do’s and do not’s in times of economic recession.
This study looked at overall changes in pharmaceutical consumption. Previous studies on the impact
of an economic recession on public health found that the people with the lowest incomes
experienced the greatest decline in real household incomes. Bong-min Yang et al found that the
poorest income category (10% of the population with the lowest income) had a decline of over 30%
in real household income while the high income group only had a decline of 3%.(17) A decline in
household income probably leads to a decline in health expenditure. Pharmaceutical consumption at
a country level is aggregated and can therefore give a rosier picture than the analysis of

Impact of the economic recession on pharmaceutical consumption
Dis
cuss
ion
51
pharmaceutical consumption subdivided by income categories within a country. It would be very
useful to study if for example people who became unemployed and therefore lost their health
insurance consumed fewer medicines. People who kept their jobs and thus their income would
probably not have to change their pharmaceutical consumption patterns.
In times of economic recession government expenditures has to be examined carefully. This may
also be a suitable time to reform health care. Changes have to be made so it is a good time to
introduce more evidence based medicine. We found that the declines in pharmaceutical
consumption in Estonia, Latvia, Lithuania and Romania were mostly products like vitamin and
mineral supplements and cold and nose preparations. These products do not have evidence of
effectiveness and could be excluded from reimbursement lists to keep funds for “essential”
medicines.
Conclusion
This study showed that there were only a few countries which experienced a severe decline in
pharmaceutical consumption. For the 29 European countries a moderate correlation (r2=0,65 Q3 09)
was found between GDP decline and pharmaceutical consumption decline.
There was no distinction between the decline in medicines for acute and chronic indications, as was
seen in the 1997 Asian financial crisis.
The expected shifts in use from patent protected and licensed products to branded and other non
patent protected medicines and from private to public sector were not seen in this study. Mexico
might be an exception but the shift from private to public sector in this country is probably caused
by the health reform which was implemented during this time period.
It was expected that there would be a more severe price increase in countries which were affected
more by the economic crisis but this was not seen in this study. A general price increase was seen
but there was no association with the economic situation of the countries.
The decline in pharmaceutical consumption seems to be caused by a general decline in consumption
and not by particular products. Unfortunately, no marker products could be identified which could
be used by governments to track their pharmaceutical consumption and the functioning of their
health systems. The products which declined in all the recession struck countries were products with
a limited negative effect on public health if used less, i.e. vitamin and mineral supplements and cold
and nose preparations.
While most countries in 2010 have moved back into positive GDP growth some have not and there
are concerns about countries such as Greece with high budget deficits. There may be more to learn
from this recession which could guide future policy responses to future recessions.

Impact of the economic recession on pharmaceutical consumption
Re
fere
nce
s
52
References 1. Läänelaid S, and Ain Aaviksoo Economic slowdown shaping healthcare system. Health Policy
Monitor. 2009 April 2009.
2. Nagpal S. Latvian health minister quits over big budget cuts 2009 17 September 2009 [cited
21 September 2009]; Available from: http://www.topnews.in/latvian-health-minister-quits-
over-big-budget-cuts-2179023
3. Bailey M. Latvia makes healthcare budget cuts as economic crisis bites. Scrip News; 2009.
4. OECD. Health at a Glance 2007: OECD Indicators. 2007.
5. WHO. Health amid a financial crisis: a complex diagnosis. Bulletin World Health Organisation.
2009 January 2009;87(1):1-80.
6. David Stuckler SB, Mark Suhrcke, Adam Coutts, Martin McKee. The public health effect of
economic crises and alternative policy responses in Europe: an emperical analysis. The
Lancet. 2009 25 July 2009;374:315-23.
7. Tangcharoensathien V, Harnvoravongchai, P., Pitayarnagsarit, S., Kasemsup, V. Health
impacts of rapid economic changes in Thailand. Social Science & Medicine. 2001;51:789-807.
8. Cutler DM, Knaul, F., Lozano, R., Mendez, O., Zurita, B. Financial crisis, health outcomes and
ageing: Mexico in the 1980s and 1990s. Journal of Public Economics. 2002 15 March
2001;84:279-303.
9. Europe WROf. Health in times of global economic crisis:implications for the WHO European
Region: World Health Organisation; 2009 April 2008.
10. WHO. Indicators for Tracking the Effect of the Economic Crisis on Pharmaceutical
Consumption, Expenditures and Unit Prices. 2009.
11. Great Depression. Encyclopædia Britannica 2010 [cited 2010 15 January 2010]; Available
from: http://www.britannica.com/EBchecked/topic/243118/Great-Depression
12. Rasmussen H. A students guide to the great depression. Why did the great depression occur?
2010 [cited 2010 20 January 2010]; Available from:
http://economics.about.com/od/recessions/a/greatdepression_2.htm
13. Second Arab Oil Embargo, 1973-1974. [cited 2010 20 January 2010]; Available from:
http://www.state.gov/r/pa/ho/time/dr/96057.htm
14. Greenhouse S. Confrontation in the Gulf; Oil Crisis Like 1973's? It's Not Necessarily so. New
York Times. 1990 13 August 1990(New York edition):9.
15. Corporation FDI. The LDC Debt Crisis. History of the Eighties-Lessons for the future; 1997. p.
191-210.
16. Cellan-Jones R. Dot.com to Dot.bomb. BBC news. 2000 15 December 2000.
17. Yang BM, Prescott N, Bae EY. The impact of economic crisis on health-care consumption in
Korea. Health Policy Plan. 2001 Dec;16(4):372-85.
18. Hugh Waters FSaMP. The impact of the 1997-98 East Asian economic crisis on health and
health care in Indonesia. Health Policy and Planning. 2003;18(2):172-81.
19. Hopkins S. Economic stability and health status: Evidence from East Asia before and after the
1990s economic crisis. Health Policy. 2006;75:347-57.
20. Suryawati S, Ross-Degnan, D., Slamet, L.S., Nurita, P., Hogerzeil, H. Impact of the economic
crisis on availabiltiy, price and use of medicines in Indonesia 1997-2000. World Health
Organisation; 2004. p. 1-97.
21. Health I. The impact of the Asian Financial crisis on pharmaceutical consumption. 2008. p.
Powerpoint presentation.
22. Lithuania: Govt to cut social insurance budget by 6.4 pct Baltic Business News. 2009 12 April
2009.
23. Schuman M. Turning point for the global recession. Time Magazine Europe. 2009 14
september 2009;174(10).

Impact of the economic recession on pharmaceutical consumption
Re
fere
nce
s
53
24. Gumbel P. Fallen Stars. Time International Atlantic Ed. 2009 3 September 2009;174(10).
25. Allen. T. Euro area and EU 27 GDP up by 0,1%. Euroindicators 12 February 2010 [cited 18
February 2010]; Available from: http://epp.eurostat.ec.europa.eu/cache/ITY_PUBLIC/2-
12022010-BP/EN/2-12022010-BP-EN.PDF
26. government E. The government approved, in principle, the negative supplementary budget
in the amount of EEK 8 billion. 2009 [cited 2009 17 September 2009]; Available from:
http://www.valitsus.ee/?id=8908
27. Ilze Meюniece LG. Health care fees to increase as of March. Latvian News Agency. 2009 28
Januari 2009.
28. Lithuania: Revised budget of 2009 after Easter Baltic Business News. 2009 12 April 2009.
29. Saluse JaAA. Impact of taxation policy on pharmaceutical policy. 2008 October 2008;Health
Policy Monitor.
30. Industry Trend Analysis - Ministry Of Health Wrestling To Prevent Price Hikes BMI Industry
Insights - Pharma & Healthcare, Emerging Europe. 10 June 2009.
31. Thompson M. GP Visits and Other Medical Services to See Price Hike in Latvia from 2009
Global Insight Daily Analysis. 2008 13 October 2008.
32. About the ATC/DDD system. 2009 29-09-2009 [cited 2009 02-12-2009]; Available from:
www.whocc.no/atcddd/atcsystem.html
33. IMF. World Economic Outlook Update: A Policy-Driven, Multispeed Recovery. January, 26
2010 [cited 18 February 2010]; Available from:
http://www.imf.org/external/pubs/ft/weo/2010/update/01/index.htm
34. Seputyte M. Baltic Countries to Remain in Recessions in 2010, Danske Says. BusinessWeek.
2010 17 February 2010.
35. Simon Z, Brown, A. East Europe’s Recovery ‘Limps’ as Czech Slump Deepens (Update3).
BussinessWeek. 2010 February, 12 2010.

Impact of the economic recession on pharmaceutical consumption
54
Annexes
Annex 1: Correlation decline in GDP and pharmaceutical consumption ............................................. 55
Annex 2: Consumption of medicines with acute and chronic indication ............................................. 56
Annex 3: Consumption of original & licensed brands and others brands & unbranded medicines ..... 58
Annex 4: Shift from private to public .................................................................................................... 59
4.1: Consumption of medicines for acute and chronic indications ..................................................................................... 59
4.2: Consumption of original & licensed brands and other brands & unbranded medicines ............................................. 60
4.3: Pharmaceutical expenditure in private and public sector ........................................................................................... 61
Annex 5: Distribution of consumption .................................................................................................. 62
Annex 6: S1 Opthamologicals ............................................................................................................... 64

Impact of the economic recession on pharmaceutical consumption
55
Annex 1: Correlation decline in GDP and pharmaceutical consumption
AT BE
BGSE
CZ
EE
FI FRIT
GR
HUIE
LV
LT
LUNL
NO
PL
PT
ROSK
SLVES
CHTRGB
y = 0,8644x + 18,101
R² = 0,3914
75,00
80,00
85,00
90,00
95,00
100,00
105,00
110,00
80,00 85,00 90,00 95,00 100,00Ph
arm
ace
uti
cal
con
sum
pti
on
(in
de
xe
d Q
1 0
8)
Gross Domestic Product (indexed on Q1 08)
Correlation GDP and pharmaceutical consumption
EUR
(Q1 09 compared to Q1 08)
Figure 35: This figure shows the relation between change in GDP and the change in pharmaceutical consumption in 29
European Countries for Q1 09 compared to Q1 08. GDP and pharmaceutical consumption are given as an index compared
to the year before. A decrease in GDP leads to a lower pharmaceutical consumption although this correlation with a r2 =
0,3914 is not very strong.
AT
BE
BGSE
CZ
DK
EE
FI
FR
IT
GR
HU
IE
LV
LT
LU
NL
NO PLPT
RO
SK
SLV ES CHTR
GB
y = 0,7357x + 30,493
R² = 0,5934
80,00
85,00
90,00
95,00
100,00
105,00
80,00 85,00 90,00 95,00 100,00
Ph
arm
ace
uti
cal
con
sum
pti
on
(in
de
xe
d o
n Q
2 0
8)
Gross Domestic Product (indexed on Q2 08)
Correlation GDP and pharmaceutical consumption
EUR
(Q2 09 compared to Q2 08)
Figure 36: This figure shows the relation between change in GDP and the change in pharmaceutical consumption in 29
European Countries for Q2 09 compared to Q2 08. GDP and pharmaceutical consumption are given as an index compared
to the year before (r2 = 0,5934).

Impact of the economic recession on pharmaceutical consumption
56
Annex 2: Consumption of medicines with acute and chronic indication Looking in more detail to the consumption on country level, the consumption of acute and chronic
medication is decreasing in the Estonia, Latvia, Lithuania and Romania. (Figures 37 & 38) The
consumption of medicines for an acute indication decreased more than the consumption of chronic
medication. The consumption of acute and chronic medication in Poland has the same pattern for
both categories. There is a peak in consumption in Q1 09 after which the consumption drops again to
respectively 91% and 93% of the consumption in Q1 08. In Malaysia the consumption of acute
medicines is decreasing compared to Q1 08, although the decrease is getting less (Figures 39 & 40). In
Q3 09 the consumption is only -3% less than in Q1 08. China shows more increase in the consumption of
acute medicines (+53% Q3 09) than for chronic medication (+30% Q3 09).
0,981,00
0,92
0,98
0,77
1,12
0,82
1,03
0,88
0,95
0,60
0,70
0,80
0,90
1,00
1,10
Q1 07 Q2 07 Q3 07 Q4 07 Q1 08 Q2 08 Q3 08 Q4 08 Q1 09 Q2 09 Q3 09 Q4 09
Consumption of medicines for acute indication
EUR, Baltic countries, Poland and Romania(Evolution on Q1 08)
EUR POLAND ESTONIA LATVIA LITHUANIA ROMANIA
Figure 37: Consumption of medicines with an acute indication in EUR, Poland, Romania and Baltic States. Estonia has the
most severe decline in consumption of acute medicines (-38% in Q3 09), while the decline in consumption of acute
medicines in Lithuania is considerably less compared to Estonia and Latvia.
0,98
1,031,01
0,93
1,01
0,87
1,03
0,88
0,99
0,70
0,75
0,80
0,85
0,90
0,95
1,00
1,05
1,10
Q1 07 Q2 07 Q3 07 Q4 07 Q1 08 Q2 08 Q3 08 Q4 08 Q1 09 Q2 09 Q3 09 Q4 09
Consumption of medicines for chronic indication
EUR, Baltic countries, Poland and Romania(Evolution on Q1 08)
EUR POLAND ESTONIA LATVIA LITHUANIA ROMANIA
Figure 38: Consumption of medicines with a chronic indication in EUR, Poland, Romania and the Baltic States. Similar to
the acute indication are Estonia and Latvia the countries with the most decline in consumption. In this situation the
decrease in Lithuania is more in line with the decrease in the other Baltic States.
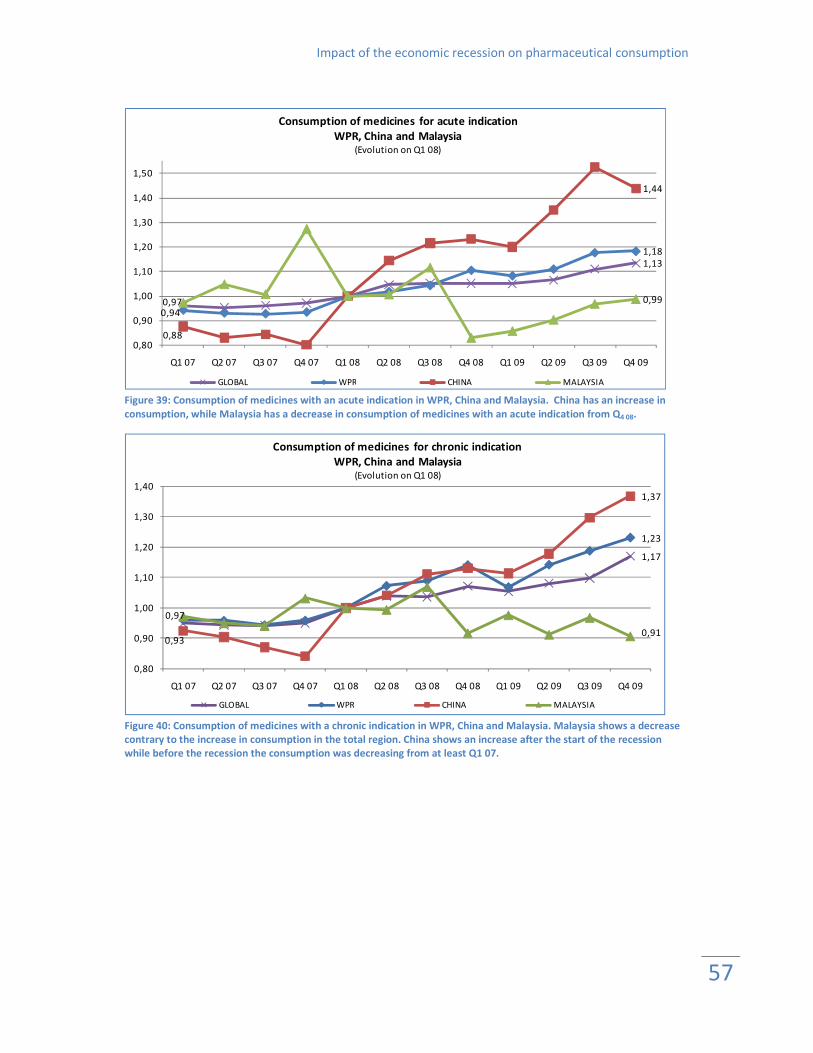
Impact of the economic recession on pharmaceutical consumption
57
1,13
0,94
1,18
0,88
1,44
0,97 0,99
0,80
0,90
1,00
1,10
1,20
1,30
1,40
1,50
Q1 07 Q2 07 Q3 07 Q4 07 Q1 08 Q2 08 Q3 08 Q4 08 Q1 09 Q2 09 Q3 09 Q4 09
Consumption of medicines for acute indication
WPR, China and Malaysia(Evolution on Q1 08)
GLOBAL WPR CHINA MALAYSIA Figure 39: Consumption of medicines with an acute indication in WPR, China and Malaysia. China has an increase in
consumption, while Malaysia has a decrease in consumption of medicines with an acute indication from Q4 08.
1,17
1,23
0,93
1,37
0,97
0,91
0,80
0,90
1,00
1,10
1,20
1,30
1,40
Q1 07 Q2 07 Q3 07 Q4 07 Q1 08 Q2 08 Q3 08 Q4 08 Q1 09 Q2 09 Q3 09 Q4 09
Consumption of medicines for chronic indication
WPR, China and Malaysia(Evolution on Q1 08)
GLOBAL WPR CHINA MALAYSIA
Figure 40: Consumption of medicines with a chronic indication in WPR, China and Malaysia. Malaysia shows a decrease
contrary to the increase in consumption in the total region. China shows an increase after the start of the recession
while before the recession the consumption was decreasing from at least Q1 07.

Impact of the economic recession on pharmaceutical consumption
58
Annex 3: Consumption of original & licensed brands and others
brands & unbranded medicines
0,99
1,08
0,97
1,12
0,88
1,20
0,97
0,85
0,90
0,95
1,00
1,05
1,10
1,15
1,20
1,25
1,30
Q1 07 Q2 07 Q3 07 Q4 07 Q1 08 Q2 08 Q3 08 Q4 08 Q1 09 Q2 09 Q3 09 Q4 09
Consumption of original & licensed brands
WPR, China and Malaysia(Evolution on Q1 08)
GLOBAL WPR CHINA MALAYSIA
Figure 41: Consumption of original & licensed brands for Western Pacific region (WPR), China and Malaysia. China had a
continuous increase in the consumption of original & licensed brands from the first quarter of 2007 onwards. The
consumption of original & licensed brands decreased in Malaysia up to 86% of the consumption in Q1 08, although the
decrease has not the same extent over time.
1,16
0,95
1,22
0,92
1,37
0,99
0,90
0,80
0,90
1,00
1,10
1,20
1,30
1,40
Q1 07 Q2 07 Q3 07 Q4 07 Q1 08 Q2 08 Q3 08 Q4 08 Q1 09 Q2 09 Q3 09 Q4 09
Consumption of other brands & unbranded medicines
WPR, China and Malaysia(Evolution on Q1 08)
GLOBAL WPR CHINA MALAYSIA
Figure 42: Consumption of other brands & unbranded medicines for Western Pacific region (WPR), China and Malaysia.
Malaysia had an increase in the consumption of other brands & unbranded medicines for two consecutive quarters after
the recession. From Q4 08 onwards there is a decline in consumption in Malaysia to 89% (Q2 09) of the consumption of
Q1 08. China had an increase in consumption of other brands & unbranded medicines up to 15% in Q2 09.
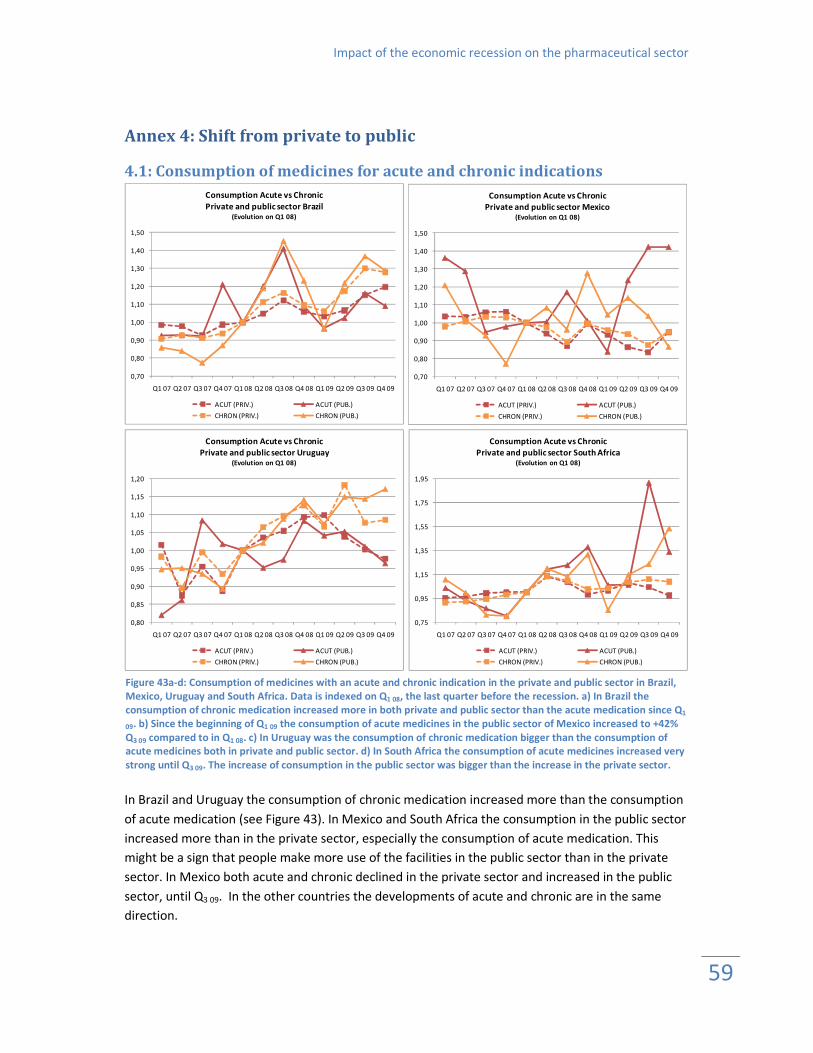
Impact of the economic recession on the pharmaceutical sector
59
Annex 4: Shift from private to public
4.1: Consumption of medicines for acute and chronic indications
0,70
0,80
0,90
1,00
1,10
1,20
1,30
1,40
1,50
Q1 07 Q2 07 Q3 07 Q4 07 Q1 08 Q2 08 Q3 08 Q4 08 Q1 09 Q2 09 Q3 09 Q4 09
Consumption Acute vs Chronic
Private and public sector Brazil(Evolution on Q1 08)
ACUT (PRIV.) ACUT (PUB.)
CHRON (PRIV.) CHRON (PUB.)
0,70
0,80
0,90
1,00
1,10
1,20
1,30
1,40
1,50
Q1 07 Q2 07 Q3 07 Q4 07 Q1 08 Q2 08 Q3 08 Q4 08 Q1 09 Q2 09 Q3 09 Q4 09
Consumption Acute vs Chronic
Private and public sector Mexico(Evolution on Q1 08)
ACUT (PRIV.) ACUT (PUB.)
CHRON (PRIV.) CHRON (PUB.)
0,80
0,85
0,90
0,95
1,00
1,05
1,10
1,15
1,20
Q1 07 Q2 07 Q3 07 Q4 07 Q1 08 Q2 08 Q3 08 Q4 08 Q1 09 Q2 09 Q3 09 Q4 09
Consumption Acute vs Chronic
Private and public sector Uruguay(Evolution on Q1 08)
ACUT (PRIV.) ACUT (PUB.)
CHRON (PRIV.) CHRON (PUB.)
0,75
0,95
1,15
1,35
1,55
1,75
1,95
Q1 07 Q2 07 Q3 07 Q4 07 Q1 08 Q2 08 Q3 08 Q4 08 Q1 09 Q2 09 Q3 09 Q4 09
Consumption Acute vs Chronic
Private and public sector South Africa(Evolution on Q1 08)
ACUT (PRIV.) ACUT (PUB.)
CHRON (PRIV.) CHRON (PUB.)
In Brazil and Uruguay the consumption of chronic medication increased more than the consumption
of acute medication (see Figure 43). In Mexico and South Africa the consumption in the public sector
increased more than in the private sector, especially the consumption of acute medication. This
might be a sign that people make more use of the facilities in the public sector than in the private
sector. In Mexico both acute and chronic declined in the private sector and increased in the public
sector, until Q3 09. In the other countries the developments of acute and chronic are in the same
direction.
Figure 43a-d: Consumption of medicines with an acute and chronic indication in the private and public sector in Brazil,
Mexico, Uruguay and South Africa. Data is indexed on Q1 08, the last quarter before the recession. a) In Brazil the
consumption of chronic medication increased more in both private and public sector than the acute medication since Q1
09. b) Since the beginning of Q1 09 the consumption of acute medicines in the public sector of Mexico increased to +42%
Q3 09 compared to in Q1 08. c) In Uruguay was the consumption of chronic medication bigger than the consumption of
acute medicines both in private and public sector. d) In South Africa the consumption of acute medicines increased very
strong until Q3 09. The increase of consumption in the public sector was bigger than the increase in the private sector.
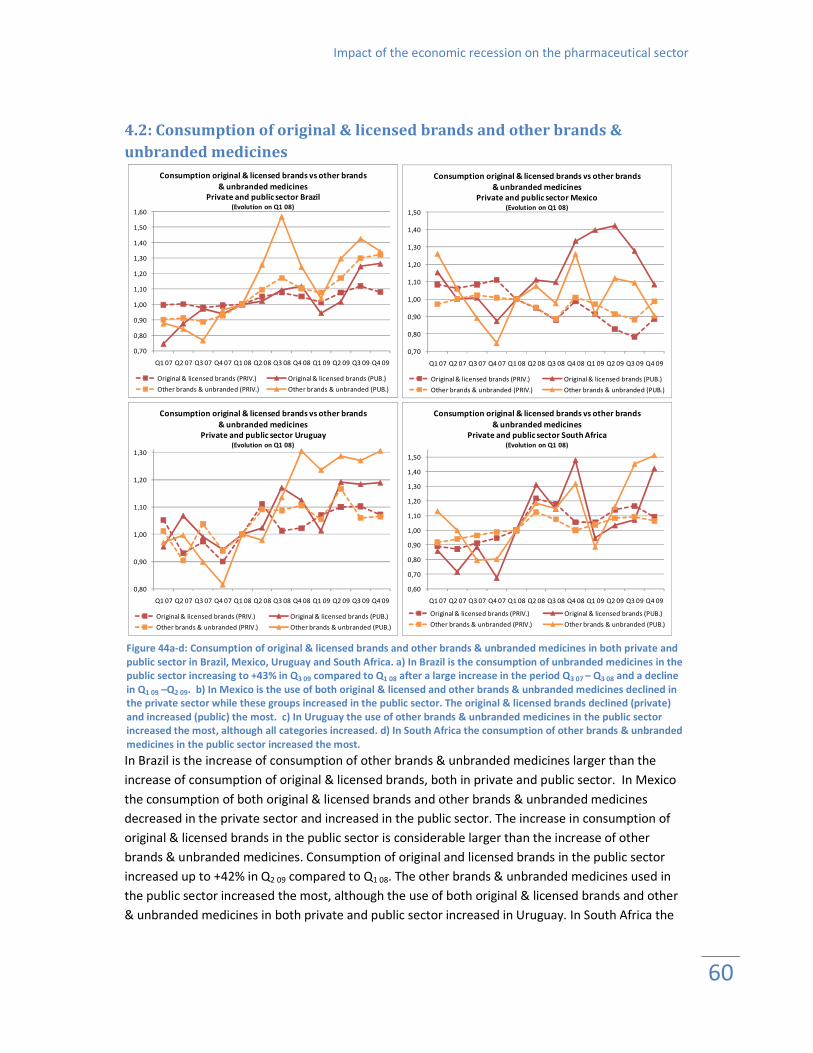
Impact of the economic recession on the pharmaceutical sector
60
4.2: Consumption of original & licensed brands and other brands &
unbranded medicines
0,70
0,80
0,90
1,00
1,10
1,20
1,30
1,40
1,50
1,60
Q1 07 Q2 07 Q3 07 Q4 07 Q1 08 Q2 08 Q3 08 Q4 08 Q1 09 Q2 09 Q3 09 Q4 09
Consumption original & licensed brands vs other brands
& unbranded medicines
Private and public sector Brazil(Evolution on Q1 08)
Original & licensed brands (PRIV.) Original & licensed brands (PUB.)
Other brands & unbranded (PRIV.) Other brands & unbranded (PUB.)
0,70
0,80
0,90
1,00
1,10
1,20
1,30
1,40
1,50
Q1 07 Q2 07 Q3 07 Q4 07 Q1 08 Q2 08 Q3 08 Q4 08 Q1 09 Q2 09 Q3 09 Q4 09
Consumption original & licensed brands vs other brands
& unbranded medicines
Private and public sector Mexico(Evolution on Q1 08)
Original & licensed brands (PRIV.) Original & licensed brands (PUB.)
Other brands & unbranded (PRIV.) Other brands & unbranded (PUB.)
0,80
0,90
1,00
1,10
1,20
1,30
Q1 07 Q2 07 Q3 07 Q4 07 Q1 08 Q2 08 Q3 08 Q4 08 Q1 09 Q2 09 Q3 09 Q4 09
Consumption original & licensed brands vs other brands
& unbranded medicines
Private and public sector Uruguay(Evolution on Q1 08)
Original & licensed brands (PRIV.) Original & licensed brands (PUB.)
Other brands & unbranded (PRIV.) Other brands & unbranded (PUB.)
0,60
0,70
0,80
0,90
1,00
1,10
1,20
1,30
1,40
1,50
Q1 07 Q2 07 Q3 07 Q4 07 Q1 08 Q2 08 Q3 08 Q4 08 Q1 09 Q2 09 Q3 09 Q4 09
Consumption original & licensed brands vs other brands
& unbranded medicines
Private and public sector South Africa(Evolution on Q1 08)
Original & licensed brands (PRIV.) Original & licensed brands (PUB.)
Other brands & unbranded (PRIV.) Other brands & unbranded (PUB.)
In Brazil is the increase of consumption of other brands & unbranded medicines larger than the
increase of consumption of original & licensed brands, both in private and public sector. In Mexico
the consumption of both original & licensed brands and other brands & unbranded medicines
decreased in the private sector and increased in the public sector. The increase in consumption of
original & licensed brands in the public sector is considerable larger than the increase of other
brands & unbranded medicines. Consumption of original and licensed brands in the public sector
increased up to +42% in Q2 09 compared to Q1 08. The other brands & unbranded medicines used in
the public sector increased the most, although the use of both original & licensed brands and other
& unbranded medicines in both private and public sector increased in Uruguay. In South Africa the
Figure 44a-d: Consumption of original & licensed brands and other brands & unbranded medicines in both private and
public sector in Brazil, Mexico, Uruguay and South Africa. a) In Brazil is the consumption of unbranded medicines in the
public sector increasing to +43% in Q3 09 compared to Q1 08 after a large increase in the period Q3 07 – Q3 08 and a decline
in Q1 09 –Q2 09. b) In Mexico is the use of both original & licensed and other brands & unbranded medicines declined in
the private sector while these groups increased in the public sector. The original & licensed brands declined (private)
and increased (public) the most. c) In Uruguay the use of other brands & unbranded medicines in the public sector
increased the most, although all categories increased. d) In South Africa the consumption of other brands & unbranded
medicines in the public sector increased the most.

Impact of the economic recession on the pharmaceutical sector
61
public sector consumed more other brands & unbranded medicines from Q2 09 onwards, +51% in Q4
09 compared to Q1 08.
4.3: Pharmaceutical expenditure in private and public sector
0,70
0,80
0,90
1,00
1,10
1,20
1,30
1,40
1,50
1,60
Q1 07 Q2 07 Q3 07 Q4 07 Q1 08 Q2 08 Q3 08 Q4 08 Q1 09 Q2 09 Q3 09 Q4 09
Average pharmaceutical expenditure index
Private and public sector Brazil (indexed on Q1 08)
BRAZIL (PRIV.) BRAZIL (PUB.)
0,85
0,90
0,95
1,00
1,05
1,10
1,15
1,20
1,25
1,30
1,35
Q1 07 Q2 07 Q3 07 Q4 07 Q1 08 Q2 08 Q3 08 Q4 08 Q1 09 Q2 09 Q3 09 Q4 09
Average pharmaceutical expenditure index
Private and public sector Mexico (indexed on Q1 08)
MEXICO (PRIV.) MEXICO (PUB.)
0,85
0,90
0,95
1,00
1,05
1,10
1,15
1,20
1,25
1,30
1,35
Q1 07 Q2 07 Q3 07 Q4 07 Q1 08 Q2 08 Q3 08 Q4 08 Q1 09 Q2 09 Q3 09 Q4 09
Average pharmaceutical expenditure index
Private and public sector Uruguay (indexed on Q1 08)
URUGUAY (PRIV.) URUGUAY (PUB.)
0,75
0,85
0,95
1,05
1,15
1,25
1,35
1,45
1,55
1,65
1,75
Q1 07 Q2 07 Q3 07 Q4 07 Q1 08 Q2 08 Q3 08 Q4 08 Q1 09 Q2 09 Q3 09 Q4 09
Average pharmaceutical expenditure index
Private and public sector South Africa (indexed on Q1 08)
SOUTH AFRICA (PRIV.) SOUTH AFRICA (PUB.)
Figure 55a-d: Average pharmaceutical expenditure index (national currency units) in private and public sector in Brazil,
Mexico, Uruguay and South Africa. The expenditure is higher in the public sector.
Expenditure in the public sector in Brazil and South Africa increased a lot since Q1 09 (+59% and +73%
respectively Q4 09 compared to Q1 08. Pharmaceutical expenditure in the private sector increased as
well, in Q4 09 the expenditure is about 26%-35% higher compared to Q1 08. In Uruguay expenditure in
private and public sector increased at the same pace. Pharmaceutical expenditure in the public
sector in Mexico was higher compared to the private sector. In Q4 09 the expenditure in the public
sector declined with -15% compared to Q1 08.

Impact of the economic recession on the pharmaceutical sector
62
Annex 5: Distribution of consumption
29,47%; 80,76%
0,00%
10,00%
20,00%
30,00%
40,00%
50,00%
60,00%
70,00%
80,00%
90,00%
100,00%
0,00% 20,00% 40,00% 60,00% 80,00% 100,00%
Co
nsu
mp
tio
n (
%)
Number of ATC 2 categories (%)
Distribution of consumption Estonia
29,17%; 80,55%
0,00%
10,00%
20,00%
30,00%
40,00%
50,00%
60,00%
70,00%
80,00%
90,00%
100,00%
0,00% 20,00% 40,00% 60,00% 80,00% 100,00%
Co
nsu
mp
tio
n (
%)
Number of ATC 2 categories (%)
Distribution of consumption Latvia
Figure 56a-e: Figures of the average percentage of total supply units of ATC 2 categories in Estonia, Latvia, Lithuania,
Romania and Poland for 2007-2009.

Impact of the economic recession on the pharmaceutical sector
63
28,72%; 80,04%
0,00%
10,00%
20,00%
30,00%
40,00%
50,00%
60,00%
70,00%
80,00%
90,00%
100,00%
0,00% 20,00% 40,00% 60,00% 80,00% 100,00%
Co
nsu
mp
tio
n (
%)
Number of ATC 2 categories (%)
Distribution of consumption Lithuania
23,16%; 81,96%
0,00%
10,00%
20,00%
30,00%
40,00%
50,00%
60,00%
70,00%
80,00%
90,00%
100,00%
0,00% 20,00% 40,00% 60,00% 80,00% 100,00%
Co
nsu
mp
tio
n (
%)
Number of ATC 2 categories (%)
Distribution of consumption Romania
27,55%; 81,11%
0,00%
10,00%
20,00%
30,00%
40,00%
50,00%
60,00%
70,00%
80,00%
90,00%
100,00%
0,00% 20,00% 40,00% 60,00% 80,00% 100,00%
Co
nsu
mp
tio
n (
%)
Number of ATC 2 categories (%)
Distribution of consumption Poland

Impact of the economic recession on the pharmaceutical sector
64
Annex 6: S1 Opthamologicals Table 121: Absolute and percentage change of SU’s per capita for Q4 08 + Q1 09 compared with Q4 07 + Q1 08 for S1
Opthamologicals.
S1 OpthamologicalsCountry atc3
Estonia S1A (ANTI-INFECTIVES-EYE) 2,46% -30,98%
Latvia S1A (ANTI-INFECTIVES-EYE) 0,56% -7,11%
Lithuania S1A (ANTI-INFECTIVES-EYE) 0,81% -10,21%
Romania S1A (ANTI-INFECTIVES-EYE) 1,26% -11,89%
Poland S1A (ANTI-INFECTIVES-EYE) 0,74% -3,76%
Estonia S1B (CORTICOSTEROIDS-EYE) 0,19% -14,82%
Latvia S1B (CORTICOSTEROIDS-EYE) 0,07% -0,44%
Lithuania S1B (CORTICOSTEROIDS-EYE) 0,16% -4,16%
Romania S1B (CORTICOSTEROIDS-EYE) 0,11% -1,79%
Poland S1B (CORTICOSTEROIDS-EYE) 0,12% 15,29%
Estonia S1C (OPHTH A-INFLAM+A-INFEC) 0,63% -15,43%
Latvia S1C (OPHTH A-INFLAM+A-INFEC) 0,61% -5,15%
Lithuania S1C (OPHTH A-INFLAM+A-INFEC) 0,46% 12,83%
Romania S1C (OPHTH A-INFLAM+A-INFEC) 0,71% 11,41%
Poland S1C (OPHTH A-INFLAM+A-INFEC) 0,25% 1,18%
Estonia S1D (ANTI-VIRAL AGENTS -EYE) 0,00% -18,38%
Latvia S1D (ANTI-VIRAL AGENTS -EYE) 0,05% 73,90%
Lithuania S1D (ANTI-VIRAL AGENTS -EYE) 0,00% 67,84%
Romania S1D (ANTI-VIRAL AGENTS -EYE) 0,00% 92,66%
Poland S1D (ANTI-VIRAL AGENTS -EYE) 0,01% -13,75%
Estonia S1E (MIOTICS+ANTIGLAUC.PREPS.) 2,43% -0,28%
Latvia S1E (MIOTICS+ANTIGLAUC.PREPS.) 1,64% 24,20%
Lithuania S1E (MIOTICS+ANTIGLAUC.PREPS.) 1,77% 5,28%
Romania S1E (MIOTICS+ANTIGLAUC.PREPS.) 1,39% 6,87%
Poland S1E (MIOTICS+ANTIGLAUC.PREPS) 1,22% 2,28%
Estonia S1F (MYDRIATICS+CYCLOPLEGICS) 0,05% -45,98%
Latvia S1F (MYDRIATICS+CYCLOPLEGICS) 0,10% -1,71%
Lithuania S1F (MYDRIATICS+CYCLOPLEGICS) 0,09% 1,61%
Romania S1F (MYDRIATICS+CYCLOPLEGICS) 0,08% 16,50%
Poland S1F (MYDRIATICS+CYCLOPLEGICS) 0,13% 1,64%
Estonia S1G (OCULAR ANTI-ALLERGICS, DECONGESTANTS) 1,08% -42,82%
Latvia S1G (OCULAR ANTI-ALLERGICS, DECONGESTANTS) 1,30% 0,08%
Lithuania S1G (OCULAR ANTI-ALLERGICS, DECONGESTANTS) 0,98% -13,43%
Romania S1G (OCULAR ANTI-ALLERGICS, DECONGESTANTS) 1,80% -13,78%
Poland S1G (OCULAR ANTI-ALLERGICS, DECONGESTANTS) 1,47% 3,83%
Estonia S1H (LOCAL ANAESTHETICS -EYE) 0,03% -50,04%
Latvia S1H (LOCAL ANAESTHETICS -EYE) 0,09% -13,66%
Lithuania S1H (LOCAL ANAESTHETICS -EYE) 0,07% 7,55%
Romania S1H (LOCAL ANAESTHETICS -EYE) 0,01% 268,14%
Poland S1H (LOCAL ANAESTHETICS -EYE) 0,04% -1,03%
Estonia S1K (ARTIFICIAL TEARS+OC LUBS) 2,63% -16,37%
Latvia S1K (ARTIFICIAL TEARS+OC LUBS) 1,35% -4,36%
Lithuania S1K (ARTIFICIAL TEARS+OC LUBS) 2,17% -1,94%
Romania S1K (ARTIFICIAL TEARS+OC LUBS) 0,31% -38,69%
Poland S1K (ARTIFICIAL TEARS+OC LUBS) 0,95% -7,45%
Estonia S1L (CONTACT LENS SOLUTIONS) 0,02% 103,36%
Latvia S1L (CONTACT LENS SOLUTIONS) 0,11% 8,68%
Lithuania S1L (CONTACT LENS SOLUTIONS) 0,19% -54,56%
Romania S1L (CONTACT LENS SOLUTIONS) 0,00% -20,66%
% of total
sales % change

Impact of the economic recession on the pharmaceutical sector
65
S1 OpthamologicalsCountry atc3
Estonia S1M (EYE TONICS AND EYE VITAMINS) 0,68% -37,54%
Latvia S1M (EYE TONICS AND EYE VITAMINS) 0,78% -12,91%
Lithuania S1M (EYE TONICS AND EYE VITAMINS) 1,08% -17,49%
Romania S1M (EYE TONICS AND EYE VITAMINS) 0,04% 1,98%
Poland S1M (EYE TONICS AND EYE VITAMINS) 0,18% -0,97%
Latvia S1N (ANTICATARACTOGENICS) 1,62% 13,83%
Lithuania S1N (ANTICATARACTOGENICS) 0,83% -4,59%
Romania S1N (ANTICATARACTOGENICS) 1,16% -0,18%
Poland S1N (ANTICATARACTOGENICS) 1,33% 0,07%
Estonia S1P (OCULAR ANTINEOVASCULARISATION PRODUCTS) 0,00% -100,00%
Latvia S1P (OCULAR ANTINEOVASCULARISATION PRODUCTS) 0,00% -20,04%
Lithuania S1P (OCULAR ANTINEOVASCULARISATION PRODUCTS) 0,00% 0,00%
Romania S1P (OCULAR ANTINEOVASCULARISATION PRODUCTS) 0,00% -100,00%
Poland S1P (OCULAR ANTINEOVASCULARISATION PRODUCTS) 0,00% 17,48%
Estonia S1R (OPHTH N/STEROID A-INFLAM) 0,02% -37,04%
Latvia S1R (OPHTH N/STEROID A-INFLAM) 0,27% -6,34%
Lithuania S1R (OPHTH N/STEROID A-INFLAM) 0,11% 17,47%
Romania S1R (OPHTH N/STEROID A-INFLAM) 0,03% 53,98%
Poland S1R (OPHTH N/STEROID A-INFLAM) 0,13% -9,03%
Estonia S1S (OPHTHALMOL SURGICAL AIDS) 0,00% 0,00%
Latvia S1S (OPHTHALMOL SURGICAL AIDS) 0,00% 6,17%
Lithuania S1S (OPHTHALMOL SURGICAL AIDS) 0,01% 38,45%
Poland S1S (OPHTHALMOL SURGICAL AIDS) 0,00% 168,82%
Estonia S1T (OPHTHALMOL DIAG AGENTS) 0,00% 39,64%
Latvia S1T (OPHTHALMOL DIAG AGENTS) 0,00% 0,00%
Lithuania S1T (OPHTHALMOL DIAG AGENTS) 0,00% 37,31%
Romania S1T (OPHTHALMOL DIAG AGENTS) 0,00% 0,00%
Poland S1T (OPHTHALMOL DIAG AGENTS) 0,00% 68,04%
Estonia S1X (OTHER OPHTHALMOLOGICALS) 0,06% 279,09%
Latvia S1X (OTHER OPHTHALMOLOGICALS) 0,83% -31,36%
Lithuania S1X (OTHER OPHTHALMOLOGICALS) 0,09% -36,46%
Romania S1X (OTHER OPHTHALMOLOGICALS) 0,01% -70,28%
Poland S1X (OTHER OPHTHALMOLOGICALS) 0,07% 7,41%
% of total
sales % change