Embed Size (px)
Citation preview
Discussion Paper No. 941
IMPACT OF
THE FUKUSHIMA NUCLEAR ACCIDENT ON THE BODY MASS INDEX
OF CHILDREN IN JAPAN 2010–2014
Eiji Yamamura
July 2015
The Institute of Social and Economic Research Osaka University
6-1 Mihogaoka, Ibaraki, Osaka 567-0047, Japan
1
Impact of the Fukushima nuclear accident on
the body mass index of children in Japan
2010–2014
Eiji Yamamura
Department of Economics, Seinan Gakuin University, 6-2-92 Nishijin, Sawara-ku,
Fukuoka 814-8511, Japan
*Corresponding author: Department of Economics, Seinan Gakuin University, 6-2-92 Nishijin, Sawara-ku Fukuoka 814-8511, Japan E-mail address: [email protected] Tel: +81 92 823 4543; Fax: +81 92 823 2506
2
ABSTRACT
Based on prefecture-level panel data from Japan for the period 2010–2014, this
study investigates the influence of the 2011 Fukushima nuclear accident on the
body mass index (BMI) and obesity rates of children and any changes over time. A
differences-in-differences approach was used to show that: (1) BMI and obesity
rates in disaster-damaged areas are higher than those in other areas; (2) The
difference in the BMI (and obesity rate) of children between damaged and other
areas increased after the accident, suggesting that the accident led to increases in
both BMI and obesity rates; (3) For cohorts aged between 5 and 7 years old in 2010,
the influence of the accident is persistent even after 3 years. Furthermore, the
effect of the accident increased as time passed; (4) Cohorts aged between 8 and 10
years in 2010 were no longer influenced by the accident 2 years afterwards.
These findings suggest that restrictions placed on outdoor exercise as a result of
the nuclear accident in Fukushima prevented younger primary school children
from burning calories. Consequently, younger children developed a habit of
inactivity, leading a persistent increase in BMI. In contrast, such a habit was not
formed by older children and therefore the effect of the accident was temporary.
JEL classification: I18; H12
Keywords: Fukushima, Nuclear accident; Body mass index; Obesity rate
3
1. Introduction
On March 11, 2011, Japan was struck by a large-scale natural disaster
combining both an earthquake and tsunami. Immediately after the earthquake
and tsunami, the Fukushima Daiichi nuclear plants located on the Fukushima
coast in northeast Japan were crippled. A level 7 nuclear disaster rating was
assigned to the Fukushima nuclear accident, a level reached only once before with
the Chernobyl disaster. Inevitably, Fukushima’s residents had to directly confront
the danger of radiation exposure.
The Great East Japan Earthquake and the Fukushima nuclear accident have
had a substantial impact on economic conditions (Ando and Kimura, 2012;
Hayashi, 2012) and happiness level (Uchida et al., 2014; Rehdanz et al., 2015;
Yamamura et al., 2015) in Japan. Regarding issues of health and human biology,
according to media reports in Japan, the nuclear accident led to “a lack of physical
exercise and stress stemming from prolonged living in shelters and restrictions on
playing outside” (Daily Yomiuri, 2012). Consequently, “an alarming trend toward
obesity has been found among children in Fukushima Prefecture, which has the
highest rate of obese children in every age group between 5 and 9 years old” (Daily
Yomiuri, 2012). Existing studies assessing other nuclear accidents such as Three
Mile Island and Chernobyl provide evidence that nuclear accidents have not only
short-term but also long-term detrimental influences on human life1. However,
little is known about how and to what extent the Fukushima accident has affected
body mass indexes (BMIs) and changes in obesity rates. Overweight children are
thought to face a higher risk of developing various diseases in the future.
Accordingly, there is the possibility that the Fukushima accident has indirectly
influenced residents’ health status because of obesity. Thus, it is of value to assess
the subsequent effect of the Fukushima accident on the physical condition of
children. Therefore, based on prefecture-level data covering 2010–2014, this study
uses a differences-in-differences approach to assess the long-term influence of the
1 The Chernobyl accident was found to reduce people’s happiness levels (Danzer and Weisshaar, 2009) and the performance of the labor market in the Ukraine (Lehmann and Wadsworth, 2008). The effects of the accident have also been observed in other European countries. For instance, Germans were found to be more likely to worry about the environment after the Chernobyl disaster (Berger, 2010). In Sweden, students born in regions exposed to higher levels of Chernobyl radiation fallout produced poorer performances at secondary school (Almond et al., 2009). Other major disasters have also been found to influence the outcomes of elections and policies in the United States (Eisensee and Strӧmberg, 2007; Kahn, 2007).
4
nuclear accident on the BMI and obesity rate of children in Japan.
2. Data and methods 2.1. Data
The Ministry of Education, Culture, Sports, Science and Technology conducts
an annual school health survey across Japan. This survey collects data regarding
the height, weight and obesity rate of school-aged children. There are 47
prefectures in Japan and the ministry releases the average heights and weights for
each prefecture2. Height and weight data are further categorized for male and
female children. The data used in this paper covered the period 2010–20143. The
sample areas (those damaged in the 2011 disaster) are Fukushima, Iwate and
Miyagi prefectures because the Great East Japan Earthquake directly hit those
areas. However, data from the three prefectures were not collected in 2011 because
of the tremendous damage suffered from the disaster. Therefore, 2011 data are not
included in the dataset used in this paper.
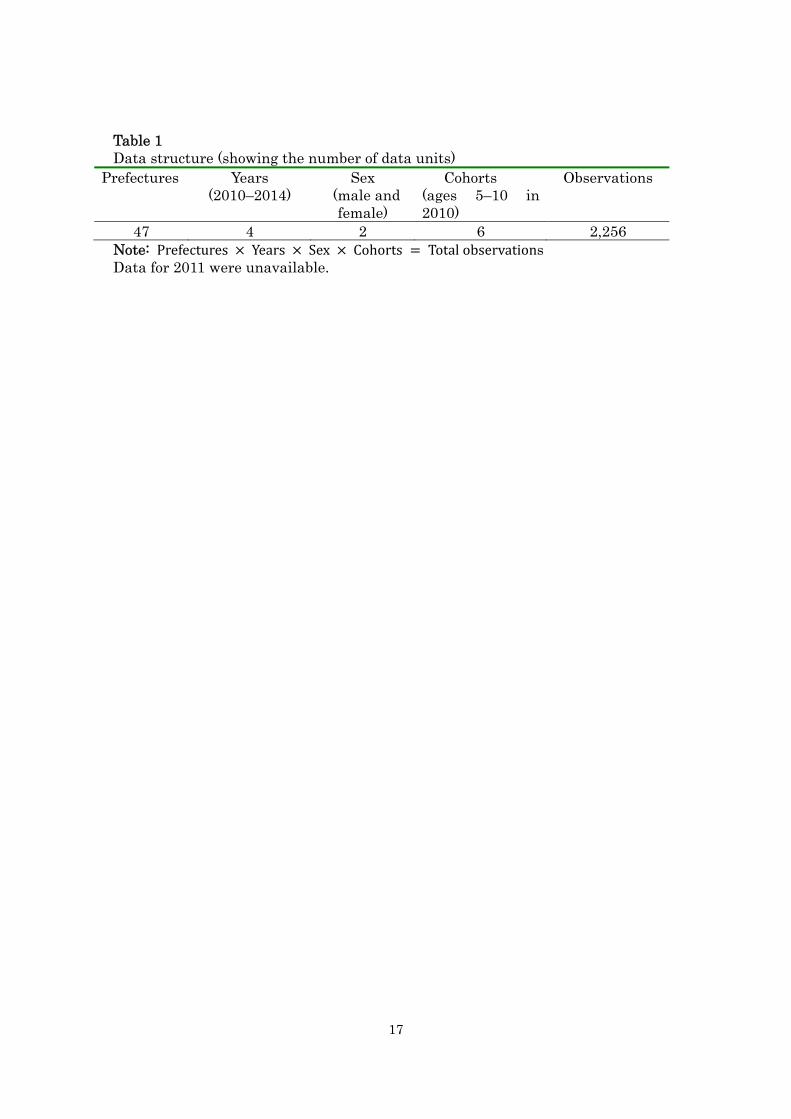
Data showing average height and weight values from 2010 to 2014 were
obtained for 47 prefectures (Table 1). To assess the subsequent effect of the
Fukushima accident on small children over time, we conducted estimations by
cohort groups. Smaller children are more likely to be influenced by circumstance
than older ones. Therefore, data used in this analysis covered six cohort groups in
which children were aged 5–10 years old in 20104. In the same cohort, for instance,
children who were aged 5 years in 2010 were 7, 8 and 9 years old in 2012, 2013 and
2014, respectively. Furthermore, separate data are available for male and female
children. A total of 2,256 observations were used in this study.
Using the data, average BMI values can be calculated. BMI reflects how
overweight the children in each cohort are, on average. However, BMI is possibly
influenced by outliers in the sample. To remove any bias caused by outliers, it is
worth considering the composition of the physical structure in the population. For
2 A Japanese prefecture is considered to be equivalent to a state in the United States or a province in Canada. 3 Data regarding children’s heights and weights used in this paper are available from the website of the Ministry of Education, Culture, Sports, Science and Technology: http://www.e-stat.go.jp/SG1/estat/List.do?bid=000001044483&cycode=0 (accessed on May 10, 2015). 4 Available data covered the height and weight of 5–17-year-olds in each year. However, our focus was on younger children, those aged 5–10 in 2010.
5
this purpose, in addition to BMI, we also assessed the obesity rate to determine
robustness of the BMI data. The obesity rate is defined in Table 4. We focused on
the BMI and obesity rates from 2010 to 2014, and compared the BMI and obesity
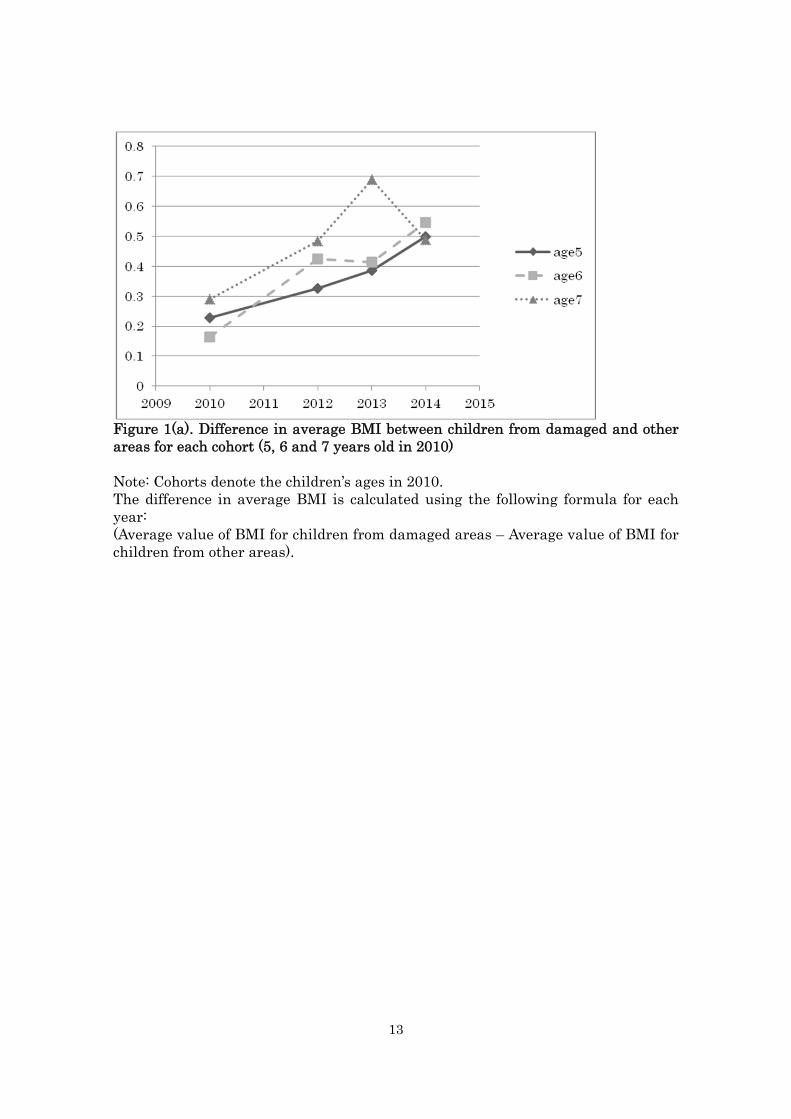
rates between disaster-damaged areas and other areas. Figure 1 demonstrates
how the difference between the average BMI of disaster-damaged areas and other
areas in each cohort (5, 6 and 7 years old in 2010) changed from 2010 to 2014. If
the value is over 0, the average BMI of children in the disaster-damaged areas is
higher than other areas. Throughout the period, the difference in BMI was
consistently positive, indicating that the average BMI of children in
disaster-damaged areas was higher than that in other areas. The difference in BMI
increased consistently from 2010 to 2014 for cohorts aged 5 and 6 in 2010. In
contrast, the difference in BMI increased until 2013 and then declined from 2013
to 2014 for cohorts aged 7 in 2010. However, the value of the difference is
approximately 0.05 in 2014, which is larger than 0.03 in 2014. Therefore, the
difference in BMI in 2014 did not return to the pre-accident levels.
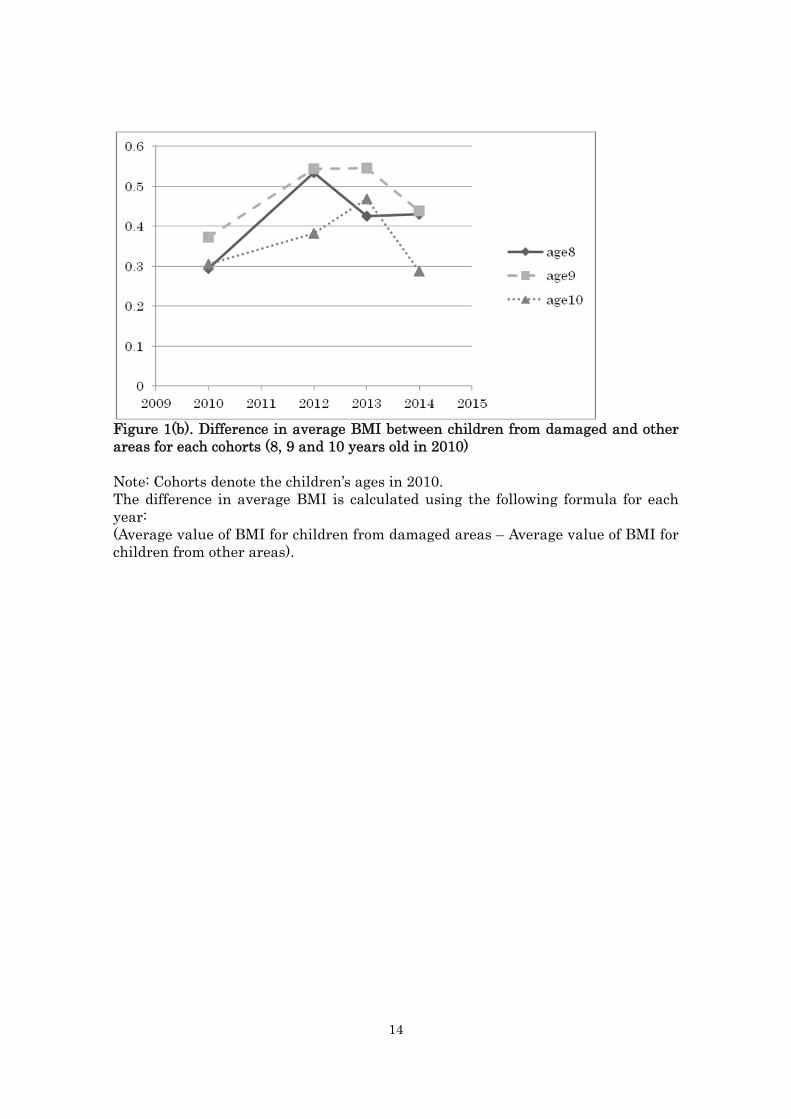
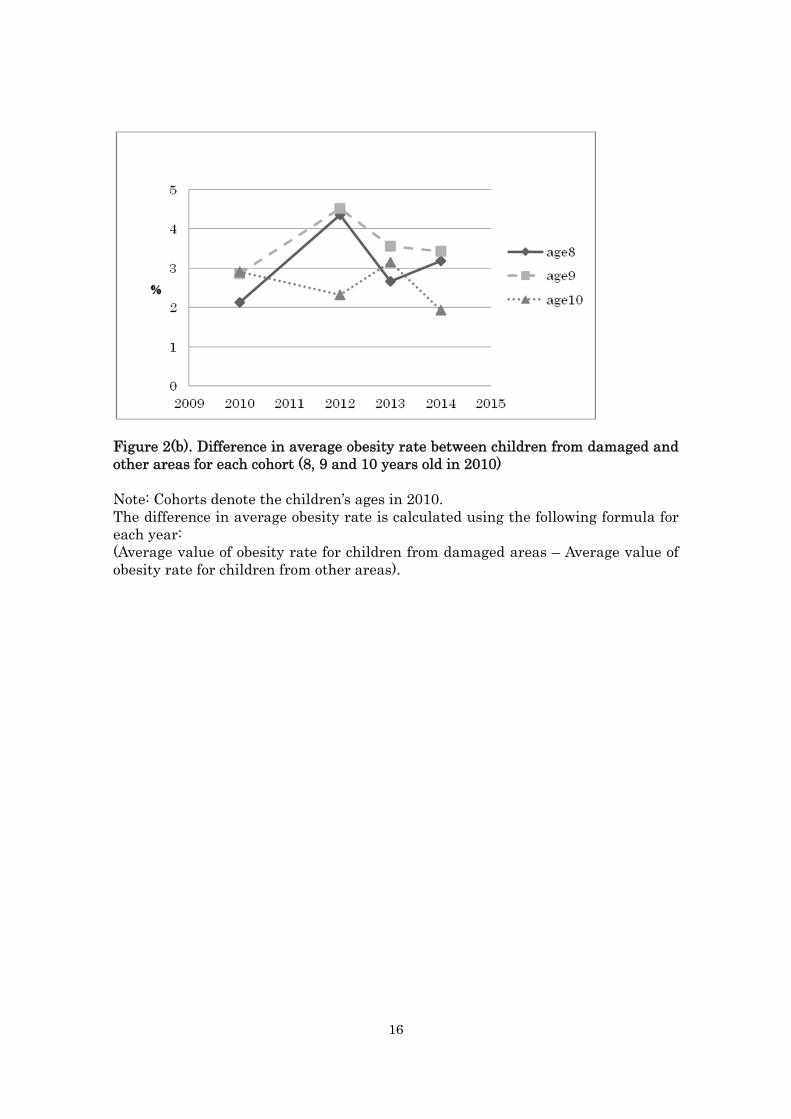
Figure 2 demonstrates the difference in BMI of children between areas for older
cohorts (8, 9 and 10 years olds in 2010). The difference increased from 2010 to 2012,
and then decreased. An inverted U-shaped curve is observed in Figure 2. Figures 3
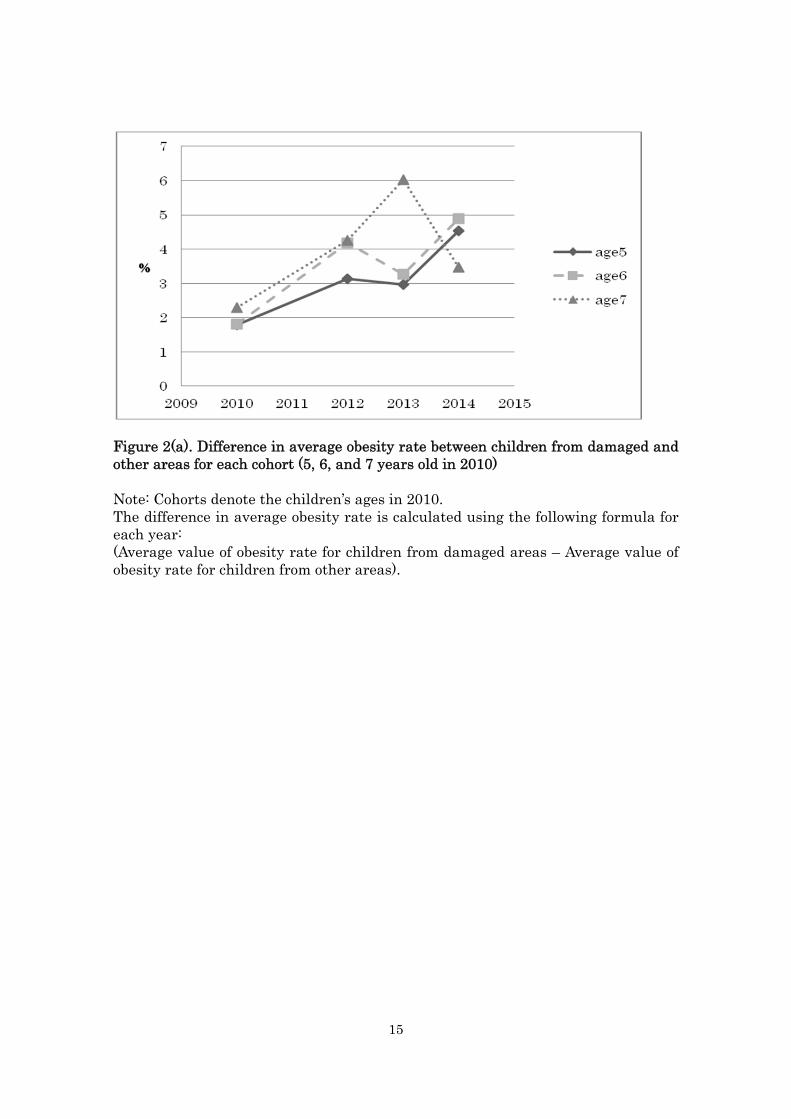
and 4 demonstrate the difference in obesity rates for younger and older cohorts,
respectively. The observations in Figures 3 and 4 are similar to those in Figures 1
and 2. Considering Figures 1–4 together, the Fukushima accident led to an
increase in the BMIs of children in disaster-damaged areas compared with those in
other areas. The effect of the accident is persistent over time for younger children,
but for older children it is temporary and is no longer apparent after several years.
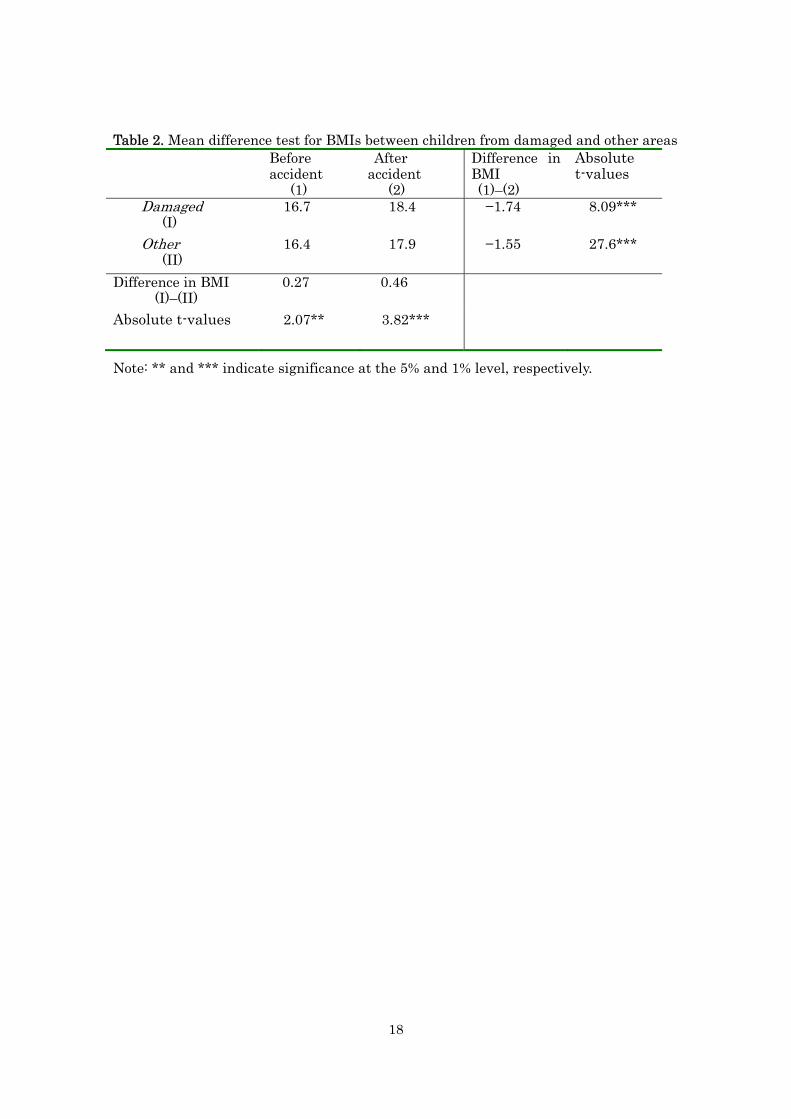
Table 2 shows the difference in BMIs of children before and after the
Fukushima accident in 2011 by comparing disaster-damaged areas and other areas.
The table shows that after the accident, the average BMI is significantly higher at
the 1% level in children in both damaged and other areas. The difference between
periods for damaged areas is 1.74, which is larger than that for other areas (1.55).
The difference between areas before the accident shows that the BMI of children in
damaged areas was higher by 0.27 when compared with other areas. Fukushima,
Iwate and Miyagi are considered rural areas. Hence, the above result is consistent
with the finding that children’s BMIs are more likely to be high in rural areas
compared with urban areas (Yamamura, 2012). After the accident, the average
BMI of children living in damaged areas is higher (by 0.46) than that for children
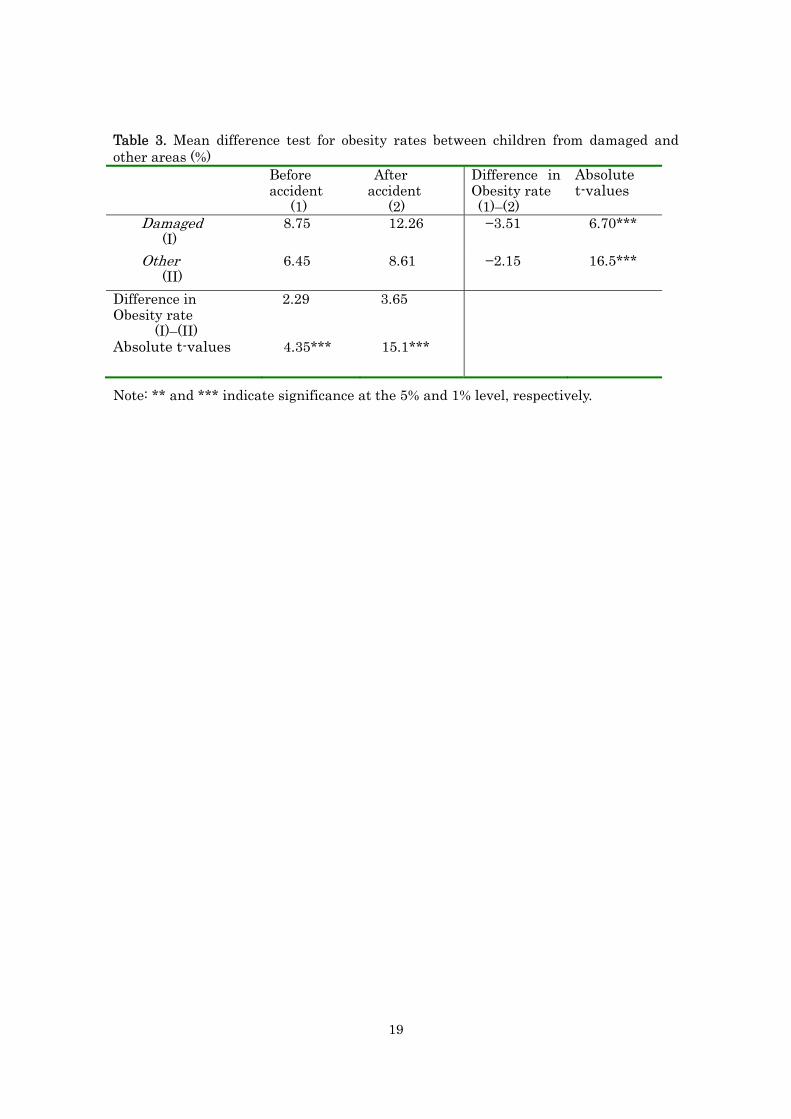
in other areas. Table 3 shows the mean difference for obesity rates. Findings from
6
Table 3 are similar to those of Table 2. All in all, Tables 2 and 3 reveal that the
Fukushima accident caused children’s BMI to increase not only in damaged areas
but also in other areas. However, the effect of the accident is more apparent in
damaged areas than other areas. Inferred from the observations above, a decrease
in physical exercise as a consequence of the Fukushima accident resulted in an
increase in BMIs throughout Japan. Thus, the greater the effect of the accident,
the greater the restriction on physical exercise, and the higher the increase in
children’s BMIs.
2.2. Econometric Framework
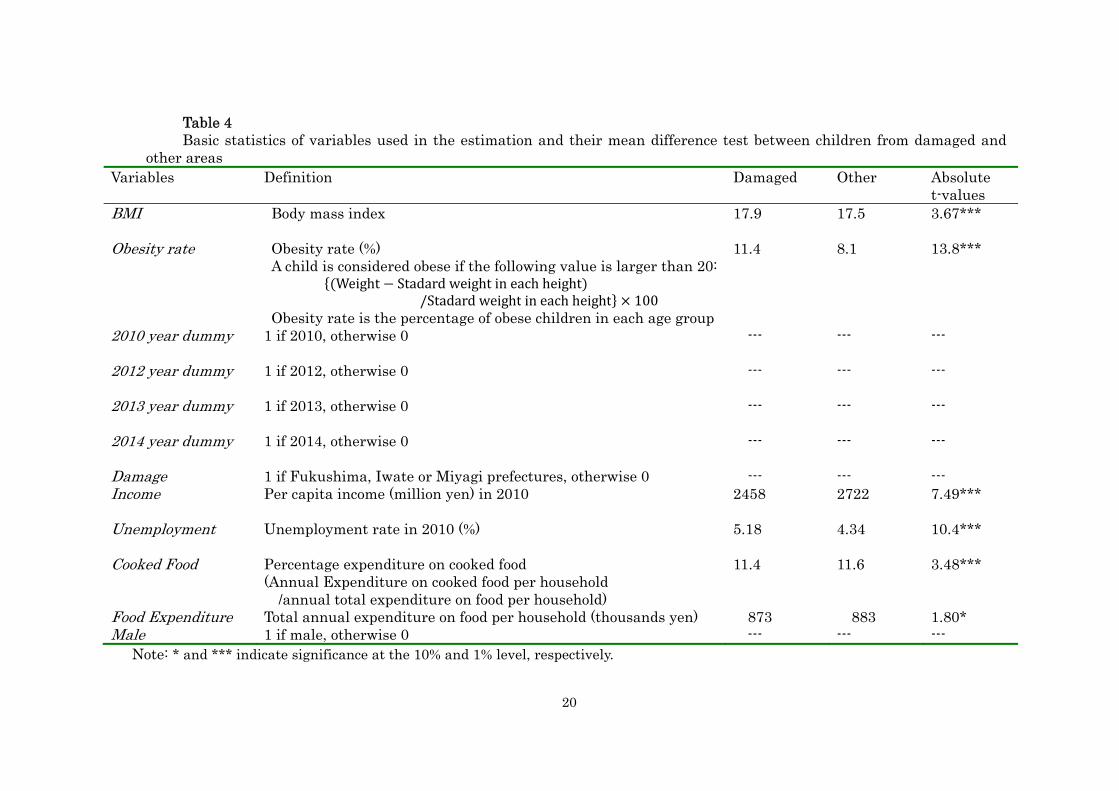
Table 4 presents the definition of the variables used in the estimation and the
mean difference tests between damaged areas and other areas. As shown in Tables
2 and 3, BMI and Obesity rate of children in the damaged areas are higher than in
other areas. Income is lower in the damaged areas and Unemployment is higher.
This suggests that economic conditions are worse in damaged areas than in other
areas. Following the description in the previous subsection, the estimated function
takes the following form:
BMI (or Obesity rate) itga = α1Damaged area i * 2012 year dummy t + α2 Damaged
area i * 2013 year dummy t + α3Damaged area i * 2014 year dummy t +
α4Damaed area i + α52012 year dummy t + α62013 year dummy t + α72014
year dummy t + α8Maleg + Y’ itgaBitga +ea + ki + u itga,
where BMI (or Obesity rate) itga represents the dependent variable in prefecture i,
year t, sex g and cohort a. To control for the effects of years, year dummies are
included and the reference group is 2010 reflecting conditions before the
Fukushima accident in 2011. As explained earlier, data for 2011 are not available,
thus, the dataset used in the estimation covered a 5-year period, 2010, 2012, 2013
and 2014.).
Based on data from 2010 and 2014, to scrutinize the effect of the Fukushima
accident on the BMI (or obesity rate) of children, changes in BMIs (or obesity rate)
from 2010 to other years in the disaster-damaged areas are compared with those in
other areas. That is, a differences-in-differences approach is used to examine the
impact of the 2011 disaster on children’s BMIs (or obesity rate). In this study, the
treatment group (damaged areas) includes Fukushima, Iwate and Miyagi because
the Great East Japan Earthquake directly hit those prefectures; the control group
7
is other prefectures. The interaction terms between Damaged area and Year
dummies are key variables to examine how the effect of the Fukushima accident
has changed as years have passed. The interaction terms show how and the extent
to which the BMI (or obesity rate) is larger than those in the base year (2010). If
the Fukushima accident increases the BMI (or obesity rate) and the effect is
observed in 2012, the coefficient of Damaged area i * 2012 year dummy t will be
positive.
Male is included to represent sex differences. The vectors of the control variables
(including unemployment rate,5 per capita income6, rate of expenditure for cooked
food and expenditure for food7) are denoted by Y itga. Per capita income and
unemployment rate capture economic conditions. BMI and obesity rates are
considered to depend on calorie intake. However, data for calorie intake cannot be
obtained. By definition of the statistics bureau, cooked food consists of various
fast-food, which is considered high-calorie food. Therefore, instead of calorie intake,
Cooked Food (expenditure on cooked food) is included to capture calorie intake.
The coefficient of Cooked Food is thus predicted to be positive. In addition, the log
of Food expenditure (expenditure on food) is also included. The regression
parameters are denoted by α, and B is the vector of the regression parameters for
the control variables. Furthermore, ea represents cohort effects, which are
controlled by including cohort dummies, ki represents time invariant prefecture
effects, which are controlled by the fixed effects model and the error term is
denoted by u itga.
3. Estimation results and their interpretation
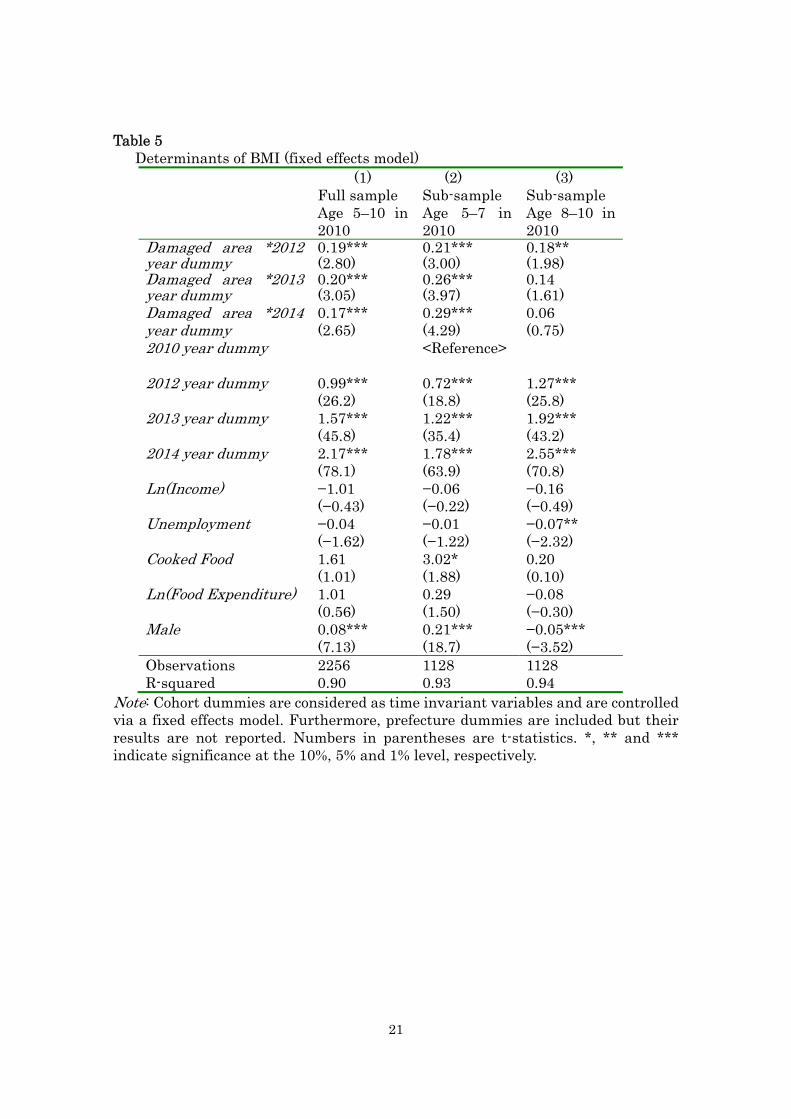
Tables 5 and 6 exhibit the estimation results of the fixed effects model. In each
5 Data regarding unemployment rates are available on the website of the Ministry of Internal Affairs and Communications–Statistics Bureau, Director-General for Policy Planning & Statistical Research and Training Institute: http://www.stat.go.jp/data/roudou/pref/index.htm (accessed on May 10, 2015). 6 Data regarding per capita income are available on the website of the Ministry of Internal Affairs and Communications–Statistics Bureau, Director-General for Policy Planning & Statistical Research and Training Institute: http://www.e-stat.go.jp/SG1/estat/List.do?bid=000001036889&cycode=0 (accessed on May 10, 2015). 7 Data regarding percentage of expenditure on cooked food and food expenditure are available on the website of the Ministry of Internal Affairs and Communications–Statistics Bureau, Director-General for Policy Planning & Statistical Research and Training Institute: http://www.e-stat.go.jp/SG1/estat/List.do?lid=000001064772 (accessed on May 10, 2015).
8
table, column (1) shows the results based on the full sample consisting of six
cohorts (those aged 5–10 in 2010). After dividing the sample into younger cohorts
and older cohorts, estimations were conducted and their results suggest how the
effect of the Fukushima accident differs between younger and older cohorts. In
each table, column (2) presents results based on the sample of cohorts for those
aged 5–7 in 2010, while column (3) shows results based on a sample consisting of
cohorts aged 8–10 in 2010.
Table 5 shows positive values of cross terms such as damaged area*2012 year
dummy, damaged area*2013 year dummy and damaged area*2014 year dummy.
These cross terms are statistically significant at the 1% level in columns (1) and (2).
Hence, the effect of the Fukushima accident is persistent during the 2012–2014
period. In column (1), the absolute value of the coefficient of damaged area*2013
year dummy is 0.20, and is larger than that for damaged area*2012 year dummy
(0.19) and damaged area*2014 year dummy (0.17). Thus, the effect of the
Fukushima accident on BMI is largest in 2013. Turning to column (2), the absolute
values of the coefficient of damaged area*2012 year dummy, damaged area*2013
year dummy and damaged area*2014 year dummy are 0.21, 0.26 and 0.29,
respectively. These can be interpreted as follows: the difference in BMI of children
for damaged areas and other areas in 2012 is higher (by 0.21) than that in 2010,
and it continues to increase in subsequent years (0.26 in 2013, 0.29 in 2014). Thus,
the effect of the Fukushima accident on BMI has increased as years have passed.
Regarding column (3), damaged area*2012 year dummy shows statistical
significance. However, damaged area*2013 year dummy and damaged area*2014
year dummy fail to reach statistical significance. Furthermore, the absolute values
of the coefficient of damaged area*2012 year dummy is 0.18, which is smaller than
that in column (2). Thus, the effect of the Fukushima accident is only observed in
2012, and not in 2013 and 2014. For the older cohorts, the effect of the accident is
considered temporary. Compared with the younger cohort group, the effect of the
accident in 2012 is smaller, even though a significant effect is observed. With
respect to the results of the year dummies in Table 5, these dummies are positive
and statistically significant at the 1% level in all columns. In column (1), the
absolute values of the coefficients of the 2012 year dummy, 2013 year dummy and
2014 year dummy are 0.99, 1.57 and 2.17, respectively. In estimations of this
analysis, we assessed the BMI of each cohort and the year dummies reflect the
increase in age. That is, for the cohort of children aged 5 in 2010, the 2012 year
dummy captures the difference between the BMI of children aged 7 and when they
9
were 5. Hence, the results of the year dummies are interpreted to suggest that
children’s body structures develop as they grow older. That is, their muscles
develop and increase during periods of growth. BMI naturally increases as a
consequence of an increase in muscle because muscle is heavier than fat (if the
cubic volume is the same).
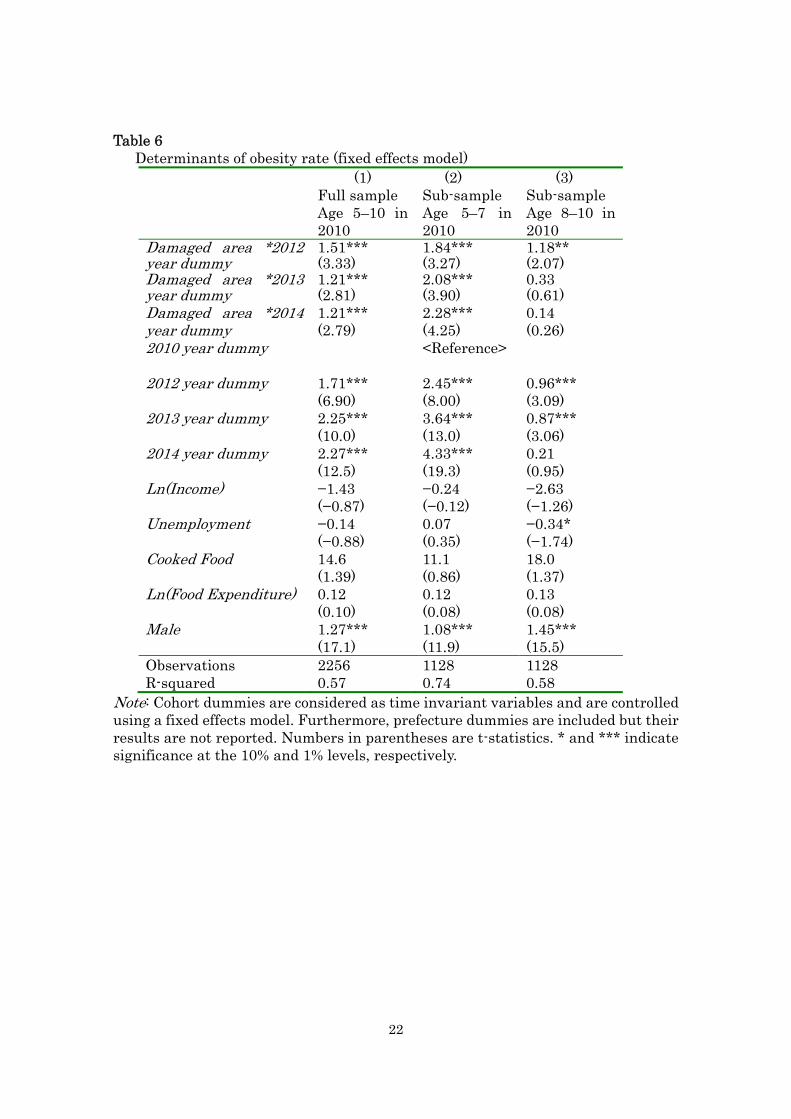
Table 6 shows similar results to those in Table 5, the cross terms between
Damaged area and year dummies are positive in columns (1)–(3), and are
statistically significant in columns (1) and (2). In contrast, only Damaged
area*2012 year dummy is statistically significant in column (3). As observed in
column (2), the coefficient of Damaged area*2012 year dummy is 1.84, the
coefficient of Damaged area*2013 year dummy is 2.08 and that of Damaged
area*2014 year dummy is 2.28. Thus, the rate of obese children in 2012 is higher
than that in 2010 (by 1.84%). Compared with the 2010 rates, the obesity rate for
children increased by 2.08% in 2013 and 2.28% in 2014. This reflects the persistent
and increasing effect of the Fukushima accident on obesity rates for younger
children. Turning to column (3), the coefficient of Damaged area*2012 year dummy
is only 1.18, which is far smaller than that in column (2). Hence, for the older
cohort, the effect of the Fukushima accident was no longer apparent 2 years
afterwards. Therefore, the effect of the accident is temporary and smaller than for
the younger cohort. As a whole, the results for the key variables in Table 6 are very
similar to those in Table 5. This suggests that the results of Table 5 are robust
when alternative specifications are used.
Based on observations thus far, the following argument can be derived: in
response to the nuclear accident in Fukushima, outdoor exercise was restricted for
children. As a consequence, younger primary school children could not burn
calories. Such an effect has a greater impact on younger children than older
children because younger children are more likely to develop a habit of inactivity,
which persistently reduces physical activity and sports participation. It is
important to urge children aged less than 7 years to get enough physical exercise.
Therefore, a policy implication from the key findings is to enhance physical
exercise for younger children to help develop an active habit to maintain proper
weight and good health in the future.
4. Conclusion
The Great East Japan Earthquake caused a massive radiation leak, especially in
disaster-damaged areas such as Fukushima, Iwate and Miyagi prefectures.
10
Radiation leaks influence human behavior because radiation exposure has a
detrimental effect on health. In the disaster-damaged areas after the Great East
Japan Earthquake, schools and parents prevented children from playing outside
because of the risk of radiation exposure. A decrease in outdoor exercise is thought
to reduce calorie burn-off, causing an increase in BMI and obesity. Hence, the
impact of the accident on BMIs and obesity rates is expected to differ between
damaged areas and other areas in Japan. By employing a differences-in-differences
approach, this study investigated the long-term influence of the impact of the
Fukushima accident on children’s BMIs.
Based on prefecture-level panel data from Japan for the period 2010–2014, this
study investigated how the 2011 Fukushima nuclear accident affected the BMIs of
children between 5–10 years old in 2010 and whether its effect changed over time.
A differences-in-differences approach was used to show that: (1) The Fukushima
accident resulted in an increase in the BMI and obesity rates of children; (2) For
cohorts between 5 and 7 years old in 2010, the effect of the accident remained
evident after 3 years. Furthermore, the effect of the accident increased as time
passed; (3) For cohorts between 8 and 10 years old in 2010, the influence of the
accident was observed 1 year after the accident but was no longer apparent after 2
years.
These findings suggest that restrictions placed on outdoor exercise as a result of
the nuclear accident in Fukushima prevented younger children from burning
calories. Thus, a habit of inactivity was formed, leading to a persistent increase in
BMI. In contrast, this habit did not form for older children and the effect of the
accident was no longer apparent after 2 years. This suggests the importance of
getting enough physical exercise to ensure that young children maintain a proper
weight and enjoy good health in the future.
11
References
Almond, D, Edlund, L., Palme,M., 2007. Chernobyl's subclinical legacy: pre-natal
exposure to radioactive fallout and school outcomes in Sweden. Quarterly
Journal of Economics 124(4), 1729–1772.
Ando, M., Kimura, F., 2012. How did the Japanese exports respond to two crisis in
the international production networks? The global financial crisis and the
Great East Japan earthquake. Asian Economic Journal 26(3), 261-287.
Berger, E. M. 2010. The Chernobyl disaster, concern about the environment and
life satisfaction. Kyklos 63, 1–8.
Cawley, J., Spiess, C. K. 2008. Obesity and skill attainment in early childhood.
Economics and Human Biology 6(3), 388-397.
Daily Yomiuri. 2012. Obesity rising for Fukushima kids / 5- to 9-year-olds show
highest rates of obese children across the nation. Daily Yomiuri, December 27,
2012.
Danzer A., Weisshaar, N., 2009. the long run consequences of the Chernobyl
catastrophe on subjective well-being and its set-point. evidence from two
Ukrainan data sets. Working Paper, WPEG Conference, 2009.
Hayashi, T., 2012. Japan’s post-disaster economic reconstruction: from Kobe to
Tohoku. Asian Economic Journal 26(3), 261-287.
Japan Times., 2012. Special Report 3.11 one Year on; a Chronicle of Japan’s Road
to Recovery. Tokyo: The Japan Times.
Kahn, M., 2007. Environmental disasters as risk regulation catalysts? The role of
Bhopal, Chernobyl, Exxon Baldez, love canal, and Three Mile Island in
shaping U.S. environmental law. Journal of Risk and Uncertainty 35(1),
17–43.
Lehmann, H. and J. Wadsworth., 2008. The impact of Chernobyl on health and
labour market performance in the Ukraine. Centre for Economic
Performance Working Paper 1679.
Rehdanz, K., Welsch, H., Narita, D., Okubo, T. 2015. Well-being effects of a major
natural disaster: The case of Fukushima. Journal of Economic Behavior &
Organization 116, 500-517.
Uchida, Y., Takahashi, Y., Kawahara, K. 2014. Changes in hedonic and eudaimonic
well-being after a severe nationwide disaster: The case of the Great East
Japan Earthquake. Journal of Happiness Studies 15(1), 207–221.
Yamamura, E., 2012. Influence of body image in urbanized areas: differences in
12
long-term changes in teenage body mass index between boys and girls in
Japan. Journal of Bioeconomics 14(3), 243–256.
Yamamura, E., Tsutsui, Y., Yamane, C., Yamane, S.,Powdthavee, N. 2015. Trust
and happiness: comparative study before and after the Great East Japan
Earthquake. Forthcoming in Social Indicators Research.
13
Figure 1(a). Difference in average BMI between children from damaged and other areas for each cohort (5, 6 and 7 years old in 2010) Note: Cohorts denote the children’s ages in 2010. The difference in average BMI is calculated using the following formula for each year: (Average value of BMI for children from damaged areas – Average value of BMI for children from other areas).
14
Figure 1(b). Difference in average BMI between children from damaged and other areas for each cohorts (8, 9 and 10 years old in 2010) Note: Cohorts denote the children’s ages in 2010. The difference in average BMI is calculated using the following formula for each year: (Average value of BMI for children from damaged areas – Average value of BMI for children from other areas).
15
Figure 2(a). Difference in average obesity rate between children from damaged and other areas for each cohort (5, 6, and 7 years old in 2010) Note: Cohorts denote the children’s ages in 2010. The difference in average obesity rate is calculated using the following formula for each year: (Average value of obesity rate for children from damaged areas – Average value of obesity rate for children from other areas).
16
Figure 2(b). Difference in average obesity rate between children from damaged and other areas for each cohort (8, 9 and 10 years old in 2010) Note: Cohorts denote the children’s ages in 2010. The difference in average obesity rate is calculated using the following formula for each year: (Average value of obesity rate for children from damaged areas – Average value of obesity rate for children from other areas).
17
Table 1 Data structure (showing the number of data units)
Prefectures Years (2010–2014)
Sex (male and
female)
Cohorts (ages 5–10 in 2010)
Observations
47 4 2 6 2,256 Note: Prefectures Years Sex Cohorts Totalobservations Data for 2011 were unavailable.
18
Table 2. Mean difference test for BMIs between children from damaged and other areas Before
accident (1)
After accident
(2)
Difference in BMI (1)–(2)
Absolute t-values
Damaged (I)
16.7 18.4 −1.74 8.09***
Other (II)
16.4 17.9 −1.55 27.6***
Difference in BMI (I)–(II)
0.27 0.46
Absolute t-values 2.07** 3.82***
Note: ** and *** indicate significance at the 5% and 1% level, respectively.
19
Table 3. Mean difference test for obesity rates between children from damaged and other areas (%)
Before accident (1)
After accident
(2)
Difference in Obesity rate (1)–(2)
Absolute t-values
Damaged (I)
8.75 12.26 −3.51 6.70***
Other (II)
6.45 8.61 −2.15 16.5***
Difference in Obesity rate
(I)–(II)
2.29 3.65
Absolute t-values 4.35*** 15.1***
Note: ** and *** indicate significance at the 5% and 1% level, respectively.
20
Table 4 Basic statistics of variables used in the estimation and their mean difference test between children from damaged and
other areas Variables Definition Damaged Other Absolute
t-values BMI
Body mass index 17.9 17.5 3.67***
Obesity rate
Obesity rate (%) A child is considered obese if the following value is larger than 20:
Weight Stadardweightineachheight/Stadard weight in each height 100
Obesity rate is the percentage of obese children in each age group
11.4 8.1 13.8***
2010 year dummy
1 if 2010, otherwise 0 --- --- ---
2012 year dummy
1 if 2012, otherwise 0 --- --- ---
2013 year dummy
1 if 2013, otherwise 0 --- --- ---
2014 year dummy 1 if 2014, otherwise 0
--- --- ---
Damage 1 if Fukushima, Iwate or Miyagi prefectures, otherwise 0 --- --- --- Income
Per capita income (million yen) in 2010 2458 2722 7.49***
Unemployment
Unemployment rate in 2010 (%) 5.18 4.34 10.4***
Cooked Food Percentage expenditure on cooked food (Annual Expenditure on cooked food per household
/annual total expenditure on food per household)
11.4 11.6 3.48***
Food Expenditure Total annual expenditure on food per household (thousands yen) 873 883 1.80* Male 1 if male, otherwise 0 --- --- ---
Note: * and *** indicate significance at the 10% and 1% level, respectively.
21
Table 5 Determinants of BMI (fixed effects model)
(1) Full sample Age 5–10 in 2010
(2) Sub-sample Age 5–7 in 2010
(3) Sub-sample Age 8–10 in 2010
Damaged area *2012 year dummy
0.19***(2.80)
0.21***(3.00)
0.18** (1.98)
Damaged area *2013 year dummy
0.20***(3.05)
0.26***(3.97)
0.14(1.61)
Damaged area *2014 year dummy
0.17*** (2.65)
0.29*** (4.29)
0.06 (0.75)
2010 year dummy
<Reference>
2012 year dummy
0.99*** (26.2)
0.72*** (18.8)
1.27*** (25.8)
2013 year dummy
1.57*** (45.8)
1.22*** (35.4)
1.92*** (43.2)
2014 year dummy 2.17*** (78.1)
1.78*** (63.9)
2.55*** (70.8)
Ln(Income) −1.01 (−0.43)
−0.06 (−0.22)
−0.16 (−0.49)
Unemployment
−0.04 (−1.62)
−0.01 (−1.22)
−0.07** (−2.32)
Cooked Food 1.61 (1.01)
3.02* (1.88)
0.20 (0.10)
Ln(Food Expenditure) 1.01 (0.56)
0.29 (1.50)
−0.08 (−0.30)
Male 0.08*** (7.13)
0.21*** (18.7)
−0.05*** (−3.52)
Observations 2256 1128 1128 R-squared 0.90 0.93 0.94
Note: Cohort dummies are considered as time invariant variables and are controlled via a fixed effects model. Furthermore, prefecture dummies are included but their results are not reported. Numbers in parentheses are t-statistics. *, ** and *** indicate significance at the 10%, 5% and 1% level, respectively.
22
Table 6 Determinants of obesity rate (fixed effects model)
(1) Full sample Age 5–10 in 2010
(2) Sub-sample Age 5–7 in 2010
(3) Sub-sample Age 8–10 in 2010
Damaged area *2012 year dummy
1.51***(3.33)
1.84***(3.27)
1.18** (2.07)
Damaged area *2013 year dummy
1.21***(2.81)
2.08***(3.90)
0.33(0.61)
Damaged area *2014 year dummy
1.21*** (2.79)
2.28*** (4.25)
0.14 (0.26)
2010 year dummy
<Reference>
2012 year dummy
1.71*** (6.90)
2.45*** (8.00)
0.96*** (3.09)
2013 year dummy
2.25*** (10.0)
3.64*** (13.0)
0.87*** (3.06)
2014 year dummy 2.27*** (12.5)
4.33*** (19.3)
0.21 (0.95)
Ln(Income) −1.43 (−0.87)
−0.24 (−0.12)
−2.63 (−1.26)
Unemployment
−0.14 (−0.88)
0.07 (0.35)
−0.34* (−1.74)
Cooked Food 14.6 (1.39)
11.1 (0.86)
18.0 (1.37)
Ln(Food Expenditure) 0.12 (0.10)
0.12 (0.08)
0.13 (0.08)
Male 1.27*** (17.1)
1.08*** (11.9)
1.45*** (15.5)
Observations 2256 1128 1128 R-squared 0.57 0.74 0.58
Note: Cohort dummies are considered as time invariant variables and are controlled using a fixed effects model. Furthermore, prefecture dummies are included but their results are not reported. Numbers in parentheses are t-statistics. * and *** indicate significance at the 10% and 1% levels, respectively.