Embed Size (px)
Citation preview
Dr. Ralph P. Hall, School of Public and International Affairs (SPIA), Virginia Tech
Dr. Eric A. Vance, Laboratory for Interdisciplinary Statistical Analysis (LISA), Virginia Tech
March 27, 2014
Impact Evaluation of the MCC’s Rural Water Supply Project in Mozambique: Enhancing local partner
capacity through collaboration
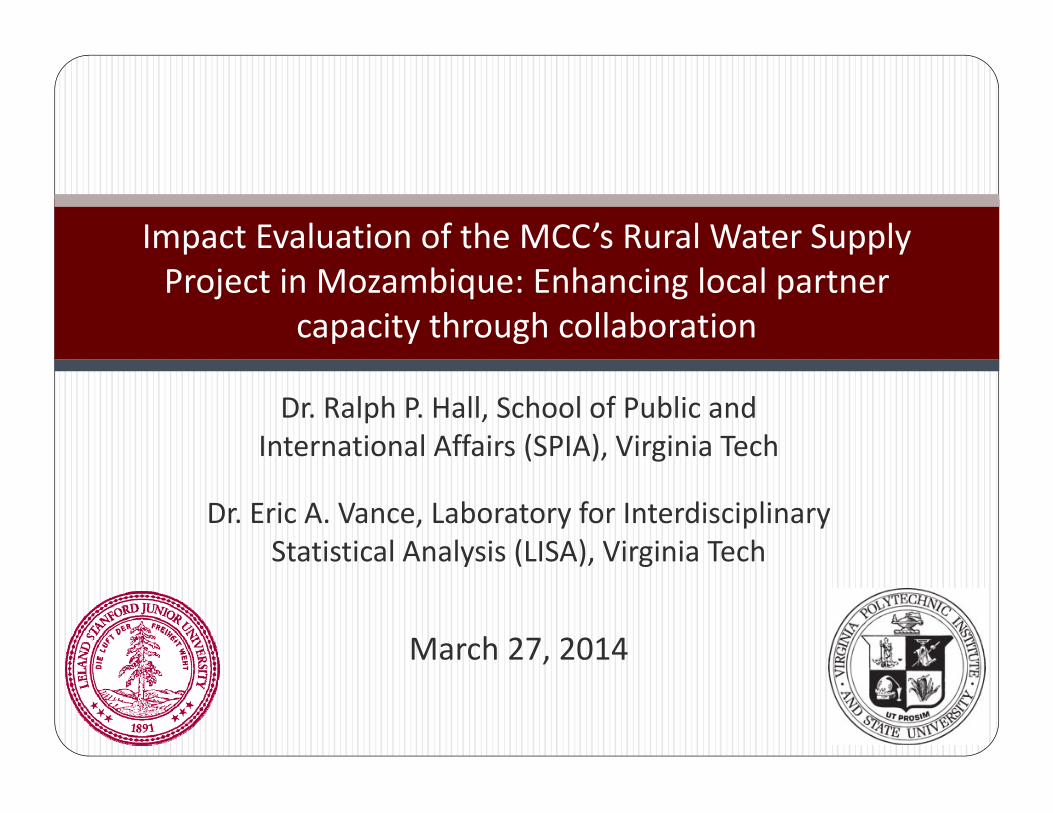
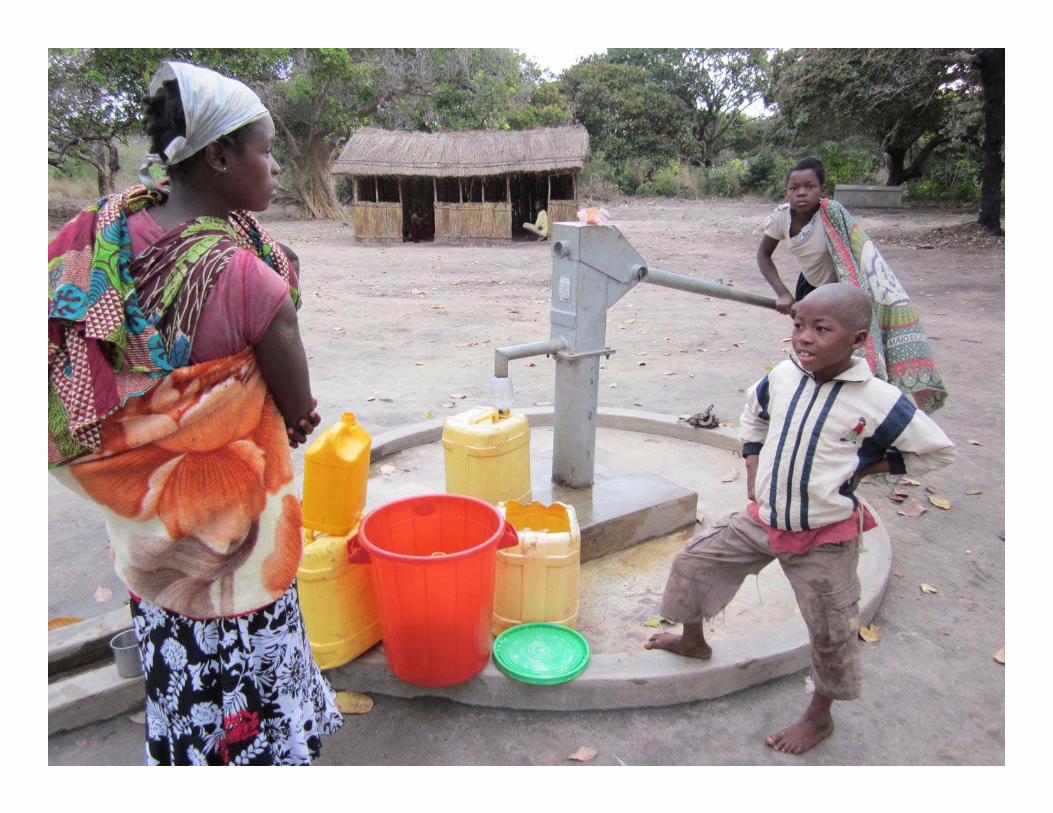
Rural Water Supply Activity (RWSA) Installation of 600 handpumps in rural communities across the provinces of Nampula (358) and Cabo Delgado (242)
Installation of 10 small scale solar systems in Cabo Delgado
2
3
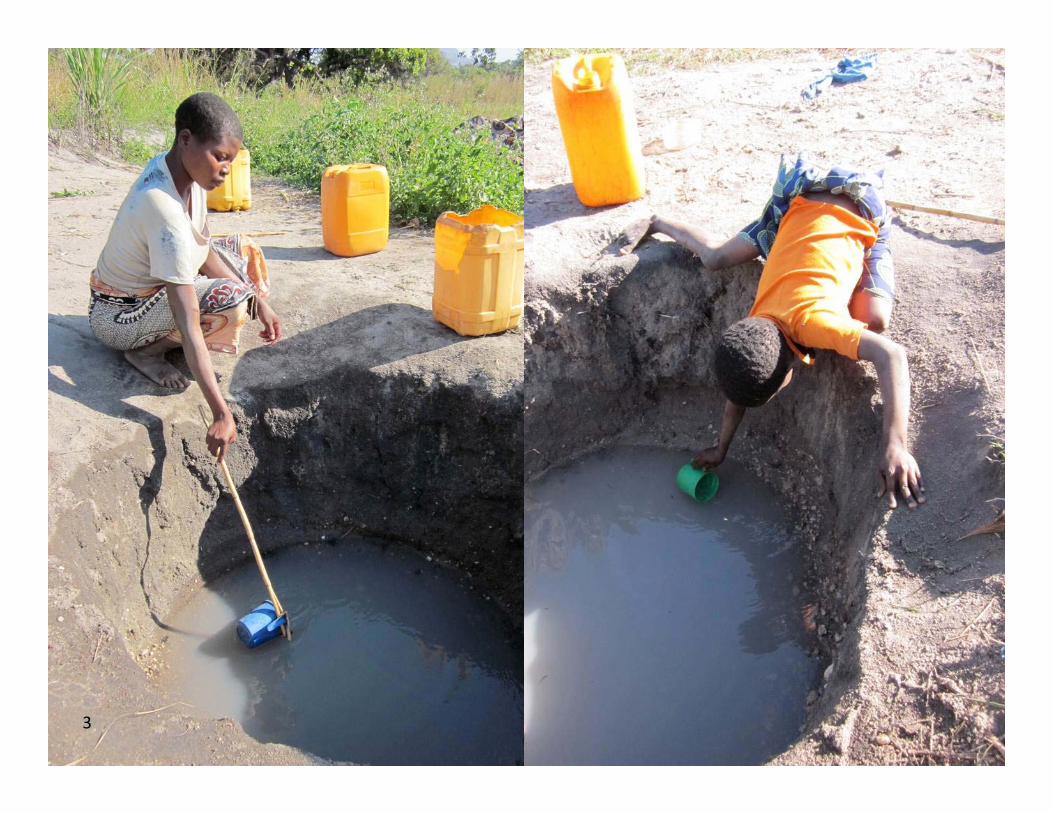
The objectives of the RWSA, as stated in the Compact, are to increase beneficiary productivity and income through:
4
Time savings Reducing water‐related illnesses (diarrhea, dysentery, etc.)
5
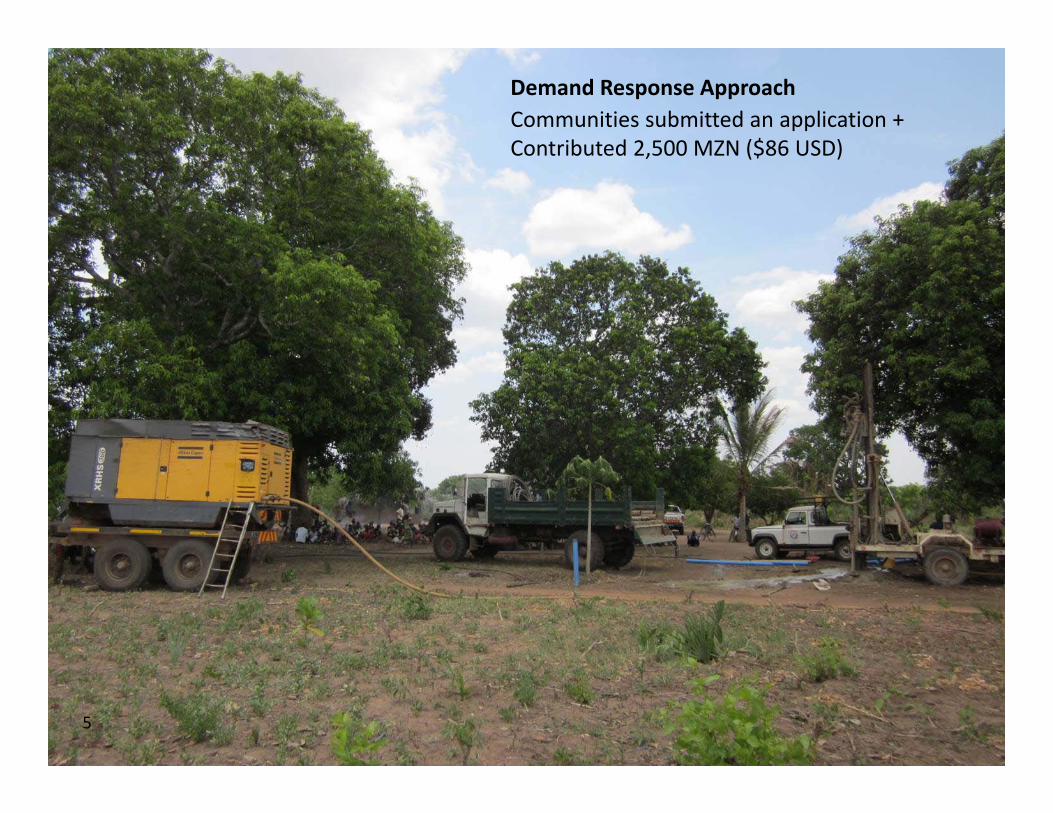
Demand Response ApproachCommunities submitted an application + Contributed 2,500 MZN ($86 USD)
6
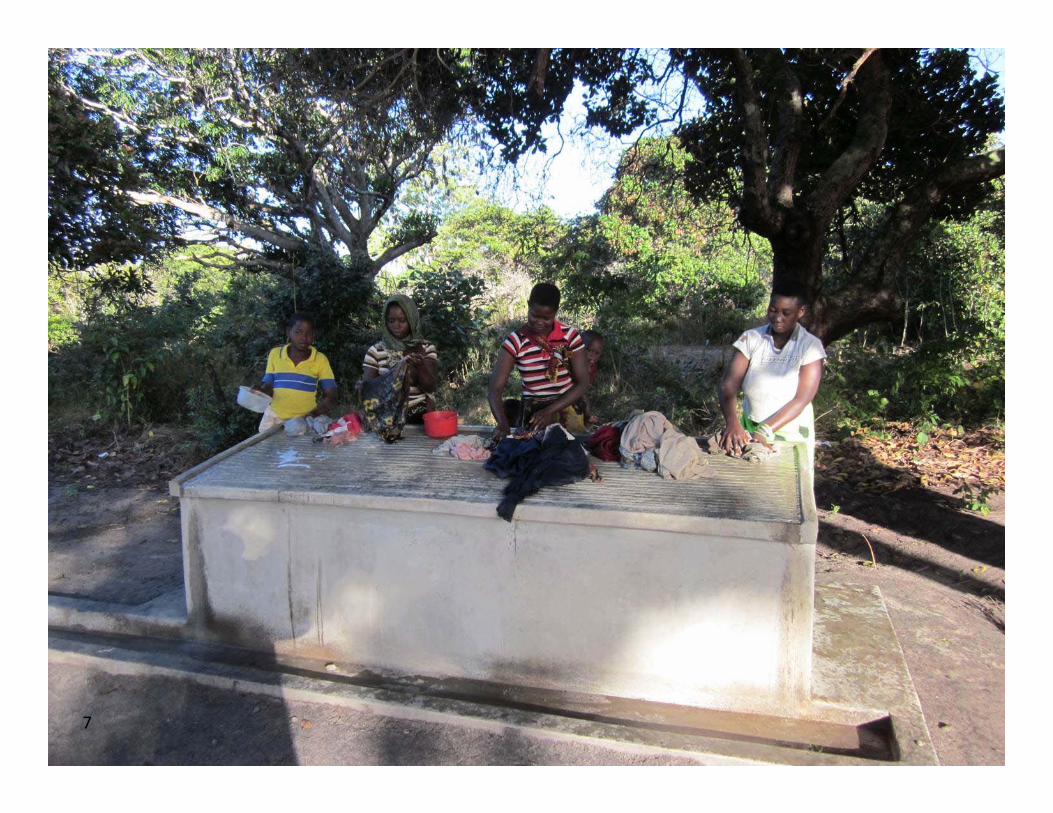
7
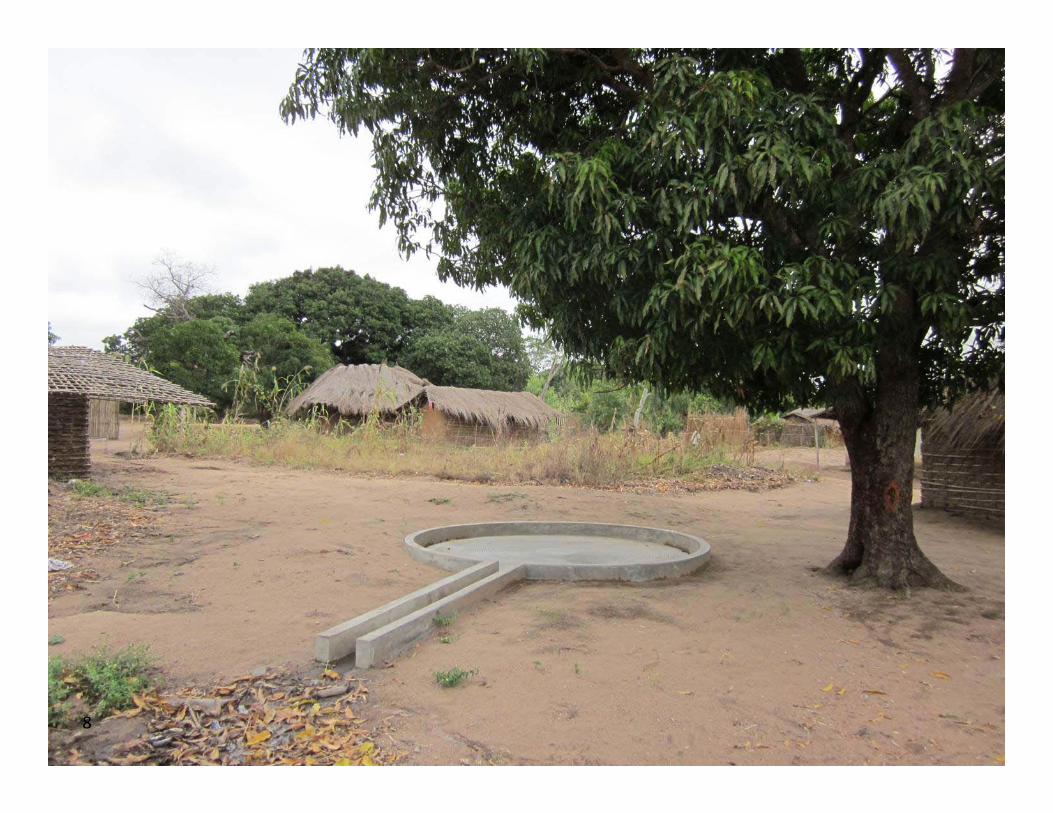
8
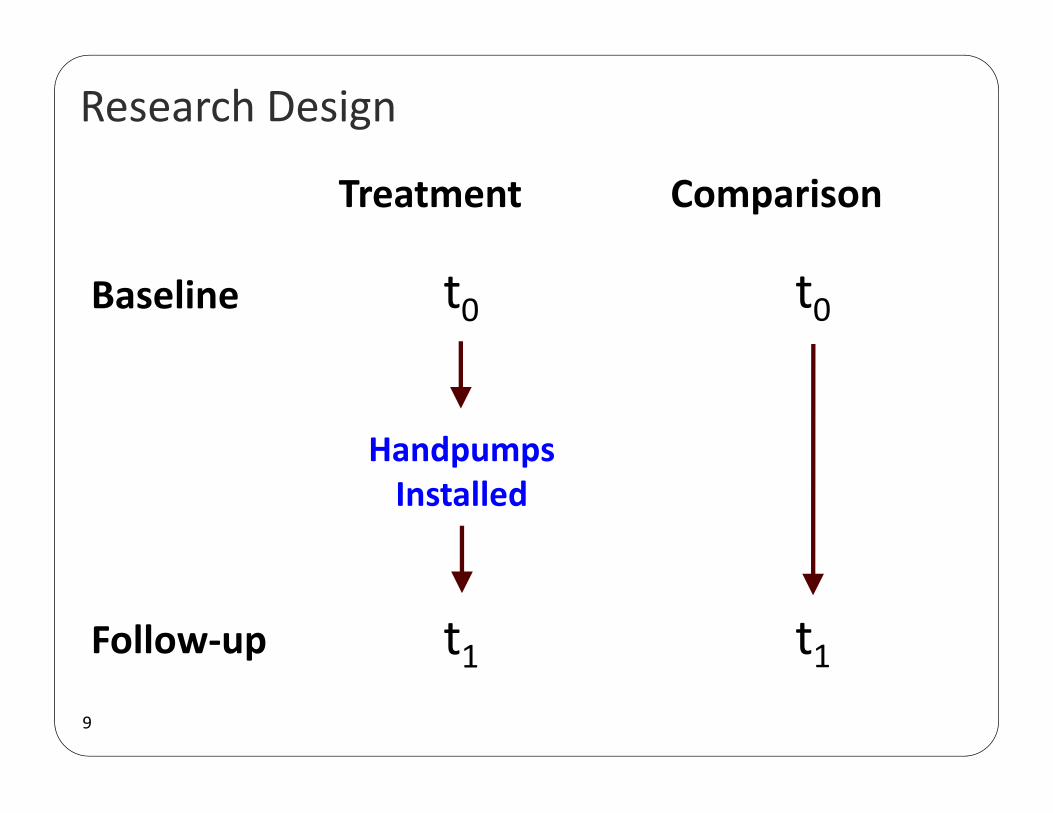
Treatment Comparison
Baseline
Follow‐up
t0
t1
t0
t1
HandpumpsInstalled
Research Design
9
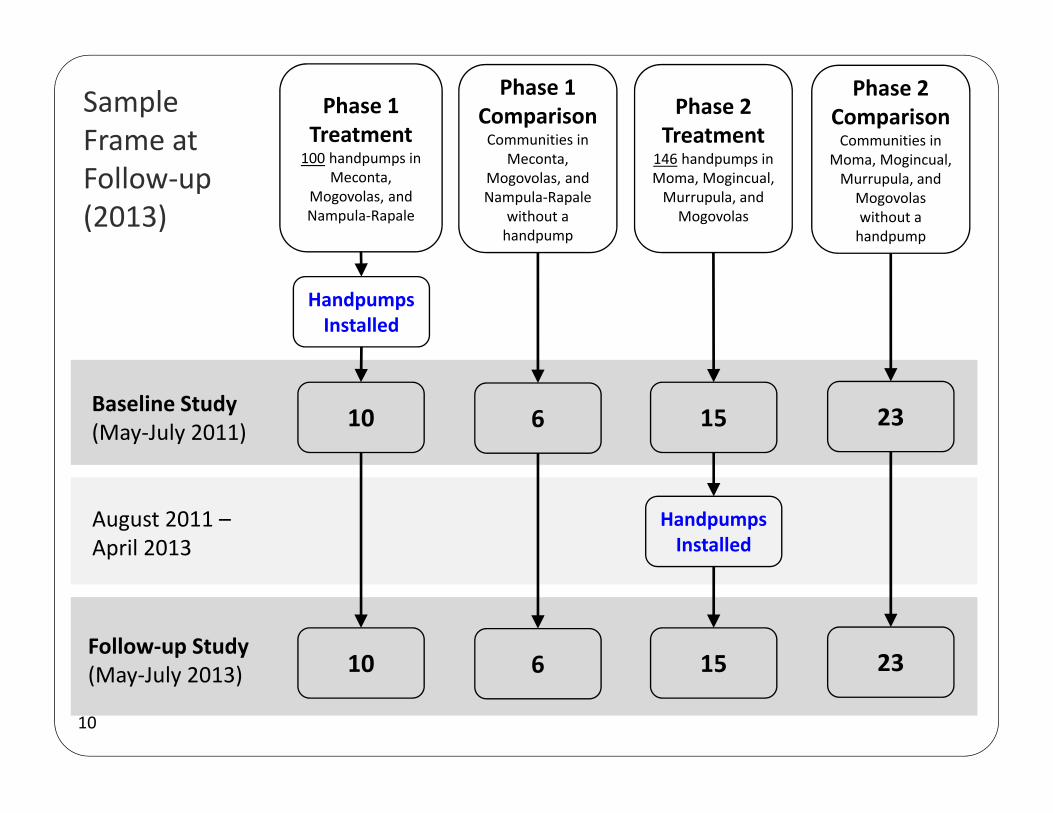
Phase 1 Treatment
100 handpumps in Meconta,
Mogovolas, and Nampula‐Rapale
HandpumpsInstalled
1510
1510Baseline Study(May‐July 2011)
August 2011 –April 2013
Follow‐up Study (May‐July 2013) 6
6
Phase 1 ComparisonCommunities in
Meconta, Mogovolas, and Nampula‐Rapale
without a handpump
Phase 2 Treatment
146 handpumps in Moma, Mogincual, Murrupula, and Mogovolas
Phase 2 ComparisonCommunities in
Moma, Mogincual, Murrupula, and Mogovolaswithout a handpump
23
23
HandpumpsInstalled
Sample Frame at Follow‐up(2013)
10
11
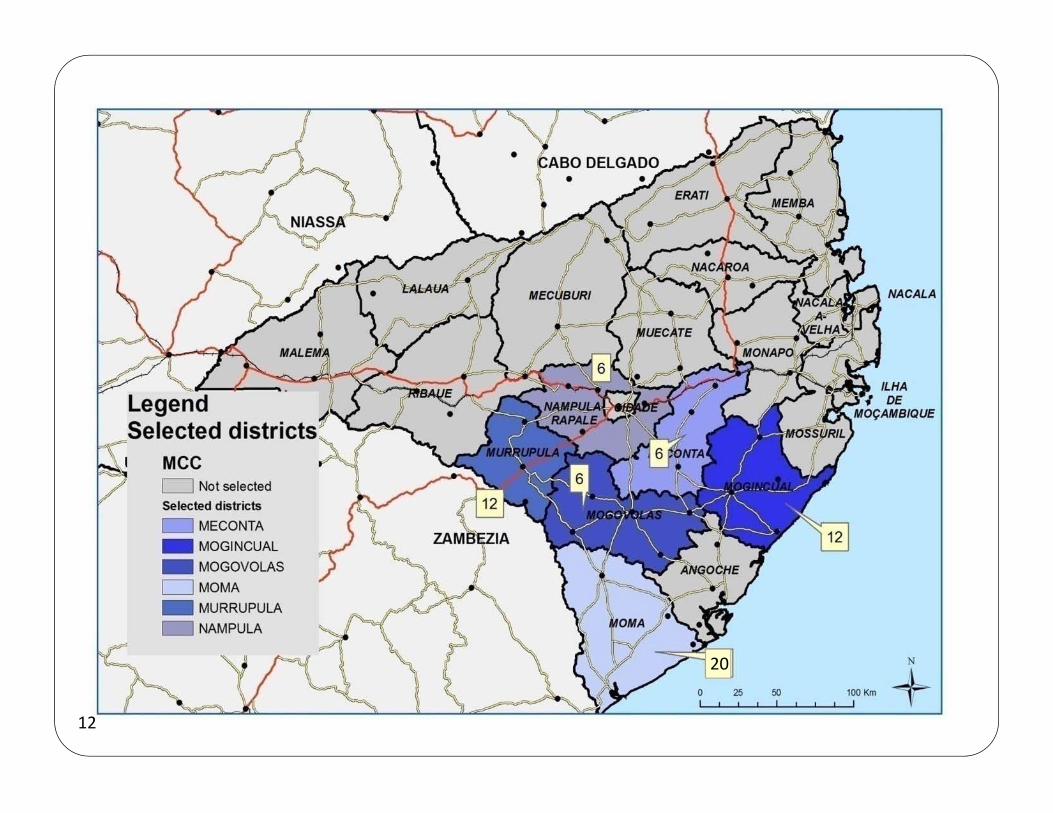
20
12
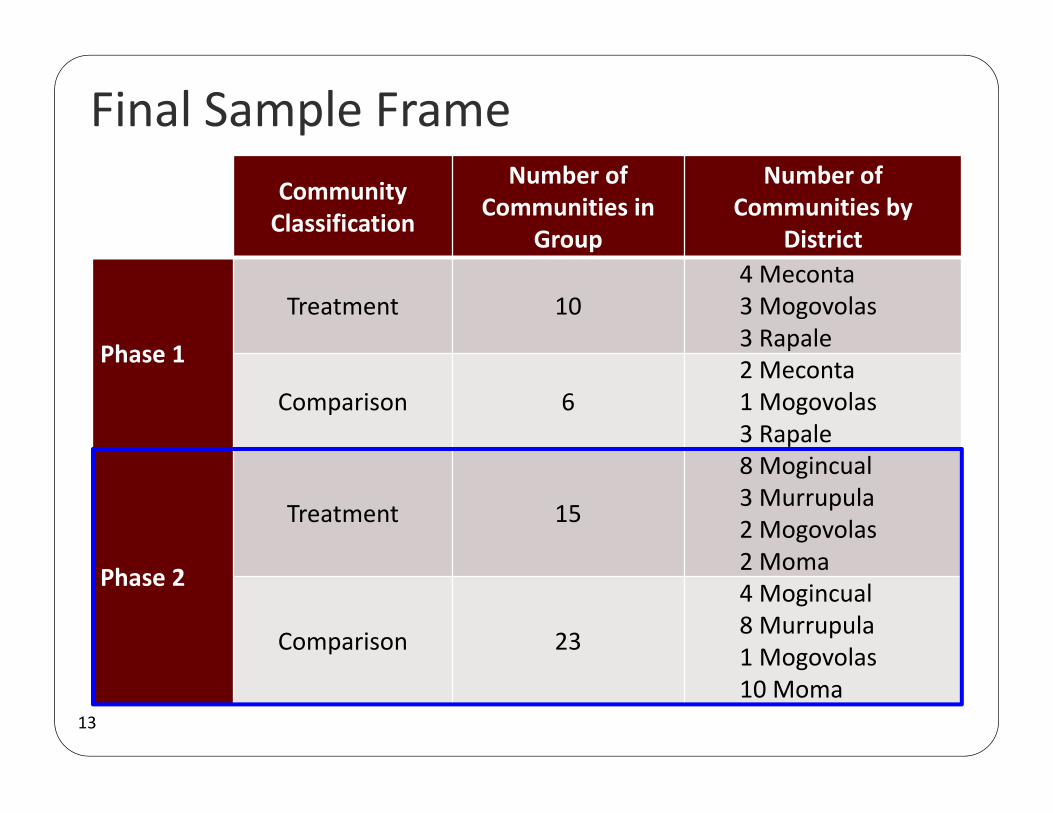
Final Sample Frame Community Classification
Number of Communities in
Group
Number of Communities by
District
Phase 1
Treatment 104 Meconta3 Mogovolas3 Rapale
Comparison 62 Meconta1 Mogovolas3 Rapale
Phase 2
Treatment 15
8 Mogincual3 Murrupula2 Mogovolas2 Moma
Comparison 23
4 Mogincual8 Murrupula1 Mogovolas10 Moma
13
Data Collection
14
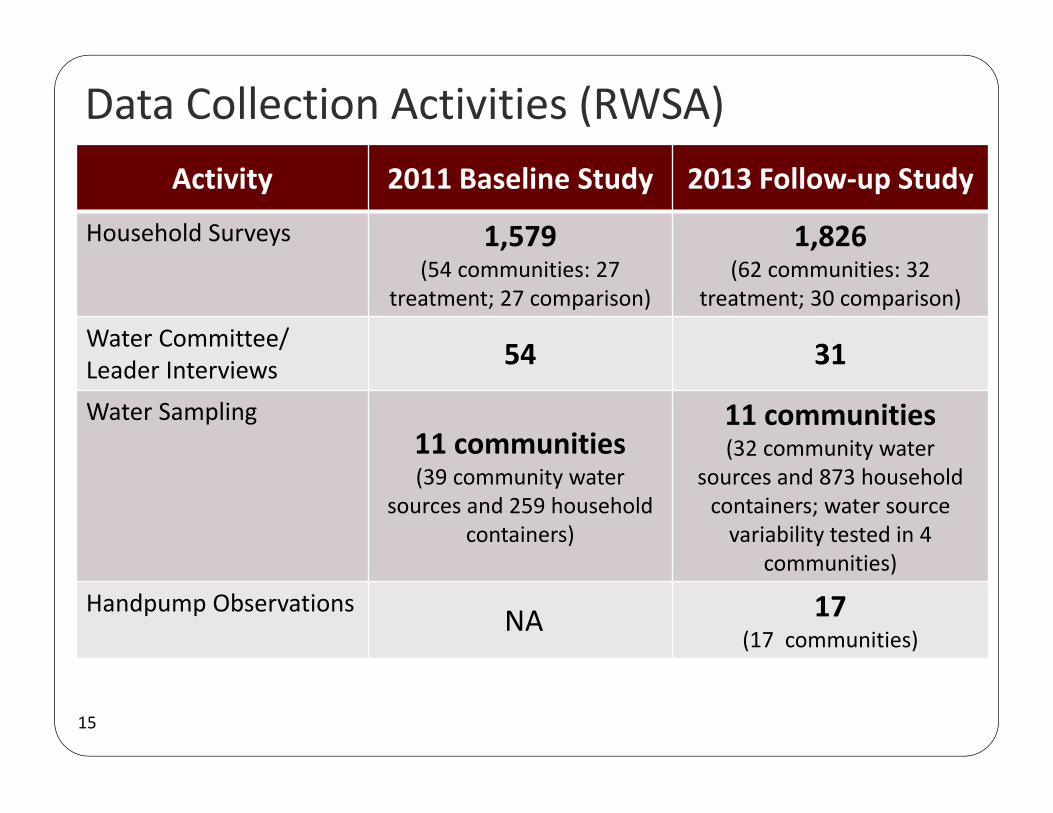
Data Collection Activities (RWSA)Activity 2011 Baseline Study 2013 Follow‐up Study
Household Surveys 1,579 (54 communities: 27
treatment; 27 comparison)
1,826 (62 communities: 32
treatment; 30 comparison)
Water Committee/ Leader Interviews 54 31
Water Sampling11 communities (39 community water
sources and 259 household containers)
11 communities (32 community water
sources and 873 household containers; water sourcevariability tested in 4
communities)
Handpump Observations NA 17(17 communities)
15
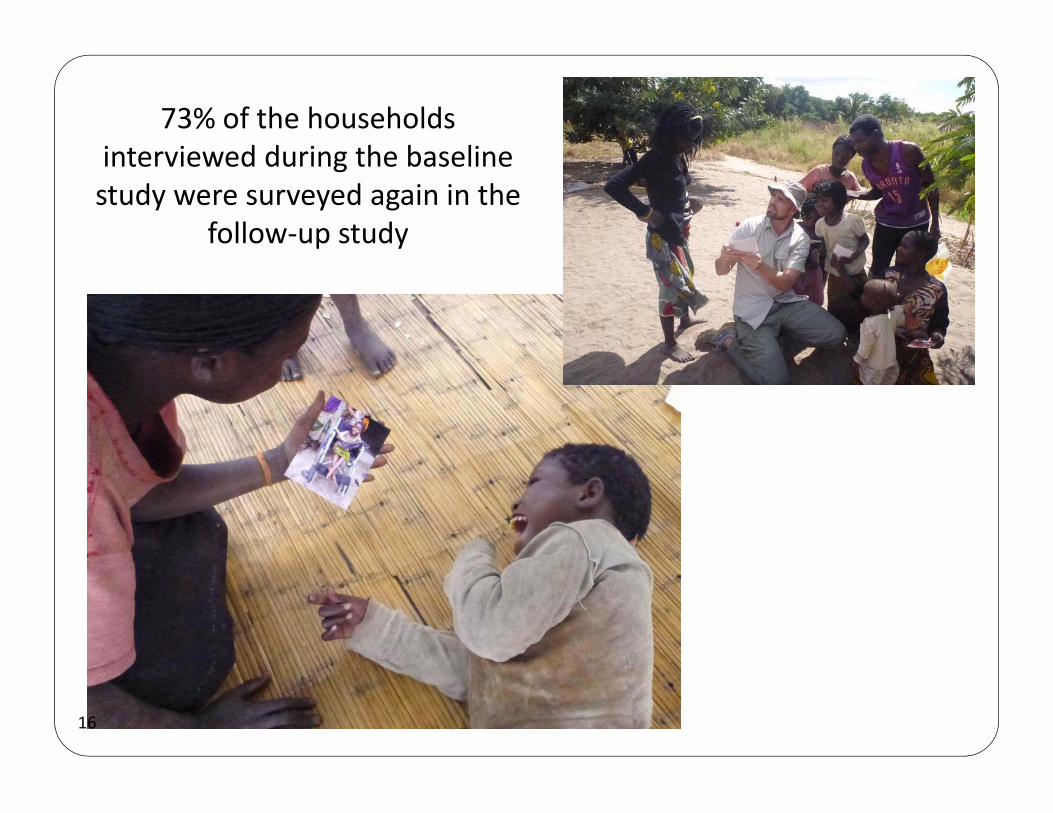
73% of the households interviewed during the baseline study were surveyed again in the
follow‐up study
16
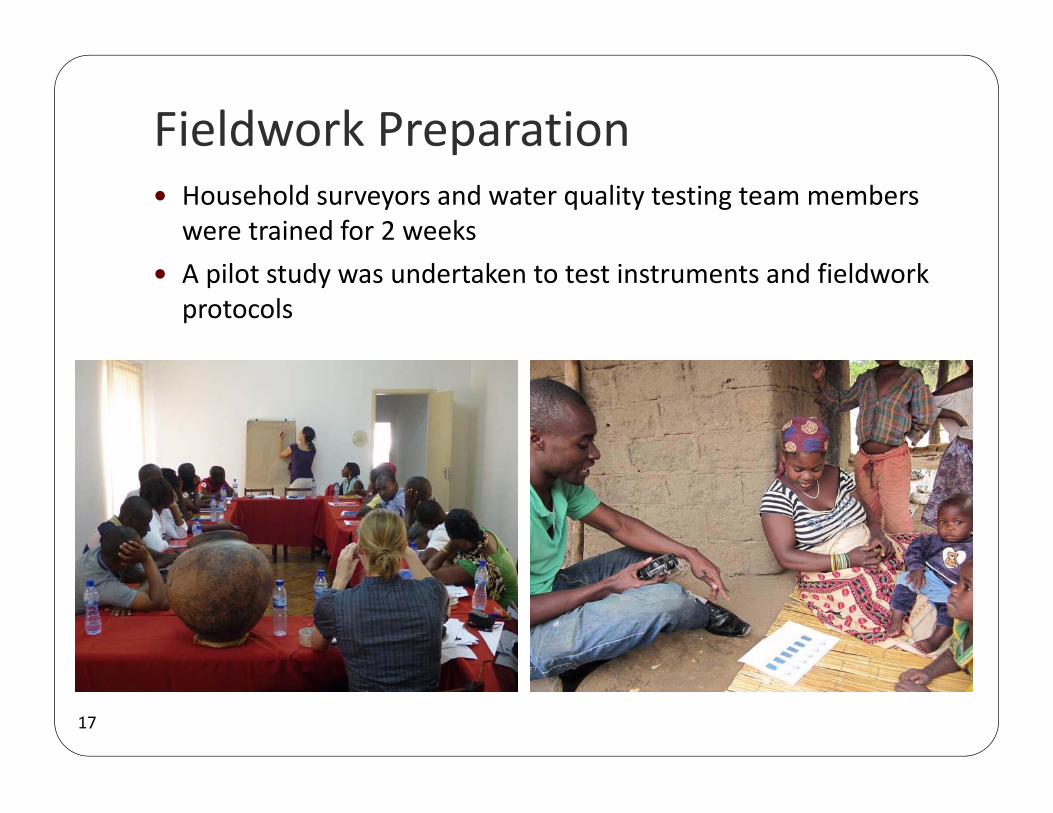
Fieldwork Preparation Household surveyors and water quality testing team members were trained for 2 weeks
A pilot study was undertaken to test instruments and fieldwork protocols
17
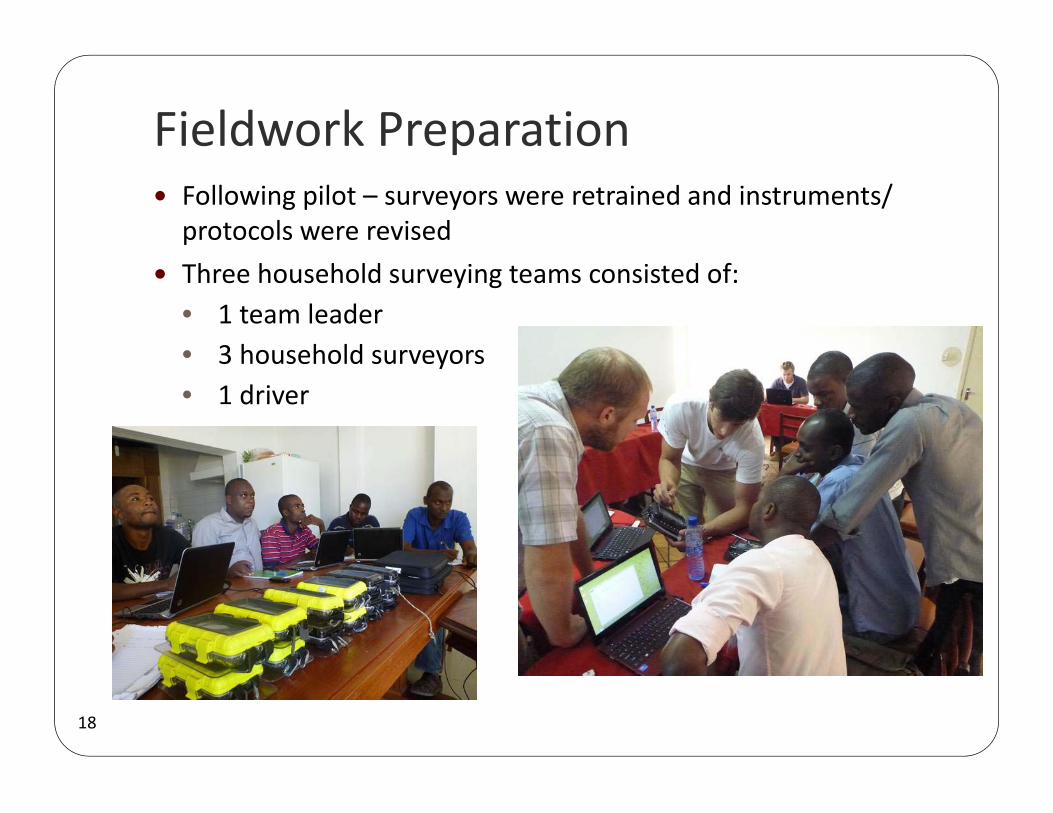
Fieldwork Preparation Following pilot – surveyors were retrained and instruments/ protocols were revised
Three household surveying teams consisted of:• 1 team leader • 3 household surveyors• 1 driver
18
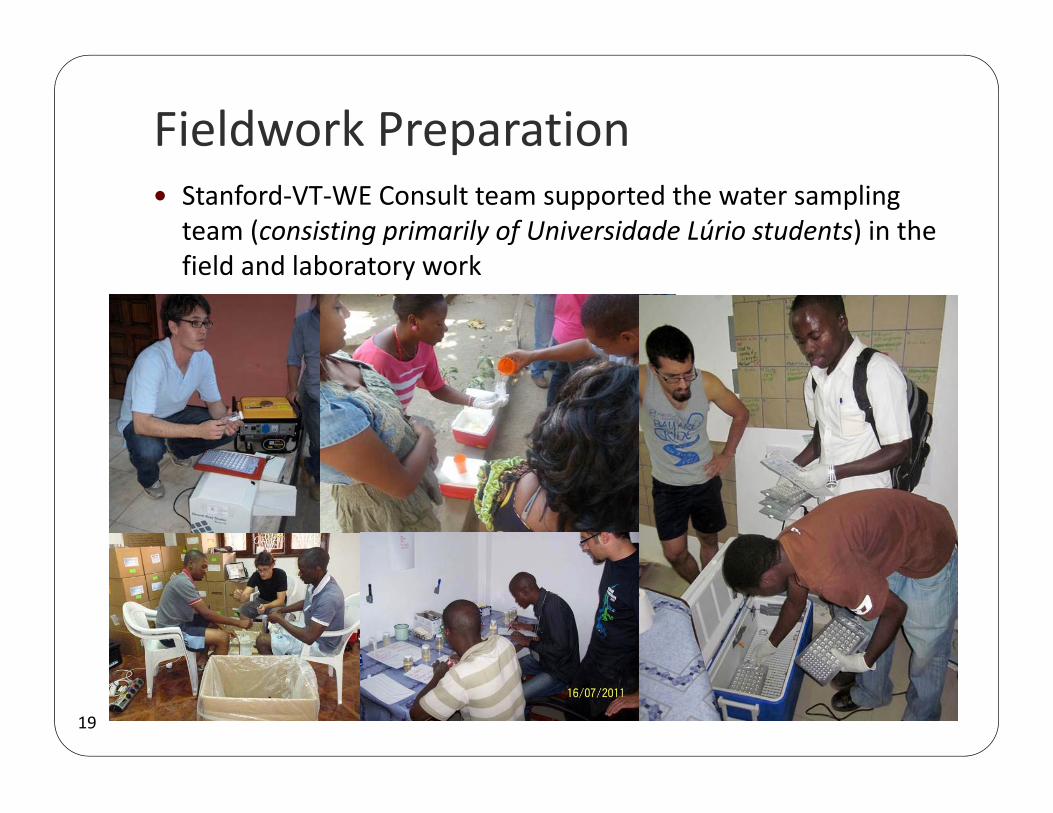
Fieldwork Preparation Stanford‐VT‐WE Consult team supported the water sampling team (consisting primarily of Universidade Lúrio students) in the field and laboratory work
19
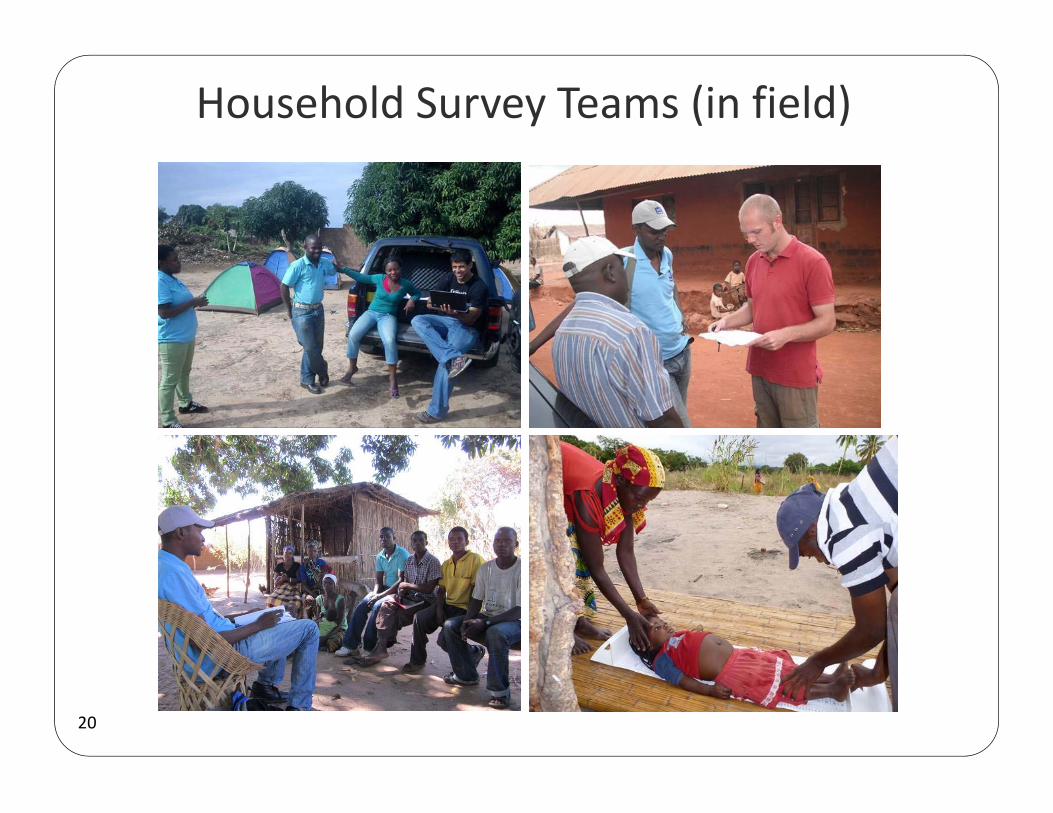
Household Survey Teams (in field)
20
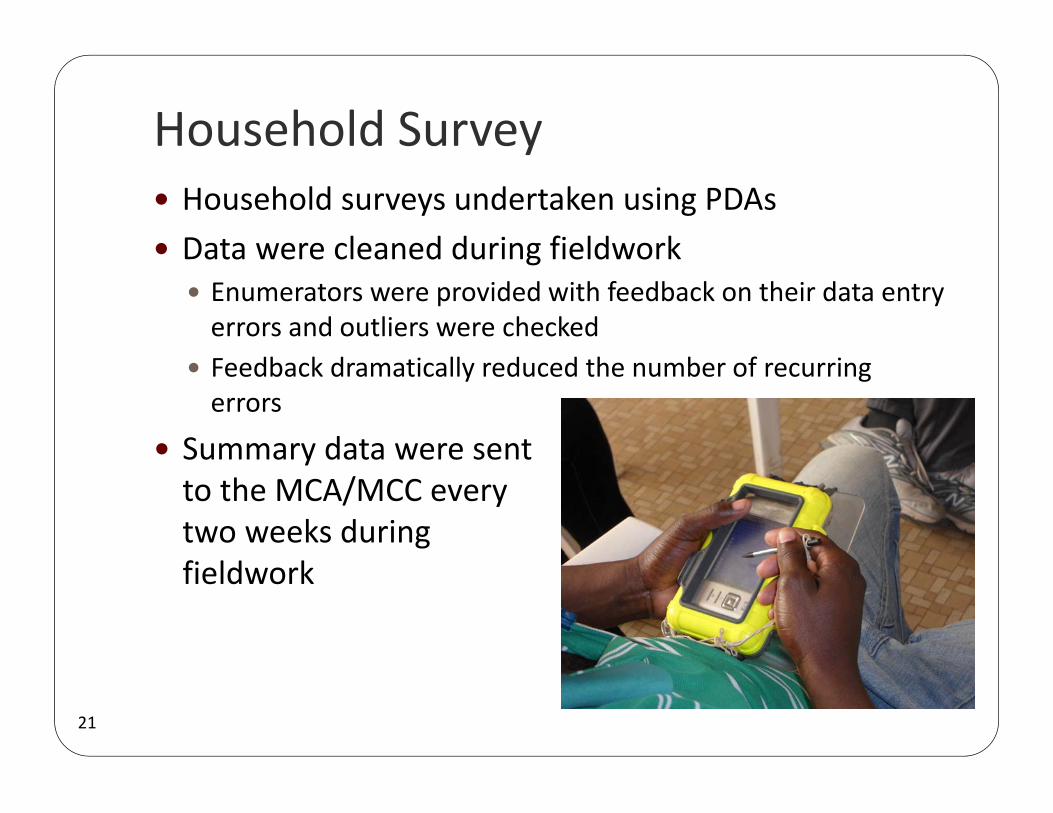
Household Survey Household surveys undertaken using PDAs Data were cleaned during fieldwork Enumerators were provided with feedback on their data entry errors and outliers were checked
Feedback dramatically reduced the number of recurring errors
Summary data were sent to the MCA/MCC every two weeks during fieldwork
21
22
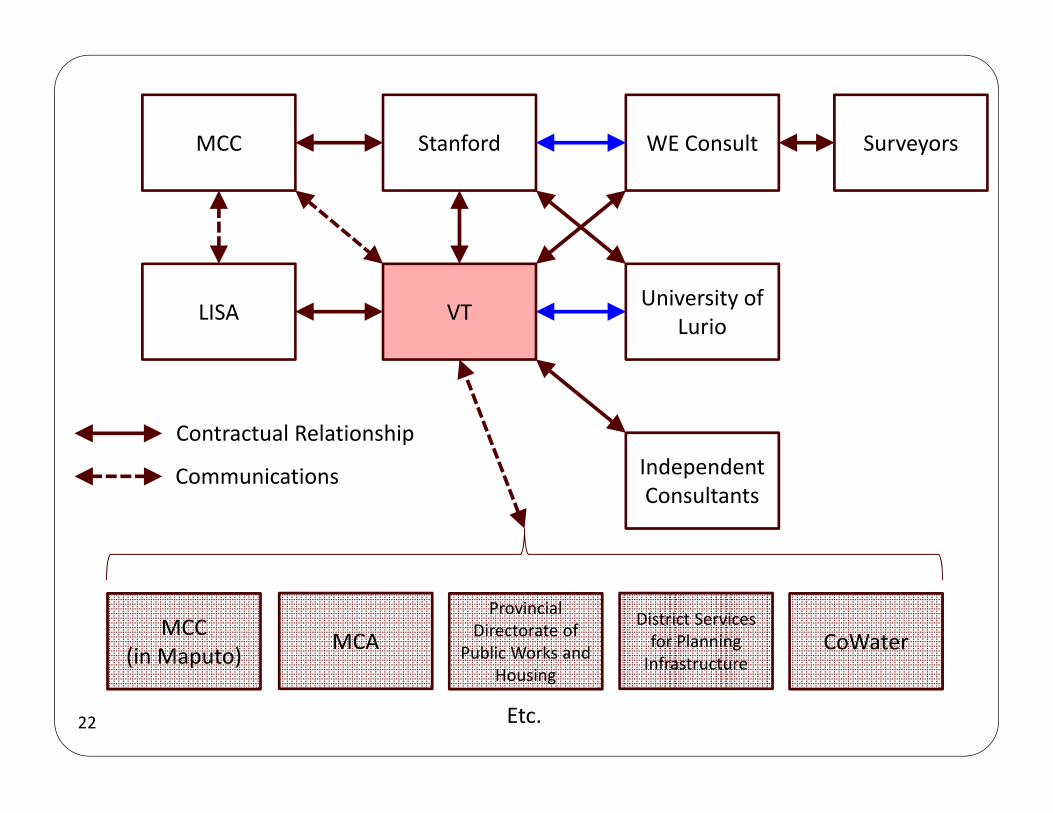
StanfordMCC
VTLISA
WE Consult
University of Lurio
Independent Consultants
MCAProvincial
Directorate of Public Works and
Housing
District Services for Planning Infrastructure
MCC (in Maputo) CoWater
Contractual Relationship
Communications
Etc.
Surveyors
Water Sources Used by Households
23
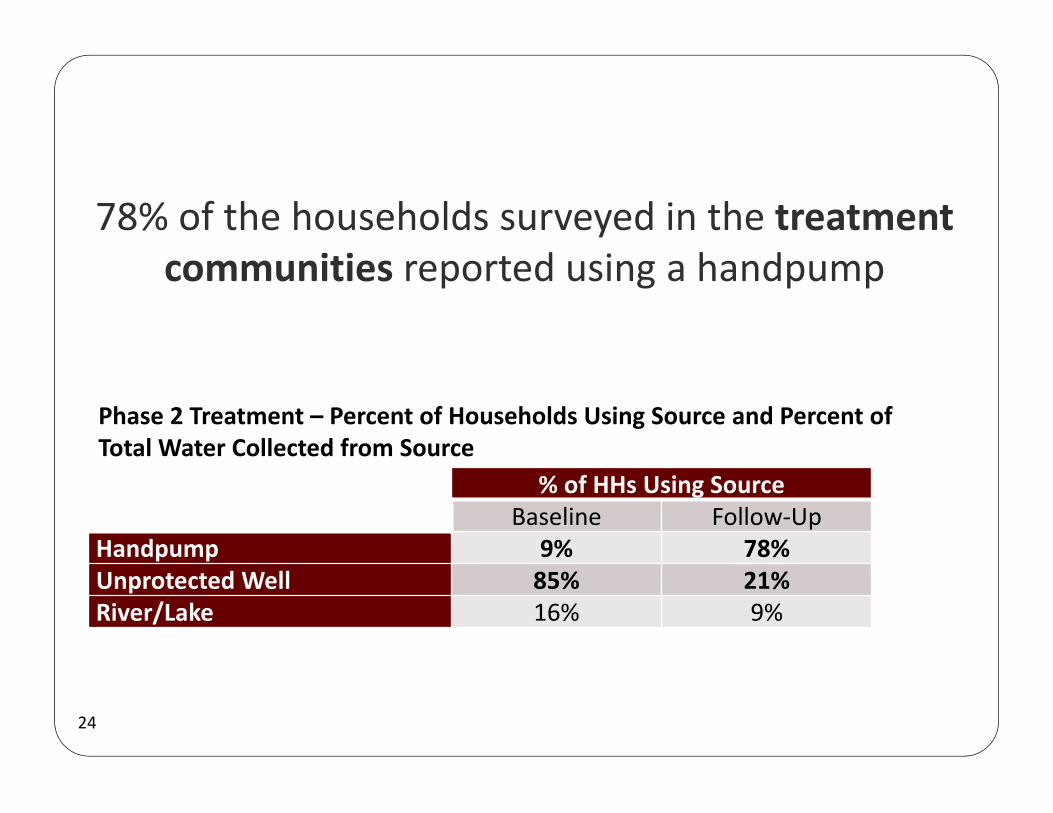
78% of the households surveyed in the treatment communities reported using a handpump
% of HHs Using SourceBaseline Follow‐Up
Handpump 9% 78%Unprotected Well 85% 21%River/Lake 16% 9%
Phase 2 Treatment – Percent of Households Using Source and Percent of Total Water Collected from Source
24
Water Consumption
All Sources and Improved Sources
25
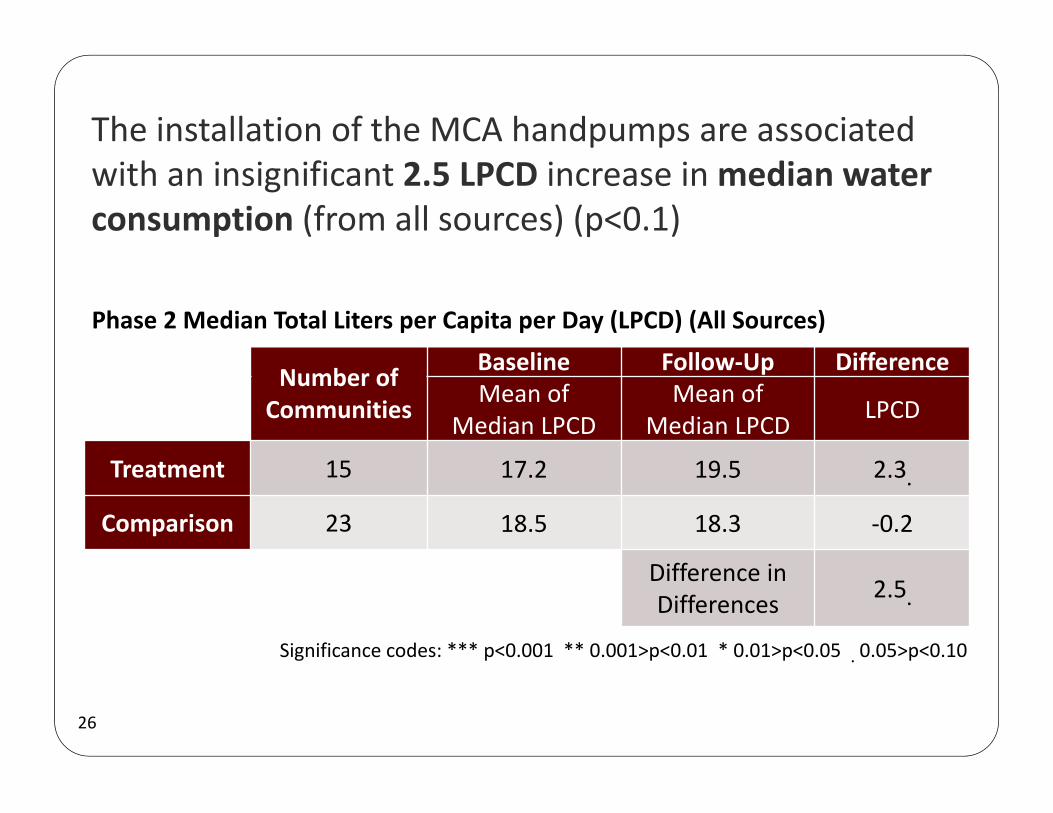
The installation of the MCA handpumps are associated with an insignificant 2.5 LPCD increase in median water consumption (from all sources) (p<0.1)
Phase 2 Median Total Liters per Capita per Day (LPCD) (All Sources)
Number of Communities
Baseline Follow‐Up DifferenceMean of
Median LPCDMean of
Median LPCD LPCD
Treatment 15 17.2 19.5 2.3.
Comparison 23 18.5 18.3 ‐0.2
Difference in Differences 2.5.
Significance codes: *** p<0.001 ** 0.001>p<0.01 * 0.01>p<0.05 . 0.05>p<0.10
26
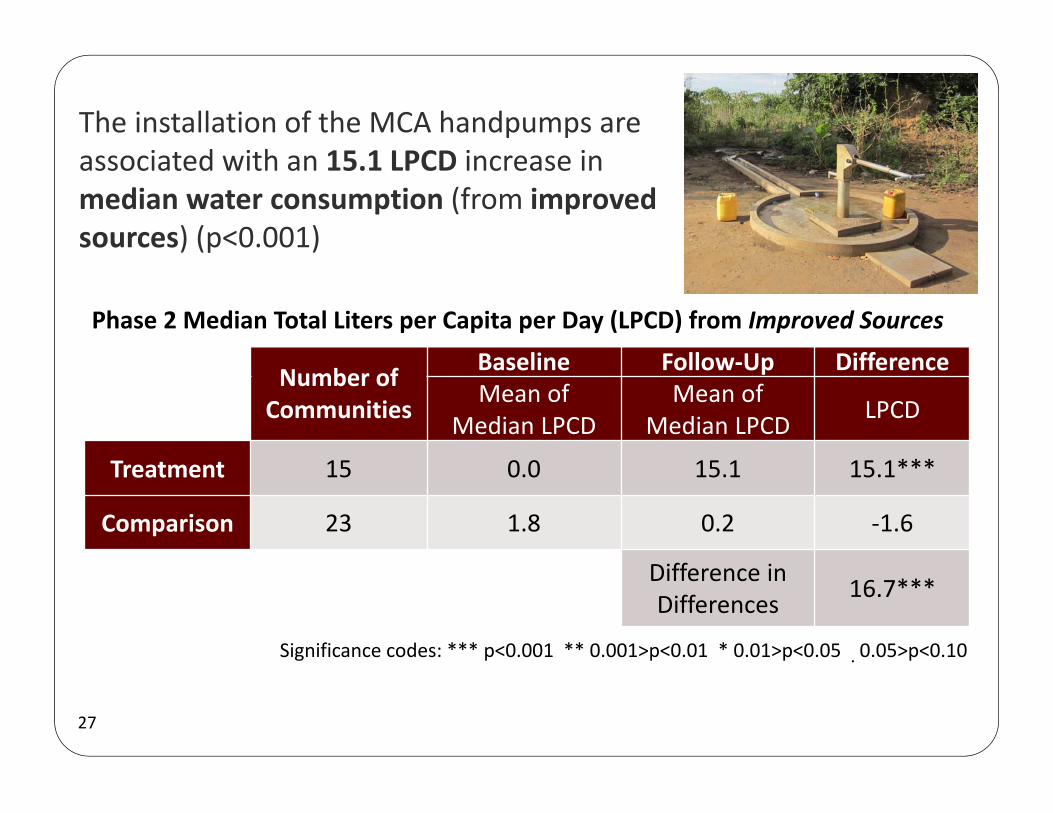
The installation of the MCA handpumps are associated with an 15.1 LPCD increase in median water consumption (from improved sources) (p<0.001)
Phase 2 Median Total Liters per Capita per Day (LPCD) from Improved Sources
Number of Communities
Baseline Follow‐Up DifferenceMean of
Median LPCDMean of
Median LPCD LPCD
Treatment 15 0.0 15.1 15.1***
Comparison 23 1.8 0.2 ‐1.6
Difference in Differences 16.7***
Significance codes: *** p<0.001 ** 0.001>p<0.01 * 0.01>p<0.05 . 0.05>p<0.10
27
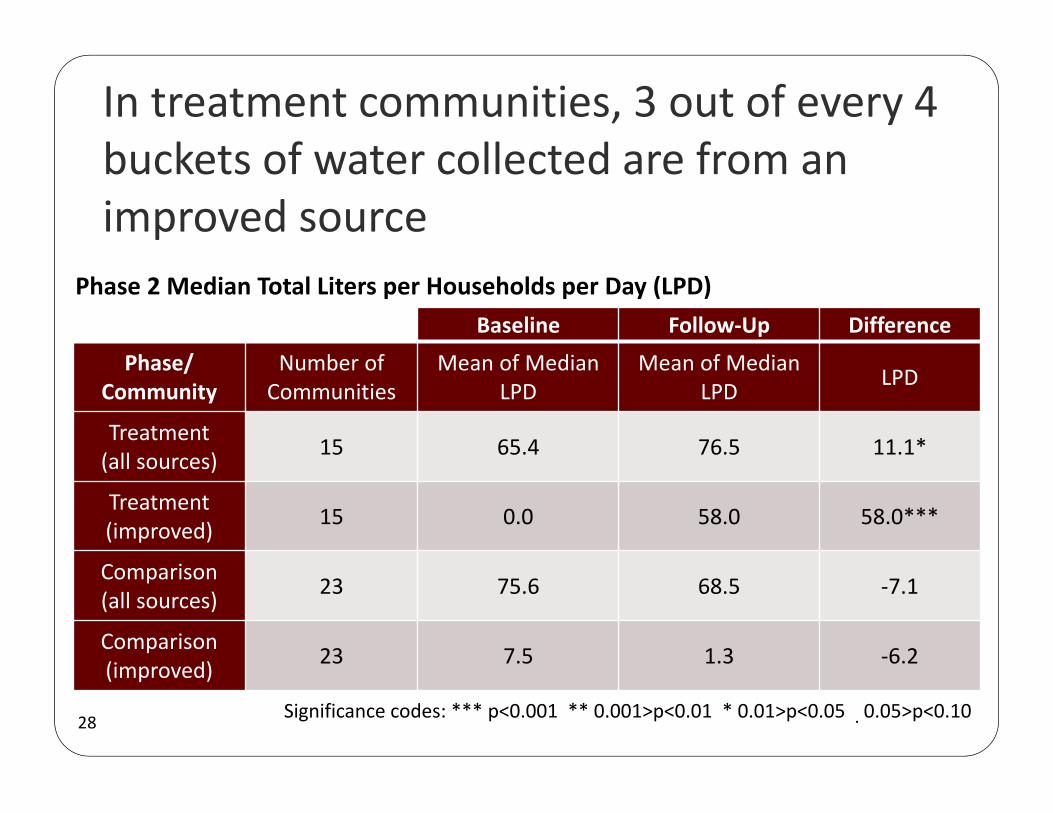
In treatment communities, 3 out of every 4 buckets of water collected are from an improved source
Baseline Follow‐Up Difference
Phase/ Community
Number of Communities
Mean of Median LPD
Mean of Median LPD LPD
Treatment (all sources) 15 65.4 76.5 11.1*
Treatment (improved) 15 0.0 58.0 58.0***
Comparison (all sources) 23 75.6 68.5 ‐7.1
Comparison (improved) 23 7.5 1.3 ‐6.2
Significance codes: *** p<0.001 ** 0.001>p<0.01 * 0.01>p<0.05 . 0.05>p<0.10
Phase 2 Median Total Liters per Households per Day (LPD)
28
Time Spent Collecting Water
29
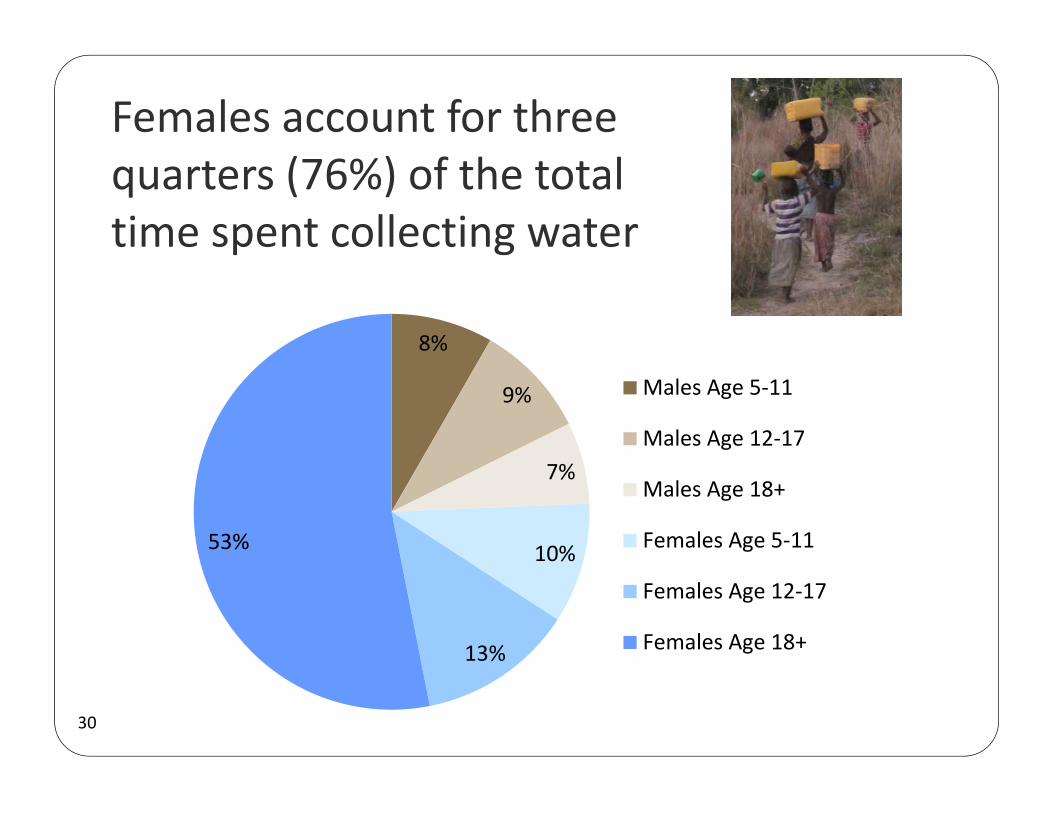
Females account for three quarters (76%) of the total time spent collecting water
8%
9%
7%
10%
13%
53%
Males Age 5‐11
Males Age 12‐17
Males Age 18+
Females Age 5‐11
Females Age 12‐17
Females Age 18+
30
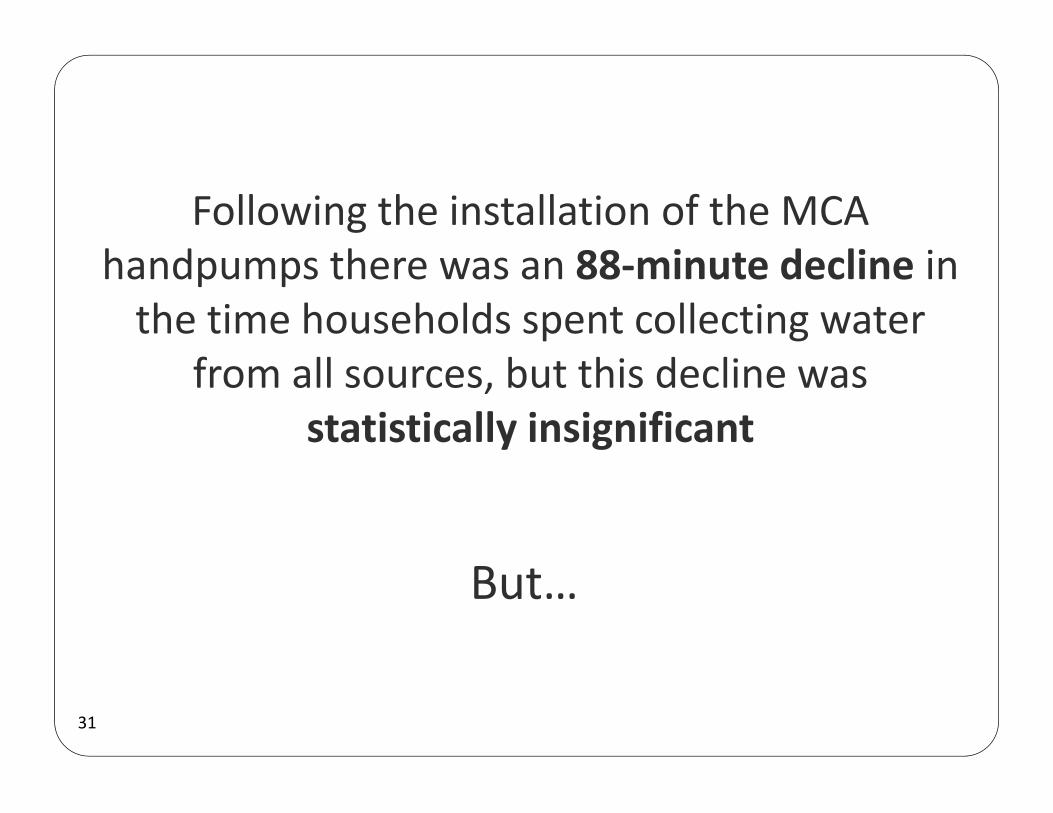
Following the installation of the MCA handpumps there was an 88‐minute decline in the time households spent collecting water
from all sources, but this decline was statistically insignificant
But…
31
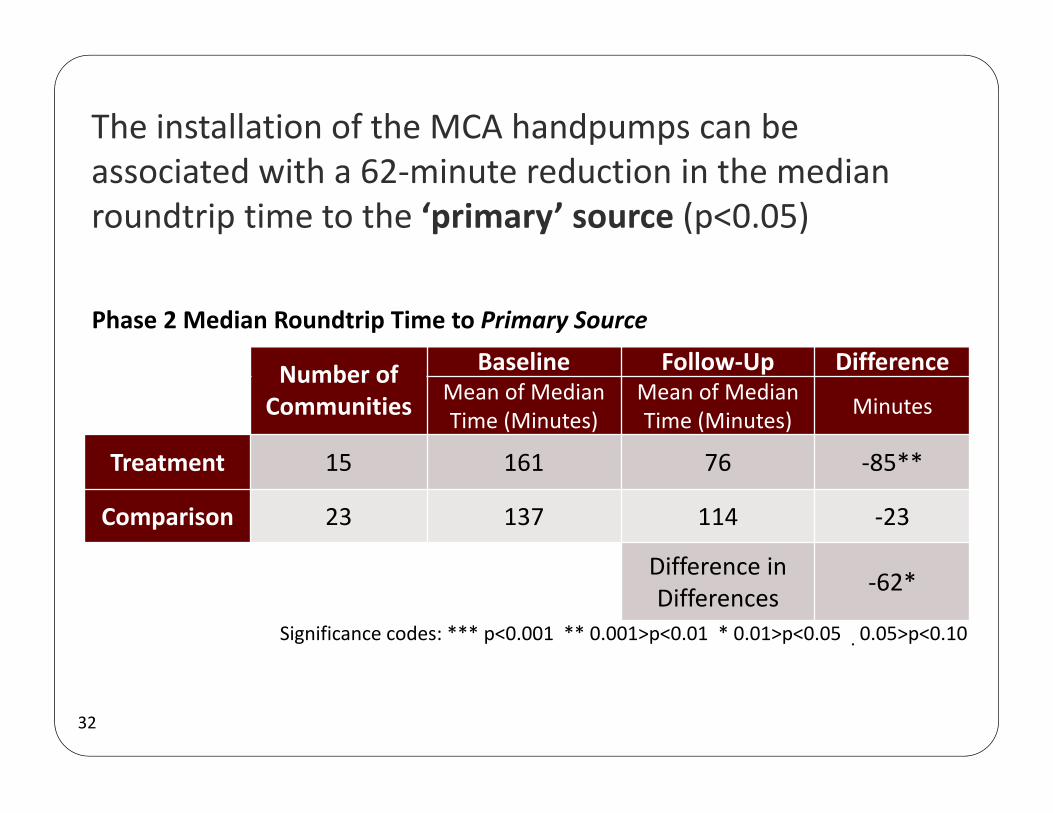
The installation of the MCA handpumps can be associated with a 62‐minute reduction in the median roundtrip time to the ‘primary’ source (p<0.05)
Phase 2 Median Roundtrip Time to Primary Source
Number of Communities
Baseline Follow‐Up DifferenceMean of Median Time (Minutes)
Mean of Median Time (Minutes) Minutes
Treatment 15 161 76 ‐85**
Comparison 23 137 114 ‐23
Difference in Differences ‐62*
Significance codes: *** p<0.001 ** 0.001>p<0.01 * 0.01>p<0.05 . 0.05>p<0.10
32
The wait time at the primary source in treatment communities declined by 41 minutes relative to comparison communities (p<0.05)
No statistically significant change was found in the one‐way walk times to the primary source
33
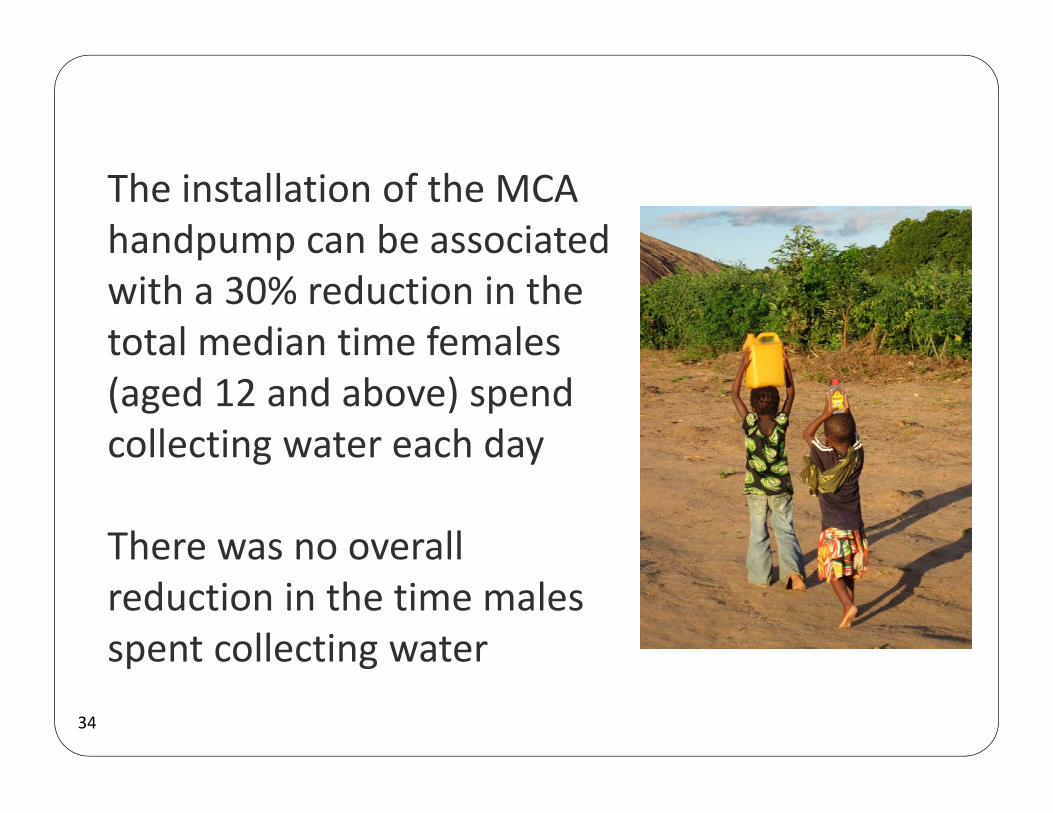
The installation of the MCA handpump can be associated with a 30% reduction in the total median time females (aged 12 and above) spend collecting water each day
There was no overall reduction in the time males spent collecting water
34
By comparing the time and water volume data by demographic groups, the installation of the MCA handpump can be associated with …
an increase in the quantity of water collected by girls and boys aged 12‐17 and women aged 18 and above, …
but a decline in the time these groups spend collecting water
35
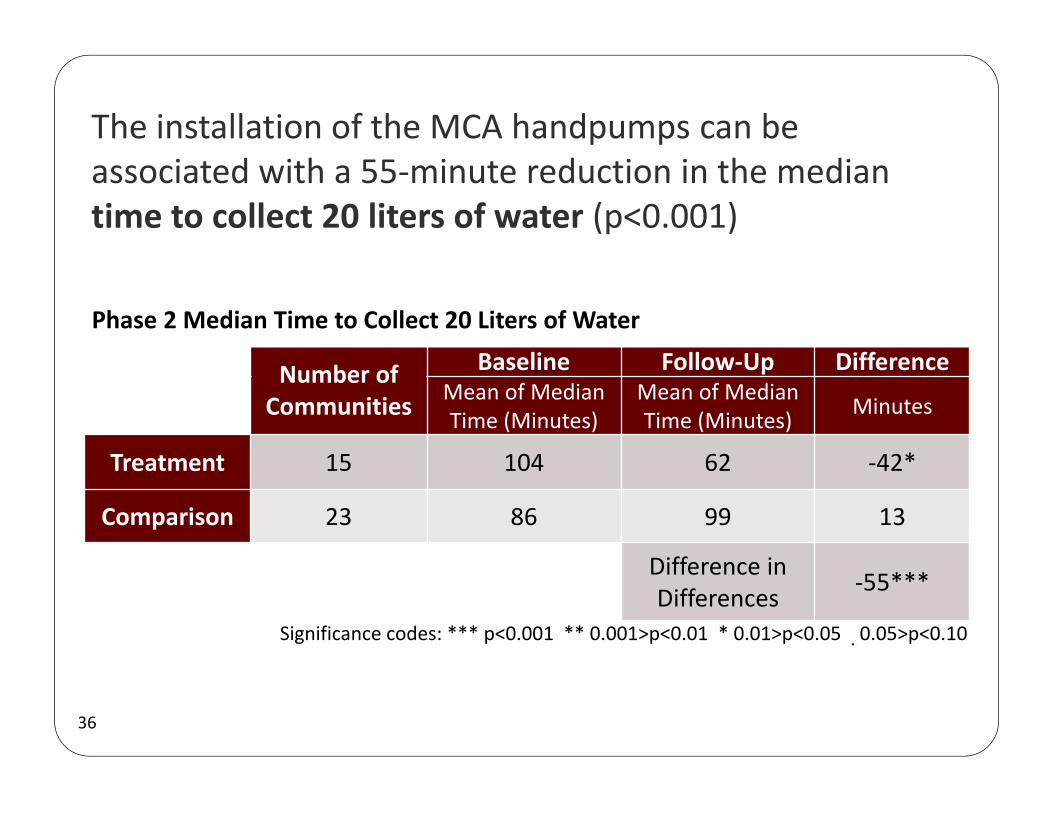
The installation of the MCA handpumps can be associated with a 55‐minute reduction in the median time to collect 20 liters of water (p<0.001)
Phase 2 Median Time to Collect 20 Liters of Water
Number of Communities
Baseline Follow‐Up DifferenceMean of Median Time (Minutes)
Mean of Median Time (Minutes) Minutes
Treatment 15 104 62 ‐42*
Comparison 23 86 99 13
Difference in Differences ‐55***
Significance codes: *** p<0.001 ** 0.001>p<0.01 * 0.01>p<0.05 . 0.05>p<0.10
36
Probability of Using the Installed Handpumps
37
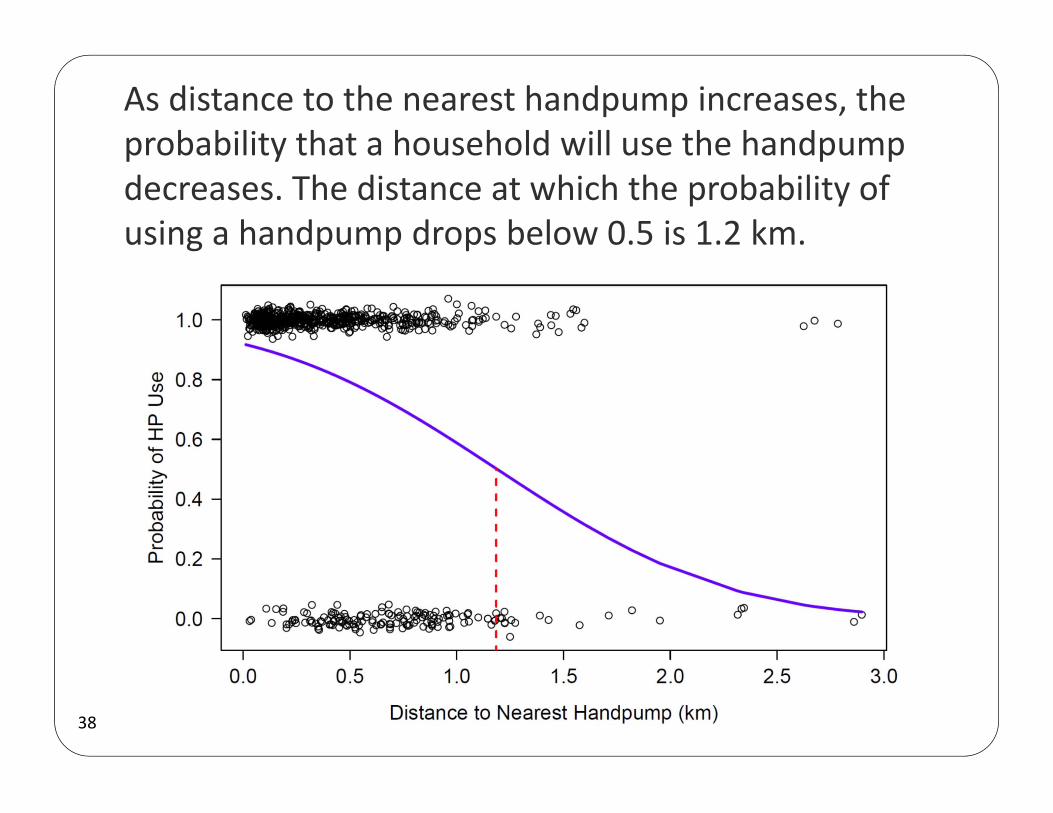
As distance to the nearest handpump increases, the probability that a household will use the handpumpdecreases. The distance at which the probability of using a handpump drops below 0.5 is 1.2 km.
38
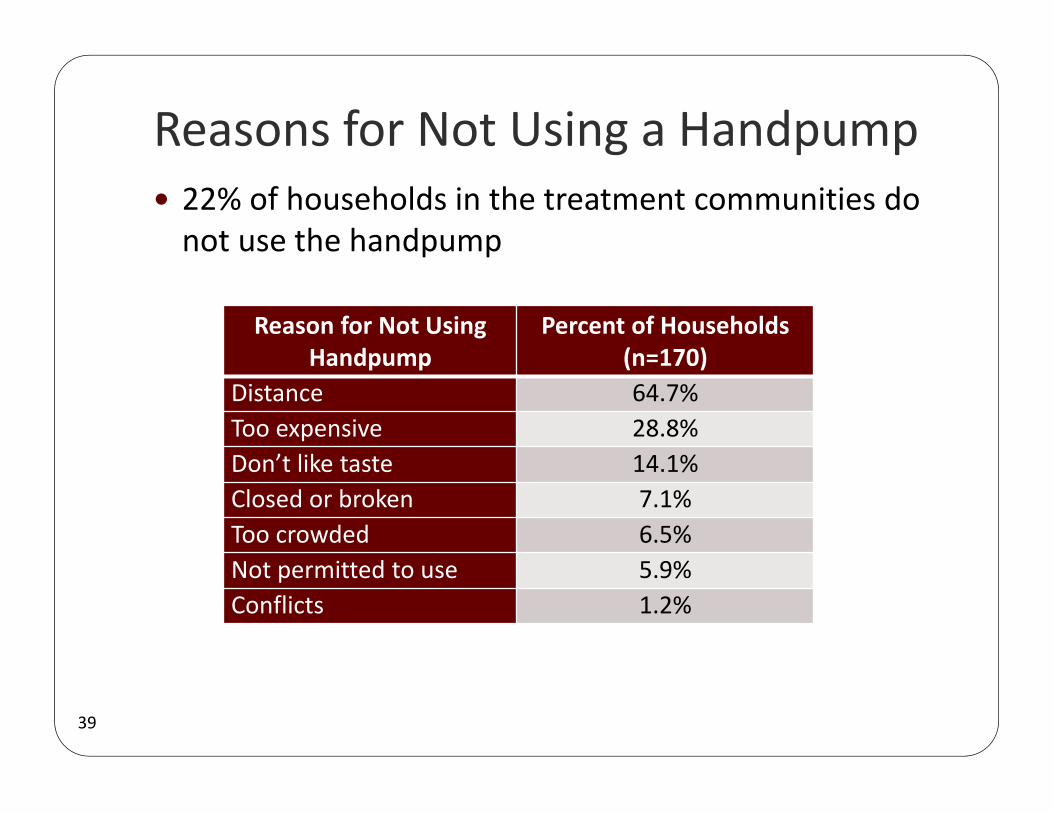
Reasons for Not Using a Handpump 22% of households in the treatment communities do not use the handpump
Reason for Not Using Handpump
Percent of Households (n=170)
Distance 64.7%Too expensive 28.8%Don’t like taste 14.1%Closed or broken 7.1%Too crowded 6.5%Not permitted to use 5.9%Conflicts 1.2%
39
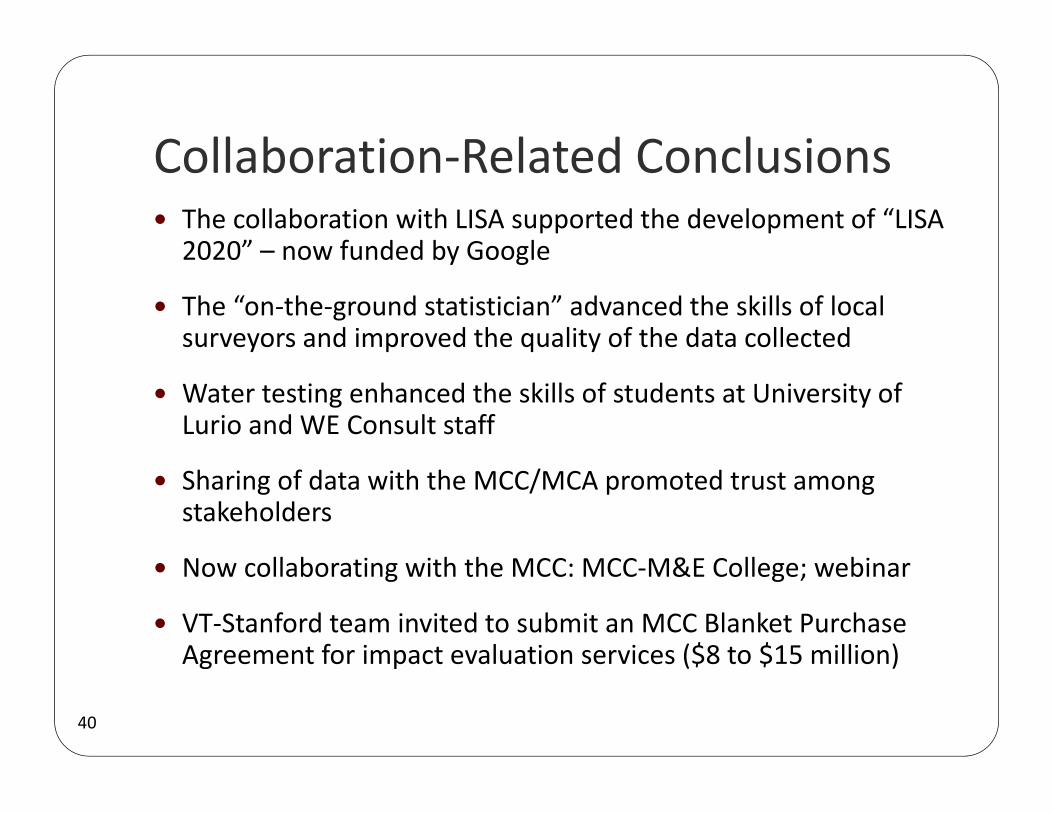
Collaboration‐Related Conclusions
40
The collaboration with LISA supported the development of “LISA 2020” – now funded by Google
The “on‐the‐ground statistician” advanced the skills of local surveyors and improved the quality of the data collected
Water testing enhanced the skills of students at University of Lurio and WE Consult staff
Sharing of data with the MCC/MCA promoted trust among stakeholders
Now collaborating with the MCC: MCC‐M&E College; webinar
VT‐Stanford team invited to submit an MCC Blanket Purchase Agreement for impact evaluation services ($8 to $15 million)
Impact Evaluation Team Co‐Principal Investigators: Dr. Jennifer Davis (Stanford University) Dr. Ralph Hall (Virginia Tech)
Core Team Members: Dr. Eric Vance (Virginia Tech) Dr. Emily Van Houweling (Virginia Tech) Marcos Carzolio (Virginia Tech) Mark Seiss (Virginia Tech) Kory Russel (Stanford University) Wouter Rhebergen (WE Consult)
41
42
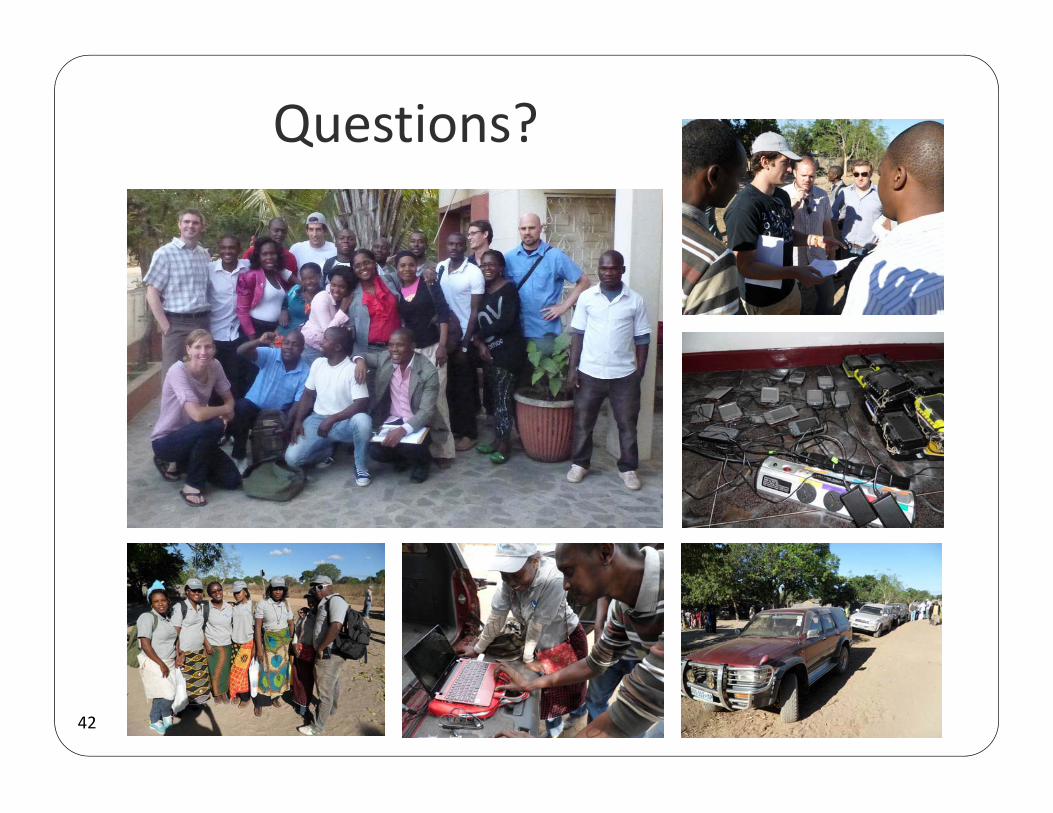
Questions?