Embed Size (px)
Citation preview

August 2014
Impact Evaluation of the Mozambique Rural Water Supply Activity

Acknowledgements
Many people have contributed to this report. First, we would like to thank our in-country partner, WE Consult, for their hard work and leadership during the research design, fieldwork, and data collection stages of this impact evaluation. We also wish to thank the many enumerators who collected the household data and the students and faculty at Universidade Lúrio who supported the water quality testing. Staff at the MCC, MCA, and Cowater made our task much easier by including the evaluation in the program design and sharing background information on the rural water supply program with our team. We would also like to thank Virginia Tech’s Laboratory for Interdisciplinary Statistical Analysis (LISA) for its support throughout all stages of the research. We are very grateful to Jessica Hanff and Nicholas Balacco for all of their work in developing this professional version of the final report. Finally, we would like to thank the reviewers of this report for their constructive feedback and comments that have undoubtedly improved the quality of the work. Any errors in the report are the responsibility of the
authors.

PRePARed BY
Ralph P. Hall (Virginia Tech)Jenna Davis (Stanford University)Emily van Houweling (Virginia Tech)Eric A. Vance (Virginia Tech)Marcos Carzolio (Virginia Tech)Mark Seiss (Virginia Tech)Kory Russel (Stanford University)
Virginia TechSchool of Public and International AffairsBlacksburg, Alexandria and Richmond, VA
August 2014

ABBREVIATIONS
ADPP: Ajuda de Desenvolvimento de Povo para Povo (Development Aid from People to People)
AP Posto Administrativo (Administrative Post)
ASNANI Projecto de Abastecimento de Água e Saneamento de Nampula e Niassa (Integrated Water Supply and Sanitation Project for Niassa and Nampula)
CLTS Community Led Total Sanitation
DPOPH Direcção Provincial das Obras Públicas e Habitação (Provincial Directorate of Public Works and Housing)
FAO Food and Agriculture Organization
FIB Fecal Indicator Bacteria
GIS Geographic Information System
GPS Global Positioning System
HH Household
INE Instituto Nacional de Estatística (National Statistics Institute)
LPCD Liters Per Capita Per Day
LPD Liters Per Day
LU Livestock Unit
MCA Millennium Challenge Account
MCC Millennium Challenge Corporation
MIPAR Manual de Implementação de Projectos de Água Rural (Rural Water Project Implementation Manual)
MPCD Minutes Per Capita Per Day
MPD Minutes Per Day MSF Medicos sem Fronteiras (Doctors without Borders)
OKHALI-HANA Plataforma Provincial da Sociedade Civil de Nampula (Forum of Civil Society in Nampula)
OPHAVELA Associação para o Desenvolvimento Sócio Económico (Association for Socio- Economic Development)
PHAST Participatory Hygiene And Sanitation Transformation
PRONASAR Programa Nacional de Abastecimento de Água e Saneamento Rural (National Rural Water Supply and Sanitation Program)
RWPIP Rural Water Points Installation Program
RWSA Rural Water Supply Activity
SANA Segurança Alimentar através de Nutrição e Agricultura (Food Security through Agriculture and Nutrition)
SCIP Strengthening Communities through Integrated Programing
SSSS Small-Scale Solar System
VT Virginia Polytechnic Institute and State University (or “Virginia Tech”)
WC Water Committee
WHO World Health Organization
OP Water Operator
1 EXECUTIVE SUMMARY
2 INTRODUCTION
3 OVERVIEW OF THE COMPACT AND THE INTERVENTIONS EVALUATED
3.1 MCC ERR and Beneficiary Analysis
4 LITERATURE REVIEW OF THE EVIDENCE
4.1 Time Savings
4.2 Water Quality/Health
5 SUMMARY OF INTERVENTIONS
5.1 Community Selection and Mobilization
5.2 Formation of the Water Committee and PEC
5.3 Drilling Preparation
5.4 Drilling and Civil Works
5.5 Community Handover
5.6 Monitoring and Evaluation
6 EVALUATION DESIGN
6.1 Evaluation Type
6.2 Evaluation Questions
6.3 Methodology / Data Collection
6.4 Sample Frame
6.5 Power Calculations
6.6 Timeframe
7 FINDINGS FROM THE IMPACT EVALUATION
OF THE RWPIP IN NAMPULA
7.1 Context
7.2 Household Water Consumption (LPCD)
7.3 Time Spent Collecting Water
INDEX OF CONTENTS
...................................................................................... 1 ..............................................................................................11 ..........................13 .................................................................15 .......................................................................... 21 ...................................................................................... 27
.............................................................................. 39

7.4 Relationship between Distance and Handpump Use
7.5 Schooling
7.6 Sanitation 7.7 Water Quality
7.8 Health
7.9 Satisfaction/Sense of Ownership
7.10 Income/Expenditure 7.11 Performance of the Handpumps
7.12 Energy
7.13 Analysis of the Sustainability of the Impacts from the RWPIP 7.14 Assumption for the MCC’s ERR Model
8 POLICY IMPLICATIONS
9 NEXT STEPS/FUTURE ANALYSIS
9.1 Dissemination procedures
10 REFERENCES
Appendix A DEVELOPING THE SAMPLE FRAME
Key Decisions That Shaped The Nampula Sample Frame
The Nampula Sample Frame
Appendix B PHASE 1 DIFFERENCE-IN-DIFFERENCES ANALYSES
................................................................................89
........................................................................... 91 ....................................................................................................... 93

1
1. EXECUTIVE SUMMARY
A. Overview of Compact and Interventions Evaluated
In 2007, the Millennium Challenge Corporation (MCC) signed a $506.9 million compact designed to reduce poverty in Mozambique by promoting sustainable economic growth. Among the planned investments was the installation of 600 improved water points in rural communities across the provinces of Nampula and Cabo Delgado. In addition to the installation of the water points, the Rural Water Points Installation Program (RWPIP) also mobilized water committees to maintain the infrastructure and provided trainings to water committees and community members. Most of the water points are boreholes equipped with Afridev handpumps, but in Cabo Delgado ten small-scale solar systems (SSSS) were installed where there was sufficient water supply and unmet demand. The Rural Water Supply Activity (RWSA) of the Mozambique Compact is intended to increase sustainable access to improved water supply in some of the country’s poorest districts.
This report provides the results from an impact evaluation of the Millennium Challenge Account’s (MCA’s) Rural Water Point Implementation Program (RWPIP) in Nampula.
B. Evaluation Type, Questions, Methodology
The objective of the impact evaluation of the MCA’s RWPIP in Nampula is to examine the extent to which the program objectives have been realized. Rigorous impact evaluations should allow causal claims to be made about program interventions and observed changes in outcome indicators, typically by comparing the beneficiaries of the program to a non-beneficiary comparison group.
In order to assess the impacts of the installed handpumps (see Figure 1.1) on households in the RWPIP communities, the research design employed a panel survey in the treatment and comparison groups. Panel surveys are specifically designed to compare changes in treatment communities “before” and “after” an intervention with changes in comparison communities that did not receive the intervention. This design permits a “difference-in-differences” approach to the analysis of data collected, which controls for general trends that affect both treatment and comparison communities (e.g., drought, high crop prices, or other development interventions). To collect the panel data, a baseline survey was undertaken in 2011 and a follow-up survey was undertaken in 2013. In the baseline and follow-up studies, an average of 29 household surveys were

Impact Evaluat Ion of thE mozamb IquE RuRal WatER Supply act Iv I ty 2
completed in each community. Around three quarters (73%) of the households interviewed during the baseline study were surveyed again in the follow-up study.
Due to the constrained timing of the baseline study, the impact evaluation focused on Phase 2 of the RWPIP (Table 1.1). However, data were collected from Phase 1 communities that had received a handpump before the baseline study. The primary reason for including Phase 1 communities was to study the performance of, and benefit streams from, the handpumps at least two years after their installation, which was deemed important by MCC/MCA staff. Including Phase 1 communities also made it possible to include three additional districts, which meant the study was more generalizable to the RWPIP intervention in Nampula. The communities for Phase 3 of the RWPIP had not been identified at the time of the baseline study, so were not purposefully included in the sample.
The following lists provide a summary of the activities that were undertaken during each of the fieldwork expeditions in Nampula. In both the baseline and follow-up studies, two weeks of enumerator training and a pilot study were undertaken prior to the commencement of the fieldwork.
2011 baseline study:
• 1,579 households surveys were completed in 54 communities (27 treatment and 27 comparison);
• 54 water committee or leader interviews were completed; and• Water sampling was undertaken in 11 communities (from 39 community water
sources and 259 household containers).
FIGURE 1.1 MCA Handpump Installed in Nampula

3
2013 follow-up study:
• 1,826 households surveys were completed in 62 communities (32 treatment and 30 comparison);
• 31 water committee or leader interviews were completed;• 17 water point observations were undertaken in 17 communities; • Water sampling was undertaken in 11 communities (from 32 community water
sources and 873 household containers); and• Repeated sampling of water sources in four communities (a total of 412
samples) was undertaken to characterize water quality variability.
C. Findings
The installation of MCA handpumps in communities in Nampula led to significant increases in household access to improved water and reduced the time households spent fetching water from a primary source. Before the installation of the handpumps, virtually all household water came from non-improved sources (e.g., unprotected wells and rivers/lakes). Following the installation of the MCA handpumps, those communities that received a handpump experienced an increase in their median daily water consumption from improved sources (i.e., the handpump) of 15.1 liters per capita per day (LPCD) (p<0.001). More than three quarters (78%) of households surveyed in the treatment communities reported using a handpump. Similarly, nearly three quarters (74%) of total residential water consumption in the treatment communities came from an improved water source. The most common reasons cited for not using the handpump were that
Table 1.1: Final Sample Frame
Community Classification
Number of Communities
in Group
Number of Communities
by DistrictComments Relating to the Analysis of the Data
Phase 1
Treatment 104 Meconta3 Mogovolas3 Rapale
Since the treatment communities had received a handpump before the baseline study, the data collected from the Phase 1 treatment and comparison communities are used to evaluate the sustainability of impacts over time.Comparison 6
2 Meconta1 Mogovolas3 Rapale
Phase 2
Treatment 15
8 Mogincual3 Murrupula2 Mogovolas2 Moma
Since the handpumps were installed in the treatment communities after the baseline study, the data from the treatment and comparison communities are used to evaluate the ‘impacts’ from the RWPIP using a difference-in-differences evaluation methodology. Comparison 23
4 Mogincual8 Murrupula1 Mogovolas10 Moma

Impact Evaluat Ion of thE mozamb IquE RuRal WatER Supply act Iv I ty 4
it was too far away or too expensive. An analysis of handpump use and the distance of a household from the handpump revealed that the distance from a respondent’s home at which the probability of using a handpump drops below 0.5 is 1.2 km.1
Following the installation of the MCA handpumps, the total time households spent collecting 20 liters of water fell by 55 minutes (p<0.01). Time savings were used primarily for domestic activities, resting, family activities/child care, and farming. Girls and boys aged 12-17 and women aged 18 and above were found to be primarily responsible for collecting water, regardless of whether a community received a handpump or not. When considering the impact of water fetching on perceptions of school attendance, the installation of the MCA handpumps can be associated with a 17.5% reduction in the mean percentage of households stating that water fetching interferes with children’s schooling (p<0.01).
There was a consistent and high level of reported community sense of ownership for the MCA RWPIP project. Eighty-eight percent of households in communities receiving an MCA handpump stated that the community owned the project. Further, following the installation of MCA handpumps, 79% of households stated they were satisfied with their water supply situation, compared with 22% prior to installation – an increase of 57% (p<0.001).
With regard to health-related impacts, the installation of the MCA handpumps was associated with a 9% and 2% reduction in the percentage of children under the age of 5 with reported respiratory and gastrointestinal illness, respectively; however, these decreases were not statistically significant at the 0.05 level. Water quality testing revealed that the handpumps were providing a high level of water quality at the point of collection. At the household level, however, almost half of the samples of stored drinking water that were collected from handpumps had levels of fecal indicator bacteria (FIB) considered to be unsafe. It may thus be that inadequate hygiene and water management practices obviated these households’ gains in water quality at the point of collection, resulting in the limited observed impacts on child respiratory and gastrointestinal illness. It may also be that the pathogens causing these illnesses among sample households are transmitted via exposure pathways other than or in addition to ingestion in water (e.g., hand-to-mouth contact or through food). Small marginal increases (relative to comparison communities) in the share of households using traditional pit latrines and the median number of handwashing events in the day prior to interview were observed in communities that received MCA handpumps, but none of these differences in sanitation or hygiene behaviors were statistically significant. Two thirds of households in treatment communities reported that they practice open defecation at the time of the follow-up study. Taken together, these findings suggest that considerable fecal contamination still exists in the household and community environment, with concomitant risks for illnesses transmitted via the fecal-oral exposure route.
1 Note: The sample frame disproportionately measured households within 500 m of the handpump.

5
The analysis found no relationship between the installation of the MCA handpumps and changes in self-reported levels of monthly income or expenditure. Between the baseline and follow-up study, both treatment and comparison communities experienced a comparable increase in both income and expenditure.
Finally, the MCA handpumps were found to have a high level of technical performance, with water committees demonstrating an ability to repair minor breakdowns successfully. However, water committee members felt they needed more training and that they should be financially compensated for their work. They also expressed concern about insufficient revenues, access to spare parts, and technical capacity for larger repairs. Only 6% of water committees said that they believe their handpump will still be functioning in 10 years.
The text below outlines the research questions pursued in this investigation, and provides additional details on the main findings from the impact evaluation of the MCA’s RWPIP.
• How does the installation of handpumps through the mcA RwPIP affect the total amount of water from all sources used by households?The installation of the MCA handpumps is associated with a statistically insignificant increase of 2.5 LPCD in median water consumption from all sources (p<0.1). When considering total median household water consumption from all sources, the installation of the MCA handpumps is associated with a statistically significant increase of 18.2 liters per day (p<0.01).
• How does the installation of handpumps through the mcA RwPIP affect the total amount of water from improved sources used by households?Prior to the installation of the MCA handpumps, the typical household did not collect any water from an improved source (using the UN-WHO Joint Monitoring Program definitions). Following the installation of the MCA handpumps, those communities that received a handpump experienced a statistically significant increase in their median daily water consumption from improved sources of 15.1 LPCD (p<0.001). When considering the total median household consumption of improved water, the installation of the MCA handpumps is associated with a statistically significant increase of 58.0 liters per day (p<0.001). Thus, in the communities that received an MCA handpump, 3 out of every 4 buckets of water collected came from an improved source.
• How is the volume of water collected by males, females, adults, and children in the household affected by the installation of the mcA handpumps?Girls and boys aged 12-17 and women aged 18 and above are primarily responsible for collecting water from the MCA handpumps. These same groups are also responsible for collecting water in communities that did not receive an MCA handpump. In the communities that received an MCA handpump, each of these three

Impact Evaluat Ion of thE mozamb IquE RuRal WatER Supply act Iv I ty 6
groups of water fetchers experienced an increase – ranging between 9% (3.6 liters) to 33% (10 liters) in the volume of water collected from all sources, with the largest increase being experienced by girls aged 12-17.
• How does the installation of handpumps through the mcA RwPIP affect the time costs of water collection?Following the installation of the MCA handpumps there was an 88-minute decline in the time households spent collecting water from all sources, but this decline was statistically insignificant. A more refined analysis revealed that the installation of the MCA handpumps can be associated with a statistically significant 62-minute reduction in the median roundtrip time to the ‘primary’ source (p<0.05). Further, the impact was found to be greater during the dry season, when households experienced a statistically significant 129-minute decline in the median roundtrip time (p<0.05).
An analysis of the wait time at the primary source revealed a statistically significant decline of 41 minutes when comparing the treatment and comparison communities (p<0.05). Again, the impact was more pronounced during the dry season, when the wait time at the primary source declined by 57 minutes (p<0.01).
When considering the median time costs of collecting 20 liters of water, a statistically significant decline of 42 minutes was observed in communities that received a handpump (p<0.05). Thus, while there was no statistically significant change in the total amount of time spent collecting water, there was a significant reduction in the time spent collecting each 20 liters of water. This finding implies that following the installation of the MCA handpumps, households were able to collect more water in less time (although the time savings were not statistically significant).
• How are the time costs of water collection distributed across males, females, adults, and children in the household?The installation of the MCA handpumps can be associated with a 30% (37-minute) reduction in the total median time females spent collecting water each day. These time savings were realized by females aged 12 and above. While the median time adult males spent collecting water remained at zero following the installation of the MCA handpump, boys aged 12-17 did experience a 45% (73-minute) reduction in the median time spent collecting water.
By comparing the time and water volume data by demographic groups, the installation of the MCA handpumps can be associated with an increase in the quantity of water collected by girls and boys aged 12-17 and women aged 18 and above, but a decline in the time these groups spend collecting water.
• How does the use of alternative indicators of distance affect the estimated time cost of water fetching?

7
The time cost of water fetching was estimated using walk and queue time values as reported by survey respondents. This is common practice in the water supply literature. We explored the effect of using alternative approaches to estimating time costs that are increasingly possible because of the availability of satellite imagery. For example, using satellite imagery it was possible to estimate both route and straight-line (Euclidean) distances between 1,103 sample households in the baseline study and their primary water source. We assumed that route distance is the most valid indicator of the time cost of water fetching and compared those values to both self-reported data and straight-line estimates. We found that straight-line distance is a good proxy for route distance (R2 = 0.98), although it under-estimates route distance by 22% on average. By contrast, self-reported travel time is a poor proxy for route distance (R2 = 0.12), with no systematic bias (over- or under-estimation) observed in the data. Using these two indicators also leads to considerable differences in estimated time costs of water fetching. For example, the average one-way travel time to the primary water point was found to be 48.5 min (SD = 53.2 min) using self-reported data, as compared to 14.8 min (SD = 15.8 min) when calculated from route distance with walking paces found in the literature. In future evaluations it may be useful to devote additional effort and resources toward testing alternative time-cost indicators against field-based observations (e.g., timing of respondents after collecting self-reported walk and queue time values).
• what is the relationship between the distance a household is located from a handpump and the probability that the household uses the handpump?As distance to the nearest handpump increases, the probability that a household will use the handpump decreases. The distance at which the probability of using a handpump drops below 0.5 is 1.2 km. In addition, consumption of water from an improved source was found to drop 1 LPCD for every 100 m increase in the distance from a household to its nearest handpump.
• How does the installation of handpumps through the mcA RwPIP affect school attendance for girls and boys?The installation of the MCA handpumps is associated with a statistically significant 17.5% reduction in the mean percentage of households stating that water fetching negatively affects the school attendance of their children (p<0.01). To put this in perspective, for a group of 100 households in treatment communities (which had an average of 154 school age children), the introduction of an MCA handpump corresponds to 27 fewer children whose school attendance is negatively affected by water fetching.

Impact Evaluat Ion of thE mozamb IquE RuRal WatER Supply act Iv I ty 8
• How does the installation of handpumps through the mcA RwPIP affect sanitation and hygiene practices?The MCA intervention is associated with a 7.5% increase in the average number of households reporting that they use a traditional pit latrine, but this finding is not statistically significant (p<0.1). Similarly, the MCA intervention is associated with a statistically insignificant 0.1 increase in the median number of times the respondents reported washing their hands.
• How does the installation of handpumps through the mcA RwPIP affect the microbiological quality of water supplies being used by households? Microbiological quality of samples collected at water sources and from water storage containers in sample households was evaluated by testing for fecal indicator bacteria (FIB). Drinking water quality standards in Mozambique are based on World Health Organization (WHO) guidelines, and specify that water for human consumption should have no detectable FIB in a 100-mL sample (MISAU, 2004). Our analysis makes use of previously published WHO guidelines for water supply in rural settings and assumes that water with up to 10 colony forming units (CFU) of E. coli per 100-mL sample poses “low” health risk; concentrations of 11-100 CFU/100mL carry “moderate” risk; and water with E. coli concentrations greater than 100 CFU/100mL is “high” risk. For vulnerable groups (e.g., young children, elderly, and immunocompromised persons), even low levels of contamination are considered risky. Overall, FIB concentration was found to be significantly lower in water samples collected from MCA handpumps as compared to other types of water sources. None of the handpump samples had a high level of contamination, as compared to 39% of traditional wells and 71% of surface sources. Similarly, the quality of stored household drinking water that was obtained from an MCA handpump was significantly better than stored water obtained from traditional sources. The typical handpump sample had a low level of contamination (8.4 CFU/100mL) while the typical sample from other sources had 43 CFU/100mL. Because not all households in treatment communities obtain drinking water from MCA handpumps, however, no significant difference in the quality of stored drinking water was found at the community level between treatment and comparison communities.
• How does the installation of handpumps through the mcA RwPIP affect the 7-day prevalence of gastrointestinal and respiratory illness?The installation of the MCA handpumps is associated with a statistically insignificant 9% reduction in the average percentage of children under the age of five with reported symptoms of respiratory illness, and a statistically insignificant 2% reduction in children with reported symptoms of gastrointestinal illness, in the week prior to interview.

9
• to what extent do community members express a sense of ownership for the infrastructure installed by the mcA RwPIP?There is a consistent and high level of reported community sense of ownership for the MCA RWPIP project. Eighty-eight percent of households in communities that received an MCA handpump stated the community owned the project. Further, following the installation of the handpump, reported community sense of ownership significantly increased for the land on which the handpump was located (p<0.05) as well as for the water source itself (p<0.001), indicating that communities also felt they owned the physical infrastructure.
• to what extent do community members express a greater satisfaction with their water supply situation following the installation of the mcA handpump?The mean percentage of households in communities that received an MCA handpump reporting that they are satisfied with their water supply situation increased significantly from 22% to 79% from baseline to follow-up (p<0.001). In comparison, the mean percentage of households in communities that did not receive an MCA handpump experienced a statistically insignificant decline in their level of reported satisfaction from 31% to 26%. These results indicate that the installation of the MCA handpumps is associated with a significant improvement in the general satisfaction of households with their water supply situation (p<0.001).
• How does the installation of handpumps through the mcA RwPIP affect household income, expenditures, and dietary consumption? The installation of the MCA handpumps was not found to have any statistically significant impact on the self-reported levels of monthly income or expenditure. Between the baseline and follow-up study, both treatment and comparison communities experienced a comparable increase in both income and expenditure. Similar conclusions were reached with respect to the frequency of meat and fish consumption, as well as household engagement in agriculture. Households in both treatment and comparison communities experienced a statistically significant increase in the consumption of meat and fish (p<0.001) and in the percentage of households engaged in agriculture (p<0.05). An analysis of livestock units and the income earned from selling agricultural products revealed statistically insignificant changes in activity from the baseline to follow-up study in both treatment and comparison communities. In summary, incomes and expenditures in all communities increased along with household engagement in agriculture and consumption of meat and fish, pointing to a general trend of economic development in Nampula (or a productive farming season).
• How well are the handpumps installed by the mcA RwPIP performing from a technical, management, and financial perspective, and what are the prospects for long-term sustainability?Overall the handpumps are functioning well from a technical perspective. Only

Impact Evaluat Ion of thE mozamb IquE RuRal WatER Supply act Iv I ty 10
one handpump was not working at the time of the follow-up study, and water committees had successfully repaired other minor breakdowns on their own. Water committees were also functioning at a high level, with an average of 11 members regularly supporting the operation and maintenance of the handpump. However, water committee members felt they needed more training and should be financially compensated for their work. In terms of finances, the revenues generated so far from tariffs appear to support the regular operation and maintenance of the handpumps. However, there is considerable variation between systems, and less certainty about how large repairs will be paid for in the future.
Water committee perceptions about the future sustainability of the handpumps are concerning. Only 6% of water committees reported that they believe their handpump will be functioning in 10 years. Key sustainability issues identified by the water committees are the lack of sufficient revenues, access to spare parts, and technical capacity for larger repairs.
With regards to the sustainability of the impacts from the installed handpumps over time, difference-in-differences analyses between Phase 1 treatment and comparison communities from baseline to follow-up showed no statistically significant (at the 0.05 level) changes in 15 key variables of interest. This indicates that the various impacts observed due to the installation of the handpumps have been sustained for at least two years.
D. Next Steps/Future Analysis
The Stanford-VT team intends to develop a series of academic papers based on this research that will present an in-depth look at several specific research questions outlined at the end of the report. In addition, the team welcomes collaboration with the MCC and other interested parties to help answer research questions of specific interest through the careful analysis and interpretation of the collected data.

11
2. INTRODUCTION
The Millennium Challenge Corporation (MCC) is a Federal Corporation created under Title VI of the Foreign Operations, Export Financing, and Related Programs Appropriations Act, 2004. It is tasked with managing and implementing the Millennium Challenge Act, which Congress approved to provide United States assistance for global development. The key tenets of this assistance are the promotion of economic growth and elimination of extreme poverty.
MCC’s mandate is to rigorously evaluate the projects it funds to assess its investment impact and contribute to the development literature for knowledge dissemination. MCC is committed to using impact evaluation resources where they will provide the most useful lessons. Governments and organizations often design and fund projects where the link between the activity and poverty reduction is anecdotal. In these cases, rigorous impact evaluations can help establish, or refute, the links between costly investments and stated benefits. Also, MCC often funds similar projects in several countries and is interested in evaluating the effectiveness of these projects in different contexts. In some circumstances, governments may expand programs following the MCC investment based on results from impact evaluations. In all of these scenarios, impact evaluations should provide lessons that will help in focusing limited funds where they can address development priorities most effectively.
In 2007, the MCC signed a $506.9 million compact designed to reduce poverty in Mozambique by promoting sustainable economic growth. Among the planned investments was the installation of 600 improved water points in rural communities across the provinces of Nampula and Cabo Delgado. Most of the water points are boreholes equipped with Afridev handpumps, but in Cabo Delgado ten small-scale solar systems (SSSS) were installed where there was sufficient water supply and unmet demand. The Rural Water Supply Activity (RWSA) of the Mozambique Compact is intended to increase sustainable access to improved water supply in some of the country’s poorest districts.
Stanford University and Virginia Tech (Stanford-VT) collaborated with the MCC on an impact evaluation of the handpumps installed in the province of Nampula. This report provides an overview of the research design for this evaluation along with a detailed discussion of the findings.

Impact Evaluat Ion of thE mozamb IquE RuRal WatER Supply act Iv I ty 12

13
3. OVERVIEW OF THE COMPACT AND THE INTERVENTIONS EVALUATED
The Mozambique Compact includes activities that focus on water and sanitation ($231 million), roads ($176 million), land tenure ($39 million), and farmer income ($17 million). The water and sanitation activity covers four areas: technical assistance and capacity building; rehabilitation/expansion of water supply systems in urban areas; rehabilitation/expansion of two municipal sanitation and drainage systems; and the construction/rehabilitation of 600 water supply points (boreholes fitted with Afridev handpumps) in rural communities.2 The evaluation described in this report focuses on the latter activity – known generally as the Rural Water Supply Activity (RWSA) or the Millennium Challenge Account’s (MCA’s) Rural Water Point Installation Program (RWPIP) – that had an original budget of $9 million. In addition to the installation of handpumps, the MCA leveraged available funds in their RWPIP to upgrade the handpumps installed in ten communities in Cabo Delgado to small-scale solar systems (SSSS). Section 5 provides more information on the components included in, and implementation of, the MCA’s RWPIP in Nampula.
The objectives of the RWSA, as stated in the Compact, are to increase beneficiary productivity and income by:
1. Providing time savings by reducing the time burden of water collection. Time savings from an improved water supply will increase beneficiary productivity and incomes.
2. Reducing water-related illnesses (diarrhea, dysentery, etc.). Health improvements resulting from an improved water supply will increase beneficiary productivity and incomes.
The MCC estimated that the RWSA would impact 300,000 people based on the assumption that each installed handpump would benefit 500 people. By increasing access to improved water, the expectation was that the incidence of diarrhea would decline and women and children, in particular, would spend less time collecting water. Other secondary impacts include improved opportunities for children (especially girls) to attend school and for women to use any time freed from water collection to engage in productive activities.
2 In addition, four deep boreholes were developed in Nangade, Cabo Delgado, and handed over to the district government for possible mechanization by other actors. Given the depths of these boreholes, an Afridev handpump could not be installed.

Impact Evaluat Ion of thE mozamb IquE RuRal WatER Supply act Iv I ty 14
3.1 MCC ERR AND BENEFICIARY ANALYSIS
The primary development objective of the MCC is to promote economic growth. In order for a project to qualify for the MCC Compact it needs to attain a certain economic rate of return (ERR). Each project is individually assessed and a combined ERR is also calculated for the Compact as a whole.
All projects within MCC Compacts are required to meet a 20 year ERR of at least 10%. The initial ERR of the RWPIP was estimated at 18% (MCC 2007); in other words, the economic benefit stream from the RWPIP was found to equal the costs of the project when using an 18% discount rate. This initial ERR was calculated by estimating benefits in the following areas:
• Health benefits achieved through the reduction in diarrhea and other water related diseases. The health benefits stem from:
* Savings to households with reductions in the use of medical care;* Income from productive activities to households through the reduction of
adult sick days;* Income from productive activities to households through the reduction of
child care days; and* Added output over a lifetime through reductions in mortality.
• Time savings to households (primarily women) who spend less time fetching water and use that time productively (i.e., the opportunity cost of fetching water) (MCA-Mozambique, 2009, p. 9)
Section 7.14 provides summary of key assumptions based on the findings from the RWPIP impact evaluation that could be included in future ERR models.

15
4. LITERATURE REVIEW OF THE EVIDENCE
4.1 TIME SAVINGS
The effect of installing improved water infrastructure on the time costs of supply within rural communities depends critically on the ex-ante conditions, the nature of the intervention, and the extent to which households make use of new versus existing water sources.3 Average travel time could be reduced if an improved water point is sited nearer to users’ homes than the sources previously used; however, this time savings could be offset by an increased number of trips to the source per day (Churchill, 1987) and/or if households continue to use existing sources in addition to new improved options (Crow, Swallow and Asamba, 2012). Average queue time could decrease or increase depending on the relative level of congestion at new versus existing sources. The net effect on the time costs of supply is thus shaped by local context, which helps to explain why most published literature discussing the time costs of water fetching is descriptive, i.e., quantifying the amount of time devoted to this task in different locations and by different sub-groups (see Sorenson et al., 2011, for example). It also stands to reason that the published empirical evidence regarding time-related impacts of rural water supply investment is limited and reflects highly variable outcomes.
Along with the uncertainty regarding the amount of travel and queue time saved by rural water infrastructure improvements, debate exists about what value should be assigned to saved time within cost-benefit analyses. It has often been assumed that such time savings will largely accrue to women; different rules of thumb have been used to value their time, typically as some fraction of the prevailing unskilled wage rate (Whittington et al., 2008; Kulindwa, 2008). Applied research beginning in the 1980s has helped to provide empirical evidence on the value of time for cost-benefit analysis. This work takes on two principal forms: examining the uses to which saved time is (or could be) put (i.e., whether it is allocated to productive activities or not), and (much less common) calculating the monetary value of time to water fetchers based on the choices they are observed to make.
Some early work on the use of saved time is based largely on cross-sectional comparisons between communities with differing time costs of water fetching. Cairncross and Cliff (1987), for example, compared the daily time allocations for women in one Mozambican village that had a centrally-located water source to
3 The discussion in this section refers to rural water supply investments that entail installation of shared community water points. If a water infrastructure intervention includes the provision of on-plot water supplies, many of the uncertainties described in this section would be substantially reduced or eliminated.

Impact Evaluat Ion of thE mozamb IquE RuRal WatER Supply act Iv I ty 16
those in a second village who relied on a distant source. The mean difference in time allocated to water fetching per day between women in the two villages was 106 minutes. Women using the centrally-located water source allocated roughly half of this time to domestic chores (e.g., cleaning and grinding grain), and roughly half to leisure. Very little time was allocated to agricultural production or other economic activities, although the authors acknowledge that the timing of their investigation during the dry season may have shaped this result. Similar findings regarding the re-allocation of time from water fetching to other domestic responsibilities, rest, and socialization were documented by Carruthers (1973) in Kenya and Ilahi and Grimard (2000) in Pakistan. More recently, Crow et al. (2012) found very little difference in the allocation of time among daily activity categories for women in communities with traditional (unimproved) water sources versus those with improved, but communal sources (specifically, protected springs).
A related set of studies use empirical data to establish the status quo situation regarding time costs of water fetching, and then estimate the hypothetical benefits of reducing those costs given particular assumptions about the use of saved time. James et al. (2002), for example, estimated that the reduction of daily fetching from the observed 2.8 hours to one hour per day among 10 villages in rural India would generate incremental income of Rs. 750 - 5,500 per household per year, assuming that the saved time was devoted to entrepreneurial activities being promoted by an NGO in those communities. These benefits are substantial, representing the equivalent of 19 - 137 days of wage labor at the then-prevailing wage rate. At the same time, given that the sample villages had recently benefitted from the installation of new borewells with handpumps, it seems unlikely that the dramatic reduction in time costs of water supply needed to realize these benefits would be realized in the foreseeable future.
More recent research into the time savings associated with rural water supply investments includes longitudinal designs with pre- and post- intervention collection of data from sample households. Arku (2010), for example, documented dramatic reductions in the mean daily time allocated to water fetching that resulted from the Volta Rural Water Supply Project (VRWSP) in Ghana. Before the installation of improved water points, women in the sample communities spent an average of 6 hours, 15 minutes collecting water each day, whereas men spent an average of 34 minutes. Post intervention, daily time costs fell to 64 and 11 minutes for women and men, respectively. Among women, on average roughly 20% of saved time was allocated to religious activities, and almost 30% was allocated to socialization and leisure. In contrast to the earlier findings noted above, almost 40% of women’s saved time was re-allocated to petty trading and farming. Taken together, these results underscore the fact that the impact on time usage of any particular rural water project will be shaped by opportunities for water fetchers to engage in wage labor, small-scale production, petty trade, or other economic activities.
Over the past decade, practitioners and applied researchers have increasingly

17
advocated the design of rural and peri-urban water systems to support both domestic needs as well as livelihoods. They note that rural households need time, but also ample supplies of water and other types of support (infrastructural, financial, etc.) in order to transform improved water supplies into income. In Senegal, for example, facilities such as cattle troughs and community garden plots were constructed along with small piped systems so as to facilitate income-generating activities. Van Houweling et al. (2012) found that these investments enabled women to initiate new activities and expand existing livelihood activities such as small commerce, raising livestock, and gardening. The broader “multiple use” (or MUS) water system literature advocates this livelihoods approach to designing water interventions as a way of enhancing the net benefits of such investments, and making their distribution across genders more equitable (van Koppen et al., 2009; Van Houweling et al., 2012; Hall, Van Houweling and Van Koppen, 2013). Notably, a critical review of the MUS literature by Winrock International (Renwick et al., 2007) concluded that shared point sources (e.g., borewells or shallow wells with handpumps, dispersed standpipes) that do not include “add-ons” such as those implemented in the Senegal case above, have very little potential to support income generating activities. The authors conclude that maximizing net benefits from rural water supply investments requires a shift toward an “intermediate” service level that focuses on piped systems and substantial reductions in the distance between households and their water points. “A particularly promising option is low-cost piped, gravity-fed spring systems,” the authors note.
It is also important to note that increased leisure time can have ancillary economic value for households, although published literature on this topic is scant. For example, it is reasonable to expect that women who have young children would spend a substantial share of their rest and leisure time with those children. Some research suggests a positive association between the amount of time that mothers spend on childcare and their children’s health and cognitive development (e.g., Lindskog and Lundqvist, 1989). Pickering and Davis (2012) found a strong positive association between one-way walk time to a household’s water source and the probability of a young child in the household experiencing fever, diarrhea, or respiratory illness. The authors acknowledge that their study does not identify the causal mechanism(s) that underlie this association, but note that increased time available for child care is a plausible explanation. In addition, leisure time in itself has been shown to confer economic value to households, at least in higher income countries. For example, in a review of studies carried out in North America, Boardman et al. (1996) found that North Americans valued leisure at a median of almost 40% their wage rate.
Whereas research on the value of leisure time in sub-Saharan Africa is exceedingly limited, Whittington et al. (1990) published a unique study that calculated the monetary value of time spent collecting water in rural Kenya. The authors imputed the value of time from observed choices among available water sources: water vendors, with negligible time but high monetary costs; water kiosks, with moderate

Impact Evaluat Ion of thE mozamb IquE RuRal WatER Supply act Iv I ty 18
time and monetary costs; and open wells, with high time but low monetary costs. The authors found that a typical household valued the time they allocated to water fetching at a rate that was very close to the household’s actual wage rate. As with the Arku (2010) study, Whittington et al. (1990) note that their findings are shaped by the relatively greater economic opportuities for low- and semi-skilled workers in the Ukundu region. In rural India, Asthana (1997) similarly used data on observed water source choices to conclude that households in his sample valued time lost to fetching at slightly less than half the prevailing wage rate.
In sum, existing literature suggests that the benefits associated with time savings from water infrastructure improvements are likely to be highest where usage rates for the new water point(s) are high, the time cost differential between existing and new water point(s) is high, and market conditions create ample opportunities to convert fetching time savings into income.
4.2 WATER QUALITY/HEALTH
It is perhaps surprising that, relative to amount of investment in rural water infrastructure made by developing country governments and international development institutions over the past four decades, little rigorous research has been published about the health impacts of rural water supply improvements. What peer-reviewed literature that does exist has rarely, and only recently, featured randomized controlled trial designs, widely considered to be the “gold standard” for drawing causal inference. As a result, the “received wisdom” regarding the likelihood and magnitude of health gains associated with traditional rural water supply interventions has evolved considerably in the past decade.
Early work on the health effects of rural water supply improvements was based (as with the effects on time savings described in Section 4.1) on comparisons of diarrheal disease incidence or prevalence between communities with different types of water supply infrastructure. The potential for confounding, as well as the difficulty in establishing the direction of cause-effect relationships, in cross-sectional study designs is well known. It is also difficult to compare results from studies of rural water supply improvements in particular, because such interventions can result in any combination of the following possible health-related changes: higher quality water at the point of collection; higher quality water at the point of use/consumption; increased volumes of water collected/used per capita per unit time; reduced physical burden of water fetching; and reduced time costs of water fetching (saved time can be used for personal and/or child care). Given that the pathogens which cause diarrheal illness can be transmitted through a variety of pathways (ingestion of water, hand-to-mouth contact, food consumption), a given intervention may reduce exposure within one pathway but leave others unaffected (White, Bradley and White, 1972).
These limitations acknowledged, early studies did find some evidence that rural water infrastructure improvements reduced rates of diarrhea among children

19
(Blum and Feacham, 1983; Esrey et al., 1991; Esrey and Habicht, 1986; Esrey, Feachem and Hughes, 1985; Rosen and Vincent, 1999). The magnitude of effect varied widely, but was generally in the range of 20-30% reduction. Esrey was one of the first researchers to posit that the effect of water supply improvements are moderated by contextual factors, particularly the state of sanitation services in the household and community. Specifically, Esrey (1996) postulated that sanitation improvements are consistently associated with reductions in diarrheal disease, regardless of water supply service type, whereas water supply improvements are only associated with health gains in communities with improved sanitation. As discussed below, this claim is consistent with the notion that contamination of stored water collected from an improved source may be more likely in environments with widespread fecal pollution.
More recently, several influential reviews and meta-analyses have been published that challenge the claim of substantial health effects from the installation of shared water points in rural areas. Zwane and Kremer (2007), for example, conclude that “there is little evidence that providing community-level rural water infrastructure substantially reduces diarrheal disease.” The small number of studies reviewed by Fewtrell et al. (2005) that focus exclusively on installation or improvement of shared water points all find no or a very small reduction in relative risk of diarrheal illness among children (Gasana et al., 2002; Jensen et al., 2003; Tonglet et al., 1992). The conclusions of these papers are consistent with those from a small number of relatively recent, randomized controlled trials of water supply improvements in rural areas. For example, in western Kenya, Kremer et al. (2006) found that spring protection substantially improved the quality of water at the point of collection, but had no significant impact on child diarrhea incidence among their sample of 1200 households in 175 communities.
There are several reasons why installation of improved, shared water points in rural communities may not confer reductions in diarrheal illness. First, whereas the quality of water at the point of collection is typically high, contamination by fetching containers, dipping cups, and hands can quickly lead to a deterioration of quality in the home. Wright et al. (2004) demonstrated that there is limited association between the quality of source and stored water within households using shared water points located at some distance from their homes. Levy et al. (2008) and Harris et al. (2013) provide further evidence for the re-contamination theory with detailed “follow the water” studies in Ecuador and Tanzania, respectively. The risk of post-collection contamination of water would seem to be greatest in communities with low levels of access to improved sanitation services, where fecal pollution is widespread on surfaces and in soils (Pickering et al., 2012).
Second, it may be that the greatest share of the diarrheal disease burden in a given community is caused by pathogens transmitted along non-waterborne pathways. Cairncross (2003), for example, has noted that reductions in diarrhea following handwashing interventions are larger and more consistent than those associated with water source or quality improvements. These findings suggest that

Impact Evaluat Ion of thE mozamb IquE RuRal WatER Supply act Iv I ty 20
incidental ingestion of pathogens transmitted by hands, surfaces, and/or food may be responsible for a greater share of diarrheal illness as compared to ingestion of waterborne microbes. In such settings, increasing the volume of water obtained by a household each day, along with encouragements for correct and consistent handwashing, would likely have a greater impact on health than improving the quality of water at source.
Third, it is commonly reported that households in communities where improved water points are installed continue to use traditional sources to meet at least some of their water needs. To the extent that these other sources deliver unsafe water, and that their use by households results in continued exposure, health gains from the provision of higher quality drinking water may be negated.
Finally, it is worth reiterating that virtually all published research on the health effects of rural water supply improvements focus on a very limited set of health indicators: incidence or prevalence of, and mortality resulting from, diarrheal diseases in children under the age of five. There are good reasons for focusing on this sub-population and these particular measures. Not only are children more vulnerable to diarrheal pathogens, but the impacts of infection in children are typically more severe and long-term.
At the same time, diarrhea is notoriously difficult to measure. Moreover, rates of acute infectious diarrhea in young children is but one of many potential health-related impacts of water supply improvements in rural areas. For example, an opinion piece by Humphrey (2009) has posited that, in environments with high levels of fecal contamination, children may suffer from sub-clinical gastrointestinal illness that does not manifest as acute diarrheal episodes but nevertheless has important effects on growth and development. This environmental enteropathy hypothesis has garnered substantial attention in the WASH sector, with several research groups currently engaged in field investigations on the topic. A positive association between diarrhea in under-2 children and cognitive performance later in childhood has been repeatedly documented (Guerrant, Lima and Davidson, 1992; Berkman et al., 2002; Niehaus et al., 2002); although, the endogenous relationship between diarrheal illness and nutrition makes causal inference challenging. Other health-related effects of rural water supply improvements that have been afforded limited attention in the literature include musculoskeletal injury (Jäger et al., 1997; Geere, Hunter and Jagals, 2010) and physical assault (Sorenson et al., 2011). Future work that employs a broader range of health indicators would allow a more complete picture of the health benefits of water supply investments to be obtained.
21
5.SUMMARY OF INTERVENTIONS
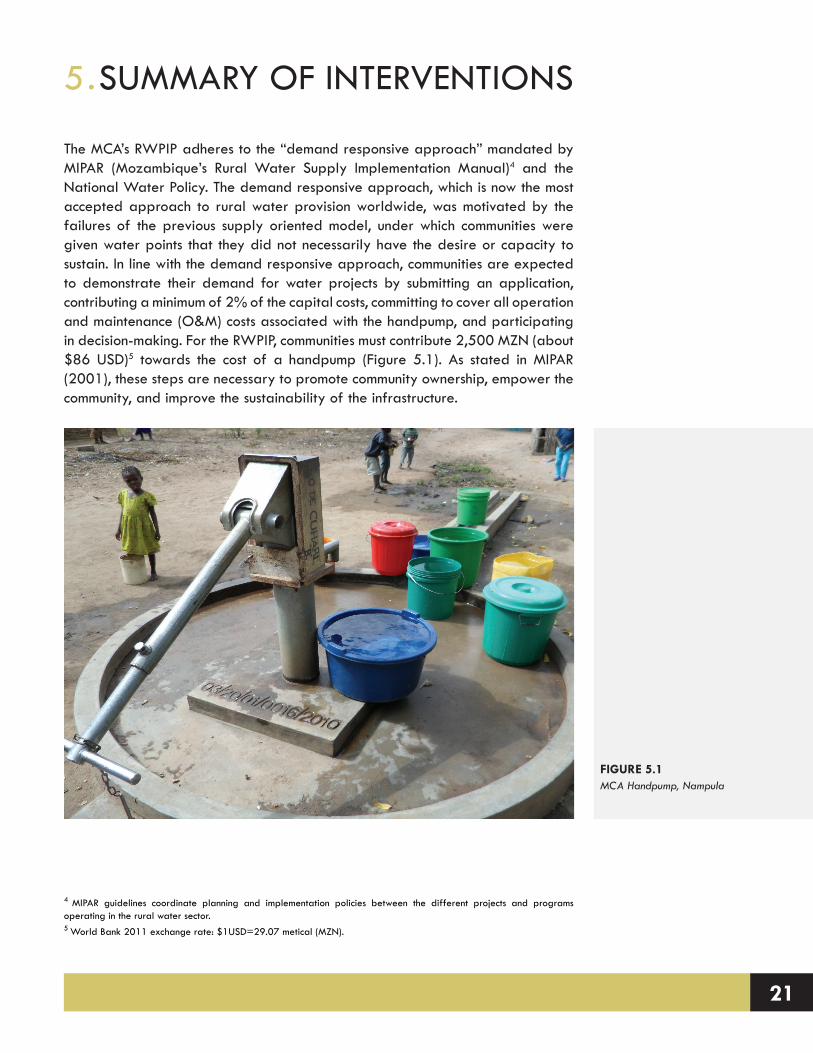
The MCA’s RWPIP adheres to the “demand responsive approach” mandated by MIPAR (Mozambique’s Rural Water Supply Implementation Manual)4 and the National Water Policy. The demand responsive approach, which is now the most accepted approach to rural water provision worldwide, was motivated by the failures of the previous supply oriented model, under which communities were given water points that they did not necessarily have the desire or capacity to sustain. In line with the demand responsive approach, communities are expected to demonstrate their demand for water projects by submitting an application, contributing a minimum of 2% of the capital costs, committing to cover all operation and maintenance (O&M) costs associated with the handpump, and participating in decision-making. For the RWPIP, communities must contribute 2,500 MZN (about $86 USD)5 towards the cost of a handpump (Figure 5.1). As stated in MIPAR (2001), these steps are necessary to promote community ownership, empower the community, and improve the sustainability of the infrastructure.
4 MIPAR guidelines coordinate planning and implementation policies between the different projects and programs operating in the rural water sector. 5 World Bank 2011 exchange rate: $1USD=29.07 metical (MZN).
FIGURE 5.1 MCA Handpump, Nampula

Impact Evaluat Ion of thE mozamb IquE RuRal WatER Supply act Iv I ty 22
5.1 COMMUNITY SELECTION AND MOBILIZATION
The selection of communities for the MCA’s RWPIP took place at the district level with the collaboration of local leaders. Upon receipt of a list of priority communities from district offices, Cowater, the contractor hired by the MCA to implement the RWPIP, sent an animator to meet with each of the communities. The animators explained the nature and approach of the project and assessed the interest of the community in engaging in the RWPIP. If leaders were interested in participating they were asked to submit a formal application (manifestação de interesse). The form included basic information about the community and their water situation, as well as the names of the proposed water committee members and a list of households who were interested in contributing money towards the water point.
The 146 communities that did not receive a handpump under the last large water project in Nampula6 received first priority from the RWPIP (Cowater, 2010). After targeting these communities, the remaining communities were selected from the applications submitted to the MCA/Cowater based on available water sources, the election of a water committee that includes women, the ability to raise a cash contribution, district government prioritization, and population size7 (Cowater, 2010).
Community decision-making is a key element of the rural water approach in Mozambique. The project design report for the RWPIP (Cowater, 2010) specifies that communities will make the decisions about the water supply technology, borehole siting, management structures, and household financial contribution levels. These policies are designed to promote community member’s “sense of ownership” (Marks and Davis, 2012), and thus increase the likelihood of the handpump functioning over the long term (MIPAR, 2001). In line with the community participation approach, the water points are to be managed by a water committee.
The community is responsible for sustaining the water point after the warranty period on the handpump expires. In order to pay for the spare parts and repairs that may be needed, Cowater animators instructed the water committee to collect monthly tariffs from water users. While communities choose the tariff amount, Cowater recommended a monthly tariff between 10 - 40 MZN ($0.34-1.28 USD), depending on the number of water users. The community management model operates under the assumption that the water committee will have the capacity (both technically and financially) to keep the handpump functioning over the long term (10 years).
5.2 FORMATION OF THE WATER COMMITTEE AND PEC
After the community was selected and the Cowater animator met with the leader,
6 Due to a shortage of funds, 146 communities that were mobilized, as part of the ASNANI project, did not receive boreholes.7 To receive a handpump the communities should have at least 100 families.

23
the water committee (WC) was chosen. With the help of the animators the community selected the water committee members and assigned them to one of the three sub-groups: management, operation and maintenance, or hygiene and sanitation. When the WC was assembled, they received a series of trainings, known as PEC (Participação e Educação Comunitária; Community Participation and Education) from Cowater animators.
PEC activities encompass a variety of topics, but the two main goals of the program are to improve the capacity of the water committee to keep the handpump functioning over the long term, and promote hygiene and sanitation in the community. According to Cowater reports, water committees receive training in handpump management, repair and maintenance, record keeping, financial management, conflict resolution, latrine promotion and construction, oversight of contractors, participatory monitoring and evaluation and health, and sanitation education.
The hygiene and sanitation trainings are based on a participatory World Health Organization curriculum called PHAST (Participatory Hygiene And Sanitation Transformation). Activities conducted during PHAST include card sorting of “good” and “bad” sanitation behaviors, mapping fecal-oral transmission routes, and ranking different types of latrines. In some areas Cowater animators also used a different approach called community led total sanitation (CLTS). This program relies on a mixture of pride and humiliation to induce behavior change, and is reserved for “difficult” communities where people don’t want to change their behaviors.
As stated in the predesign report (Cowater, 2010), the goals of the sanitation and hygiene education were to promote latrine construction, handwashing facilities, hygienic practices for water transportation and storage, dish racks, rubbish pits in the home, and good hygiene practices in homes, schools, health centers, and markets. Hygiene and sanitation behavior change requires repetition over a long time period of time. This fact was recognized by the project planners, who recommended that PEC activities begin six months before the boreholes were installed, and continue 12 months following the installation (Cowater, 2010). Besides PEC activities, sanitation demonstration centers in district cities were intended to display latrine options, sell concrete latrine covers, and carry spare handpump parts.
5.3 DRILLING PREPARATION
To prepare for the drilling, the community selected three sites where they would like to have their handpump located. As stipulated in the Cowater design manual “women and other vulnerable groups” should be involved in this process. After the sites were marked by the first, second, and third preference of the community, a geophysical team was called in to the community to conduct an investigation of the water resources in the area. The method used to determine the potential of proposed sites for borehole construction is known as geo-electric prospecting with

Impact Evaluat Ion of thE mozamb IquE RuRal WatER Supply act Iv I ty 24
resistivity profiling (or vertical electric sounding, VES) (Cowater, 2010). Through this system the three locations were ranked according to their potential water yield. If the geophysical investigations showed limited or no promise of reaching water, the community was replaced by another. Before drilling, the community was expected to have raised their capital contribution of 2,500 MZN ($86 USD).
5.4 DRILLING AND CIVIL WORKS
In Nampula, 358 handpumps were installed in six districts over three phases (Table 5.1). The handpumps were divided into multiple lots for procurement purposes. Drilling companies bid on individual lots, resulting in the hiring of five different drilling contractors from China, Maputo, and Nampula. Drilling typically occurred within a half day. In some cases, even when the geophysical assessments indicated water should be accessible, the drilling rigs were not able to reach water within 50 meters and drilling was cancelled.8
Boreholes that were dry, delivered less than the recommended yield, or did not meet the minimum water quality standards are referred to as “negative” boreholes (Cowater, 2011). During each stage of the project there were various conditions that could exclude a community from receiving a handpump. However, most negative boreholes were identified during the drilling process. The number of negative boreholes in Phases 1, 2, and 3 is illustrated in Table 5.2. A total of 274 boreholes in Nampula and Cabo Delgado were classified as negative (Cowater, 2013).
When the Cowater animators meet communities they are instructed to deliver the “clear and transparent” message to the communities that there are a number of risks that could result in their exclusion from the program (Cowater, 2010). Cowater animators face the difficult task of mobilizing communities and engaging their participation without unduly raising their expectations.
When boreholes were positive, they were plugged on top and held intact with a plastic casing until pumping and water quality tests were completed. Electrical conductivity (EC) and pH tests were determined immediately. The flow rate and water quality tests were performed at a later date. Provided that the
8 In some cases, an Afridev handpump with bottom support was used to pump water from aquifers deeper than 50 meters.
Table 5.1: Number of Boreholes Installed in Nampula by Phase
Phase 1 Phase 2 Phase 3
Number of boreholes 100 150 108Districts Meconta 30
Nampula Rapale 30Mogovolas 40
Murrupula 50Mogicual 40Moma 60
Mogicual 38Mogovolas 30Monapo 40
Drillers Jiangsu (Meconta, Nampula)Mozagua (Mogovolas)
SC Nasser (Murrupula)Rock Driller (Mogicual)Mozagua (Moma)
Mozagua (Mogovolas, Mogicual)HA (Monapo)

25
tests showed no potential problems,9 a permanent casing was inserted into the borehole and the handpump was mounted. Another team was responsible for constructing the civil works – including the aprons, drainage system, and washing basins. The procurement guidelines mandated that the works were completed within the construction period of 17 weeks regardless of the geological conditions encountered on-site (MCA-Mozambique, 2010).
5.5 COMMUNITY HANDOVER
The water points were provisionally handed over to the communities soon after they were functioning. The handover ceremony signifies that the community has fulfilled their obligations, and now assumes responsibility for the water point. During the ceremony, the water committee hands the 2,500 MZN community contribution directly to the drilling team, and in return the water committee is presented with the tools necessary to maintain the handpump. The community leaders sign a contract with the district government and the water committee (WC) president acknowledges their responsibility to maintain the handpump.
5.6 MONITORING AND EVALUATION
During the one-year warranty period, Cowater animators visit the communities every three months. During these visits they complete simple monitoring exercises with the water committee, and have opportunities to fix any problems. These monitoring visits are used to improve on practices and address potential issues that threaten the effectiveness or sustainability of the handpumps. The communities that received the boreholes during the first round of drilling had regular monitoring visits for almost two years, but extended monitoring was not possible in the last round of boreholes completed just months before the termination of the Compact.
9 An estimated minimum flow of 900 l/h (15 l/min) is necessary to develop the borehole and the quality of water measured on the basis of EC measurements cannot exceed 2000 microsiemens per centimeter.
Table 5.2: Number of Positive and Negative Boreholes in Nampula by Phase
Phase 1 Phase 2 Phase 3 Total
Number of handpumps installed
100 150 108
358Meconta 30Nampula Rapale 30Mogovolas 40
Murrupula 50Mogicual 40Moma 60
Mogicual 38Mogovolas 30Monapo 40
Number of negative boreholes
49 60 66
175Meconta 13Nampula Rapale 20Mogovolas 16
Murrupula 21Mogicual 17Moma 22
Mogicual 9Mogovolas 26Monapo 31

Impact Evaluat Ion of thE mozamb IquE RuRal WatER Supply act Iv I ty 26
27
6.EVALUATION DESIGN
6.1 EVALUATION TYPE
The objective of the impact evaluation of the MCA’s RWPIP in Nampula is to examine the extent to which the program objectives have been realized. The RWPIP is not strictly a hardware program. It also mobilized water committees to maintain the handpumps and provided hygiene and sanitation trainings to water committees and community members. Rigorous impact evaluations should allow causal claims to be made about program interventions and observed changes in outcome indicators, typically by comparing the beneficiaries of the program to a non-beneficiary comparison group.
In order to assess the impacts of the installed handpumps in the RWPIP communities, the research design employed a panel survey in the treatment and comparison groups. Panel surveys are specifically designed to compare changes in treatment communities “before” and “after” an intervention with changes in comparison communities that did not receive the intervention. This design permits a “difference-in-differences” approach to the analysis of data collected. To collect the panel data, a baseline survey was undertaken in 2011, mainly targeted at collecting pre-intervention data, and a follow-up survey was undertaken in 2013.
The evaluation of the treatment and comparison communities uses a difference-in-differences approach in which outcomes are observed for two groups for two time periods. The treatment group is exposed to the intervention by the second period, but not in the first period. The comparison group is not exposed to the treatment during either period. In the case where the same units within a group are observed in each time period, the average gain in the second (comparison) group is subtracted from the average gain in the first (treatment) group. This approach removes biases in second-period comparisons between the treatment and comparison group that could be the result of permanent differences between those groups, as well as biases from comparisons over time in the treatment group that could be the result of general trends.
The predominant analysis of the RWPIP impact evaluation consists of two-sample t-tests comparing the differences between baseline and follow-up of treatment and comparison communities’ median household values of the outcomes of interest (e.g., time cost of water fetching). For each community, the difference between the median household value of the outcome of interest at baseline was subtracted from the median household value at follow-up. These differences from baseline to follow-up in the treatment communities were then compared to the differences in the comparison communities via a two-sample t-test.
The difference-in-differences approach assumes that in the absence of the intervention, the values of outcome variables of interest would be changing at the same rate in the two cohorts. The Stanford-VT team developed a sample frame

Impact Evaluat Ion of thE mozamb IquE RuRal WatER Supply act Iv I ty 28
that tried to minimize the potential for systematic differences to exist between the treatment and comparison groups. It must be recognized, however, that the RWPIP was based upon a demand-responsive approach to rural water planning. As such, communities that wanted to receive a water point had to organize themselves and successfully manage several programmatic demand filters (e.g., forming a water committee and collecting US$86 in capital cost contributions from community members) in order to be eligible for a water point. Such communities may have characteristics that differentiate them from those (comparison) communities that were not able to mobilize the resources to qualify for the RWPIP. However, these concerns are mitigated by the fact that nine of the original treatment communities became comparison communities because of negative geophysical results, and eight of the original comparison communities received a RWPIP handpump and became treatment communities.
While it is unreasonable to assume that the treatment and comparison communities are the same with respect to every characteristic of interest, the difference-in-differences approach only requires that, absent the RWPIP intervention, the unobserved differences between the two groups would be equivalent over time.
6.2 EVALUATION QUESTIONS
The Stanford-VT team worked with colleagues in the Monitoring & Evaluation unit of the MCC to develop a set of research questions that underpin the evaluation. In addition to collecting evidence regarding the RWPIP objectives, the Stanford-VT team also included a number of questions that will leverage the MCC’s investment in the impact evaluation to generate additional learning.
The following research questions are explored in Section 7:
• How does the installation of handpumps through the MCA RWPIP affect the total amount of water from all sources used by households?
• How does the installation of handpumps through the MCA RWPIP affect the total amount of water from improved sources used by households?
• How is the volume of water collected by males, females, adults, and children in the household affected by the installation of the MCA handpumps?
• How does the installation of handpumps through the MCA RWPIP affect the time costs of water collection?
• How are the time costs of water collection distributed across males, females, adults, and children in the household?
• How does the use of alternative indicators of distance affect the estimated time cost of water fetching?

29
• What is the relationship between the distance a household is located from a handpump and the probability that the household uses the handpump?
• How does the installation of handpumps through the MCA RWPIP affect school attendance for girls and boys?
• How does the installation of handpumps through the MCA RWPIP affect sanitation and hygiene practices?
• How does the installation of handpumps through the MCA RWPIP affect the microbiological quality of water supplies being used by households?
• How does the installation of handpumps through the MCA RWPIP affect the 7-day prevalence of gastrointestinal and respiratory illness?
• To what extent do community members express a sense of ownership for the infrastructure installed by the MCA RWPIP?
• To what extent do community members express a greater satisfaction with their water supply situation following the installation of the MCA handpump?
• How does the installation of handpumps through the MCA RWPIP affect household income, expenditures, and dietary consumption?
• How well are the handpumps installed by the MCA RWPIP performing from a technical, management, and financial perspective, and what are the prospects for long-term sustainability?
6.3 METHODOLOGY / DATA COLLECTION
The sample frame was designed to draw confident causal inference about the impacts attributed to the installation of handpumps in Nampula. In order to monitor these impacts, the following activities were undertaken:
• A baseline study in Phase 1 and 2 treatment and comparison communities was completed in June-July, 2011, which was mainly targeted at collecting pre-intervention information.
• A follow-up study in Phase 1 and 2 treatment and comparison communities was completed in June-July, 2013, to capture the changes that had occurred in these communities over a two-year period.
The following lists provide a summary of the activities that were undertaken during each of the fieldwork expeditions. In both the baseline and follow-up studies, two weeks of enumerator training (Figure 6.1) and a pilot study (Figure 6.2) were undertaken prior to the commencement of the fieldwork. The

Impact Evaluat Ion of thE mozamb IquE RuRal WatER Supply act Iv I ty 30
pilot study enabled the Stanford-VT team to test the logic in the household survey and review the structure of the data collected for omitted or incorrect values. It also provided the enumerators with an opportunity to follow all the fieldwork protocols and practice administering each of the surveying instruments. Following the pilot study, final adjustments were made to the surveying instruments and fieldwork protocols, and enumerators were retrained as needed to address any data entry errors made during the pilot study. The training of enumerators continued throughout the fieldwork when the Stanford-VT team’s ‘on-the-ground statistician’ regularly reviewed potential data entry errors with each enumerator. This regular (nightly) review of data improved the overall data quality and prevented the enumerators from making systematic errors throughout the fieldwork.
2011 baseline study:
• 1,579 households surveys were completed in 54 communities (27 treatment and 27 comparison);
• 54 water committee (WC) or leader interviews were completed;10 and• Water sampling was undertaken in 11 communities (from 39 community water
sources and 259 household containers).
2013 follow-up study:
• 1,826 households surveys were completed in 62 communities (32 treatment and 30 comparison);
• 31 water committee or leader interviews were completed;• 17 water point observations were undertaken in 17 communities; • Water sampling was undertaken in 11 communities (from 32 community water
sources and 873 household containers); and• Water source variability sampling was undertaken in four communities (which
10 Interviews with WC members and/or leaders took place in each of the 54 communities in the baseline sample. Out of the 54 interviews, 27 were conducted with the leader alone, 5 were conducted with the WC alone, and 22 were conducted with WC and leader together. In the cases when the WC did not exist the leader was asked basic information about the community and their water sources.
FIGURE 6.1Enumerator Training in
Nampula

31
consisted of 412 water samples).
In the baseline and follow-up studies, an average of 29 household surveys were completed in each community. Around three quarters (73%) of the households interviewed during the baseline study were surveyed again in the follow-up study. If the head of a household was not available after two attempts to contact them or had left the community, a replacement household was randomly selected into the follow-up sample.
6.4 SAMPLE FRAME
Appendix A provides a detailed description of the key decisions that influenced the design of the sample frame. The text below summarizes the process that was followed to develop the sample and outlines the changes that were made to the sample after the baseline study.
The sample frame was developed to draw confident causal inference about the impacts attributable to the installation of water points in the RWPIP. Following the purposive first-stage selection of Nampula,11 the selection of districts, communities, and households was conducted as follows:
• District selection: Sampling of treatment communities was based on the completed and planned water point interventions in Phases 1 and 2, respectively. [Note: the RWPIP had three phases (or rounds) during which handpumps were installed in communities in Nampula and Cabo Delgado. The phases generally focused on groups of districts within each province.]
• Comparison communities: Comparison communities were randomly selected from the same localities as the sampled treatment communities. This approach
11 The decision to limit the evaluation to Nampula province (excluding Cabo Delgado) was made in 2009 as a result of both budgetary and validity concerns. Through consultation with MCC staff the Stanford-VT team concluded that spreading the available evaluation resources across both provinces would (1) substantially reduce the number of communities and households that could be included in the study and (2) result in a sample frame that did not allow for meaningful comparisons between the provinces.
FIGURE 6.2 Pilot Study in Nampula

Impact Evaluat Ion of thE mozamb IquE RuRal WatER Supply act Iv I ty 32
meant that only localities that were involved with the MCA’s RWPIP were contacted.
• Phase 3: Phase 3 communities were not included in the sample frame due to the following constraints: (1) the list of communities receiving a water point was not available prior to the commencement of the 2011 baseline study; and (2) Phase 3 water point installations occurred toward the end of the program, which meant that insufficient time would have passed for the full impacts of the interventions to be realized before the 2013 follow-up study. However, three of the original comparison communities received an MCA water point during Phase 3 and are considered as Phase 2 treatment communities in the follow-up study.
• Household selection: During the baseline study, households were selected using the following process:
1. Upon arrival in the community, the surveying team leader met with the community leader and confirmed that the household survey could begin within the community.
2. The surveying team leader then met with the community guide and was taken to the start point of the surveying cluster: • Treatment community: The start point was the recently installed
handpump or the planned location of the handpump.• Comparison community: The start point was the house of the
community leader.3. From the start point a bottle/pen was spun to identify the direction of a
random line running from the start point. The first and second enumerators walked in opposite directions along this line. The bottle/pen was spun again to establish the line for the remaining enumerator and team leader. Every second household encountered by the surveyor was selected for the survey. If an enumerator reached the edge of a community, he/she returned to the start point and spun a bottle/pen again to identify a new random direction.
4. Around 27 to 30 households were interviewed in each cluster. During the follow-up study, if a respondent from the baseline study was not available to interview or had left the community, a replacement house hold was randomly selected.
The schematic below highlights the key difference between the Phase 1 and 2 treatment and comparison groups – i.e., Phase 1 treatment communities received a handpump before the baseline study, whereas Phase 2 treatment communities received a handpump between the baseline and follow-up study.
The timing of the baseline study meant that it was not possible to collect data from the Phase 1 treatment communities prior to the installation of the handpumps in these communities. Acknowledging the lack of pre-intervention data in these communities, the decision to include them in the study sample was the result of several important considerations. First, since Phases 1 and 2 of the rural water program each targeted

33
three different districts, if Phase 1 had been excluded only one-half of the RWPIP in Nampula would have been studied. Second, including Phase 1 communities in the sample meant that it would be possible to study the performance of, and benefit streams from, the handpump beyond its one-year warranty. When designing the 2011 baseline sample, there was a concern that some of the handpumps in Phase 2 might be installed within months or weeks of the 2013 follow-up study. The inclusion of Phase 1 communities in the study meant that data could be collected on the performance and impact of the handpumps at least two years after their installation, which was deemed important by MCC/MCA staff.12
Table 6.1 provides a summary of the sample frame at the time of the 2011 baseline study. The sample consisted of 54 communities, 18 (nine treatment and nine comparison) from Phase 1 districts and 36 (18 treatment and 18 comparison) from Phase 2 districts.
During the two years that passed between the baseline and follow-up studies, a number of events impacted the original classification of the Phase 1 and 2 treatment and comparison communities. For example, as a result of poor geophysical conditions, several treatment communities did not receive a handpump and were subsequently reclassified as comparison communities. Further, during Phase 3 of the RWPIP, a number of handpumps were installed in comparison communities that were then reclassified as treatment communities. In total, nine treatment communities were reclassified as comparison communities and one was removed from the sample (due to the installation of a World Vision handpump) (see Table A.2 in Appendix A), seven treatment and one comparison communities in Moma were added to the sample (Table A.3 in Appendix A);13 and eight comparison communities were reclassified as treatment communities (see Table A.4 in Appendix A). See Appendix A for a detailed discussion of the changes that were made to the sample.
12 Note: An analysis of the time that a handpump had been installed (i.e., less than vs. greater than one year) against LPCD from all sources and improved sources, time spent collecting water, income, and expenditures showed no significant changes between the two groups.13 Since the seven treatment communities in Moma were not included in the baseline study, they were excluded from the difference-in-differences analyses presented in Section 7. The Stanford-VT team plans to include them in the more nuanced analyses planned for journal articles.
Phase 1: Handpump (XHP) installed before baseline survey
Baseline 2011 Follow-up 2013
Treatment XHP1 t0 t1
Comparison t0 t1
Phase 2: Handpump (XHP) installed after baseline survey
Baseline 2011 Follow-up 2013
Treatment t0 XHP2 t1
Comparison t0 t1

Impact Evaluat Ion of thE mozamb IquE RuRal WatER Supply act Iv I ty 34
Table 6.2 provides a summary of the final sample frame that is referred to in the analysis in Section 7.
One potential concern with the design of the sample was that the treatment communities were in some way different to the comparison communities. For example, the treatment communities were able to mobilize their community to qualify for the RWPIP, whereas the comparison communities did not. Thus, the treatment communities may have characteristics that differentiate them from the comparison communities. To address this concern, an ANOVA test comparing the overall difference in means between Phase 1 comparison and Phase 2 treatment
Table 6.2: Final Sample Frame (after the 2013 Follow-up Study)
Community ClassificationNumber of Communities in
GroupNumber of Communities by
District
Phase 1
Treatment 104 Meconta3 Mogovolas3 Rapale
Comparison 62 Meconta1 Mogovolas3 Rapale
Phase 2
Treatment 15
8 Mogincual3 Murrupula2 Mogovolas2 Moma
Comparison 23
4 Mogincual8 Murrupula1 Mogovolas10 Moma
Table 6.1: Original Sample Frame (at the time of the 2011 Baseline Study)
Community Classification
Number of Communities
in Group
Number of Communities
by DistrictComments Relating to the Analysis of the Data
Phase 1
Treatment 93 Meconta3 Mogovolas3 Rapale
Since the treatment communities had received a handpump before the baseline study, the data collected from the Phase 1 treatment and comparison communities are used to evaluate the sustainability of impacts over time.Comparison 9
3 Meconta3 Mogovolas3 Rapale
Phase 2 Treatment 186 Mogincual6 Murrupula6 Moma
Since the handpumps were installed in the treatment communities after the baseline study, the data from the treatment and comparison communities are used to evaluate the ‘impacts’ from the RWPIP using a difference-in-differences evaluation methodology.

35
and comparison communities shows that for 13 of 15 key variables, the differences between the three groups of communities were not statistically significant (Table 6.3).14
For latrine use and income, the differences between the three groups were statistically significant. At baseline, the average use of latrines by Phase 1 comparison communities was 56.7%, significantly higher than the average percentage in Phase 2 treatment and comparison communities (23.2% and 16.2%, respectively) (p<0.01). For comparison, Phase 1 treatment communities had an average household latrine use of 53.8% at baseline, a percentage similar to that in Phase 1 comparison communities (56.7%). Reported median monthly income earned by households in Phase 2 comparison communities was 839 MZN, significantly higher than that reported in Phase 2 treatment communities (308 MZN) and Phase 1 comparison communities (455 MZN) (p<0.05). Notwithstanding these two variables, the overall results indicate that Phase 2 treatment, Phase 2 comparison, and Phase 1 comparison communities were relatively equivalent at the time of the baseline study.
In addition to the above analysis, the changes that were made to the sample frame following the baseline study (see Appendix A) help mitigate the impact of potential confounding factors in the comparison of the treatment and comparison communities. As mentioned above, nine treatment communities were reclassified as comparison communities and eight comparison communities were reclassified as treatment communities. Finally, while it is unreasonable to assume that the treatment and comparison communities are the same with respect to every characteristic of interest, the difference-in-differences approach only requires that, absent the RWPIP intervention, the unobserved differences between the two groups would be equivalent over time.
6.5 POWER CALCULATIONS
Variable: LPCD per Household from Improved Sources
As an example of a post-hoc power calculation, we investigate the differences from baseline to follow-up in communities’ median volume of water (LPCD) collected per household from improved sources. In other words, what change in improved LPCD collected do we observe due to the installation of the handpumps?
Analysis: We used a two-sample t-test on the baseline-to-follow-up differences in community medians. We compared the baseline-to-follow-up differences in medians of the 15 Phase 2 treatment communities with the baseline-to-follow-up differences in medians of the 23 Phase 2 comparison communities.
Post-hoc Power Calculation: For a Type I error rate of alpha=0.05, with an observed standard deviation of the difference in median LPCD collected
14 Since the Phase 1 treatment communities had received a handpump at the time of the baseline study, they were excluded from this analysis.

Impact Evaluat Ion of thE mozamb IquE RuRal WatER Supply act Iv I ty 36
Table 6.3: Comparing Baseline Values of 15 Key Variables between Phase 2 Treatment, Phase 2 Comparison, and Phase 1 Comparison Communities
Variable
Mea
n of
Pha
se
2 Tr
eatm
ent
Com
mun
ities
Mea
n of
Pha
se
2 C
ompa
rison
C
omm
uniti
es
Mea
n of
Pha
se
1 C
ompa
rison
C
omm
uniti
es
P-va
lue
for
AN
OVA
Tes
t of
dif
fere
nces
be
twee
n gr
oups
P-va
lue
for
t-tes
t com
parin
g Ph
ase
2 Tr
eatm
ent
and
Com
paris
on
Com
mun
ities
Median Total Liters per Capita per Day (LPCD) (All Sources) 17.2 18.5 21.0 0.103 0.191
Median Total (All Sources) Liters per Day (LPD) 65.4 75.6 75.0 0.241 0.075.
Median Total LPCD from Improved Sources 0.0 1.8 0.0 0.282 0.101
Median Total LPD from Improved Sources 0.0 7.5 0.0 0.269 0.095.
Median Total Minutes Per Day (MPD) Spent Collecting Water (All Sources) by Household
272.3 256.0 231.0 0.848 0.745
Median Total MPD Spent Collecting 20 Liters of Water (All Sources)
103.9 85.9 82.5 0.522 0.294
Mean Percentage of Households (HHs) Stating that Water Fetching Affects School Attendance
26.7% 16.8% 22.5% 0.158 0.096.
Percentage of HHs Using Latrines 23.2% 16.2% 56.7% 0.001** 0.234
Median Number of Times Per Day Respondent Reported Washing Hands
3.7 4.0 3.3 0.435 0.634
Percentage of HHs Indicating Satisfaction with Sanitation Situation
42.0% 46.9% 45.2% 0.743 0.459
Percentage of Children Exhibiting Symptoms of Respiratory Illness in the Past Week
19.1% 18.3% 18.6% 0.98 0.848
Percentage of Children Exhibiting Symptoms of Gastrointestinal Illness in the Past Week
14.5% 17.2% 18.0% 0.671 0.393
Percentage of HHs Indicating Satisfaction with Water Supply Situation
22.1% 31.4% 22.2% 0.246 0.15
Median Monthly Income (in MZN)308 839 455 0.019* 0.002**
Median Monthly Expenditures (in MZN) 472 645 673 0.131 0.037*
Significance codes: ‘***’ p<0.001; ‘**’ p<0.01; ‘*’ p<0.05; ‘.’ p<0.1

37
from improved sources of 10.3 LPCD, the minimum detectable effect size of the difference (15 Phase 2 treatment communities compared to 23 Phase 2 comparison communities) in differences (baseline to follow-up) is shown in Figure 6.3 for various levels of power. For 80% power, the minimum detectable effect size would be 8.7 LPCD. We observed a difference in differences of 16.7 LPCD between the Phase 2 treatment and comparison communities, approximately double the minimum detectable effect size.
Table 6.4 provides a summary of the critical values needed to reach 80% power for the difference-in-differences analyses for 15 key variables. The table presents data from Phase 2 communities. The second, third, and fourth columns present the data collected from the Phase 2 treatment communities during the baseline and follow-up studies, and the difference between these values, respectively. The fifth column shows the results from the difference-in-differences analyses for the Phase 2 treatment and comparison communities (note the data for the Phase 2 comparison communities is not shown in the table). The sixth column on the right of the table shows the approximate “true” difference-in-differences value that would have been needed to achieve an 80% power in the difference-in-differences analyses. Thus, for an impact to be statistically significant (p<0.05), the value in the right-hand column needs to be less than the value in the adjacent Difference in Differences column. Thus, of the 15 key variables, only six were found to have a significant (p<0.05) impact.
6.6 TIMEFRAME
As discussed in Appendix A, the two-year period between the baseline (2011) and follow-up (2013) study was determined by the extended negotiations on the structure of the sample frame that delayed the start of the evaluation, and the end of the Mozambique Compact in 2013. Notwithstanding these constraints, the two-year timeframe between the baseline and follow-up study is considered to be sufficient to capture many of the impacts related to the installation of a handpump in the treatment communities.
0 5 10
0.0
0.2
0.4
0.6
0.8
1.0
Water Collected per HH (LPCD) from Improved Sources
Minimum Detectable Effect Sizes (LPCD)
Pow
er
FIGURE 6.3 Liters per Capita per Day (LPCD) per Household from Improved Sources (Power vs. Effect Size)

Impact Evaluat Ion of thE mozamb IquE RuRal WatER Supply act Iv I ty 38
Table 6.4: Summary of 15 Key Variables for the Phase 2 Treatment Communities and the Critical Values Needed to Reach 80% Power for the Difference-in-Differences Analyses
Variable
Base
line
(Pha
se 2
tr
eatm
ent)
Follo
w-U
p (P
hase
2
trea
tmen
t)
Dif
fere
nce
(Bas
elin
e to
Fol
low
-up
for
Phas
e 2
trea
tmen
t)
Dif
fere
nce
in
Dif
fere
nces
(Pha
se 2
trea
tmen
t co
mpa
red
with
co
mpa
rison
co
mm
uniti
es)
App
roxi
mat
e cr
itica
l va
lue
for
80%
po
wer
for
diff
eren
ce
in d
iffe
renc
es
Median Total Liters per Capita per Day (LPCD) (All Sources) 17.2 19.5 2.3. 2.5. 4.2
Median Total (All Sources) Liters per Day (LPD) 65.4 76.5 11.1* 17.9** 17.5
Median Total LPCD from Improved Sources 0.0 15.1 15.1*** 16.7*** 6.1
Median Total LPD from Improved Sources 0.0 58.0 58.0*** 64.3*** 16.3
Median Total Minutes Per Day (MPD) Spent Collecting Water (All Sources) by Household
272 225 -48 -88 -159
Median Total MPD Spent Collecting 20 Liters of Water (All Sources)
103.9 61.9 -42.0* -54.7** -51.4
Mean Percentage of Households (HHs) Stating that Water Fetching Affects School Attendance
26.7% 7.1% -19.6%** -17.5%** -16.0%
Percentage of HHs Using Latrines 23.2% 32.8% 9.6%** 7.5%. 12.2%
Median Number of Times Per Day Respondent Reported Washing Hands
3.7 3.9 0.2 0.1 1.4
Percentage of HHs Indicating Satisfaction with Sanitation Situation
42.0% 63.5% 21.5%* 8.5% 26.7%
Percentage of Children Exhibiting Symptoms of Respiratory Illness in the Past Week
19% 8% -11%* -9% -15.8%
Percentage of Children Exhibiting Symptoms of Gastrointestinal Illness in the Past Week
15% 14% -1% -2% -10.4%
Percentage of HHs Indicating Satisfaction with Water Supply Situation
22% 79% 57%*** 63%*** 27%
Median Monthly Income (in MZN) 308 805 497** 8 617
Median Monthly Expenditures (in MZN) 472 619 147* 53 216
Significance codes: ‘***’ p<0.001; ‘**’ p<0.01; ‘*’ p<0.05; ‘.’ p<0.1

39
7. FINDINGS FROM THE IMPACT EVALUATION OF THE RWPIP IN NAMPULA
7.1 CONTEXT
7.1.1 Household and Respondent Characteristics
The average number of people in the household was approximately four people for both the baseline and follow-up studies (Table 7.1). Mean reported annual household income for all treatment and comparison communities was $939 at the time of the baseline and $1,248 during the follow-up. The annual reported expenditures were $353 at the time of the baseline and $426 during the follow-up. The income data were obtained from a module in the household survey that asked questions about a broad range of activities such as agriculture, the raising of livestock, wage income, and income from remittances. The expenditure data were obtained through a series of questions that focused on weekly, monthly, and annual expenditures. One key indicator of household wealth, whether a household has a tin roof versus a thatch, mud, or wood roof, shows that 5% of all the households surveyed in the baseline had tin roofs, as did 8% in the follow-up.
The average age of respondents was about 40 years during both the baseline and follow-up (Table 7.2). At the time of the baseline, 38% of respondents
Table 7.1: Household Characteristics
Baseline Follow-up
Mean Median Mean MedianNumber of people in the household 4.2 4.0 4.2 4.0Annual reported household income $939 $165 $1,248 $433Annual reported expenditures $353 $225 $426 $282Percent of roofs covered with non-organic material 5% – 8% –
Table 7.2: Respondent Characteristics
Baseline Follow-up
Mean Median Mean Median
Age of survey respondent 39.6 38.0 39.7 37.0% of female survey respondents 38% – 44% –% of respondents that are literate 32% – 32% –

Impact Evaluat Ion of thE mozamb IquE RuRal WatER Supply act Iv I ty 40
were women, compared to 44% during the follow-up. About one-third (32%) of respondents were literate in the baseline and follow-up studies.
7.1.2 Household Water Use by Water Source Type
Tables 7.3 and 7.4 provide a summary of (1) the percent of households using each water source and (2) the percent of total water obtained from each source, for the baseline and follow-up studies for the Phase 2 treatment and comparison communities. The data show that at the time of the baseline study the vast majority of households surveyed in both treatment and comparison communities collected water from unprotected wells (85% and 78%, respectively). However, in the follow-up study, 78% of households surveyed in treatment communities were using handpumps compared to only 2% of households in comparison communities. Thus, the majority of households in the treatment communities switched from unprotected wells and rivers to handpumps. Unprotected sources, including wells and rivers, continued to be the primary water sources in comparison communities.
Table 7.3: Phase 2 Treatment – Percentage of Households Using Source and Percentage of Total Water Collected from Source
% of HHs Using Source % of Total HH Water Collected from Source
Baseline Follow-Up Baseline Follow-Up
Public Tap 0.0% 0.0% 0.0% 0.0%Handpump 9.1% 77.6% 6.2% 73.9%Protected Well 0.2% 0.9% 0.1% 0.4%Unprotected Well 85.4% 20.6% 84.3% 17.2%Protected Spring 0.0% 0.0% 0.0% 0.0%Unprotected Spring 0.2% 1.8% 0.0% 1.0%Rainwater 0.0% 0.0% 0.0% 0.0%River/Lake 15.7% 8.7% 9.3% 7.5%
Table 7.4: Phase 2 Comparison - Percentage of Households Using Source and Percentage of Total Water Collected from Source
% of HHs Using Source % of Total HH Water Collected from Source
Baseline Follow-Up Baseline Follow-Up
Public Tap 0.0% 0.9% 0.0% 0.8%Handpump 10.2% 2.3% 10.5% 2.0%Protected Well 0.3% 2.2% 0.2% 2.0%Unprotected Well 77.8% 64.5% 78.5% 62.1%Protected Spring 0.0% 0.1% 0.0% 0.1%Unprotected Spring 0.1% 0.0% 0.0% 0.0%Rainwater 1.2% 0.1% 0.3% 0.0%River/Lake 14.5% 35.1% 10.5% 32.9%

41
However, even in Phase 2 treatment communities, about one-quarter (22%) of households surveyed did not use the handpumps (or another protected source). The most common reasons that households did not use the handpumps were because they were too far away or too expensive (Table 7.5).
7.1.3 Tariffs
Almost 90% of communities charge users for water. Users pay for water by the month; the median monthly tariff is 10 MZN. In one-third of the communities, users are not charged for water during the rainy months – typically December/January to May. This policy was instituted because there are many shallow open wells available near peoples’ homes during this time and when users are charged they stop using the handpump altogether. During these months, farmers also have little disposable income available to pay for water. In 71% of communities, at least one group receives water for free, most commonly elderly or disabled people without the means to support themselves.
7.1.4 Regulations About Water Use
Table 7.6 shows that 42% of communities established rules about how water can be used. More than one-third of communities had regulations prohibiting the use of handpump water for irrigating gardens, irrigating farm plots, washing cars, (re)selling water, small-scale commerce, services, and manufacturing. The resale of water happens in 17% of the communities and in each case it happens only occasionally or rarely.
Table 7.5: Self-Reported Reasons that Treatment Households Do Not Use Handpumps (multiple responses permitted)
Reason for Not Using the Handpump Percent of Households (n=170)Distance 64.7%Too expensive 28.8%
Don’t like taste 14.1%Closed or broken 7.1%Too crowded 6.5%Not permitted to use* 5.9%
Conflicts 1.2%
* Some households were not permitted to use the handpump because they did not pay the initial contribution towards the cost of the system.

Impact Evaluat Ion of thE mozamb IquE RuRal WatER Supply act Iv I ty 42
7.1.5 Number of Handpump Users
Data about the number of people using the handpumps was obtained from two sources: a day of handpump observation in treatment communities, and water committee estimates. Water committee estimates were provided in 28 communities. Based on these estimates a median of 391 people are served by the handpump during the dry season and 176 people during the wet season. In 63% of these communities, the estimates provided by the water committee were given verbally without reference to records. The estimates varied widely between communities, from 66 to 1,848 users during the dry season. Based on the unreliability of these estimates, one day of observation at the handpump was also conducted in 17 communities.
During the day of observation, one enumerator sat at the handpump and used a form to record the number of users, their gender, and how much water they collected. Every fourth user was asked whether they live in the community and how many daily trips someone from their household takes to the handpump. The handpumps were observed for an average of five hours, typically in the morning. The observations were conducted in June or July, after the wet season, but before the driest part of the year in September-November. Thus, the results reflect an proximate midpoint in the year between the lowest and highest rates of handpump usage.
The data show that the handpumps were not widely used on the day of observation: on average, only six people collected water each hour from the handpumps. If the handpumps are open for eight hours, this means that about 50 people were using the handpumps every day. Water users reported that their households take an average of 2.3 trips to the handpump per day, so in actuality there were probably fewer than 25 unique water collectors using the handpump on the observation day. Multiplying the number of individual families by the average number of people in a family (4.2) shows that around 90 people were served by the handpumps on the day of observation. Nearly all the water collectors (94%) reported that they lived in the community. The median amount of water collected per person for each trip
Table 7.6: Community Regulations About the Use of Handpump Water (from water committee data)
% of communities that restrict the use of handpump water for… All year Dry Season Only
Irrigating farm plots 42% 6%
Manufacturing 42% 3%
Irrigating gardens 39% 10%
Washing cars 39% 3%
Small commerce and services 35% 0%
Selling water 35% 0%
Watering animals 32% 3%
Washing clothes 10% 6%

43
was 19.4 liters (i.e., approximately one 20 liter bucket).
7.1.6 Water Collection by Age and Gender
Of the total time spent collecting water, 76% is accounted for by females (Figure 7.1). Over one half (53%) of the total time spent collecting water is accounted for by women over the age of 18. Girls between 5 and 11 account for 10% of the water collection time, and girls between the ages of 12 to 17 account for 13% of the water collection time. About a quarter of the time spent collecting water is accounted for by men (24%). The time costs of water collection are fairly evenly distributed between male age groups, with each group accounting for approximately 8% of the total time spent collecting water. These findings show that below the ages of 18, girls only spent slightly more time collecting water than boys, but above the age of 18 women spend significantly more time collecting water than men.
7.2 HOUSEHOLD WATER CONSUMPTION (LPCD)
7.2.1 How does the installation of handpumps through the MCA RWPIP affect the total amount of water from all sources used by households?
The installation of the MCA handpumps is associated with a statistically insignificant increase of 2.5 LPCD in median water consumption from all sources (p<0.1). When considering total median household water consumption from all sources, the installation of the MCA handpumps is associated with a statistically significant increase of 18.2 liters per day (p<0.01).
Total water consumption takes into account the water households consume during the dry and wet season from all sources – i.e., public taps, handpumps, protected wells, traditional wells, protected springs, non-protected springs, rainwater, and rivers/lakes. The self-reported data were obtained from the household survey during the dry season (from June to July) in both the baseline and follow-up studies. Thus, the dry season data are based on ‘real time’ information, whereas the wet season data are based on recall data.
FIGURE 7.1Time Costs Distribution Across Gender and Age Groups
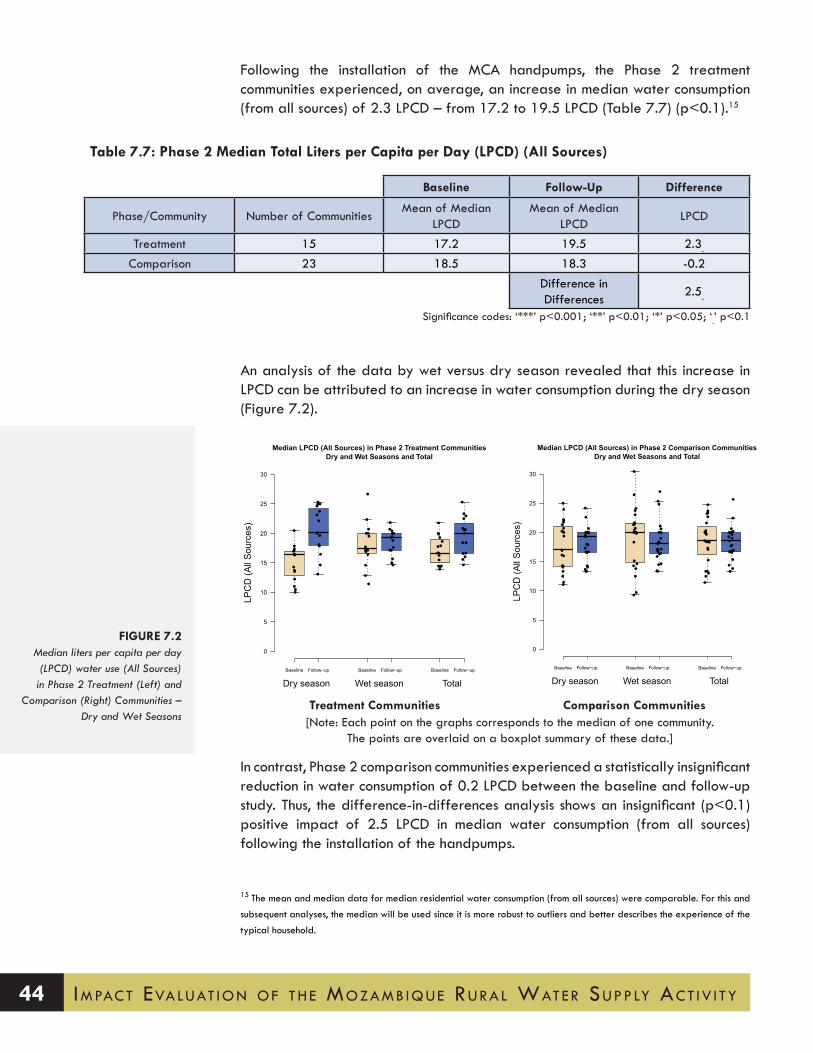
Impact Evaluat Ion of thE mozamb IquE RuRal WatER Supply act Iv I ty 44
Following the installation of the MCA handpumps, the Phase 2 treatment communities experienced, on average, an increase in median water consumption (from all sources) of 2.3 LPCD – from 17.2 to 19.5 LPCD (Table 7.7) (p<0.1).15
An analysis of the data by wet versus dry season revealed that this increase in LPCD can be attributed to an increase in water consumption during the dry season (Figure 7.2).
In contrast, Phase 2 comparison communities experienced a statistically insignificant reduction in water consumption of 0.2 LPCD between the baseline and follow-up study. Thus, the difference-in-differences analysis shows an insignificant (p<0.1) positive impact of 2.5 LPCD in median water consumption (from all sources) following the installation of the handpumps.
15 The mean and median data for median residential water consumption (from all sources) were comparable. For this and
subsequent analyses, the median will be used since it is more robust to outliers and better describes the experience of the
typical household.
Median LPCD (All Sources) in Phase 2 Treatment CommunitiesDry and Wet Seasons and Total
LPC
D (A
ll S
ourc
es)
Baseline Follow−up Baseline Follow−up Baseline Follow−up
0
5
10
15
20
25
30
Dry season Wet season Total
●●
●
●
●
●
●
●
●●
●●
●
●●
●
●
●
●
●
●●
●
●
●●
●
●
●●
●
●
●
●
●
●
●
●
●
●
●
●●
●
●
●
●
●●
●
●
●
●
●
●●
●
●
●●
●
●
●●
●
●
●
●
●
●
●
●
●
●
●
●
●
●
●●
●●●
●
●
●●
●
●
●
Median LPCD (All Sources) in Phase 2 Comparison CommunitiesDry and Wet Seasons and Total
LPC
D (A
ll S
ourc
es)
Baseline Follow−up Baseline Follow−up Baseline Follow−up
0
5
10
15
20
25
30
Dry season Wet season Total
●
●
●
●●
●●
●
●
●
●
●
●
●
●
●
●
●
●
●●
●
●
●
●
●●●
●
●
●
●
●
●
●
●●
●
●●
●
●
●●●●
●
●
●
●
●
●
●
●●
●●
●
●●
●
●
●
●
●
●
●
●
●
●
●
●
●
●
●
●
●
●
●
●
●
●
●
●●
●
●
●
●●
●
●
●
●
●
●
●
●
●
●
●
●
●
●
●
●
● ●
●
●
●
●
●
●
●
●
●
●
●
●
●
●
●
●
●
●
●
●
●
●●●
●
●
●
●
●
●
Treatment Communities Comparison Communities[Note: Each point on the graphs corresponds to the median of one community.
The points are overlaid on a boxplot summary of these data.]
Table 7.7: Phase 2 Median Total Liters per Capita per Day (LPCD) (All Sources)
Baseline Follow-Up Difference
Phase/Community Number of CommunitiesMean of Median
LPCDMean of Median
LPCDLPCD
Treatment 15 17.2 19.5 2.3.
Comparison 23 18.5 18.3 -0.2Difference in Differences
2.5.
Significance codes: ‘***’ p<0.001; ‘**’ p<0.01; ‘*’ p<0.05; ‘.’ p<0.1
FIGURE 7.2Median liters per capita per day (LPCD) water use (All Sources) in Phase 2 Treatment (Left) and
Comparison (Right) Communities – Dry and Wet Seasons

45
However, when considering total median household water consumption from all sources, the installation of the MCA handpumps is associated with a statistically significant increase of 18.2 liters per day (p<0.01) (Table 7.8).
7.2.2 How does the installation of handpumps through the MCA RWPIP affect the total amount of water from improved sources used by households?
Prior to the installation of the MCA handpump, the typical household did not collect any water from an improved source (using the UN-WHO Joint Monitoring Program definitions). Following the installation of the MCA handpump, those communities that received a handpump experienced a statistically significant increase in their median daily water consumption from improved sources of 15.1 LPCD (p<0.001). When considering the total median household consumption of improved water, the installation of the MCA handpump is associated with a statistically significant increase of 58.0 liters per day (p<0.001). Thus, in the communities that received an MCA handpump, 3 out of every 4 buckets of water collected came from an improved source.
Improved sources include handpumps, public taps, rainwater, protected springs, and protected wells. Essentially all (dry season 97%, wet season 98%) of the water from improved sources comes from handpumps.
Following the installation of the MCA handpumps, the Phase 2 treatment communities experienced, on average, a significant increase in median water consumption from improved sources of 15.1 LPCD – from 0.0 to 15.1 LPCD (Table 7.9) (p<0.001). In contrast, the Phase 2 comparison communities experienced a statistically insignificant 1.6 LPCD decline in the consumption of water from an improved source – from 1.8 to 0.2 LPCD.
If we undertake a difference-in-differences analysis in Phase 2 communities, the MCA handpumps can be associated with a significant increase in median water consumption from improved sources of 16.7 LPCD (Table 7.9) (p<0.001). A review of the data by wet versus dry season revealed that the increases in LPCD from improved sources is the result of increased water consumption from improved
Table 7.8: Phase 2 Median Total Liters per Day (LPD) (All Sources)
Baseline Follow-Up Difference
Phase/Community Number of Communities Mean of Median LPD Mean of Median LPD LPD
Treatment 15 65.4 76.5 11.1*Comparison 23 75.6 68.5 -7.1
Difference in Differences
18.2**
Significance codes: ‘***’ p<0.001; ‘**’ p<0.01; ‘*’ p<0.05; ‘.’ p<0.1

Impact Evaluat Ion of thE mozamb IquE RuRal WatER Supply act Iv I ty 46
Median LPCD (Improved Sources) in Phase 2 Treatment CommunitiesDry and Wet Seasons and Total
LPC
D (I
mpr
oved
Sou
rces
)
Baseline Follow−up Baseline Follow−up Baseline Follow−up
0
5
10
15
20
25
30
Dry season Wet season Total
●●●●●●●●●●●●●●●
●
●
●
●●
●
●
●
●
●●
●
●
●
●
●●●●●●●●●●●●●●●
●
●
●
●
●
●
●
●
●
●
●
●
●
●
●
●●●●●●●●●●●●●●●
●
●
●
●
●
●
●
●
●
●
●
●
●
●●
FIGURE 7.3Median LPCD (Improved Sources)
in Phase 2 Treatment Communities - Dry and Wet Seasons
Table 7.10: Phase 2 Median Total Water Use (All Sources) and Improved Liters per Day
Baseline Follow-Up Difference
Phase/CommunityNumber of LPD
CommunitiesMean of Median LPD Mean of Median LPD LPD
Treatment (all sources) 15 65.4 76.5 11.1*Treatment (improved) 15 0.0 58.0 58.0***
Comparison (all sources) 23 75.6 68.5 -7.1Comparison (improved) 23 7.5 1.3 -6.2
Significance codes: ‘***’ p<0.001; ‘**’ p<0.01; ‘*’ p<0.05; ‘.’ p<0.1
Table 7.9: Phase 2 Median Total Liters per Capita per (LPCD) Day from Improved sources
Baseline Follow-Up Difference
Phase/CommunityNumber of LPCD
CommunitiesMean of Median LPCD Mean of Median LPCD LPCD
Treatment 15 0.0 15.1 15.1***Comparison 23 1.8 0.2 -1.6
Difference in Differences 16.7***
Significance codes: ‘***’ p<0.001; ‘**’ p<0.01; ‘*’ p<0.05; ‘.’ p<0.1

47
water sources during both the wet and dry seasons (Figure 7.3).
It is also possible to look at how water consumption changes at the household level, by considering the total liters per day (LPD) of water collected by household members from all and improved sources. Table 7.10 shows that households in Phase 2 treatment communities significantly increased their total median water consumption (from all sources) by 11.1 LPD – from 65.4 to 76.5 LPD (p<0.05). When looking at total median improved water consumption, households in Phase 2 treatment communities significantly increased their water consumption by 58.0 LPD – from 0.0 to 58.0 LPD (p<0.001).
7.2.3 How is the volume of water collected by males, females, adults, and children in the household affected by the installation of the mcA handpumps?
Girls and boys aged 12-17 and women aged 18 and above are primarily responsible for collecting water from the MCA handpumps. These same groups are also responsible for collecting water in communities that did not receive an MCA handpump. In the communities that received an MCA handpump, each of these three groups of water fetchers experienced an increase – ranging between 9% (3.6 liters) to 33% (10 liters) – in the volume of water collected from all sources, with the largest increase being experienced by girls aged 12-17.
In Section 7.2.2, an analysis was undertaken to evaluate the impact of MCA handpumps on water consumption per day (LPD) (see Table 7.10). Using this variable it is possible to explore how the volume of water collected by males, females, adults, and children in the household is affected by the installation of the MCA handpumps.
The analysis in Table 7.11, shows that burdens of water collection fall primarily on females aged 12 and above and boys aged 12-17. At the time of the follow-up study, the typical girl in a treatment community between the ages of 5 and 11 collected 4.3 liters a day, girls between 12-17 years old collected 40 liters, and women above the age of 18 collected 43.6 liters. Other than boys between the ages of 12-17, who collected 33.6 liters per day, the typical male in the other age categories did not collect any water. These distributions are similar across comparison communities (Table 7.11); however, very little of the water in comparison communities is collected from an improved water source.
Between the baseline and follow-up study in Phase 2 treatment communities, the gender and age groups already collecting water all experienced increases in the volumes of water collected. Women above the age of 18 collected approximately 9% (3.6 liters) more water, as compared to girls between the ages of 5-11 and 12-17, who collected about 19% (0.7 liters) and 33% (10 liters) more water, respectively. Boys between the ages of 12-17 increased the amount of water they collected by 24% (6.5 liters) and there was no difference for other male age groups. In the comparison communities (Table 7.12), the same groups of individuals are primarily responsible for water collecting.

Impact Evaluat Ion of thE mozamb IquE RuRal WatER Supply act Iv I ty 48
Table 7.11: Phase 2 Treatment – M
edian Liters per Day (Total) by G
ender and Age G
roup
Female
Male
All
5-1112-17
18+A
ll5-11
12-1718+
LPDn
LPDn
LPDN
LPDn
LPDn
LPDn
LPDn
LPDn
Baseline (all sources)30
7683.6
22630
7840
4640
6900
20927.1
940
387Follow
-up (all sources)38.6
7894.3
23340
10043.6
4560
7680
23533.6
1180
415
Percent Change
29%3%
19%3%
33%28%
9%-2%
-11%
-12%
24%26%
-7%
Baseline (improved)
0768
0226
078
0464
0690
0209
094
0387
Follow-up (im
proved)23.6
7890
23340
10034.3
4560
7680
23530
1180
415Percent C
hangeIN
F3%
-3%
INF
28%IN
F-2%
-11%
-12%
INF
26%-
7%
INF =
Infinity, n = num
ber of people.
Table 7.12: Phase 2 Com
parison – Median Liters per D
ay (Total) by Gender and A
ge Group
Female
Male
All
5-1112-17
18+A
ll5-11
12-1718+
LPDn
LPDn
LPDN
LPDn
LPDn
LPDn
LPDn
LPDn
Baseline (all sources)37.1
11864.6
32940
15447.1
7030
11642.5
39125.7
1260
647
Follow-up (all sources)
34.31246
2.9378
40183
40685
01157
0340
34.3151
0666
Percent Change
-8%5%
-37%15%
0.0%19%
-15%-3%
--1%
-100%-13%
34%20%
-3%
Baseline (improved)
01186
0329
0154
0703
01164
0391
0126
0647
Follow-up (im
proved)0
12460
3780
1830
6850
11570
3400
1510
666Percent C
hange-
5%-
15%-
19%-
-3%-
-1%-
-13%-
20%-
3%
INF =
Infinity, n = num
ber of people.

49
In Phase 2 treatment communities, the typical female aged 12-17 collects the majority of her water (40 liters) from an improved source (the handpump), whereas the typical woman (aged 18 and above) collects around three quarters (34.3 liters) of her water from an improved source. The remainder of her water is collected from traditional (unimproved) sources. The typical boy aged 12-17 also collects the majority of his water from an improved source (30 out of 33.6 liters).
In summary, the girls and boys aged 12-17 and women aged 18 and above collect the vast majority of water from all sources and from improved sources, and these are the same groups that increased their water collection volumes between the baseline and follow-up study in Phase 2 treatment communities.
7.3 TIME SPENT COLLECTING WATER
7.3.1 How does the installation of handpumps through the MCA RWPIP affect the time costs of water collection?
Following the installation of the MCA handpumps there was an 88-minute decline in the time households spent collecting water from all sources, but this decline was statistically insignificant. A more refined analysis revealed that the installation of the MCA handpumps can be associated with a statistically significant 62-minute reduction in the median roundtrip time to the ‘primary’ source (p<0.05). Further, the impact was found to be greater during the dry season, when households experienced a statistically significant 129-minute decline in the median roundtrip time (p<0.05).
An analysis of the wait time at the primary source revealed a statistically significant decline of 41 minutes when comparing the treatment and comparison communities (p<0.05). Again, the impact was more pronounced during the dry season, when the wait time at the primary source declined by 57 minutes (p<0.01).
When considering the median time costs of collecting 20 liters of water, a statistically significant decline of 42 minutes was observed in communities that received a handpump (p<0.05). Thus, while there was no statistically significant change in the total amount of time spent collecting water, there was a significant reduction in the time spent collecting each 20 liters of water. This finding implies that following the installation of the MCA handpumps, households were able to collect more water in less time (although the time savings were not statistically significant).
As with the water volume data, the time spent collecting water was obtained from self-reported data in the household survey that was administered during the dry season (from June to July) in both the baseline and follow-up studies. Thus, the dry season data are based on ‘real time’ information, whereas the wet season data are based on recall data.
Table 7.13 shows that the median total minutes per day (MPD) that households spend collecting water (from all sources) in Phase 2 treatment communities declined by a statistically insignificant 48 minutes – from 272 (4.5 hours) to 225 (3.75 hours) – from the baseline to follow-up study.

Impact Evaluat Ion of thE mozamb IquE RuRal WatER Supply act Iv I ty 50
If we undertake a difference-in-differences analysis in Phase 2 communities, the MCA handpumps can be associated with a statistically insignificant 88-minute (1.5-hour) reduction in the time households spend fetching water each day. Just under one half of this value is due to an increase in the median minutes per day that households in Phase 2 comparison communities spend fetching water – i.e., from 256 (4.3 hours) to 296 (4.9 hours).
Figure 7.4 presents the median minutes per day that households in Phase 2 treatment (left) and comparison (right) communities spend collecting water in the dry and wet season. The graph on the left shows a slight reduction in MPD during the dry season and slight increase in MPD during the wet season in the treatment communities. In contrast, the graph on the rights shows a consistent increase in MPD in both the dry and wet seasons in the comparison communities.
While the above data considers the daily time spent collecting water from all sources, a more detailed analysis was undertaken of the time spent collecting
Table 7.13: Phase 2 Median Total Minutes Per Day (MPD) Spent Collecting Water (All Sources) by Household
Baseline Follow-Up Difference
Phase/CommunityNumber of
CommunitiesMean of Median MPD Mean of Median MPD MPD
Treatment 15 272 225 -48
Comparison 23 256 296 40
Difference in Differences -88
Significance codes: ‘***’ p<0.001; ‘**’ p<0.01; ‘*’ p<0.05; ‘.’ p<0.1
FIGURE 7.4Median Total Minutes Per
Day (MPD) Spent Collecting Water (All Sources) in Phase 2
Treatment (Left) and Comparison (Right) Communities - Dry and
Wet Seasons
Treatment Communities Comparison Communities[Note: Each point on the graphs corresponds to the median of one community.
The points are overlaid on a boxplot summary of these data.]

51
water from a household’s primary source.16
Table 7.14 shows that the median roundtrip time that households spend collecting water from a primary source in Phase 2 treatment communities declined by a statistically significant 85 minutes – from 161 (2.7 hours) to 76 (1.3 hours) – from the baseline to follow-up study (p<0.01). In contrast, households in Phase 2 comparison communities experienced a statistically insignificant decline of 23 minutes from the baseline to follow-up study. The difference-in-differences analysis of the median roundtrip time that households spend collecting water from a primary source revealed a statistically significant decline of 62 minutes (1 hour) from the baseline to follow-up study (p<0.05).
Tables 7.15 and 7.16 present the roundtrip time that households spend collecting water from the primary source during the dry and wet season, respectively. Table 7.15 shows that the installation of the MCA handpumps can be associated with a statistically significant decline of 129 minutes in the roundtrip time to the primary source during the dry season (p<0.05). While a decline of 36 minutes was found during the wet season, it is not statistically significant.
The total time households spend collecting water from a source is obtained from the household survey respondent’s estimate of the one-way walk time to a source and the time spent waiting at a source. Table 7.17 shows that Phase 2 treatment
16 The water module in the household survey was structured to obtain data on a household’s primary, secondary, and
tertiary water sources. The same sequence of questions was asked for each water source and data were collected on
water fetching during both the wet and dry seasons.
Table 7.14: Phase 2 Median Roundtrip Time to Primary Source
Baseline Follow-Up Difference
Phase/CommunityNumber of
CommunitiesMean of Median Time
(Minutes)Mean of Median Time
(Minutes)Minutes
Treatment 15 161 76 -85**Comparison 23 137 114 -23
Difference in Differences -62*Significance codes: ‘***’ p<0.001; ‘**’ p<0.01; ‘*’ p<0.05; ‘.’ p<0.1
Table 7.15: Phase 2 Median Roundtrip Time to Primary source During the dry Season
Baseline Follow-Up Difference
Phase/CommunityNumber of
CommunitiesMean of Median Time
(Minutes)Mean of Median Time
(Minutes)Minutes
Treatment 15 261 100 -161**Comparison 23 178 146 -32
Difference in Differences -129*Significance codes: ‘***’ p<0.001; ‘**’ p<0.01; ‘*’ p<0.05; ‘.’ p<0.1

Impact Evaluat Ion of thE mozamb IquE RuRal WatER Supply act Iv I ty 52
communities experience a statistically significant 22-minute decline in the one-way walk time to the primary source from the baseline to follow-up study (p<0.01). The comparison communities experience a statistically significant 11-minute decline over the same period (p<0.05).
An analysis was also undertaken of the median one-way walk times during the dry and wet seasons. The analysis found that the dry season one-way walk times to primary sources significantly decreased by 53 minutes from the baseline to the follow-up in the Phase 2 treatment communities (p<0.05). Phase 2 comparison communities also saw a significant decrease in dry season time to a primary source of 16 minutes (p<0.01). These changes led to an insignificant difference-in-differences of -37 minutes in travel time to the primary source during the dry season for Phase 2 treatment communities when compared with Phase 2 comparison communities. There was also a statistically significant decrease in the one-way walk times to primary sources during the wet season in the Phase 2 treatment (-22 minutes, p<0.01) and comparison communities (-12 minutes, p<0.05). These changes led to a statistically insignificant difference-in-differences of -9 minutes in travel time to the primary source during the wet season for Phase 2 treatment communities over Phase 2 comparison communities.
When considering the median time spent waiting for water at the primary source
Table 7.16: Phase 2 Median Roundtrip Time to Primary Source During the Wet Season
Baseline Follow-Up Difference
Phase/CommunityNumber of
CommunitiesMean of Median Time
(Minutes)Mean of Median Time
(Minutes)Minutes
Treatment 15 120 53 -67*Comparison 23 115 84 -31*
Difference in Differences -36Significance codes: ‘***’ p<0.001; ‘**’ p<0.01; ‘*’ p<0.05; ‘.’ p<0.1
Table 7.17: Phase 2 Median One-way Walk Time to Primary source
Baseline Follow-Up Difference
Phase/CommunityNumber of
CommunitiesMean of Median Time
(Minutes)Mean of Median Time
(Minutes)Minutes
Treatment 15 44 22 -22**
Comparison 23 45 34 -11*Difference in Differences -11
Significance codes: ‘***’ p<0.001; ‘**’ p<0.01; ‘*’ p<0.05; ‘.’ p<0.1

53
(Table 7.18), Phase 2 treatment communities experienced a statistically significant 44-minute decline in wait time from the baseline to follow-up study (p<0.05). In contrast, there was essentially no change (-2 minutes) in wait time at the primary source in the comparison communities. The difference-in-differences analysis of wait time at the primary source revealed a statistically significant 41-minute reduction in waiting time for Phase 2 treatment communities when compared to comparison communities (p<0.05).
As before, an analysis was undertaken of the median wait times at the primary source by season. The analysis found that the dry season wait times at primary sources significantly decreased by 58 minutes from the baseline to the follow-up study in Phase 2 treatment communities (p<0.01). However, for Phase 2 comparison communities there was an insignificant decrease of 1 minute in the dry season wait times at the primary sources. Therefore, a significant difference-in-differences of -57 minutes was observed for dry season primary source wait times (p<0.01). There was also a statistically significant decrease in the wait times at primary sources during the wet season in the Phase 2 treatment communities (-25 minutes, p<0.05), but an insignificant change in the comparison communities (-8 minutes, p>0.1). These changes led to a statistically insignificant difference-in-differences of -17 minutes in wait time at the primary source during the wet season for Phase 2 treatment communities over Phase 2 comparison communities.
Whereas the minutes per day variable provides a general indication of the total amount of time households spend fetching water, it does not provide an indication of how much water is collected during this timeframe. For example, one person could spend three hours a day collecting one 20 liter bucket of water or could collect three buckets of water in the same time if the water source is located near to the household. In both scenarios, the total MPD would be a value of 180. By holding the volume of water collected constant, it is possible to explore the different times that households invest in fetching a typical bucket of water (i.e., 20 liters).
Table 7.19 shows that the median time to collect 20 liters in Phase 2 treatment communities declines significantly by 42 minutes (0.7 hours) – from 104 minutes
Table 7.18: Phase 2 Median Time Spent Waiting at Primary Source
Baseline Follow-Up Differencea
Phase/CommunityNumber of
CommunitiesMean of Median Time
(Minutes)Mean of Median Time
(Minutes)Minutes
Treatment 15 74 31 -44*Comparison 23 47 44 -2
Difference in Differences -41*Significance codes: ‘***’ p<0.001; ‘**’ p<0.01; ‘*’ p<0.05; ‘.’ p<0.1
a Discrepancy in values due to rounding.

Impact Evaluat Ion of thE mozamb IquE RuRal WatER Supply act Iv I ty 54
(1.7 hours) to 62 minutes (1 hour) (p<0.05) – following the installation of the MCA handpumps. However, for households in the Phase 2 comparison communities, the time spent collecting 20 liters of water increased slightly from 86 to 99 minutes (1.7 hours).
Figure 7.5 presents the same data by dry and wet season. The graph on the left shows a significant reduction in the median time households in treatment communities spend collecting 20 liters of water in both seasons. In contrast, the graph on the right shows no significant change in the comparison communities.
Whereas the above analysis deduces the time savings by comparing the stated times spent collecting water, the household respondents were also asked during the follow-up study whether they felt they spend less time collecting water, and, if so, how they spend this time. The possible time-use categories were: rest; spend time with family; earn income; work in the field; take care of livestock; collect more water; collect firewood; tend to other domestic chores; and other. Table 7.20 shows that 10.8% of households in the Phase 2 treatment communities reported spending less time collecting water and using the freed time to rest. A comparable percentage stated that they spent their freed time with their family
Treatment Communities Comparison Communities[Note: Each point on the graphs corresponds to the median of one community.
The points are overlaid on a boxplot summary of these data.]
Table 7.19: Phase 2 Median Minutes To Collect 20 Liters of Water (All Sources)
Baseline Follow-Up Difference
Phase/CommunityNumber of
CommunitiesMean of Median MPD Mean of Median MPD MPD
Treatment 15 104 62 -42*Comparison 23 86 99 13
Difference in Differences -55**
Significance codes: ‘***’ p<0.001; ‘**’ p<0.01; ‘*’ p<0.05; ‘.’ p<0.1
FIGURE 7.5Median Total Minutes Per Day
(MPD) Spent Collecting 20 Liters of Water (All Sources) in Phase 2 Treatment (Left) and Comparison
(Right) Communities - Dry and Wet Seasons
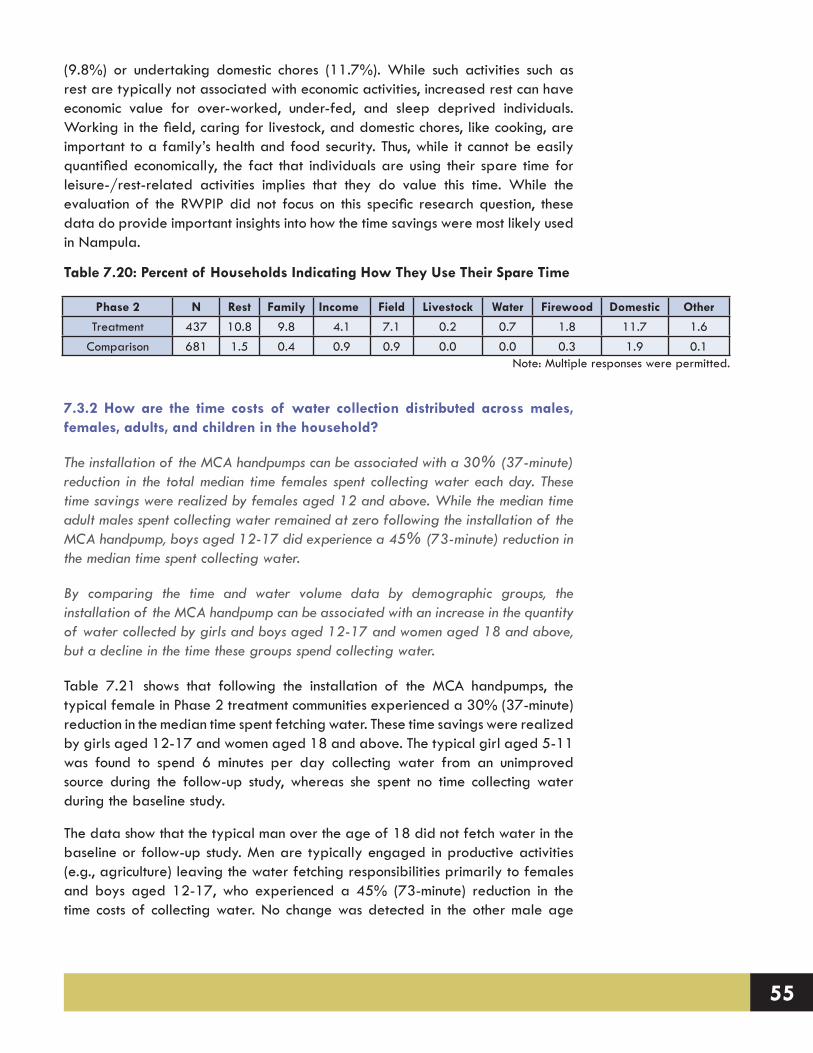
55
(9.8%) or undertaking domestic chores (11.7%). While such activities such as rest are typically not associated with economic activities, increased rest can have economic value for over-worked, under-fed, and sleep deprived individuals. Working in the field, caring for livestock, and domestic chores, like cooking, are important to a family’s health and food security. Thus, while it cannot be easily quantified economically, the fact that individuals are using their spare time for leisure-/rest-related activities implies that they do value this time. While the evaluation of the RWPIP did not focus on this specific research question, these data do provide important insights into how the time savings were most likely used in Nampula.
7.3.2 How are the time costs of water collection distributed across males, females, adults, and children in the household?
The installation of the MCA handpumps can be associated with a 30% (37-minute) reduction in the total median time females spent collecting water each day. These time savings were realized by females aged 12 and above. While the median time adult males spent collecting water remained at zero following the installation of the MCA handpump, boys aged 12-17 did experience a 45% (73-minute) reduction in the median time spent collecting water.
By comparing the time and water volume data by demographic groups, the installation of the MCA handpump can be associated with an increase in the quantity of water collected by girls and boys aged 12-17 and women aged 18 and above, but a decline in the time these groups spend collecting water.
Table 7.21 shows that following the installation of the MCA handpumps, the typical female in Phase 2 treatment communities experienced a 30% (37-minute) reduction in the median time spent fetching water. These time savings were realized by girls aged 12-17 and women aged 18 and above. The typical girl aged 5-11 was found to spend 6 minutes per day collecting water from an unimproved source during the follow-up study, whereas she spent no time collecting water during the baseline study.
The data show that the typical man over the age of 18 did not fetch water in the baseline or follow-up study. Men are typically engaged in productive activities (e.g., agriculture) leaving the water fetching responsibilities primarily to females and boys aged 12-17, who experienced a 45% (73-minute) reduction in the time costs of collecting water. No change was detected in the other male age
Table 7.20: Percent of Households Indicating How They Use Their Spare Time
Phase 2 N Rest Family Income Field Livestock Water Firewood Domestic Other
Treatment 437 10.8 9.8 4.1 7.1 0.2 0.7 1.8 11.7 1.6Comparison 681 1.5 0.4 0.9 0.9 0.0 0.0 0.3 1.9 0.1
Note: Multiple responses were permitted.

Impact Evaluat Ion of thE mozamb IquE RuRal WatER Supply act Iv I ty 56
Table 7.21: Phase 2 Treatment – M
edian Total Minutes per D
ay (MPD
) Spent Fetching Water by G
ender and Age
Group
Female
Male
All
5-1112-17
18+A
ll5-11
12-1718+
MPD
nM
PDn
MPD
nM
PDn
MPD
nM
PDn
MPD
nM
PDn
Baseline (all sources)125
5730
187147
55195
3310
6080
189161
720
347
Follow-up (all sources)
88703
6219
10690
125394
0714
0215
88106
0393
Percent Change
-30%23%
Inf17%
-28%64%
-36%19%
-17%
-14%
-45%47%
-13%
Baseline (improved)
0573
0187
055
0331
0608
0189
072
0347
Follow-up (im
proved)50
7030
21989
9080
3940
7140
21572
1060
393Percent C
hangeInf
23%-
17%Inf
64%Inf
19%-
17%-
14%Inf
47%-
13%IN
F = Infinity, n =
number of people.
Table 7.22: Phase 2 Com
parison – Median Total M
inutes per Day (M
PD) Spent Fetching W
ater by Gender and A
ge G
roup
Female
Male
All
5-1112-17
18+A
ll5-11
12-1718+
MPD
nM
PDn
MPD
nM
PDn
MPD
nM
PDn
MPD
nn
Baseline (all sources)120
94318.3
282149
119160
5420
10250
34099
1000
585
Follow-up (all sources)
1301040
0331
183146
164563
01071
0317
124125
0629
Percent Change
8%10%
-100%17%
23%23%
3%4%
-5%
--7%
25%25%
-8%
Baseline (improved)
0943
0282
0119
0542
01025
0340
0100
0585
Follow-up (im
proved)0
10400
3310
1460
5630
10710
3170
1250
629Percent C
hange-
10%-
17%-
23%-
4%-
5%-
-7%-
25%-
8%IN
F = Infinity, n =
number of people.

57
categories.
When these data are compared with those presented in Section 7.2.3, the installation of the MCA handpumps can be associated with an increase in the quantity of water collected by girls and boys aged 12-17 and women aged 18 and above, but a decline in the time these groups spend collecting water. In contrast, women in Phase 2 comparison communities were found to spend more time collecting water in the follow-up study than in the baseline (Table 7.22).
7.3.3 How does the use of alternative indicators of distance affect the estimated time cost of water fetching?
The time cost of water fetching was estimated using walk and queue time values as reported by survey respondents. This is common practice in the water supply literature. We explored the effect of using alternative approaches to estimating time costs that are increasingly possible because of the availability of satellite imagery. For example, using satellite imagery it was possible to estimate both route and straight-line (Euclidean) distances between 1,103 sample households in the baseline study and their primary water source. We assumed that route distance is the most valid indicator of the time cost of water fetching and compared those values to both self-reported data and straight-line estimates. We found that straight-line distance is a good proxy for route distance (R2 = 0.98), although it under-estimates route distance by 22% on average. By contrast, self-reported travel time is a poor proxy for route distance (R2 = 0.12), with no systematic bias (over- or under-estimation) observed in the data. Using these two indicators also leads to considerable differences in estimated time costs of water fetching. For example, the average one-way travel time to the primary water point was found to be 48.5 min (SD = 53.2 min) using self-reported data, as compared to 14.8 min (SD = 15.8 min) when calculated from route distance with walking paces found in the literature. In future evaluations it may be useful to devote additional effort and resources toward testing alternative time-cost indicators against field-based observations (e.g., timing of respondents after collecting self-reported walk and queue time values).
A manuscript describing this study is published in the Journal of Water & Health.
Sample Frame and Methodology
Data used in this analysis were collected during the 2011 baseline study. Enumerators followed randomly determined transects within each of the 54 sample communities and selected every second or third household to be interviewed. Each respondent was asked to identify the primary water source used by his/her household at the time of survey, and enumerators took GPS coordinates of each sampled household and all shared water points in each study community. Among sampled households, 503 (31%) reported using a primary water source other than a community water point, and/or a source for which GPS coordinates were not obtained. Given the objectives of this study, these households were removed
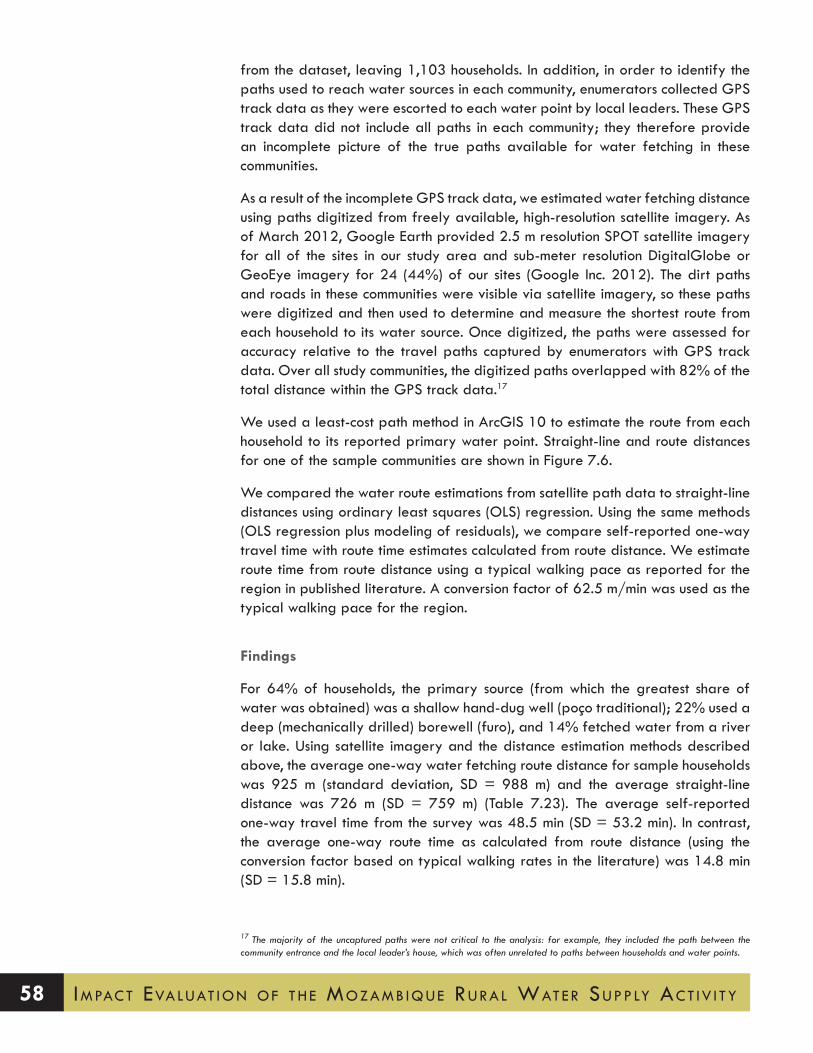
Impact Evaluat Ion of thE mozamb IquE RuRal WatER Supply act Iv I ty 58
from the dataset, leaving 1,103 households. In addition, in order to identify the paths used to reach water sources in each community, enumerators collected GPS track data as they were escorted to each water point by local leaders. These GPS track data did not include all paths in each community; they therefore provide an incomplete picture of the true paths available for water fetching in these communities.
As a result of the incomplete GPS track data, we estimated water fetching distance using paths digitized from freely available, high-resolution satellite imagery. As of March 2012, Google Earth provided 2.5 m resolution SPOT satellite imagery for all of the sites in our study area and sub-meter resolution DigitalGlobe or GeoEye imagery for 24 (44%) of our sites (Google Inc. 2012). The dirt paths and roads in these communities were visible via satellite imagery, so these paths were digitized and then used to determine and measure the shortest route from each household to its water source. Once digitized, the paths were assessed for accuracy relative to the travel paths captured by enumerators with GPS track data. Over all study communities, the digitized paths overlapped with 82% of the total distance within the GPS track data.17
We used a least-cost path method in ArcGIS 10 to estimate the route from each household to its reported primary water point. Straight-line and route distances for one of the sample communities are shown in Figure 7.6.
We compared the water route estimations from satellite path data to straight-line distances using ordinary least squares (OLS) regression. Using the same methods (OLS regression plus modeling of residuals), we compare self-reported one-way travel time with route time estimates calculated from route distance. We estimate route time from route distance using a typical walking pace as reported for the region in published literature. A conversion factor of 62.5 m/min was used as the typical walking pace for the region.
Findings
For 64% of households, the primary source (from which the greatest share of water was obtained) was a shallow hand-dug well (poço traditional); 22% used a deep (mechanically drilled) borewell (furo), and 14% fetched water from a river or lake. Using satellite imagery and the distance estimation methods described above, the average one-way water fetching route distance for sample households was 925 m (standard deviation, SD = 988 m) and the average straight-line distance was 726 m (SD = 759 m) (Table 7.23). The average self-reported one-way travel time from the survey was 48.5 min (SD = 53.2 min). In contrast, the average one-way route time as calculated from route distance (using the conversion factor based on typical walking rates in the literature) was 14.8 min (SD = 15.8 min).
17 The majority of the uncaptured paths were not critical to the analysis: for example, they included the path between the community entrance and the local leader’s house, which was often unrelated to paths between households and water points.
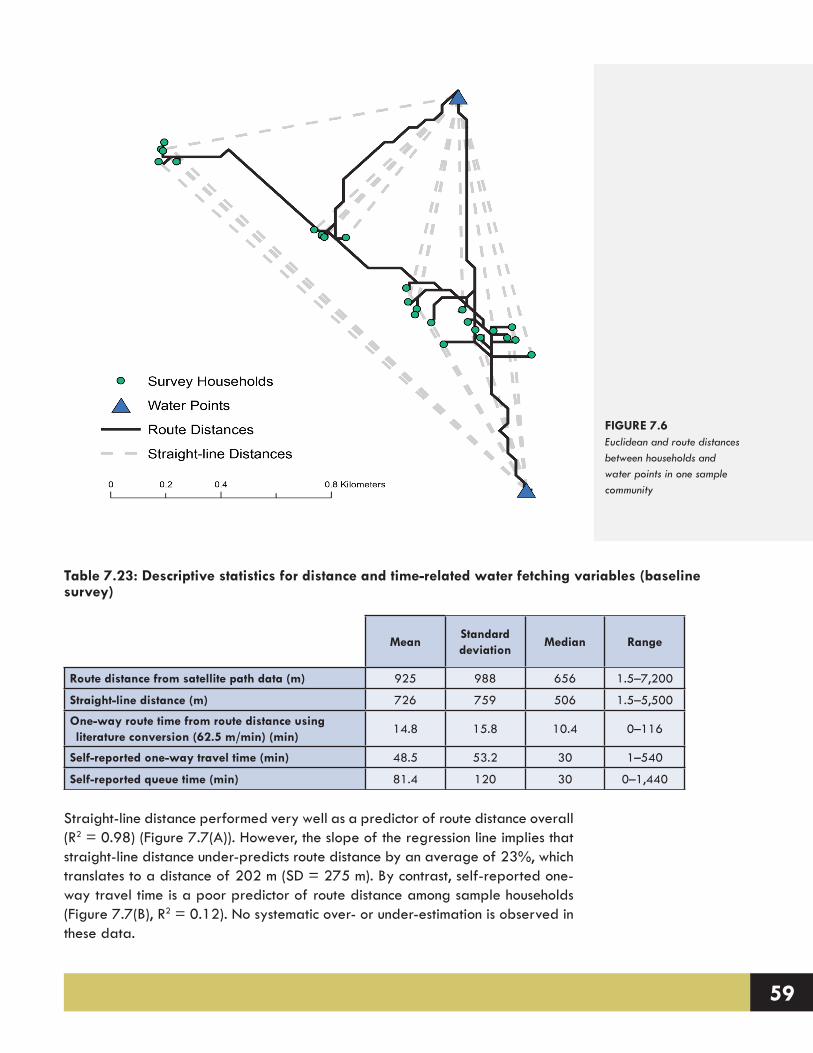
59
Straight-line distance performed very well as a predictor of route distance overall (R2 = 0.98) (Figure 7.7(A)). However, the slope of the regression line implies that straight-line distance under-predicts route distance by an average of 23%, which translates to a distance of 202 m (SD = 275 m). By contrast, self-reported one-way travel time is a poor predictor of route distance among sample households (Figure 7.7(B), R2 = 0.12). No systematic over- or under-estimation is observed in these data.
FIGURE 7.6Euclidean and route distances between households and water points in one sample community
Table 7.23: Descriptive statistics for distance and time-related water fetching variables (baseline survey)
MeanStandard deviation
Median Range
Route distance from satellite path data (m) 925 988 656 1.5–7,200
Straight-line distance (m) 726 759 506 1.5–5,500
One-way route time from route distance using literature conversion (62.5 m/min) (min)
14.8 15.8 10.4 0–116
Self-reported one-way travel time (min) 48.5 53.2 30 1–540
Self-reported queue time (min) 81.4 120 30 0–1,440
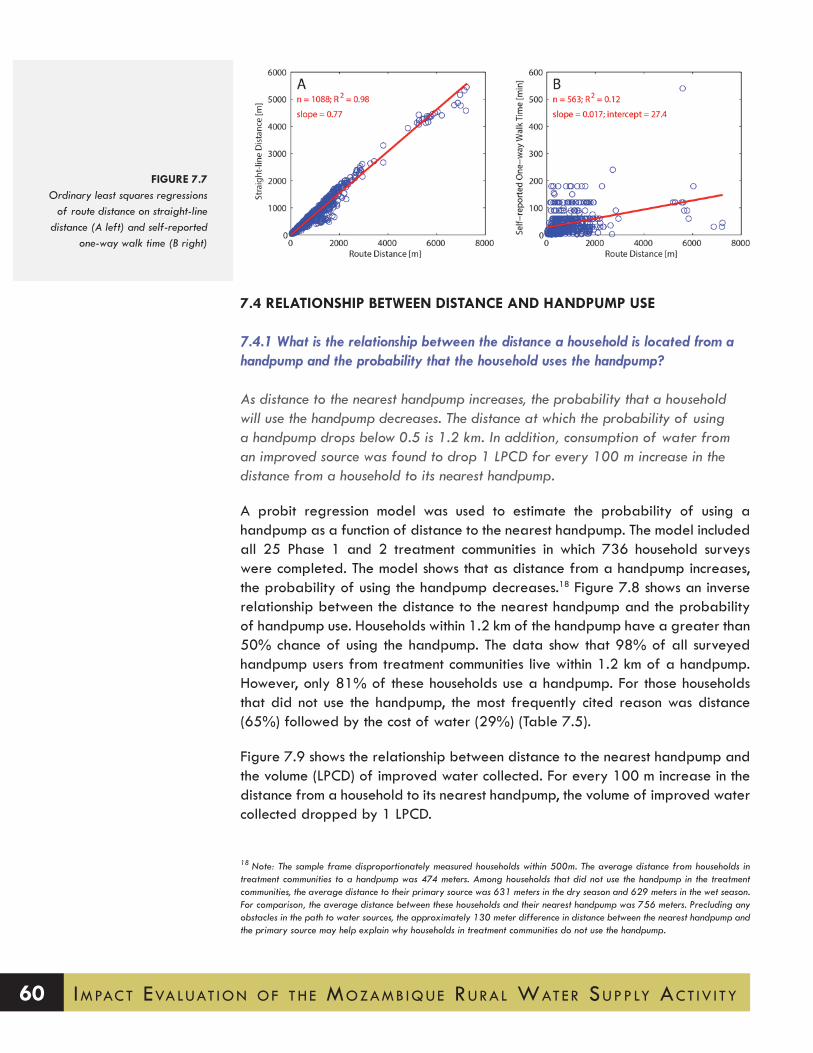
Impact Evaluat Ion of thE mozamb IquE RuRal WatER Supply act Iv I ty 60
7.4 RELATIONSHIP BETWEEN DISTANCE AND HANDPUMP USE
7.4.1 what is the relationship between the distance a household is located from a handpump and the probability that the household uses the handpump?
As distance to the nearest handpump increases, the probability that a household will use the handpump decreases. The distance at which the probability of using a handpump drops below 0.5 is 1.2 km. In addition, consumption of water from an improved source was found to drop 1 LPCD for every 100 m increase in the distance from a household to its nearest handpump.
A probit regression model was used to estimate the probability of using a handpump as a function of distance to the nearest handpump. The model included all 25 Phase 1 and 2 treatment communities in which 736 household surveys were completed. The model shows that as distance from a handpump increases, the probability of using the handpump decreases.18 Figure 7.8 shows an inverse relationship between the distance to the nearest handpump and the probability of handpump use. Households within 1.2 km of the handpump have a greater than 50% chance of using the handpump. The data show that 98% of all surveyed handpump users from treatment communities live within 1.2 km of a handpump. However, only 81% of these households use a handpump. For those households that did not use the handpump, the most frequently cited reason was distance (65%) followed by the cost of water (29%) (Table 7.5).
Figure 7.9 shows the relationship between distance to the nearest handpump and the volume (LPCD) of improved water collected. For every 100 m increase in the distance from a household to its nearest handpump, the volume of improved water collected dropped by 1 LPCD.
18 Note: The sample frame disproportionately measured households within 500m. The average distance from households in treatment communities to a handpump was 474 meters. Among households that did not use the handpump in the treatment communities, the average distance to their primary source was 631 meters in the dry season and 629 meters in the wet season. For comparison, the average distance between these households and their nearest handpump was 756 meters. Precluding any obstacles in the path to water sources, the approximately 130 meter difference in distance between the nearest handpump and the primary source may help explain why households in treatment communities do not use the handpump.
FIGURE 7.7Ordinary least squares regressions
of route distance on straight-line distance (A left) and self-reported
one-way walk time (B right)

61
7.5 SCHOOLING
7.5.1 How does the installation of handpumps through the mcA RwPIP affect school attendance for girls and boys?
The installation of the MCA handpumps can be associated with a statistically sig-nificant 17.5% reduction in the mean percentage of households stating that water fetching negatively affects the school attendance of their children (p<0.01). To put this in perspective, for a group of 100 households in treatment communities (which had an average of 154 school age children), the introduction of an MCA handpump corresponds to 27 fewer children whose school attendance is negatively affected by water fetching.
FIGURE 7.8Relationship between Probability of Using a Handpump and Distance to Nearest Handpump in Phase 2 Treatment Communities
[Note: Eash point on the graph correspond to a household using (probability of 1.0) or not using (probability of 0.0) a handpump]
FIGURE 7.9Relationship between Distance to Nearest Handpump and Improved LPCD in Phase 2 Treatment Communities

Impact Evaluat Ion of thE mozamb IquE RuRal WatER Supply act Iv I ty 62
In the household survey, respondents were asked whether their child’s school attendance was affected by water fetching. If a respondent replied that water fetching ‘frequently’ or ‘sometimes’ affected school attendance, the school attendance of the children of the household was considered to be negatively affected by water collection activities.
Table 7.24 shows that following the installation of the MCA handpumps, the mean percentage of households in the Phase 2 treatment communities reporting that water fetching affected their children’s school attendance significantly declined by 19.6% – from 26.7% to 7.1% (p<0.01).
If we undertake a difference-in-differences analysis in Phase 2 communities, the MCA handpumps can be associated with a statistically significant 17.5% reduc-tion in the mean percentage of households reporting that water fetching af-fected their children’s school attendance (p<0.01).
7.6 SANITATION
7.6.1 How does the installation of handpumps through the MCA RWPIP affect sanitation and hygiene practices?
The MCA intervention can be associated with a 7.5% increase in the average num-ber of households reporting that they use a traditional pit latrine, but this finding is not statistically significant (p<0.1). Similarly, the MCA intervention can be associ-ated with a statistically insignificant 0.1 increase in the median number of times the respondents reported washing their hands.
In addition to receiving training on how to manage and maintain the MCA hand-pump, the water committees in the treatment communities also received sanita-tion and hygiene education from Cowater to promote the construction of latrines and handwashing facilities, and enhance knowledge relating to hygienic prac-
Table 7.24: Phase 2 Mean Percentage of Households (HHs) Stating that Water Fetching Affects School Attendance
Baseline Follow-Up Difference
Phase/CommunityNumber of
Communities
Mean % HHs Stating that Water Fetching
Affects School Attendance
Mean % HHs Stating that Water Fetching
Affects School Attendance
Change in Percentage
Treatment 15 26.7% 7.1% -19.6%**Comparison 23 16.8% 14.7% -2.1%
Difference in Differences -17.5%**Significance codes: ‘***’ p<0.001; ‘**’ p<0.01; ‘*’ p<0.05; ‘.’ p<0.1

63
tices around households, schools, health centers, and markets.
With regards to latrine use, household survey respondents were asked what type of sanitation system the adults in the household use. If the respondent stated that adults use a flush toilet, ventilated improved pit latrine (VIP), pit latrine with concrete slab, composting toilet, improved traditional latrine, or traditional pit latrine, the household was classified as using a ‘latrine.’ Other options included open defecation or defecating in the ground and covering the feces with soil, known locally as ‘sistema do gato’ (meaning the ‘cat system’). Table 7.25 provides a summary of the sanitation options used by households in Phase 2 treatment and comparison communities for the baseline and follow-up studies. The table only includes the sanitation options that were used by more than 3% of households. The table shows that in Phase 2 treatment communities there was a 10% reduction in the percent of households that either defecated in the open or used the ‘cat system’ between the baseline and follow-up studies. Similarly, there was 10% increase in the percent of households that were using a traditional pit latrine, which was one of the options promoted in the sanitation and hygiene training. The table also shows that no significant changes occurred in the sanitation practices of households in Phase 2 comparison communities.
A difference-in-differences analysis of the sanitation practices in Phase 2 treatment and comparison communities indicates that the MCA intervention can be associated with a statistically insignificant 7.5% increase in the average number of households using traditional pit latrines (Table 7.26) (p<0.1).19
Table 7.25: Percent of Households in Phase 2 Treatment and Comparison Communities Using Sanitation System (for Baseline and Follow-up)
Phase 2 Treatment Phase 2 Comparison
Baseline Follow-up Baseline Follow-up
Traditional pit latrine 20.3% 30.7% 16.1% 17.8%Cat system 56.9% 35.0% 54.3% 52.7%Open defecation 19.8% 32.0% 28.4% 28.7%
Table 7.26: Phase 2 Percentage of Households Using Latrines
Baseline Follow-Up Difference
Phase/CommunityNumber of
Communities% HHs Using Latrine % HHs Using Latrine Change in Percentage
Treatment 15 23.2% 32.8% 9.6%**Comparison 23 16.2% 18.3% 2.1%
Difference in Differences
7.5%.
Significance codes: ‘***’ p<0.001; ‘**’ p<0.01; ‘*’ p<0.05; ‘.’ p<0.1

Impact Evaluat Ion of thE mozamb IquE RuRal WatER Supply act Iv I ty 64
When considering handwashing behavior, respondents in Phase 2 treatment communities had a statistically insignificant increase in the median number of times per day they washed their hands by 0.2 (Table 7.27). The difference-in-differences analysis shows that the MCA handpumps can be associated with a statistically insignificant increase in handwashing by 0.1 times per day.
When respondents were asked whether they were satisfied with their current sanitation situation, there was a consistent statistically significant positive increase in satisfaction from the baseline to the follow-up study (Table 7.28). Satisfaction increased by 21.5% in Phase 2 treatment communities (p<0.05) and by 13% in comparison communities (p<0.05). The difference-in-differences analysis shows a statistically insignificant impact of 8.5%. The primary reasons that households were not satisfied with their sanitation situation were that they did not have a latrine in their household compound or the latrine was far away, and/or their existing latrine was unsanitary (i.e., smelled bad and/or had flies).
Table 7.27: Phase 2 Median Number of Times Per Day Respondent Reported Washing Hands
Baseline Follow-Up Difference
Phase/Community Number of CommunitiesNumber of Times Washing
HandsNumber of Times Washing
HandsChange
Treatment 15 3.7 3.9 0.2Comparison 23 4.0 4.1 0.1
Difference in Differences 0.1Significance codes: ‘***’ p<0.001; ‘**’ p<0.01; ‘*’ p<0.05; ‘.’ p<0.1
Table 7.28: Phase 2 Percentage of Households Indicating Satisfaction with Sanitation Situation
Baseline Follow-Up Difference
Phase/Community Number of Communities% HHs Satisfied with Sanitation Situation
% HHs Satisfied with Sanitation Situation
Change in Percentage
Treatment 15 42.0% 63.5% 21.5%*Comparison 23 46.9% 59.9% 13.0%*
Difference in Differences
8.5%
Significance codes: ‘***’ p<0.001; ‘**’ p<0.01; ‘*’ p<0.05; ‘.’ p<0.1
19 An analysis of the eight Phase 2 comparison communities that had no external sanitation training and no documented contact with Cowater or MCA shows that latrine use in these communities was very similar to latrine use in the other Phase 2 comparison communities. Mean latrine use in these eight communities increased from 16% of households in the baseline to 20% in the follow-up. This comparison implies that the external hygiene and sanitation interventions in communities that did not receive an MCA handpump had a limited impact in terms of the variables measured.

65
7.7 WATER QUALITY
7.7.1 How does the installation of handpumps through the mcA RwPIP affect the microbiological quality of water supplies being used by households?
Microbiological quality of samples collected at water sources and from water storage containers in sample households was evaluated by testing for fecal indicator bacteria (FIB). Drinking water quality standards in Mozambique are based on World Health Organization (WHO) guidelines, and specify that water for human consumption should have no detectable FIB in a 100-mL sample (MISAU, 2004). Our analysis makes use of previously published WHO guidelines for water supply in rural settings and assumes that water with up to 10 colony forming units (CFU) of E. coli per 100-mL sample poses “low” health risk; concentrations of 11-100 CFU/100mL carry “moderate” risk; and water with E. coli concentrations greater than 100 CFU/100mL is “high” risk. For vulnerable groups (e.g., young children, elderly, and immunocompromised persons), even low levels of contamination are considered risky. Overall, FIB concentration was found to be significantly lower in water samples collected from MCA handpumps as compared to other types of water sources. None of the handpump samples had a high level of contamination, as compared to 39% of traditional wells and 71% of surface sources. Similarly, the quality of stored household drinking water that was obtained from an MCA handpump was significantly better than stored water obtained from traditional sources. The typical handpump sample had a low level of contamination (8.4 CFU/100mL) while the typical sample from other sources had 43 CFU/100mL. Because not all households in treatment communities obtain drinking water from MCA handpumps, however, no significant difference in the quality of stored drinking water was found at the community level between treatment and comparison communities.
Sample Frame and Methodology
Drinking water quality standards in Mozambique are based on World Health Organization (WHO) guidelines, and specify that water delivered for human consumption should have no detectable fecal coliform in a 100-mL sample (MISAU, 2004). E. coli is one group of fecal coliforms that is widely used for water quality testing. Previously published WHO guidelines for water supply in rural settings were based on three levels of E. coli contamination (WHO 1997). For healthy adults, water with up to 10 colony forming units (CFU) of E. coli per 100-mL sample was generally considered to pose “low” health risk; concentrations of 11-100 CFU/100mL carried “moderate” risk; and water with E. coli concentrations greater than 100 CFU/100mL was considered high risk. For vulnerable groups (e.g., young children, elderly, and immune-compromised persons), even low levels of contamination are considered risky.
The number of colony forming units of E. coli in a water sample is determined by filtering the sample through a membrane, placing the membrane on an agar-coated Petri dish, incubating the dish, and observing the growth of bacteria colonies

Impact Evaluat Ion of thE mozamb IquE RuRal WatER Supply act Iv I ty 66
directly. This approach (called membrane filtration) requires an appropriate laboratory setup with reliable electricity. An alternative approach to estimating the number of CFU in a water sample is the most probable number (MPN) method, in which a water sample is divided into several different sub-samples, each of which undergoes dilution and testing for the presence or absence of E. coli. The volume and dilution of each sub-sample, along with the share of sub-samples that are positive for E. coli, can be used to estimate the most probable number of CFU in the original sample. The MPN approach used for water quality testing in this study; specifically, all samples were processed using the IDEXX methodology (IDEXX Laboratories, Inc., One IDEXX Drive, Westbrook, Maine 04092 USA).
During the 2011 baseline, 11 Phase 2 treatment communities in the districts of Murrupula, Moma, and Mogincual were randomly selected for water quality testing from among the 18 Phase 2 treatment communities in the impact evaluation sample. Across these 11 communities, samples were collected from 39 unique water sources, and from drinking water storage containers in 258 households.
Among the 11 baseline communities included in water quality sampling, only 7 received an MCA water point. Handpumps could not be installed in 3 of the 11 communities as a result of negative geophysics, and a fourth community received a water point from World Vision rather than from MCA. Two new communities that had received MCA water points (one in Phase 1 and one in Phase 2) were thus added to the water quality sample in the follow-up study. Additionally, two comparison communities were added and sampled at the follow up as well. Among these 11 communities, a total of 873 water samples were collected and processed during the follow-up study. The methodology employed was identical to that described for the baseline study above, with one exception: in addition to E. coli, samples in the follow-up study were also tested for the fecal indicator bacteria enterococci.
During the follow-up study an additional investigation into the variability of FIB concentrations in source water samples was undertaken in four Phase 1 treatment communities. Specifically, a Universidade Lúrio student trained during the baseline study collected four 100-mL samples (two of which were processed for E. coli and two of which were processed for enterococci) during the morning, again at mid-day, and again in the late afternoon at each of three water sources in each community. This process was repeated in each community on three separate days, spaced roughly one week apart. One field blank was sampled in each community on each of the three days it was visited. Thus, a total of 156 source water samples (4 samples x 3 samples/day x 3 days x 4 communities, plus 12 field blanks) were collected in this investigation. No household stored water sampling was undertaken in these communities. Samples were processed at a field laboratory established by the Stanford-VT team in Nampula City. Communities were purposively selected that were located close enough to Nampula City to enable easy transport of samples within the 6-hour window for processing, and that had MCA handpumps that had been operating for at least a year.

67
Water samples were collected during the same months of the year in both the baseline and follow-up studies (during the dry season). This timing had the benefit of eliminating seasonal variation from the pre- versus post-intervention comparison, but it also precluded direct investigation of seasonal variation in water quality among sample communities.
Sample Collection and Processing
During the baseline study, Stanford-VT research team members trained six medical students and two professors from the Universidade Lúrio in obtaining and processing water samples. The training was carried out over four 3-hour sessions and included use of sterile technique for sampling; proper labeling and handling of samples between the field and the laboratory; processing samples using IDEXX; and obtaining and forwarding results to the Stanford-VT team. The Universidade Lúrio provided a classroom and teaching resources to support the training, while the Stanford-VT team supplied all other equipment and materials.
A designated water sampling team comprised of the Universidade Lúrio personnel, supervised by the Stanford-VT team, operated independently of
Community ID District Sampling undertaking Community study status
1 Rapale Source variability only Phase 1 Treatment2 Rapale Source variability only Phase 1 Treatment
27 Rapale Source variability only Phase 1 Treatment4 Meconta Source variability only Phase 1 Treatment9 Mogincual Source & stored water Phase 2 Treatment
10 Mogincual Source & stored water Phase 2 Treatment11 Mogincual Source & stored water Phase 2 Treatment14 Moma Source & stored water Phase 2 Comparison16 Moma Source & stored water Phase 2 Treatment21 Murrupula Source & stored water Phase 2 Treatment23 Murrupula Source & stored water Phase 2 Treatment25 Murrupula Source & stored water Phase 2 Treatment12 Moma Source & stored water1 Phase 2 Comparison17 Moma Source & stored water1 Phase 2 Comparison26 Murrupula Source & stored water1 Phase 2 Treatment20 Mogovolas Source & stored water2 Phase 1 Treatment68 Mogovolas Source & stored water2 Phase 3 Treatment 83 Moma Source & stored water2 Phase 2 Comparison
1 Source and stored water sampled during baseline only.2 Source and stored water sampled during follow-up only.
Table 7.29: Summary of Water Quality Study Sampling Frame

Impact Evaluat Ion of thE mozamb IquE RuRal WatER Supply act Iv I ty 68
the larger impact evaluation field team during the baseline study. During the follow-up study, water sampling was undertaken by one of the three field teams undertaking household and water committee interviews as part of the larger impact evaluation. Enumerators in this team were also trained in use of sterile technique for sampling, as well as proper labeling and handling of samples. Sample processing was performed by Stanford-VT team members, with assistance from Universidade Lúrio personnel.
Within communities selected for water quality sampling, a field team “runner” sought permission from leaders to obtain samples from shared water sources. Leaders were also asked to provide local guides who could show the sampling teams the locations of the most commonly used community water sources. Field team members collected samples from handpumps, while community guides were asked to obtain water from traditional wells and surface sources in the manner that would typically be employed by community members. This approach was used to assuage community members’ concerns regarding field team members interacting directly with shared water sources.
To sample stored water in households, field team members asked respondents if they would provide a 200-mL sample of stored drinking water to the field team member. Each willing respondent was asked several questions about the source from which the water was obtained. S/he was then asked to fill the sample container (which was held by an enumerator wearing latex gloves) with stored water in the manner that s/he typically used to obtain water. Sample containers were pre-labeled with an identification code that conveyed information about the sample date, community, and household ID. Samples were immediately placed on ice in coolers, and were processed within eight hours of collection. In each community, one 200-mL field blank was collected by a randomly selected field team member. Duplicate samples were also taken at every water source, and in at least one household per community.
Processing of the samples followed the IDEXX protocol for E. coli (baseline and follow-up) and enterococci (follow-up only). Specifically, each 100-mL sample was mixed with IDEXX reagent (Colilert-18© and Enterolert© for E. coli and enterococci, respectively). The sample-reagent solution was poured into a labeled QuantiTray©/ 2000 and sealed. Sealed Quantitrays with Colilert-18© were incubated at 35+/-0.5°C for 18 hours; Enterolert© samples were incubated at 41+/-0.5°C for 24 hours. Following incubation, the Quantitrays© were removed and the results were read and recorded.
The number of each type of sample obtained is summarized in Table 7.30. Note that, in the follow-up study, most samples were tested for both E. coli and enterococci, whereas samples obtained in the baseline study were tested for E. coli only.
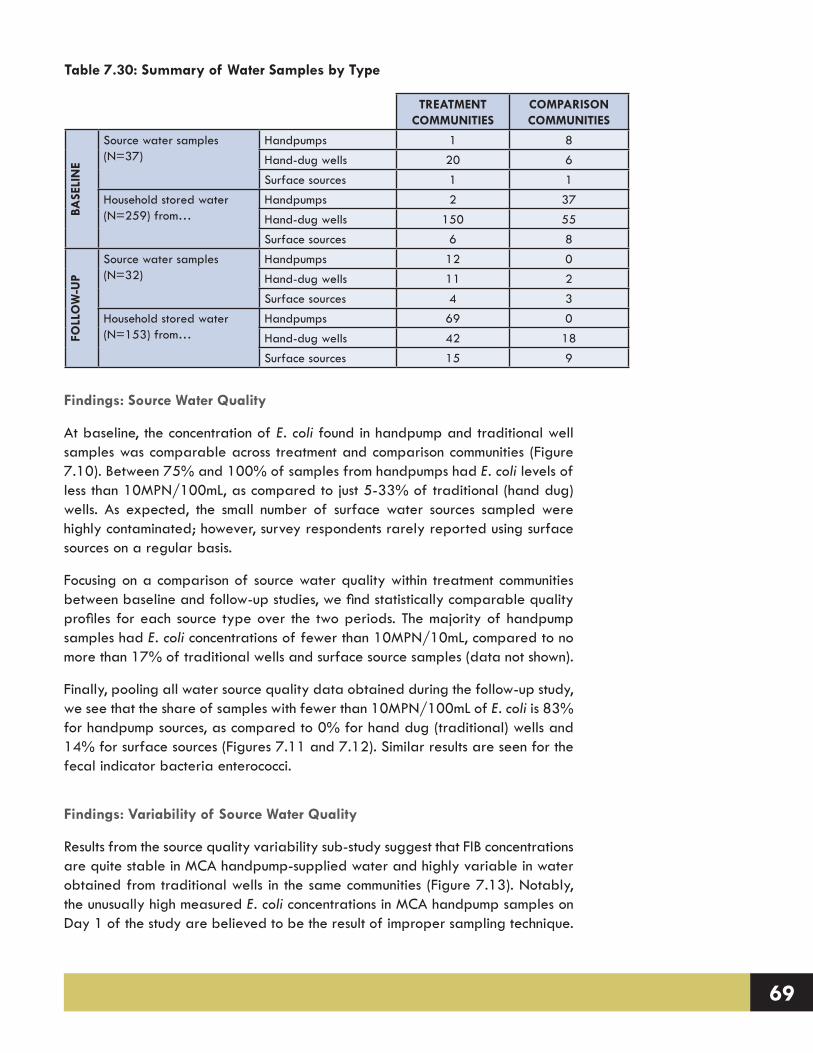
69
Findings: Source Water Quality
At baseline, the concentration of E. coli found in handpump and traditional well samples was comparable across treatment and comparison communities (Figure 7.10). Between 75% and 100% of samples from handpumps had E. coli levels of less than 10MPN/100mL, as compared to just 5-33% of traditional (hand dug) wells. As expected, the small number of surface water sources sampled were highly contaminated; however, survey respondents rarely reported using surface sources on a regular basis.
Focusing on a comparison of source water quality within treatment communities between baseline and follow-up studies, we find statistically comparable quality profiles for each source type over the two periods. The majority of handpump samples had E. coli concentrations of fewer than 10MPN/10mL, compared to no more than 17% of traditional wells and surface source samples (data not shown).
Finally, pooling all water source quality data obtained during the follow-up study, we see that the share of samples with fewer than 10MPN/100mL of E. coli is 83% for handpump sources, as compared to 0% for hand dug (traditional) wells and 14% for surface sources (Figures 7.11 and 7.12). Similar results are seen for the fecal indicator bacteria enterococci.
Findings: Variability of Source Water Quality
Results from the source quality variability sub-study suggest that FIB concentrations are quite stable in MCA handpump-supplied water and highly variable in water obtained from traditional wells in the same communities (Figure 7.13). Notably, the unusually high measured E. coli concentrations in MCA handpump samples on Day 1 of the study are believed to be the result of improper sampling technique.
Table 7.30: Summary of Water Samples by Type
TREATMENT COMMUNITIES
COMPARISON COMMUNITIES
BASE
LIN
E
Source water samples (N=37)
Handpumps 1 8Hand-dug wells 20 6Surface sources 1 1
Household stored water (N=259) from…
Handpumps 2 37Hand-dug wells 150 55Surface sources 6 8
FOLL
OW
-UP
Source water samples (N=32)
Handpumps 12 0Hand-dug wells 11 2Surface sources 4 3
Household stored water (N=153) from…
Handpumps 69 0Hand-dug wells 42 18Surface sources 15 9

Impact Evaluat Ion of thE mozamb IquE RuRal WatER Supply act Iv I ty 70
FIGURE 7.10Percentage of Samples from Indicated
Source Type with <10, 10-100, and >100 MPN (most probable number) E. coli per 100 ml, by baseline community
status.
FIGURE 7.11Percentage of Water Source Samples
with Indicated Level of E. coli Contamination, by Type of Source Water
(follow-up study)
FIGURE 7.12Percentage of Water Source Samples
with Indicated Level of Enterococci Contamination, by Type of Source Water
(follow-up study)

71
Specifically, the local guide recruited to assist with sampling in Community 1 and Community 4 dispensed water from the handpump into a gourd and subsequently poured the water into a sterile sampling container. All other samples were obtained by dispensing water directly from the handpump into sterile containers.
Findings: Household Stored Water Quality
At the community level, the significant decline observed in FIB contamination of water sources within treatment communities was not seen in stored household water samples (Figure 7.14). The distribution of stored water samples between the “low,” “medium,” and “high” E. coli contamination categories was statistically
FIGURE 7.13Source Water E. coli MPN (Most Probable Number, log transformed) in Four Communities, by Source Type and Sample Number
FIGURE 7.14Percentage of Household Stored Water Samples with Indicated Level of E. coli Contamination, by Sampling Period (7 treatment communities)

Impact Evaluat Ion of thE mozamb IquE RuRal WatER Supply act Iv I ty 72
equivalent in the baseline and follow-up phases (X2=3.99, df=2, p=0.14) for the seven treatment communities with baseline and follow-up data. An analysis of self-reported water treatment activities captured by the household survey revealed that only 5.4% (n=85) of all the households surveyed reported treating their water at the time of the baseline study, compared to 4.7% (n=85) in the follow-up study. In the follow-up study, of those households that said they treated their water, 37% boiled it, 44% used chlorine, 26% aerated the water, 9% filtered it through a cloth, and 1% used solar disinfection (multiple responses were permitted).
Stratifying the follow-up data by water source, however, suggests that households whose stored drinking water was obtained from an MCA handpump has a significantly better quality profile as compared to households in treatment communities who continue to use traditional sources (X2= 19.05, df=2, p<0.01) (Figure 7.15). This finding is supported by the observation that, during the follow-up study, the geometric mean E. coli concentration of the 96 stored water samples obtained from households that use MCA handpump was 8.4 MPN/100mL, compared to 42.7 MPN/100mL for households whose stored water was obtained from traditional wells and surface sources. This result may be caused in part by households using the handpumps keeping water in storage for shorter durations as compared to households using other sources (thus providing fewer opportunities for contamination).
In summary, the handpumps installed through the MCA program have the best water quality profile among all water source types sampled in the study, with limited variability in the concentration of fecal indicator bacteria at the point of collection. In addition, those households whose stored drinking water was obtained from a handpump was found to have significantly lower contamination with FIB as compared to stored water obtained from other sources.
FIGURE 7.15Percentage of Household Stored Water
Samples with Indicated Level of E. coli Contamination, by Water Source Type (7
treatment communities)

73
7.8 HEALTH
7.8.1 How does the installation of handpumps through the mcA RwPIP affect the 7-day prevalence of gastrointestinal and respiratory illness?
The installation of the MCA handpumps is associated with a statistically insignificant 9% reduction in the average percentage of children under the age of five with reported symptoms of respiratory illness, and a statistically insignificant 2% reduction in children with reported symptoms of gastrointestinal illness, in the week prior to interview.
In the household survey, respondents who had children under five years of age were asked whether any of their children (up to a total of five) had been ill in the past week (seven days). For each child that was reported to be ill, a follow-up question was asked about the child’s symptoms. If a respondent reported that a child had stomach pain, three or more runny stools in a 24-hour period, blood or mucus in their feces, and/or were vomiting, the child was classified as having a gastrointestinal illness. Whereas if the respondent reported that a child had a constant cough, congestion or runny nose, or difficulty breathing, the child was classified as having a respiratory infection. The data collected were aggregated at the community level to obtain the percent of total children in the community that were reported to have been ill in the past week. These community percentages were then averaged within the Phase 2 treatment and comparison groups to evaluate the impact of the MCA RWPIP.
Table 7.31 shows that the self-reported 7-day prevalence of respiratory illness among children under the age of five declined significantly by 11% following the installation of the MCA handpumps in Phase 2 treatment communities (p<0.05). However, a difference in difference analysis showed a statistically insignificant impact of a 9% decrease. Table 7.32 shows a statistically insignificant reduction (of 2%) in the prevalence of gastrointestinal illness among children under the age of five following the installation of the handpump in Phase 2 treatment communities.
Considering the absence of significant health impacts in conjunction with the water quality findings presented in Section 7.7, a few observations can be made. The handpumps tested generally provided good quality water at the point of collection. At the household level, however, almost half of the samples of stored drinking water that was collected from handpumps had levels of fecal indicator bacteria (FIB) considered to be unsafe. Thus, it may be that inadequate hygiene and water management practices obviated these households’ gains in water quality at the point of collection, resulting in the limited observed impacts on child respiratory and gastrointestinal illness. It may also be that the pathogens causing these illnesses among sample households are transmitted via exposure pathways other than or in addition to ingestion in water (e.g., hand-to-mouth contact or through food).

Impact Evaluat Ion of thE mozamb IquE RuRal WatER Supply act Iv I ty 74
7.9 SATISFACTION / SENSE OF OWNERSHIP
7.9.1 to what extent do community members express a sense of ownership for the infrastructure installed by the mcA RwPIP?
There is a consistent and high level of reported community sense of ownership for the MCA RWPIP project. Around 88% of households in communities that received an MCA handpump stated the community owned the project. Further, following the installation of the handpump, reported community sense of ownership significantly increased for the land on which the handpump was located (p<0.05) as well as for the water source itself (p<0.001), indicating that communities also felt they owned the physical infrastructure.
In the household survey, respondents were asked whether a water project has happened in their community in the past two years. If a respondent answered yes, a series of questions was asked about the project, including a sequence designed to gauge a community’s sense of ownership for the water-related activity.
When asked whether the water project is ‘owned’ by the community, 88% of households in Phase 2 treatment communities said that the community owned the project (Table 7.33). This percentage is almost identical to the result obtained from the baseline study, indicating a consistent and high level of project ownership
Table 7.32: Phase 2 Percentage of Children Exhibiting Symptoms of Gastrointestinal Illness in the Past Week
Baseline Follow-Up Difference
Phase/CommunityNumber of
CommunitiesMean Percent of
Children Under 5 with GIMean Percent of
Children Under 5 with GIChange in Percentage
Treatment 15 15% 14% -1%Comparison 23 17% 18% 1%
Difference in Differences -2%Significance codes: ‘***’ p<0.001; ‘**’ p<0.01; ‘*’ p<0.05; ‘.’ p<0.1
Table 7.31: Phase 2 Percentage of Children Exhibiting Symptoms of Respiratory Illness in the Past Week
Baseline Follow-Up Difference
Phase/CommunityNumber of
CommunitiesMean Percent of
Children Under 5 with RIMean Percent of
Children Under 5 with RIChange in Percentage
Treatment 15 19% 8% -11%*Comparison 23 18% 16% -2%
Difference in Differences -9%Significance codes: ‘***’ p<0.001; ‘**’ p<0.01; ‘*’ p<0.05; ‘.’ p<0.1

75
by the community. The high level of ownership at baseline is probably related to the participation of the community in the planning process and in hygiene and sanitation activities implemented by Cowater.
When asked whether the community owns (1) the land on which the water source is located and (2) the actual water source itself (Table 7.33), there was a 40.6% (p<0.05) and 62.3% (p<0.001) increase in the percentage of households in Phase 2 treatment communities that felt the community owned these assets, respectively. This indicates that once a community had received the MCA handpump, their ownership of the infrastructure and project site significantly increased.
7.9.2 To what extent do community members express a greater satisfaction with their water supply situation following the installation of the MCA handpump?
The mean percentage of households in communities that received an MCA handpump reporting that they are satisfied with their water supply situation increased significantly from 22% to 79% from baseline to follow-up (p<0.001). In comparison, the mean percentage of households in communities that did not receive an MCA handpump experienced a statistically insignificant decline in their level of reported satisfaction from 31% to 26%. These results indicate that the installation of the MCA handpumps are associated with a significant improvement in the general satisfaction of households with their water supply situation (p<0.001).
In the household survey, respondents were asked whether they were satisfied with their current water situation. If a respondent replied that they were ‘very satisfied’ or ‘satisfied,’ they were classified as being satisfied with their water supply situation.
Following the installation of the MCA handpumps, the Phase 2 treatment communities experienced, on average, a significant increase in their level of satisfaction with their water supply situation of 57% – from 22% to 79% (Table 7.34) (p<0.001).
If we undertake a difference-in-differences analysis in Phase 2 communities, the MCA handpumps can be associated with a significant increase of 63% in the percentage of households that are satisfied with their water supply situation (p<0.001).
Table 7.33: Sense of Ownership for the MCA’s RWPIP in Phase 2 Treatment Communities
Baseline Follow-Up Difference
% HH Believing Community Owns Project 86.8% 87.9% 1.1%% HH Believing Community Owns Land 31.7% 72.3% 40.6%*% HH Believing Community Owns Source 12.8% 75.1% 62.3%***
Significance codes: ‘***’ p<0.001; ‘**’ p<0.01; ‘*’ p<0.05; ‘.’ p<0.1

Impact Evaluat Ion of thE mozamb IquE RuRal WatER Supply act Iv I ty 76
These results indicate that the installation of the MCA handpumps are associated with a significant improvement in the general satisfaction of households with their water supply situation.
7.10 INCOME / EXPENDITURE
7.10.1 How does the installation of handpumps through the MCA RWPIP affect household income, expenditures, and dietary consumption?
The installation of the MCA handpumps was not found to have any statistically significant impact on the self-reported levels of monthly income or expenditure. Between the baseline and follow-up study, both treatment and comparison communities experienced a comparable increase in both income and expenditure. Similar conclusions were reached with respect to the frequency of meat and fish consumption, as well as household engagement in agriculture. Households in both treatment and comparison communities experienced a statistically significant increase in the consumption of meat and fish (p<0.001) and in the percentage of households engaged in agriculture (p<0.05). An analysis of livestock units and the income earned from selling agricultural products revealed statistically insignificant changes in activity from the baseline to follow-up study in both treatment and comparison communities. In summary, incomes and expenditures in all communities increased along with household engagement in agriculture and consumption of meat and fish, pointing to a general trend of economic development in Nampula (or a productive farming season).
Data on annual household income and expenditure were obtained from the household survey. In both the baseline and follow-up studies, the household surveys were administered during the dry season (June-July). Thus, the annual data are based on ‘real time’ dry season information and recall data from other times of the year (data which are vulnerable to recall biases). Further, for agriculture production, the dry season would be the least likely time to observe an impact since (1) the time costs of domestic water fetching are highest, even with improved sources, and (2) relatively less agricultural labor can happen. The following data and analysis should be considered within this context.
Table 7.34: Phase 2 Percentage of HH Indicating Satisfaction with Water Supply Situation
Baseline Follow-Up Difference
Phase/CommunityNumber of
CommunitiesMean Percent of HH
SatisfiedMean Percent of HH
SatisfiedChange in Percentage
Treatment 15 22% 79% 57%***Comparison 23 31% 26% -6%
Difference in Differences 63%***Significance codes: ‘***’ p<0.001; ‘**’ p<0.01; ‘*’ p<0.05; ‘.’ p<0.1

77
The self-reported monthly income was highly variable and increased in both Phase 2 treatment and comparison communities by approximately the same amount (497 (p<0.01) and 489 (p<0.05) MZN, respectively) (Table 7.35). A difference-in-differences analysis shows virtually no impact on reported incomes due to the installation of the MCA handpumps.
The self-reported monthly expenditures were also highly variable and increased slightly in both Phase 2 treatment and comparison communities (by 147 (p<0.05) and 94 (p<0.1) MZN, respectively) (Table 7.36). A difference-in-differences analysis shows an insignificant impact (53 MZN) on reported monthly expenditures due to the installation of the MCA handpumps.
An analysis of the self-reported size of agricultural plots proved to be a poor measure of potential productive activity, since it was difficult for respondents to accurately estimate the size of their plots. However, data from the household survey did permit an analysis of the livestock units owned by households, the engagement of households in agriculture, the income earned from selling agricultural products, and household consumption of meat or fish.
Livestock are another measure of wealth among villagers in Nampula. In order to make comparisons across different types of livestock, the Food and Agriculture Organization (FAO) of the United Nations uses a unit of measurement known as Livestock Units (LU). Livestock Units allow for the standardization of different farm
Table 7.35: Phase 2 Median Monthly Income (in MZN)
Baseline Follow-Up Difference
Phase/CommunityNumber of
CommunitiesMean of Median Income
(MZN)Mean of Median Income
(MZN)MZN
Treatment 15 308 805 497**Comparison 23 839 1328 489*
Difference in Differences 8Significance codes: ‘***’ p<0.001; ‘**’ p<0.01; ‘*’ p<0.05; ‘.’ p<0.1
Table 7.36: Phase 2 Median Monthly Expenditures (in MZN)
Baseline Follow-Up Difference
Phase/CommunityNumber of
CommunitiesMean of Median Income
(MZN)Mean of Median Income
(MZN)MZN
Treatment 15 472 619 147*Comparison 23 645 739 94.
Difference in Differences 53Significance codes: ‘***’ p<0.001; ‘**’ p<0.01; ‘*’ p<0.05; ‘.’ p<0.1
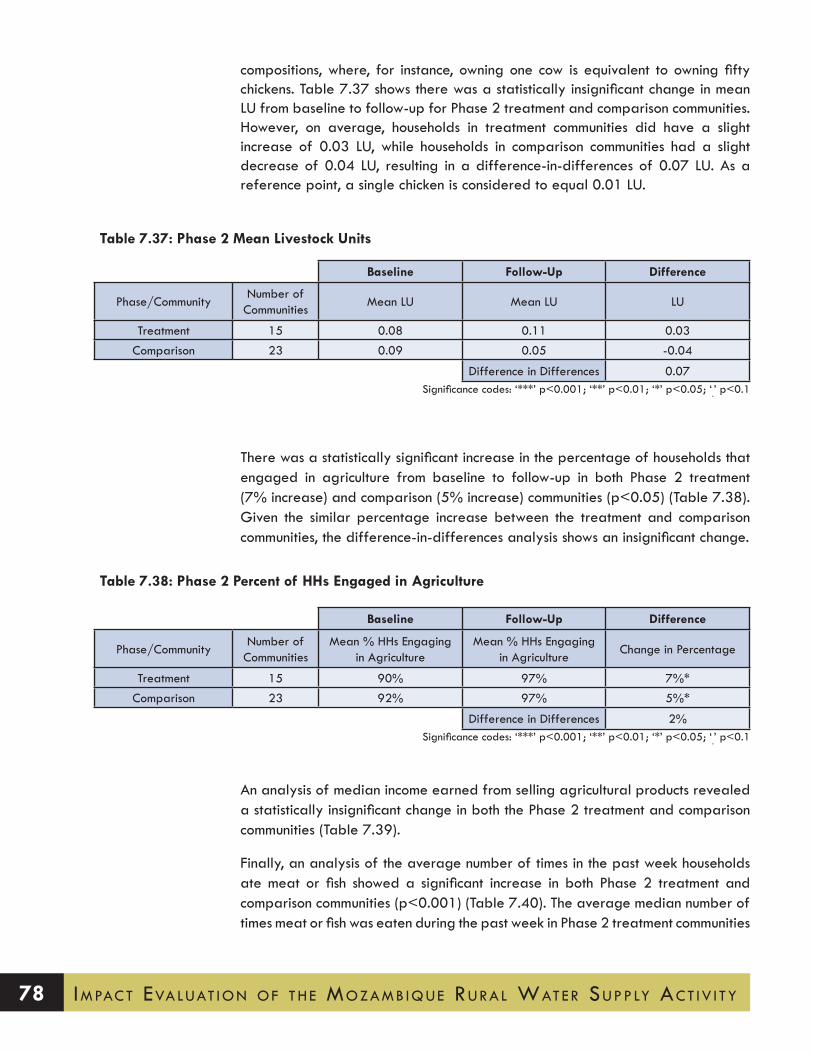
Impact Evaluat Ion of thE mozamb IquE RuRal WatER Supply act Iv I ty 78
compositions, where, for instance, owning one cow is equivalent to owning fifty chickens. Table 7.37 shows there was a statistically insignificant change in mean LU from baseline to follow-up for Phase 2 treatment and comparison communities. However, on average, households in treatment communities did have a slight increase of 0.03 LU, while households in comparison communities had a slight decrease of 0.04 LU, resulting in a difference-in-differences of 0.07 LU. As a reference point, a single chicken is considered to equal 0.01 LU.
There was a statistically significant increase in the percentage of households that engaged in agriculture from baseline to follow-up in both Phase 2 treatment (7% increase) and comparison (5% increase) communities (p<0.05) (Table 7.38). Given the similar percentage increase between the treatment and comparison communities, the difference-in-differences analysis shows an insignificant change.
An analysis of median income earned from selling agricultural products revealed a statistically insignificant change in both the Phase 2 treatment and comparison communities (Table 7.39).
Finally, an analysis of the average number of times in the past week households ate meat or fish showed a significant increase in both Phase 2 treatment and comparison communities (p<0.001) (Table 7.40). The average median number of times meat or fish was eaten during the past week in Phase 2 treatment communities
Table 7.37: Phase 2 Mean Livestock Units
Baseline Follow-Up Difference
Phase/CommunityNumber of
CommunitiesMean LU Mean LU LU
Treatment 15 0.08 0.11 0.03Comparison 23 0.09 0.05 -0.04
Difference in Differences 0.07Significance codes: ‘***’ p<0.001; ‘**’ p<0.01; ‘*’ p<0.05; ‘.’ p<0.1
Table 7.38: Phase 2 Percent of HHs Engaged in Agriculture
Baseline Follow-Up Difference
Phase/CommunityNumber of
CommunitiesMean % HHs Engaging
in AgricultureMean % HHs Engaging
in AgricultureChange in Percentage
Treatment 15 90% 97% 7%*Comparison 23 92% 97% 5%*
Difference in Differences 2%Significance codes: ‘***’ p<0.001; ‘**’ p<0.01; ‘*’ p<0.05; ‘.’ p<0.1
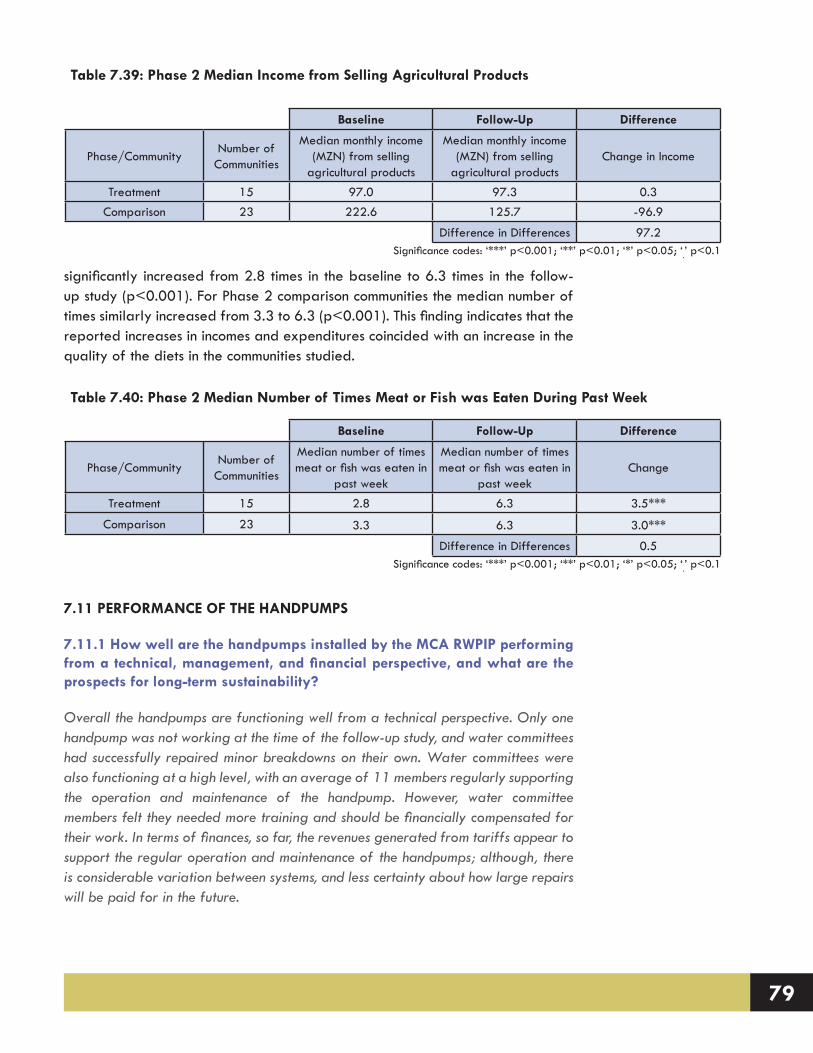
79
significantly increased from 2.8 times in the baseline to 6.3 times in the follow-up study (p<0.001). For Phase 2 comparison communities the median number of times similarly increased from 3.3 to 6.3 (p<0.001). This finding indicates that the reported increases in incomes and expenditures coincided with an increase in the quality of the diets in the communities studied.
7.11 PERFORMANCE OF THE HANDPUMPS
7.11.1 How well are the handpumps installed by the MCA RWPIP performing from a technical, management, and financial perspective, and what are the prospects for long-term sustainability?
Overall the handpumps are functioning well from a technical perspective. Only one handpump was not working at the time of the follow-up study, and water committees had successfully repaired minor breakdowns on their own. Water committees were also functioning at a high level, with an average of 11 members regularly supporting the operation and maintenance of the handpump. However, water committee members felt they needed more training and should be financially compensated for their work. In terms of finances, so far, the revenues generated from tariffs appear to support the regular operation and maintenance of the handpumps; although, there is considerable variation between systems, and less certainty about how large repairs will be paid for in the future.
Table 7.39: Phase 2 Median Income from Selling Agricultural Products
Baseline Follow-Up Difference
Phase/CommunityNumber of
Communities
Median monthly income (MZN) from selling
agricultural products
Median monthly income (MZN) from selling
agricultural productsChange in Income
Treatment 15 97.0 97.3 0.3Comparison 23 222.6 125.7 -96.9
Difference in Differences 97.2Significance codes: ‘***’ p<0.001; ‘**’ p<0.01; ‘*’ p<0.05; ‘.’ p<0.1
Table 7.40: Phase 2 Median Number of Times Meat or Fish was Eaten During Past Week
Baseline Follow-Up Difference
Phase/CommunityNumber of
Communities
Median number of times meat or fish was eaten in
past week
Median number of times meat or fish was eaten in
past weekChange
Treatment 15 2.8 6.3 3.5***
Comparison 23 3.3 6.3 3.0***
Difference in Differences 0.5Significance codes: ‘***’ p<0.001; ‘**’ p<0.01; ‘*’ p<0.05; ‘.’ p<0.1

Impact Evaluat Ion of thE mozamb IquE RuRal WatER Supply act Iv I ty 80
Water committee perceptions about the future sustainability of the handpumps are concerning, however. Only 6% of water committees reported that they believe their handpump will be functioning in 10 years. Key sustainability issues identified by the water committees are the lack of sufficient revenues, access to spare parts, and technical capacity for larger repairs.
Technical Performance
Based on data from the water committee interview, 39% of handpumps in the treatment communities surveyed had at least one breakdown since construction. The average breakdown lasted 23.1 days (median 6 days) and was typically repaired by the water committee. At the time of the survey, all but one handpump was functioning. Based on tests in 17 communities, the average time it took for a water collector to fill a 20 liter container was 1 min and 29 seconds.
Table 7.41 shows that 90% of water committees think their handpump will be operating in one year, but this percent declines to 45% at 5 years, and 6% at 10 years. The top two reasons that the water committee felt that the handpump would stop functioning were a lack of sufficient funds for repairs and insufficient technical knowledge for making larger repairs. Only 13% of water committees had spare parts on hand, but 77% of water committees felt that they could obtain spare parts when necessary. About half (48%) of the water committees received a post-construction visit from Cowater.
Water Committee Performance
The average water committee had 11 active members at the time of the survey. Table 7.42 shows the duties of the water committee and how often they are performed. Most water committees report educating the community about hygiene and sanitation, supervising the handpump, locking and unlocking the handpump, and cleaning the handpump on a daily basis. Tariffs are typically collected on a monthly basis and most communities have not had to make repairs or buy spare parts.
On average, water committee members work 2.7 hours per day and none of the water committee members were financially compensated for their work. A small percentage received free water from the handpump.
Water committees met together an average of 7.5 times in the last year, and with water users 5 times to discuss issues related to the handpump.
About three-quarters of water committees reported receiving trainings in the
Table 7.41: Water Committee Perceptions about Sustainability
Percentage of water committees that think the handpump will be operating in: (n=31)
one year 90%five years 45%ten years 6%
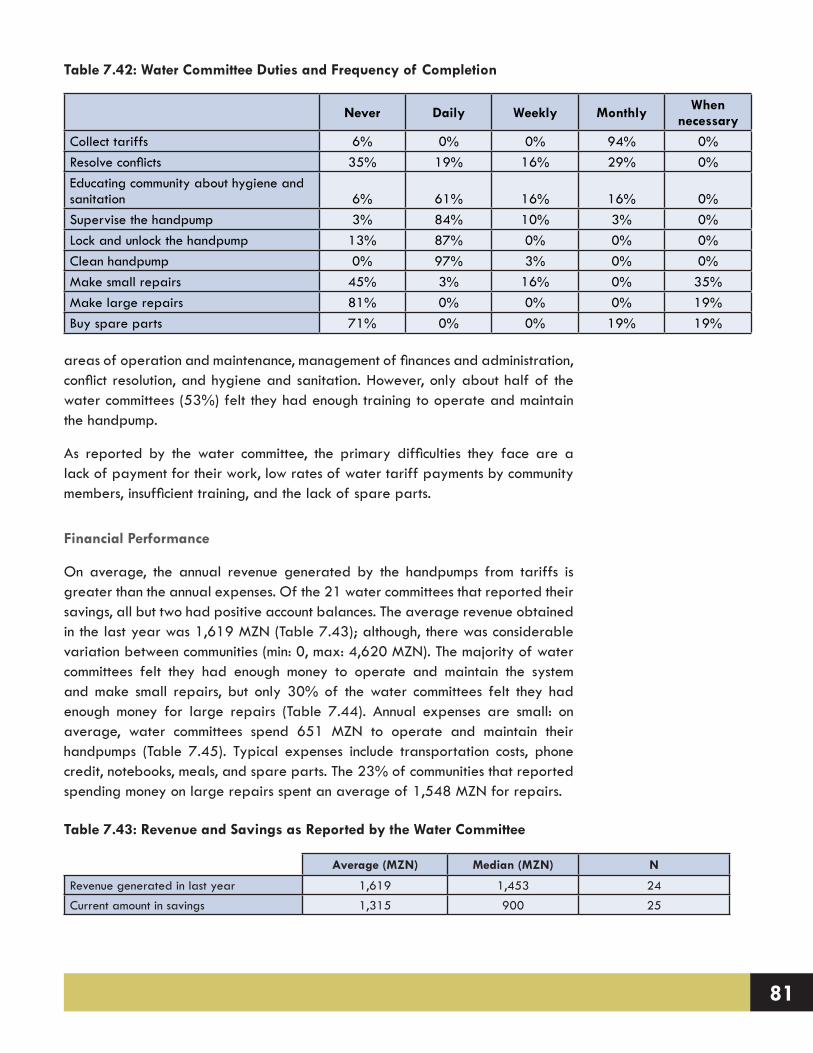
81
areas of operation and maintenance, management of finances and administration, conflict resolution, and hygiene and sanitation. However, only about half of the water committees (53%) felt they had enough training to operate and maintain the handpump.
As reported by the water committee, the primary difficulties they face are a lack of payment for their work, low rates of water tariff payments by community members, insufficient training, and the lack of spare parts.
Financial Performance
On average, the annual revenue generated by the handpumps from tariffs is greater than the annual expenses. Of the 21 water committees that reported their savings, all but two had positive account balances. The average revenue obtained in the last year was 1,619 MZN (Table 7.43); although, there was considerable variation between communities (min: 0, max: 4,620 MZN). The majority of water committees felt they had enough money to operate and maintain the system and make small repairs, but only 30% of the water committees felt they had enough money for large repairs (Table 7.44). Annual expenses are small: on average, water committees spend 651 MZN to operate and maintain their handpumps (Table 7.45). Typical expenses include transportation costs, phone credit, notebooks, meals, and spare parts. The 23% of communities that reported spending money on large repairs spent an average of 1,548 MZN for repairs.
Table 7.42: Water Committee Duties and Frequency of Completion
Never Daily Weekly Monthly When necessary
Collect tariffs 6% 0% 0% 94% 0%Resolve conflicts 35% 19% 16% 29% 0%Educating community about hygiene and sanitation 6% 61% 16% 16% 0%Supervise the handpump 3% 84% 10% 3% 0%Lock and unlock the handpump 13% 87% 0% 0% 0%Clean handpump 0% 97% 3% 0% 0%Make small repairs 45% 3% 16% 0% 35%Make large repairs 81% 0% 0% 0% 19%Buy spare parts 71% 0% 0% 19% 19%
Table 7.43: Revenue and Savings as Reported by the Water Committee
Average (MZN) Median (MZN) N
Revenue generated in last year 1,619 1,453 24Current amount in savings 1,315 900 25
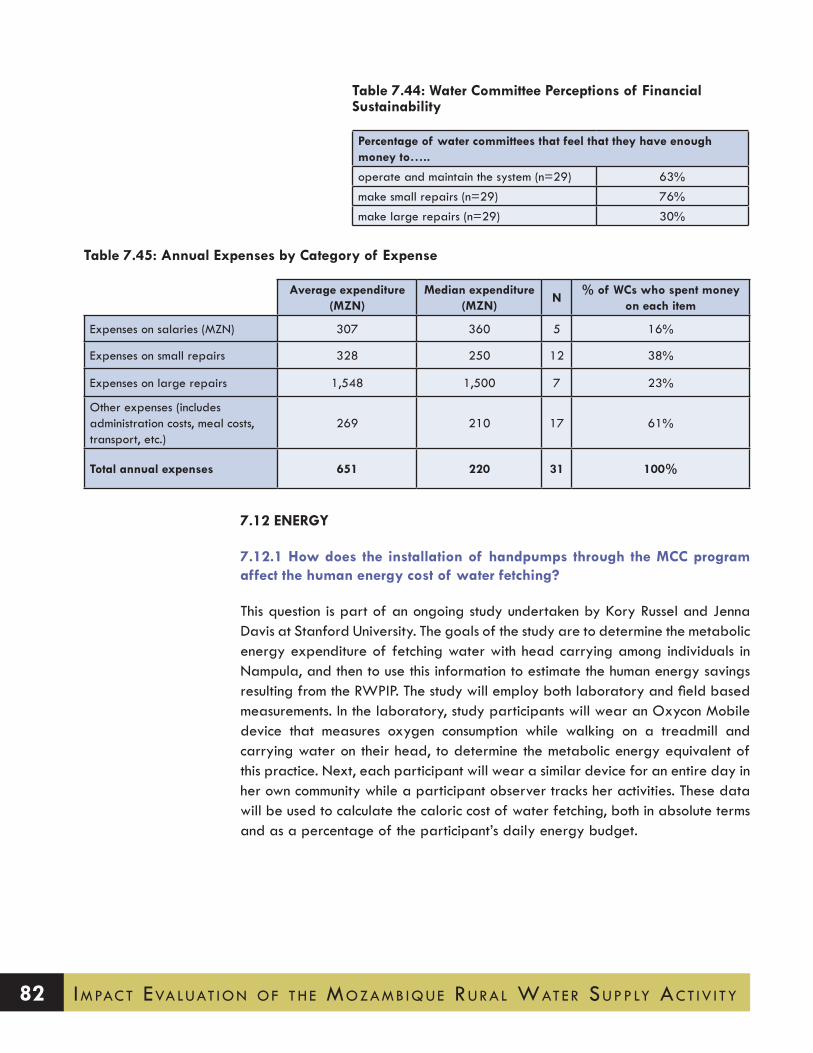
Impact Evaluat Ion of thE mozamb IquE RuRal WatER Supply act Iv I ty 82
7.12 ENERGY
7.12.1 How does the installation of handpumps through the MCC program affect the human energy cost of water fetching?
This question is part of an ongoing study undertaken by Kory Russel and Jenna Davis at Stanford University. The goals of the study are to determine the metabolic energy expenditure of fetching water with head carrying among individuals in Nampula, and then to use this information to estimate the human energy savings resulting from the RWPIP. The study will employ both laboratory and field based measurements. In the laboratory, study participants will wear an Oxycon Mobile device that measures oxygen consumption while walking on a treadmill and carrying water on their head, to determine the metabolic energy equivalent of this practice. Next, each participant will wear a similar device for an entire day in her own community while a participant observer tracks her activities. These data will be used to calculate the caloric cost of water fetching, both in absolute terms and as a percentage of the participant’s daily energy budget.
Table 7.44: Water Committee Perceptions of Financial Sustainability
Percentage of water committees that feel that they have enough money to…..
operate and maintain the system (n=29) 63%make small repairs (n=29) 76%make large repairs (n=29) 30%
Table 7.45: Annual Expenses by Category of Expense
Average expenditure (MZN)
Median expenditure (MZN)
N% of WCs who spent money
on each item
Expenses on salaries (MZN) 307 360 5 16%
Expenses on small repairs 328 250 12 38%
Expenses on large repairs 1,548 1,500 7 23%
Other expenses (includes administration costs, meal costs, transport, etc.)
269 210 17 61%
Total annual expenses 651 220 31 100%

83
7.13 ANALYSIS OF THE SUSTAINABILITY OF THE IMPACTS FROM THE RWPIP
As discussed in Section 6.4 (and Appendix A), there was insufficient time to collect baseline data in Phase 1 communities prior to the installation of the handpumps. The decision to include Phase 1 communities in the study was based on two key considerations. First, since Phase 1 and 2 of the rural water program each targeted three different districts, if Phase 1 had been excluded only one-half of the rural water program in Nampula would have been studied. Second, including Phase 1 communities in the sample meant that the performance of, and benefit streams from, the handpump beyond its one-year warranty could be studied. In this section, the sustainability of the benefits streams from the installation of the handpumps in Phase 1 communities is discussed. We are interested in whether the impacts increased or decreased over time.
The same sampling methodology that was used in the selection of Phase 2 treatment and comparison communities was followed in the selection of the Phase 1 treatment and comparison communities. Since the benefit streams from the installation of the handpumps in the Phase 1 treatment communities were already being realized at the time of the baseline study, the difference-in-differences analyses permits the study of how these benefits changed over a two-year period when compared with the Phase 1 comparison communities.
Appendix B presents the results from the difference-in-differences analyses that are summarized in Table 7.46. Given the observed variation between communities, approximate critical values were calculated that would achieve roughly 80% power to detect a statistically significant (p<0.05) difference in differences between the between the Phase 1 treatment and comparison communities from baseline to follow-up. This approximate critical value gives an indication of how large a difference-in-differences change would have to be to achieve approximately 80% power to reject the null hypothesis of no difference in differences between the treatment and comparison communities from baseline to follow-up.
For example, the median minutes spent collecting 20 liters of water in Phase 1 Treatment communities was 45.6 minutes at baseline. This time increased to 74.4 minutes at follow-up for a statistically significant difference in Phase 1 treatment communities of 28.8 minutes for every 20 liters of water collected (p<0.05). In the Phase 1 comparison communities, the median time households spent collecting 20 liters of water decreased insignificantly by 5.4 minutes (these data are not shown in Table 7.46, but can be seen in Appendix B). The difference in differences of 34.2 minutes was found to be statistically insignificant (p<0.1).
The results from the difference-in-differences analyses between Phase 1 treatment and comparison communities from baseline to follow-up showed no statistically significant (at the 0.05 level) changes in the 15 key variables of interest (Table
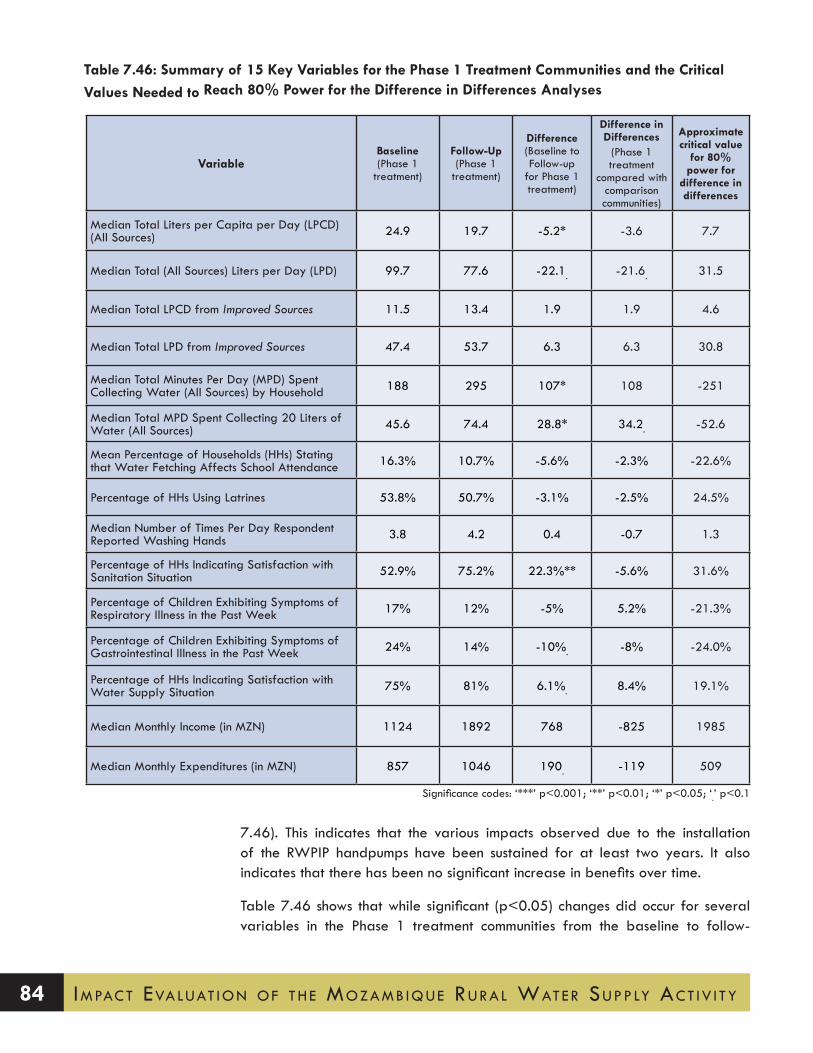
Impact Evaluat Ion of thE mozamb IquE RuRal WatER Supply act Iv I ty 84
7.46). This indicates that the various impacts observed due to the installation of the RWPIP handpumps have been sustained for at least two years. It also indicates that there has been no significant increase in benefits over time.
Table 7.46 shows that while significant (p<0.05) changes did occur for several variables in the Phase 1 treatment communities from the baseline to follow-
Table 7.46: Summary of 15 Key Variables for the Phase 1 Treatment Communities and the Critical Values Needed to Reach 80% Power for the Difference in Differences Analyses
VariableBaseline (Phase 1
treatment)
Follow-Up (Phase 1
treatment)
Difference (Baseline to Follow-up
for Phase 1 treatment)
Difference in Differences
(Phase 1 treatment
compared with comparison communities)
Approximate critical value
for 80% power for
difference in differences
Median Total Liters per Capita per Day (LPCD) (All Sources) 24.9 19.7 -5.2* -3.6 7.7
Median Total (All Sources) Liters per Day (LPD) 99.7 77.6 -22.1. -21.6. 31.5
Median Total LPCD from Improved Sources 11.5 13.4 1.9 1.9 4.6
Median Total LPD from Improved Sources 47.4 53.7 6.3 6.3 30.8
Median Total Minutes Per Day (MPD) Spent Collecting Water (All Sources) by Household 188 295 107* 108 -251
Median Total MPD Spent Collecting 20 Liters of Water (All Sources) 45.6 74.4 28.8* 34.2. -52.6
Mean Percentage of Households (HHs) Stating that Water Fetching Affects School Attendance 16.3% 10.7% -5.6% -2.3% -22.6%
Percentage of HHs Using Latrines 53.8% 50.7% -3.1% -2.5% 24.5%
Median Number of Times Per Day Respondent Reported Washing Hands 3.8 4.2 0.4 -0.7 1.3
Percentage of HHs Indicating Satisfaction with Sanitation Situation 52.9% 75.2% 22.3%** -5.6% 31.6%
Percentage of Children Exhibiting Symptoms of Respiratory Illness in the Past Week 17% 12% -5% 5.2% -21.3%
Percentage of Children Exhibiting Symptoms of Gastrointestinal Illness in the Past Week 24% 14% -10%. -8% -24.0%
Percentage of HHs Indicating Satisfaction with Water Supply Situation 75% 81% 6.1%. 8.4% 19.1%
Median Monthly Income (in MZN) 1124 1892 768 -825 1985
Median Monthly Expenditures (in MZN) 857 1046 190. -119 509
Significance codes: ‘***’ p<0.001; ‘**’ p<0.01; ‘*’ p<0.05; ‘.’ p<0.1

85
up study, when these variables were considered in a difference-in-differences analysis, the changes were not found to be statistically significant (at the 0.05 level). For example, a statistically significant increase was found in the number of times per day the respondents in Phase 1 treatment communities reported washing their hands (p<0.001) and in the percent of households satisfied with the current sanitation situation (p<0.01). However, the difference-in-differences analyses showed no significant (at the 0.05 level) changes had occurred between the treatment and comparison communities from the baseline to follow-up study.
In summary, it appears that the various impacts of the handpumps seem to be sustainable over a period of two years.
7.14 ASSUMPTION FOR THE MCC’S ERR MODEL
The data presented throughout Section 7 provide a range of information that can inform the assumptions included in an ERR model. The following text outlines several assumptions that could be used by the MCC to create a more accurate estimate of the RWPIP’s economic impact.
Average Size of Household
The average number of people living in the households surveyed in Nampula was 4.2.
Number of Handpump Users
Each of the installed MCA handpumps was intended to serve 500 people (Cowater, 2013). However, data obtained from the water committee interviews and handpump observations revealed that a more realistic estimate would be 391 users during the dry season and 176 users during the wet season. Further, since the handpump is only operational for eight hours (480 minutes) a day to enable the aquifer to recharge, if takes 2 minutes to fill each 20 liter container, this would mean that only 240 containers would be filled. Thus, the Stanford-VT team recommends that the estimated number of households served by the handpump be reduced so that it is more in line with the observed estimates and the physical limits of the handpump.
Percentage of Community Using the Handpump
The household survey revealed that 78% of households surveyed in the treatment communities reported using the installed handpump. Thus, 22% of households continue to use traditional (unimproved) sources. The most commonly reported reason for not using a handpump was that it was located too far away from the

Impact Evaluat Ion of thE mozamb IquE RuRal WatER Supply act Iv I ty 86
household. Considering that the average community size is over 1,500 people, the installed handpumps will be unable to serve the majority of the households in a community.
Total Water Consumption
The installation of the handpump can be associated with a statically insignificant increase in total water consumption of 2.5 LPCD. In the treatment communities, water consumption increased from 17.2 to 19.5 LPCD from the baseline to the follow-up study (p<0.1). In the comparison communities, water consumption remained more or less constant at 18.4 LPCD. Note: While water consumption in the treatment and comparison communities is comparable, in the treatment communities, 15 LPCD (or three quarters of the water consumed) was obtained from an improved water source (i.e., the handpump).
Time Spent Collecting Water
There was a statistically insignificant reduction of 88 minutes in the total median time households spend collecting water each day (p=0.14). Since the average number of people in a household is 4.2, this change is the equivalent of a time savings of 21 minutes per person per day.
Use of Time Saved from Collecting Water
Around one third (30%) of households in the treatment communities felt that they had benefited from a reduction in the time spent collecting water. Of these households, 37% stated that they use part of this time for a productive activity such as earning an income, working in the field, or raising livestock. The remaining households (63%) stated that they spent their time on domestic chores, resting, and social activities. These data imply that around one third of the time saved from collecting water could be associated with income-related activities.
Impact of Water Fetching on Schooling
The installation of the MCA handpump was associated with a significant 17.5% reduction in the mean percentage of households stating that water fetching negatively affects the school attendance of their children (p<0.01). Thus, for a group of 100 households in treatment communities (which had an average of 154 school age children), the introduction of an MCA handpump corresponds to 27 fewer children whose school attendance is negatively affected by water fetching. While no data were collected on the actual school attendance, these data provide some sense of the scale of the potential impact.
Payment for Handpump Water
Around 90% of communities charge users for water obtained from the handpump.

87
Users pay for water by the month; the median monthly tariff is 10 MZN. In one-third of the communities, users were not charged for water during the wet season, since it was argued that households would use the freely available surface water if they had to pay to use the handpump.
Health
The evaluation of the RWPIP revealed no significant changes in health-related measures.
Income and Expenditure
The evaluation of the RWPIP revealed no significant changes in household incomes or expenditures.

Impact Evaluat Ion of thE mozamb IquE RuRal WatER Supply act Iv I ty 88

89
8.POLICY IMPLICATIONS
The data show that the number of people using the handpump declines quickly when households live further than 1.2 kilometers from the handpumps. Respondents also reported “distance” as the number one reason they did not use the handpumps. Given the dispersed nature of housing in Nampula and the large size of communities, it may be necessary to construct multiple handpumps per community or small piped water systems in order to ensure access to improved water for a greater share of the target population. Further, since traditional water sources continue to be important to households for a variety of non-consumptive uses, even after the installation of the handpumps, attention should be given to enhancing or rehabilitating these sources as needed.
The data obtained from the water committees and from the water point observations revealed that fewer people are benefiting from the handpumps than expected. The original assumption of the RWPIP was that each handpump would service 500 people. Assuming a two-minute fill time per 20-liter container, and an average of eight hours a day that the handpumps operate (as observed in the field), the most one handpump can supply is 4,800 liters daily. This volume is sufficient to provide only 240 people with the JMP-recommended 20 liters per capita per day for “basic needs” water supply. Thus, future rural water projects should carefully consider the number of people who are expected to access water from a handpump and how this may affect the volume of water consumed by beneficiaries. In addition, wide variation was observed in the estimated number of water point users as provided by water committees and suggested through water point observation. It seems worth exploring opportunities to collect automated, year-round data on handpump use from a sample of the installed handpumps (e.g., through the installation of wireless sensors that can transmit data via the cellular phone network). Such data would provide valuable information on water point performance and could also inform future rural water planning and project design.
The data collected showed no significant health impacts from the RWPIP, despite the fact that installed handpumps were found to deliver high quality water. Inadequate water management practices may have resulted in contamination of stored water between the point of collection and the point of use. It is also possible that exposure pathways other than water ingestion (e.g., hands and food) may be more important for child diarrheal and respiratory illness in Nampula. In addition, data from the treatment communities show that households who use the handpump also continue to obtain some of their water from unimproved sources. Households in treatment communities reported little change in their sanitation and hygiene practices; two thirds of treatment households continue to practice open defecation. Taken together,

Impact Evaluat Ion of thE mozamb IquE RuRal WatER Supply act Iv I ty 90
these findings suggest that the overall impact on fecal contamination at the household and community level has likely been negligible.
Triggering demand for improved sanitation, as well as motivating correct and consistent hygiene behaviors, are important challenges that require focused attention and resources. Future interventions might consider whether sanitation and hygiene trainings targeted primarily to water committee members are the most effective strategy for catalyzing the widespread change needed to improve excreta management in these communities. In terms of reducing stored water contamination, implementing sustainable point-of-use water treatment promotion programs is also known to be very challenging. There may be intermediate measures that are worth exploring, however. For example, providing safe water storage containers (i.e., with a narrow mouth and/or spigot) could help ensure that water collected from the handpump does not deteriorate in quality during storage.
Only 6% of water committees said that they believed their handpump would be functioning in 10 years. Whereas it could be argued that water committees were being strategic in their responses so as to obtain additional external support, the Stanford-VT team is also concerned about the long-term performance of the handpumps. It is not clear whether the district government is prepared to fulfill their obligation to finance major repairs, nor to respond to the felt needs among water committee members for more training and capacity building in financial management, operation and maintenance, and hygiene and sanitation. A small stipend or other material incentive for water committee members may also be necessary to ensure that the committees continue to function at a high level over the life of the handpump. In addition, the increasing number of handpumps installed in Nampula (and other provinces in Mozambique), combined with the rapidly improving telecommunications networks, provides a foundation on which new handpump maintenance models can be explored.
91
9.NEXT STEPS/FUTURE ANALYSIS
The Stanford-VT team intends to develop a series of academic papers based on this research that will present an in-depth look at several specific research questions of interest outlined below. In addition, we welcome collaboration with the MCC to help answer research questions of specific interest through the careful analysis and interpretation of the collected data.
1. In this report we primarily analyzed the data at the community level using community medians because the handpump intervention was intended to affect entire communities or neighborhoods within a community. In a future paper we intend to investigate the impacts of the handpumps at the household level, by looking at the 73% of households from the baseline study that were surveyed again during the follow-up study. With these rich panel data, we intend to investigate in detail the factors affecting changes in the volume of water collected and the time spent collecting water.
2. We intend to use the panel data to investigate at the household and person level the differential impacts of the handpumps on water volume and time spent collecting water by gender and age. The analysis will also consider which groups benefited the most from the handpumps – with a focus on gender and age groups. To the extent possible this paper will also look at whether the benefits depend on the household income level.
3. We plan to compare the impacts between households that use and do not use the handpump within the treatment communities. It should be possible to match (on key demographic variables) households from treatment communities that exclusively use a handpump with households from treatment or comparison communities that do not use a handpump and analyze how the users of handpumps differ from non-users.
4. In this report, we analyzed how the distance from a household to a handpump affected the likelihood of a household using the handpump and the volume of water the household collected from the handpump. We intend to expand this analysis in a future paper to consider the distances from households to traditional water sources (such as wells and rivers) and other household factors that might influence or predict (1) the likelihood of a household using a handpump and (2) the volume of water a household collects from a handpump.
5. Whereas our focus for the impact evaluation was on diarrheal disease incidence among children, we also collected data that allow us to compute height-for-age Z-scores for children under the age of 4 in sample households. Given the

Impact Evaluat Ion of thE mozamb IquE RuRal WatER Supply act Iv I ty 92
movement in the WASH/health literature toward evaluating impacts in terms of child growth and development, we can compare the HAZ scores in treatment communities before and after the installation of handpumps – although it is important to note that a two-year interval may be an insufficient period to detect effects on stunting.
6. We are currently working to analyze collected data on the perceived physical exertion and pain associated with water fetching relative to other household tasks. We have observed that perceptions of both exertion and pain from fetching in treatment communities declined markedly between the pre- and post- installation periods, whereas perceptions in comparison villages are largely unchanged. We are developing a multivariate repeated measures model to identify the factors associated with changes in stated perceptions (e.g., reduction in distance to water source; reduction in daily time devoted to fetching; shift from traditional wells to a handpump as the primary source; social desirability bias). The goal of this work is to spur reflection about broadening the idea of “health” associated with water supply interventions.
7. We plan to estimate the impact of the handpump installation on the daily caloric cost of water fetching. We have data on distances traveled and volumes of water carried. We are planning (with support from another funder) to complete a biometric study to estimate the metabolic requirements of water fetching under different conditions. With these biometric data, we will be able to estimate the total caloric cost of water fetching by our sample households, as well as the caloric “savings” generated by the installation of the MCA handpumps.
8. Another research interest is the inter-relationship of factors that may affect the technical and financial performance and sustainability of the handpumps such as fees, access to spare parts, distance to cities, and timeliness of repairs.
9.1 Dissemination procedures
The results from the impact evaluation of the MCA’s RWPIP will be published in a series of academic papers and presented at conferences in the US and overseas

93
10.REFERENCES
Arku, F. 2010. Time savings from easy access to clean water: Implications for rural men’s and women’s well-being. Progress in Development Studies 10(3): 233-246.
Asthana, A. 1997. Where the Water is Free but the Buckets are Empty: Demand Analysis of Drinking Water in Rural India. Open Economies Review 8(2): 137–149.
Berkman, D.S.; Lescano, A.G.; Gilman, R.H.; Lopez, S.L. and Black, M.M. 2002. Effects of Stunting, Diarrhoeal Disease, and Parasitic Infection During Infancy on Cognition in Late Childhood: A Follow-Up Study. Lancet 359(9306): 564–571.
Blum, D. and Feacham, R.G. 1983. Measuring the Impact of Water Supply and Sanitation Investments on Diarrheal Diseases: Problems of Methodology. International Journal of Epidemiology 12(3): 357–365.
Boardman, A.E.; Greenberg, D.; Vining, A. and Weimer, D. 1996. Cost-Benefit Analysis: Concepts and Practice. New Jersey: Prentice Hall.
Cairncross, S. 2003. Water supply and snaitation: Some misconceptions. Tropical Medicine and International Health 8(3): 193–195.
Cairncross, S. and Cliff, J.L. 1987. Water use and health in Mueda, Mozambique. Transactions of the Royal Society of Tropical Medicine and Hygiene 81(1): 51-54.
Carruthers, I.D. 1973. “Impact and Economics of Community Water Supply. Kenya: Agrarian Development Unit.
Churchill, A.A. 1987. Rural water supply and sanitation: time for a change. World Bank Discussion Paper 18. Washington, D.C.: World Bank.
Cowater. 2010. Cabo delgado and nampula rural water point installation program mozambique: Pre-design report. Maputo: Cowater International Inc. and Solomon Lda.
---. 2011. Quarterly progress report: January 1 to March 31. Maputo: Cowater International Inc. and Solomon Lda.
---. 2013. Final End of Project and Monitoring and Evaluation Report. Maputo: Cowater International Inc. and Solomon Lda.
Crow, B.; Swallow, B. and Asamba, I. 2012. Community organized household water increases not only rural incomes, but also men’s work. World Development 40(3): 528-541.
Esrey, S.A. 1996. Water, waste, and well-being: a multicountry study. American Journal of Epidemiology 143(6): 608-623.
Esrey, S.A.; Feachem, R. and Hughes, J. 1985. Interventions for the Control of Diarrheal Diseases among Young Children: Improving Water Supplies and Excreta Disposal Facilities. Bulletin of the World Health Organization 63(4): 757-772.

Impact Evaluat Ion of thE mozamb IquE RuRal WatER Supply act Iv I ty 94
Esrey, S.A. and Habicht, J.-P. 1986. Epidemiologic Evidence for Health Benefits from Improved Water and Sanitation in Developing Countries. Epidemiology Review 8: 117-128.
Esrey, S.A.; Potash, J.B.; Roberts, L. and Shiff, C. 1991. Effects of Improved Water Supply and Sanitation on Ascariasis, Diarrhea, Dracunculiasis, Hookworm Infection, Schistosomiasis, and Trachoma. Bulletin of the World Health Organization 69(5): 609–621.
Fewtrell, L.; Kaufman, R.B.; Kay, D.; Enanoria, W.; Haller, L. and M., C.J. 2005. Water, sanitation, and hygiene interventions to reduce diarrhoea in less developed countries: a systematic review and meta-analysis. Lancet Infectious Disease 5(1).
Gasana, J.; Morin, J.; Ndikuyeze, A. and Kamoso, P. 2002. Impact of water supply and sanitation on diarrheal morbidity among young children in the socioeconomic and cultural context of Rwanda. Environmental Research 90: 76-88.
Geere, J.; Hunter, P. and Jagals, P. 2010. Domestic water carrying and its implications for health: A review of mixed methods pilot study in Limpopo Province, South Africa. Environ. Health (9): 52–63.
Guerrant, R.L.; Aldo Lima, A.M. and Davidson, F. 1992. Diarrhea as a Cause and Effect of Malnutrition: Diarrhea Prevents Catch-up Growth and Malnutrition Increases Diarrhea Frequency and Duration. American Journal of Tropical Medicine and Hygiene 47(1): 28-35.
Hall, R.P.; Van Houweling, E. and Van Koppen, B. 2013. The Human Right to Water: The Importance of Domestic and Productive Water Rights. Science and Engineering Ethics: Available at: http://link.springer.com/article/10.1007/s11948-013-9499-3.
Harris, A.; Davis, J. and Boehm, A. 2013. Mechanisms of post-supply contamination of drinking water in Bagamoyo, Tanzania. Journal of Water and Health 11(3): 543–554.
Humphrey, J.H. 2009. Child undernutrition, tropical enteropathy, toilets, and handwashing. Lancet 374: 1032-1035.
Ilahi, N. and Grimard, F. 2000. Public Infrastructure and Private Costs: Water Supply and Time Allocation of Women in Rural Pakistan. Economic Development and Cultural Change 49(1): 45.
Jäger, H.J.; Gordon-Harris, L.; Mehring, U.M.; Goetz, G.F. and Mathias, K.D. 1997. Degenerative change in the cervical spine and load-carrying on the head. Skeletal Radiology 26(8): 475-481.
James, A.J.; Verhagen, J.; Wijk, C.v.; Nanavaty, R.; Parikh, M. and Bhatt, M. 2002. Transforming time into money using water: A participatory study of economics and gender in rural India. Natural Resources Forum 26(3): 205-217.
Jensen, P.K.; Ensink, J.H.J.; Jayasinghe, G.; van der Hoek, W.; Cairncross, S. and Dalsgaard, A. 2003. Effect of chlorination of drinking water on water quality and childhood diarrhoea in a village in Pakistan. J Health Popul Nutr 21: 26-31.
Kremer, M.; Leino, J.; Miguel, E. and Zwane, A. 2006. Spring Cleaning: Results from a Randomized Impact Evaluation of a Source Water Quality Improvement. Berkeley: University of California.

95
Kulindwa, K. 2008. Rural Water Supply Projects Appraisal and Poverty Eradication in Tanzania. In Hemson, D.; Kulindwa, K.; Lein, H. and Mascarenhas, A. (Eds), Poverty and Water; Explorations of the Reciprocal Relationship, pp. New York: Zed Books.
Levy, K.; Nelson, K.; Hubbard, A. and Eisenberg, J. 2008. Following the Water: A Controlled Study of Drinking Water Storage in Northern Coastal Ecuador. Environ Health Perspect 116(11): 1533–1540.
Lindskog, P. and Lundqvist, J. 1989. Why poor children stay sick: the human ecology of child health and welfare in rural Malawi. Uppsala: Scandinavian Institute of African Studies Research Report No. 85.
Marks, S. and Davis, J. 2012. Does user participation lead to sense of ownership for rural water systems? Evidence from Kenya. World Development 40(8): 1569-1576.
MCA-Mozambique. 2009. Monitoring and evaluation plan. Maputo: Millenium Challenge Account-Mozambique.
---. 2010. Procurement of small works. Maputo: Millenium Challenge Account-Mozambique.
Millennium Challenge Corporation (MCC). 2007. Mozambique Water Supply and Sanitaiton Project: ERR Summary. Washington, D.C.: Millennium Challenge Corporation.
MIPAR. 2001. Manual de implementaco de projectos de agua rural (rural water implementation manual). Maputo: Ministry of Public Works and Housing Rural Water Department.
MISAU. 2004. Regulamento sobre a Qualidade de Água para Consumo Humano. Boletim da República de Moçambique, I Série, Nr. 37. Diploma Ministerial 180/2004 de 15 de Setembro.
Niehaus, M.D.; Moore, S.; Patrick, P.; Derr, L.; Lorntz, B. and Lima, A. 2002. Early Childhood Diarrhea isAssociated with Diminished Cognitive Function Four to Seven Years Later in Children in a Northeast Brazilian Shantytown. American Journal of Tropical Medicine and Hygiene 66(5): 590-593.
Pickering, A. and Davis, J. 2012. Freshwater availability affects child health in sub-Saharan Africa. Environmental Science & Technology: DOI: 10.1021/es203177v.
Pickering, A.; Julian, T.R.; Marks, S.J.; Mattioli, M.; Boehm, A.B.; Schwab, K. and Davis, J. 2012. Fecal contamination and diarrheal pathogens on surfaces and in soils among Tanzanian households with and without improved sanitation. Environmental Science and Technology 46(11): 5736-5743.
Renwick, M.; Joshi, D.; Huang, M.; Kong, S.; Petrova, S.; Bennett, G.; Bingham, R.; Fonseca, C.; Moriarty, P.; Smits, S.; Butterworth, J.; Boelee, E. and Jayasinghe, G. 2007. Multiple Use Water Services for the Poor: Assessing the State of Knowledge. Arlington, VA: Winrock International.
Rosen, S. and Vincent, J.R. 1999. Household Water Resources and Rural Productivity in Sub-Saharan Africa: A Review of the Evidence. Harvard Institute for International Development Discussion Paper 673.
Sorenson, S.; Morssink, C. and Campos, P. 2011. Safe access to safe water in low income countries: Water fetching in current times. Social Science & Medicine 72: 1522-1526.

Impact Evaluat Ion of thE mozamb IquE RuRal WatER Supply act Iv I ty 96
Tonglet, R.; Isu, K.; Mpese, M.; Dramaix, M. and Hennart, P. 1992. Can improvements in water supply reduce childhood diarrhoea? Health Policy Plan 7: 260-268.
Van Houweling, E.; Hall, R.; Sakho Diop, A.; Davis, J. and Seiss, M. 2012. The role of productive water use in women’s livelihoods: Evidence from rural Senegal. Water Alternatives 5(3): 658-677.
van Koppen, B.; Smits, S.; Moriarty, P.; Penning de Vries, F.; Mikhail, M. and Boelee, E. 2009. Climbing the water ladder: Multiple use services for poverty reduction. The Hague, The Netherlands: IRC International Water and Sanitation Centre and International Water Management InstituteTP series; no. 52].
White, G.F.; Bradley, D.J. and White, A.U. 1972. Drawers of water: domestic water use in East Africa. Chicago: University of Chicago Press.
Whittington, D.; Hanemann, M.; Sadoff, C. and Jeuland, M. 2008. The challenge of improving water and sanitation in less developed countries. Foundations and Trends in Microeconomics 4(6-7).
Whittington, D.; Mu, X. and Roche, R. 1990. Calculating the value of time spent collecting water: some estimates for Ukunda, Kenya. World Development 18(2): 269-280.
World Health Organization (WHO). 1997. Water Quality Guidelines for Rural Drinking Water Supplies. Surveillance and Control of Community Supplies, 2nd edition. Geneva: World Health Organisation Press.
Wright, J.; Gundry, S. and Conroy, R. 2004. Household Drinking Water in Developing Countries: A Systematic Review of Microbiological Contamination between Source and Point of Use. Tropical Medicine and International Health 9(1): 106–117.
Zwane, A.P. and Kremer, M. 2007. What Works in Fighting Diarrheal Diseases in Developing Countries? A Critical Review. CID Working Paper No. 140. Cambridge: Center for International Development, Harvard University.
97
Appendix A Developing the Sample Frame
This Appendix provides a discussion of the key decisions that shaped the structure of the sample frame and outlines the approach used to select the treatment and comparison communities into the sample. The Appendix also provides a detailed discussion of the changes that occurred in several Phase 1 and 2 treatment and comparison communities during the two years between the baseline and follow-up studies.
Key Decisions that Shaped the Nampula Sample Frame
The decision to limit the evaluation to Nampula province (excluding Cabo Del-gado) was made in 2009 as a result of both budgetary and validity concerns. Through consultation with MCC staff the Stanford-VT team concluded that spread-ing the available evaluation resources across both provinces would (1) substan-tially reduce the number of communities and households that could be included in the study and (2) result in a sample frame that did not allow for meaningful comparisons between the provinces.
The rural water program was based on principles laid out in the MIPAR, the rural water supply implementation manual developed by the Rural Water Department of Mozambique’s National Directorate of Water, housed in the Ministry of Pub-lic Works. The MIPAR operationalizes national water policy by providing imple-mentation guidelines for relevant institutions at the national, provincial, district, and community level. Key among the MIPAR principles is a demand-responsive (rather than supply driven) orientation, including the requirement that communities participate throughout the planning, construction, operation, and maintenance of rural water infrastructure.
Given the MIPAR framework underpinning Mozambique’s rural water sub-sector, the allocation of water points in the MCC-supported project had to be based on communities’ meeting the eligibility criteria for the program (e.g., forming a water committee, contributing toward the capital cost of the handpump, etc.). From an impact evaluation perspective, the ideal strategy for a sample frame would be to identify all communities that met these criteria, then to randomly select a subset of those to receive a handpump. Such an approach was deemed infeasible from the perspective of procedural fairness. For example, a number of communities had been approved for a handpump as part of a previous project (ASNANI) but were ultimately left unserved when project resources were exhausted. Randomization

Impact Evaluat Ion of thE mozamb IquE RuRal WatER Supply act Iv I ty 98
of water points in the MCA rural water project would have conflicted with the privileged status that these communities were considered to have in the selection process.
As a second option, the Stanford-VT team proposed a randomized roll-out of wa-ter point installation among communities that were approved to receive a hand-pump in the MCA rural water program. The evaluation strategy envisioned was to use communities in the latter ‘waves’ of handpump installation as controls for the earlier waves. This too was viewed as infeasible, as it would impede the con-tractor’s ability to organize drilling and well installation in the most cost-effective manner and make it impossible to reach the RWPIP construction targets within the available budget.
The Stanford-VT team then proposed that those communities who were approved to receive a handpump in Phase 1 and 2 of the program, but who were subse-quently found to have unfavorable geophysical conditions and were rejected from the program, could serve as control communities for the impact evaluation. The idea of collecting data from these communities was strongly resisted by the MCA, based on the concern that these communities might confuse this action as signaling that they were still part of the rural water program. Additional concerns were raised about the potential for these communities to respond negatively to-ward outside groups asking questions about water-related issues, following the disappointing experience of a negative borehole test.
A fourth proposal put forward by the Stanford-VT team was to select communities that were not part of the rural water program, and that did not have access to an improved water sources, from the same districts in which the rural water program is operating. This proposal was rejected by the DPOPH in Nampula, based on concerns that the presence of a research team in these communities might raise their expectations for receiving a water supply improvement in the future.
After considerable discussion among the Stanford-VT team, MCC and MCA staff, and senior officials of the DPOPH, it was ultimately agreed that comparison communities would only be selected from localidades (or localities, the lowest geographical level of the central state administration that normally consists of multiple communities) that were benefitting from at least one MCA handpump. This approach was the only one that received the support of the Director of the DPOPH in Nampula, who subsequently granted the Stanford-VT team permission to conduct the study. It was also discussed with the staff in the National Statistics Institute of Mozambique (INE), whose endorsement was critical to the study’s cred-ibility. The final approach also resulted in comparison communities being selected from within the same locality as a community receiving an MCA handpump, i.e., in closer geographic proximity as compared to sampling at the district level.
The procedure by which comparison communities were selected began by the

99
Stanford-VT team meeting with the Chefe de localidade to explain the study and seek permission to conduct research in a given locality. The team then explained to the Chefe the need to select a community to compare against the community receiving an MCA handpump. The Chefe was asked to work with the field team to develop a list of comparison communities – none of which had a handpump – located within his localidade. Those communities that were included in Phase 1 or 2 of the rural water program were removed from the list, along with communities that were originally approved for the program but were subsequently removed due to unfavorable geophysical conditions (e.g., negative test borehole results, as explained above).
Once the list was developed, the Chefe was asked to personally select one com-munity at random by drawing a slip of paper out of a hat. Because the Chefe de localidade was fully involved in the selection of the comparison community, he was well positioned to answer any questions that might arise about why a community not included in the rural water project had been included in the study.
The time required for the protracted discussion between the Stanford-VT team, MCC, MCA, DPOPH, and INE of how to identify a suitable set of comparison communities effectively made data collection before the installation of Phase 1 water points an impossibility. Acknowledging the lack of pre-intervention data in these communities, the decision to include them in the study sample was the result of several important considerations. First, since Phase 1 and 2 of the rural water program each targeted three different districts, if Phase 1 had been excluded we would have only studied one-half of the rural water program in Nampula. Second, including Phase 1 communities in the sample meant that we could study the performance of, and benefit streams from, the handpump beyond its one-year warranty. When designing the baseline sample, there was a concern that some of the handpumps in Phase 2 might be installed within months or weeks of the 2013 follow-up study. The inclusion of Phase 1 communities in the study meant that we could collect data on the performance and impact of the handpumps at least two years after their installation, which was deemed important by MCC/MCA staff.
Third, based on the high occurrence of negative geophysical results among other-wise eligible communities in Phase 1 of the rural water program, the Stanford-VT team was concerned that the same situation might occur during Phase 2. Including Phase 1 communities with operational handpumps in the baseline ensured that we captured data on the effects of providing water supply from improved sources. We note that eight of our original 18 Phase 2 treatment communities did indeed obtain negative geophysical results, suggesting that such concern was warranted (see Table A.2 below).
Finally, since the MCA had not selected the Phase 3 communities at the time of the baseline study, it was not possible to include this group in the design of the sample. Thus, Phase 1 was also included to ensure that data were collected on two

Impact Evaluat Ion of thE mozamb IquE RuRal WatER Supply act Iv I ty 100
of the three phases of the rural water program in Nampula.
The Nampula Sample Frame
Given the above context, the sample frame was developed to draw confident causal inference about the impacts attributable to the installation of water points in the RWPIP. Following the purposive first-stage selection of Nampula, the selec-tion of districts, communities, and households was conducted as follows:
• District selection: Sampling of treatment communities was based on the completed and planned water point interventions in Phases 1 and 2, respectively. [Note: the RWPIP had three phases (or rounds) during which handpumps were installed in communities in Nampula and Cabo Delgado. The phases generally focused on groups of districts within each province.]
• Comparison communities: Comparison communities were randomly selected from the same localities as the sampled treatment communities. This approach meant that only localities that were involved with the MCA’s RWPIP were contacted.
• Phase 3: Phase 3 communities were not included in the sample frame due to the following constraints: (1) the list of communities receiving a water point was not available prior to the commencement of the 2011 baseline study; and (2) Phase 3 water point installations occurred toward the end of the program, which meant that insufficient time would have passed for the full impacts of the interventions to be realized before the 2013 follow-up study. However, three of the original comparison communities received an MCA water point during Phase 3 and are considered as Phase 2 treatment communities in the follow-up study.
• Household selection: During the baseline study, households were selected using the following process:
1. Upon arrival in the community, the surveying team leader met with the community leader and confirmed that the household survey could begin within the community.
2. The surveying team leader then met with the community guide and was taken to the start point of the surveying cluster:
• Treatment community: The start point was the recently installed handpump or the planned location of the handpump.
• Comparison community: The start point was the house of the comunity leader.
3. From the start point a bottle/pen was spun to identify the direction of a

101
random line running from the start point. The first and second enumerators walked in opposite directions along this line. The bottle/pen was spun again to establish the line for the remaining enumerator and team leader. Every second household encountered by the surveyor was selected for the survey. If an enumerator reached the edge of a community, he/she returned to the start point and spun a bottle/pen again to identify a new random direction.
4. Around 27 to 30 households were interviewed in each cluster. During the follow-up study, if a respondent from the baseline study was not avail-able to interview or had left the community, a replacement household was randomly selected.
Phase 1: Handpump (XHP) installed before baseline survey
Baseline 2011 Follow-up 2013
Treatment XHP1 t0 t1
Comparison t0 t1
Phase 2: Handpump (XHP) installed after baseline survey
Baseline 2011 Follow-up 2013
Treatment t0 XHP2 t1
Comparison t0 t1
Table A.1 presents a summary of the baseline sample frame, which contained 3 treatment and 3 comparison communities from each of the Phase 1 districts and 6 treatment and 6 comparison communities from each of the Phase 2 districts (see Figure A.1).
Figure A.2 presents the timeline of activities relating to the sample frame.
District in Nampula Total Population 201020
MCA Phase
Expected No. of MCA Water Points
No. of MCA Water Points in Sample
Frame
No. of Treatment
Communities Sampled
No. of Comparison Communities
Sampled
Meconta 170,299 1 30 30 3 3Mogovolas 313,863 1 40 40 3 3Nampula-Rapale 234,713 1 30 30 3 3Moma 337,503 2 60 60 6 6Mogincual 144,433 2 44 34 6 6Murrupula 155,071 2 52 52 6 6Totals 1,355,882 - 256 246 27 27
Table A.1: Baseline Sample Frame
20 Source: projections made by INE (National Bureau of Statistics) based on Census 2007.

Impact Evaluat Ion of thE mozamb IquE RuRal WatER Supply act Iv I ty 102
Identified Limitations
The sampling strategy represents a balance between resources and desired out-comes. The sampling strategy has some known limitations:
• The sampling is representative within the cluster level,21 but depending on the community size, may not be representative at the community level.
• The sampling of the treatment clusters is over-represented with respect to the total population. Thus, while the design is appropriate and statisti cally valid for the project evaluation, adjustments to full-sample results would need to be made in order to generalize them to the parent population. The Stanford-VT team has requested from INE the necessary weightings to make such comparisons.
Sample Integrity Following 2011 Baseline
Following the 2011 baseline study a number of changes occurred in several treatment and comparison communities that affected the structure of the sample. As indicated in Table A.2, water points have been installed in 17 of the 27 treatment communities. Three of the 17 communities receiving a water point also benefited from additional hygiene-, sanitation-, and health-related interventions
FIGURE A.1Map Indicating the Number of Sample
Communities per District
21Within each sampled community, the households selected into the study were located within a cluster of households, or quateirão, of approximately 500 people. The rationale for focusing on a cluster/quateirão was that (1) each water point is intended to serve 500 people, and (2) assuming approximately 5 people per household, the cluster will include approximately 100 households. This number of households is comparable with enumeration areas as used by Mozambique’s national statistics institute, INE. In communities with no sub-divisions, the entire community was included in the cluster. In communities with multiple quarteiraõs, the community leader was asked to randomly select one. During the baseline survey, community guides were asked to aid in identifying the households belonging to the selected cluster.

103
(most commonly from the USAID program Strengthening Communities through Integrated Programing (SCIP)).
In addition, an MCA water point was installed in an 18th treatment community (community #6), but was placed approximately 3km away from the area where households surveyed during the baseline are located. Given the great distance between the water point and sample households, this community will be consid-ered a member of the comparison cohort.
In another of the treatment communities, a World Vision water point was installed just before the commencement of Phase 2 of the MCA RWPIP. As a result, the MCA did not install their own water point as initially planned. This community has been removed from the analysis.
In the remaining eight originally classified treatment communities, geophysical surveys or drilling revealed that it was not possible to install a water point in the
FIGURE A.2Structure of the Sample Frame

Impact Evaluat Ion of thE mozamb IquE RuRal WatER Supply act Iv I ty 104
ID DistritoCurrent Status
(P1 T = Phase 1 Treatment; P2 T = Phase 2 Treatment; P2 C = Phase 2 Comparison)
01 Rapale Water point installed. No other intervention. P1 T02 Rapale Water point installed. No other intervention. P1 T27 Rapale Water point installed. Hygiene and sanitation intervention by SCIP. P1 T03 Meconta Water point installed. No other intervention. P1 T04 Meconta Water point installed. No other intervention. P1 T05 Meconta Water point installed. No other intervention. P1 T06 Mogincual Water point installed 2.7-3.4 km away from the households surveyed at
baseline. No other intervention.P2 C
07 Mogincual Water point installed. No other intervention. P2 T08 Mogincual Negative geophysical results. No water point installed during Phase 2.
Water point installed in a nearby community during Phase 3.P2 C
09 Mogincual Water point installed. No other intervention. P2 T10 Mogincual Water point installed. No other intervention. P2 T11 Mogincual Water point installed. No other intervention. P2 T12 Moma Negative geophysical results. No water point installed. Sanitation
intervention by ADECOM.P2 C
13 Moma Negative geophysical results. No water point installed. Hygiene & sanitation intervention by SCIP.
P2 C
14 Moma Negative geophysical results. No water point installed. Hygiene & sanitation intervention by SCIP.
P2 C
15 Moma Negative geophysical results. No water point installed. Hygiene & sanitation intervention by SCIP.
P2 C
16 Moma Water point installed. No other intervention. P2 T17 Moma Negative geophysical results. No water point installed. P2 C18 Mogovolas Water point installed. No external intervention. P1 T19 Mogovolas Water point installed. Interventions by Okhalihana (2011, population), SCIP
(2011, HIV/AIDS, hygiene & sanitation), and Ocumi (2008 food security & health).
P1 T
20 Mogovolas Water point installed. Interventions by ADPP (2011, HIV/AIDS), AFRICA CUAM (2010, microfinance and small enterprise), and Save the Children (2009-2012, nutrition).
P1 T
21 Murrupula Water point installed. No other intervention. P2 T22 Murrupula No water point installed due to high risk of negative borehole. No external
intervention so far.P2 C
23 Murrupula Water point installed. No other intervention. P2 T
24 Murrupula Negative geophysical results. No water point installed. P2 C25 Murrupula Water point installed. No other intervention. P2 T
Table A.2: Integrity of Treatment Communities

105
community. Since these communities did not receive a water point through the RW-PIP they will be considered as comparison communities in the impact evaluation analysis.22
Five of the six treatment communities in Moma did not receive a water point due to unfavorable geophysical conditions. In an effort to capture some of the impacts of MCA water points in Moma, eight Phase 2 treatment communities were added in Moma for the follow-up study (which increases the total number of communities studied from 54 to 62). These communities are listed in Table A.3 and were chosen because they are located within the same localities as the other Moma communi-ties in our study. However, one of the eight communities was found to not have a handpump, even though records indicated that one had been installed. A post-hoc comparison of the seven new Phase 2 treatment communities and the five com-munities with negative handpumps in Moma will permit the drawing of inferences about some of the impacts associated with MCA water points.
Table A.4 summarizes the status of the original 27 comparison communities. Nine-teen of the communities originally classified as comparison communities had not received an MCA handpump at the time of the follow-up study. One of the 27 comparison communities has been reclassified as a Phase 1 treatment community due to the presence of an MCA handpump in the community during the baseline. Three of the original 27 comparison communities received a water point during Phase 2 and four received a water point during Phase 3 of the RWPIP. Analysis of the baseline data suggests that these communities were similar to the other com-parison communities; therefore, all eight of these communities were reclassified as treatment communities.
Finally, of the 19 communities originally classified as comparison communities, which did not receive a water intervention, seven were involved with a health- and/or sanitation-related project that was not part of the RWPIP. Thus, 12 of the 27 comparison communities can be considered as being generally unaffected by other projects.
In summary, nine treatment communities have been reclassified as comparison communities and one has been removed from the sample (due to the installation of a World Vision handpump) (Table A.2), seven treatment and one compari-son community in Moma have been added to the sample (Table A.3); and eight comparison communities have been reclassified as treatment communities (Table A.4). Table A.5 provides a summary of the final sample frame that is referred to in the analysis in Section 7.
22 During the follow-up study, the Stanford-VT team discussed with the MCA and Cowater the challenges associated with surveying “negative” treatment communities. As a result of these discussions, the training protocol was subsequently updated to ensure that enumerators were fully briefed on the potential problems faced by “negative” communities, and how they should manage confrontational or other situations that might arise during the household survey. During the follow-up study, the enumerators did not report any problems related to undertaking household surveys in the “negative” treatment communities.

Impact Evaluat Ion of thE mozamb IquE RuRal WatER Supply act Iv I ty 106
ID Distrito Current Status(P2 T-M = Phase 2 Treatment Moma; P2 C = Phase 2 Comparison)
82 Moma New Phase 2 Treatment community in Moma. P2 T-Moma83 Moma No handpump was installed in the community. P2 C84 Moma New Phase 2 Treatment community in Moma. P2 T-Moma85 Moma New Phase 2 Treatment community in Moma. P2 T-Moma86 Moma New Phase 2 Treatment community in Moma. P2 T-Moma87 Moma New Phase 2 Treatment community in Moma. P2 T-Moma92 Moma New Phase 2 Treatment community in Moma. P2 T-Moma96 Moma New Phase 2 Treatment community in Moma. P2 T-Moma
Table A.3: New Phase 2 Treatment Communities in Moma

107
ID DistritoStatus
(P1 T = Phase 1 Treatment; P2 T = Phase 2 Treatment; P1 C = Phase 1 Comparison; P2 C = Phase 2 Comparison)
51 Rapale No external intervention. P1 C52 Rapale No external intervention. P1 C77 Rapale Received a water point during the 2008 ASNANI project. External hygiene
and sanitation intervention by SCIP. HHs not using water point in 2011.P1 C
53 Meconta No external intervention. P1 C54 Meconta An MCA handpump had been installed in the community during Phase 1. P1 T55 Meconta No external intervention. P1 C56 Mogincual Cowater verified a water point in this community. Likely Phase 2. P2 T 57 Mogincual Water point installed in Phase 3. P2 T58 Mogincual Water point installed in Phase 2. P2 T59 Mogincual No external intervention. P2 C60 Mogincual Water point installed in Phase 3. P2 T61 Mogincual No external intervention. P2 C62 Moma External hygiene and sanitation intervention by SCIP. P2 C63 Moma External hygiene and sanitation intervention by SCIP. P2 C64 Moma External hygiene and sanitation intervention by SCIP. P2 C65 Moma External hygiene and sanitation intervention by SCIP. P2 C66 Moma External hygiene and sanitation intervention by SCIP. P2 C67 Moma External hygiene and sanitation intervention by SCIP. Water point installed
during Phase 2.P2 T
68 Mogovolas External intervention by WE Consult (water supply), CULIMA (HIV/AIDS prevention), WETT (domestic violence), OPHAVELA (population), Ministry of Agriculture (food assurance), and Medicos sem Fronteira (health). Water point installed during Phase 3.
P2 T
69 Mogovolas External intervention of Save the Children (2009-2012 nutrition program). Water point installed during Phase 3.
P2 T
70 Mogovolas No external intervention. Treated as comparison community for Phase 1 and 2 due to proximity to communities in both phases.
P1 C & P2 C
71 Murrupula No external intervention. P2 C
72 Murrupula External intervention of SANA (project on mother-child health). P2 C
73 Murrupula No external intervention. P2 C74 Murrupula No external intervention. P2 C75 Murrupula Cowater drilled two negative boreholes during Phase 2. No external
intervention.P2 C
76 Murrupula No external intervention. P2 C
Table A.4: Integrity of Comparison Communities

Impact Evaluat Ion of thE mozamb IquE RuRal WatER Supply act Iv I ty 108
Community Classification
Number of Communities in
Group
Number of Communities by
DistrictComments
Phase 1
Treatment 104 Meconta3 Mogovolas3 Rapale
Since the treatment communities had received a handpump before the baseline study, the data collected from the Phase 1 treatment and comparison communities will be used to evaluate the sustainability of impacts over time.
Comparison 62 Meconta1 Mogovolas3 Rapale
Phase 2 Treatment 15
8 Mogincual3 Murrupula2 Mogovolas2 Moma
Since the handpumps were installed in the treatment communities after the baseline study, the data from the treatment and comparison communities will be used to evaluate the ‘impacts’ from the RWPIP using a difference in differences evaluation methodology.
Table A.5: Final Sample Frame

109
Appendix B Phase 1 Difference-in-Differences Analyses
Table B.1: Phase 1 Median Total Liters per Capita per Day (LPCD) (All Sources)
Baseline Follow-Up Difference
Phase/CommunityNumber of
CommunitiesMean of Median LPCD Mean of Median LPCD LPCD
Treatment 10 24.9 19.7 -5.2*Comparison 6 21.0 19.4 -1.6
Difference in Differences -3.6
Table B.2: Phase 1 Median Total Liters per Capita per Day from Improved Sources (LPCD)
Baseline Follow-Up Difference
Phase/CommunityNumber of
CommunitiesMean of Median LPCD Mean of Median LPCD LPCD
Treatment 10 11.5 13.4 1.9Comparison 6 0 0 0
Difference in Differences 1.9Significance codes: ‘***’ p<0.001; ‘**’ p<0.01; ‘*’ p<0.05; ‘.’ p<0.1
Baseline Follow-Up Difference
Phase/CommunityNumber of
CommunitiesMean of Median LPD Mean of Median LPD LPD
Treatment (all sources)
10 99.7 77.6 -22.1.
Comparison (all sources)
6 75.0 74.3 -0.6
Treatment (improved) 10 47.4 53.7 6.3Comparison (improved) 6 0 0 0
Significance codes: ‘***’ p<0.001; ‘**’ p<0.01; ‘*’ p<0.05; ‘.’ p<0.1
Table B.3: Phase 1 Median Total (All Sources) and Improved Liters per Day (LPD)

Impact Evaluat Ion of thE mozamb IquE RuRal WatER Supply act Iv I ty 110
Baseline Follow-Up Difference
Phase/CommunityNumber of
CommunitiesMean of Median MPD Mean of Median MPD MPD
Treatment 10 188 295 107*Comparison 6 231 230 -1
Difference in Differences 108Significance codes: ‘***’ p<0.001; ‘**’ p<0.01; ‘*’ p<0.05; ‘.’ p<0.1
Table B.4: Phase 1 Median Total Minutes Per Day (MPD) Spent Collecting Water (All Sources) by Household
Baseline Follow-Up Difference
Phase/CommunityNumber of
CommunitiesMean of Median MPD Mean of Median MPD MPD
Treatment 10 46 74 29*Comparison 6 83 77 -5
Difference in Differences 34.
Significance codes: ‘***’ p<0.001; ‘**’ p<0.01; ‘*’ p<0.05; ‘.’ p<0.1
Table B.5: Phase 1 Median Total Minutes Per Day (MPD) Spent Collecting 20 Liters of Water (All Sources)
Table B.6: Phase 1 Mean Percentage of Households (HHs) Stating that School Attendance Affects School Attendance
Baseline Follow-Up Difference
Phase/CommunityNumber of
Communities
Mean % HHs Stating that Water Fetching
Affects School Attendance
Mean % HHs Stating that Water Fetching
Affects School Attendance
Change in Percentage
Treatment 10 16.3% 10.7% -5.6%Comparison 6 22.5% 19.2% -3.3%
Difference in Differences -2.3%Significance codes: ‘***’ p<0.001; ‘**’ p<0.01; ‘*’ p<0.05; ‘.’ p<0.1
Table B.7: Phase 1 Percentage of Households Using Latrines
Baseline Follow-Up Difference
Phase/CommunityNumber of
Communities% HHs Using Latrine % HHs Using Latrine Change in Percentage
Treatment 10 53.8% 50.7% -3.1%Comparison 6 56.7% 56.1% -0.6%
Difference in Differences -2.5%Significance codes: ‘***’ p<0.001; ‘**’ p<0.01; ‘*’ p<0.05; ‘.’ p<0.1

111
Table B.8: Phase 1 Median Number of Times Per Day Respondent Reported Washing Hands
Baseline Follow-Up Difference
Phase/CommunityNumber of
CommunitiesNumber of Times Washing Hands
Number of Times Washing Hands
Change
Treatment 10 3.8 4.2 0.4Comparison 6 3.2 4.3 1.1**
Difference in Differences -0.7Significance codes: ‘***’ p<0.001; ‘**’ p<0.01; ‘*’ p<0.05; ‘.’ p<0.1
Table B.9: Phase 1 Percentage of Households Indicating Satisfaction with Sanitation Situation
Baseline Follow-Up Difference
Phase/CommunityNumber of
Communities% HHs Satisfied with Sanitation Situation
% HHs Satisfied with Sanitation Situation
Change in Percentage
Treatment 10 52.9% 75.2% 22.3%**Comparison 6 45.2% 73.1% 27.9%*
Difference in Differences -5.6%Significance codes: ‘***’ p<0.001; ‘**’ p<0.01; ‘*’ p<0.05; ‘.’ p<0.1
Table B.10: Phase 1 Percentage of Children Exhibiting Symptoms of Respiratory Illness in the Past Week
Baseline Follow-Up Difference
Phase/CommunityNumber of
CommunitiesMean Percent of
Children Under 5 with RIMean Percent of
Children Under 5 with RIChange in Percentage
Treatment 10 17% 12% -5%Comparison 6 19% 8% -11%.
Difference in Differences 5.2%Significance codes: ‘***’ p<0.001; ‘**’ p<0.01; ‘*’ p<0.05; ‘.’ p<0.1
Table B.11: Phase 1 Percentage of Children Exhibiting Symptoms of Gastrointestinal Illness in the Past Week
Baseline Follow-Up Difference
Phase/CommunityNumber of
CommunitiesMean Percent of
Children Under 5 with GIMean Percent of
Children Under 5 with GIChange in Percentage
Treatment 10 24% 14% -10%.
Comparison 6 18% 16% -2%
Difference in Differences -8%Significance codes: ‘***’ p<0.001; ‘**’ p<0.01; ‘*’ p<0.05; ‘.’ p<0.1

Impact Evaluat Ion of thE mozamb IquE RuRal WatER Supply act Iv I ty 112
Table B.12: Phase 1 Percentage of HHs Indicating Satisfaction with Water Supply Situation
Baseline Follow-Up Difference
Phase/CommunityNumber of
CommunitiesMean Percent of HHs
SatisfiedMean Percent of HHs
SatisfiedChange in Percentage
Treatment 10 75% 81% 6.1%.
Comparison 6 22% 20% -2%
Difference in Differences 8.4%Significance codes: ‘***’ p<0.001; ‘**’ p<0.01; ‘*’ p<0.05; ‘.’ p<0.1
Table B.13: Phase 1 Median Monthly Income (in MZN)
Baseline Follow-Up Difference
Phase/CommunityNumber of
CommunitiesMean of Median Income
(MZN)Mean of Median Income
(MZN)MZN
Treatment 10 1124 1892 768Comparison 6 455 2048 1593*
Difference in Differences -825Significance codes: ‘***’ p<0.001; ‘**’ p<0.01; ‘*’ p<0.05; ‘.’ p<0.1
Table B.14: Phase 1 Median Monthly Expenditures (in MZN)
Baseline Follow-Up Difference
Phase/CommunityNumber of
CommunitiesMean of Median Income
(MZN)Mean of Median Income
(MZN)MZN
Treatment 10 857 1046 190Comparison 6 673 982 309
Difference in Differences -119Significance codes: ‘***’ p<0.001; ‘**’ p<0.01; ‘*’ p<0.05; ‘.’ p<0.1