Embed Size (px)
Citation preview

IMPACT OF THE REEMPLOYMENT AND ELIGIBILITY
ASSESSMENT (REA) INITIATIVE IN NEVADA
January 2012
Task Order No: DOLF091A21507
Authors:
Marios Michaelides
Eileen Poe-Yamagata
Jacob Benus
Dharmendra Tirumalasetti
IMPAQ International, LLC i Evaluation of the Nevada REA Program
TABLE OF CONTENTS
Page
Introduction .......................................................................................................................... 1
1. The Nevada REA Program ............................................................................................... 4
2. Data Overview................................................................................................................ 7
2.1 Socioeconomic Characteristics of REA-Eligible Claimants .................................................. 7
2.2 Unemployment Insurance Eligibility of REA-Eligible Claimants........................................ 10
2.3 Prior Quarterly Wages of REA-Eligible Claimants ............................................................. 11
3. Impact Analyses Using Differences in Means ................................................................. 12
3.1 Unemployment Insurance Receipt ................................................................................... 12
3.2 Quarterly Wage Outcomes ............................................................................................... 14
4. Impact Analyses Using Regression Models .................................................................... 17
4.1 Regression-Adjusted Impact Estimates on Unemployment Insurance Receipt ............... 17
4.2 Regression-Adjusted Impact Estimates on Quarterly Wage Outcomes ........................... 19
4.3 Discussion of the Results .................................................................................................. 21
5. Conclusion .................................................................................................................... 24
IMPAQ International, LLC 1 Evaluation of the Nevada REA Program
INTRODUCTION
The Reemployment and Eligibility Assessment (REA) initiative is an approach that combines: (1)
in-person unemployment insurance (UI) eligibility reviews, (2) labor market information (LMI,)
(3) development of an individual reemployment plan and (4) referral to reemployment services
(RES) and/or training. It is designed to ensure claimants are meeting the eligibility provisions of
state laws and are exposed to reemployment services, including job search assistance and
placement services, so they may return to employment as quickly as possible. While the REA
initiative began in 2005,1 its features are grounded in past research findings and proven
methods of administration that have been shown to be efficient and cost-effective2.
Research conducted by IMPAQ International in 2011 found evidence that the REA program was
effective in achieving the program’s goals of reducing UI duration and generating savings to the
UI Trust Fund.3 The study showed that the Nevada REA program was more effective in reducing
claimant UI duration and generating greater savings for the UI Trust Fund than the REA program
in other states examined. Nevada’s REA program was found to differ from REA programs in
other states. In Nevada, the same staff provided both REA and reemployment services (RES),
charging their time to the appropriate work activities, while in other study states, different staff
administered REA and RES. It appears that providing REA and RES services by the same staff in
a single interview may be a key factor that led to greater program impacts in Nevada.
In light of these findings, the U.S. Department of Labor asked IMPAQ to extend the study of the
Nevada REA program using updated data on UI receipt and wages for REA-eligible claimants
1 OPA News Release, March 10, 2005 (http://www.dol.gov/opa/media/press/opa/OPA20050343.htm).
2 This includes studies such as the Nevada Claimant Employment Projects, the Charleston Claimant Placement and
Work Test Demonstration, the Maryland UI Work Search Demonstration, the National Worker Profiling
Reemployment Services (WPRS) Evaluation, and the Wisconsin Reemployment Connections Project. For further
information about these studies and other research involving job search assistance, public exchange referral of
workers to jobs, and/or administration of the UI work test see Chapter 5, Solving the Reemployment Puzzle: From
Research to Policy (Wandner, Stephen A. 2010. Kalamazoo, MI: W.E. Upjohn Institute for Employment Research). 3 Poe-Yamagata E., Benus J., Bill N., Michaelides M., and Shen T. (2011). Impact of the Reemployment and
Eligibility Assessment Initiative, Final Report to Congress, May 2011.
IMPAQ International, LLC 2 Evaluation of the Nevada REA Program
who entered the program from July 2009 through December 2009. The objective of the
present study is to address the following key questions related to the efficacy of the Nevada
REA program:
Did REA reduce UI benefit duration and UI benefit amounts received?
Was REA effective in expediting the reemployment of UI claimants?
Did REA lead to UI Trust Fund savings and, if so, did these exceed REA program costs?
In this report, we address the above research questions using Nevada’s administrative UI data
and intrastate Wage Records for all REA-eligible UI claimants who entered the program from
July 2009 through December 2009. These data provide rich information on the socioeconomic
characteristics, UI eligibility, and prior wages of claimants at the start of their UI claim. The
data also provide the following claimant information:
1) UI receipt from program entry through September 2011, and
2) Quarterly wages earned in the 6 calendar quarters after program entry.
Using these data, we estimate the impact of the Nevada REA program on claimant UI receipt
and quarterly wage outcomes following program entry. Our results show that the Nevada REA
program was very effective in assisting claimants exit the UI program sooner than they would
have in the absence of the program, leading to lower UI duration and producing important
savings for the UI Trust Fund. We also find that the program was very effective in assisting
claimants find employment in the period following program entry. Based on these results, we
conclude that the Nevada REA program is a very effective policy tool for reducing UI duration
and assisting UI claimants to return to productive employment more rapidly than they would in
the absence of the program.
The remainder of this report is organized as follows. In Chapter 1, we provide an overview of
the Nevada REA program design, including the process for selecting UI claimants into either an
REA treatment group or an REA comparison group, and the types of services received by those
IMPAQ International, LLC 3 Evaluation of the Nevada REA Program
selected into the REA treatment group. In Chapter 2, we provide an overview of the Nevada
administrative data used for this study, including descriptive analyses of the characteristics, UI
eligibility, and prior wages of REA-eligible claimants. In Chapter 3, we present the UI receipt
and quarterly wage outcome measures for claimants in the study sample, as well as estimates
of program impacts produced by treatment-control comparisons in mean outcomes. In Chapter
4, we present regression-adjusted impact estimates of program impacts, which are produced
using multivariate regression models that control for available claimant characteristics. Finally,
in Chapter 5 we summarize our findings and discuss their policy implications.
IMPAQ International, LLC 4 Evaluation of the Nevada REA Program
1. THE NEVADA REA PROGRAM
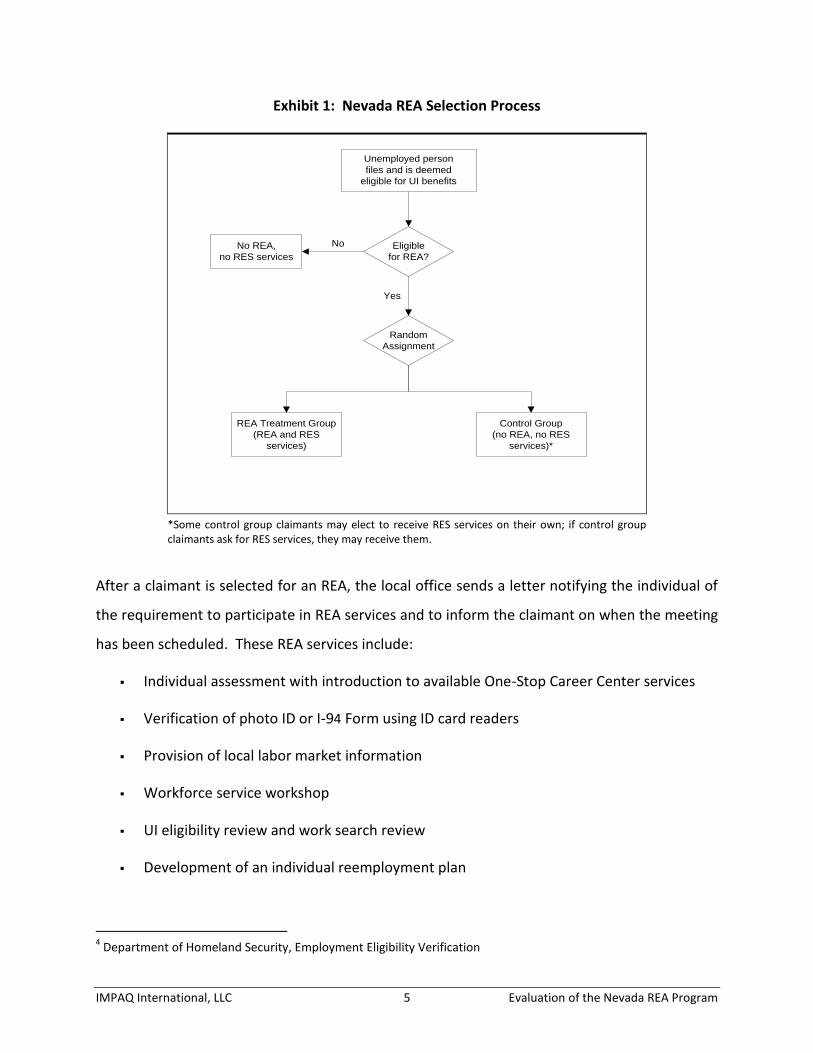
Nevada uses a random assignment process to assign REA-eligible UI claimants to REA services.
The Nevada selection process is presented in Exhibit 1. Once an unemployed worker files and is
deemed eligible to receive UI benefits, a set of eligibility criteria is used to determine if the
worker is eligible for REA participation. Specifically, new UI claimants are deemed REA-eligible
if they meet the following criteria: 1) received one week of UI benefits under the new claim, 2)
have no work return date (i.e., not a temporarily laid off worker), 3) are not active in other
training programs, 4) are not attached to a union hiring hall, and 5) were not selected to
participate in the Worker Profiling and Reemployment Services (WPRS) program.
Each week, REA-eligible claimants are placed in a selection pool from which individuals are
randomly assigned into two groups:
REA treatment group – These claimants are selected to participate in REA services to
remain eligible for UI benefits. In addition to REA services, those assigned to the REA
treatment group are required to participate in RES.
Control group – These claimants are not required to participate in REA or RES services,
but could, on their own initiative, participate in RES.
The number of REA cases varies across local offices based on each location’s available staffing
resources. For example, REA staff in Nevada enters the number of REA participants needed for
the next round of REA interviews into their computer system, and the system randomly selects
that number from the claimants eligible for REA. The remaining claimants are placed in the
control group.
IMPAQ International, LLC 5 Evaluation of the Nevada REA Program
Exhibit 1: Nevada REA Selection Process
Unemployed person
files and is deemed
eligible for UI benefits
Eligible
for REA?
No
Yes
Random
Assignment
No REA,
no RES services
REA Treatment Group
(REA and RES
services)
Control Group
(no REA, no RES
services)*
*Some control group claimants may elect to receive RES services on their own; if control group claimants ask for RES services, they may receive them.
After a claimant is selected for an REA, the local office sends a letter notifying the individual of
the requirement to participate in REA services and to inform the claimant on when the meeting
has been scheduled. These REA services include:
Individual assessment with introduction to available One-Stop Career Center services
Verification of photo ID or I-94 Form using ID card readers
Provision of local labor market information
Workforce service workshop
UI eligibility review and work search review
Development of an individual reemployment plan
4 Department of Homeland Security, Employment Eligibility Verification
IMPAQ International, LLC 6 Evaluation of the Nevada REA Program
What separates the Nevada REA program from programs in the other states studied by IMPAQ
in the earlier report is that in Nevada the same staff provided both REA and RES while in other
study states different staff administered REA and RES. RES services include:
Job search assistance
Job match against state and federal automated labor exchange and job referrals
Resume assistance
Referrals to and participation in training
Follow-up with claimants, as needed

IMPAQ International, LLC 7 Evaluation of the Nevada REA Program
2. DATA OVERVIEW
For this evaluation, Nevada provided UI administrative data and wage records for all individuals
who started a regular UI claim from July 2009 through December 2009 and who were deemed
eligible for REA participation. These data provide the following information:
Claimant socioeconomic characteristics (e.g., gender, race, age, and education) at the
start of their regular UI claim
Total number of UI weeks and benefit amounts received under regular and EUC benefits
from the start of their claim through September 2011
Claimant quarterly wage amounts in the 10 quarters prior to the start of their claim and
in the 6 quarters following the start of their claim5
Based on these data, we are able to examine the socioeconomic characteristics, UI eligibility,
and prior wages of claimants at the start of their UI claim. Furthermore, we are able to produce
important measures of UI receipt and quarterly wages after program entry and assess the
program’s impact on those outcomes.
2.1 Socioeconomic Characteristics of REA-Eligible Claimants
Exhibit 2 provides an overview of the characteristics of REA-eligible claimants who started a
new UI claim from July 2009 through December 2009 in Nevada. There were 32,751 REA-
eligible UI claimants in Nevada during the study period, of whom 5,157 (16 percent) were
randomly assigned to the REA treatment group. These claimants were required to receive both
REA and RES services to retain their UI eligibility. The remaining 27,594 (84 percent) were
assigned to the control group and not required to receive REA services.
5 For example, for claimants who entered the program in July, August, or September of 2009 (3
rd quarter of 2009),
the first quarter after program entry is the 4th
quarter of 2009. For claimants who entered the program in October,
November, or December of 2009 (4th
quarter of 2009), the first quarter after program entry is the 1st
quarter of
2010.

IMPAQ International, LLC 8 Evaluation of the Nevada REA Program
We also find that 16 percent of claimants had no high school diploma and 43 percent had only a
high school diploma; overall, 59 percent of claimants had no more than a high school
education. Interestingly, claimants were equally distributed between white collar jobs (19
percent white collar high skill and 31 percent white collar low skill) and blue collar jobs (24
percent blue collar high skill and 26 percent blue collar low skill).
An examination of the characteristics of treatment and control group members in Exhibit 2
indicates that, with the exception of race,6 the two groups were very similar in terms of their
socioeconomic characteristics at the time of program entry. This indicates that random
assignment of REA-eligible claimants in the REA treatment and in the control group was
successfully implemented.
6 Race information was available for 84 percent of the sample. Based on this information, claimants were
categorized as follows: white (64 percent), black (11 percent), Asian (7 percent), other race/missing (18 percent).

IMPAQ International, LLC 9 Evaluation of the Nevada REA Program
Exhibit 2: Characteristics of REA-Eligible Claimants
All Claimants REA Treatment Group Control Group
Total [% of Total] 32,751 [100%] 5,157 [16%] 27,594 [84%]
Men 57% 58% 57%
Women 43% 42% 43%
White 64% 72% 63%
Black 11% 7% 12%
Asian 7% 6% 7%
Other Race/Missing 18% 16% 18%
Less than High School 16% 16% 16%
High School Diploma 43% 43% 43%
Some College 28% 28% 28%
College Degree 10% 10% 10%
Graduate Degree 3% 3% 3%
Age: Less than 25 yrs 13% 13% 13%
Age: 25-34 yrs 25% 25% 25%
Age: 35-44 yrs 23% 22% 23%
Age: 45-54 yrs 21% 24% 22%
Age: 55-64 yrs 13% 12% 13%
Age: 65+ yrs 5% 4% 5%
White Collar, High Skill 19% 19% 19%
White Collar, Low Skill 31% 32% 31%
Blue Collar, High Skill 24% 23% 24%
Blue Collar, Low Skill 26% 26% 26%
U.S. Citizen 90% 91% 90%
Veteran 8% 7% 8%
Note: Reported is the proportion of total number of REA-eligible claimants.
IMPAQ International, LLC 10 Evaluation of the Nevada REA Program
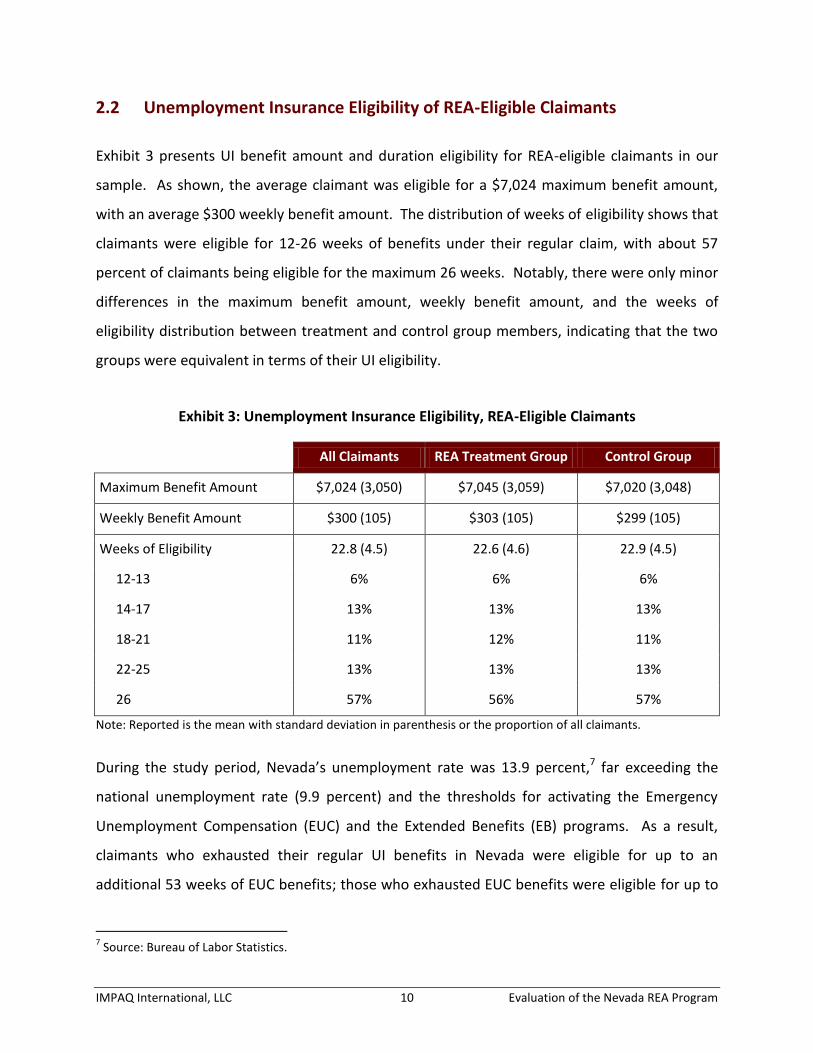
2.2 Unemployment Insurance Eligibility of REA-Eligible Claimants
Exhibit 3 presents UI benefit amount and duration eligibility for REA-eligible claimants in our
sample. As shown, the average claimant was eligible for a $7,024 maximum benefit amount,
with an average $300 weekly benefit amount. The distribution of weeks of eligibility shows that
claimants were eligible for 12-26 weeks of benefits under their regular claim, with about 57
percent of claimants being eligible for the maximum 26 weeks. Notably, there were only minor
differences in the maximum benefit amount, weekly benefit amount, and the weeks of
eligibility distribution between treatment and control group members, indicating that the two
groups were equivalent in terms of their UI eligibility.
Exhibit 3: Unemployment Insurance Eligibility, REA-Eligible Claimants
All Claimants REA Treatment Group Control Group
Maximum Benefit Amount $7,024 (3,050) $7,045 (3,059) $7,020 (3,048)
Weekly Benefit Amount $300 (105) $303 (105) $299 (105)
Weeks of Eligibility 22.8 (4.5) 22.6 (4.6) 22.9 (4.5)
12-13 6% 6% 6%
14-17 13% 13% 13%
18-21 11% 12% 11%
22-25 13% 13% 13%
26 57% 56% 57%
Note: Reported is the mean with standard deviation in parenthesis or the proportion of all claimants.
During the study period, Nevada’s unemployment rate was 13.9 percent,7 far exceeding the
national unemployment rate (9.9 percent) and the thresholds for activating the Emergency
Unemployment Compensation (EUC) and the Extended Benefits (EB) programs. As a result,
claimants who exhausted their regular UI benefits in Nevada were eligible for up to an
additional 53 weeks of EUC benefits; those who exhausted EUC benefits were eligible for up to
7 Source: Bureau of Labor Statistics.
IMPAQ International, LLC 11 Evaluation of the Nevada REA Program
an additional 20 weeks of EB. Overall, Nevada claimants in the study sample were potentially
eligible for 46-99 weeks of UI benefits: 12-26 weeks under regular UI, up to an additional 53
weeks under EUC, and up to an additional 20 weeks under EB.
2.3 Prior Quarterly Wages of REA-Eligible Claimants
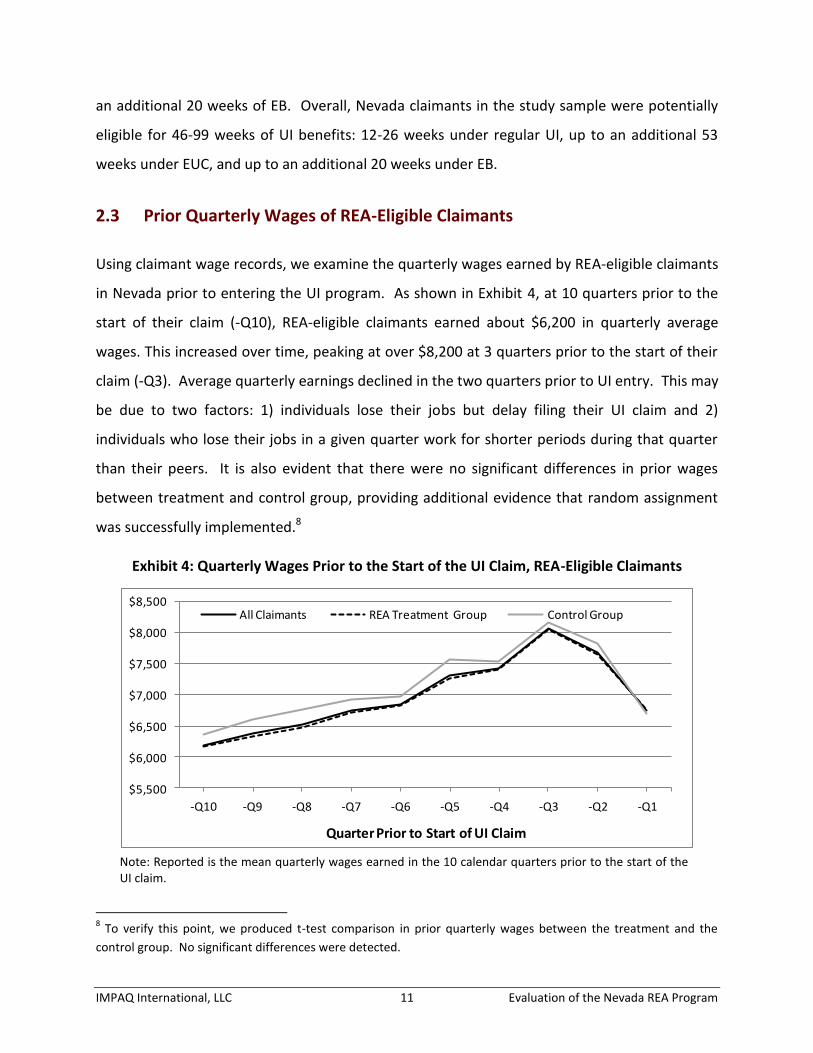
Using claimant wage records, we examine the quarterly wages earned by REA-eligible claimants
in Nevada prior to entering the UI program. As shown in Exhibit 4, at 10 quarters prior to the
start of their claim (-Q10), REA-eligible claimants earned about $6,200 in quarterly average
wages. This increased over time, peaking at over $8,200 at 3 quarters prior to the start of their
claim (-Q3). Average quarterly earnings declined in the two quarters prior to UI entry. This may
be due to two factors: 1) individuals lose their jobs but delay filing their UI claim and 2)
individuals who lose their jobs in a given quarter work for shorter periods during that quarter
than their peers. It is also evident that there were no significant differences in prior wages
between treatment and control group, providing additional evidence that random assignment
was successfully implemented.8
Exhibit 4: Quarterly Wages Prior to the Start of the UI Claim, REA-Eligible Claimants
$5,500
$6,000
$6,500
$7,000
$7,500
$8,000
$8,500
-Q10 -Q9 -Q8 -Q7 -Q6 -Q5 -Q4 -Q3 -Q2 -Q1
Quarter Prior to Start of UI Claim
All Claimants REA Treatment Group Control Group
Note: Reported is the mean quarterly wages earned in the 10 calendar quarters prior to the start of the UI claim.
8 To verify this point, we produced t-test comparison in prior quarterly wages between the treatment and the
control group. No significant differences were detected.
IMPAQ International, LLC 12 Evaluation of the Nevada REA Program
3. IMPACT ANALYSES USING DIFFERENCES IN MEANS
Using the Nevada UI administrative data, we are able to produce several measures that capture
UI benefit receipt and wage outcomes of claimants in the sample. Below, we describe these
outcome measures and present estimates of Nevada REA program impacts based on
treatment-control group mean comparisons in outcomes.
3.1 Unemployment Insurance Receipt
To assess Nevada REA impacts on UI receipt, we use the UI administrative data to produce the
following outcomes:
Exhausted Regular UI Benefits – Indicates whether the claimant exhausted regular UI
benefits
Received EUC Benefits – Indicates whether the claimant exhausted regular UI benefits
and started receiving EUC benefits
Weeks on UI, Regular – Equals number of regular UI weeks received
Weeks on UI, EUC – Equals number of EUC weeks received
Weeks on UI, Total – Equals number of UI plus EUC weeks received9
UI Benefits Received, Regular – Equals regular UI benefit amounts received
UI Benefits Received, EUC – Equals EUC benefit amounts received
UI Benefits Received, Total – Equals total (regular UI plus EUC) benefit amounts received
Exhibit 5 presents the UI receipt measures for treatment and control group claimants. Since
random assignment was used to determine assignment into the treatment or control group,
differences in outcomes between the two groups represent estimates of REA’s impact. The
right column of Exhibit 5 presents the treatment-control difference in each outcome. As
9 The data report the regular UI and EUC benefits received from the start of each claimant’s regular UI claim
through September 2011. Extended Benefits were not reported in the data, thus excluded from the study.

IMPAQ International, LLC 13 Evaluation of the Nevada REA Program
shown, 58.9 percent of REA treatment group members exhausted regular UI benefits relative to
70.9 percent of control group members. The treatment-control group difference was thus 12.0
percentage points and statistically significant at the 1 percent level. A similar result is obtained
when we compare EUC receipt between the treatment and the control groups. Exhibit 5 shows
that 48.4 percent of treatment group members and 59.7 percent of control group members
received EUC benefits, for a statistically significant difference of 11.3 percentage points. These
results provide evidence that the Nevada REA program was effective in reducing the likelihood
of exhausting regular UI benefits and receiving EUC benefits.
Exhibit 5: Unemployment Insurance Receipt, REA-Eligible Claimants
REA Treatment Group Control Group Difference
Exhausted Regular UI Benefits .589 (.492) .709 (.454) -.120 [.007]***
Received EUC Benefits .484 (.500) .597 (.491) -.113 [.007]***
Weeks on UI
Regular 16.6 (8.5) 18.7 (7.9) -2.1 [.1]***
EUC 10.5 (13.0) 12.4 (12.5) -1.9 [.2]***
Total (Regular + EUC) 27.2 (18.9) 31.1 (17.4) -4.0 [.3]***
UI Benefits Received (in USD)
Regular 5,205 (3,462) 5,763 (3,427) -558 [52]***
EUC 3,201 (4,160) 3,672 (3,888) -471 [60]***
Total (Regular + EUC) 8,406 (6,788) 9,436 (6,407) -1,029 [98]***
Note: Reported is the mean with standard deviation in parenthesis. The right column presents the difference
between the treatment and the control group with standard error in brackets (statistical significance level: *** = 1
percent).
Exhibit 5 also reports the number of UI benefit weeks and the benefit amounts collected by
claimants. The average treatment group member collected 16.6 weeks of regular benefits and
10.5 weeks of EUC benefits, for a total of 27.2 benefit weeks. These figures were significantly
lower than those for control group members – overall, treatment group members received 4.0
fewer total weeks of benefits than control group members. As a result, treatment group
IMPAQ International, LLC 14 Evaluation of the Nevada REA Program
members collected lower benefit amounts than their peers. Specifically, claimants in the REA
treatment group collected, on average, a total of $1,029 lower benefit amounts ($558 regular
UI and $471 EUC) than claimants in the control group. These results provide strong evidence
that the Nevada REA program was effective in assisting claimants to exit the UI program earlier
than they would have in the absence of the program, thus receiving lower benefit amounts.
3.2 Quarterly Wage Outcomes
Using the available data, we are also able to examine if Nevada REA program claimants were
more likely to be reemployed following program entry than their peers. We measure
reemployment based on positive wages earned by claimants in the 6 calendar quarters
following program entry. Specifically, we produce the following quarterly wage outcomes:
Likelihood of Earning Wages – Indicates whether the claimant earned wages in a given
quarter after program entry. This measure is produced for each of the 6 calendar
quarters after the claimant started receiving UI benefits.10
Quarterly Wages – Equals the total wages earned (in USD) in a given quarter after
program entry. If the claimant did not work in a given quarter, total wages earned in
that quarter are equal to zero. This measure is produced for each of the 6 calendar
quarters after the claimant started receiving UI benefits.
Total Quarterly Wages – Equals the total wages earned (in USD) in all 6 quarters after
program entry.
Exhibit 6 presents descriptive analyses of these wage measures for treatment and control group
members, as well as treatment-control group comparisons of these measures. As shown, 48.6
percent of the treatment and 40.3 percent of the control group were reemployed (i.e., had
positive wages) in Quarter 1 after the start of their UI claim. These proportions increased
slightly with each quarter, with about 55.4 percent of treatment group members and 50.0 10
As noted, for claimants who entered the program in July, August, or September of 2009 (Quarter 3 of 2009), the
first quarter after program entry is Quarter 4, 2009. For claimants who entered the program in October,
November, or December of 2009 (Quarter 4, 2009), the first quarter after program entry is the Quarter 1, 2010.

IMPAQ International, LLC 15 Evaluation of the Nevada REA Program
percent of control group members being reemployed at Quarter 6 after the start of their UI
claim. These figures suggest that the majority of claimants that found employment in the first 6
quarters after program entry did so in Quarter 1. Further, a large proportion of claimants were
not able to find employment, even a year and a half after entering the UI program, which is
probably a reflection of the tough economic conditions during the study period.
Exhibit 6: Quarterly Wages Following Start of UI Claim, REA-Eligible Claimants
REA Treatment Group Control Group Difference
Likelihood of Earning Wages
Quarter 1 .486 (.500) .403 (.491) .083 [.007]***
Quarter 2 .514 (.500) .412 (.492) .102 [.008]***
Quarter 3 .541 (.498) .457 (.498) .084 [.008]***
Quarter 4 .560 (.496) .485 (.500) .075 [.008]***
Quarter 5 .545 (.498) .486 (.500) .058 [.008]***
Quarter 6 .554 (.497) .500 (.500) .054 [.008]***
Quarterly Wages (in $)
Quarter 1 1,917 (3,703) 1,509 (3,219) 408 [50]***
Quarter 2 2,622 (4,290) 1,957 (3,705) 665 [57]***
Quarter 3 3,199 (4,860) 2,455 (4,240) 744 [67]***
Quarter 4 3,336 (5,207) 2,661 (4,520) 674 [70]***
Quarter 5 3,236 (4,973) 2,801 (5,323) 435 [80]***
Quarter 6 3,486 (5,223) 2,977 (4,874) 509 [75]***
Total, Quarters 1-6 17,796 (23,042) 14,361 (20,998) 3,435 [325]***
Note: Reported is the mean with standard deviation in parenthesis. The right column presents the difference
between the treatment and the control group with standard error in brackets (statistical significance level: *** =
1 percent).
As shown in Exhibit 6, however, REA treatment group members were significantly more likely
than their control group peers to earn wages in each of the 6 quarters after program entry. For
example, the treatment-control differential in the likelihood of earning positive wages was .083

IMPAQ International, LLC 16 Evaluation of the Nevada REA Program
and statistically significant at the 1 percent level. This indicates that treatment group claimants
were 8.3 percentage points more likely to find employment at Quarter 1 after program entry
than their peers. The treatment-control differential in this outcome remained positive and
significant through Quarter 6 after program entry. These results provide evidence that the
Nevada REA program was effective in assisting claimants to obtain employment in the 6
quarters following program entry.
Due to the fact that treatment group members were more likely than their peers to find wage
employment after program entry, they earned higher total wages in each of the 6 quarters after
program entry. As shown in Exhibit 6, treatment group members earned $408 higher total
wages than their peers in Quarter 1. This impact is partly due to the fact that treatment group
members returned to work earlier; further, this impact may be due to that treatment group
members earned higher wages than their peers, conditional on employment.11 This differential
was much higher in Quarters 2-4 after program entry and remained positive and statistically
significant in Quarters 5-6. Overall, in the 6 quarters following program entry, claimants
assigned in the REA treatment group earned, on average, $3,435 higher total wages than their
peers.
11
For a discussion of this issue, including methods to decompose effects on earnings, see: Lee D.S. (2009). Training,
Wages, and Sample Selection: Estimating Sharp Bounds on Treatment Effects. Review of Economic Studies, Vol. 76,
pp. 1071-1102; Attanasio O., Kugler A., Meghir C. (2011). Subsidizing Vocational Training for Disadvantaged Youth
in Colombia: Evidence from a Randomized Trial. American Economic Journal: Applied Economics, Vol. 3, pp. 188-
220.
IMPAQ International, LLC 17 Evaluation of the Nevada REA Program
4. IMPACT ANALYSES USING REGRESSION MODELS
In this section, we refine the REA impact estimates presented above using multivariate
regression models. These models estimate REA program impacts on participant outcomes,
controlling for all available claimant characteristics at the time of program entry. In addition to
controlling for treatment-control differences in observed characteristics that may have
occurred by chance, these models estimate program impacts with higher statistical efficiency
relative to simple treatment-control outcome comparisons. For each outcome, we estimate
the following regression model:
uXTY
The dependent variable in this model (Y ) is the claimant outcome (e.g., exhausted regular UI
benefits, weeks on UI, and UI benefits received). The control variables include:
T, equals 1 if the claimant was in the REA treatment group and 0 otherwise.
X, includes all available claimant characteristics at random assignment, as reported in
Exhibits 2, 3 and 4 (socioeconomic characteristics, UI eligibility, and prior wages).
u, is a zero mean disturbance term.
The parameter of interest in this model is α, the regression-adjusted treatment effect of the
REA program on the outcome of interest. The above model is estimated for each available
post-random assignment outcome, including UI receipt outcomes and quarterly wage
outcomes. The impact estimates are reported below.
4.1 Regression-Adjusted Impact Estimates on Unemployment Insurance
Receipt
Exhibit 7 presents the regression-adjusted REA treatment effect for UI receipt measures. As
shown, the REA treatment effect for the likelihood of exhausting benefits is 10.3 percentage

IMPAQ International, LLC 18 Evaluation of the Nevada REA Program
points and statistically significant at the 1 percent level. This result shows that the Nevada REA
program led to a 10.3 percentage point reduction in the likelihood that claimants exhaust their
regular UI benefits. As reported in the right column of Exhibit 7, this corresponds to a 15
percent reduction in regular UI benefit exhaustion relative to the control group mean.12 Due to
this effect, REA claimants were 9.4 percentage points (or 16 percent) less likely than their
control group peers to receive at least one week of EUC benefits. These impact estimates show
that the program was very effective in reducing benefit exhaustion and EUC receipt.13
The program’s large impacts on regular UI exhaustion and EUC benefit receipt led to significant
impacts on the number of UI weeks and the benefit amounts received. As shown in Exhibit 7,
the REA program reduced regular UI duration by 1.82 weeks (10 percent) and EUC duration by
1.31 weeks (11 percent). Overall, the program led to a 3.13-week (or 10 percent) reduction in
total UI duration (regular plus EUC duration). As a result, REA treatment group members
received an average of $536 less in regular UI benefits and $337 less in EUC benefits than their
control group peers. Thus, the program led to an $873 (or 9 percent) reduction in total benefits
received (regular plus EUC benefits).
Exhibit 7: Regression-Adjusted REA Treatment Effects, Unemployment Insurance Receipt
REA Treatment Effect REA Percent Impact
Exhausted Regular UI Benefits -.103 (.007)*** -15%
Received EUC Benefits -.094 (.008)*** -16%
Weeks on UI
Regular -1.82 (.12)*** -10%
EUC -1.31 (.20)*** -11%
Total -3.13 (.27)*** -10%
12
This is calculated by dividing the effect (-.103) by the control group mean reported in Exhibit 5 (.709). 13
To examine whether program impacts on UI receipt varied by key characteristics (gender, race, education,
occupation, month claim was filed, etc.), we estimated regression models that included interactions between the
treatment indicator and these characteristics. These analyses did not detect any statistically significant differences
in program impacts across key characteristics.

IMPAQ International, LLC 19 Evaluation of the Nevada REA Program
UI Benefits Received (in USD)
Regular -536 (38)*** -10%
EUC -337 (59)*** -9%
Total -873 (85)*** -9%
Note: The left column reports regression-adjusted treatment effects for REA treatment group members with
standard errors in parenthesis; the right column reports the REA impact, where statistically significant, as a
percent of the control group mean. Control variables included in the regressions but not reported: gender, race,
education, age, occupation group, citizenship, veteran, disabled, maximum benefit amount, weeks of eligibility,
prior wages, One-Stop Career Center in which claim was filed, and date of claim. Standard errors clustered by
date of claim. Statistical significance level: *** = 1 percent.
4.2 Regression-Adjusted Impact Estimates on Quarterly Wage Outcomes
Exhibit 8 presents the regression-adjusted REA treatment effects on claimant wage outcomes in
the 6 quarters following the start of their UI claim. REA had a positive and significant impact on
the likelihood of earning positive wages in each of the 6 quarters following program entry. For
example, in Quarter 1, treatment group members were 7.4 percentage points (or 18 percent)
more likely than their control group peers to have positive wages; this impact increased to 8.1
percentage points (or 20 percent) in Quarter 2. These results suggest that the REA program
was effective in assisting claimants obtain employment within the first 6 months of program
entry. These impacts steadily declined in Quarters 3-6, but remained positive and statistically
significant.14
The impacts on the likelihood of earning wages following program entry led to substantial
impacts on quarterly total wage amounts received. Specifically, the REA treatment effect on
total wages in Quarter 1 and Quarter 2 was $376 and $498, respectively, and statistically
significant at the 1 percent level. This shows that REA led to a 25 percent increase in claimant
total wages in the first 2 quarters after program entry. REA impacts on quarterly wages
declined in Quarters 3-6, but remained quite substantial; in Quarter 6, for example, treatment
14
Additional analyses show that program impacts on quarterly wage outcomes did not vary based on key
participant characteristics (gender, race, education, occupation, month claim was filed, etc.).
IMPAQ International, LLC 20 Evaluation of the Nevada REA Program
group members received $369 (or 12 percent) higher total wages than their peers. Overall,
from Quarter 1 through Quarter 6, REA treatment group members collected $2,611 (18
percent) higher total wages than their peers. These results provide strong evidence that the
Nevada REA program was effective in assisting claimants obtain employment, thus receive
higher total wages than their peers following program entry.

IMPAQ International, LLC 21 Evaluation of the Nevada REA Program
Exhibit 8: Regression-Adjusted REA Treatment Effects, Quarterly Wages
REA Treatment Effect REA Percent Impact
Likelihood of Earning Wages
Quarter 1 .074 (.008)*** +18%
Quarter 2 .081 (.008)*** +20%
Quarter 3 .061 (.008)*** +13%
Quarter 4 .059 (.008)*** +12%
Quarter 5 .055 (.008)*** +11%
Quarter 6 .043 (.008)*** +9%
Quarterly Wages (in $)
Quarter 1 376 (52)*** +25%
Quarter 2 498 (59)*** +25%
Quarter 3 508 (68)*** +21%
Quarter 4 473 (70)*** +18%
Quarter 5 386 (81)*** +14%
Quarter 6 369 (75)*** +12%
Total, Quarters 1-6 2,611 (322)*** +18%
Note: The left column reports regression-adjusted treatment effects for the REA treatment group with
standard errors in parenthesis; the right column reports the REA impact, where statistically significant, as a
percent of the control group mean. Control variables included in the regressions but not reported: gender,
race, education, age, occupation group, citizenship, veteran, disabled, maximum benefit amount, weeks of
eligibility, prior wages, One-Stop Career Center in which claim was filed, and date of claim. Standard errors
clustered by date of claim. Statistical significance level: *** = 1 percent.
4.3 Discussion of the Results
The impact analyses presented above show that the Nevada REA program was very effective in
assisting claimants exit the UI program earlier than they would have in the absence of the
program. REA claimants were significantly less likely than their peers to exhaust regular UI
benefits and start receiving EUC benefits. These impacts led to a significant reduction in
claimant UI duration (3.13 weeks) and in total benefit amounts received ($873).
IMPAQ International, LLC 22 Evaluation of the Nevada REA Program
Based on these results, we can assess whether the average UI savings produced by the Nevada
REA program exceeded the average program costs. Using the total REA funding provided by
the federal government to Nevada during the study period, we find that the average REA cost
per treatment group claimant was $53.15 Similarly, using the ARRA funding provided to support
the Nevada RES program during the study period, we estimate that the average RES cost per
treatment group claimant was $148.16 Combined, the average costs for providing REA and RES
services in Nevada was $201 per REA treatment group member. Thus, the average UI regular
savings produced by the Nevada REA program during the study period ($536) was more than
two times the average cost, while the average total UI savings ($873) was at least four times the
average cost. Based on these results, we conclude that Nevada’s REA program, which
combined REA and RES services in a single interview, was a cost-effective investment for the
Federal government.
In addition to impacts on UI receipt, our analyses show that the Nevada REA program was very
effective in assisting claimants obtain employment following program entry. In fact, REA
treatment group members were nearly 20 percent more likely than their peers to obtain
employment in the first 2 quarters after program entry. This result shows that the Nevada REA
program’s combination of REA and RES services were very effective in assisting claimants exit
the UI program early and obtain employment. Further, while the impact on employment was
lower in subsequent quarters, it was positive and significant, indicating that REA had a lasting
effect on claimant employment. As a result of REA’s impact on employment, treatment group
members returned more quickly to employment than their peers, thus earned higher total
wages in the 6 quarters following program entry. The program’s impact on total wages is partly
15
Number of REAs for 2009 was provided by the Nevada Department of Employment, Training, and Rehabilitation; the total Nevada REA grant amount for 2009 was provided by the U.S. Department of Labor, Employment and Training Administration. The average REA cost assumes that the entire Nevada REA program cost is reflected in the Federal grant. 16
Number of REAs for 2009 and the ARRA RES funding were provided by Nevada Department of Employment, Training, and Rehabilitation.
IMPAQ International, LLC 23 Evaluation of the Nevada REA Program
due to the fact that treatment group members returned to employment more quickly than
comparison group members.
These results provide strong evidence that the Nevada REA program did not just promote the
early exit of claimants from the UI system; it also helped claimants to obtain employment
earlier than they would have in the absence of the program. We, therefore, conclude that the
combination of REA and RES services provided by the Nevada REA program was very effective in
reducing UI duration and facilitating the reemployment of UI claimants.
We should note that these impacts are much larger than those obtained for other states in the
previous REA study conducted by IMPAQ.17 Furthermore, the Nevada REA impacts on wages
much exceed the Florida REA impacts.18 The disparity in the results between Nevada and the
other states may be a result of the fact that Nevada was the only state that provided both REA
and RES by the same staff at the same time, facilitating a seamless transition between REA and
RES services. This provides additional evidence that combining REA and RES services may be an
effective way of assisting claimants exit UI early, find jobs, and earn higher wages.
17
Poe-Yamagata E., Benus J., Bill N., Michaelides M., and Shen T. (2011). Impact of the Reemployment and
Eligibility Assessment Initiative, Final Report to Congress, May 2011. 18
Due to lack of wage data, the previous report did not include impact estimates on wages for Idaho and Illinois.
IMPAQ International, LLC 24 Evaluation of the Nevada REA Program
5. CONCLUSION
In 2005, the U.S. Department of Labor awarded $18 million in grants to 21 State Workforce
Agencies to implement the REA Initiative. Since 2005, funding for the REA Initiative has
increased to $50 million in 2010 and the program is currently operating in 42 states. States that
receive REA grants are required to assign a portion of their UI claimants to attend one-on-one
interviews in person, which includes a review of ongoing UI eligibility, provision of current labor
market information, development of a reemployment plan, and referral to reemployment
services and/or training, as needed. This program is designed to ensure that claimants meet all
eligibility provisions of their state and that claimants develop an individual reemployment,
receive labor market information and are referred to reemployment services (i.e., job search
assistance and placement services) so they may return to the labor market as quickly as
possible.
In a previous report prepared by IMPAQ, we showed that the REA program was effective in
reducing UI duration and benefit amounts received in Florida, Idaho, and Nevada. The same
study showed that the Nevada REA program produced much higher impacts on UI benefit
receipt relative to the REA program in other states. That study concluded that the strong
Nevada results may be attributed to the fact that, whereas REA treatment group members in
other states only received REA services, treatment group members in Nevada received a
combination of REA and RES seamlessly.
The present study extends the earlier study of the Nevada REA program using updated data on
UI receipt and wages for REA-eligible claimants who entered the UI program from July 2009
through December 2009. During this period, Nevada randomly assigned about 15 percent of
REA-eligible claimants to the REA treatment group – these claimants were required to receive
REA services and reemployment services to remain eligible for UI benefits. The remaining 85
percent of REA-eligible claimants were assigned to the control group and were not required to
receive any services.
IMPAQ International, LLC 25 Evaluation of the Nevada REA Program
Results of the analysis from this rigorous random assignment design shows that the Nevada
REA program was very effective in assisting claimants exit the UI program sooner than they
would have in the absence of the program. The analysis also shows that claimants in the REA
treatment group were significantly less likely than those in the control group to exhaust regular
UI benefits and start receiving EUC benefits. Thus, the Nevada REA program led to significantly
shorter UI durations and lower benefit amounts – REA treatment group claimants collected
3.13 fewer weeks and $873 lower total benefit amounts than their peers. These savings
exceeded average program costs by more than 4 times, providing strong evidence that the
Nevada REA program is a cost-effective intervention.
The impact analyses also show that the Nevada REA program was very effective in assisting
claimants to obtain employment in the first 2 quarters following program entry. Further, these
impacts were sustained through 6 quarters following program entry. Due to these impacts, REA
treatment group members returned to employment faster than their peers, which led to
earning higher total wages following program entry. These results suggest that, in addition to
assisting claimants exit UI early, REA helped claimants obtain employment earlier than they
would have in the absence of the program.
Overall, the impact analyses presented in this report provide strong evidence that the Nevada
REA program is a very effective strategy for facilitating the exit of UI claimants from the UI
program and producing savings for the UI Trust Fund. It is also evident that the program is very
effective in facilitating the reemployment of UI claimants. Based on these results, we conclude
that Nevada’s system of combining REA services with reemployment assistance into a seamless
delivery system is a very effective mechanism for reducing UI duration and for assisting
claimants to return to productive employment.