Embed Size (px)
Citation preview

Journal of Multidisciplinary Engineering Science and Technology (JMEST)
ISSN: 2458-9403
Vol. 7 Issue 5, May - 2020
www.jmest.org
JMESTN42353375 11825
Impact Of Toposequence On Soil Chemical Properties In Floodplain Irrigated Soils Of
Gadabiyu Area Of Kwali Area Council, Abuja Federal Capital Territory, Nigeria
DR. AHMAD HADIZA A
1
Department of Geography and Environmental
Management, University of Abuja, Abuja,
Federal Capital Territory, Nigeria.
Prof. ALHASSAN M.M2
Department of Geography and Environmental
Management, University of Abuja, Abuja,
Federal Capital Territory, Nigeria.
Aliyu Abubakar Ahmad3.
Isah Kaita College of Education, Dutsinma,
Katsina State, Nigeria.Katsina State, Nigeria
Abstract —This study assessed the effect of topo
sequence position on soil chemical properties in flood
plain irrigated soils of GADA BIYU area of KWALI
Area Council, Abuja, FCT. Two catanas (A and B) and
three slope segments were identified. Soil samples were
collected from each profile pit in accordance with
horizons starting from lower horizons to avoid
contaminating samples. Transect placement and
sampling intervals along transects were determined
subjectively to capture the full range of soil variability
within landforms. The depth of the auger borings was
0-15 and 15- 30 cm (surface and sub-surface
respectively). The soils were analyzed forSoil pH,
Organic Carbon, Total Nitrogen, Available
Phosphorus, CEC, Exchangeable Cations and
Percentage base saturation, Exchangeable acidity in
the soil. Descriptive statistics and a One-way Analysis
of Variance were used to analyze the data. .Findings
revealed that values gotten for soil pH shows that the
soil in the study area is moderately acidic, in the same
vein ANOVA result showed that there was no
significant difference (p>0.05) in the pH values of the
soil determined in H2O and in KCl, The study further
revealed that the EC values were rated low to
moderate, also Organic carbon and soil organic matter
showed the same trend in the soils, the values gotten
indicated a moderate to very high distribution within
the profiles and along the toposequence with much
higher values in the middle and lower slope sections.
Furthermore, The total nitrogen values within the
profiles decreased with increasing soil depth, however,
the distribution of nitrogen within the profile. Also
findings show that the value of P recorded in the soil
was rated as being high with a mean value of 15.83
mgkg-1in the upper slope, 16.02mgkg-1 in the middle
slope and 20.92mgkg-1 respectively in the same vein
findings revealed that the distribution of the basic
cations in the soil showed that Ca and Mg were the
most abundant in the soil. Also the the cation exchange
capacity of the soils along the topo sequence recorded
was very low. Based on the findings the study
recommended that organic matter should be
continuously applied to the soil as a means of
improving soil structure, and the nutrient capital
reserve of the soil.
Keywords-Toposequence, Catena, Irrigation, Physical
Properties.
Introduction
Soils vary in their physical, chemical, morphological and
mineralogical characteristics where topography happens to
be a major factor which controls most surface processes
taking place [11]. Adjacent soils that show differing profile
characteristics reflecting the influence of local topography
are calledtoposequence. Topography has an influence on
soil chemicaland physical properties and also on the
pattern of soil distributionover landscape [12]. As the
landscape is undulating, soilcharacteristics at different
topographic positions differ. Toposequencerefers to a
succession of sites from crest to the valleybottom which
contains a range of soil profiles that arerepresentative of
the landscape and soils [15]. Soil propertiesvary in vertical
and lateral directions and such variationsfollow systematic
changes as a function of the land scapeposition (slope),

Journal of Multidisciplinary Engineering Science and Technology (JMEST)
ISSN: 2458-9403
Vol. 7 Issue 5, May - 2020
www.jmest.org
JMESTN42353375 11826
soil forming factors and/or soil managementpractices (land
use).
Generally, topography influences soil morphological,
chemical and physical properties and also affects the
pattern of soil distribution over landscape even when the
soils are derived from the same parent material [11]. This
gives rise to a succession of soil types, known as a catena
from the hilltop to the valley bottom. The catenary
differentiation of soils is of pivotal importance to the
management of soils in different topographic positions in
the landscape. Consequently, understanding the roles of
topography in a landscape will help in assessing
productive values of soils and most importantly, in
developing strategies for its conservation and reducing
uniform soil management which could result in some parts
of an agricultural field receiving insufficient inputs, while
other parts receive an excess [18’.
The objective of this study was to determine the impact of
toposequenceon the chemicalproperties of the soil, using
appropriate statisticalmethods, in order to contribute to the
validationof indicators of soil fertility in the irrigated soils
of gadabiyu area of kwali area council.
MATERIALS AND METHODS
Study area
Kwali Area Council of the Federal Capital Territory was
created on the 1st October 1996. It lies between 80 28’ - 80
54’ North of the Equator and Longitude 60 50’ -70 13’ East
of the Green Witch Meridian. The council has a total land
mass of about 1700km square. The settlements pattern is
dispersed with the indigenous clustered type within Kwali,
Leda, Dangara, Gada-biyu, Sheda, Kilankawa, Dabi and
Pai. The main ethnic groupings include the Gbari,
Ganagana, Bassa, Fulani, and others [5].
The Kwali climate is the hot, humid tropical type. It is such
that its elements have ranges that are transitional from those
of the southern and northern parts of the country. The area
has distinct wet (March - October) and dry (November -
February) seasons with average annual rainfall of
1358.7mm and mean temperature range of between 20.70C
- 30.80C [5] Rainfall play a vital role with respect to
agricultural activities within the study area and most
farming activities highly depend on rainfall [5].
The alluvial soil of Iku plains, gleysols and fluvisols are
noteworthy in the study area. The soils are complex in their
degree of taxonomic variations. The drainage conditions of
the soil depend on the depth of water table. The colour of
the soils is modified by mottling due to poor drainage. The
area has clayish and sandy loam soil texture with occasional
swampy areas used for fadama (irrigated) farming. There is
the upland soils of the ferruginous red tropical type, often
derived from crystalline acid or sandy rocks and contained
high proportion of silt. They are most suited for cereal and
tuber crops production [5].
Fig.1: Abuja, FCT Showing Kwali Area Council,
Source: UniAbujaGis Lab
Journal of Multidisciplinary Engineering Science and Technology (JMEST)
ISSN: 2458-9403
Vol. 7 Issue 5, May - 2020
www.jmest.org
JMESTN42353375 11827
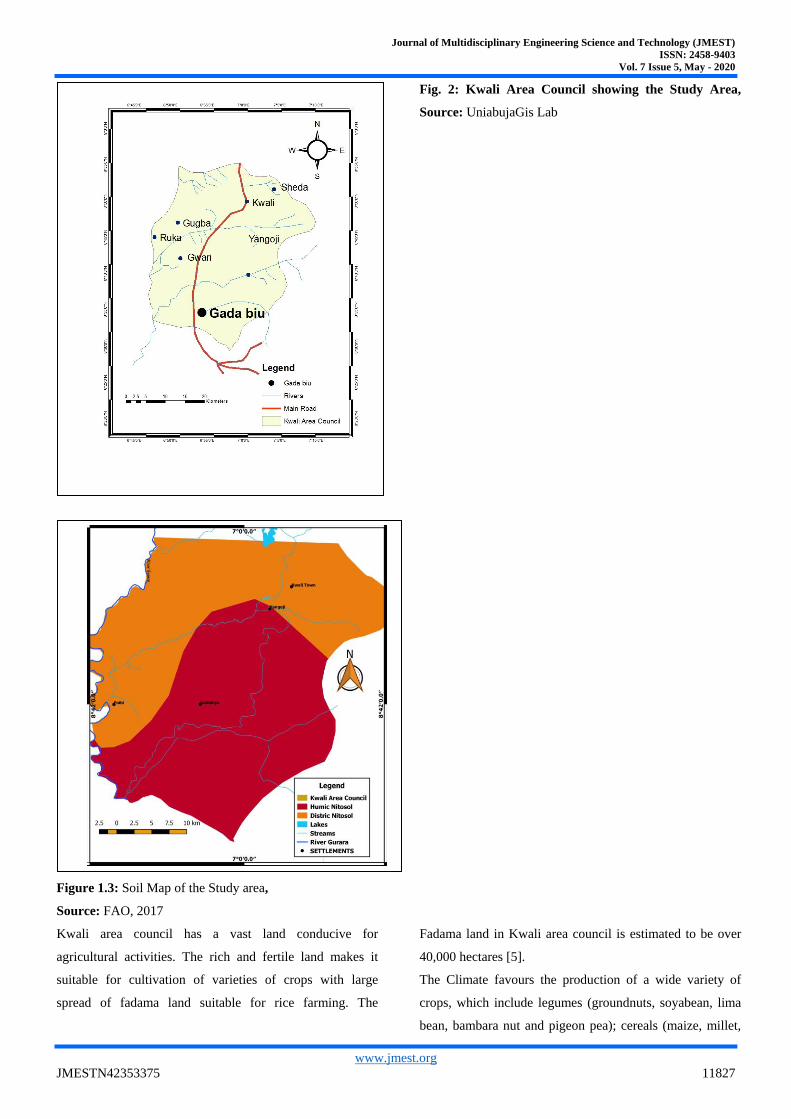
Fig. 2: Kwali Area Council showing the Study Area,
Source: UniabujaGis Lab
Figure 1.3: Soil Map of the Study area,
Source: FAO, 2017
Kwali area council has a vast land conducive for
agricultural activities. The rich and fertile land makes it
suitable for cultivation of varieties of crops with large
spread of fadama land suitable for rice farming. The
Fadama land in Kwali area council is estimated to be over
40,000 hectares [5].
The Climate favours the production of a wide variety of
crops, which include legumes (groundnuts, soyabean, lima
bean, bambara nut and pigeon pea); cereals (maize, millet,

Journal of Multidisciplinary Engineering Science and Technology (JMEST)
ISSN: 2458-9403
Vol. 7 Issue 5, May - 2020
www.jmest.org
JMESTN42353375 11828
sorghum and rice), solanecious crops (peppers, tomato,
garden eggs and ginger); tree crops (guava, cashew, mango,
orange and paw-paw); and root and tuber crops (yam, sweet
potatoes, cocoyam and cassava). For livestock production,
the animals that are mostly kept are swine, goats, sheep and
poultry. Hunting and bee-keeping are also practiced [5].The
area is mainly occupied by small holder rainfed and
irrigation farmers who grow crop such as yam, rice, melon
seed, cocoyam, cassava, peppe, tomato, okro, rice, onion,
garden eggs, spinage, beniseed and millet among others [5].
Field procedures
The toposequence survey was carried out using a Germin
GPS to detect both the various segments of the geodetic
heights and the coordinates of the segments (Mapping
Units). Transects were taken with the use of tape. Two
catanas (A and B) and three slope segments were detected
and the slopes are classified on Table 1.
Table 1: Topo sequence slope segments Elevation, Interval Distance and Coordinates.
SLOPE
COORDINATES OF PROFILE PITS
EL
EV
AT
ION
/H
IGH
T
INT
ER
VA
L
HO
RIZ
ON
TA
L
DIS
TA
NC
E
COORDINATES Of
SLOPE
SEGMENTS
CATANA A CATANA B
Upper slope (MU1)
96m
0-200
N08753'36ه''
E 0060
55'165''
E6.919432 N
8.61257 E6.920833
Middle slope (MU2)
Mid-slope
85m
200-700
N08036'649''
E 0060
55'134''
E6.918897 N8.610845
Lower slope (MU3) Lower
slope 78m 700-1000
N080 36''
385''
E 0060
54'835'' E6.9139 N8.606472
Journal of Multidisciplinary Engineering Science and Technology (JMEST)
ISSN: 2458-9403
Vol. 7 Issue 5, May - 2020
www.jmest.org
JMESTN42353375 11829
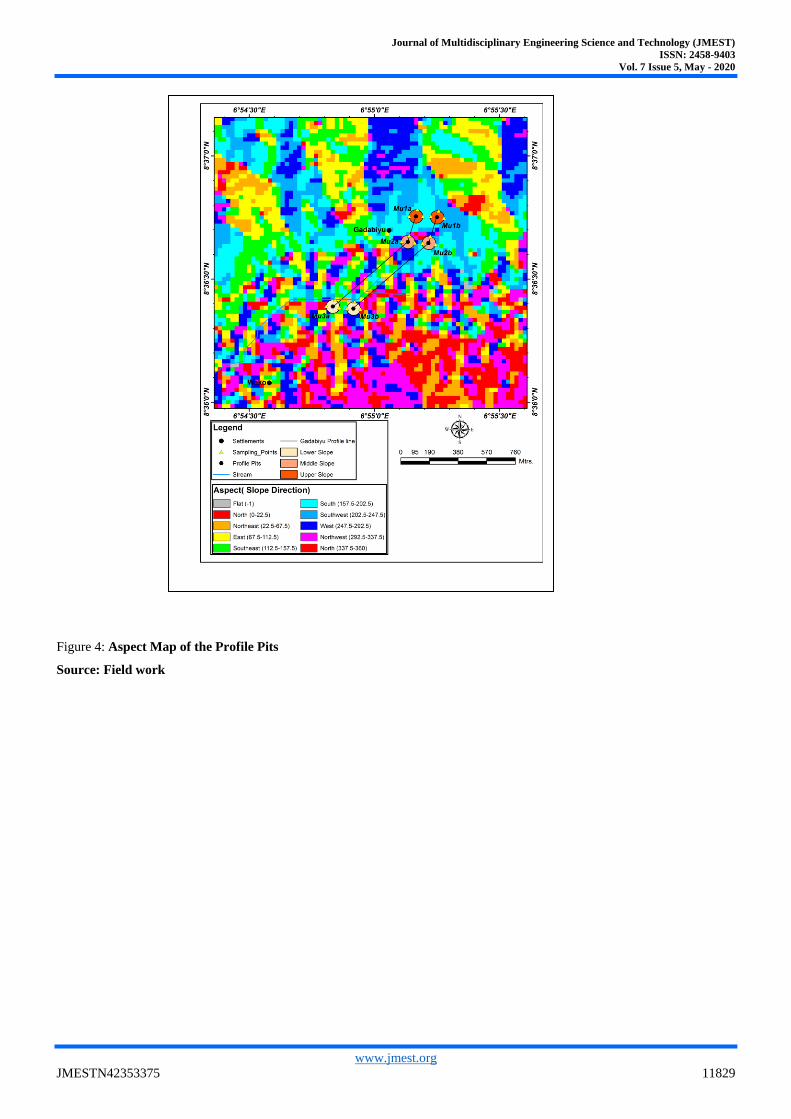
Figure 4: Aspect Map of the Profile Pits
Source: Field work
Journal of Multidisciplinary Engineering Science and Technology (JMEST)
ISSN: 2458-9403
Vol. 7 Issue 5, May - 2020
www.jmest.org
JMESTN42353375 11830
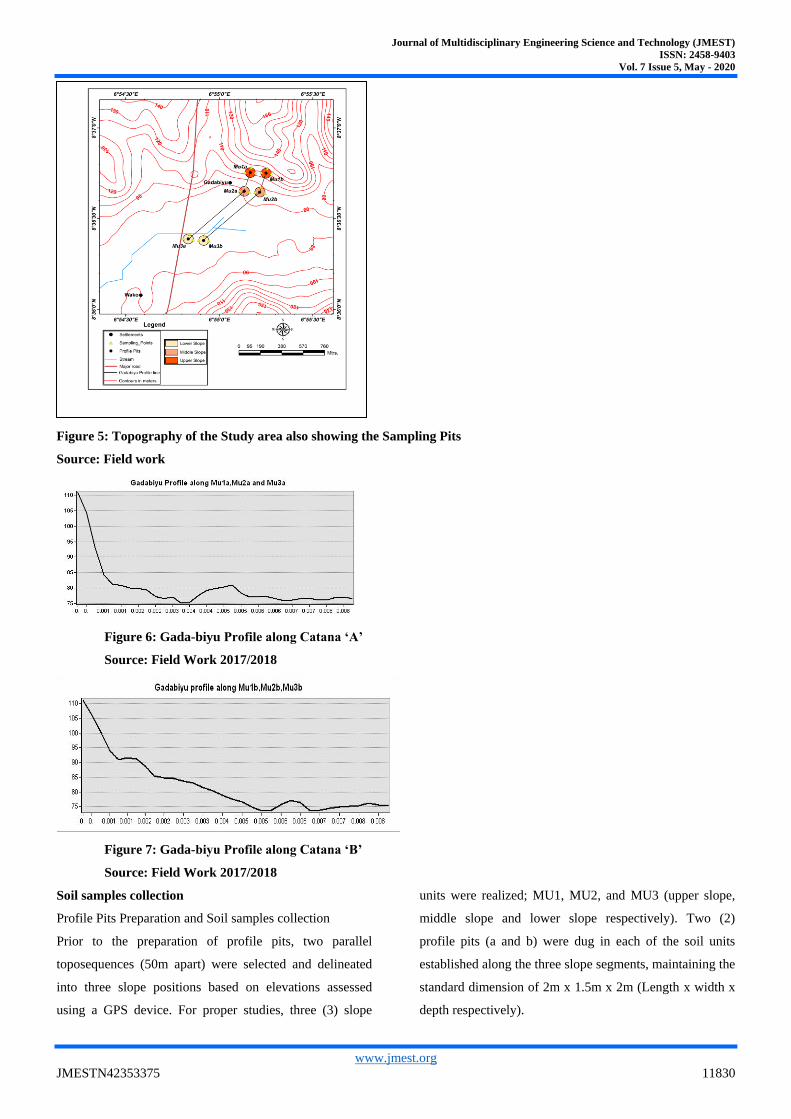
Figure 5: Topography of the Study area also showing the Sampling Pits
Source: Field work
Figure 6: Gada-biyu Profile along Catana ‘A’
Source: Field Work 2017/2018
Figure 7: Gada-biyu Profile along Catana ‘B’
Source: Field Work 2017/2018
Soil samples collection
Profile Pits Preparation and Soil samples collection
Prior to the preparation of profile pits, two parallel
toposequences (50m apart) were selected and delineated
into three slope positions based on elevations assessed
using a GPS device. For proper studies, three (3) slope
units were realized; MU1, MU2, and MU3 (upper slope,
middle slope and lower slope respectively). Two (2)
profile pits (a and b) were dug in each of the soil units
established along the three slope segments, maintaining the
standard dimension of 2m x 1.5m x 2m (Length x width x
depth respectively).
Journal of Multidisciplinary Engineering Science and Technology (JMEST)
ISSN: 2458-9403
Vol. 7 Issue 5, May - 2020
www.jmest.org
JMESTN42353375 11831
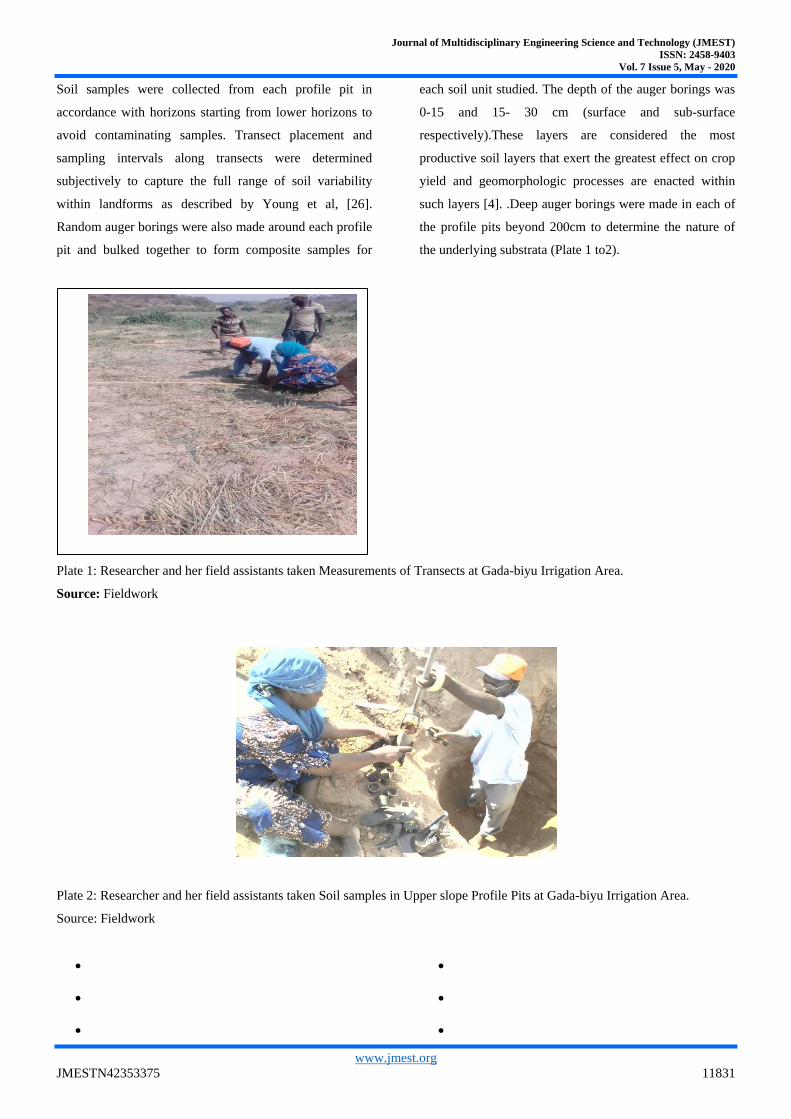
Soil samples were collected from each profile pit in
accordance with horizons starting from lower horizons to
avoid contaminating samples. Transect placement and
sampling intervals along transects were determined
subjectively to capture the full range of soil variability
within landforms as described by Young et al, [26].
Random auger borings were also made around each profile
pit and bulked together to form composite samples for
each soil unit studied. The depth of the auger borings was
0-15 and 15- 30 cm (surface and sub-surface
respectively).These layers are considered the most
productive soil layers that exert the greatest effect on crop
yield and geomorphologic processes are enacted within
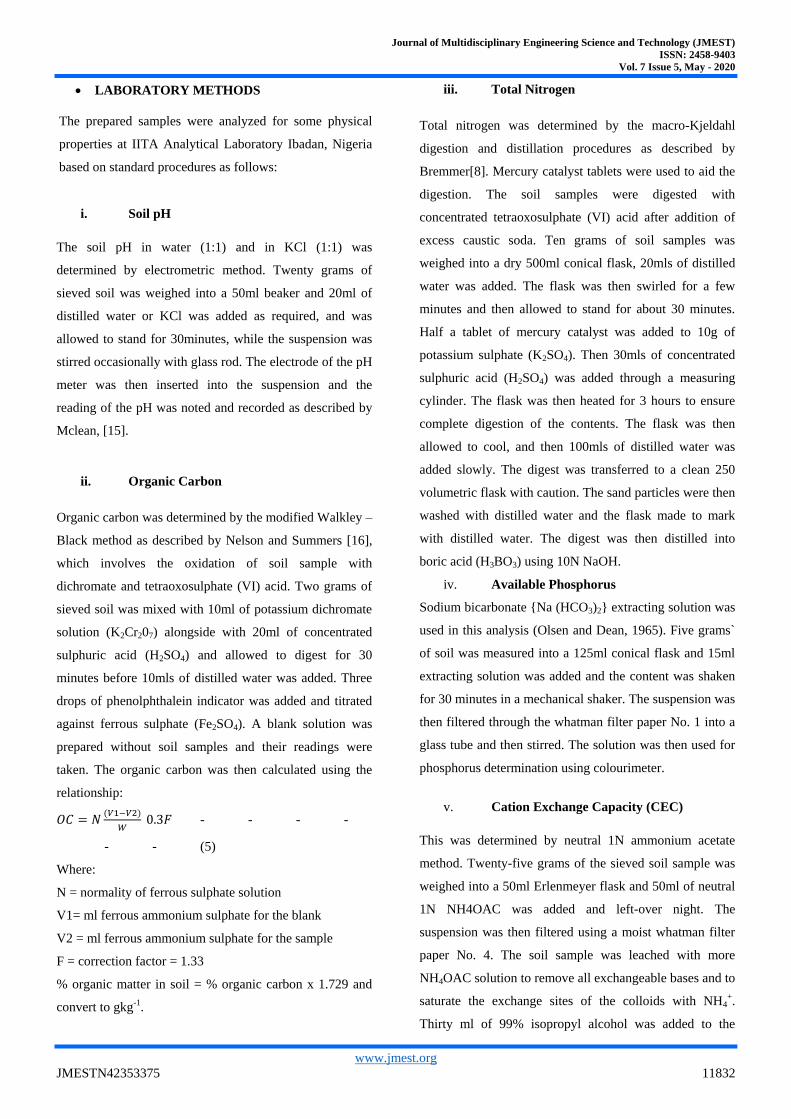
such layers [4]. .Deep auger borings were made in each of
the profile pits beyond 200cm to determine the nature of
the underlying substrata (Plate 1 to2).
Plate 1: Researcher and her field assistants taken Measurements of Transects at Gada-biyu Irrigation Area.
Source: Fieldwork
Plate 2: Researcher and her field assistants taken Soil samples in Upper slope Profile Pits at Gada-biyu Irrigation Area.
Source: Fieldwork
Journal of Multidisciplinary Engineering Science and Technology (JMEST)
ISSN: 2458-9403
Vol. 7 Issue 5, May - 2020
www.jmest.org
JMESTN42353375 11832
LABORATORY METHODS
The prepared samples were analyzed for some physical
properties at IITA Analytical Laboratory Ibadan, Nigeria
based on standard procedures as follows:
i. Soil pH
The soil pH in water (1:1) and in KCl (1:1) was
determined by electrometric method. Twenty grams of
sieved soil was weighed into a 50ml beaker and 20ml of
distilled water or KCl was added as required, and was
allowed to stand for 30minutes, while the suspension was
stirred occasionally with glass rod. The electrode of the pH
meter was then inserted into the suspension and the
reading of the pH was noted and recorded as described by
Mclean, [15].
ii. Organic Carbon
Organic carbon was determined by the modified Walkley –
Black method as described by Nelson and Summers [16],
which involves the oxidation of soil sample with
dichromate and tetraoxosulphate (VI) acid. Two grams of
sieved soil was mixed with 10ml of potassium dichromate
solution (K2Cr207) alongside with 20ml of concentrated
sulphuric acid (H2SO4) and allowed to digest for 30
minutes before 10mls of distilled water was added. Three
drops of phenolphthalein indicator was added and titrated
against ferrous sulphate (Fe2SO4). A blank solution was
prepared without soil samples and their readings were
taken. The organic carbon was then calculated using the
relationship:
𝑂𝐶 = 𝑁(𝑉1−𝑉2)
𝑊 0.3𝐹 - - - -
- - (5)
Where:
N = normality of ferrous sulphate solution
V1= ml ferrous ammonium sulphate for the blank
V2 = ml ferrous ammonium sulphate for the sample
F = correction factor = 1.33
% organic matter in soil = % organic carbon x 1.729 and
convert to gkg-1.
iii. Total Nitrogen
Total nitrogen was determined by the macro-Kjeldahl
digestion and distillation procedures as described by
Bremmer[8]. Mercury catalyst tablets were used to aid the
digestion. The soil samples were digested with
concentrated tetraoxosulphate (VI) acid after addition of
excess caustic soda. Ten grams of soil samples was
weighed into a dry 500ml conical flask, 20mls of distilled
water was added. The flask was then swirled for a few
minutes and then allowed to stand for about 30 minutes.
Half a tablet of mercury catalyst was added to 10g of
potassium sulphate (K2SO4). Then 30mls of concentrated
sulphuric acid (H2SO4) was added through a measuring
cylinder. The flask was then heated for 3 hours to ensure
complete digestion of the contents. The flask was then
allowed to cool, and then 100mls of distilled water was
added slowly. The digest was transferred to a clean 250
volumetric flask with caution. The sand particles were then
washed with distilled water and the flask made to mark
with distilled water. The digest was then distilled into
boric acid (H3BO3) using 10N NaOH.
iv. Available Phosphorus
Sodium bicarbonate {Na (HCO3)2} extracting solution was
used in this analysis (Olsen and Dean, 1965). Five grams`
of soil was measured into a 125ml conical flask and 15ml
extracting solution was added and the content was shaken
for 30 minutes in a mechanical shaker. The suspension was
then filtered through the whatman filter paper No. 1 into a
glass tube and then stirred. The solution was then used for
phosphorus determination using colourimeter.
v. Cation Exchange Capacity (CEC)
This was determined by neutral 1N ammonium acetate
method. Twenty-five grams of the sieved soil sample was
weighed into a 50ml Erlenmeyer flask and 50ml of neutral
1N NH4OAC was added and left-over night. The
suspension was then filtered using a moist whatman filter
paper No. 4. The soil sample was leached with more
NH4OAC solution to remove all exchangeable bases and to
saturate the exchange sites of the colloids with NH4+.
Thirty ml of 99% isopropyl alcohol was added to the

Journal of Multidisciplinary Engineering Science and Technology (JMEST)
ISSN: 2458-9403
Vol. 7 Issue 5, May - 2020
www.jmest.org
JMESTN42353375 11833
sample and the suspension was then shaken mechanically
to remove excess NH4OAC. The NH4- saturated soil was
then transferred to a 500ml Kjeldahl flask and 200ml of
deionized water was added and also 3g magnesium oxide
added into the flask. The content of the flask was then
distilled into 50ml of 4% H3BO3 solution after methylene
blue indicator was added. The ammonium absorbed in the
distillate in the 4% boric acid solution was titrated with
standard 0.1N hydrochloric acid. The total cation exchange
capacity was calculated and expressed as cmol kg-1 of soil.
Blank determination was carried out following the same
procedure but without soil.
vi. Exchangeable Cations and Percentage
base saturation
This was determined by ammonium acetate extraction
method as described by IITA [13]. The soil samples were
shaken for two hours then centrifuged at 2000 rpm for 5 –
10 minutes after decanting into a volumetric flask, thirty
ml of ammonium acetate was added again and shaken for
30 minutes, centrifuged and the supernatant transferred
into same volumetric flask. Ca and Mg was then
determined using the Atomic Absorption
Spectrophotometer (AAS) while the Na and K were
determined using flame photometer.
The percentage base saturation of the soil was calculated
using the relationship below:
PBS =exchangeable bases
cation exchange capacity x 100 - - -
- - (6)
vii. Exchangeable acidity
The exchange acidity was determined using barium
chloride triethanolamine method as described by Peech
[22]. Ten grams of soil sample was weighed into a 125ml
Erlenmeyer flask and 100ml of the extracting solution
(0.5N BaCl2-0.055N triethanolamine) was added. The
suspension was then thoroughly mixed, covered with
stopper and allowed to stand overnight. The suspension
was transferred into a Pyrex Buchner funnel size No. 40,
fitted with 4.25cm Whatman No. 32 filter paper. The flask
was then rinsed into the funnel using extracting solution.
The soil suspension was leached to obtain the leachate.
The leachate therefore was transferred quantitatively into a
250ml volumetric flask and made to a volume with the
extracting solution. The leachate was again transferred into
a 500mls Erlenmeyer flask into which 5 drops of the
mixed indicator solution was added. It was then be titrated
with 0.2NHCl to a pink end point, at pH of 5.1 two
hundred and fifty ml of the original extracting solution was
titrated to precisely the same end point, using the same
amount of the mixed indicator. The exchange acidity (EA)
was then calculated using the formula:
E.A. = (B - S) 10N - - - -
- - - (7)
Where:
B = volume of acid required to titrate 250mls of extracting
solution
S = volume of acid required to titrate the soil extract
N = normality of acid.
Statistical Analysis
In this respect the SPSS Statistical packages and excel
spread sheet were used to do analysis on different
parameters. The statistical analysis considered is ANOVA
to check for soil quality variations between and within
catenary segments and profile pits. Simple descriptive
statistics such as mean, standard deviation and standard
error of the mean, were also used.
RESULTS AND DISCUSSION
Descriptive statistics
Chemical Properties of Gada-biyu Irrigation Area
The chemical properties of the soils are presented in
Tables 1.1a and 1.1b for all the three soil units studied in
the Gadabiyu Irrigation area and the findings are explained
as follows.
Soil pH
The result of soil reaction for the upper slope section for
both Pit (a) and Pit (b) (in H2O) showed that the soil pH
was moderately acidic having values ranging from 6.65 to
6.94 with a mean of 6.76 (SE±0.04). The pH values in KCl
ranged from 3.03 to 3.28 with a mean value of 3.21 (0.02).
Also, for both profile pits in the middle slope section, pH
(in H2O) ranged from 6.47 to 6.78 with a mean value of
6.68 (SE±0.06). The values in KCl ranged from 3.13 to

Journal of Multidisciplinary Engineering Science and Technology (JMEST)
ISSN: 2458-9403
Vol. 7 Issue 5, May - 2020
www.jmest.org
JMESTN42353375 11834
3.31 and a mean of 3.24 (SE±0.04). This value is rated as
moderately acidic.
Moreover, both profile pits in the lower slope section of
the toposequence, soil pH (in H2O) ranged from 6.53 to
6.77 with a mean of 6.68 (SE±0.03), while in KCl the
values ranged from 3.08 to 4.37 with a mean of 3.35
(SE±0.52). These values are rated as moderately acidic.
From the result above, the soils are generally moderately
acidic. This implied that the practice of irrigation (in the
middle and lower slope sections) did not influence the rate
of soil reaction (pH).
Electrical conductivity (Ec µs cm-1
)
The distribution of electrical conductivity in the soils of
the pits of the upper slope section ranges from 1.00 to
9.00µs cm-1 with a mean of 3.00 µs cm-1 and standard
deviation of 2.01 (SE±0.11). These values are rated as
moderate. While in the middle slope pits, the EC values
ranged from 1.00 to 2.00 µs cm-1 with a mean value of
0.60 µs cm-1. These values are rated as very low.
Also, in the lower slope EC was rated as low with values
that ranged from 1.00 to 3.00 µs cm-1 and a mean value of
1.33 µs cm-1 (SE±0.32).
Organic Carbon and Organic Matter
The distribution of organic carbon and organic matter in
the soils of the study area showed that organic carbon in
the soils of the upper slope profile pits ranged from 0.125
to 1.345% with a mean of 0.51% (SE±0.13) while organic
matter varied from 0.21% to 2.319% with a mean value of
0.89% (SE±0.23).
In the middle slope soil pits, the values for organic carbon
ranged from 0.672% to 2.117% having a mean of 1.45%
(SE±0.26). The values for organic matter in this soil unit
ranged from 1.159% to 3.650% having a mean of 2.50%
(SE±0.44).
For the lower slope section of the toposequence, the soil
organic carbon ranged from 0.423% to 3.735% having a
mean of 1.72% (SE±0.46) while the organic matter ranged
from 0.729% to 6.437% with a mean of 2.96% (SE±0.80).
Total Nitrogen
Total nitrogen in the soil of the upper slope pits ranged
from 0.028% to 0.322% with a mean value of 0.14%
(SE±0.04). These values fall within moderate to high.
In the middle slope section, total nitrogen varied from
0.168% to 0.576% having a mean value of 0.78%
(SE±0.32). These values are rated as being moderate to
very high. For the lower slope section, total nitrogen in the
soil was also very high with values ranging from 0.098 to
0.910% having a mean of 0.54% (SE±0.14).
Available Phosphorus
Available phosphorus in the soil pits of the upper slope
section ranged from 8.76 to 22.13mgkg-1 with a mean
value of 15.83 mgkg-1 and standard deviation of 2.21
(SE±1.01). This is rated as high.
In the middle slope, available phosphorus ranged from
8.85 to 23.46 mgkg-1 with a mean of 16.02mgkg-1 and
standard deviation of 3.72 (SE±0.77). This was also rated
as being high.
In the lower slope section, the Available phosphorusranges
from 7.80 to 49.40mgkg-1with a mean of 20.92mgkg-1 and
standard deviation of 10.22 (SE±4.21) and this is rated as
very high (see table 1.1a and 1.1b).
Exchangeable bases (Ca, Mg, K, Na and Exc. Acidity)
The distribution of the basic cations in the soil showed that
Ca and Mg were the most abundant. Ca in the soils of the
upper slope ranged from 1.402 Cmol kg-1 to 3.628 Cmol
kg-1 with a mean of 2.79 Cmol kg-1 (SE±0.28).
For the middle slope area, Ca ranged from 1.866 Cmol kg-1
to 5.339 Cmol kg-1 having a mean of 3.82 Cmol kg-1
(SE±0.59).
In the lower slope, the Ca content ranged from 1.752
Cmol kg-1 to 6.537 Cmol kg-1 having a mean of 4.29 Cmol
kg-1 (0.56). These values fall within the rating of low.
The distribution of Mg in the soils of the upper slope
section of the catena ranged from 0.475 Cmol kg-1 to 0.720
Cmol kg-1 with a mean of 0.62 Cmol kg-1 (SE±0.03). In the
middle slope of the catena, Mg ranged from 0.383 Cmol
kg-1 to 1.996 Cmol kg-1 having a mean of 1.25 Cmolkg-1
(SE±0.30). For the lower slope section, Mg in the soil
ranged from 0.758 Cmol kg-1 to 2.665 Cmol kg-1 with a
mean of 1.54 Cmol kg-1 (SE±0.27). These range of values
are all ranked as low.
Potassium (K) in the soils of the upper slope unit ranged
from 0.077 Cmol kg-1 to 0.170 Cmol kg-1having a mean
value of 0.13 Cmol kg-1 (SE±0.02), While in the middle

Journal of Multidisciplinary Engineering Science and Technology (JMEST)
ISSN: 2458-9403
Vol. 7 Issue 5, May - 2020
www.jmest.org
JMESTN42353375 11835
slope section, the distribution of K in the soil ranged from
0.075 Cmol kg-1 to 0.463 Cmol kg-1 having a mean of 0.21
Cmol kg-1 (SE±0.07). In the lower slope unit, K ranged
between 0.108 Cmol kg-1 to 0.310 Cmol kg-1 with a mean
of 0.21 Cmol kg-1 (SE±0.03). These values were rated as
low to moderate (Values for the upper slope being very
low).
Sodium (Na) in the soil of the upper slope ranged from
0.488 Cmol kg-1 to 0.761 Cmol kg-1 having a mean of 0.59
Cmol kg-1 (SE±0.02). This is rated as moderate to high.
In the middle slope section of the catena, Na ranged from
0.464 Cmol kg-1 to 0.787 Cmol kg-1 with a mean of 0.57
Cmol kg-1 (SE±0.06). These values also rated as low to
moderate. For the lower slope section of the catena, Na
was rated as being uniformly moderate with values ranging
from 0.526 Cmol kg-1 to 0.648 Cmol kg-1 and a mean of
0.59 Cmol kg-1 (SE±0.02).
Exchangeable acidity in the soils of the upper slope ranged
from 0.40 Cmol kg-1 to 4.60 Cmol kg-1 with a mean of 1.62
Cmol kg-1 (SE±0.04). This is rated as low to very high. For
the middle slope section, the values for exchangeable
acidity ranged from 0.80 Cmol kg-1 to 1.20 Cmolkg-1
having a mean of 0.88 Cmol kg-1 (SE±0.08). The lower
slope section had values ranging from 0.40 Cmol kg-1 to
1.00 Cmol kg-1 with a mean of 0.75 Cmol kg-1 (SE±0.06).
These values are ranked as low to moderate (see table 1.1a
and 1.1b).
Cation Exchange Capacity (CEC)
Generally, the cation exchange capacity of the soils along
the toposequence as recorded on table 1.1a and 1.1b was
very low. In the upper slope section, the CEC values
ranged from 3.78 Cmol kg-1 to 10.39 Cmol kg-1 having a
mean of 5.98 Cmol kg-1 (SE±0.80). These values are
ranked as very low to low.
In the middle slope soils, CEC ranged from 6.08 Cmol kg-
1 to 8.96 Cmol kg-1 having a mean of 7.60 Cmol kg-1
(SE±0.56), all these values are rated as low.
In the lower slope section, CEC was in the range of 5.74
Cmol kg-1 to 11.37 Cmol kg-1 with a mean of 8.17 Cmol
kg-1 (SE±0.82), also rated as very low to low.
Exchangeable Sodium Percentage (ESP)
The soils of the upper slope section of the catena had
relatively higher values for ESP which ranged from 5.09%
(low) to 20.13% (very high) having a mean of 11.42%
(SE±0.62) as shown on table 1.1a and 1.1b.
In the middle slope section, ESP ranged from 6.25% to
9.92% with a mean value of 7.64% (SE±0.62). These
values are rated as low as they fall within acceptable limit
of ≤15.0%.
For the lower slope section, the ESP ranged from 5.20% to
9.16% having a mean of 7.67% (SE±0.68) rated as low.
The practice of irrigation in the middle and lower slope
sections of the catena has reduced the concentration of
soluble Na in the soil owing to high water content and the
effect of leaching. Continues water application through
irrigation could have leached out the excess Na compared
to the upper slope where irrigation is not practiced and the
soils tend to be drier than in the middle and lower slope.
High ESP above 15% leads to problem of soil salinity.
Hence, the upper slope unit may pose potential salinity
problem probably due to low moisture content in the soil.
However, this is within the sub-surface horizons and may
not be a serious problem for most arable crops with
shallow rooting system [1].
Base Saturation Percentage
Base saturation percentage of the soils in the upper slope
ranged from 46.11% to 93.47% with a mean of 75.67%
(SE±5.80). These values for base saturation percentage are
ranked as low to high according to USDA [24] standards.
In the middle slope, BSP ranged from 77.67% to 98.78%
with a mean of 89.44% (SE±3.44). These values are all
rated as high.
In the lower slope position, the BSP values ranged from
84.80% to 93.68% with a mean of 89.65% (SE±1.02) (see
table 1.1a and 1.1b).
Analysis of Variance for Soil Chemical Properties
Across Different Topographic Units
Soil pH
The result of analysis of variance showed that there was no
significant difference (p>0.05) in the pH values of the soil
determined in H2O and in KCl. Test of homogeneity also
Journal of Multidisciplinary Engineering Science and Technology (JMEST)
ISSN: 2458-9403
Vol. 7 Issue 5, May - 2020
www.jmest.org
JMESTN42353375 11836
showed that the non-significant variation in the values was
also homogeneous across the two topo sequences studied
in the GadaBiyu irrigation area.
Soil Electrical Conductivity
The values for electrical conductivity (Ec) studied showed
that the values were not significantly different (p>0.05)
using ANOVA. However, the description of homogeneity
showed that the distribution of values was highly non-
homogeneous across the different slope positions along the
two topo sequences in GadaBiyu Irrigation area.
Soil Organic matter
The result of analysis of variance for values obtained that
depict the distribution of organic carbon and organic
matter generally, did not show significance difference
(p>0.05) in all the soil units of the two catenas. However,
while the distribution in the soils of catena ‘A’ were highly
non-homogenous, the distribution along catena ‘B’ showed
that the values distribution was homogeneous (Table 1.3a
and b).
Total Nitrogen
The analysis of variance for the distribution of total
nitrogen was not significant different (p>0.05) for the soil
units along topo sequence ‘A’ but showed a significant
difference (p<0.05) in the distribution of TN in the soils
along the different slope units of catena B. Test of
homogeneity also showed that the level of non-
significance in TN for topo sequences ‘A’ and ‘B’ was
highly non homogeneous (p<0.05).
Available Phosphorus
The result for analysis of variance for available
phosphorus (AP) showed that there was no significant
difference (p>0.05) in the values obtained for AP. Also,
the values were highly homogenous across all the soil
units of the two catenas studied (p>0.05) (Table 1.3a and
b).
Exchangeable Bases
The result of ANOVA for Ca distribution showed that the
values were not significantly different (p>0.05) across all
the slope positions of the two topo sequences. Also, a test
of homogeneity showed that the Ca values across the soil
units of the two topo sequences were homogeneous.
The distribution of Mg showed a significance difference
(p>0.05) across the soil units of topo sequences ‘A’ but
showed a significant variation (p<0.05) in the values
obtained from the soil units of catena ‘B’. The test of
homogeneity also showed that the values for Mg in topo
sequence ‘A’ were non homogeneous (p<0.05) while the
values for topo sequence ‘B’ were highly homogeneous
(p>0.05).
The result of analysis of variance showed that there was no
significant variation (p>0.05) in the values of K across the
different soils sampled from the two topo sequences. The
test of homogeneity however, showed that the distribution
of the values were not homogeneous across the soil units
of the area.
The result for Na showed that the ANOVA was not
significantly different (p>0.05) for values recorded from
topo sequence ‘A’, but for topo sequence ‘B’, there was
significant difference (p<0.05) in the distribution of Na.
Test of homogeneity showed that the values were not
homogeneous (p<0.05) in all the soil units studied.
The analysis of variance showed that there was there was
no significant variation (p>0.05) in the exchangeable
acidity values of the soils from the two topo sequences.
Also, test of homogeneity showed that the non-
significance in the values recorded was uniformly
homogeneous across the two topo sequences studied
(Table 1.3a and b)
Cation Exchange Capacity
The distribution of CEC showed that there was no
significant difference in the CEC values of the soils from
the different soil units of the two topo sequences. The
values were also homogeneous in their distribution
(p>0.05) (Table 1.3a and b)
Exchangeable Sodium Percentage
The result for analysis of variance showed that there was
no significant difference (p>0.05) in the values for
exchangeable sodium percentage for all the soil units
studied. The values were uniformly homogeneous (p>0.05)
across all the slope positions of the two topo sequences
(Table 5.5a and b).
Journal of Multidisciplinary Engineering Science and Technology (JMEST)
ISSN: 2458-9403
Vol. 7 Issue 5, May - 2020
www.jmest.org
JMESTN42353375 11837
Base Saturation Percentage
The result for analysis of variance showed that there was
no significant difference (p>0.05) in the distribution of
base saturation percentage (BSP) of the soils across the
different slope positions of the topo sequence. The test of
homogeneity showed that the values were not homogenous
(p<0.05) across the slope positions of topo sequence ‘A’,
while the values for topo sequence ‘B’ were generally
homogenous (p>0.05) across the slope positions of the
catena (Table 1.3a and b)
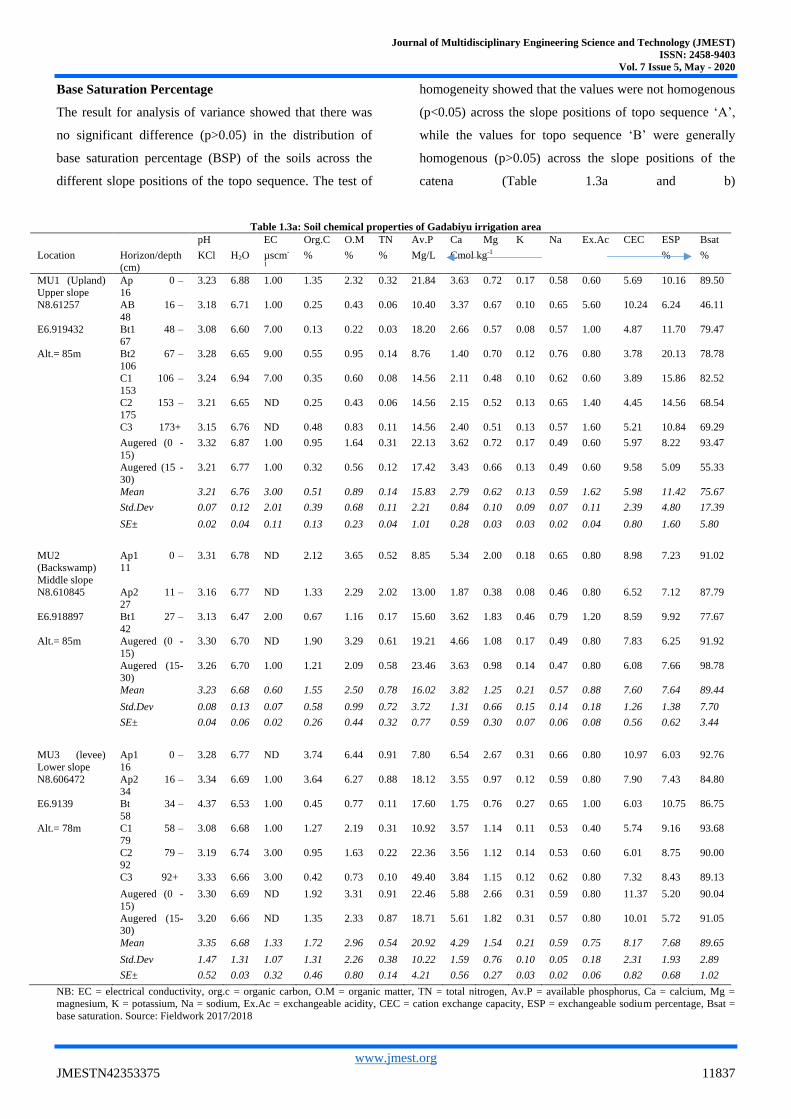
Table 1.3a: Soil chemical properties of Gadabiyu irrigation area
pH EC Org.C O.M TN Av.P Ca Mg K Na Ex.Ac CEC ESP Bsat
Location Horizon/depth
(cm)
KCl H2O µscm-
1
% % % Mg/L Cmol kg-1 % %
MU1 (Upland)
Upper slope
Ap 0 –
16
3.23 6.88 1.00 1.35 2.32 0.32 21.84 3.63 0.72 0.17 0.58 0.60 5.69 10.16 89.50
N8.61257 AB 16 –
48
3.18 6.71 1.00 0.25 0.43 0.06 10.40 3.37 0.67 0.10 0.65 5.60 10.24 6.24 46.11
E6.919432 Bt1 48 –
67
3.08 6.60 7.00 0.13 0.22 0.03 18.20 2.66 0.57 0.08 0.57 1.00 4.87 11.70 79.47
Alt.= 85m Bt2 67 –
106
3.28 6.65 9.00 0.55 0.95 0.14 8.76 1.40 0.70 0.12 0.76 0.80 3.78 20.13 78.78
C1 106 –
153
3.24 6.94 7.00 0.35 0.60 0.08 14.56 2.11 0.48 0.10 0.62 0.60 3.89 15.86 82.52
C2 153 –
175
3.21 6.65 ND 0.25 0.43 0.06 14.56 2.15 0.52 0.13 0.65 1.40 4.45 14.56 68.54
C3 173+ 3.15 6.76 ND 0.48 0.83 0.11 14.56 2.40 0.51 0.13 0.57 1.60 5.21 10.84 69.29
Augered (0 -
15)
3.32 6.87 1.00 0.95 1.64 0.31 22.13 3.62 0.72 0.17 0.49 0.60 5.97 8.22 93.47
Augered (15 -
30)
3.21 6.77 1.00 0.32 0.56 0.12 17.42 3.43 0.66 0.13 0.49 0.60 9.58 5.09 55.33
Mean 3.21 6.76 3.00 0.51 0.89 0.14 15.83 2.79 0.62 0.13 0.59 1.62 5.98 11.42 75.67
Std.Dev 0.07 0.12 2.01 0.39 0.68 0.11 2.21 0.84 0.10 0.09 0.07 0.11 2.39 4.80 17.39
SE±
0.02 0.04 0.11 0.13 0.23 0.04 1.01 0.28 0.03 0.03 0.02 0.04 0.80 1.60 5.80
MU2
(Backswamp)
Middle slope
Ap1 0 –
11
3.31 6.78 ND 2.12 3.65 0.52 8.85 5.34 2.00 0.18 0.65 0.80 8.98 7.23 91.02
N8.610845 Ap2 11 –
27
3.16 6.77 ND 1.33 2.29 2.02 13.00 1.87 0.38 0.08 0.46 0.80 6.52 7.12 87.79
E6.918897 Bt1 27 –
42
3.13 6.47 2.00 0.67 1.16 0.17 15.60 3.62 1.83 0.46 0.79 1.20 8.59 9.92 77.67
Alt.= 85m Augered (0 -
15)
3.30 6.70 ND 1.90 3.29 0.61 19.21 4.66 1.08 0.17 0.49 0.80 7.83 6.25 91.92
Augered (15-
30)
3.26 6.70 1.00 1.21 2.09 0.58 23.46 3.63 0.98 0.14 0.47 0.80 6.08 7.66 98.78
Mean 3.23 6.68 0.60 1.55 2.50 0.78 16.02 3.82 1.25 0.21 0.57 0.88 7.60 7.64 89.44
Std.Dev 0.08 0.13 0.07 0.58 0.99 0.72 3.72 1.31 0.66 0.15 0.14 0.18 1.26 1.38 7.70
SE±
0.04 0.06 0.02 0.26 0.44 0.32 0.77 0.59 0.30 0.07 0.06 0.08 0.56 0.62 3.44
MU3 (levee)
Lower slope
Ap1 0 –
16
3.28 6.77 ND 3.74 6.44 0.91 7.80 6.54 2.67 0.31 0.66 0.80 10.97 6.03 92.76
N8.606472 Ap2 16 –
34
3.34 6.69 1.00 3.64 6.27 0.88 18.12 3.55 0.97 0.12 0.59 0.80 7.90 7.43 84.80
E6.9139 Bt 34 –
58
4.37 6.53 1.00 0.45 0.77 0.11 17.60 1.75 0.76 0.27 0.65 1.00 6.03 10.75 86.75
Alt.= 78m C1 58 –
79
3.08 6.68 1.00 1.27 2.19 0.31 10.92 3.57 1.14 0.11 0.53 0.40 5.74 9.16 93.68
C2 79 –
92
3.19 6.74 3.00 0.95 1.63 0.22 22.36 3.56 1.12 0.14 0.53 0.60 6.01 8.75 90.00
C3 92+ 3.33 6.66 3.00 0.42 0.73 0.10 49.40 3.84 1.15 0.12 0.62 0.80 7.32 8.43 89.13
Augered (0 -
15)
3.30 6.69 ND 1.92 3.31 0.91 22.46 5.88 2.66 0.31 0.59 0.80 11.37 5.20 90.04
Augered (15-
30)
3.20 6.66 ND 1.35 2.33 0.87 18.71 5.61 1.82 0.31 0.57 0.80 10.01 5.72 91.05
Mean 3.35 6.68 1.33 1.72 2.96 0.54 20.92 4.29 1.54 0.21 0.59 0.75 8.17 7.68 89.65
Std.Dev 1.47 1.31 1.07 1.31 2.26 0.38 10.22 1.59 0.76 0.10 0.05 0.18 2.31 1.93 2.89
SE± 0.52 0.03 0.32 0.46 0.80 0.14 4.21 0.56 0.27 0.03 0.02 0.06 0.82 0.68 1.02
NB: EC = electrical conductivity, org.c = organic carbon, O.M = organic matter, TN = total nitrogen, Av.P = available phosphorus, Ca = calcium, Mg =
magnesium, K = potassium, Na = sodium, Ex.Ac = exchangeable acidity, CEC = cation exchange capacity, ESP = exchangeable sodium percentage, Bsat =
base saturation. Source: Fieldwork 2017/2018
Journal of Multidisciplinary Engineering Science and Technology (JMEST)
ISSN: 2458-9403
Vol. 7 Issue 5, May - 2020
www.jmest.org
JMESTN42353375 11838
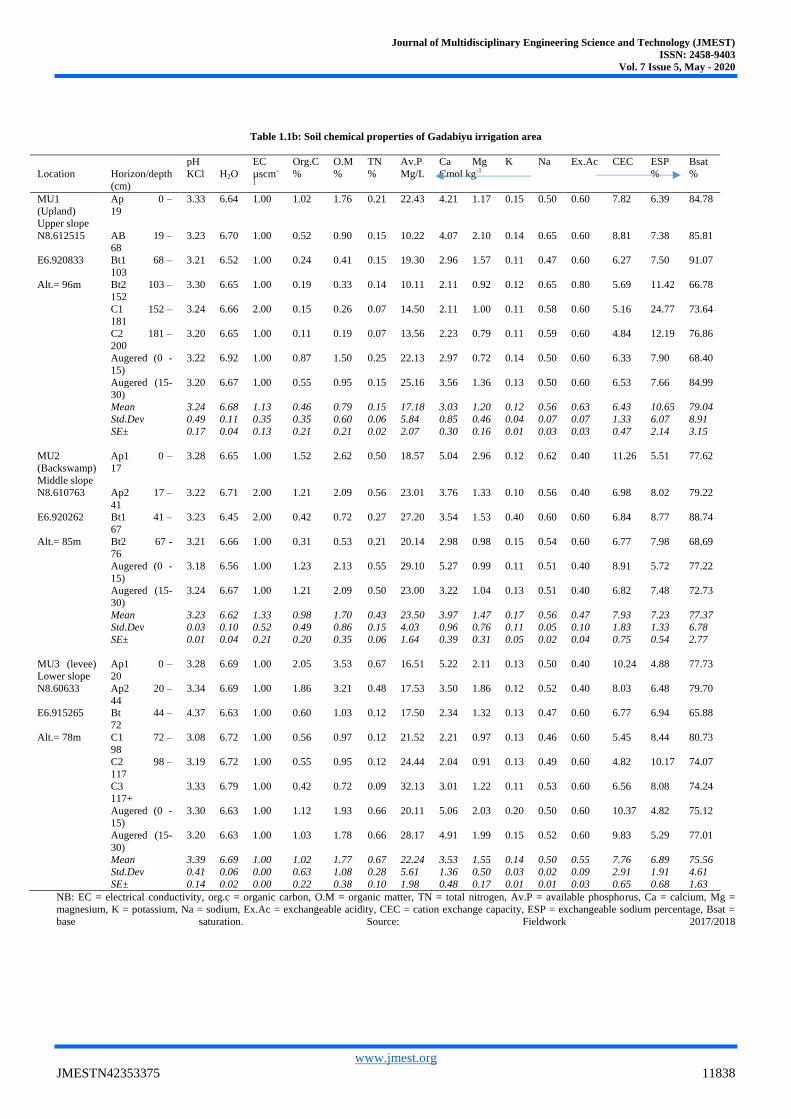
Table 1.1b: Soil chemical properties of Gadabiyu irrigation area
pH EC Org.C O.M TN Av.P Ca Mg K Na Ex.Ac CEC ESP Bsat
Location Horizon/depth
(cm)
KCl H2O µscm-
1
% % % Mg/L Cmol kg-1 % %
MU1
(Upland)
Upper slope
Ap 0 –
19
3.33 6.64 1.00 1.02 1.76 0.21 22.43 4.21 1.17 0.15 0.50 0.60 7.82 6.39 84.78
N8.612515 AB 19 –
68
3.23 6.70 1.00 0.52 0.90 0.15 10.22 4.07 2.10 0.14 0.65 0.60 8.81 7.38 85.81
E6.920833 Bt1 68 –
103
3.21 6.52 1.00 0.24 0.41 0.15 19.30 2.96 1.57 0.11 0.47 0.60 6.27 7.50 91.07
Alt.= 96m Bt2 103 –
152
3.30 6.65 1.00 0.19 0.33 0.14 10.11 2.11 0.92 0.12 0.65 0.80 5.69 11.42 66.78
C1 152 –
181
3.24 6.66 2.00 0.15 0.26 0.07 14.50 2.11 1.00 0.11 0.58 0.60 5.16 24.77 73.64
C2 181 –
200
3.20 6.65 1.00 0.11 0.19 0.07 13.56 2.23 0.79 0.11 0.59 0.60 4.84 12.19 76.86
Augered (0 -
15)
3.22 6.92 1.00 0.87 1.50 0.25 22.13 2.97 0.72 0.14 0.50 0.60 6.33 7.90 68.40
Augered (15-
30)
3.20 6.67 1.00 0.55 0.95 0.15 25.16 3.56 1.36 0.13 0.50 0.60 6.53 7.66 84.99
Mean 3.24 6.68 1.13 0.46 0.79 0.15 17.18 3.03 1.20 0.12 0.56 0.63 6.43 10.65 79.04
Std.Dev 0.49 0.11 0.35 0.35 0.60 0.06 5.84 0.85 0.46 0.04 0.07 0.07 1.33 6.07 8.91
SE±
0.17 0.04 0.13 0.21 0.21 0.02 2.07 0.30 0.16 0.01 0.03 0.03 0.47 2.14 3.15
MU2
(Backswamp)
Middle slope
Ap1 0 –
17
3.28 6.65 1.00 1.52 2.62 0.50 18.57 5.04 2.96 0.12 0.62 0.40 11.26 5.51 77.62
N8.610763 Ap2 17 –
41
3.22 6.71 2.00 1.21 2.09 0.56 23.01 3.76 1.33 0.10 0.56 0.40 6.98 8.02 79.22
E6.920262 Bt1 41 –
67
3.23 6.45 2.00 0.42 0.72 0.27 27.20 3.54 1.53 0.40 0.60 0.60 6.84 8.77 88.74
Alt.= 85m Bt2 67 -
76
3.21 6.66 1.00 0.31 0.53 0.21 20.14 2.98 0.98 0.15 0.54 0.60 6.77 7.98 68.69
Augered (0 -
15)
3.18 6.56 1.00 1.23 2.13 0.55 29.10 5.27 0.99 0.11 0.51 0.40 8.91 5.72 77.22
Augered (15-
30)
3.24 6.67 1.00 1.21 2.09 0.50 23.00 3.22 1.04 0.13 0.51 0.40 6.82 7.48 72.73
Mean 3.23 6.62 1.33 0.98 1.70 0.43 23.50 3.97 1.47 0.17 0.56 0.47 7.93 7.23 77.37
Std.Dev 0.03 0.10 0.52 0.49 0.86 0.15 4.03 0.96 0.76 0.11 0.05 0.10 1.83 1.33 6.78
SE±
0.01 0.04 0.21 0.20 0.35 0.06 1.64 0.39 0.31 0.05 0.02 0.04 0.75 0.54 2.77
MU3 (levee)
Lower slope
Ap1 0 –
20
3.28 6.69 1.00 2.05 3.53 0.67 16.51 5.22 2.11 0.13 0.50 0.40 10.24 4.88 77.73
N8.60633 Ap2 20 –
44
3.34 6.69 1.00 1.86 3.21 0.48 17.53 3.50 1.86 0.12 0.52 0.40 8.03 6.48 79.70
E6.915265 Bt 44 –
72
4.37 6.63 1.00 0.60 1.03 0.12 17.50 2.34 1.32 0.13 0.47 0.60 6.77 6.94 65.88
Alt.= 78m C1 72 –
98
3.08 6.72 1.00 0.56 0.97 0.12 21.52 2.21 0.97 0.13 0.46 0.60 5.45 8.44 80.73
C2 98 –
117
3.19 6.72 1.00 0.55 0.95 0.12 24.44 2.04 0.91 0.13 0.49 0.60 4.82 10.17 74.07
C3
117+
3.33 6.79 1.00 0.42 0.72 0.09 32.13 3.01 1.22 0.11 0.53 0.60 6.56 8.08 74.24
Augered (0 -
15)
3.30 6.63 1.00 1.12 1.93 0.66 20.11 5.06 2.03 0.20 0.50 0.60 10.37 4.82 75.12
Augered (15-
30)
3.20 6.63 1.00 1.03 1.78 0.66 28.17 4.91 1.99 0.15 0.52 0.60 9.83 5.29 77.01
Mean 3.39 6.69 1.00 1.02 1.77 0.67 22.24 3.53 1.55 0.14 0.50 0.55 7.76 6.89 75.56
Std.Dev 0.41 0.06 0.00 0.63 1.08 0.28 5.61 1.36 0.50 0.03 0.02 0.09 2.91 1.91 4.61
SE± 0.14 0.02 0.00 0.22 0.38 0.10 1.98 0.48 0.17 0.01 0.01 0.03 0.65 0.68 1.63
NB: EC = electrical conductivity, org.c = organic carbon, O.M = organic matter, TN = total nitrogen, Av.P = available phosphorus, Ca = calcium, Mg =
magnesium, K = potassium, Na = sodium, Ex.Ac = exchangeable acidity, CEC = cation exchange capacity, ESP = exchangeable sodium percentage, Bsat =
base saturation. Source: Fieldwork 2017/2018

Journal of Multidisciplinary Engineering Science and Technology (JMEST)
ISSN: 2458-9403
Vol. 7 Issue 5, May - 2020
www.jmest.org
JMESTN42353375 11839
Table1.3a: Summary of ANOVA Analysis for Catena ‘A
SOIL CHEMIICAL PROPERTIES
1 KCL .943 .407 0.05 NS .060 NS
2 H2O 1.165 .333 0.05 NS .604 NS
3 EC 1.646 .219 0.05 NS .001 S
4 Carbon 3.060 .070 0.05 NS .276 NS
5 OrgM 3.051 .071 0.05 NS .275 NS
6 TN 4.492 .025 0.05 S .000 S
7 P 2.907 .079 0.05 NS .337 NS
8 Ca 1.308 .294 0.05 NS .171 NS
9 Mg .808 .460 0.05 NS .645 NS
10 K 3.078 .070 0.05 NS .022 S
11 Na 5.521 .013 0.05 S .003 S
12 ExAc 1.527 .243 0.05 NS .192 NS
13 CEC 2.172 .141 0.05 NS .165 NS
14 ESP .493 .618 0.05 NS .081 NS
15 Bsat .943 .407 0.05 NS .080 NS Table 1.3b: Summary of ANOVA Analysis for Catena ‘B’
S/
N
PROPERT
Y
CALCULATE
D F
SIGNI
FICA
NT
VAL
UE
ALPHA
LEVEL
SIGNIFICANC
E
DIFFERENCE
TEST OF HOMOGENITY
SIGNIFICANT
VALUE OF
HOMOGENIT
Y
DESCRIPTION
OF
HOMOGENITY
SOIL CHEMIICAL PROPERTIES
1 KCL 1.120 .347 0.05 NS .109 NS
2 H2O 1.508 .247 0.05 NS .278 NS
3 EC 1.059 .380 0.05 NS .000 S
4 Carbon 4.319 .028 0.05 NS .012 S
5 OrgM 4.326 .028 0.05 NS .012 S
6 TN 4.441 .026 0.05 NS .006 NS
7 P .869 .435 0.05 NS .344 NS
8 Ca 3.357 .056 0.05 NS .164 NS
9 Mg 6.065 .009 0.05 S .001 S
10 K 2.232 .135 0.05 NS .007 S
11 Na .133 .876 0.05 NS .019 S
12 ExAc .950 .404 0.05 NS .081 NS
13 CEC 2.360 .121 0.05 NS .367 NS
14 ESP 3.268 .060 0.05 NS .034 NS
15 Bsat 5.813 .011 0.05 NS .007 S

Journal of Multidisciplinary Engineering Science and Technology (JMEST)
ISSN: 2458-9403
Vol. 7 Issue 5, May - 2020
www.jmest.org
JMESTN42353375 11840
DISCUSSION OF RESULTS
The pH range of soils in this report may not be unconnected
to the soil texture, low status of basic cations, nutrient
biocycling and parent materials from which the soils are
formed. Also, acidic soils are mostly commonly associated
with climatic regimes, for example where rainfall is high
and temperatures are warm, increased biological activities
may lead to the production of organic acids thereby
increasing soil pH (Wapa, et al., 2015). Also, free drainage
favours leaching of exchangeable cations, thus increasing
the concentration of H+ in the soil solution. This is
particularly true for the soils of the study area which is
predominantly silty loam, thus favoring excessive leaching
of minerals and nutrients. This assertion agrees with
Barnabas et al, [6]. The surface horizons recorded higher
values of pH than the lower horizons, this is probably due
to biocycling of nutrients in the soil (Idoga and Azagaku,
2005). Also, the ANOVA result showed that there was no
significant difference (p>0.05) in the pH values of the soil
determined in H2O and in KCl.Test of homogeneity also
showed that the non-significant variation in the values was
also homogenuous across the two toposequences study
area. The general uniformity in the pH distribution of the
soil could be function of landuse pattern and uniform parent
material from which the soils developed. Barnabas
andBarnabasandNwaka (2014) reported similar findings in
the soils of Jiwa a suburb of Abuja. The soils were formed
generally from basement complex materials, primarily
granites, migmatites and schists (Table 1.3a and b).
The study further revealed that the EC values were rated
low to moderate. EC is a soil quality indicator that gives
information on the amount of soluble salts in a soil. It is a
measure of how easily an electric current can flow through
the soil. The range of EC values and pH in these soils is
tending towards neutrality especially where EC is above
1.00 µs cm-1. This may not be unconnected to the
seasonal/periodic inundation by flood water during peaks of
the river flow. Different salt materials are transported in the
flowing water which when deposited on the soil increases
the electrical conductivity of the soil (Chudeet al., 2011;
2005).Also, the middle and lower slope units had lower EC
values probably due to their poorly drained nature and
aquic moisture regimes that could have leached out most of
the soluble salts in the soil. This explains why areas farther
from the lower slope (middle slope and Upland) had EC
values that are relatively higher. The lower values of EC in
the middle and lower slopes suggest effect of continues
irrigation which dissolved most salts in the soil and leached
them out. This assertion agrees with Agbede (2009) who
noted that drier soils have high salt content than wet soils.
The higher EC values in the upper slope are attributed to
the dry soil condition which is often associated with higher
salt deposits. The moisture regime in the upper slope was
suggesting that the soils were dry for longer periods than
the lower slope sections of the toposequences, hence may
show higher dissolvable salts content.
Organic carbon and soil organic matter showed the same
trend in the soils. The values recorded indicated a moderate
to very high distribution within the profiles and along the
toposequence with much higher values in the middle and
lower slope sections. The values were higher at the surface
and decreases with increasing soil depth within the profile
see table 1.1a and 1.1b.
There is evidence of organic matter illuviation in some sub
surface horizons in all the three locations. Amhiakhian and
Osemwata, (2012) reported similar trends. The high values
of organic matter content in the soil can be attributed to
constant use of organic manure by farmers (especially in
the middle and lower slopes) as a means of maintaining soil
fertility and for improved crop performance and yield. A
trend observed in the organic matter distribution in all the
three locations was a decrease in organic matter content
with increasing soil depth.
The percentage organic matter content was moderately high
in the surface horizons and also in the lower slopes adjacent
to the river course. This is so probably because of the aquic
moisture condition of the soil which reduce soil
temperature and consequently lower the rate of organic
matter decomposition. Also, leaching and washing away of
nutrients from higher slope units and the subsequent
deposition in the lower slopes may be responsible for the
higher organic matter content at the lower slope unit than
the other units on the higher slopes (Wapaet al., 2015;
Barnabas and Nwaka, 2014 and Idoga and Azagaku, 2005).
Journal of Multidisciplinary Engineering Science and Technology (JMEST)
ISSN: 2458-9403
Vol. 7 Issue 5, May - 2020
www.jmest.org
JMESTN42353375 11841
Another reason for the very high organic matter content in
all the soils of the units studied could be attributed to
continuous use and application of organic materials,
especially cow dung, poultry droppings and wood ash as
nutrient/manures for crop production. This was a common
practice by all the farmers in the study area.
Upper slope sections had lower values than the middle and
lower slope sections of the toposequences. The increase in
organic matter along the toposequence from upper to lower
section suggest influence of gradient that warrant migration
of soil organic carbon and subsequent deposition in the
lower slope sections.
The total nitrogen values within the profiles decreased with
increasing soil depth, however, the distribution of nitrogen
within the profile followed the same trend as organic
matter.It is observed that the horizons with high organic
matter content also showed high N content. This attests that
there is synergy in the distribution of organic matter and
total nitrogen in the soil. This trend is also a confirmation
that soil organic matter is a store house of soil nutrients.
Ogbodo, (2011) also reported a positive correlation
between organic matter and soil nitrogen. Sanni (2012)
reported a similar trend in the soils of Dobi a suburb of
Gwagwalada Area Council in the FEDERAL CAPITAL
TERRITORY.
Though nitrogen in the surface soils (especially) tended to
be very high, but it is prone to loses by leaching,
percolation, volatilization and plant uptake. This is
attributed to the porous nature of the soil coupled with high
temperatures associated with the area. The soils were sandy
and leaching of nutrients and other basic cations in the soil
would be high.
The high availability of P in the soil is attributed to the soil
reaction being generally slightly acidic to near neutral and
also the high moisture content of the soil especially at the
middle and lower slope sections of the toposequence. These
pH range favours availability of P in the soil (Agbede,
2009). Also, Ogbodo (2011) reported high available P in
some depressed wetlands in south-eastern Nigeria and
attributed the high available soil P to high moisture content
of the soil. He noted that one of the ways to enhance the
availability of P in soils is to increase the water/moisture
content of the soil. (Uzohoet al, (2004) noted that low P
content in most soils is attributed to soil acidity. In this
case, soil texture becomes significant in determining P
availability. In this study area, the soils are mostly sandy,
and available P increased with increasing profile depth even
though the pattern of increase was not consistent all through
the profile depth. This may be explained by the high
moisture content in the lower horizons within all the
profiles [14]. P is less mobile and can still be observed in
the soil after cropping, this could still be responsible for the
high P values of the surface horizon in the upper slope
section, considering the fact that the floodplain soils are
cultivated for various crops and SSP fertilizers are often
added as inorganic fertilizer.
The distribution of the basic and acidic cations in the soil
did not show any regular pattern of distribution within the
profiles. However, soils that are mostly wet (middle and
lower slopes) with high water tables showed relatively
stable values within the profiles.
The very low range of values for all the basic cations in the
soils of the area is likely the result of excessive leaching of
these basic cations in the soil.This is true considering the
high sand content of the soils. Sandy loam, single grained
sand and loamy sand are porous and aggravate leaching by
water. This low status of basic cations in the soil also
correlates with the near acidic reaction (low pH) of the
soil.Osujiet al, (2002), reported that soils formed from
coastal plain sands/floodplain soils are deep, acidic, and
coarse textured and generally of low CEC and low inherent
natural fertility.
The preponderance of Ca and Mg in the soils is common to
most tropical soils even though the exchangeable cations
were relatively very low.Foth, (2006) stated that the
exchange site of most tropical soils are dominated by
calcium and magnesium. The exchangeable cations
decrease with increasing depth due to nutrient biocycling
(Ogunwaleetal., 2002; Akamigbo, 1986).
The distribution of exchange acidity in the soil did not
follow any definite pattern of occurrence. It is mostly
believed that H+ and Al3- which are the constituents of
exchange acidity are in equilibrium in acid soils [1]. Higher
contents of exchangeable acidity is associated with high

Journal of Multidisciplinary Engineering Science and Technology (JMEST)
ISSN: 2458-9403
Vol. 7 Issue 5, May - 2020
www.jmest.org
JMESTN42353375 11842
clay content, hence the result of the study shows that values
of exchange acidity in the soils are low probably due to the
sandy texture of the soil.
The low CEC of the soils may be due to the very low
amount of clay content of the soil. The low CEC implies
low ability of the soil to hold cations. CEC is strongly
dependent on physical and chemical variables of the soil
[2]. Practices of bush burning in the area has affected the
concentration of aluminum in the soil making the soil
temporarily acidic with high level of ionic elements.
Generally, soils with low CEC values have colours that are
bright arising from low organic matter and low clay
content. The soils’ CEC is low and is an indication of the
nutrient holding potential of the soil.The trend in the CEC
of the soil is similar to the distribution of basic
exchangeable cations in the soil.
The relationship between clay content and CEC can be
highly variable because different clay minerals have
different cation exchange capacity [3], thus the soils of
three different slope sections have low specific capacity to
exchange cations. This is because in terms of particle size
fraction, clay sized particles have a wide range of CEC,
while that of silt is smaller, but sand has virtually low
exchange capacity. The soils having very low clay content
affected the cation exchange capacity. The relative higher
values of CEC at the surface horizons, however, may be
due to influence of high organic matter in the soil, hence
the decrease in lower horizons corresponds with decrease in
organic matter.
The distributions of all the extractable micronutrients (Mn,
Fe, Cu and Zn) in the soils along the catena were very high.
This is not unconnected to the inherent nature of the parent
material. Mn and Zn is major constituent of parent
materials formed from undifferentiated basement complex
such as granites, basalts, magmatic schists and gneisses.
This explains why Mn and Fe were so abundant in the soils
along the toposequence. This assertion agrees with [11].
Also, it would be observed that the middle slope and lower
slopes had relatively higher values for all the extractable
micronutrients than the upper slope section. This can be
attributed to higher moisture content in the lower slopes
where water table is high. Evidence of all these was
confirmed in the field where as a result of high-water table
and the rate of redox reaction, iron II is reduced to iron III
oxides liberating the sesquioxides of Fe, Mn and Cu. This is
a common phenomenon in most floodplain soils, being the
case with the Gadabiyu irrigation area. This situation was
also reported in a study of similar soils in South Eastern
Nigeria by Akamigbo, [3].
In all the units studied, Pb was decreasing with increase in
soil depth suggesting that surface horizons of the soils had
higher Pb values except for the middle slope unit which had
much higher values in the sub surface horizons than in the
surface. This can be attributed to effect of erosion and
deposition by water during irrigation. Hence, the upper
slope with low moisture content had much lower values of
extractable Pbinthe soil. This finding is consistent with the
report of Bhattachariyyaet al, (2008) and further added that
increased levels of Pb in the soils may decrease soil
productivity resulting in phytotoxicity and reduced nutrient
uptake by plants. Also, Jordaoet al, (2006) noted that
cultivation of crops on contaminated soils represents a
potential risk and a source through which vegetable tissues
can accumulate heavy metals.
The trend in the distribution of Ni in the soil showed that Ni
decreased with increase in soil depth within the profiles.
The decrease however, did not follow a regular pattern.
Also, the lower slope position had higher values of Ni
indicating effect of erosion and deposition of materials that
moved from higher elevations, thus giving higher
concentration in lower or depressed units. This result
agreed with Okoliet al, (2017) findings but disagrees with
their conclusion, they studied some coastal plain soils and
reported higher values were found at the surface horizons
than in the subsurface which they attributed to the
agricultural activities practiced in the area. However,
Ayodele and Mohammed, (2011) had noted that Ni is
generally not distributed uniformly throughout most
profiles.
Cobalt was lower in the upper slope position where
irrigation was never practiced. In the middle and lower
slope sections however, Co increased significantly. This
finding agrees with Ayorinde and Dallatu (2017) and is
attributed to erosion consequent of irrigation practice in the

Journal of Multidisciplinary Engineering Science and Technology (JMEST)
ISSN: 2458-9403
Vol. 7 Issue 5, May - 2020
www.jmest.org
JMESTN42353375 11843
area. Distribution within the profile showed that cobalt in
the profiles decreased with profile depth.
CONCLUSION AND RECOMMENDATIONS
This study aimed at assessing the impact of topography on
chemical properties of soil along a toposequence in
GadabiyuArea of Kwali area council,
AbujaFederalCapitalTerritory, Nigeria. The study revealed
that landscape position significantly influenced variation in
soil chemical properties. Generally, the values of organic
carbon and organic matter indicated a moderate to very
high distribution within the profiles and along the topo
sequence with much higher values in the middle and lower
slope sections. The high values of organic matter content in
the soil can be attributed to constant use of organic manure
by farmers (especially in the middle and lower slopes) as a
means of maintaining soil fertility and for improved crop
performance and yield. The increase in organic matter
along the topo sequence from upper to lower section
suggest influence of gradient that warrant migration of soil
organic carbon and subsequent deposition in the lower
slope sections. The total nitrogen values within the profiles
decreased with increasing soil depth, however, the
distribution of nitrogen within the profile followed the same
trend as organic matter. It is observed that the horizons with
high organic matter content also showed high N content.
The soil pH was moderately acidic in all the soil profile
studied. The general uniformity in the pH distribution of the
soil could be function of land use pattern and uniform
parent material from which the soils developed. The study
also showed that the EC values were rated low to moderate.
This may be due to the seasonal/periodic inundation by
flood water during peaks of the river flow. Different salt
materials are transported in the flowing water which when
deposited on the soil increases the electrical conductivity of
the soil. The distribution of the basic cations in the soil
showed that Ca and Mg were the most abundant. the
preponderance of Ca and Mg in the soils is common to
most tropical soils even though the exchangeable cations
were relatively very low. The very low range of values for
all the basic cations in the soils of the area is likely the
result of excessive leaching of these basic cations in the
soil. This is true considering the high sand content of the
soils. Sandy loam, single grained sand and loamy sand are
porous and aggravate leaching by water. This low status of
basic cations in the soil also correlates with the near acidic
reaction (low pH) of the soil.CEC was rated as low. The
low CEC of the soils may be due to the very low amount of
clay content of the soil. The low CEC implies low ability of
the soil to hold cations. CEC is strongly dependent on
physical and chemical variables of the soil. The soils’ CEC
is low and is an indication of the nutrient holding potential
of the soil. The addition of an organic material will likely
increase the soil CEC over time. The trend in the CEC of
the soil is similar to the distribution of basic exchangeable
cations in the soil.Based on this study finding, some
specific recommendations are forwarded as follows:
- organic matter should be continuously applied to
the soil as a means of improving soil structure, and
the nutrient capital reserve of the soil.
- This study therefore, recommends toposequence
specific soil management in order to avoid blanket
conclusion and inorder to attain sustainability of
such delicate ecosystems.

Journal of Multidisciplinary Engineering Science and Technology (JMEST)
ISSN: 2458-9403
Vol. 7 Issue 5, May - 2020
www.jmest.org
JMESTN42353375 11844
REFERENCES
[1]. O.A. Agbede, (2009). Understanding soil and plant nutrition.
Salman press limited, Keffi, Nasarawa State, Nigeria. Ist
Edition.
[2] M.A.N.Anikwe,., C.I. Okonkwo and N.L. Aniekwe, (1999).
Effect of changing land use on selected soil
properties in AbakalikiAgroecoloigcal zone
Southeast Nigeria. Environ. Educ. and
Inform, 18: 79-84.
[3] O.L.A. Asadu, and F.O.R. Akamigbo, 1990. Relative
contribution of organic matter and clay fractions
to caution exchange capacity of soils in
southeastern Nigeria. Samaru J. Agric. Res., 7:
17-23.
[4] A.O., AWETO and G.O. ENARUVBE (2010)
Catenaryvariation of soil properties under oil palm
plantation inSouth Western Nigeria. Ethiopian Journal
of EnvironmentalStudies and Management, 3(1).
[5] O.Balogun, (2001). TheFederal Capital Territory of Nigeria:
Geography of Its Development. University of Ibadan
Press Limited. Basil Blackwell, New York.
[6] I.M.Barnabas., J.M.Wapa. and , L. OkogiOnyinye (2017)
Effect of pH variation on the physical and
chemical properties of the soil and growth and
development of maize (zea mays). Kaduna Journal of
Agriculture and Natural Resources 2 (1): 81 –
90.
[7] I.M.Barnabas, and G.I.C. Nwaka (2014) Characterization of
Upland soils of Jiwa in the Federal Capital Territory,
Abuja, In: S.O. Ojeniyiet al (eds). Nigerian Agricultural
Transformation Agenda, Soil as a key to National
Development, pp 106-113. Proceedings of the 38th
Annual conf of Soil Science Soc. Nigeria. Univ of Uyo,
Nigeria.
[8] J.M. Bremmer (1965). Inorganic Forms of Nitrogen.
Agronomy 9:11792-237.
[9] V.O., Chude, W.B., Malgwi, I.Y. Amapu, and A.A. Ano,
(2011). Manual on soil fertility assessment. Federal
Department of fertilizer, FAO and National Programme
on food security, Abuja Nigeria, pp62. Company,
Volume: 4, Issue: 3, pp. 124-129.
[10] Compendium on Implementation of theFadama III project
inFederal Capital Territory(CIFIIIP), (2013); Federal
Capital TerritoryFadama Coordination Office.
Agricultural and Rural Development Secretariat, Fedral
Capital Territoy Administration Abuja.
[11] I.E, EsuAU, Akpan-IdiokMO Eyong (2008). Characterization
andclassification of soils along a typical Hillslope in
Afikpo Area ofEbonyi State, Nigeria. Nigerian Journal
of Soil and Environment;8: 1-6.
[http://dx.doi.org/10.4314/njser.v8i1.52050]
[12] I.E.Esu (2005). Soil characterization and mapping for food
security. AKeynote Address at the 29th Annual Conf. of
Soil Science Society ofNigeria held at University of
Nigeria, Abeokuta, from 6th to 10th Dec.2004, 2005
[13] IITA (International Institute for Tropical Agriculture) (1979)
Laboratory Manual for Soil and Plant Analysis Manual
Series 7, IITA, Ibadan.
[14]S.Idoga and , D.E Azagaku. (2005) Characterization and
classification of soils of Janta Area, Plateau State of
Nigeria. Nigeria Journal of Soil Science (15) 116 – 122.
[15] ASR Juo, and F.R.Moorman (1981). Characteristics of two
soil toposequenceinsoutheastern Nigeria and their
relation to potential land use. NigeriaJournal of Soil
Science; 1: 47-61.
[15] E.O. Mclean, 1982. Soil pH and lime requirement. In Page,
A.L., R.H. Miller and D.R. Keeney (eds.) Methods of
Soil analysis. Part 2 – Chemical and microbiological
properties. (2nd Ed). Agronomy 9:199-223.
[16] D.W Nelson and L.E Summers (1982). Total carbon, organic
carbon, and organic matter. Methods of Soil Analysis:
Part 2. Chemical and microbiological properties. (2nd
Ed). Agronomy 9: 539-579.
[17] E.N. Ogbodo, (2009). Effect of crop Residue on Soil
Chemical Properties and Rice Yield on an Ultisol at
Abakaliki, Southeastern Nigeria. American-Eurasian
Journal of Sustainable Agriculture 7(3): 13-18.
[18] E., OKU, A., ESSOKAE THOMAS. (2010) Variability
insoil properties along an Udalftoposequence in the
HumidForest Zone of Nigeria. Kasetsart J. (Nat. Sci.)
44:564-573.
[19] S.R. Olsen, and L.R. Dean, (1965) Phosphorus. In: Methods
of soil Analysis, American Society of Agronomy,
Madison, Wisconsin, No. 9, 920-926.
[20] P.E., OsayandeP.O., OviasogieN.O., AisueniO., Stephen P.
IrhemuandM.OEkebafe.(2013).Assessment of dithionite
and oxalate extractable iron and aluminium oxides in soils
supporting raphia palms at Nifor Main Station. Nigerian
Journal of Soil Science 23(2): 1-9
[21] I.O Osemwata, (2012). Physical and Chemical Properties of
Soils in kogi State, Guinea Savanna Zone of Nigeria.
Nigerian Journal of Soil Science. Pp 46-54.
[22] M Peech, (1965) Hydrogen Ion Activity. In: Black, C.A., et
al., Eds., Methods of Soil Analysis, Part 2, American
Society of Agronomy, Madison, 914-926.
[23] J.Sani (2012) The effects of Land use on soil properties of
Dobi in Gwagwalada Area Council of the FEDERAL
CAPITAL TERRITORY. MSc Thesis submitted to
the Dept. of Geography and Environmental
Management, University of Abuja.
Unpublished.
[24] USDA (2014). Keys to Soil Taxonomy, Twelfth Edition
http://nrcspad.sc.egov.usda.gov/DistributionCentre/
[25] B. U., Uzoho, E. E., Ihem, E. I., Ogueri,C. A., Igwe, , J. A. l.
EffiongandG. U. Njoku, (2016).Potassium forms in
particle size fractions of soils on a toposequence in
Mbano, Southeastern Nigeria. International Journal of
Environment and Pollution Research 4(3): 1-11
[26] , F.J., YoungR. Hammer, and J. Matta, E. (1992) Confidence
intervals for soil properties based on differing statistical
assumptions. (In G.A. Millikin and J.R. Schwenke
(editors.) Applied statistics in agriculture) 4th Annual
Kansas State Univ. Conf., 27–28